Durr AG · XETR:DUE
Durr — Investor Presentation (June 2014)
36 slides from Durr's investor presentation, June 2014
Slide 1: Welcome Presentation Dürr Investor Relations
WELCOME PRESENTATION DÜRR INVESTOR RELATIONS June 2014 www.durr.com
Slide 2: Disclaimer
DISCLAIMER This investor presentation has been prepared independently by Dürr AG (“Dürr”). The presentation contains statements which address such key issues as Dürr’s strategy, future financial results, market positions and product development. Such statements should be carefully considered, and it
Slide 3: Agenda
AGENDA 1. Dürr: global leader with strong competitive position 2. Markets 3. Dürr Strategy 2017 4. Financial overview, outlook and summary © Dürr AG, CCI, Investor Relations, June 2014 3
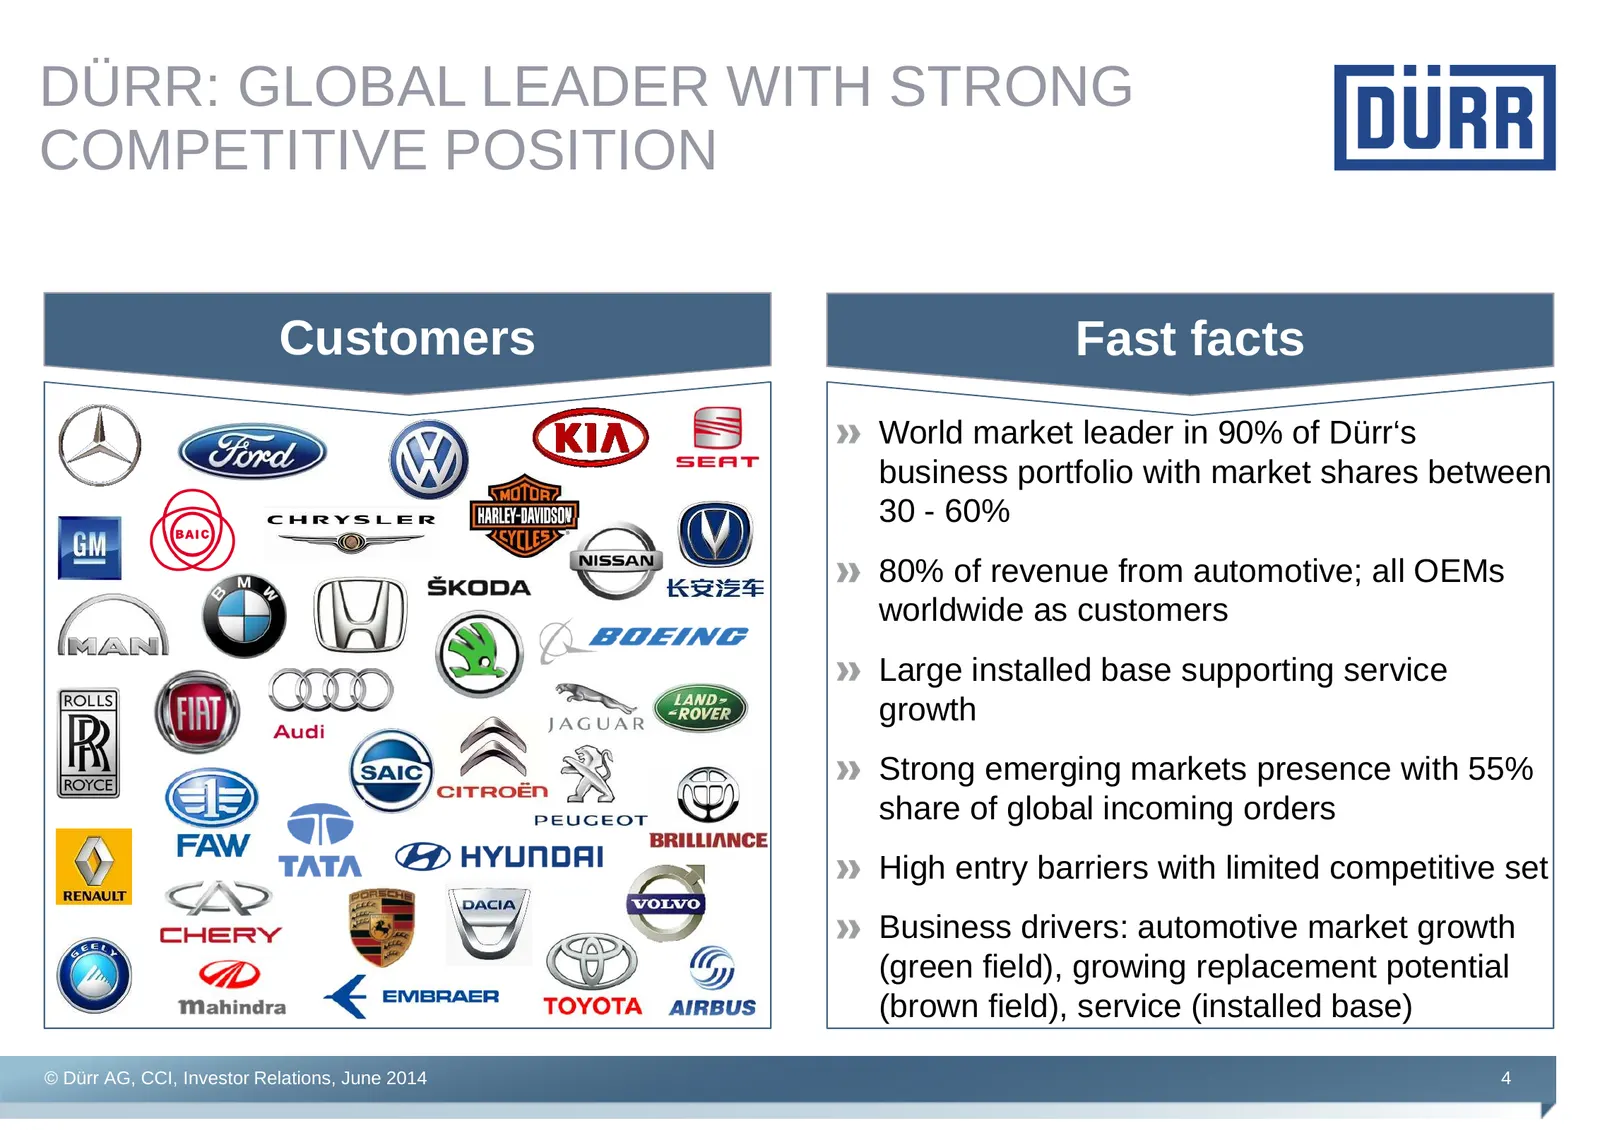
Slide 4: Dürr: global leader with strong competitive position
DÜRR: GLOBAL LEADER WITH STRONG COMPETITIVE POSITION Customers Fast facts World market leader in 90% of Dürr‘s business portfolio with market shares between 30 - 60% 80% of revenue from automotive; all OEMs worldwide as customers Large installed base supporting service growth Strong emerging markets
Slide 5: Businesses at the Dürr Group
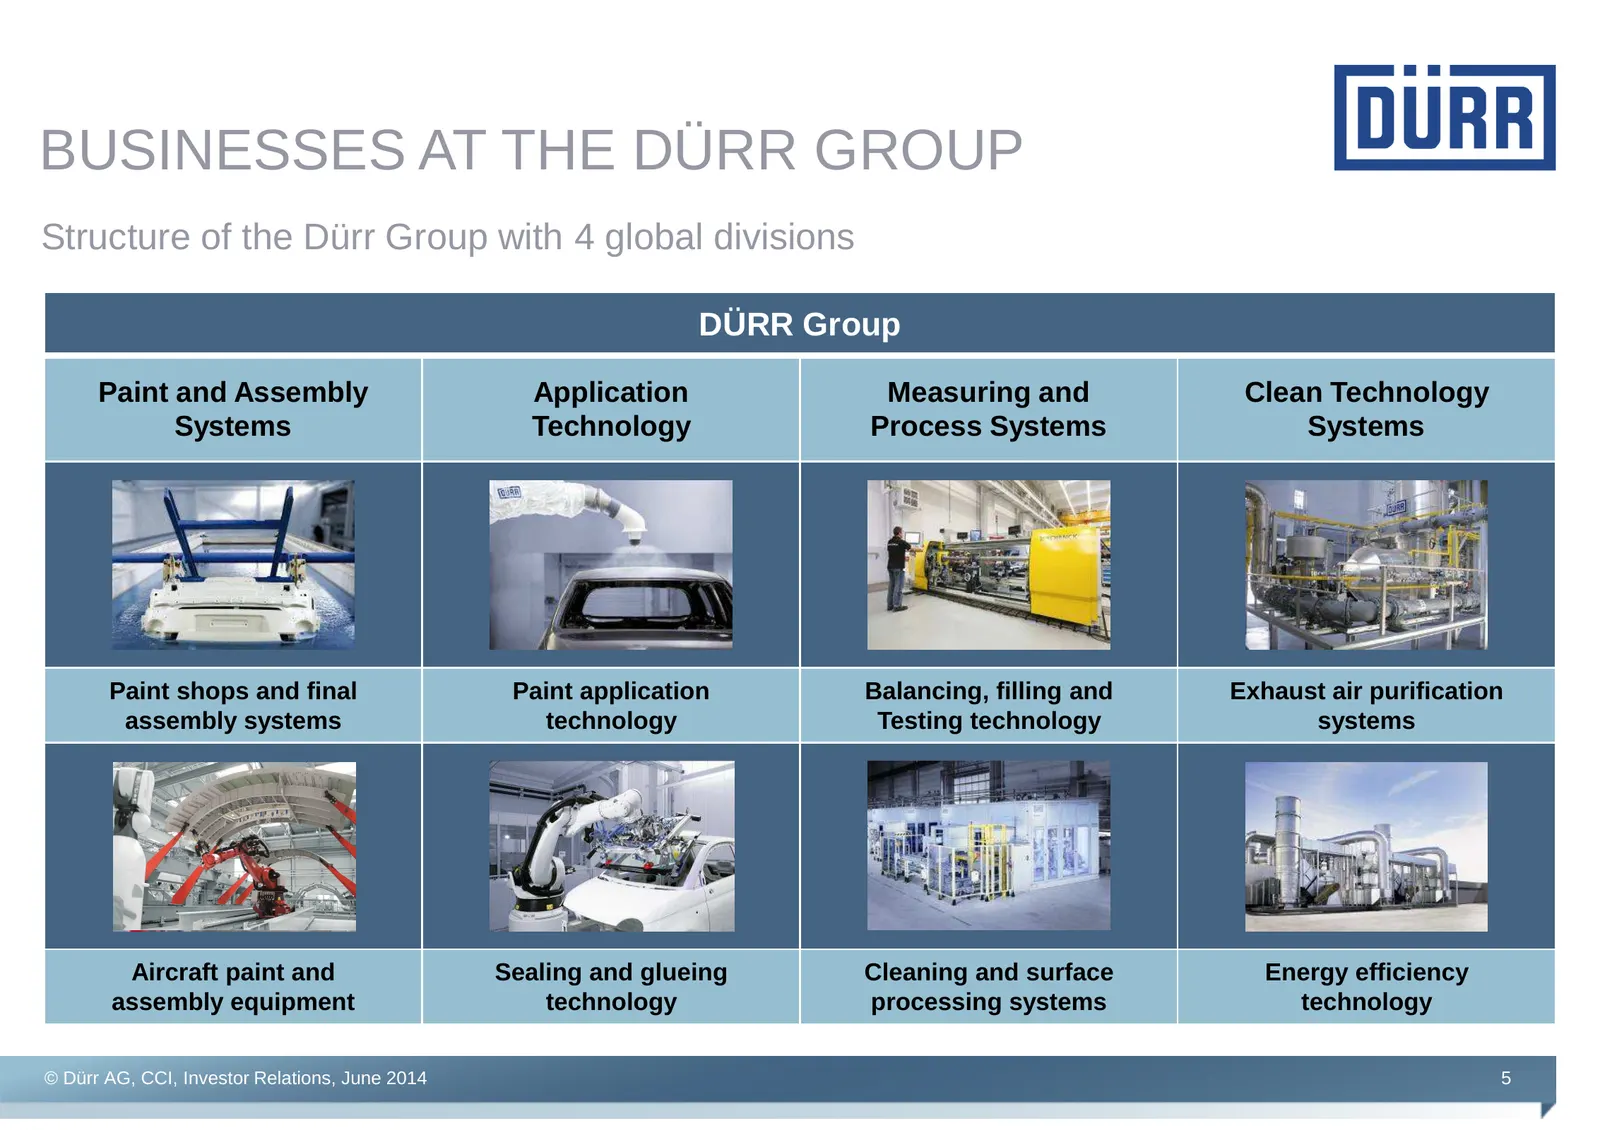
BUSINESSES AT THE DÜRR GROUP Structure of the Dürr Group with 4 global divisions DÜRR Group Paint and Assembly Application Measuring and Clean Technology Systems Technology Process Systems Systems Paint shops and final Paint application Balancing, filling and Exhaust air purification assembly system
Slide 6: Overview divisions
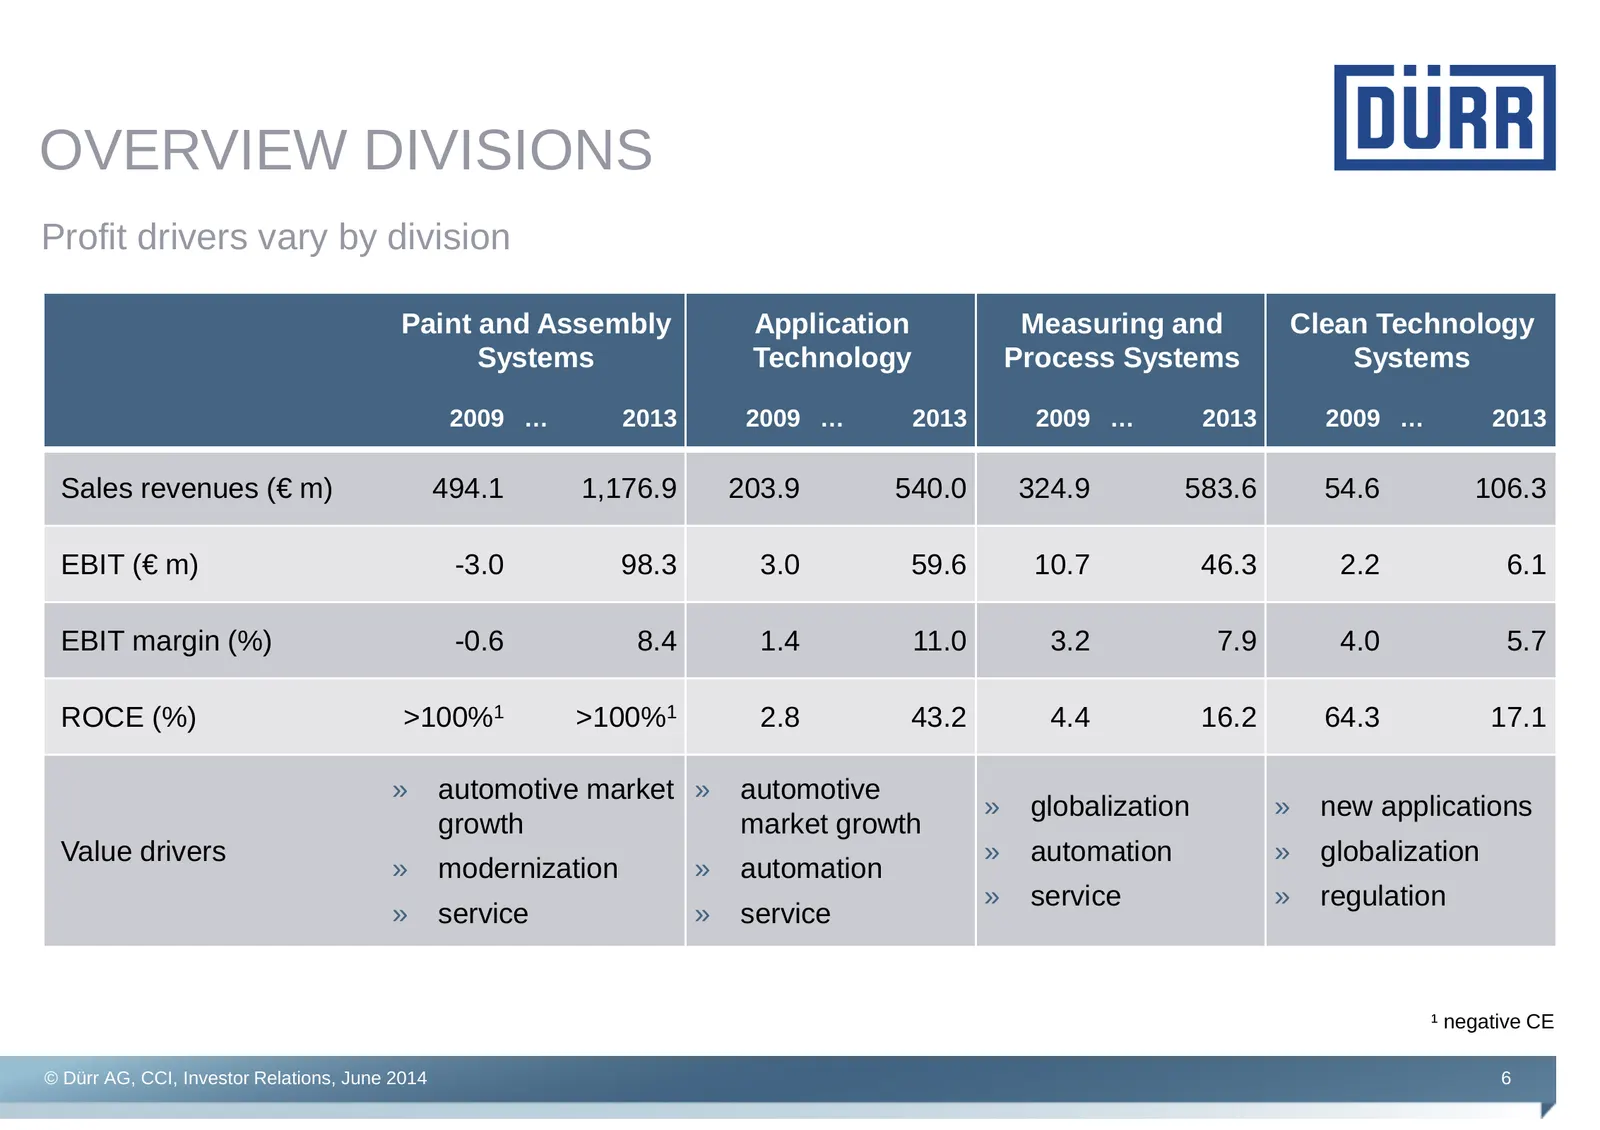
OVERVIEW DIVISIONS Profit drivers vary by division Paint and Assembly Application Measuring and Clean Technology Systems Technology Process Systems Systems 2009 … 2013 2009 … 2013 2009 … 2013 2009 … 2013 Sales revenues (€ m) 494.1 1,176.9 203.9 540.0 324.9 583.6 54.6 106.3 EBIT (€ m) -3.0 98.3 3.0 5
Slide 7: Order intake: shift to the Americas
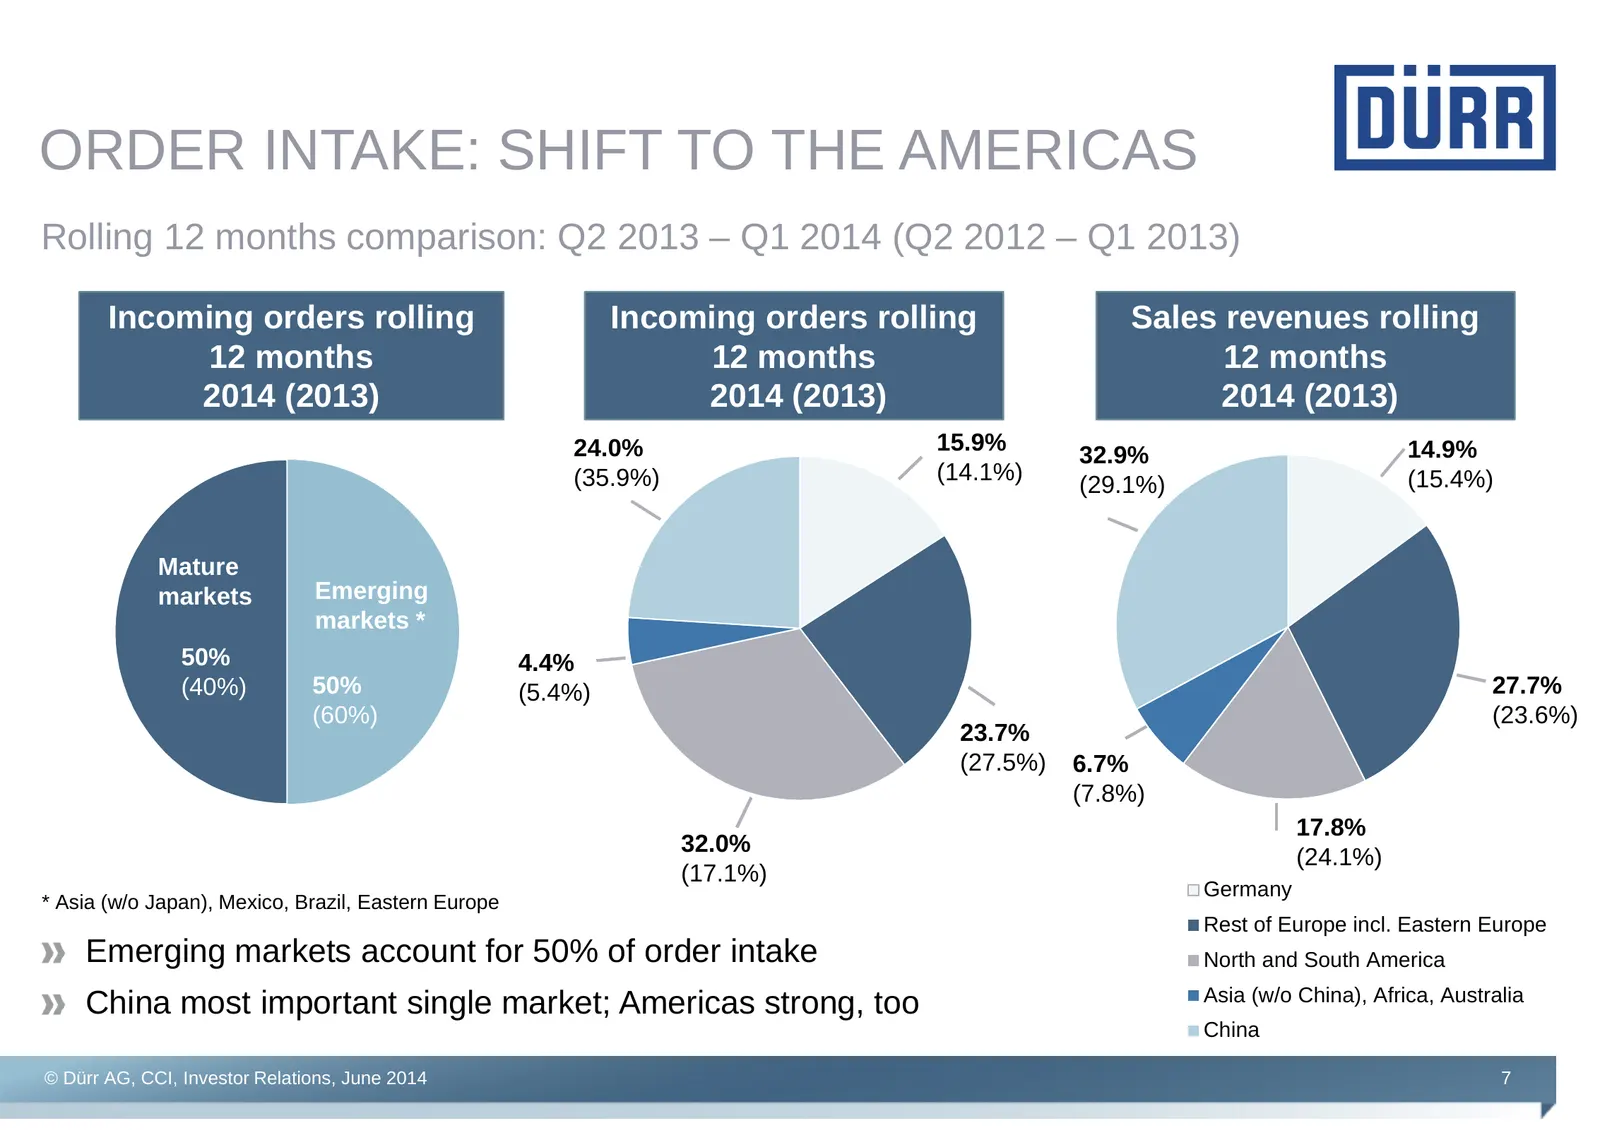
ORDER INTAKE: SHIFT TO THE AMERICAS Rolling 12 months comparison: Q2 2013 – Q1 2014 (Q2 2012 – Q1 2013) Incoming orders rolling Incoming orders rolling Sales revenues rolling 12 months 12 months 12 months 2014 (2013) 2014 (2013) 2014 (2013) 24.0% 15.9% 14.9% 32.9% (35.9%) (14.1%) (15.4%) (29.1%) Mat
Slide 8: Agenda
AGENDA 1. Dürr: global leader with strong competitive position 2. Markets 3. Dürr Strategy 2017 4. Financial overview, outlook and summary © Dürr AG, CCI, Investor Relations, June 2014 8
Slide 9: Markets
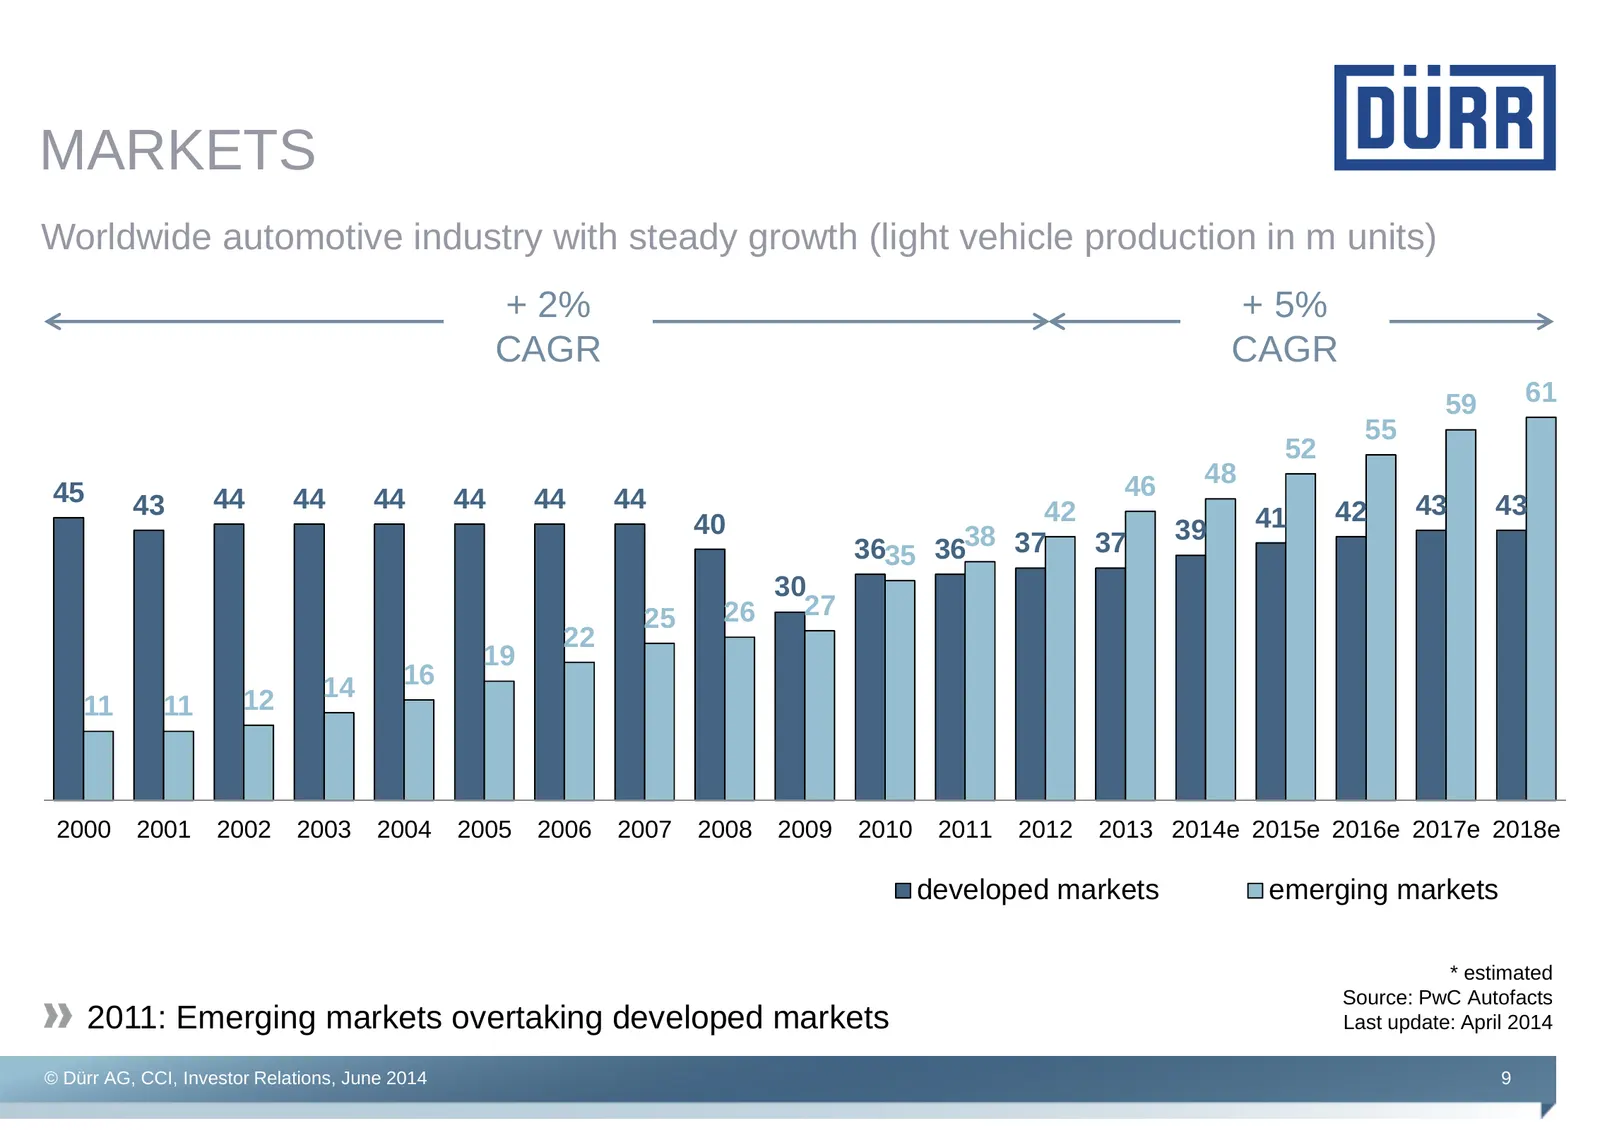
MARKETS Worldwide automotive industry with steady growth (light vehicle production in m units) + 2% + 5% CAGR CAGR 59 61 55 52 46 48 45 43 44 44 44 44 44 44 43 43 40 42 41 42 38 37 37 39 3635 36 30 25 26 27 22 19 14 16 11 11 12 2000 2001 2002 2003 2004 2005 2006 2007 2008 2009 2010 2011 2012 2013 20
Slide 10: Continued strong emerging markets growth expected
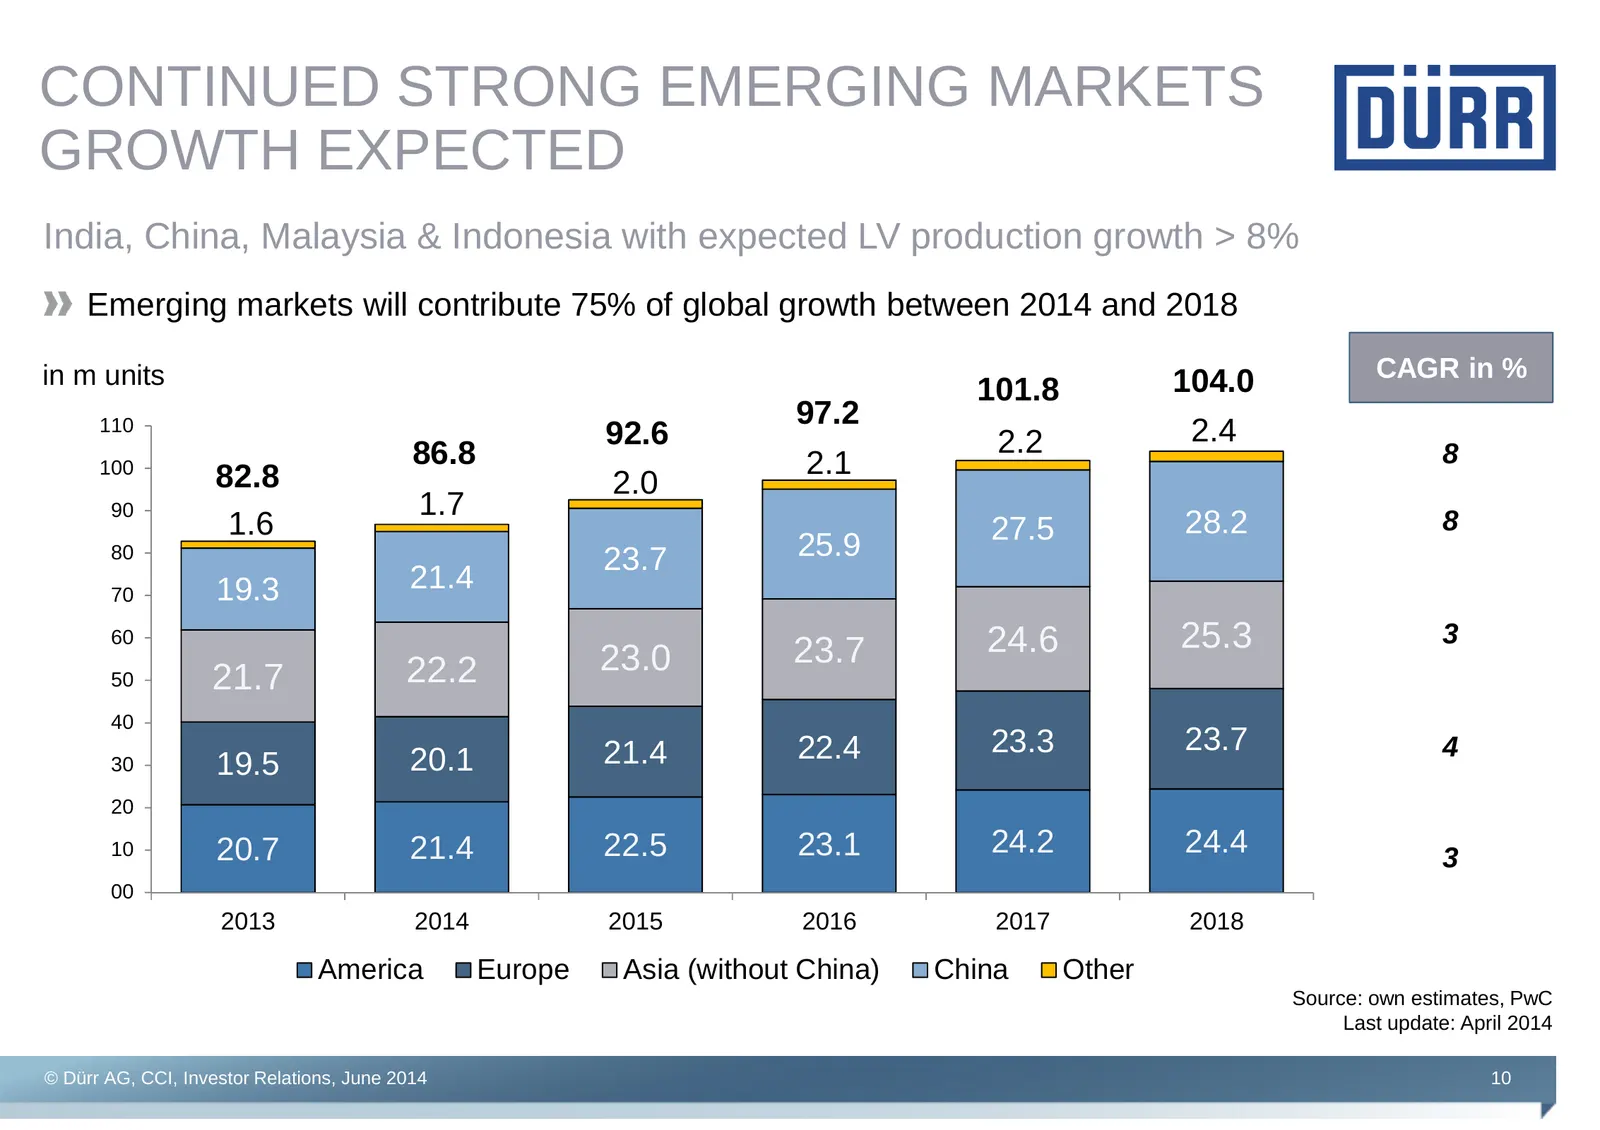
CONTINUED STRONG EMERGING MARKETS GROWTH EXPECTED India, China, Malaysia & Indonesia with expected LV production growth > 8% Emerging markets will contribute 75% of global growth between 2014 and 2018 in m units 104.0 CAGR in % 101.8 110 97.2 92.6 2.2 2.4 100 86.8 2.1 8 82.8 2.0 90 1.7 1.6 27.5 28.2
Slide 11: Agenda
AGENDA 1. Dürr: global leader with strong competitive position 2. Markets 3. Dürr Strategy 2017 4. Financial overview, outlook and summary © Dürr AG, CCI, Investor Relations, June 2014 11
Slide 12: Dürr Strategy 2017
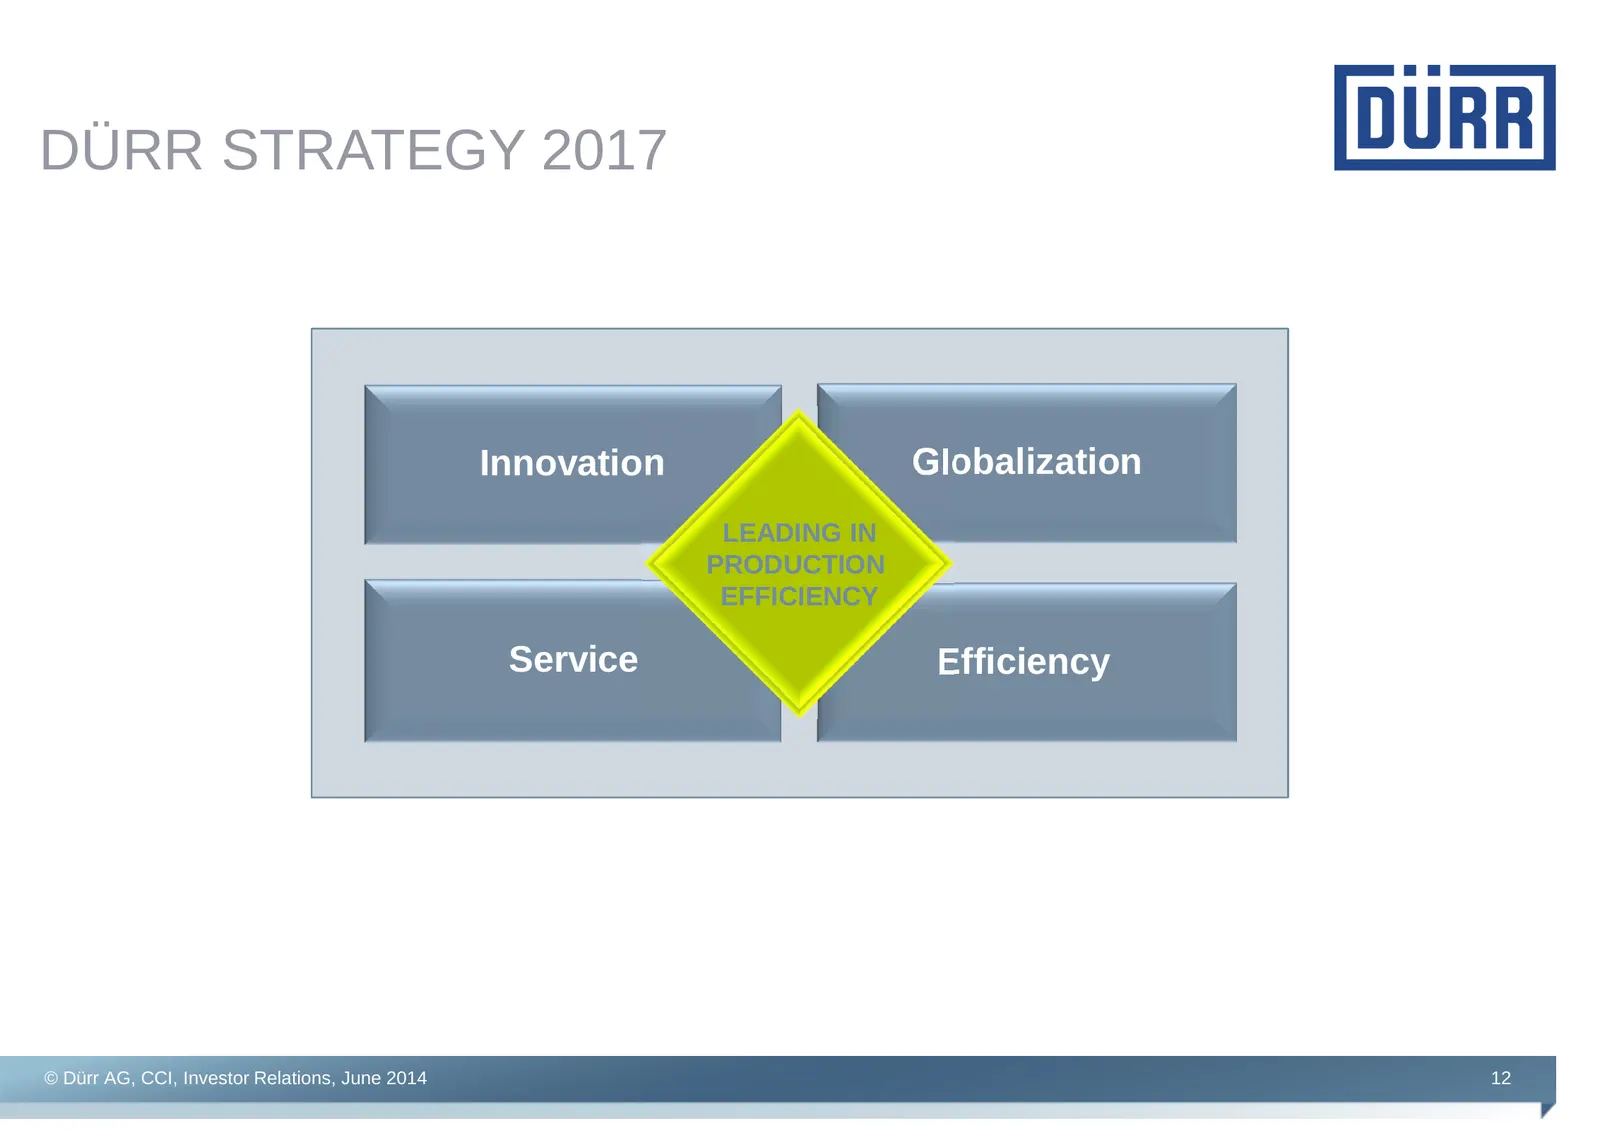
DÜRR STRATEGY 2017 Innovation Globalization LEADING IN PRODUCTION EFFICIENCY Service Efficiency © Dürr AG, CCI, Investor Relations, June 2014 12
Slide 13: Innovation: leading in production efficiency
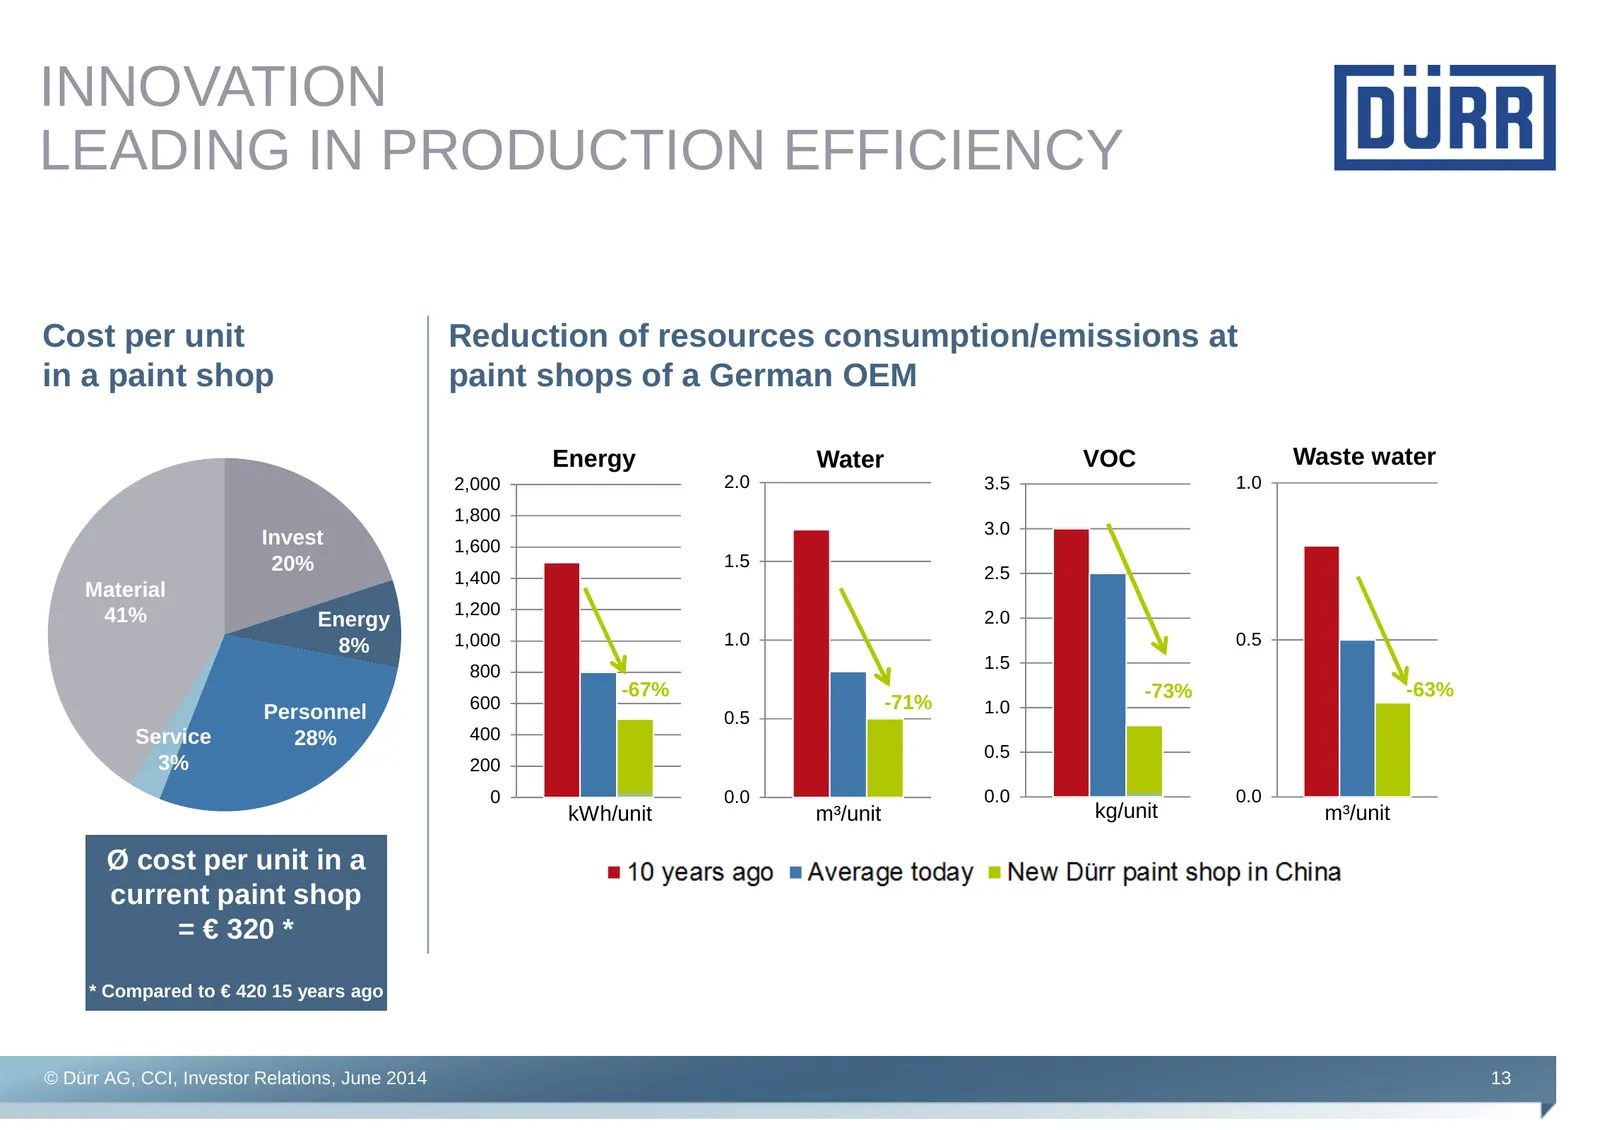
INNOVATION LEADING IN PRODUCTION EFFICIENCY Cost per unit Reduction of resources consumption/emissions at in a paint shop paint shops of a German OEM Energy Water VOC Waste water 2,000 2.0 3.5 1.0 1,800 3.0 Invest 1,600 20% 1.5 1,400 2.5 Material 41% 1,200 2.0 Energy 8% 1,000 1.0 0.5 800 1.5 -67% -7
Slide 14: Innovation examples across all businesses
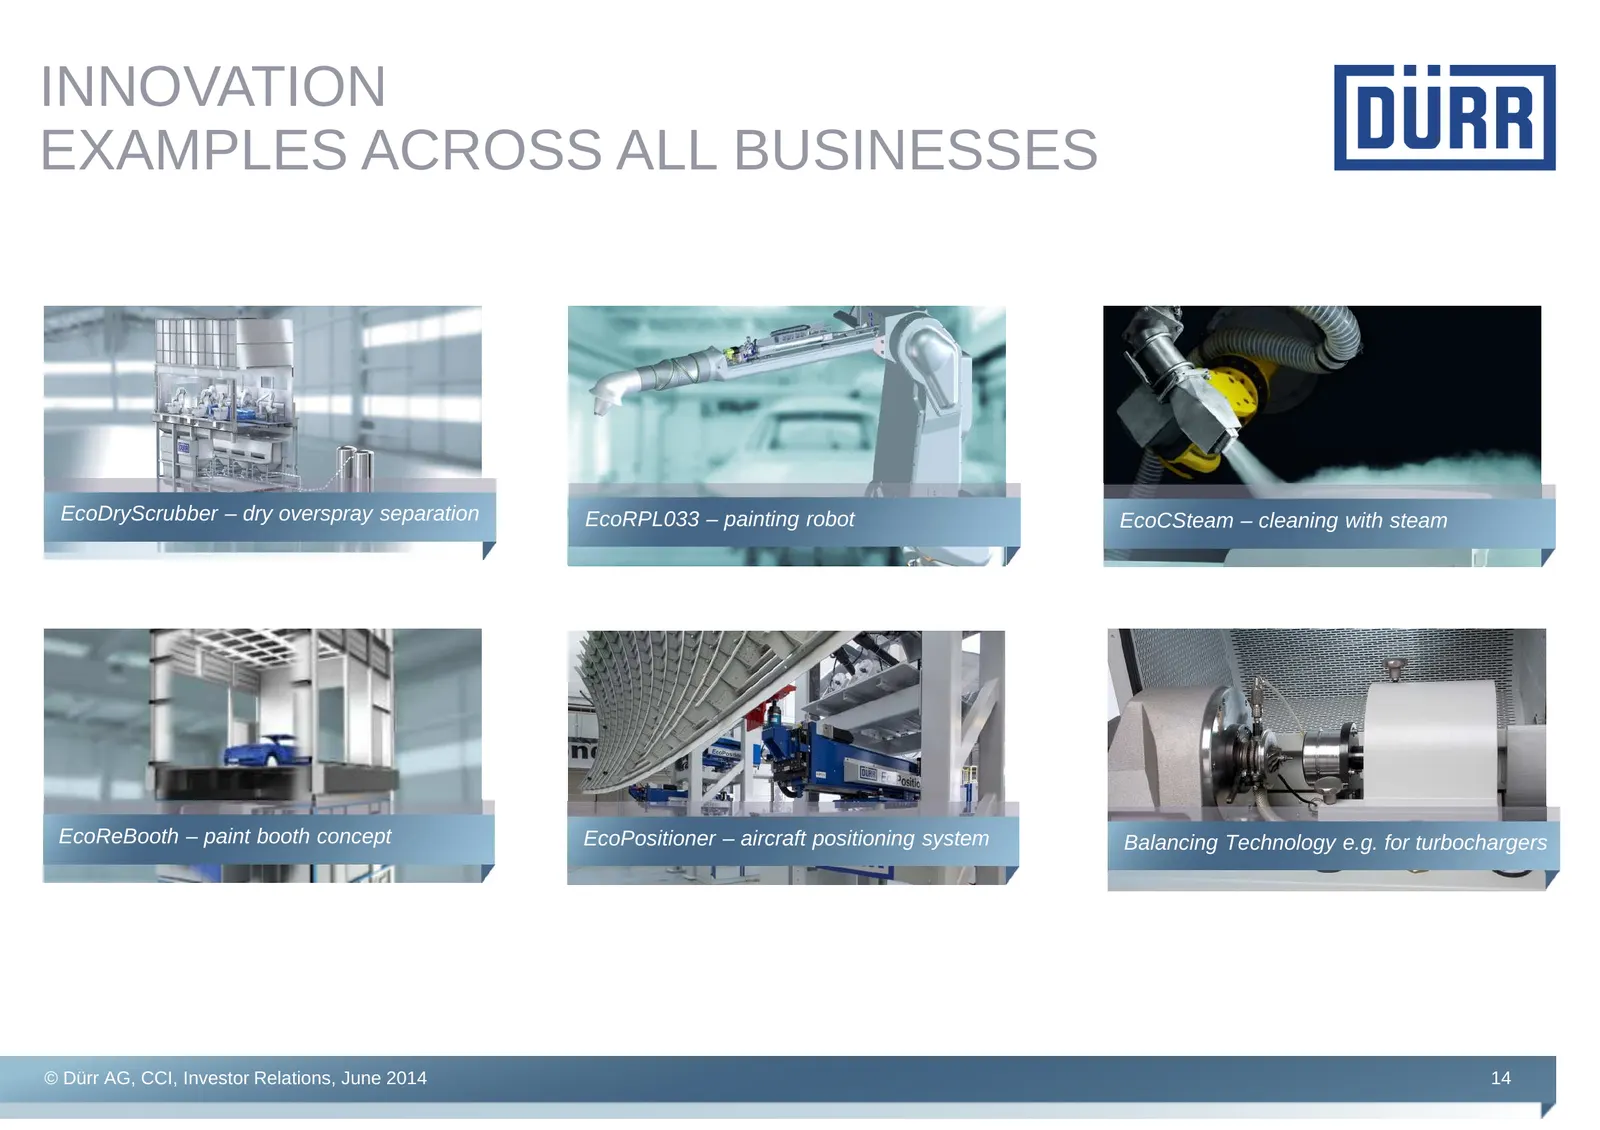
INNOVATION EXAMPLES ACROSS ALL BUSINESSES EcoDryScrubber – dry overspray separation EcoRPL033 – painting robot EcoCSteam – cleaning with steam EcoReBooth – paint booth concept EcoPositioner – aircraft positioning system Balancing Technology e.g. for turbochargers © Dürr AG, CCI, Investor Relations,
Slide 15: Innovation
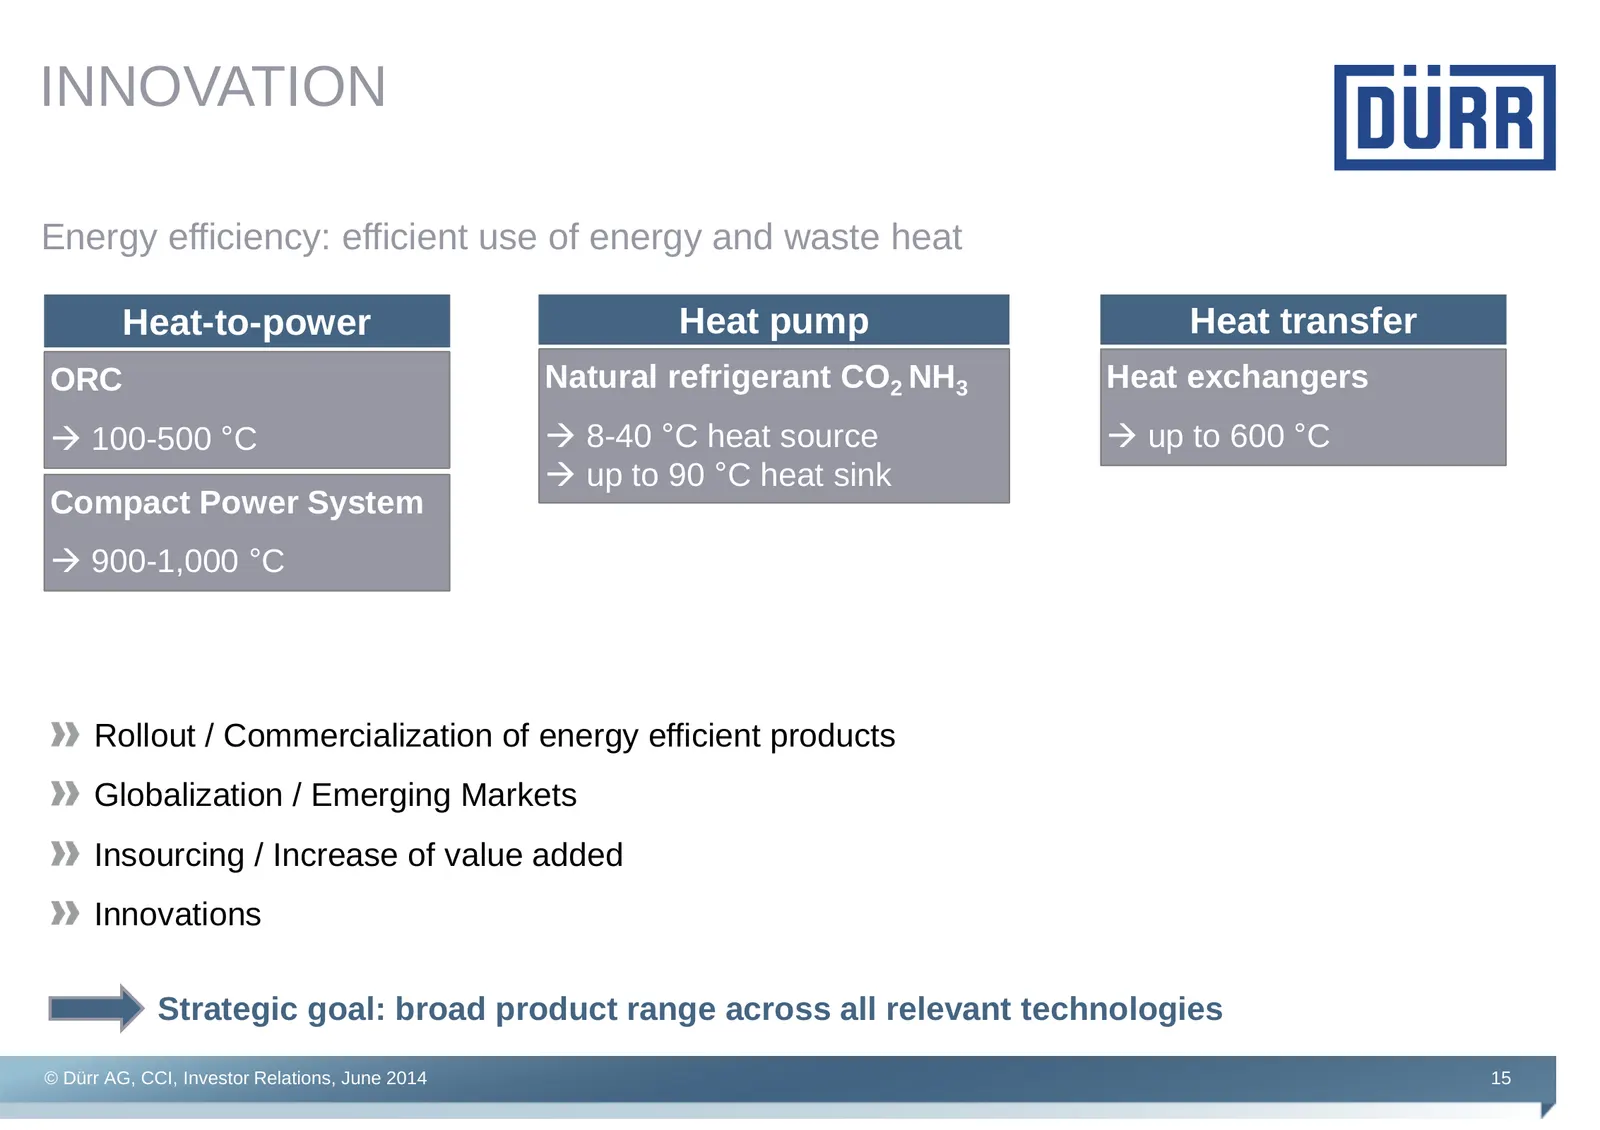
INNOVATION Energy efficiency: efficient use of energy and waste heat Heat-to-power Heat pump Heat transfer ORC Natural refrigerant CO2 NH3 Heat exchangers 100-500 °C 8-40 °C heat source up to 600 °C up to 90 °C heat sink Compact Power System 900-1,000 °C Rollout / Commercialization of energy efficie
Slide 16: Globalization: focus on emerging markets
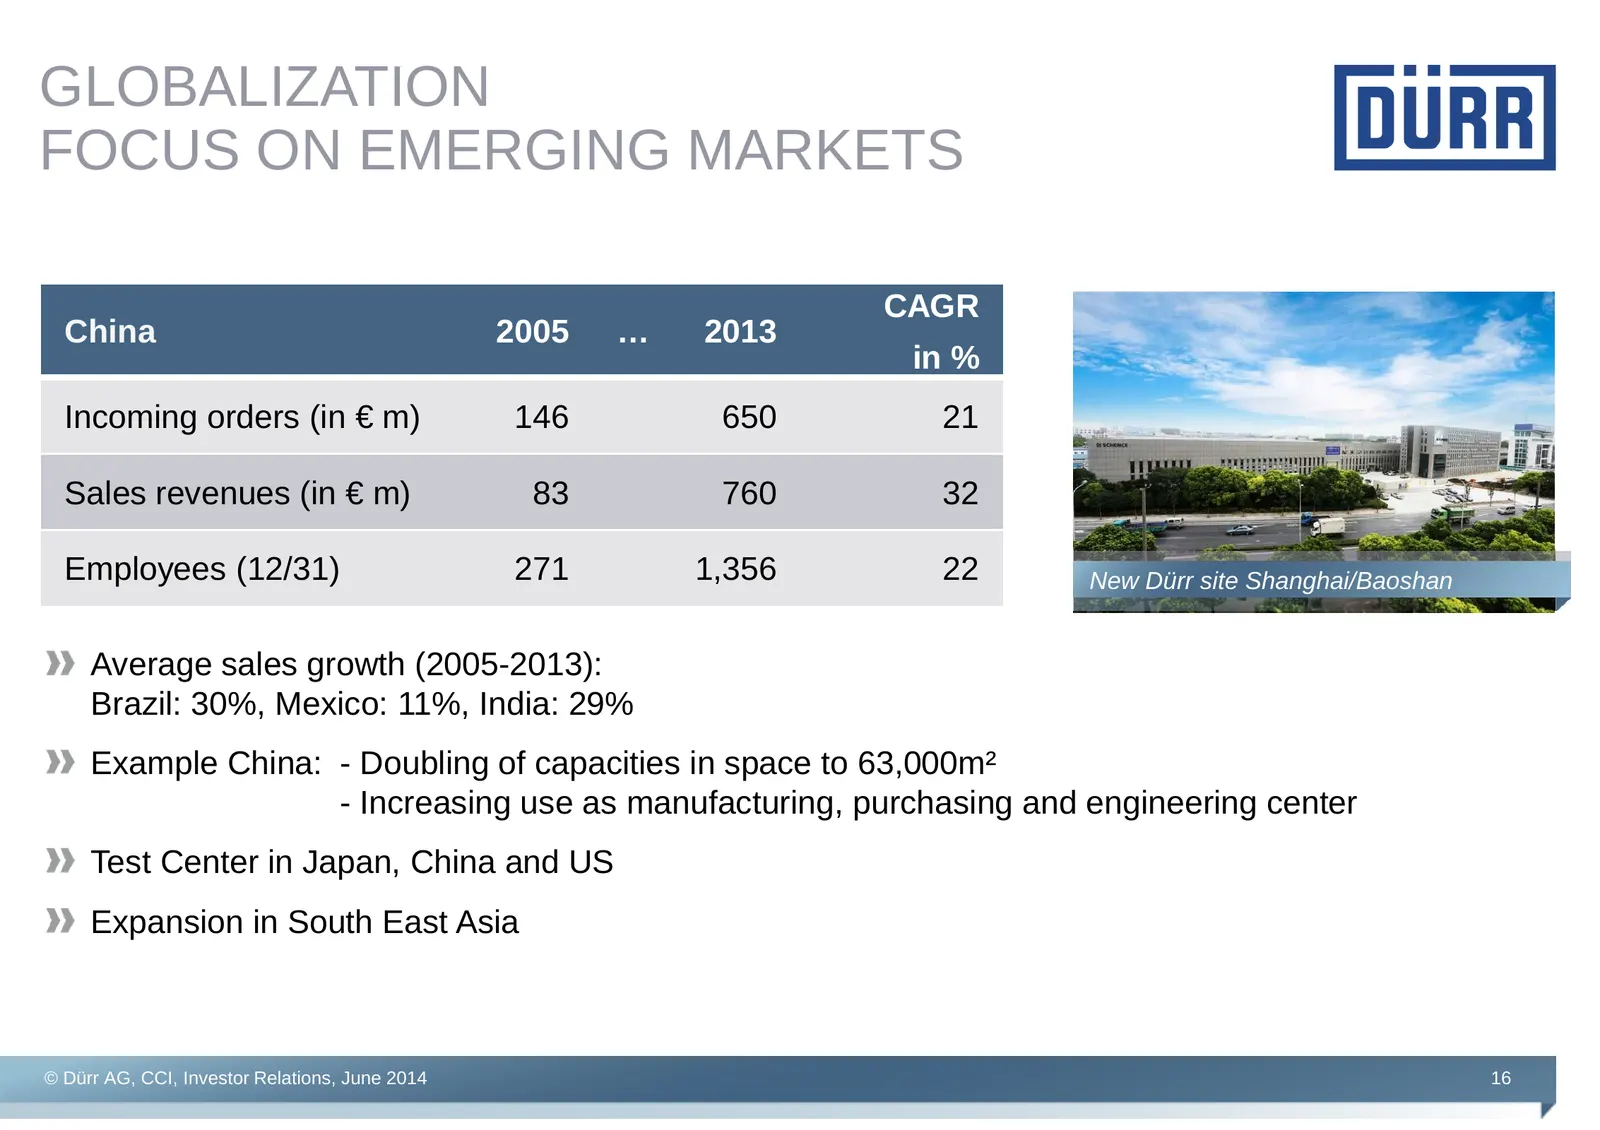
GLOBALIZATION FOCUS ON EMERGING MARKETS CAGR China 2005 … 2013 in % Incoming orders (in € m) 146 650 21 Sales revenues (in € m) 83 760 32 Employees (12/31) 271 1,356 22 New Dürr site Shanghai/Baoshan Average sales growth (2005-2013): Brazil: 30%, Mexico: 11%, India: 29% Example China: - Doubling of
Slide 17: Globalization: examples of capacities expansions
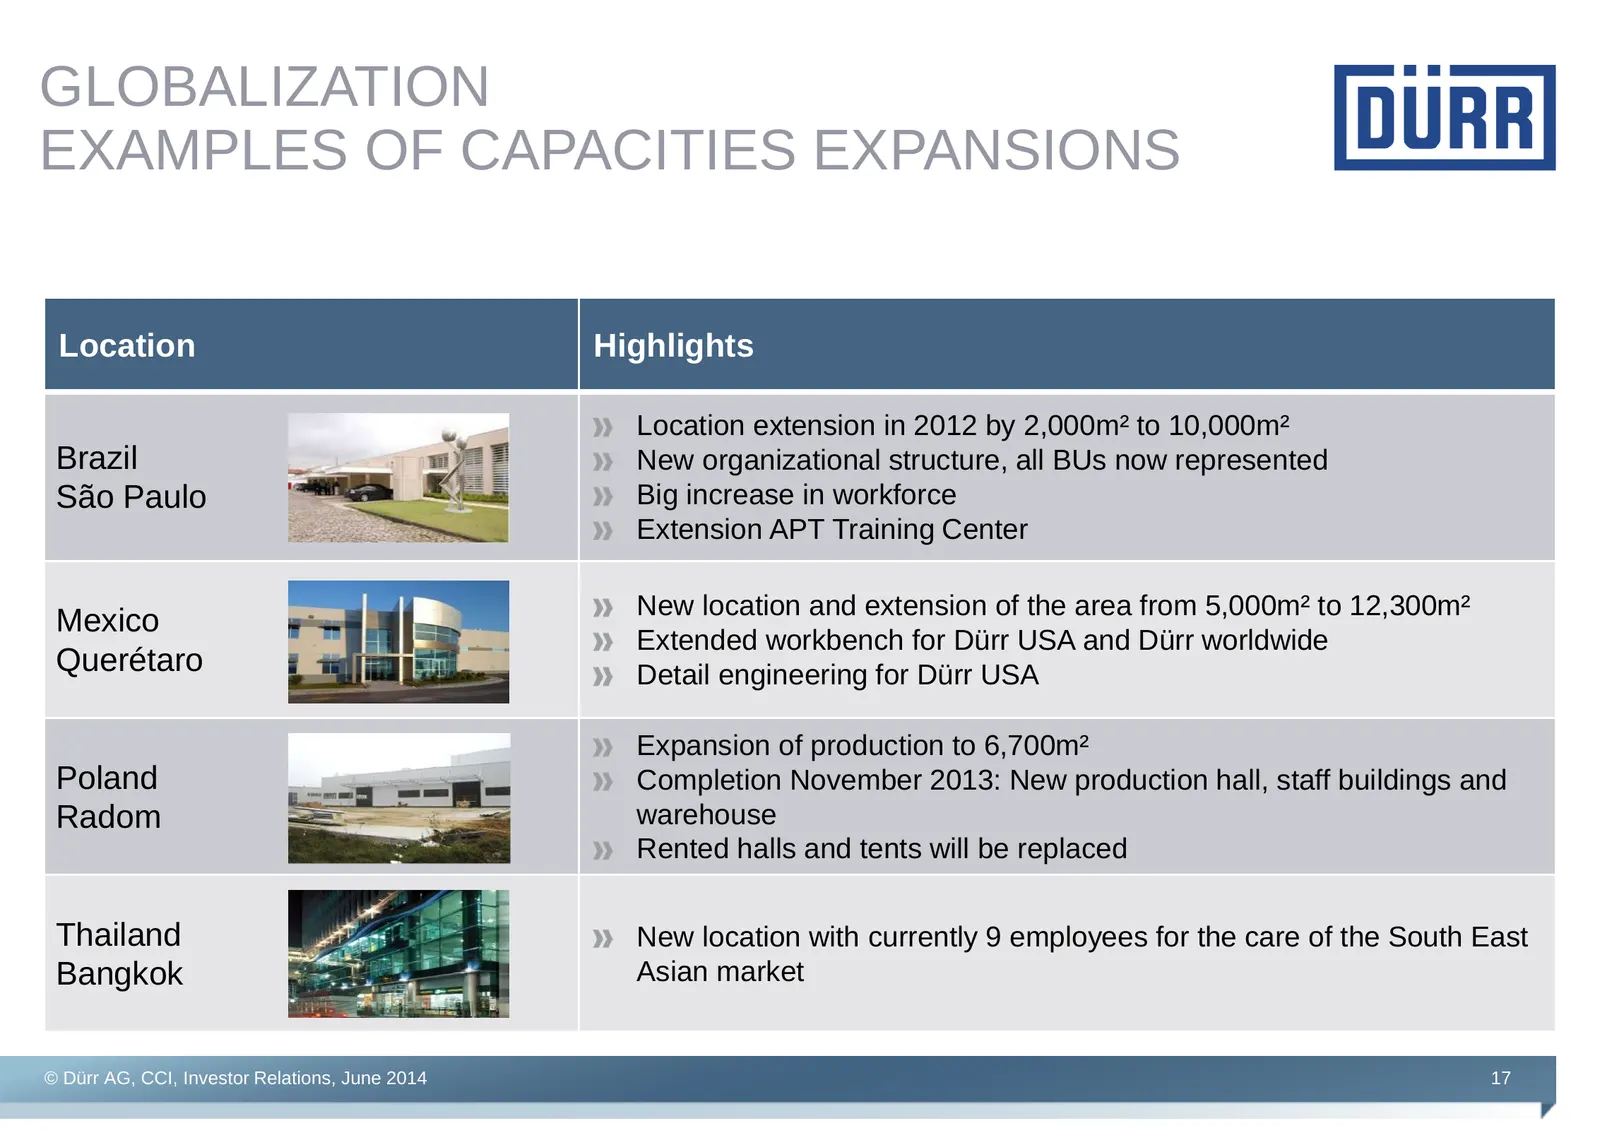
GLOBALIZATION EXAMPLES OF CAPACITIES EXPANSIONS Location Highlights Location extension in 2012 by 2,000m² to 10,000m² Brazil New organizational structure, all BUs now represented São Paulo Big increase in workforce Extension APT Training Center New location and extension of the area from 5,000m² to
Slide 18: Globalization: acquisitions
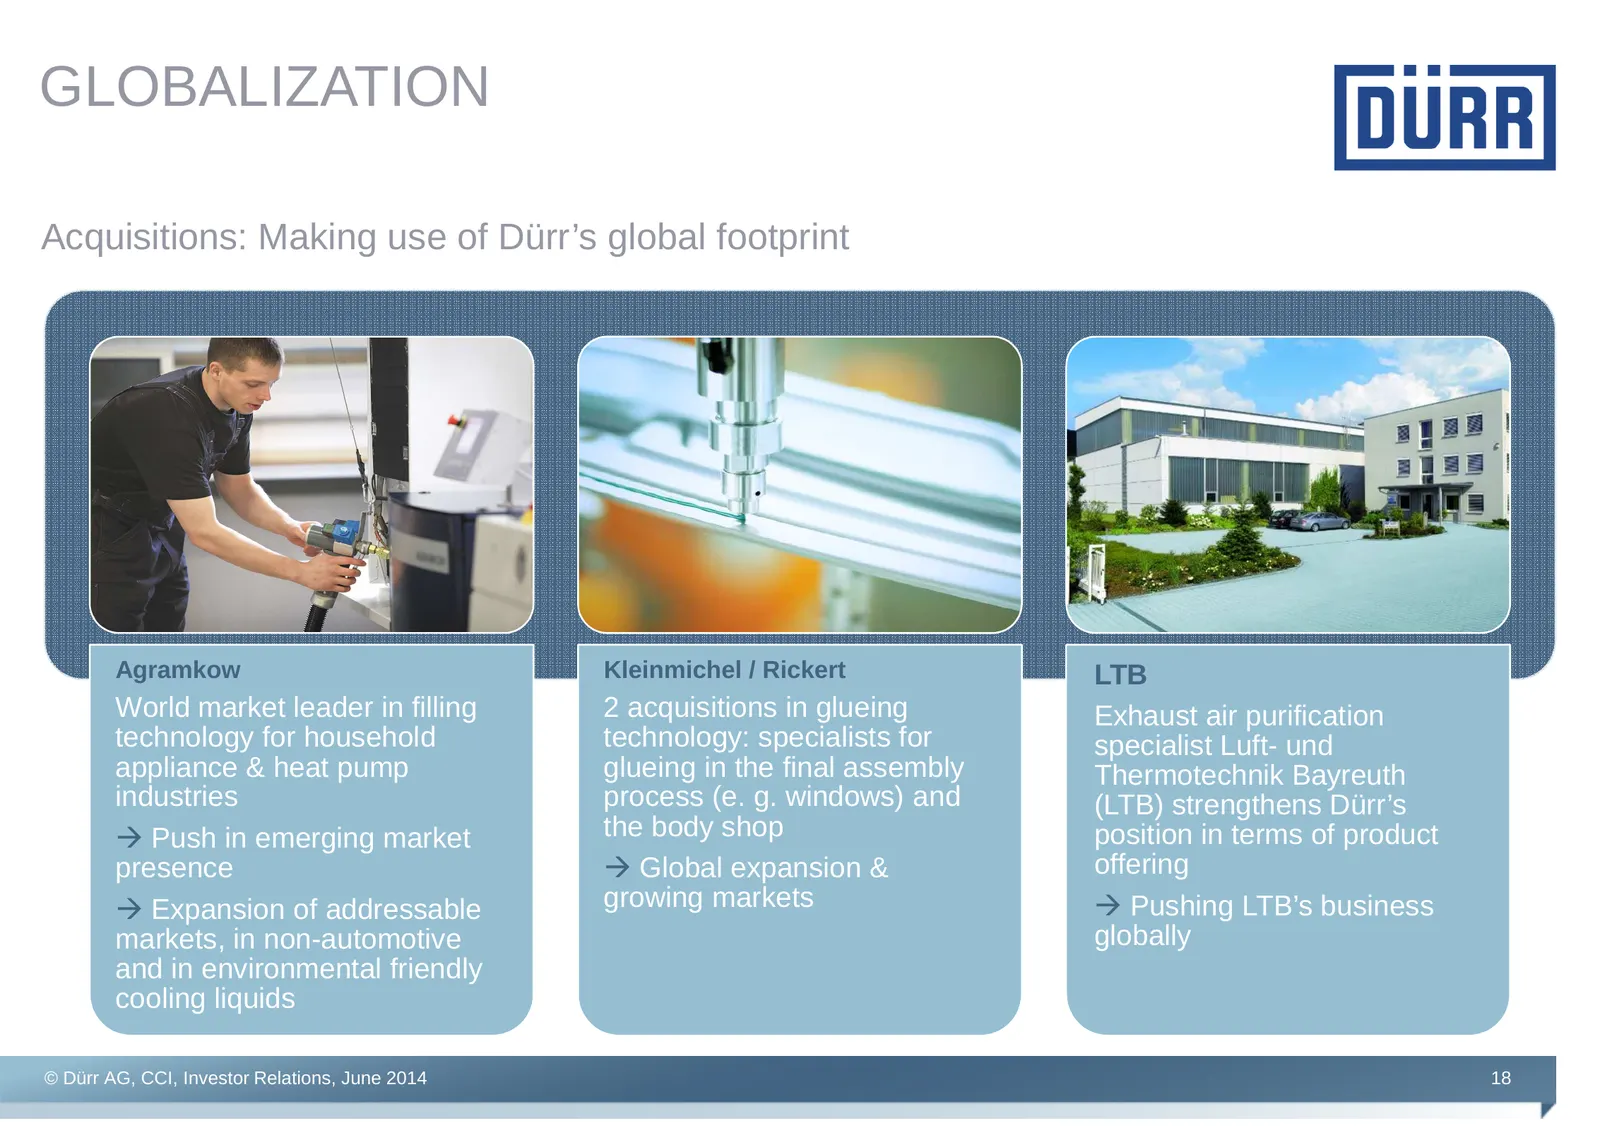
GLOBALIZATION Acquisitions: Making use of Dürr’s global footprint Agramkow Kleinmichel / Rickert LTB World market leader in filling 2 acquisitions in glueing Exhaust air purification technology for household technology: specialists for specialist Luft- und appliance & heat pump glueing in the final
Slide 19: Service growth strategy
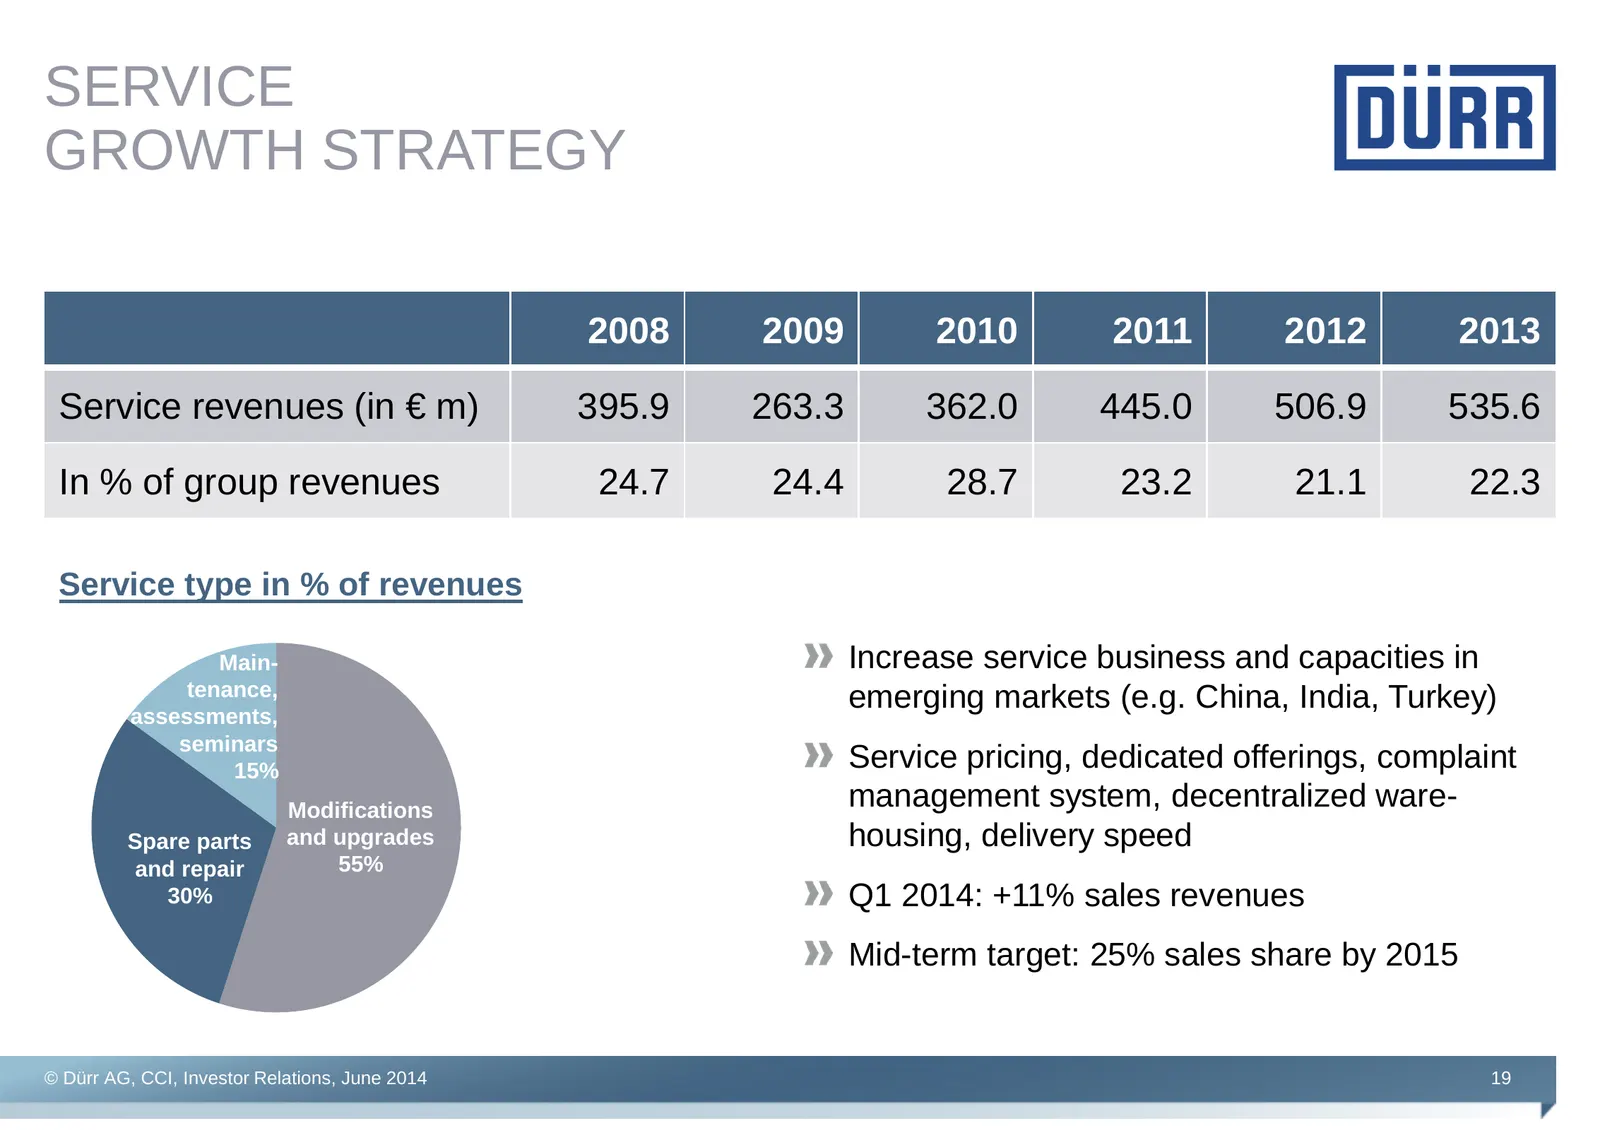
SERVICE GROWTH STRATEGY 2008 2009 2010 2011 2012 2013 Service revenues (in € m) 395.9 263.3 362.0 445.0 506.9 535.6 In % of group revenues 24.7 24.4 28.7 23.2 21.1 22.3 Service type in % of revenues Main- Increase service business and capacities in tenance, emerging markets (e.g. China, India, Turke
Slide 20: Service growth strategy
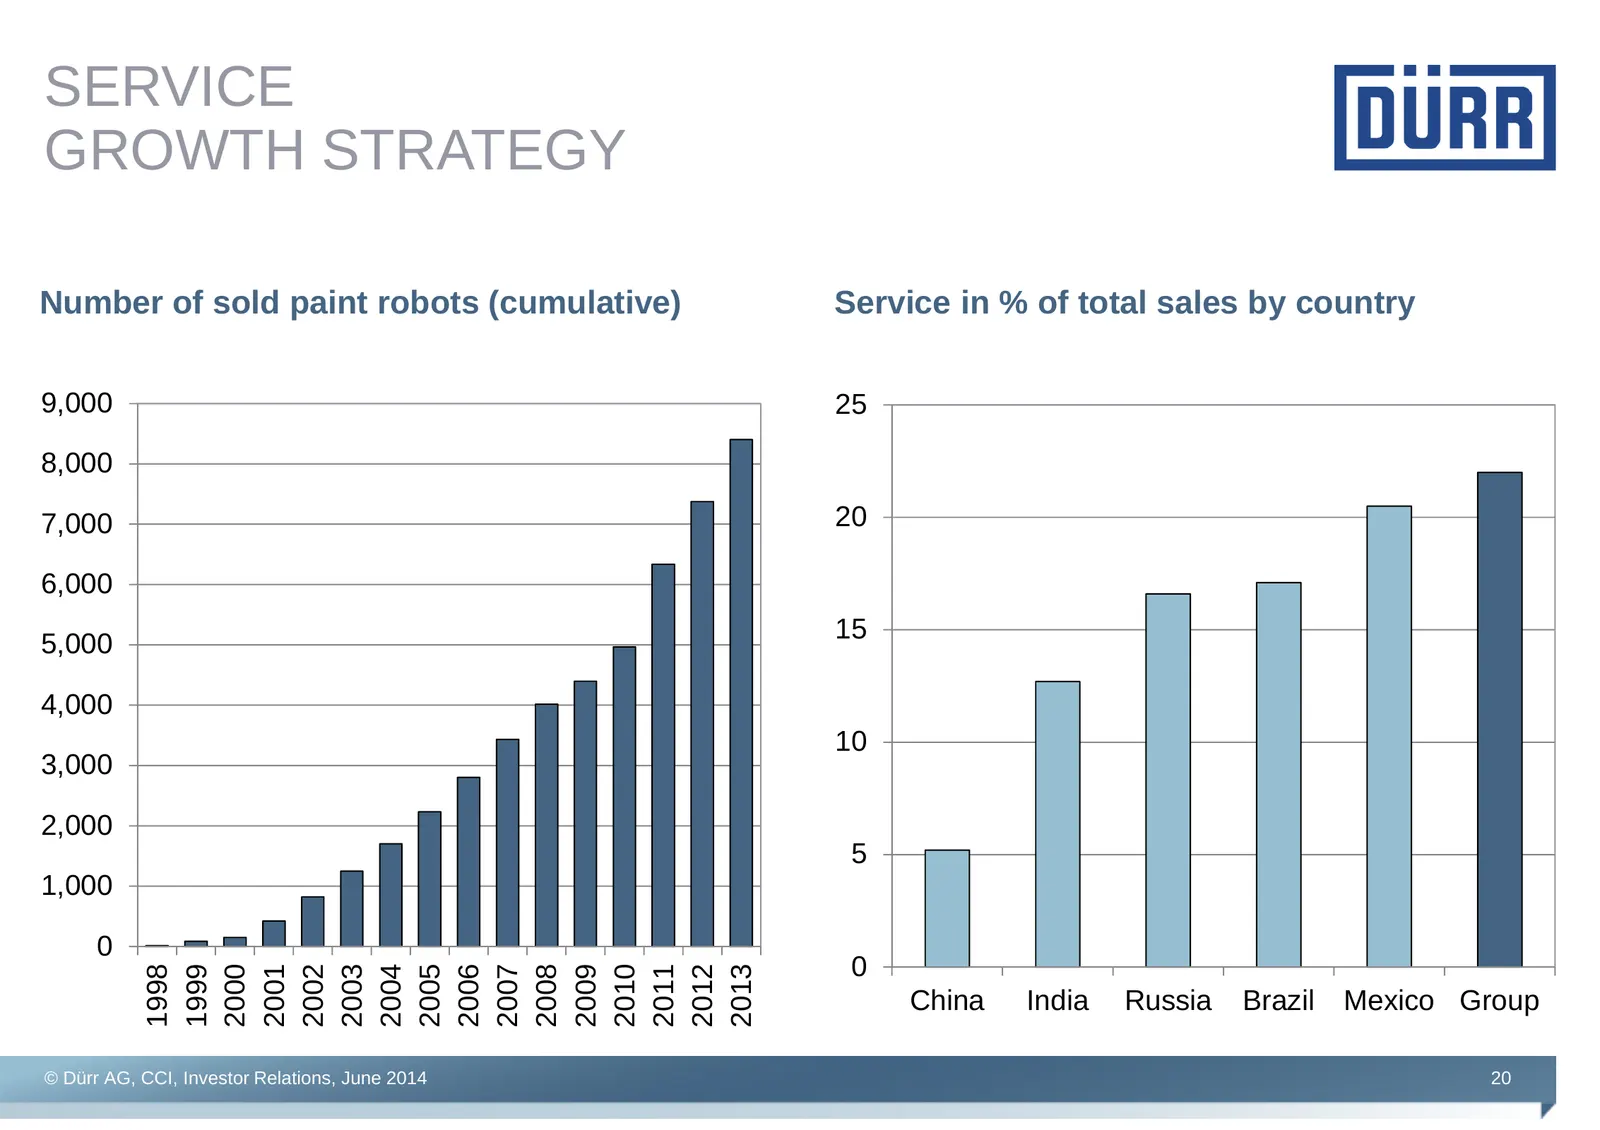
SERVICE GROWTH STRATEGY Number of sold paint robots (cumulative) Service in % of total sales by country 9,000 25 8,000 7,000 20 6,000 15 5,000 4,000 10 3,000 2,000 5 1,000 0 0 1998 1999 2000 2001 2002 2003 2004 2005 2006 2007 2008 2009 2010 2011 2012 2013 China India Russia Brazil Mexico Group © Dür
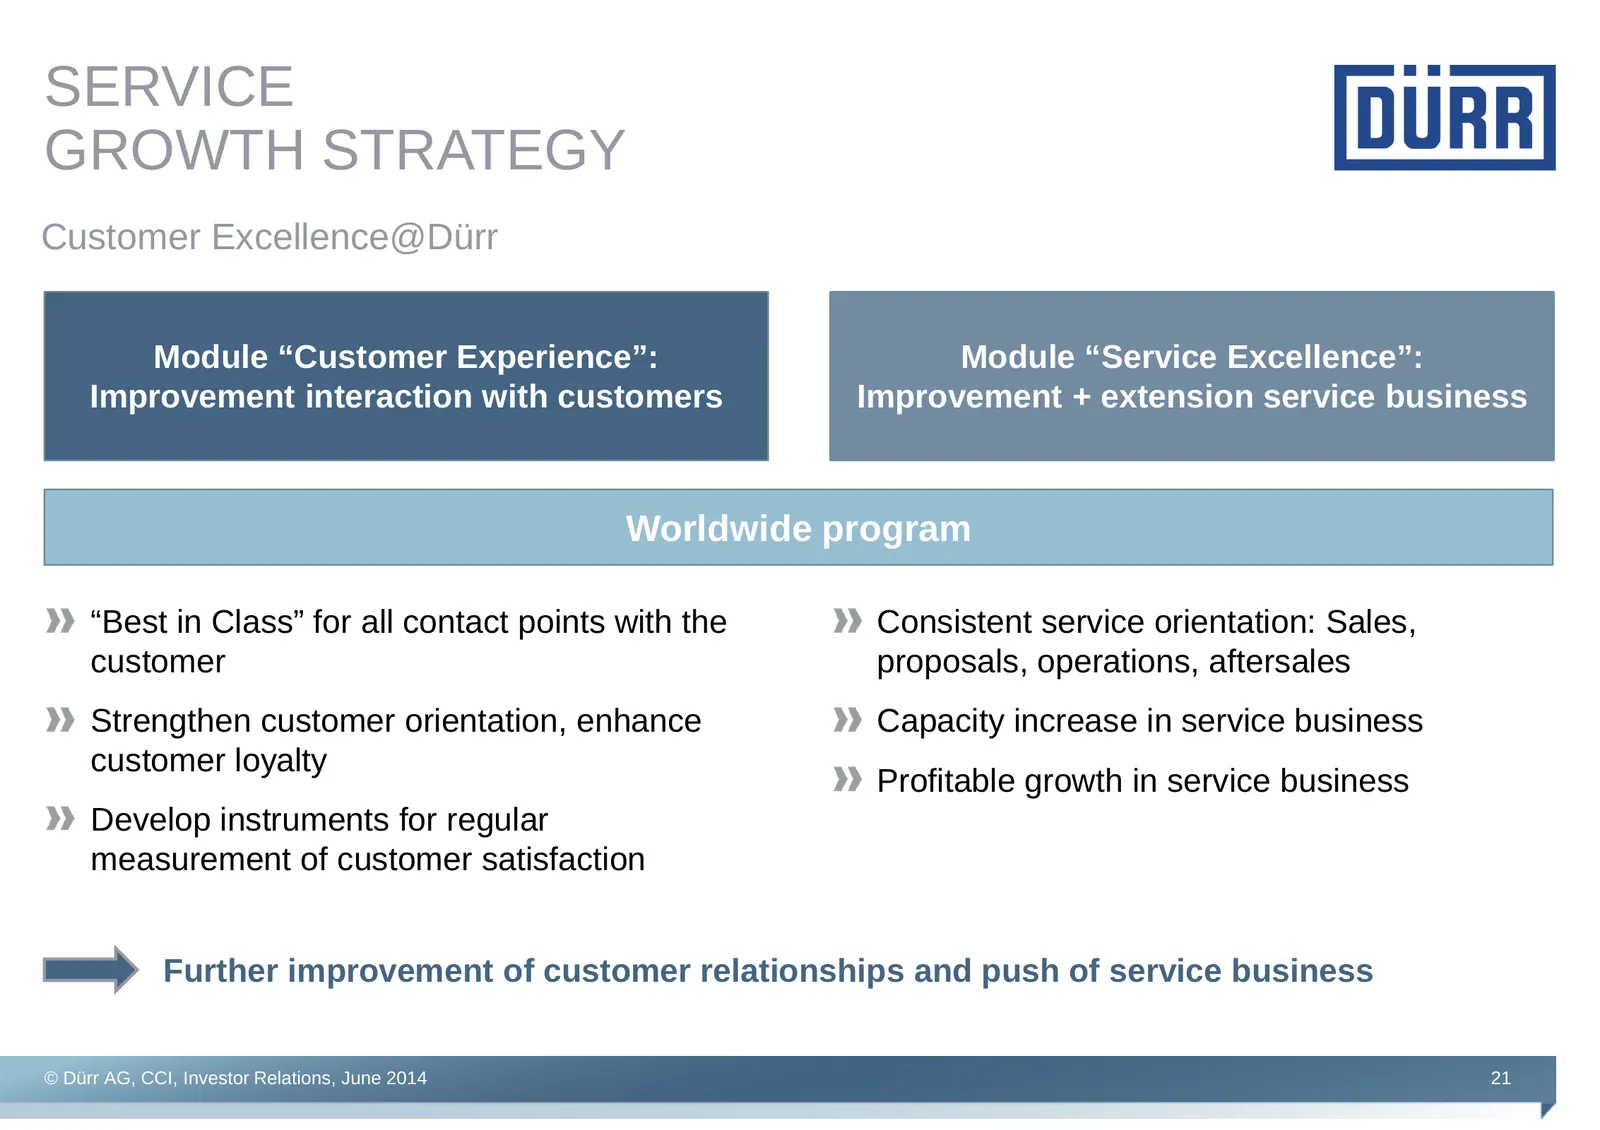
Slide 21: Service growth strategy: Customer Excellence@Dürr
SERVICE GROWTH STRATEGY Customer Excellence@Dürr Module “Customer Experience”: Module “Service Excellence”: Improvement interaction with customers Improvement + extension service business Worldwide program “Best in Class” for all contact points with the Consistent service orientation: Sales, custome
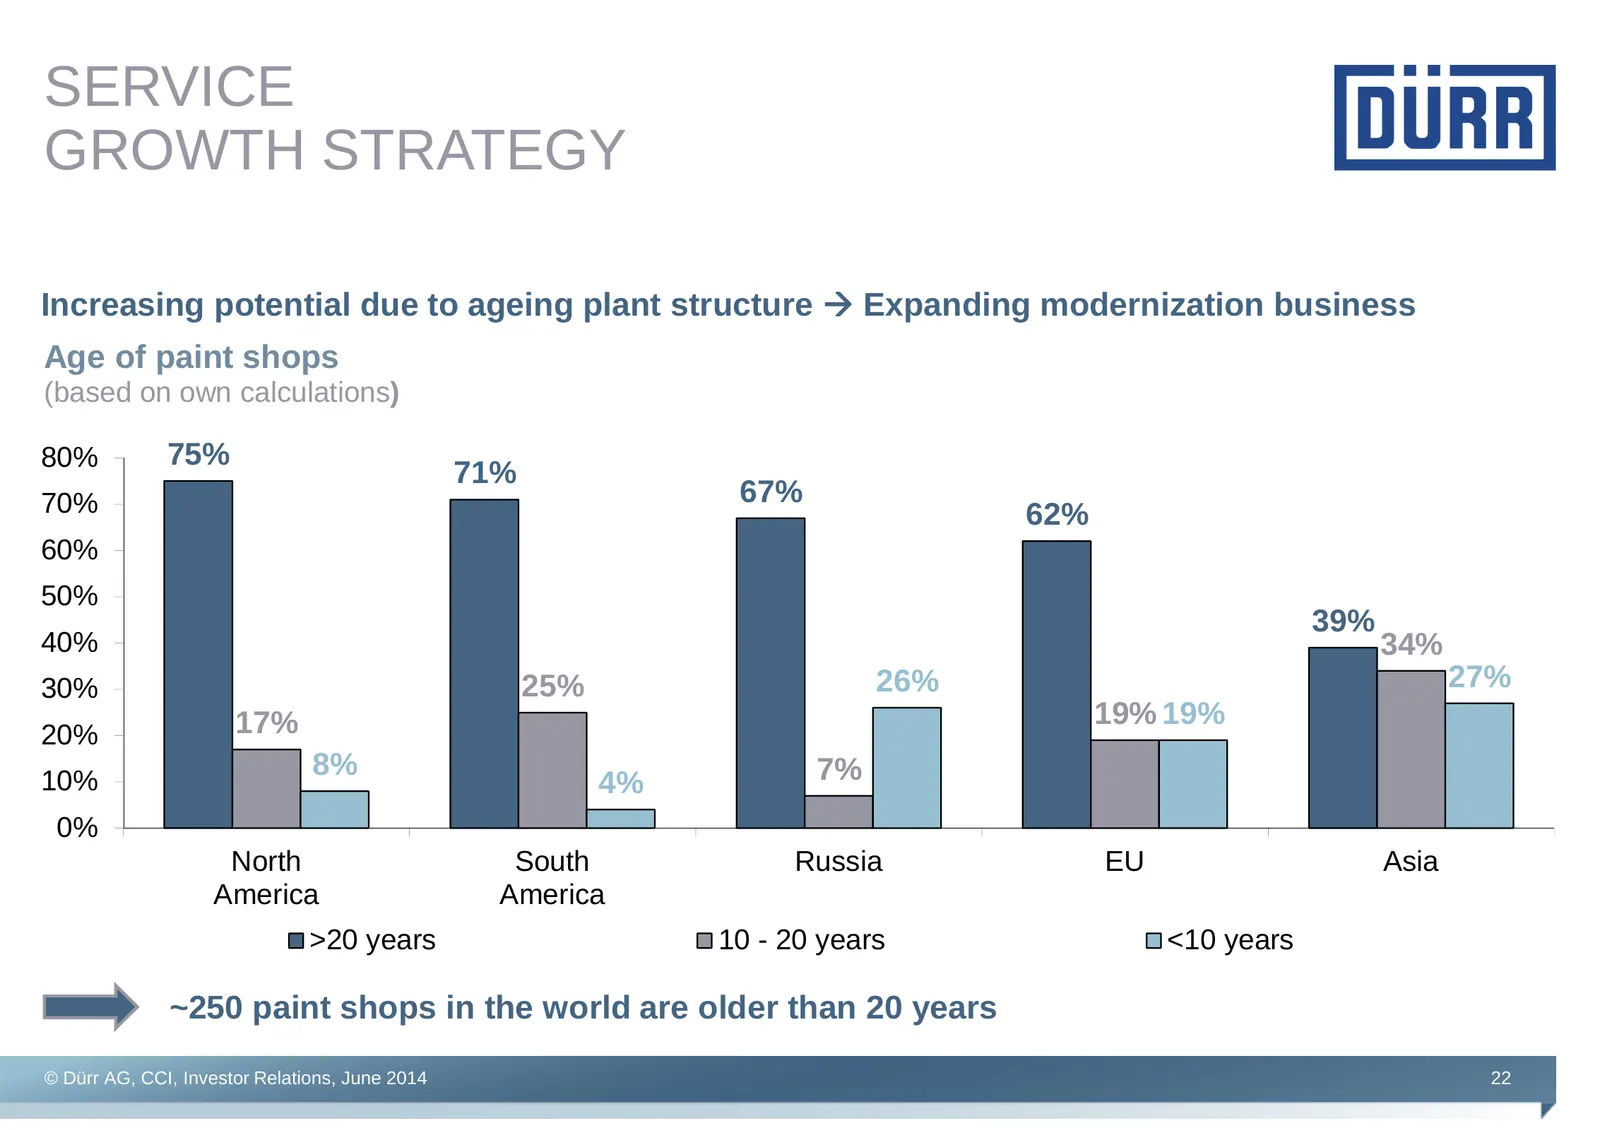
Slide 22: Service growth strategy
SERVICE GROWTH STRATEGY Increasing potential due to ageing plant structure Expanding modernization business Age of paint shops (based on own calculations) 80% 75% 71% 70% 67% 62% 60% 50% 39% 40% 34% 30% 25% 26% 27% 17% 19% 19% 20% 10% 8% 7% 4% 0% North South Russia EU Asia America America >20 years
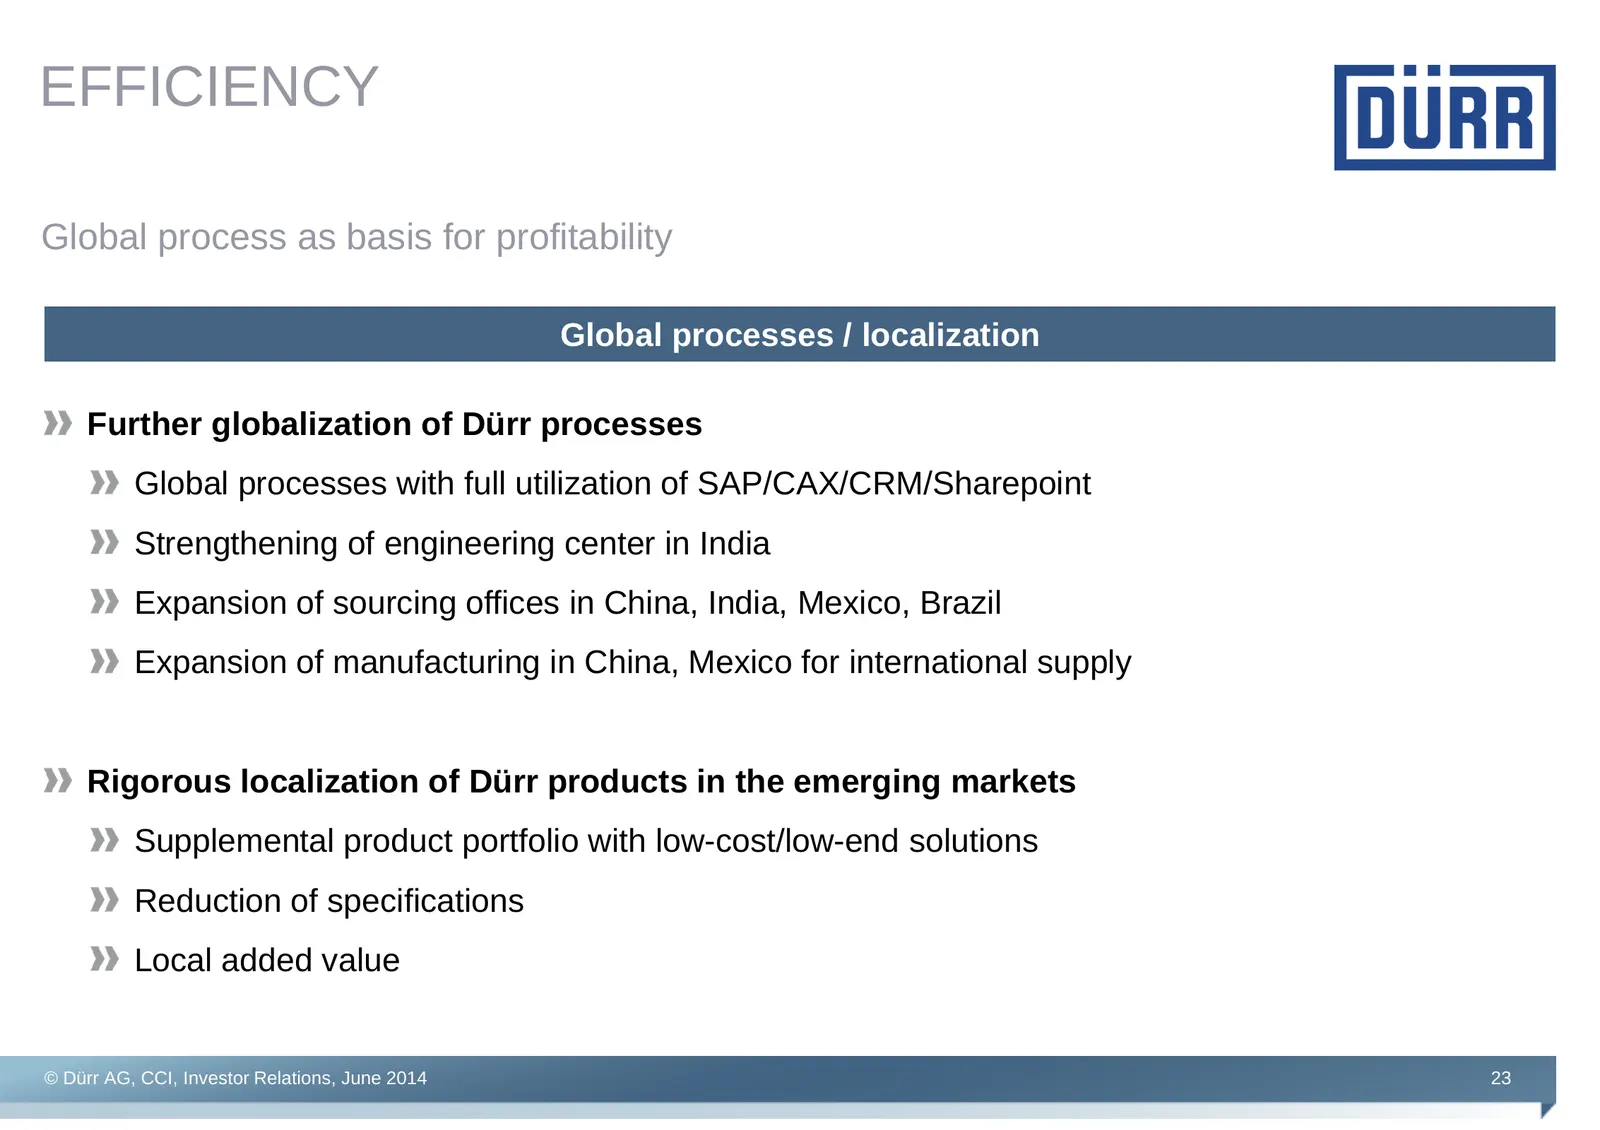
Slide 23: Efficiency
EFFICIENCY Global process as basis for profitability Global processes / localization Further globalization of Dürr processes Global processes with full utilization of SAP/CAX/CRM/Sharepoint Strengthening of engineering center in India Expansion of sourcing offices in China, India, Mexico, Brazil Exp
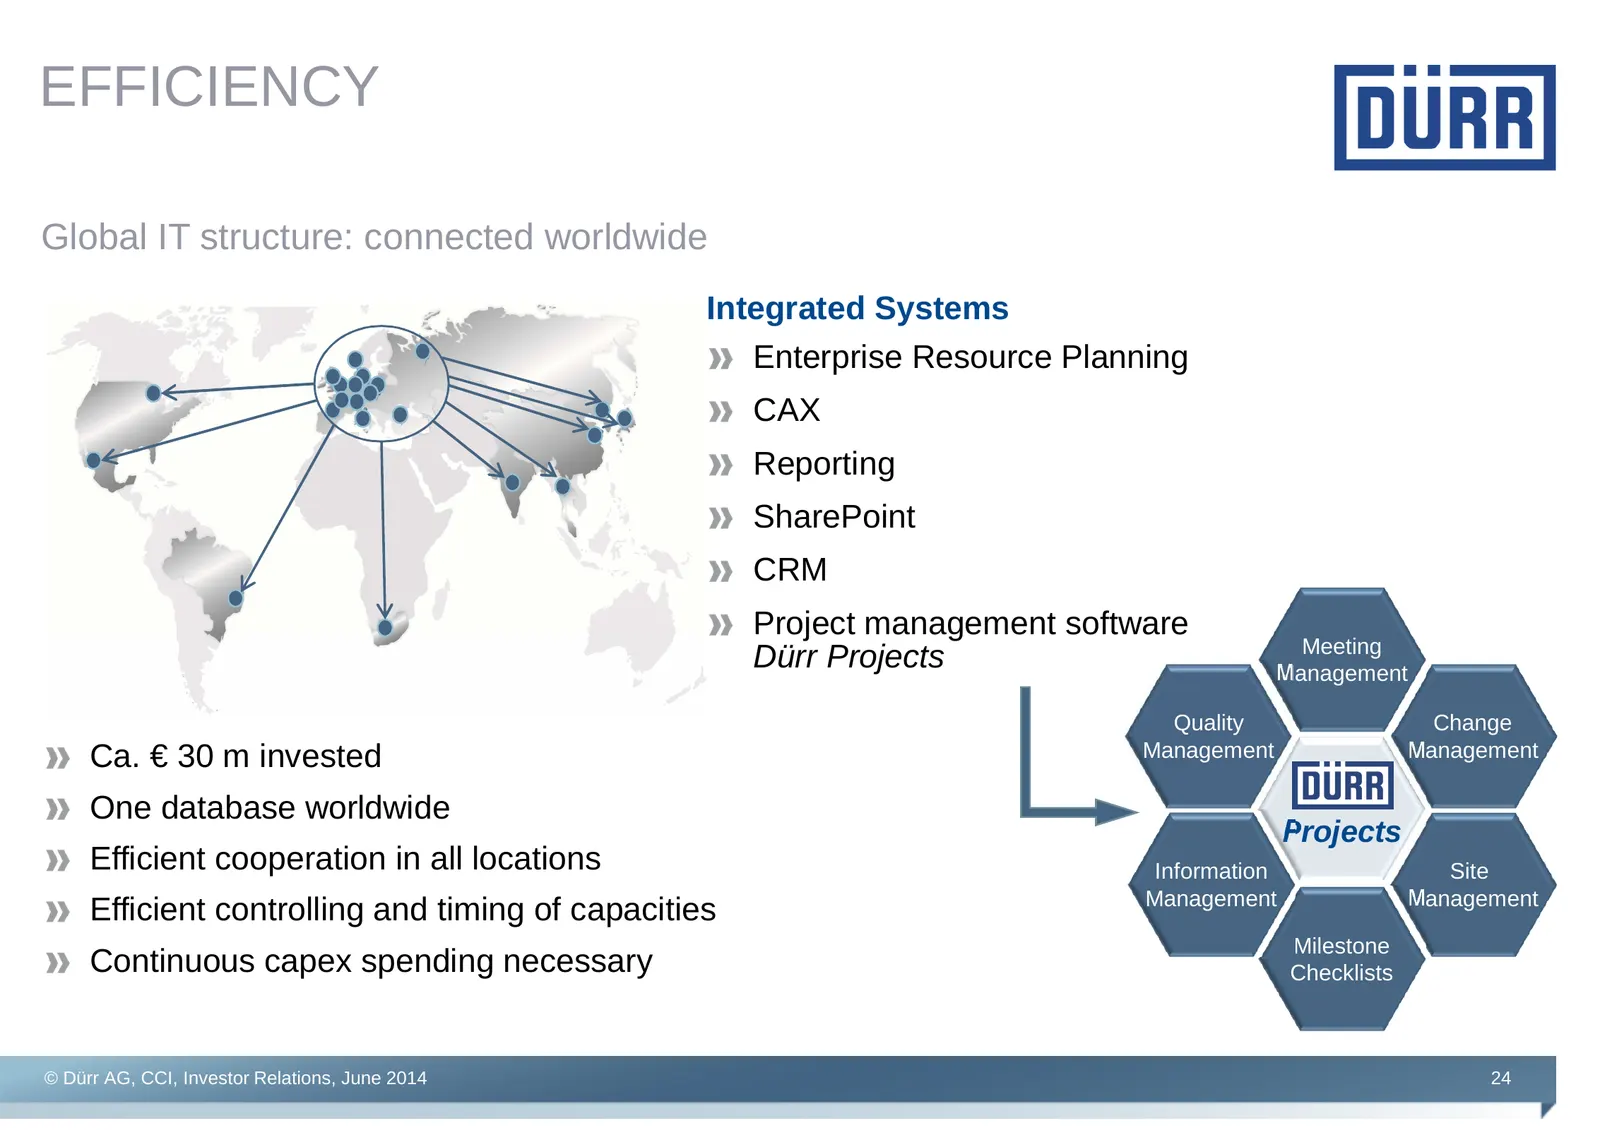
Slide 24: Efficiency: global IT structure
EFFICIENCY Global IT structure: connected worldwide Integrated Systems Enterprise Resource Planning CAX Reporting SharePoint CRM Project management software Meeting Dürr Projects Management Quality Change Ca. € 30 m invested Management Management One database worldwide Projects Efficient cooperation
Slide 25: Agenda
AGENDA 1. Dürr: global leader with strong competitive position 2. Markets 3. Dürr Strategy 2017 4. Financial overview, outlook and summary © Dürr AG, CCI, Investor Relations, June 2014 25
Slide 26: Strong earnings
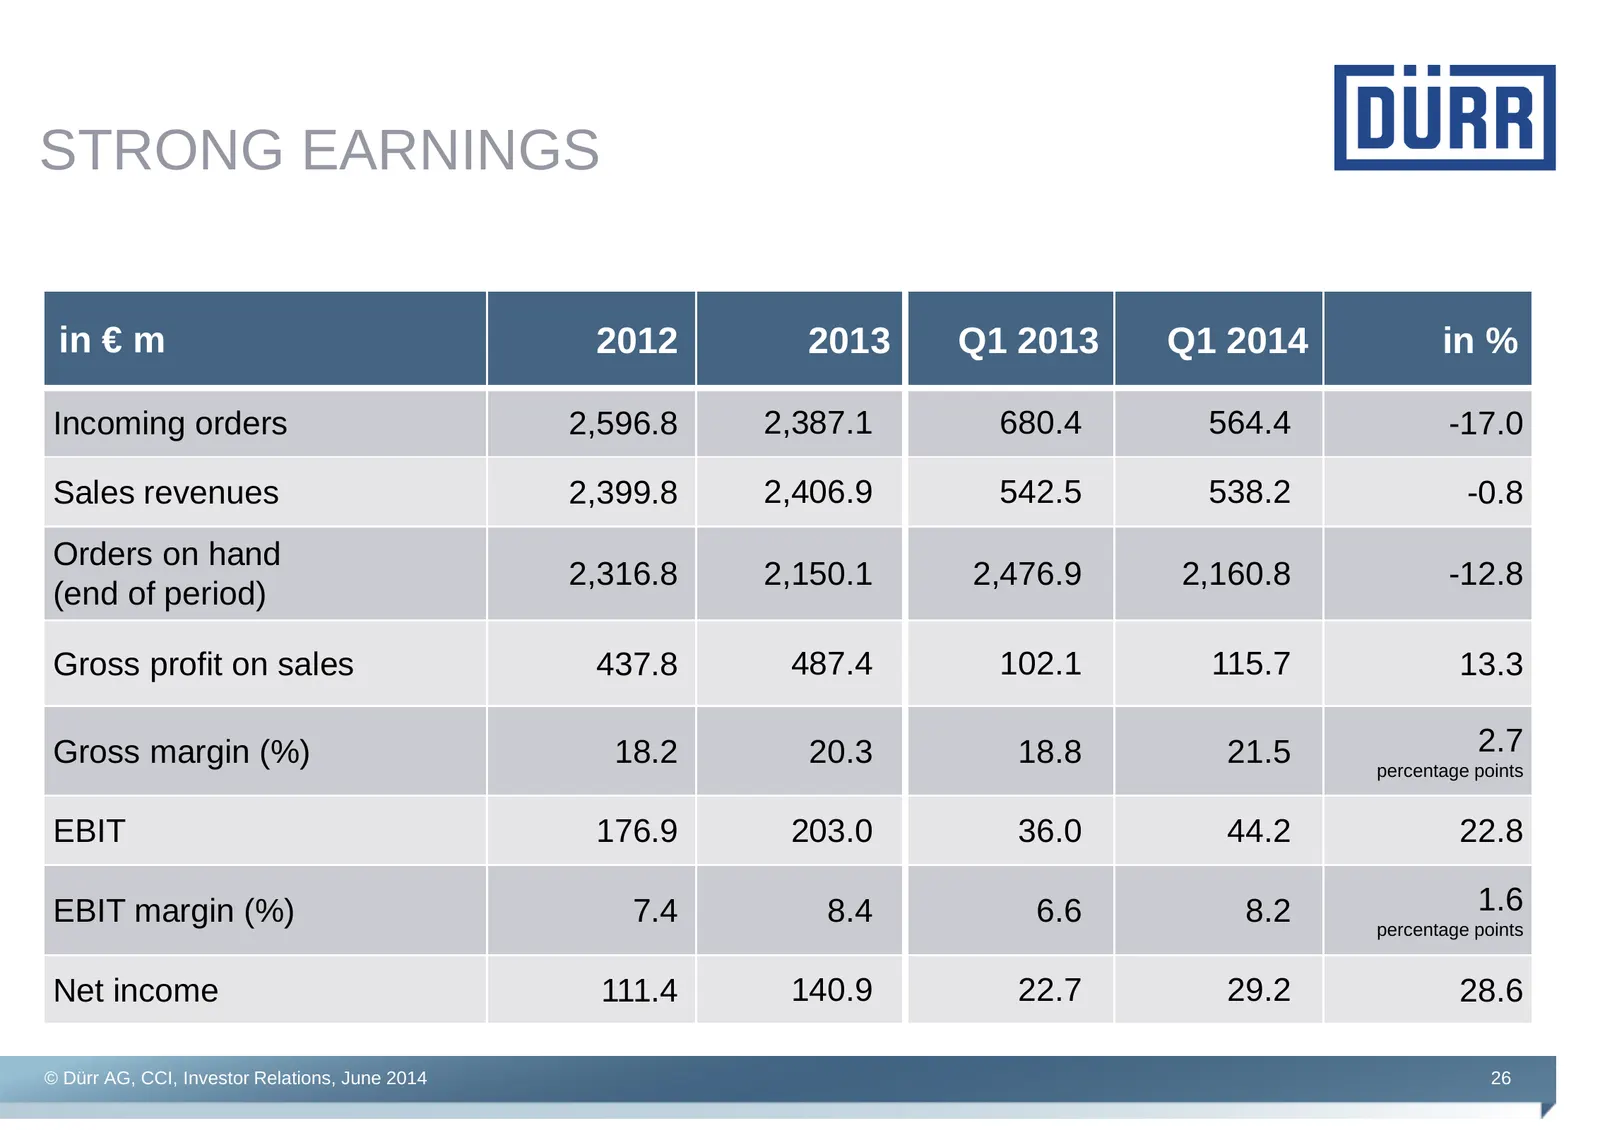
STRONG EARNINGS in € m 2012 2013 Q1 2013 Q1 2014 ∆ in % Incoming orders 2,596.8 2,387.1 680.4 564.4 -17.0 Sales revenues 2,399.8 2,406.9 542.5 538.2 -0.8 Orders on hand 2,316.8 2,150.1 2,476.9 2,160.8 -12.8 (end of period) Gross profit on sales 437.8 487.4 102.1 115.7 13.3 Gross margin (%) 18.2 20.3
Slide 27: Cash flow
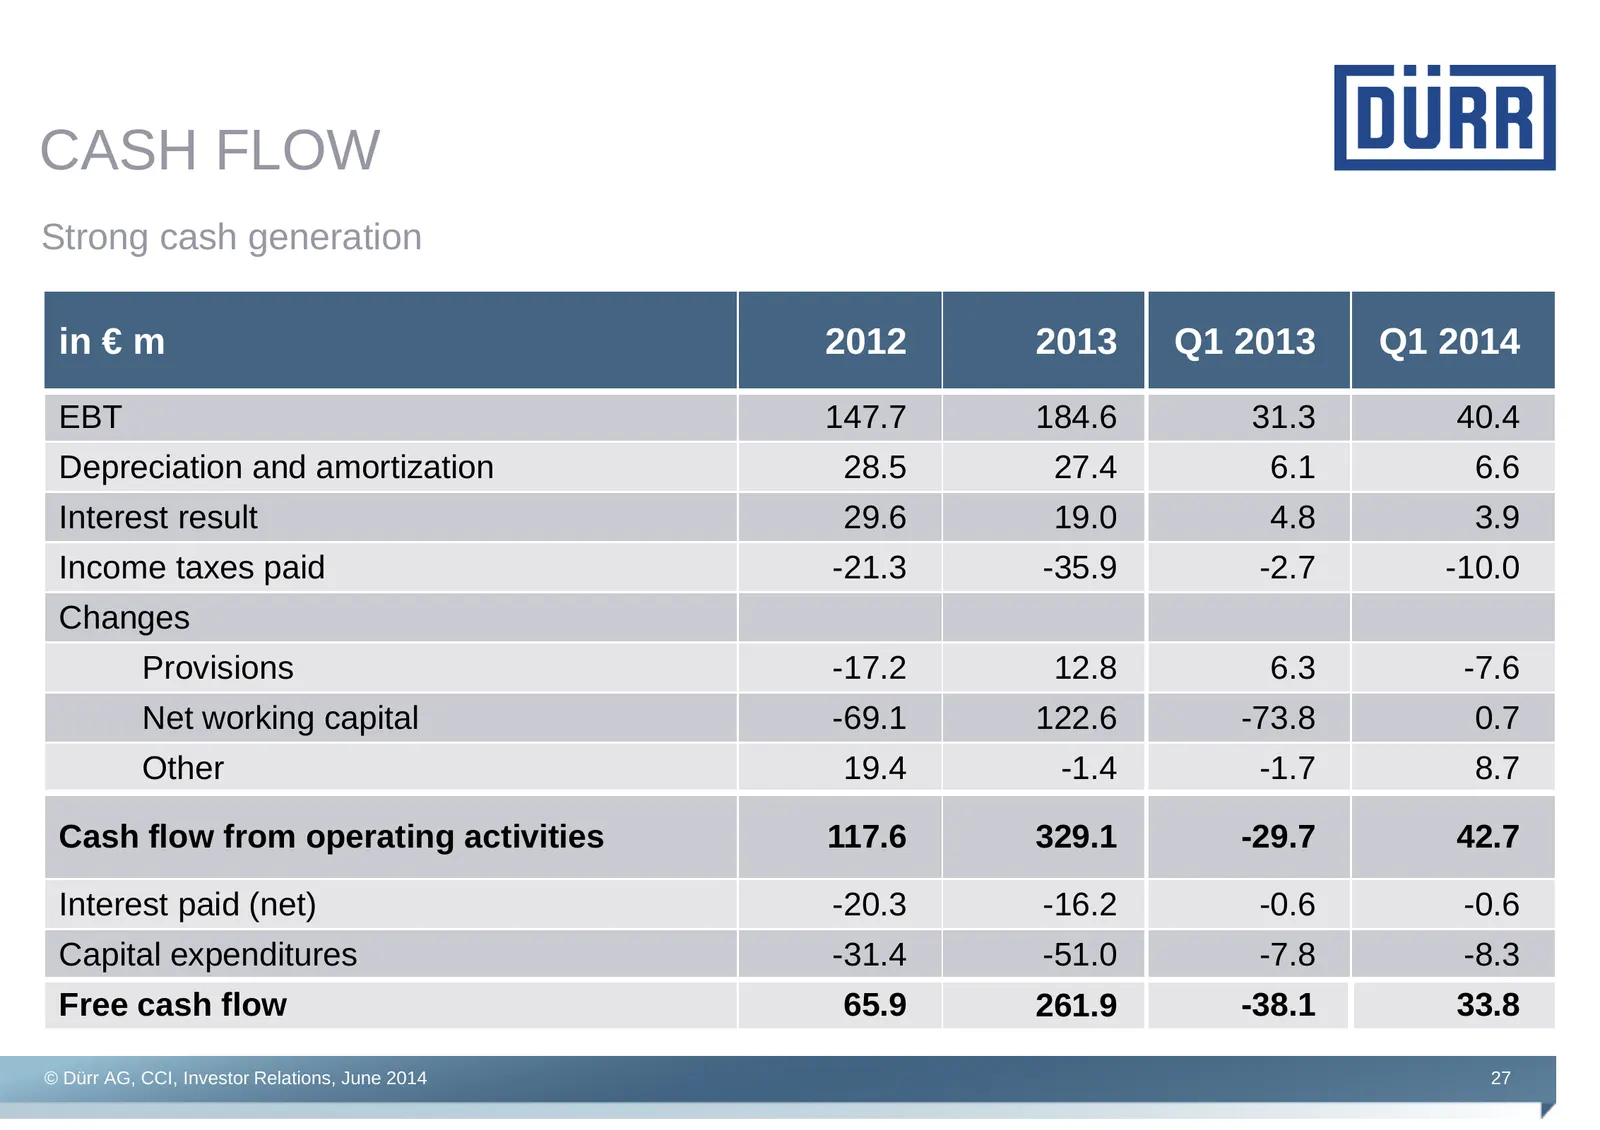
CASH FLOW Strong cash generation in € m 2012 2013 Q1 2013 Q1 2014 EBT 147.7 184.6 31.3 40.4 Depreciation and amortization 28.5 27.4 6.1 6.6 Interest result 29.6 19.0 4.8 3.9 Income taxes paid -21.3 -35.9 -2.7 -10.0 Changes Provisions -17.2 12.8 6.3 -7.6 Net working capital -69.1 122.6 -73.8 0.7 Othe
Slide 28: Solid financial structure
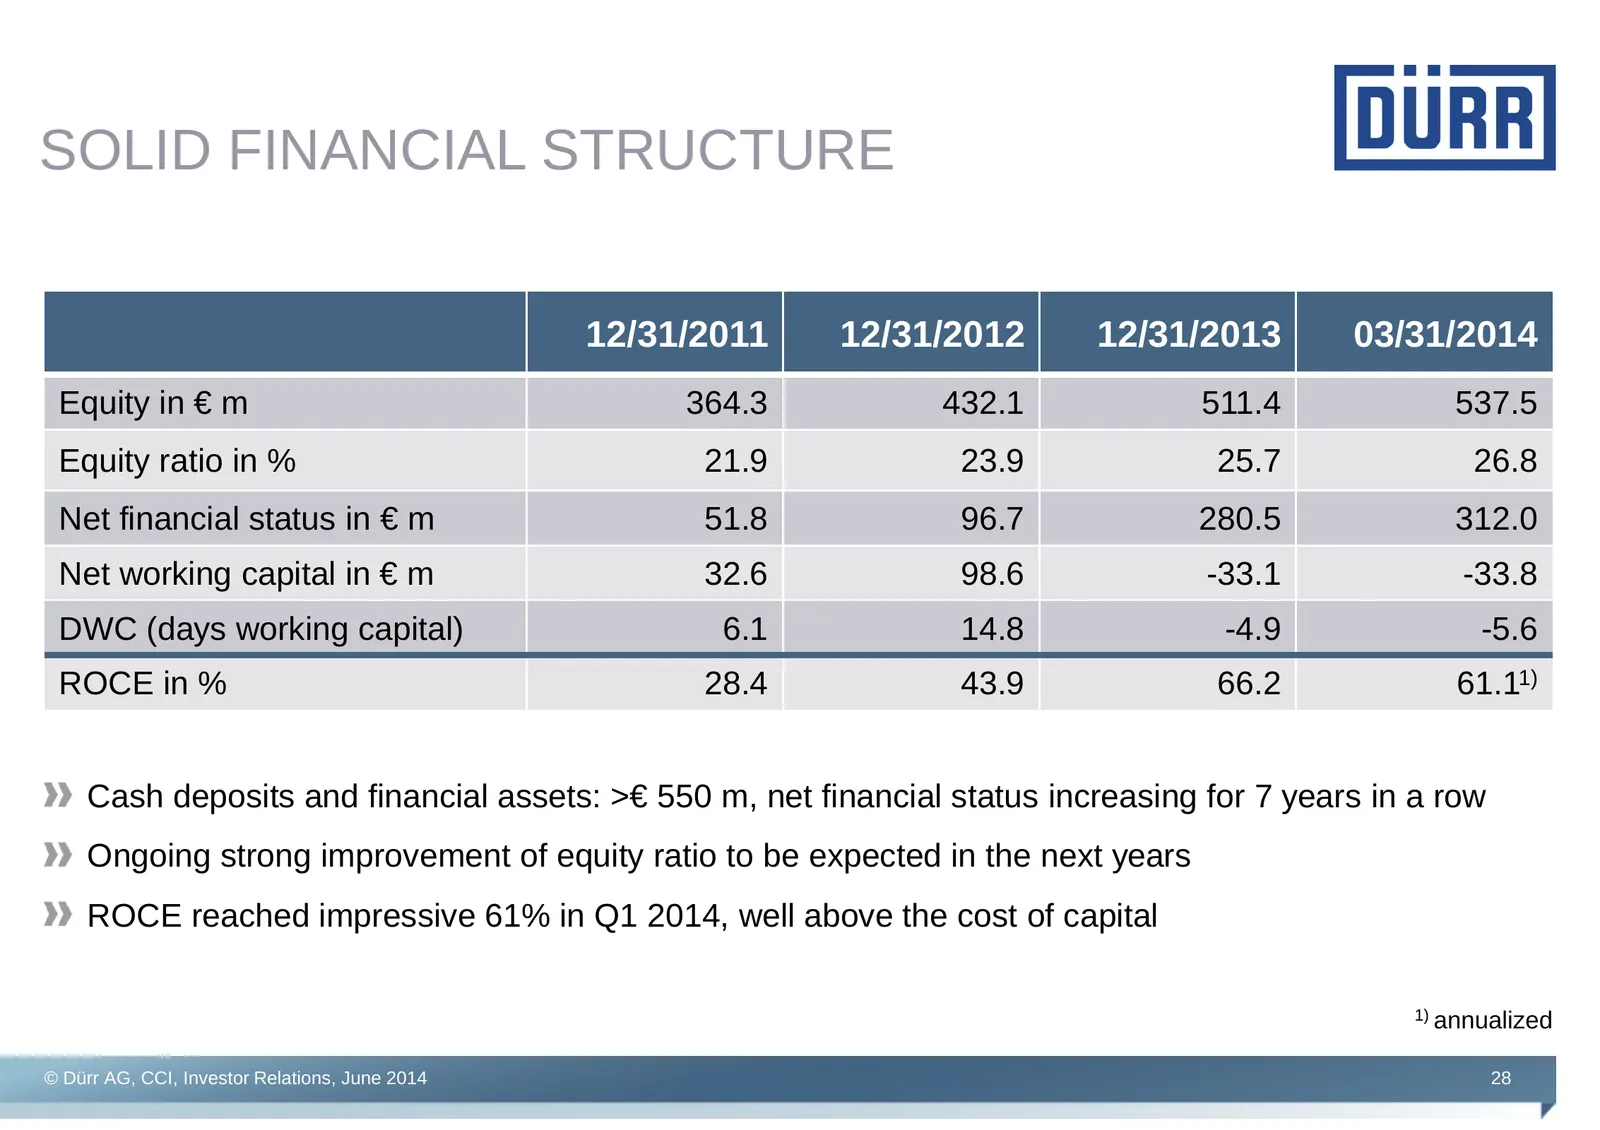
SOLID FINANCIAL STRUCTURE 12/31/2011 12/31/2012 12/31/2013 03/31/2014 Equity in € m 364.3 432.1 511.4 537.5 Equity ratio in % 21.9 23.9 25.7 26.8 Net financial status in € m 51.8 96.7 280.5 312.0 Net working capital in € m 32.6 98.6 -33.1 -33.8 DWC (days working capital) 6.1 14.8 -4.9 -5.6 ROCE in %
Slide 29: ROCE at record level
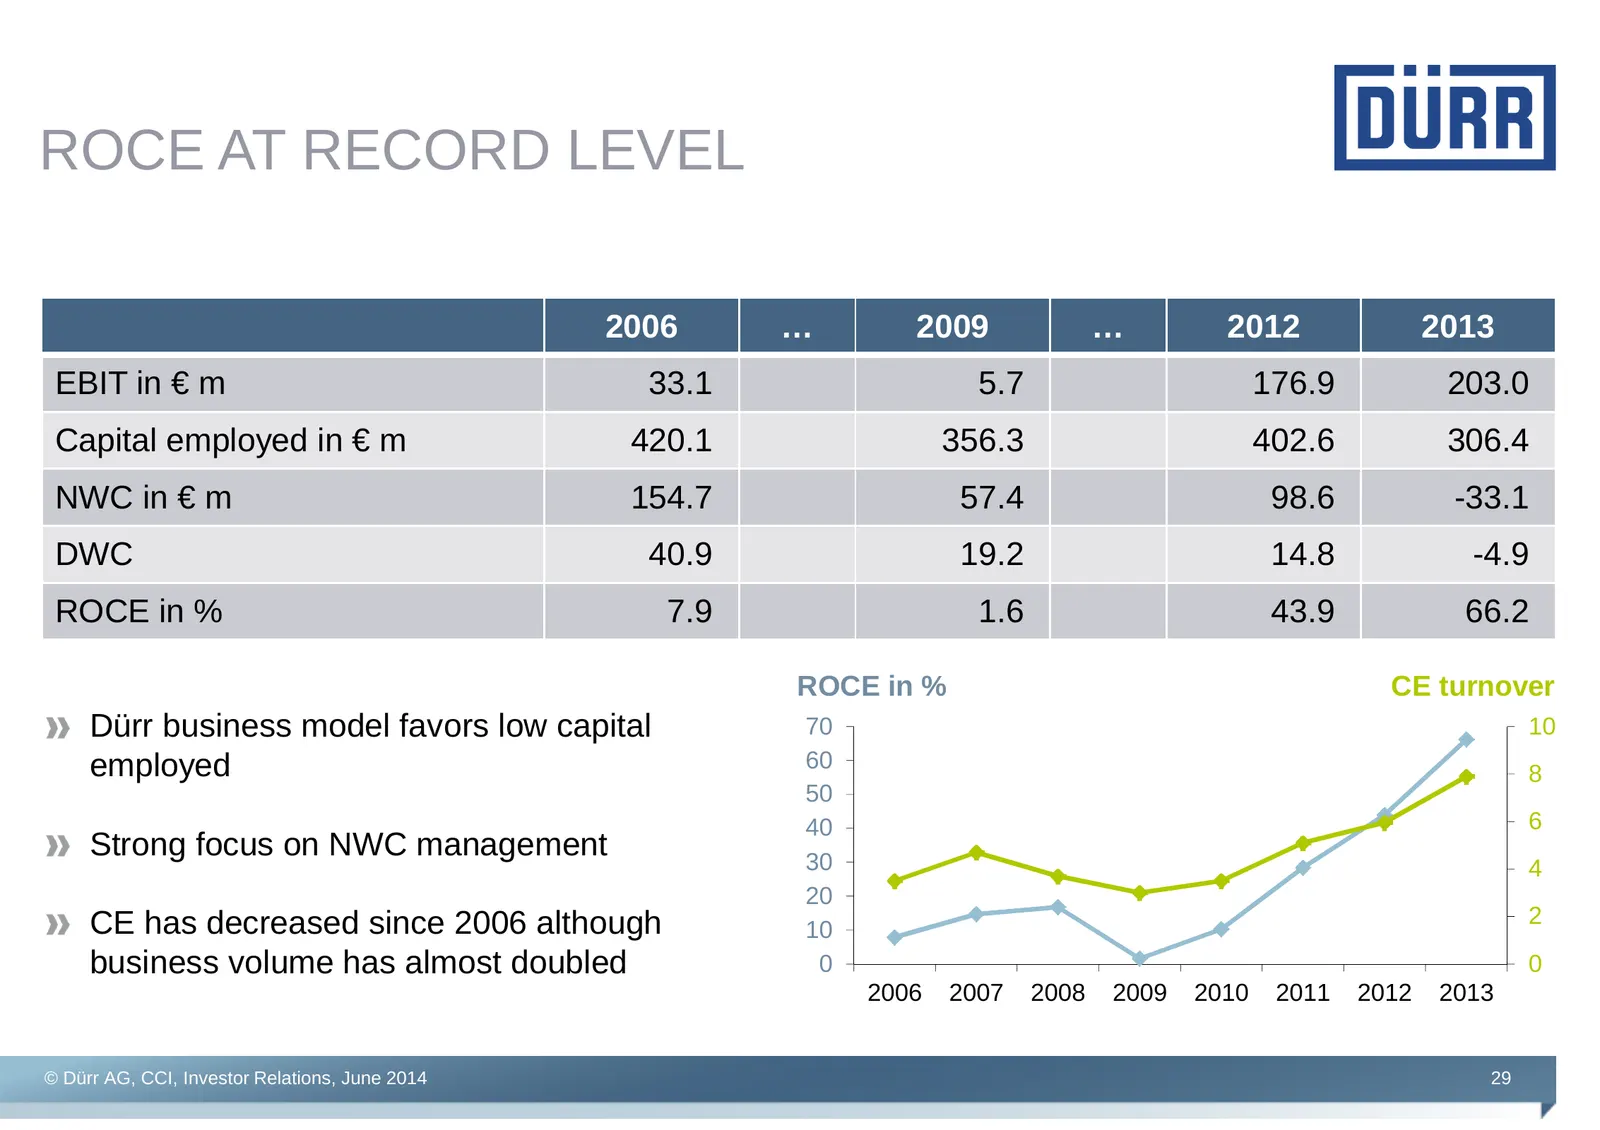
ROCE AT RECORD LEVEL 2006 … 2009 … 2012 2013 EBIT in € m 33.1 5.7 176.9 203.0 Capital employed in € m 420.1 356.3 402.6 306.4 NWC in € m 154.7 57.4 98.6 -33.1 DWC 40.9 19.2 14.8 -4.9 ROCE in % 7.9 1.6 43.9 66.2 ROCE in % CE turnover Dürr business model favors low capital 70 10 employed 60 8 50 40 6
Slide 30: Outlook
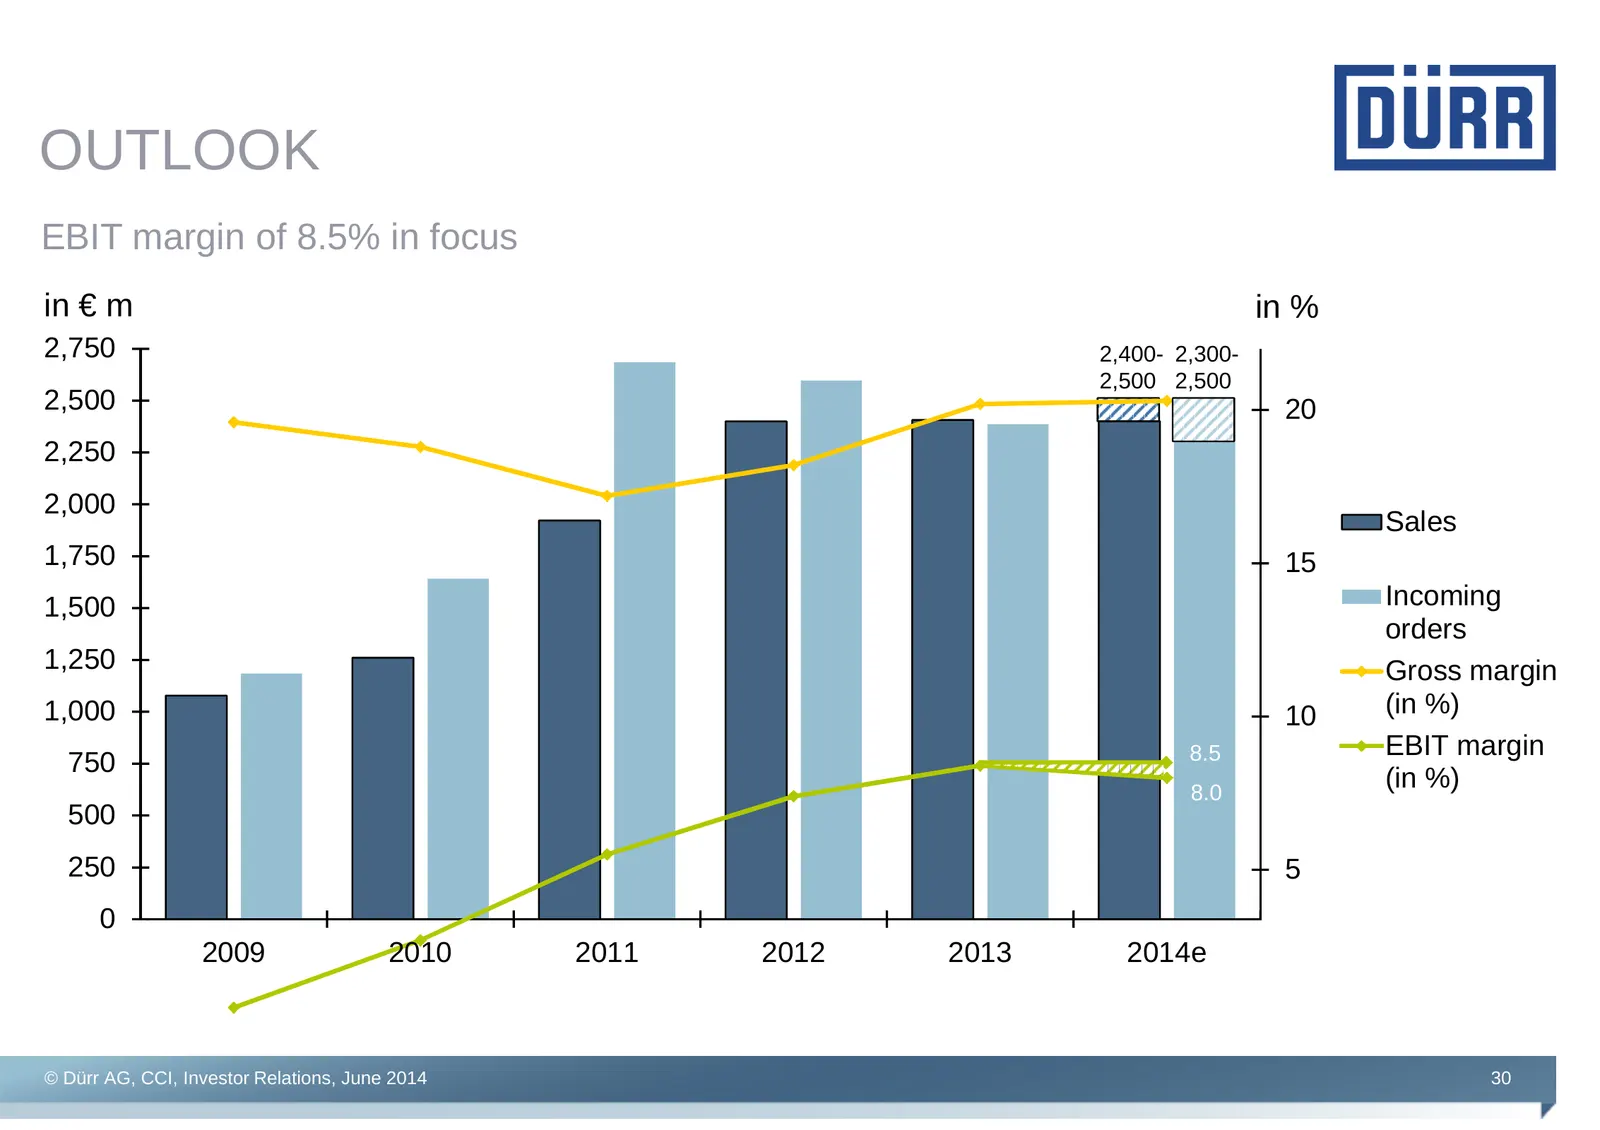
OUTLOOK EBIT margin of 8.5% in focus in € m in % 2,750 2,400- 2,300- 2,500 2,500 2,500 20 2,250 2,000 Sales 1,750 15 1,500 Incoming orders 1,250 Gross margin 1,000 10 (in %) 8.5 EBIT margin 750 8.0 (in %) 500 250 5 0 2009 2010 2011 2012 2013 2014e -250 -500 0 © Dürr AG, CCI, Investor Relations, June
Slide 31: Shareholder structure / dividend policy
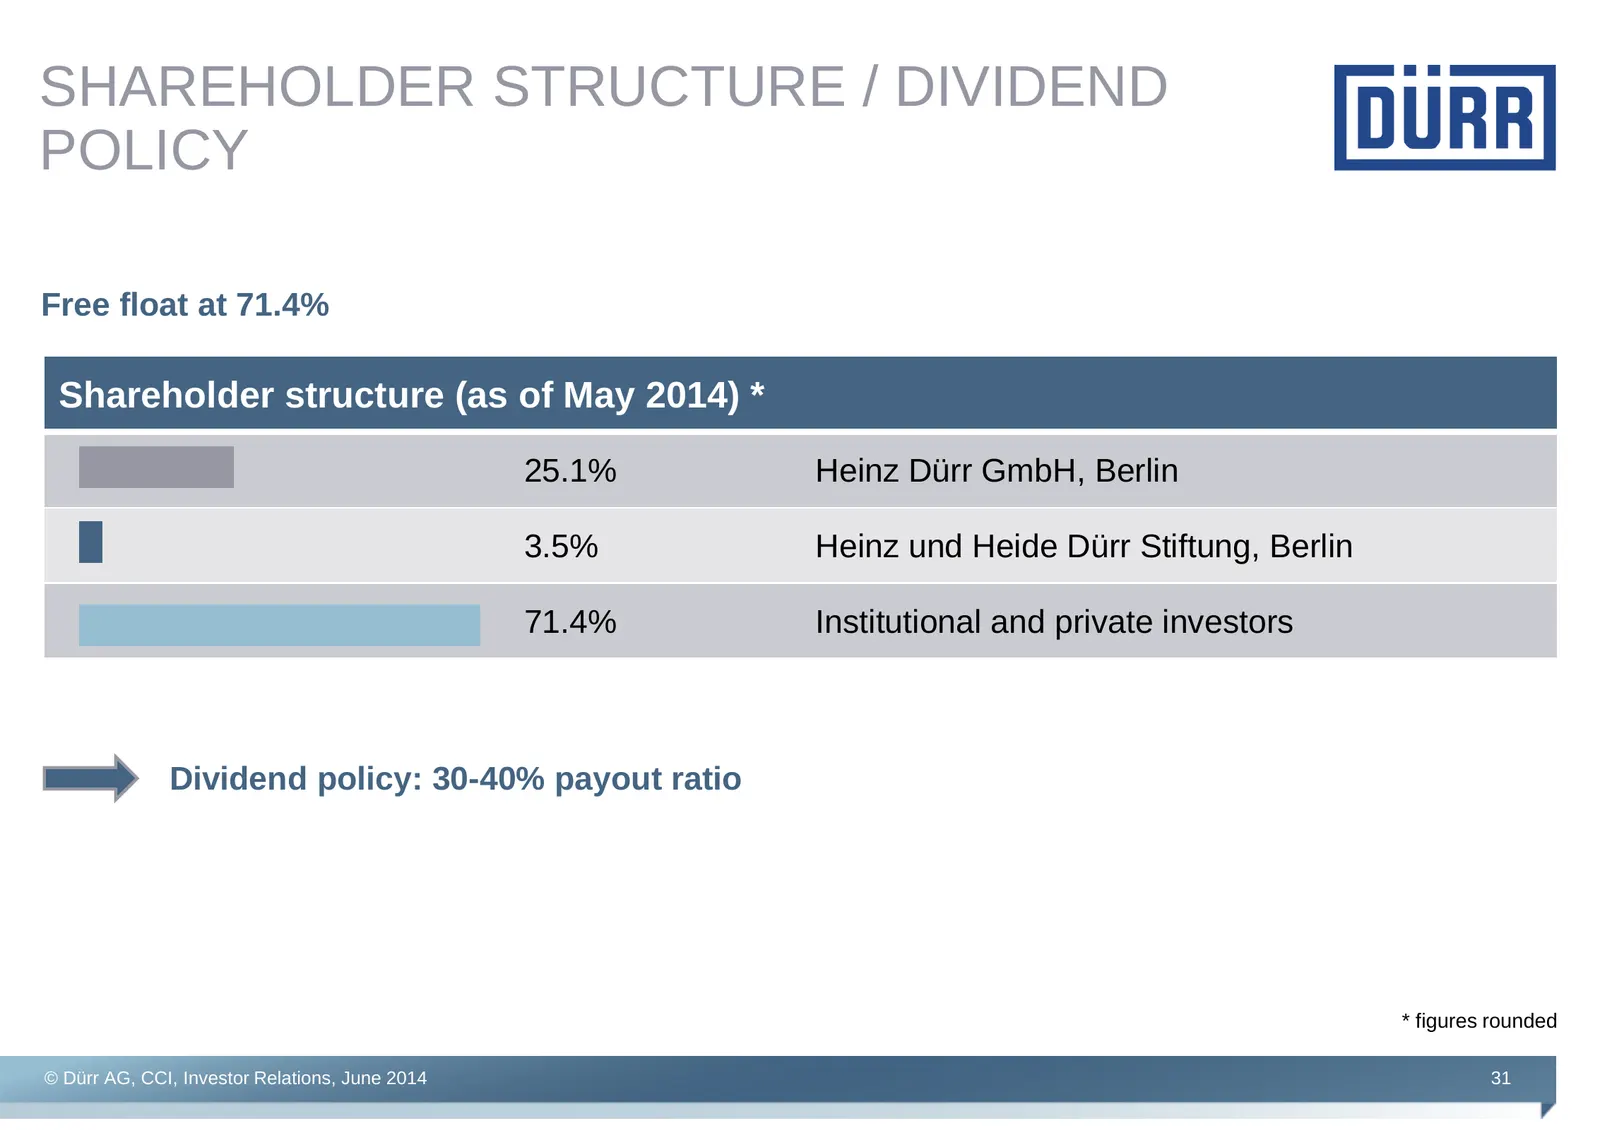
SHAREHOLDER STRUCTURE / DIVIDEND POLICY Free float at 71.4% Shareholder structure (as of May 2014) * 25.1% Heinz Dürr GmbH, Berlin 3.5% Heinz und Heide Dürr Stiftung, Berlin 71.4% Institutional and private investors Dividend policy: 30-40% payout ratio * figures rounded © Dürr AG, CCI, Investor Rela
Slide 32: Summary
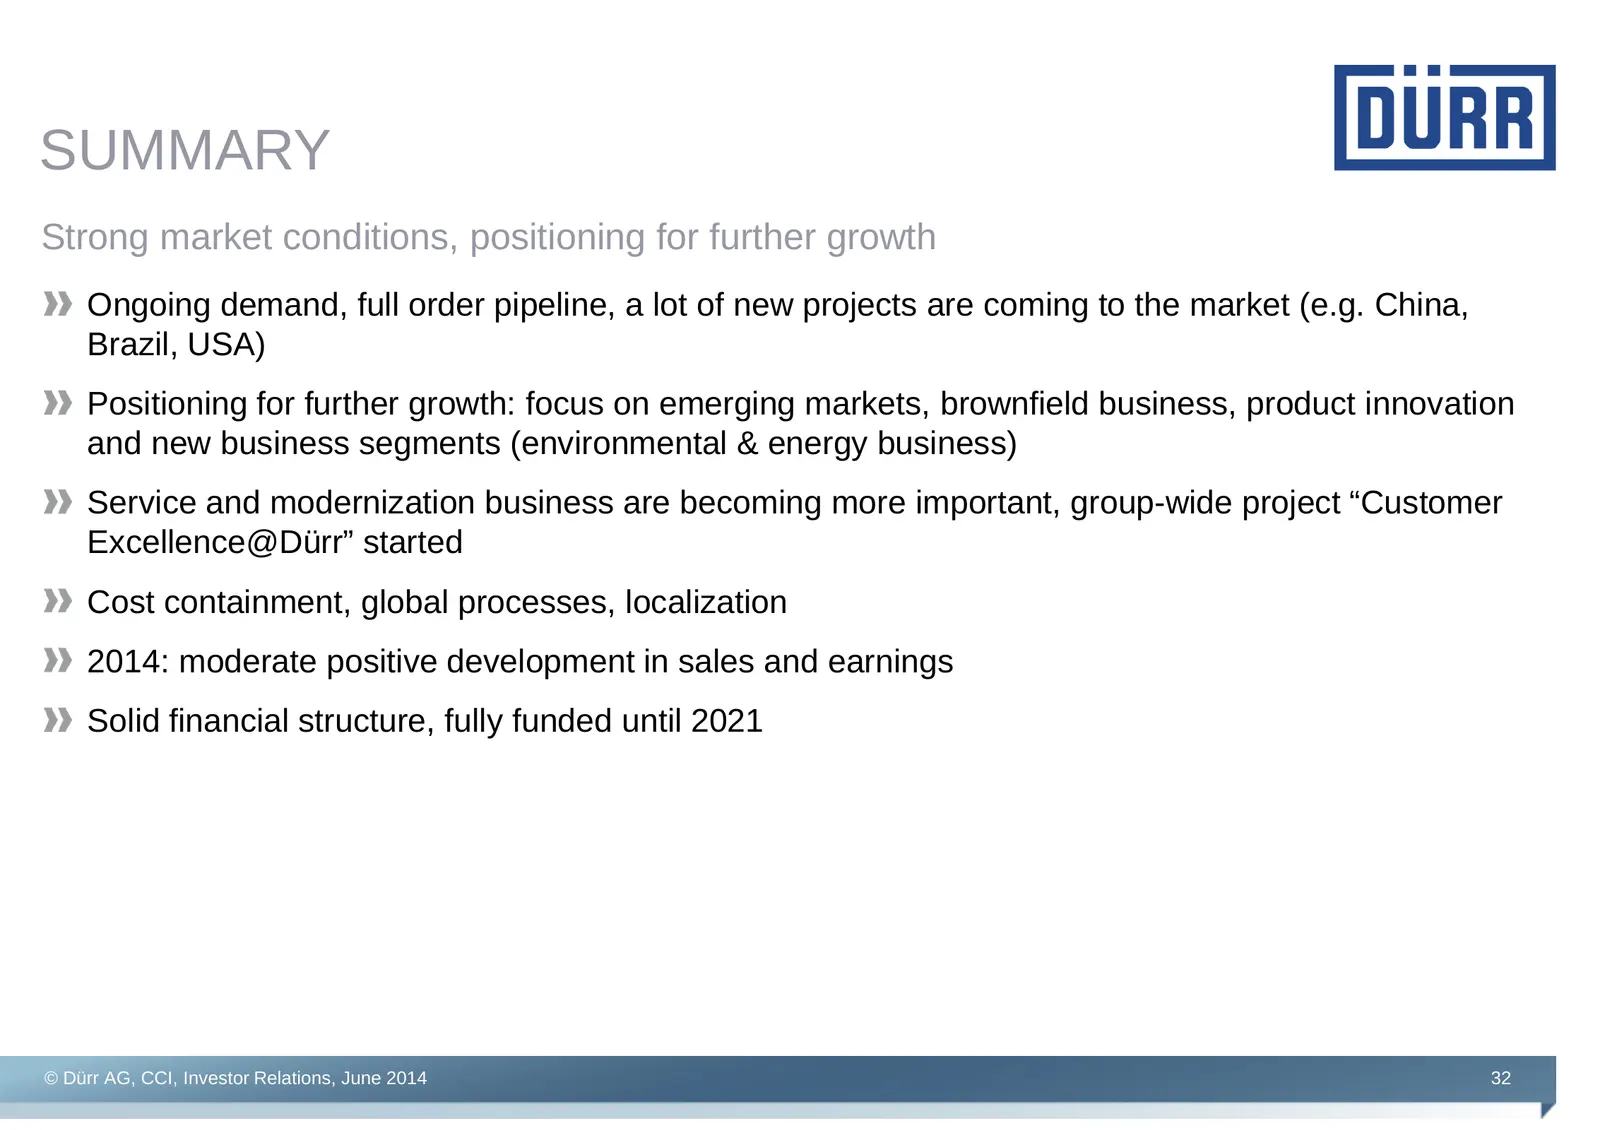
SUMMARY Strong market conditions, positioning for further growth Ongoing demand, full order pipeline, a lot of new projects are coming to the market (e.g. China, Brazil, USA) Positioning for further growth: focus on emerging markets, brownfield business, product innovation and new business segments
Slide 33: Financial calendar
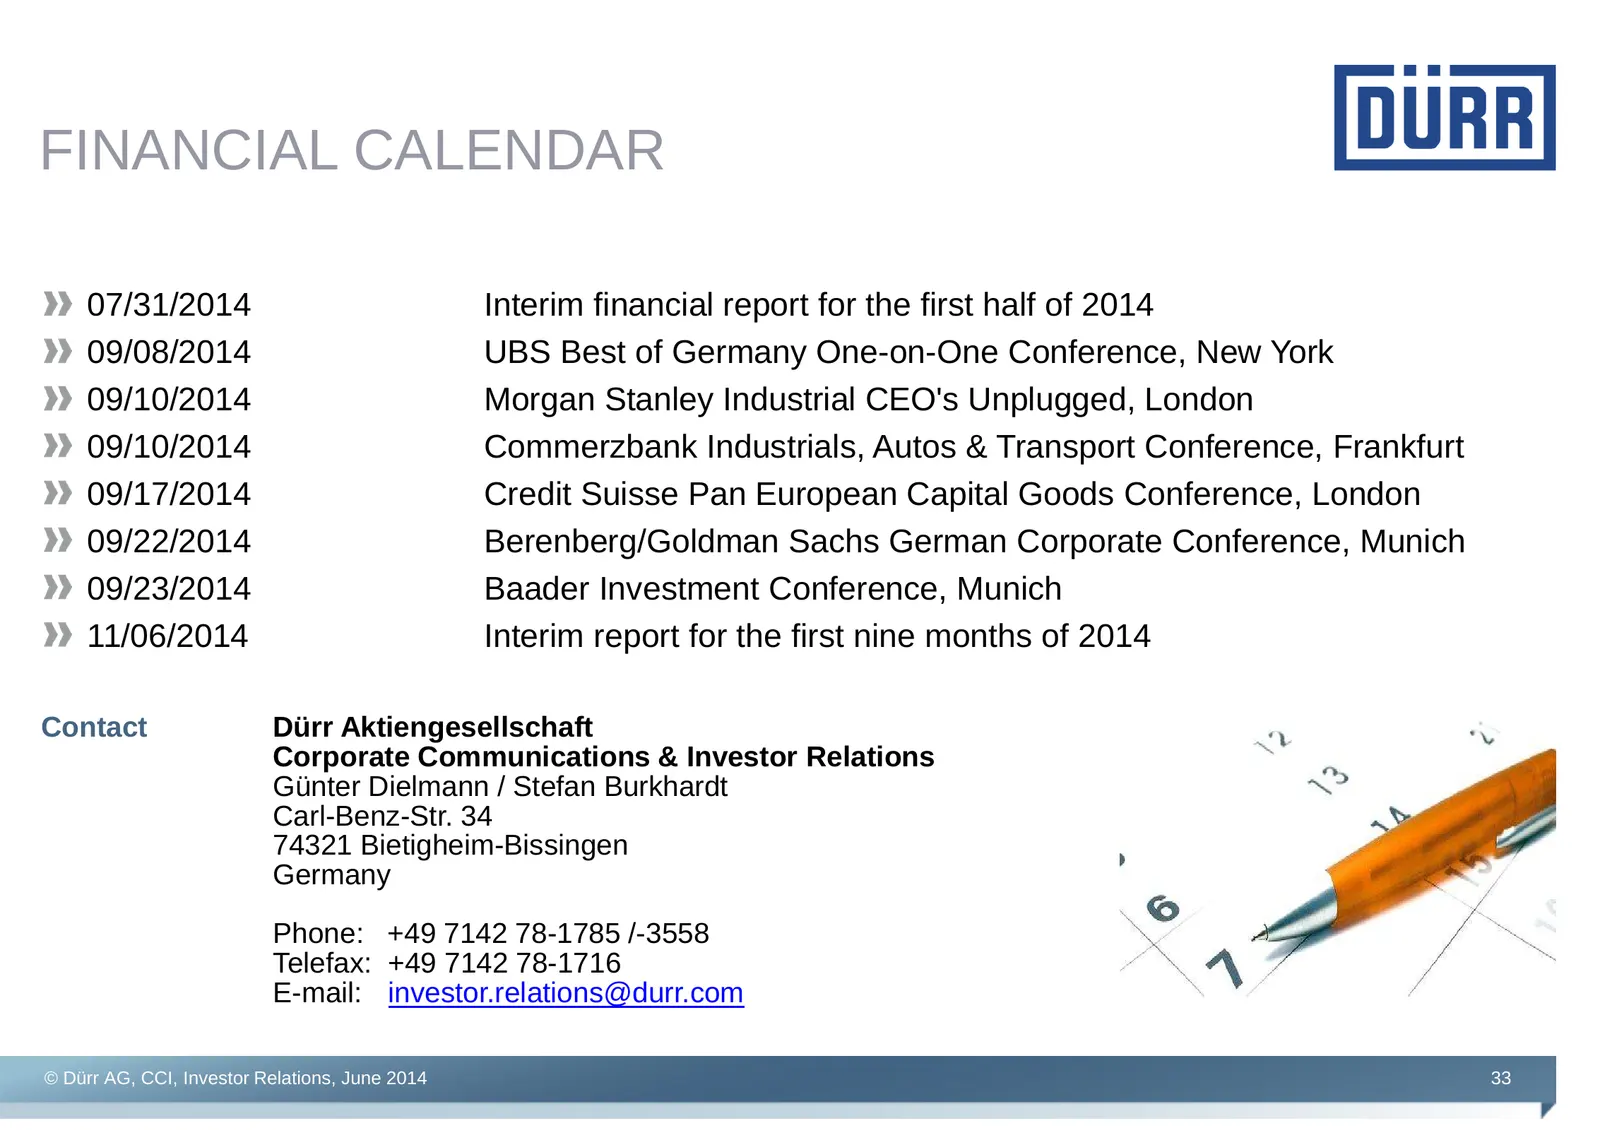
FINANCIAL CALENDAR 07/31/2014 Interim financial report for the first half of 2014 09/08/2014 UBS Best of Germany One-on-One Conference, New York 09/10/2014 Morgan Stanley Industrial CEO's Unplugged, London 09/10/2014 Commerzbank Industrials, Autos & Transport Conference, Frankfurt 09/17/2014 Credit
Slide 34: Appendix
Appendix © Dürr AG, CCI, Investor Relations, June 2014 34
Slide 35: Business units: market shares
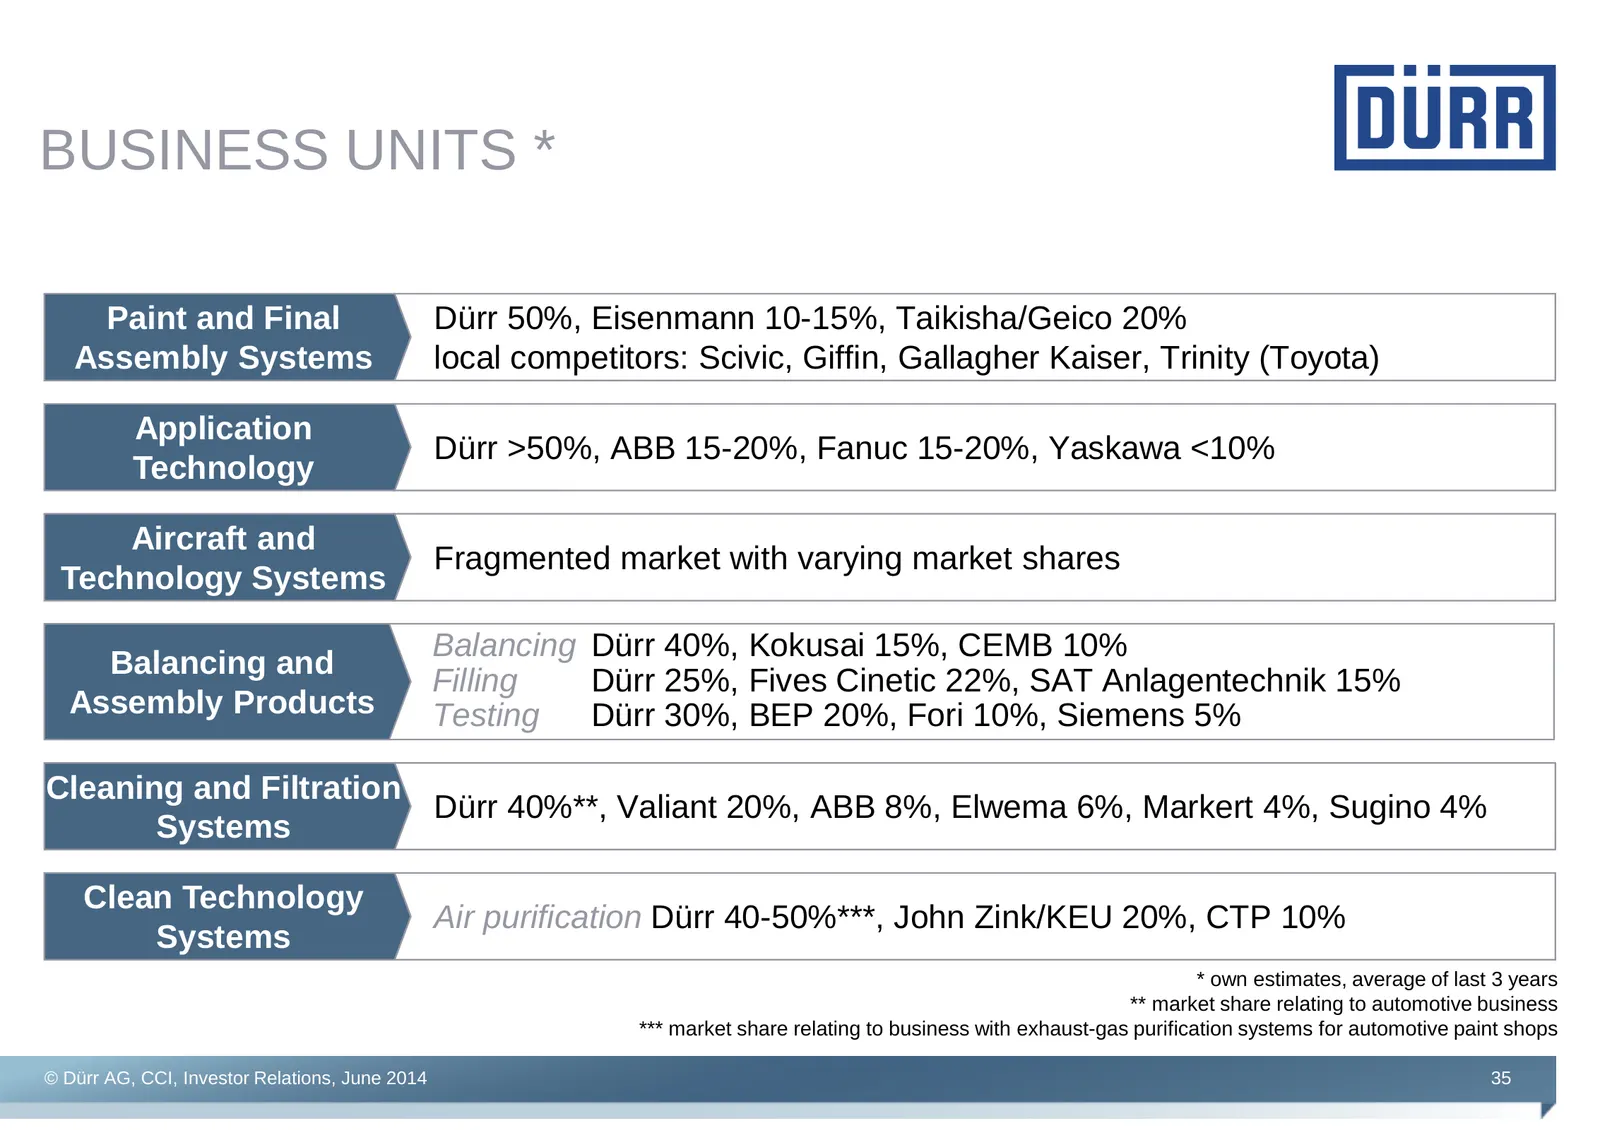
BUSINESS UNITS * Paint and Final Dürr 50%, Eisenmann 10-15%, Taikisha/Geico 20% Assembly Systems local competitors: Scivic, Giffin, Gallagher Kaiser, Trinity (Toyota) Application Dürr >50%, ABB 15-20%, Fanuc 15-20%, Yaskawa <10% Technology Aircraft and Fragmented market with varying market shares Te
Slide 36: Sales development passenger cars January-April 2014/13
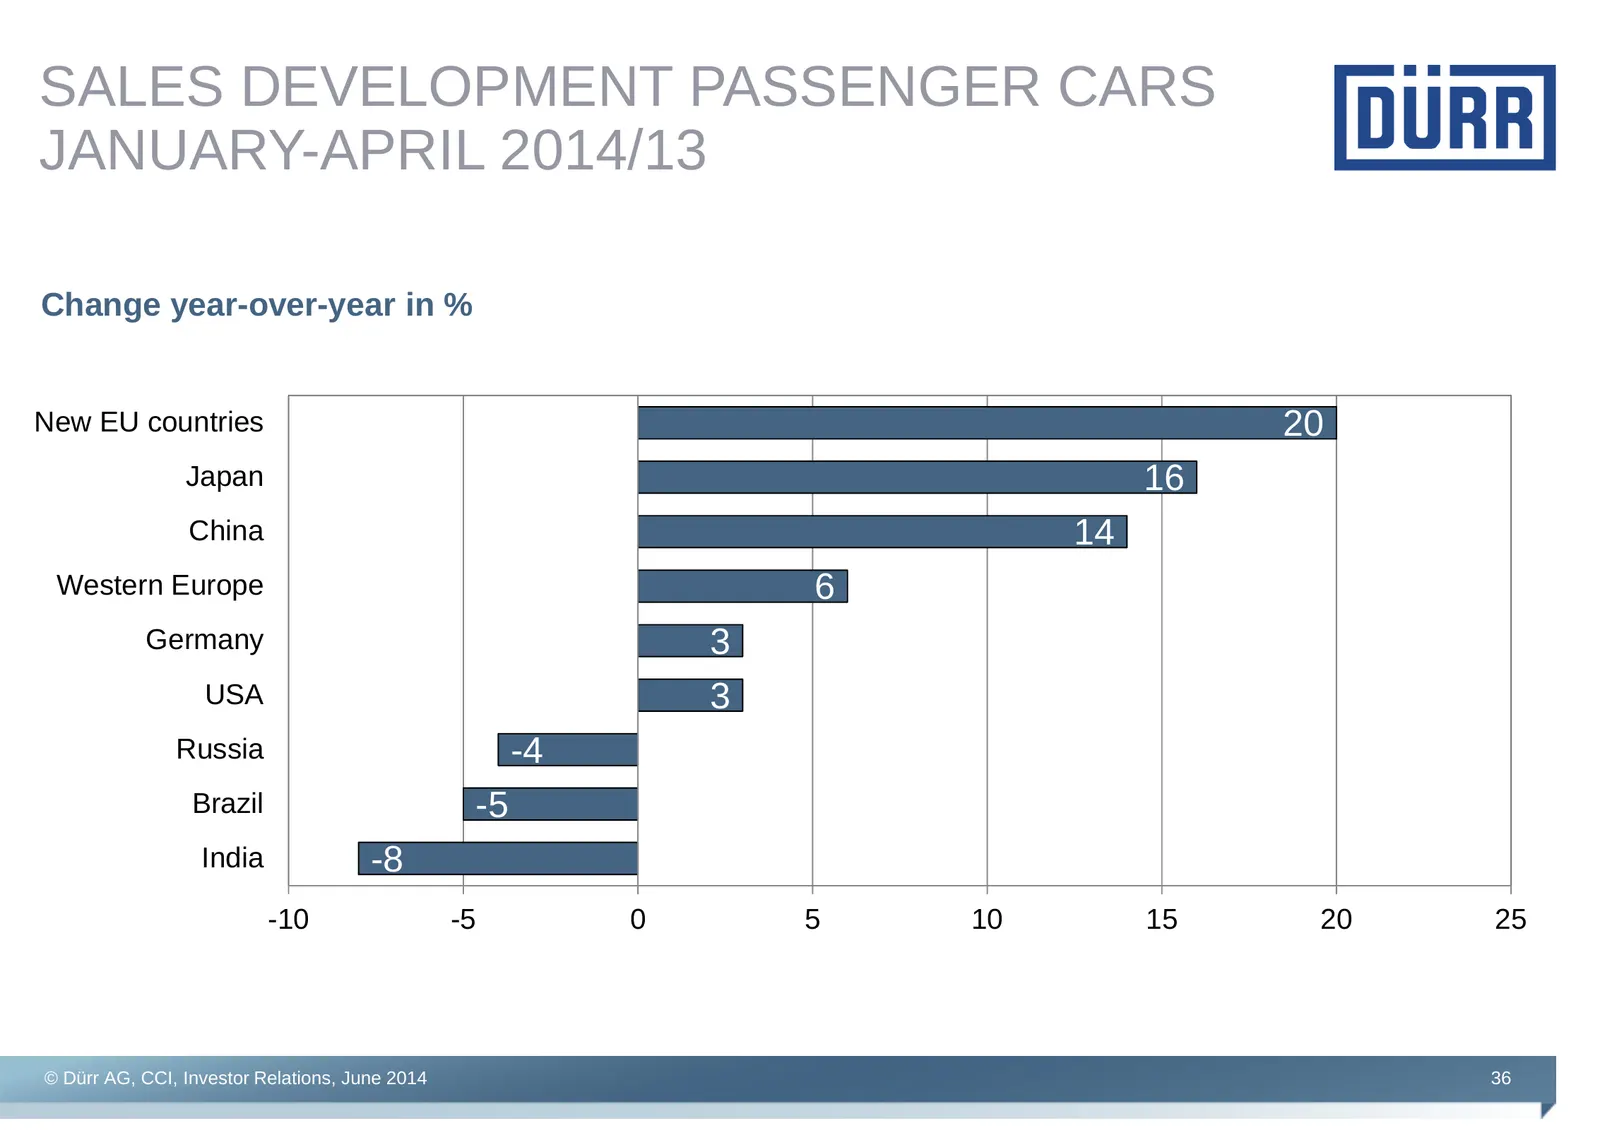
SALES DEVELOPMENT PASSENGER CARS JANUARY-APRIL 2014/13 Change year-over-year in % New EU countries 20 Japan 16 China 14 Western Europe 6 Germany 3 USA 3 Russia -4 Brazil -5 India -8 -10 -5 0 5 10 15 20 25 © Dürr AG, CCI, Investor Relations, June 2014 36
Source: Internet Archive copy of durr.com
More decks from Durr AG
 Q3 2026 Earnings Presentation33 slides · Nov 12, 2026
 Q2 2026 Earnings Presentation39 slides · Aug 6, 2026
 Q1 2026 Earnings Presentation35 slides · May 12, 2026
 Fact Sheet (2025)2 slides · Dec 2, 2025
 Q3 2025 Earnings Presentation46 slides · Nov 13, 2025
 Q2 2025 Earnings Presentation31 slides · Jul 24, 2025