Ipsen SA · EURONEXT:IPN
Ipsen SA — FY2020 Earnings Presentation
26 slides from Ipsen SA's earnings presentation, Feb 11, 2021
Slide 1: FY 2020 Results
on FB: a“ a G4. Pal » . e- & cm —_ _ i, % 4 an - es , ” tm Weal PS tal >: ~ a _ , Pw ay a a. : > ; i SIPSEN FY 2020 Results Innovation for patient care February 11, 2021
Slide 2: Disclaimer & Safe Harbor
Disclaimer & Safe Harbor This presentation includes only summary information and does not purport to be comprehensive. Forward-looking statements, targets and estimates contained herein are for illustrative purposes only and are based on management's current views and assumptions. Such statements in
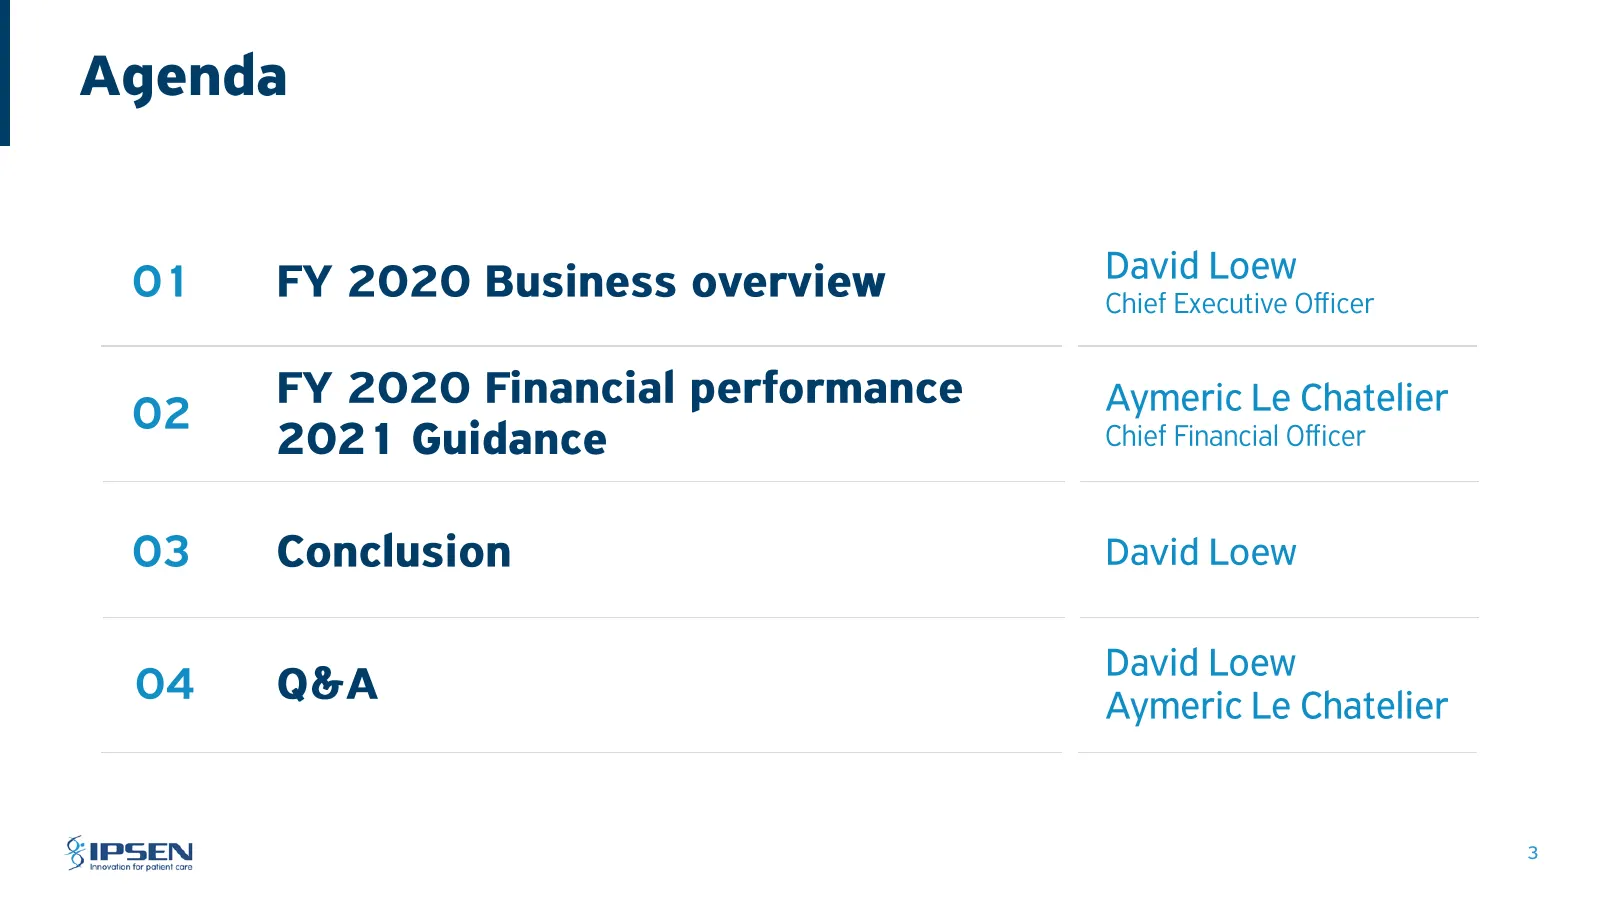
Slide 3: Agenda
Agenda O01 02 03 FY 2020 Business overview FY 2020 Financial performance 2021 Guidance Conclusion Q&A David Loew Chief Executive Officer Aymeric Le Chatelier Chief Financial Officer David Loew David Loew Aymeric Le Chatelier

Slide 4: 01 FY 2020 Business overview

Slide 5: Our Vision
Our Vision To be a leading global mid-size biopharmaceutical company with a focus on transformative medicines in oncology, rare disease & neuroscience
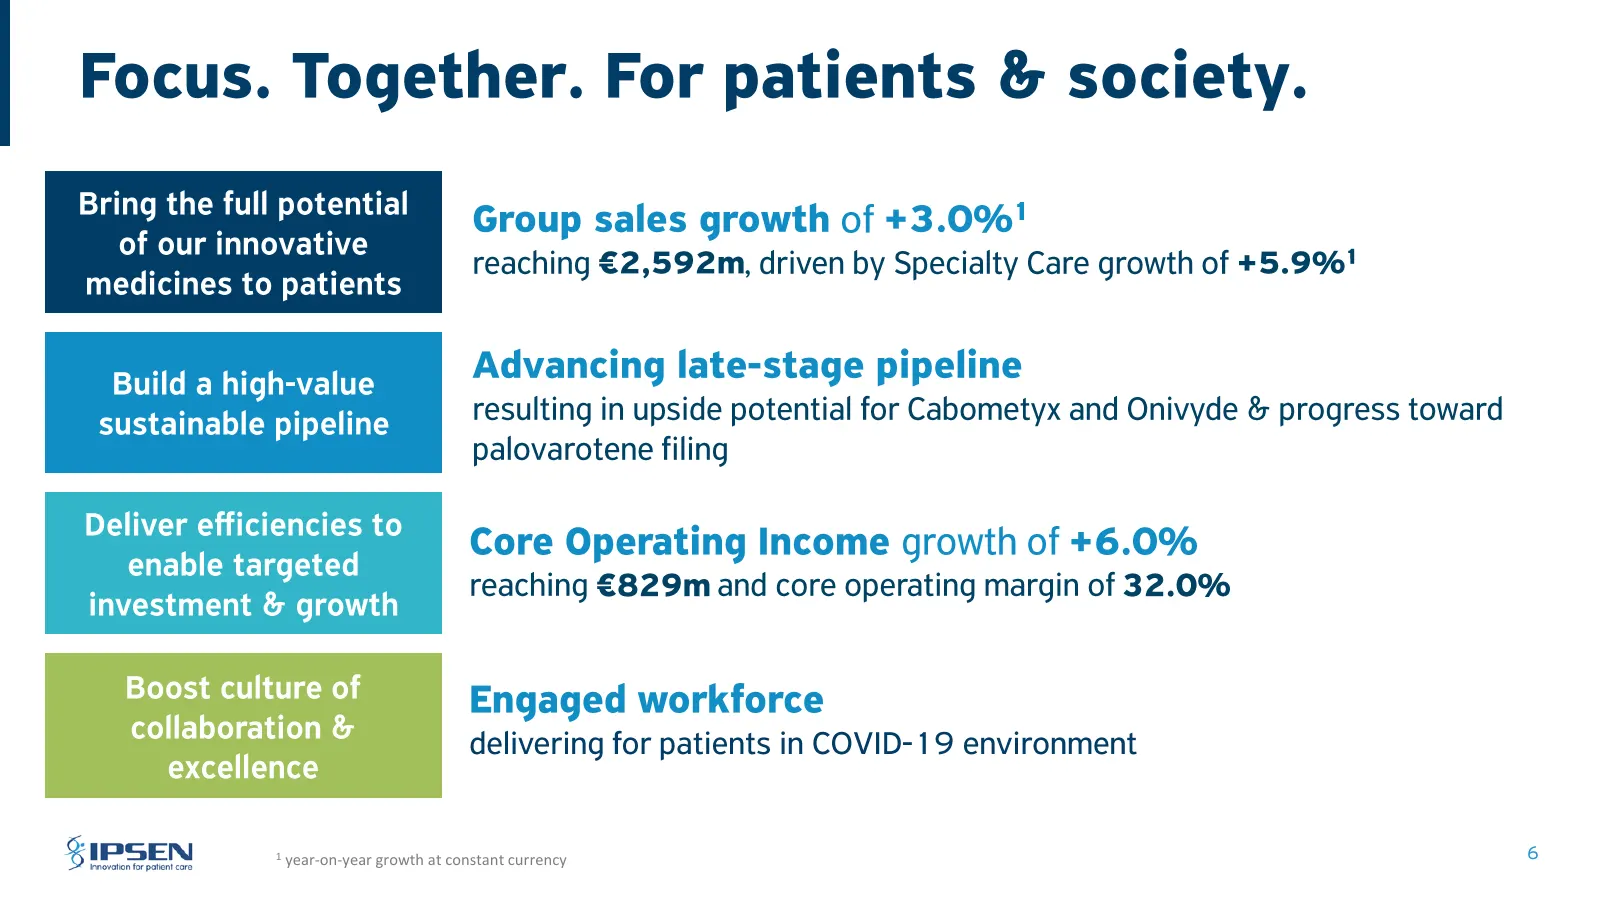
Slide 6: Year-on-year growth at constant currency
1 year-on-year growth at constant currency
Slide 7: Sales €m
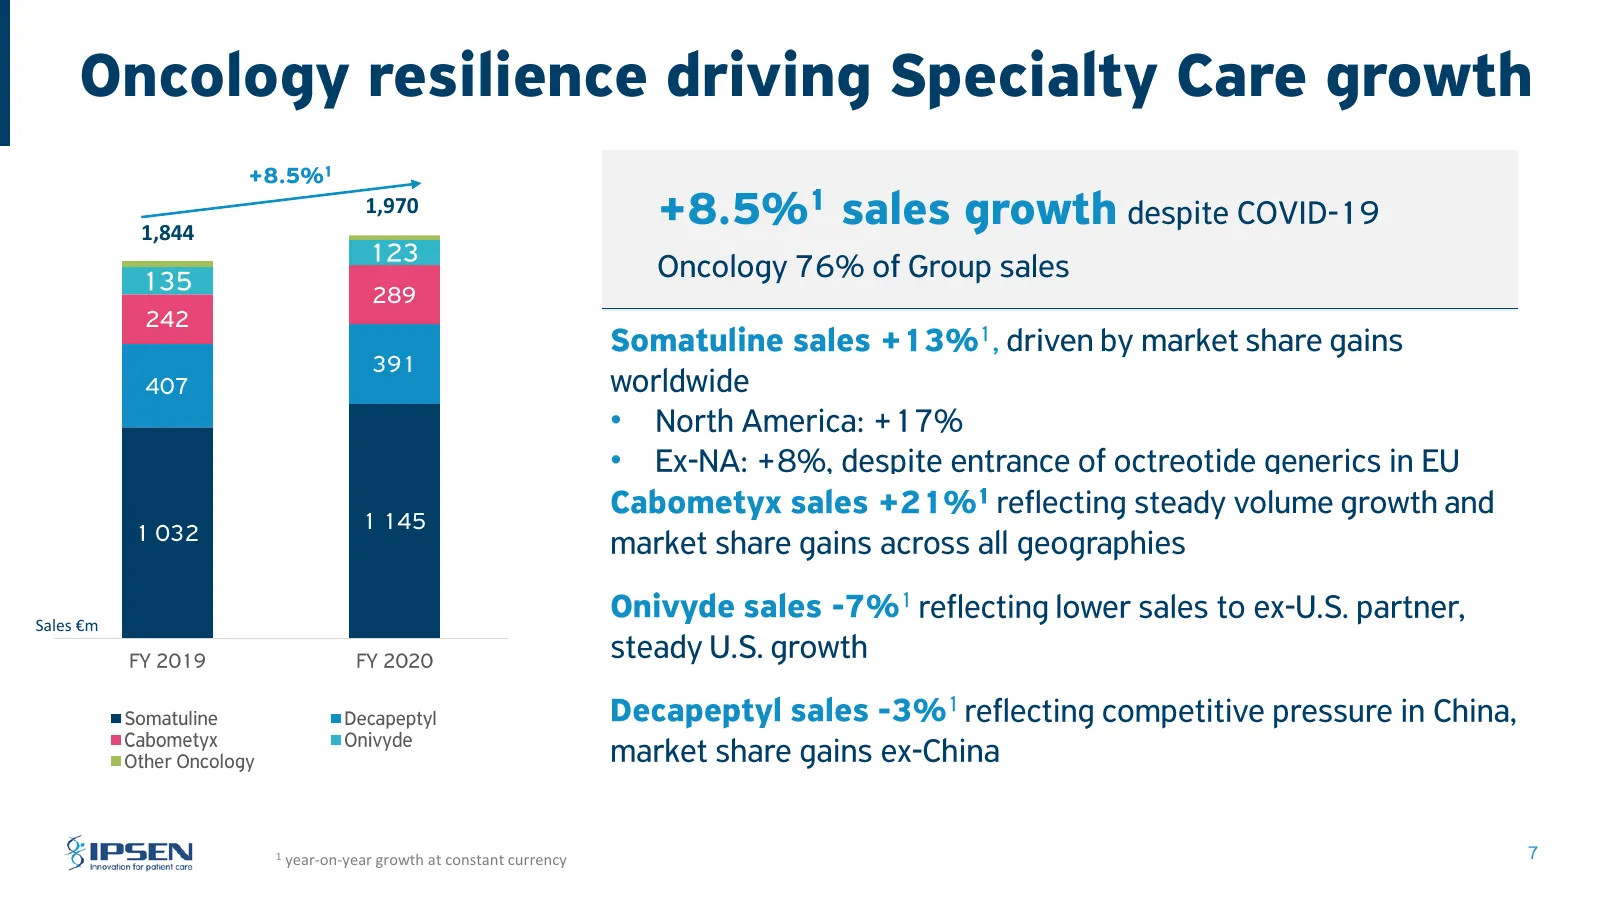
1,970 1,844 • • Sales €m 1 year-on-year growth at constant currency
Slide 8: Sales €m FY 2019 FY 2020
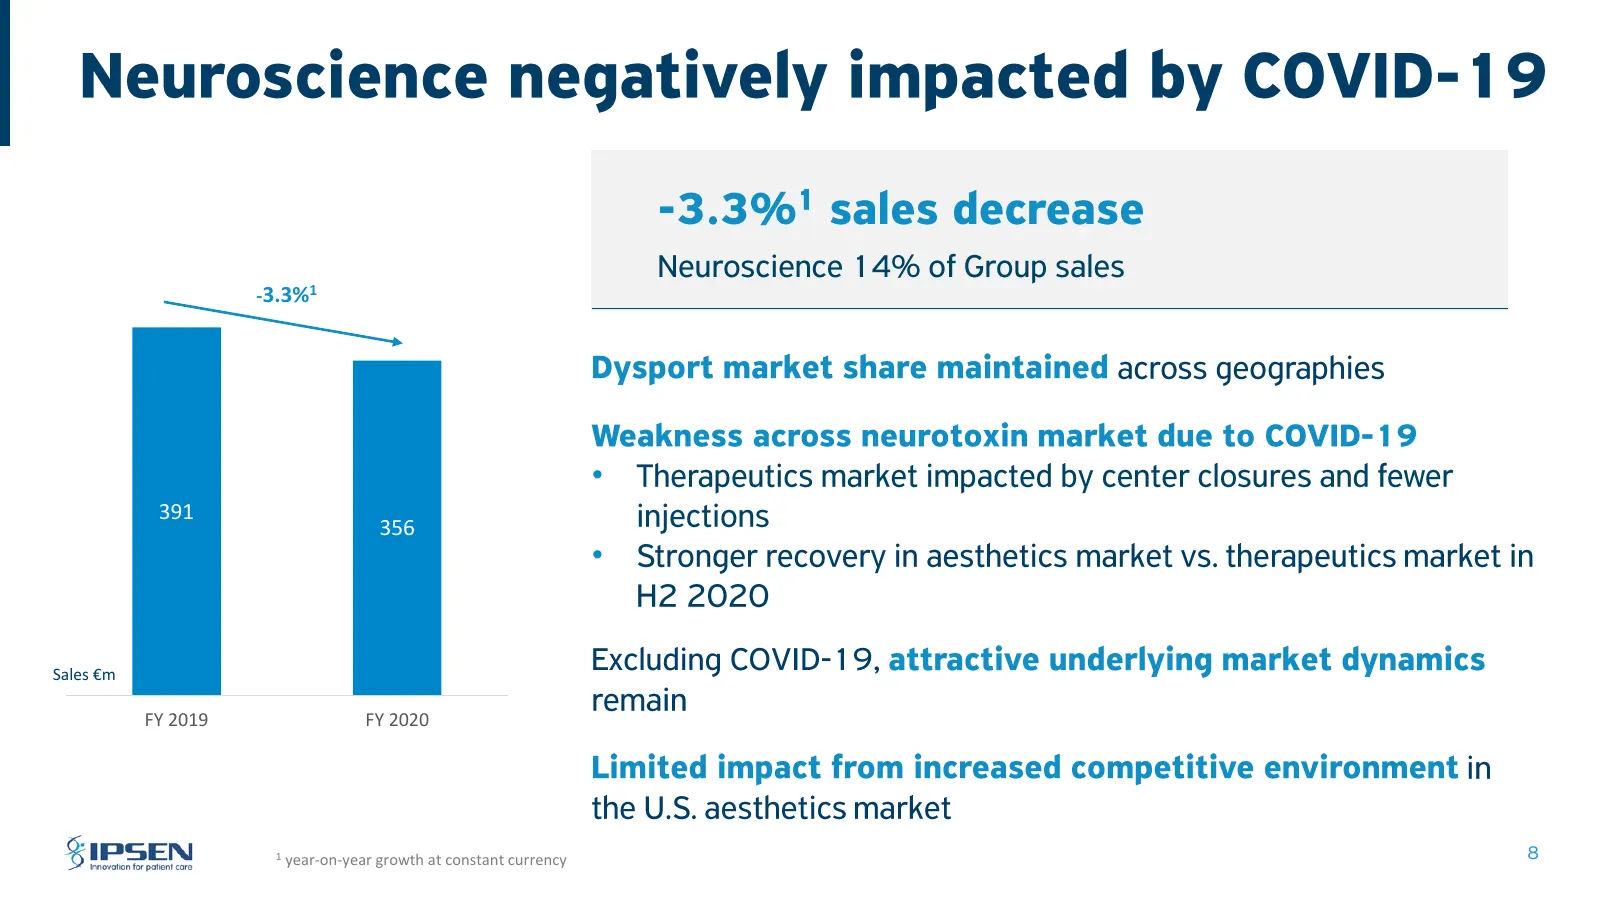
-3.3%1 • 391 356 • Sales €m FY 2019 FY 2020 1 year-on-year growth at constant currency
Slide 9: Palovarotene Phase II and III update
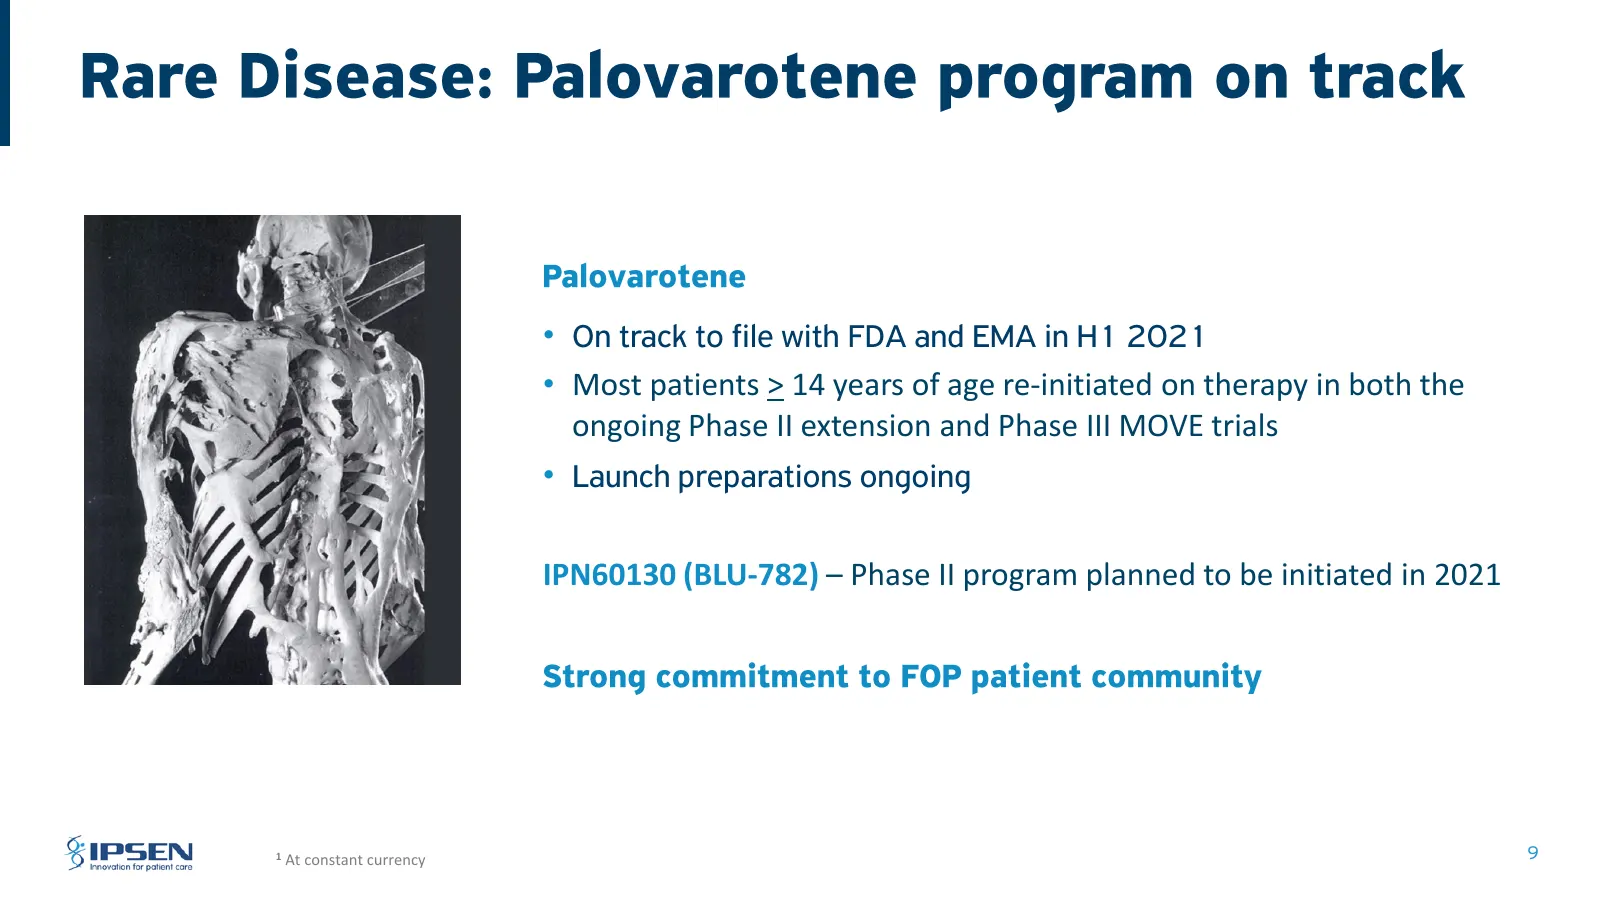
• • Most patients > 14 years of age re-initiated on therapy in both the ongoing Phase II extension and Phase III MOVE trials • IPN60130 (BLU-782) – Phase II program planned to be initiated in 2021 1 At constant currency
Slide 10: Consumer Healthcare sales by brand
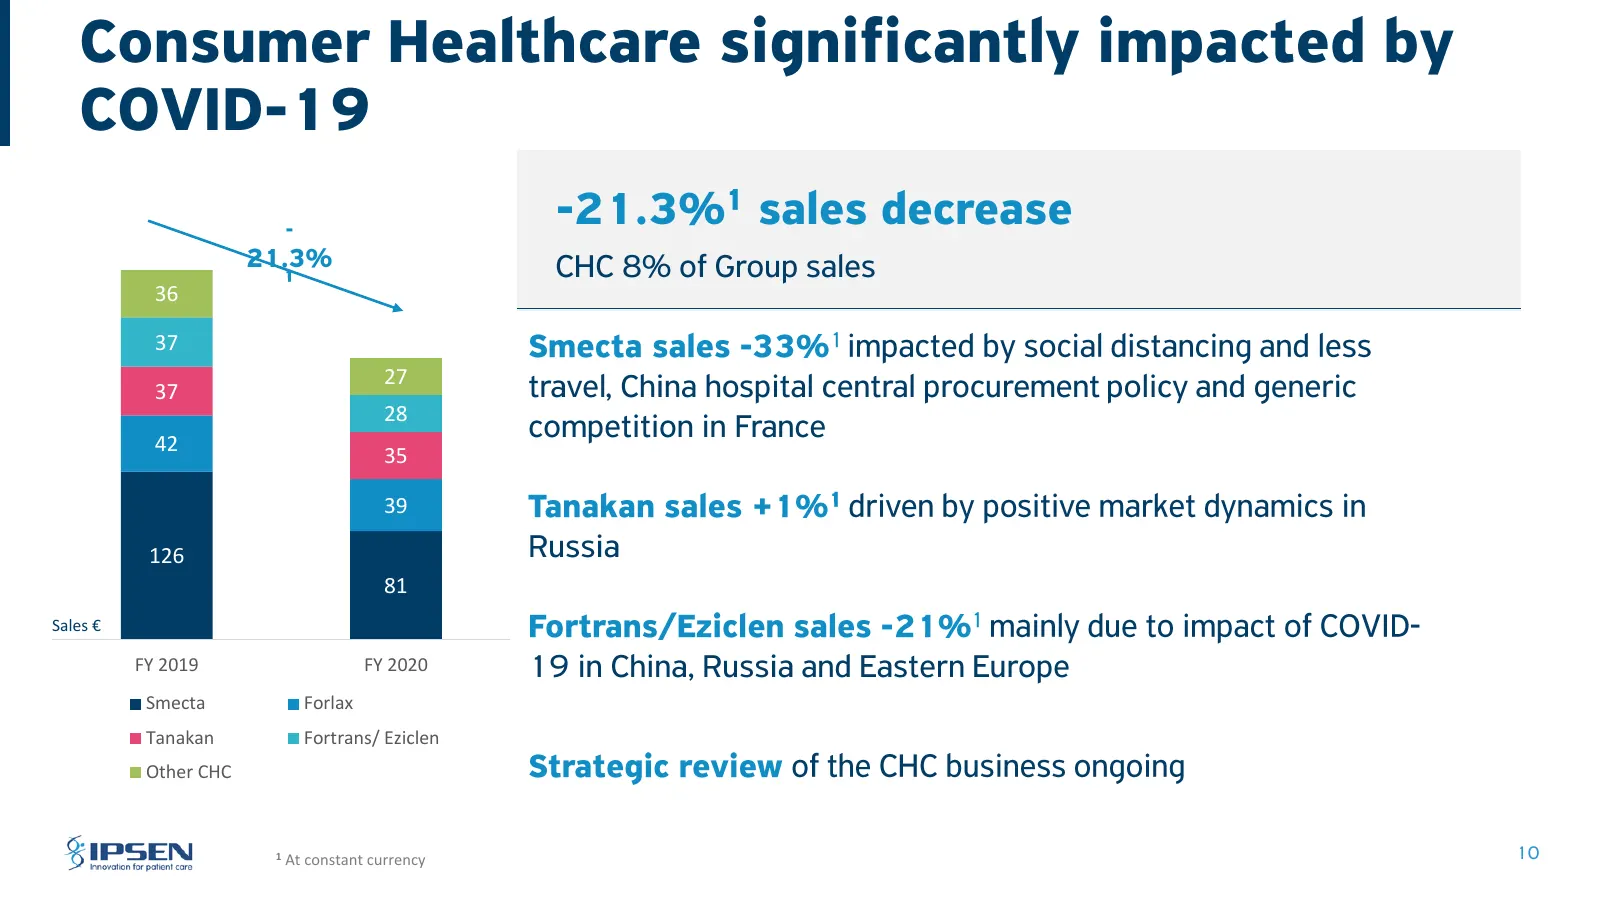
36 37 27 37 28 42 35 39 126 81 Sales € FY 2019 FY 2020 Smecta Forlax Tanakan Fortrans/ Eziclen Other CHC 1 At constant currency
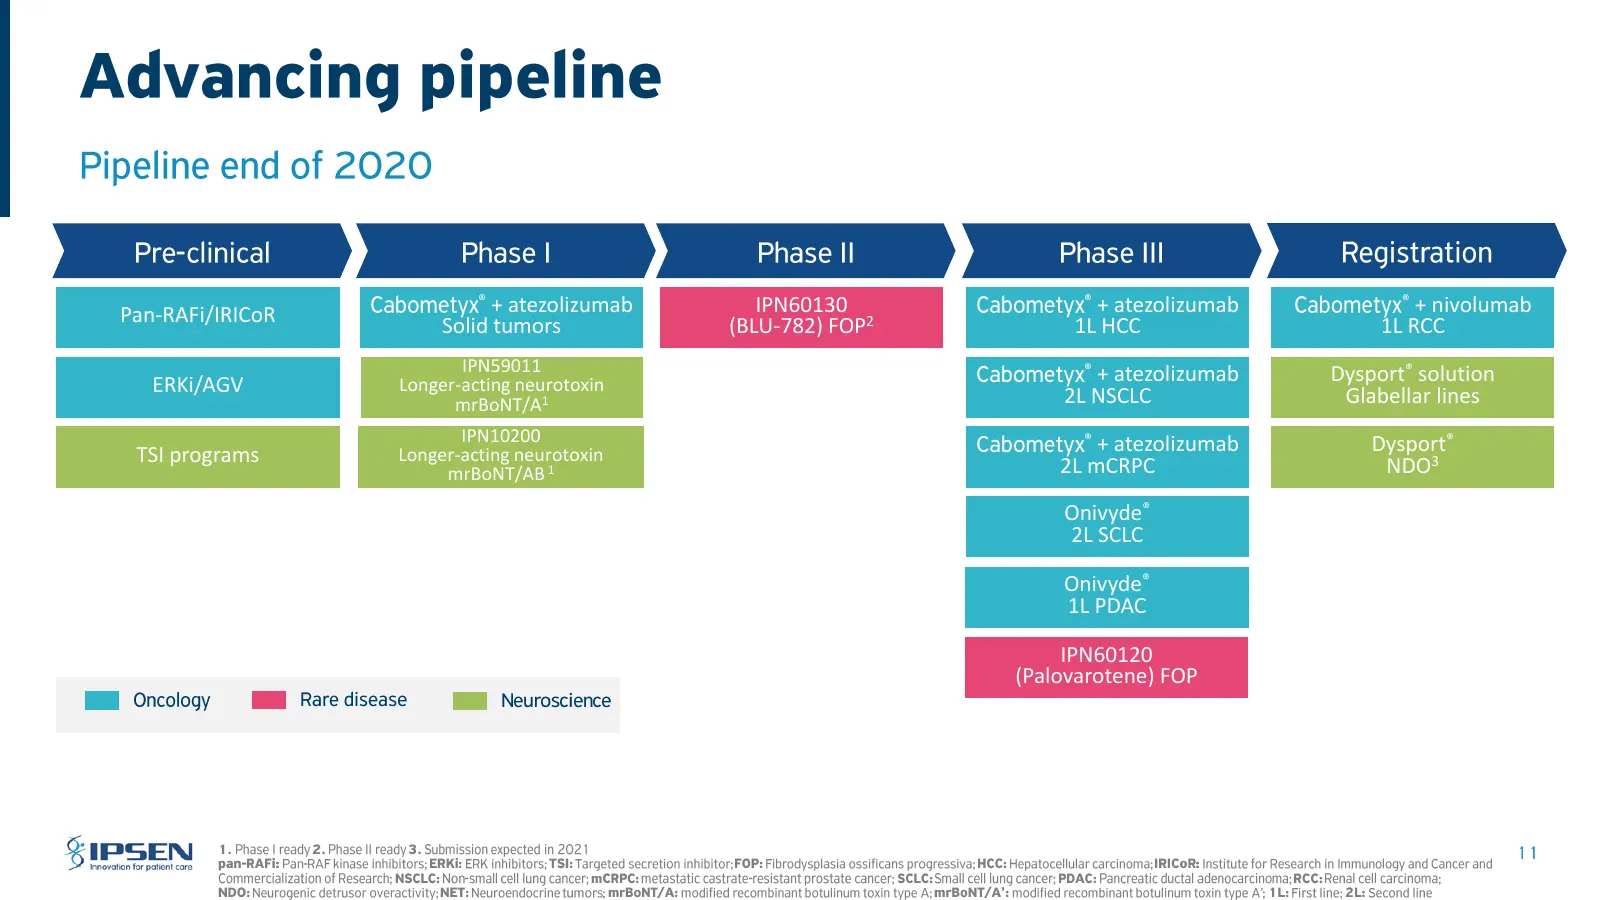
Slide 11: Pipeline milestones
® + atezolizumab IPN60130 ® + atezolizumab ® + nivolumab Pan-RAFi/IRICoR Solid tumors (BLU-782) FOP2 1L HCC 1L RCC IPN59011 ® + atezolizumab Dysport® solution ERKi/AGV Longer-acting neurotoxin 2L NSCLC Glabellar lines mrBoNT/A1 IPN10200 ® + atezolizumab Dysport® TSI programs Longer-acting neurotoxin
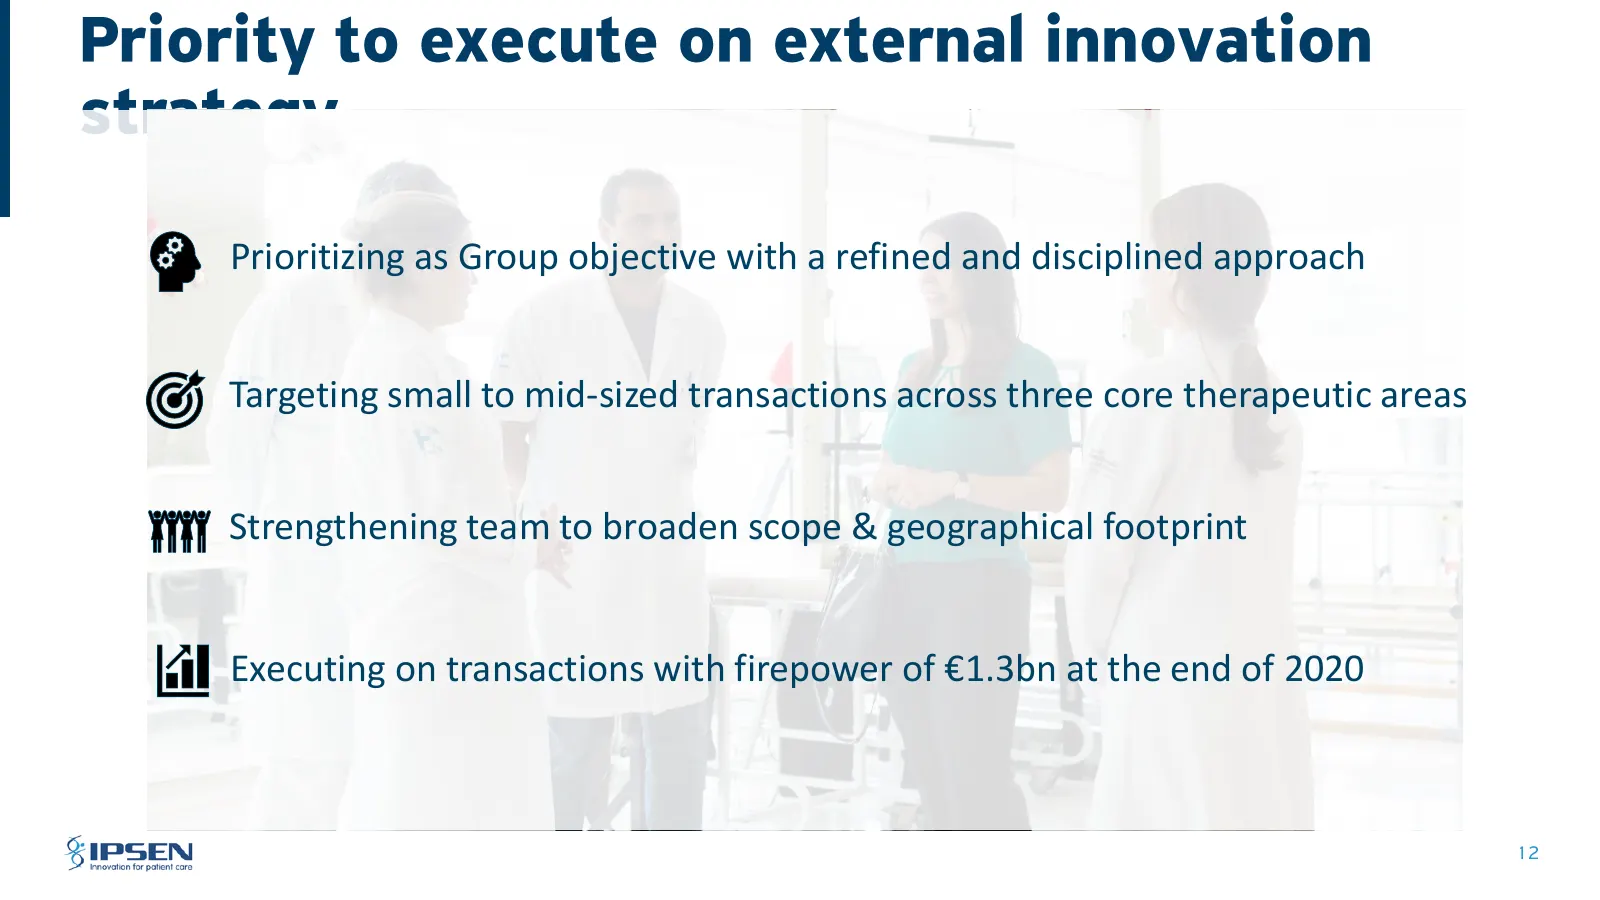
Slide 12: External innovation strategy
Prioritizing as Group objective with a refined and disciplined approach Targeting small to mid-sized transactions across three core therapeutic areas Strengthening team to broaden scope & geographical footprint Executing on transactions with firepower of €1.3bn at the end of 2020
Slide 13: 02 FY 2020 Financial performance
O2 FY 2020 Financial performance FY 2021 Guidance
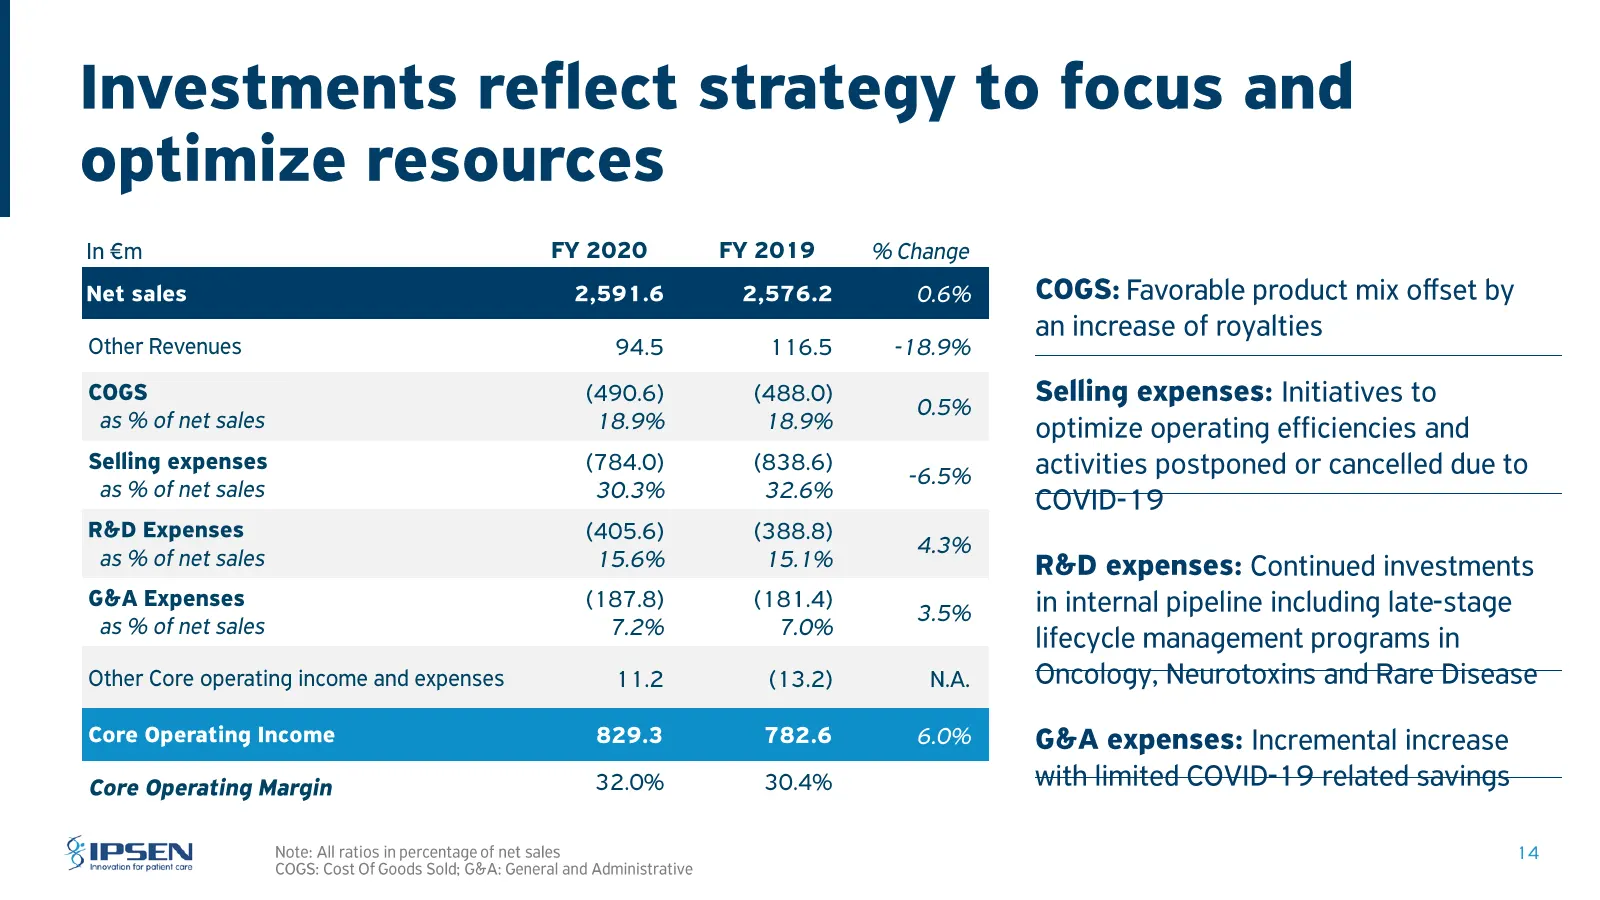
Slide 14: Investments reflect strategy to focus and optimize resources
Investments reflect strategy to focus and optimize resources In€m FY 2020 FY 2019 % Change Net sales 2,591.6 2,576.2 0.6% Other Revenues 94.5 116.5 -18.9% coGs (490.6) (488.0) 0.5% as % of net sales 18.9% 18.9% ° Selling expenses (784.0) (838.6) 6.5% as % of net sales 30.3% 32.6% . R&D Expenses (405
Slide 15: Operating leverage driving core operating margin expansion
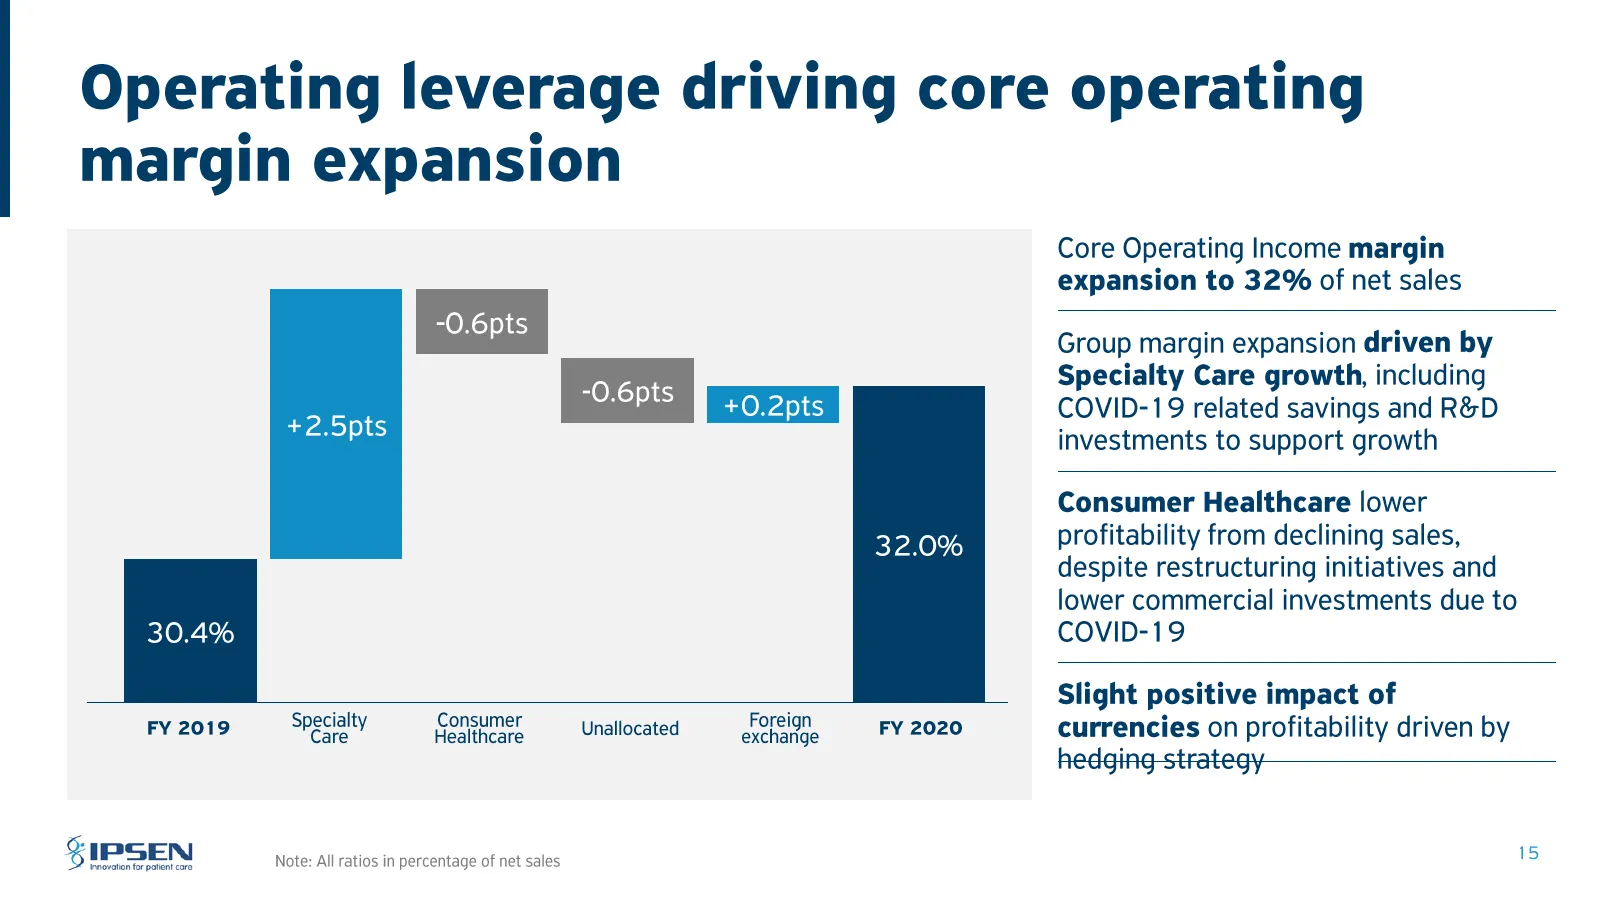
Operating leverage driving core operating margin expansion Core Operating Income margin expansion to 32% of net sales ~0.6pts Group margin expansion driven by Specialty Care growth, including +2.5pts COVID-19 related savings and R&D investments to support growth Consumer Healthcare lower profitabili
Slide 16: Consolidated income statement
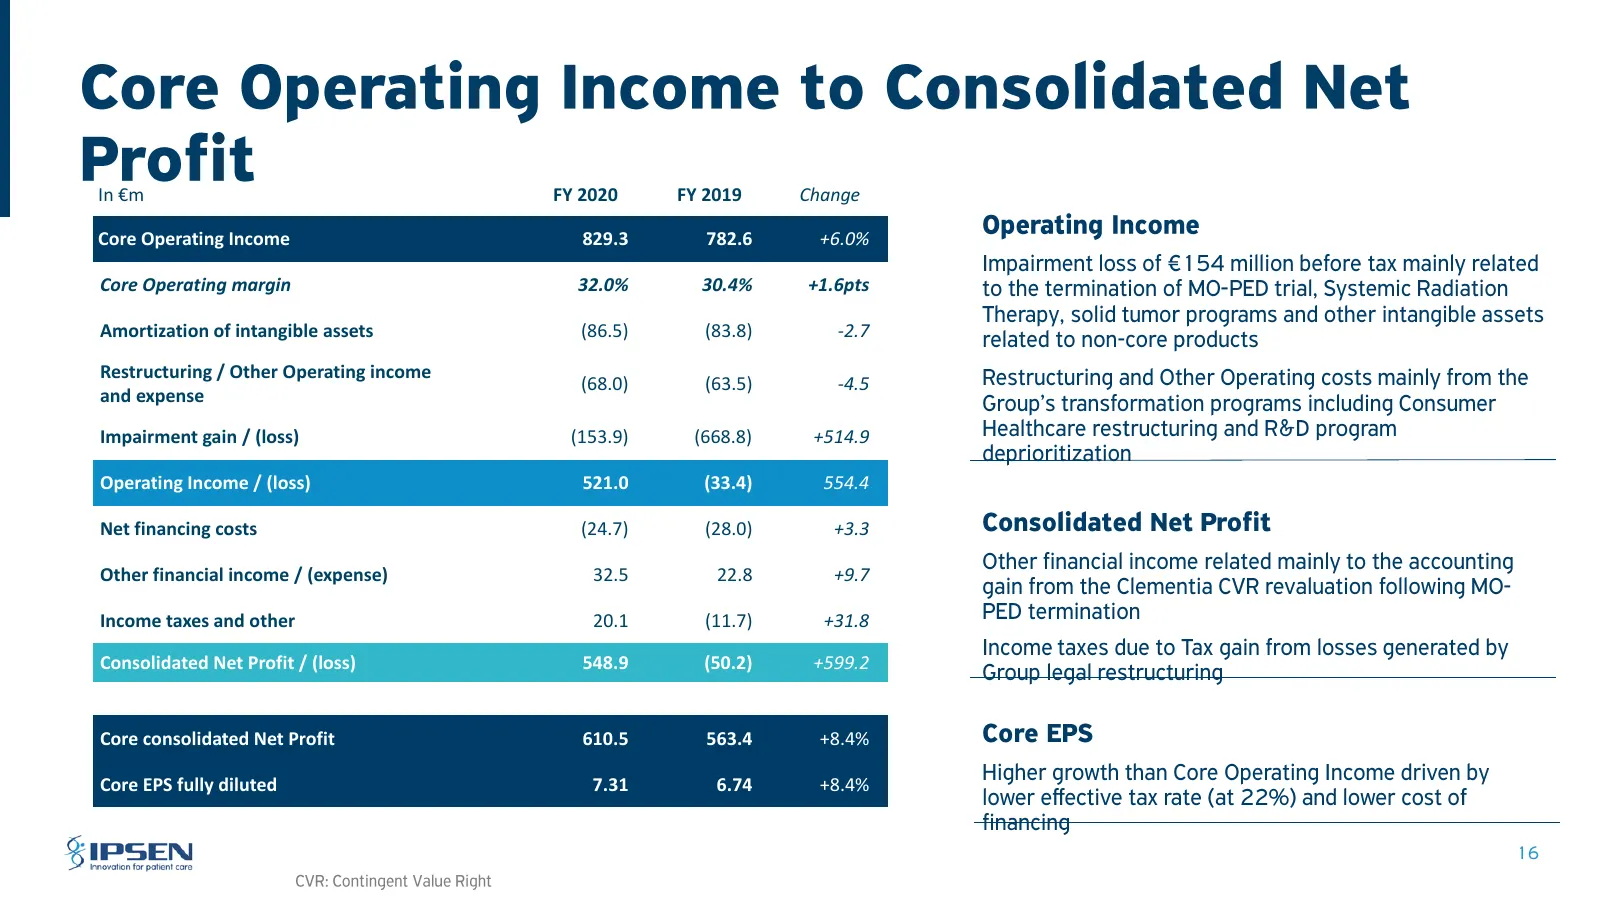
In €m FY 2020 FY 2019 Change Core Operating Income 829.3 782.6 +6.0% Core Operating margin 32.0% 30.4% +1.6pts Amortization of intangible assets (86.5) (83.8) -2.7 Restructuring / Other Operating income (68.0) (63.5) -4.5 and expense Impairment gain / (loss) (153.9) (668.8) +514.9 Operating Income /
Slide 17: Net cash position
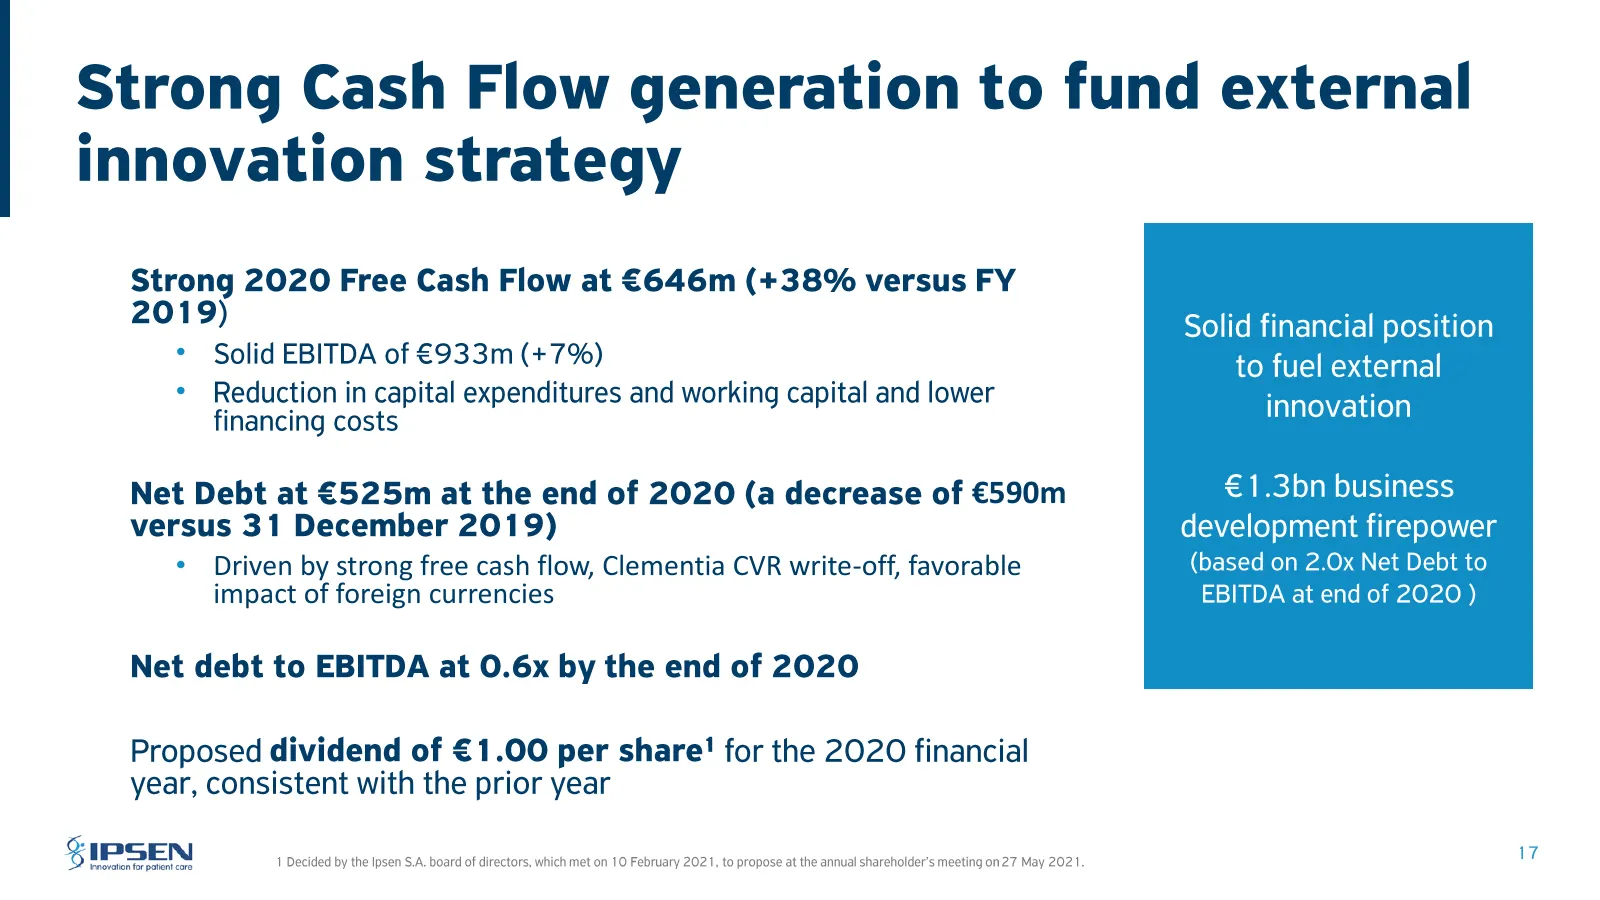
• • €590m • Driven by strong free cash flow, Clementia CVR write-off, favorable impact of foreign currencies
Slide 18: 2021 guidance
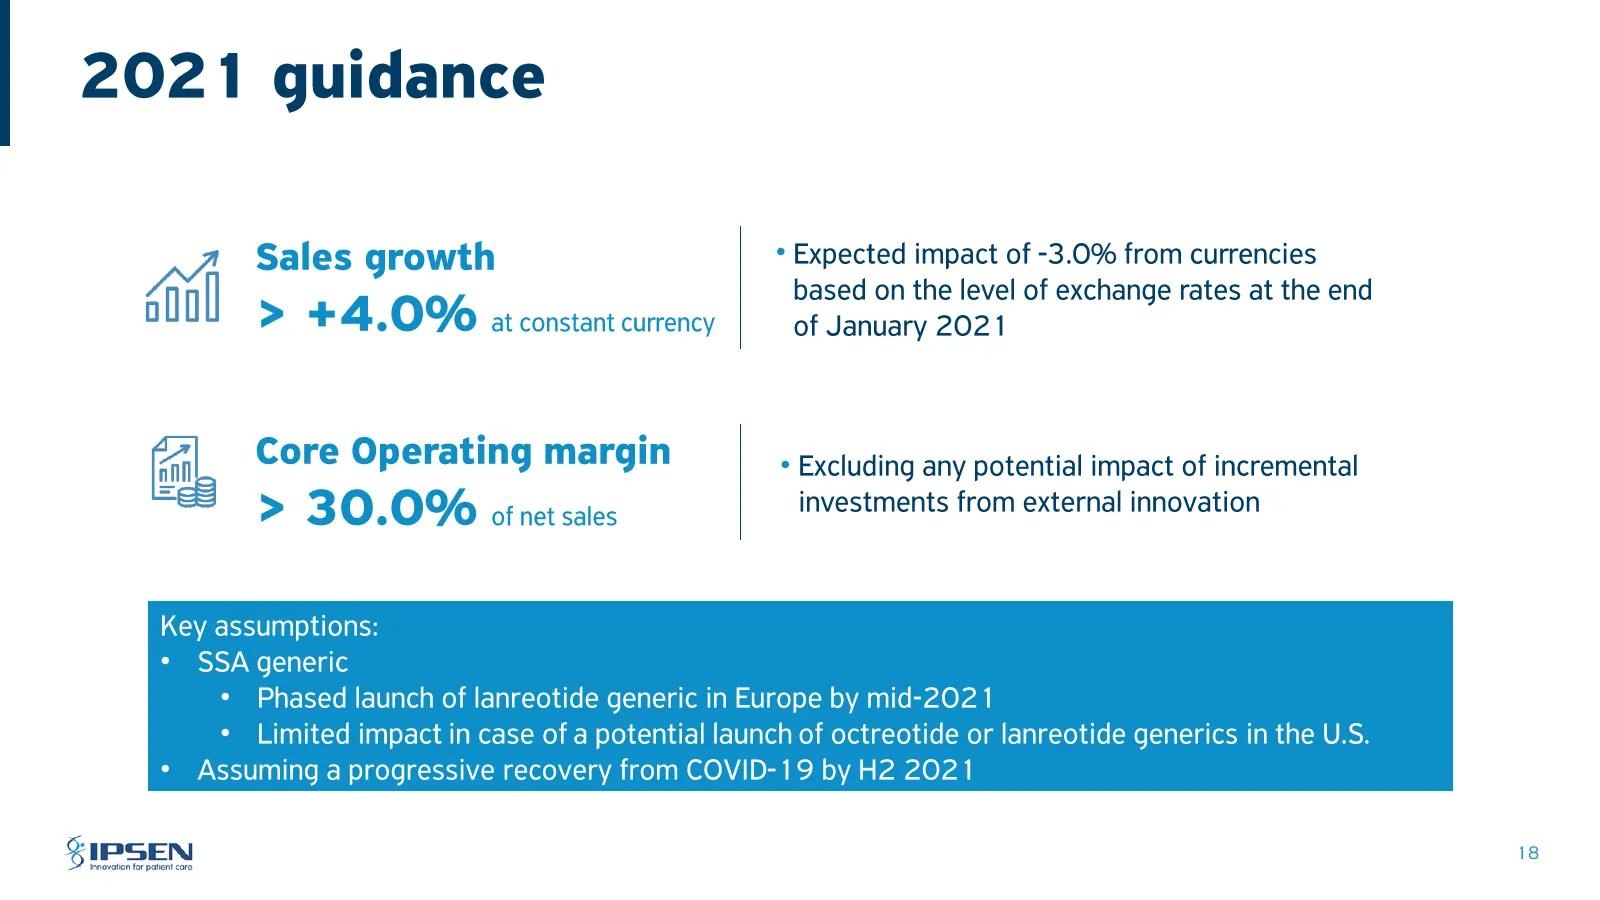
2021 guidance Sales growth Anil > +4.0% at constant currency ‘a|_ Core Operating margin = > 30.0% of net sales Key assumptions: * SSA generic Phased launch of lanreotide generic in Europe by mid-2021 Limited impact in case of a potential launch of octreotide or lanreotide generics in the U.S. ° Expe

Slide 19: Conclusion
Conclusion
Slide 20: 2021 Objectives
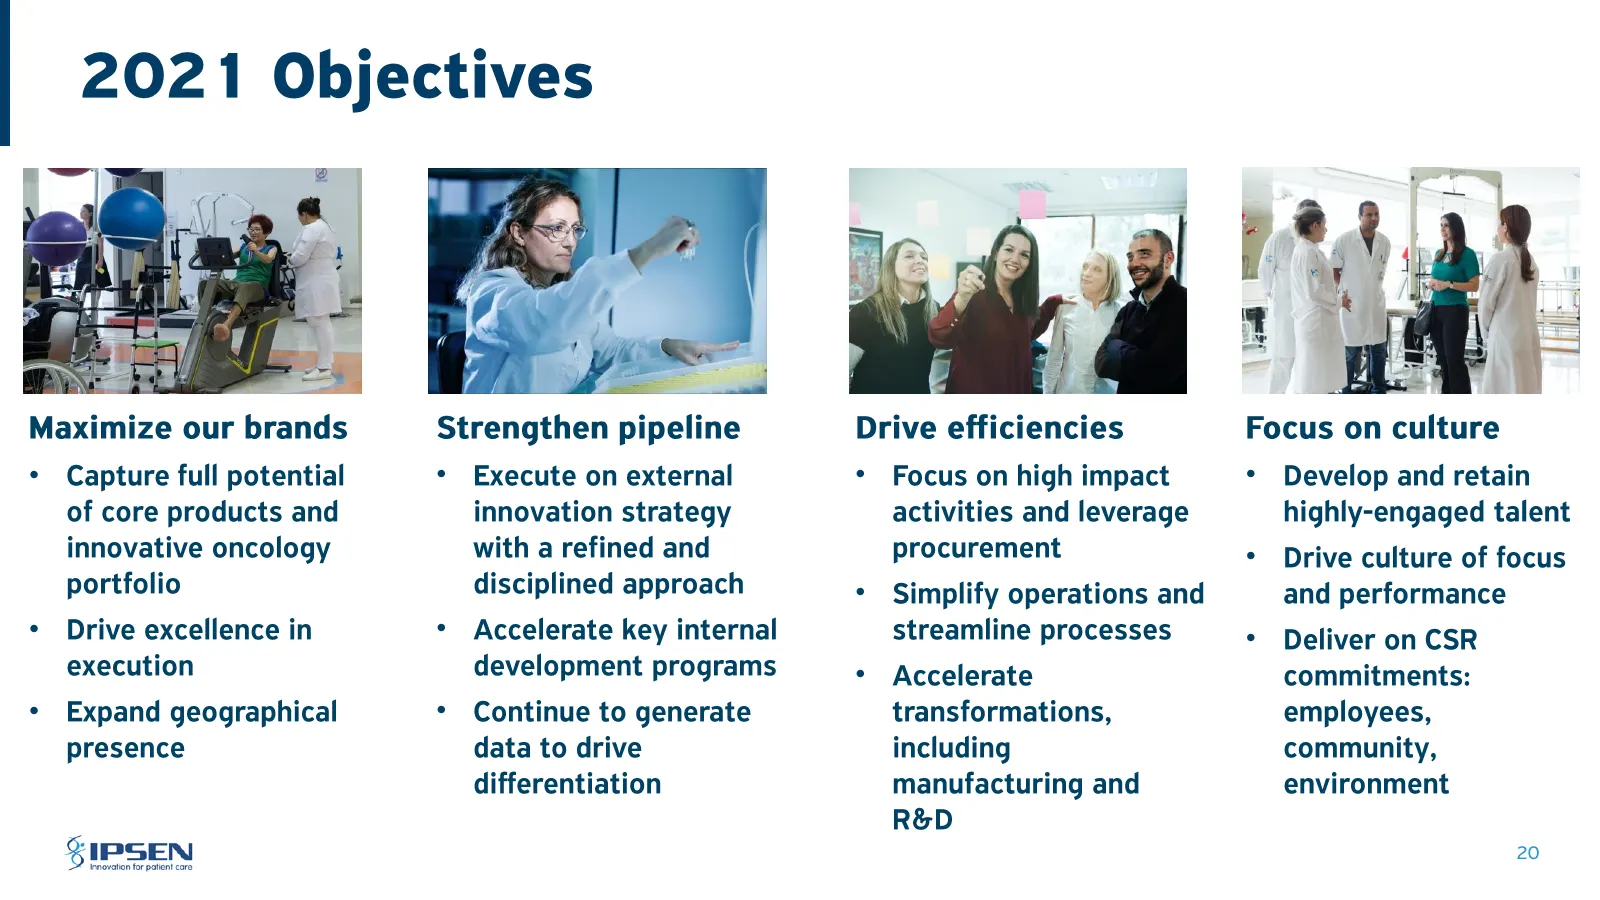
Maximize our brands 2021 Objectives Capture full potential of core products and innovative oncology portfolio Drive excellence in execution Expand geographical presence 5S IPSEN Strengthen pipeline / Ys Execute on external innovation strategy with a refined and disciplined approach Accelerate key in
Slide 21: Thank you
Thank you
Slide 22: Group sales by segment
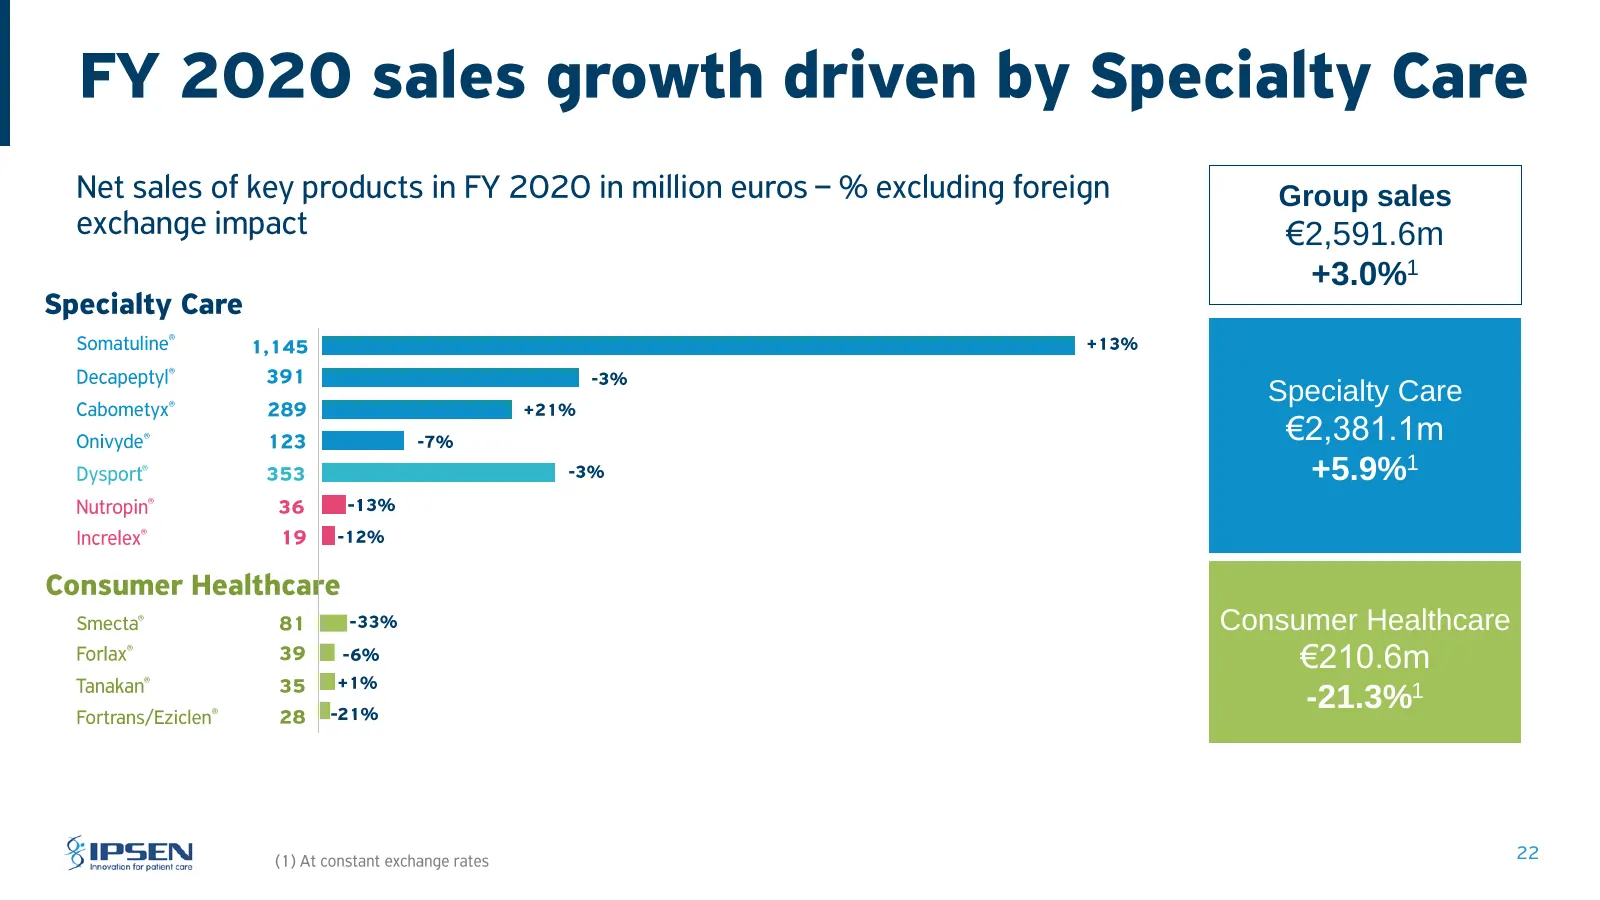
Group sales €2,591.6m +3.0%1 Specialty Care €2,381.1m +5.9%1 Consumer Healthcare €210.6m -21.3%1
Slide 23: FY 2020 sales negatively impacted by foreign exchange rates
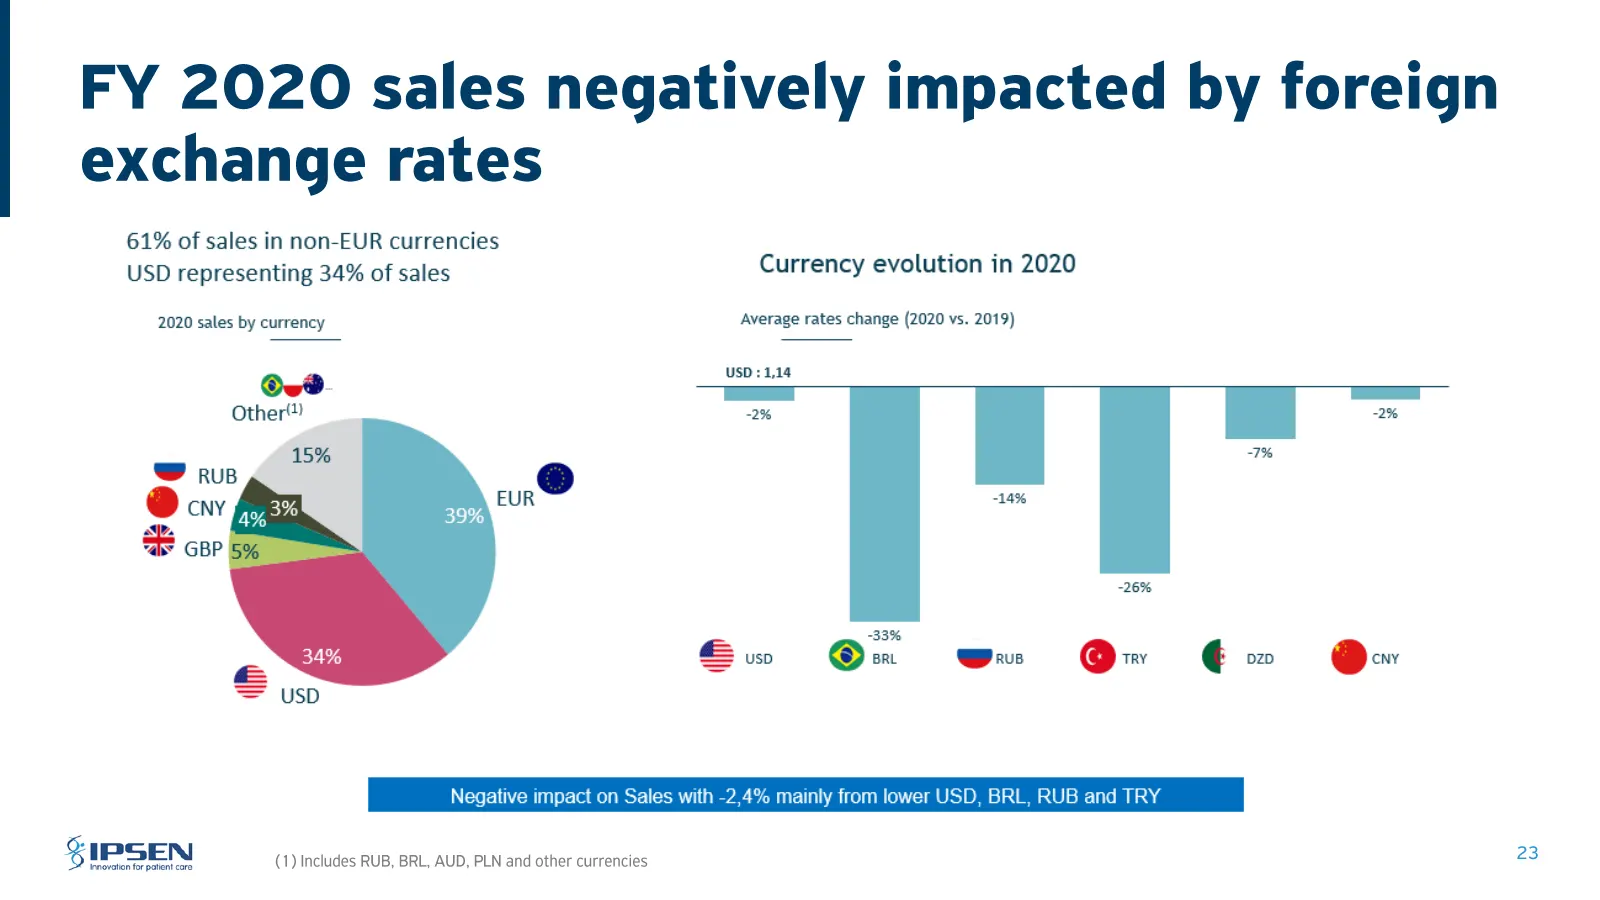
FY 2020 sales negatively impacted by foreign exchange rates 61% of sales in non-EUR currencies oo USD representing 34% of sales Currency evolution in 2020 2020 sales by currency Average rates change (2020 vs. 2019) USD : 1,14 —_ ma SS EUR -33% (lm usp © BRL Prus Ow é DzD Ow Negative impact on Sales
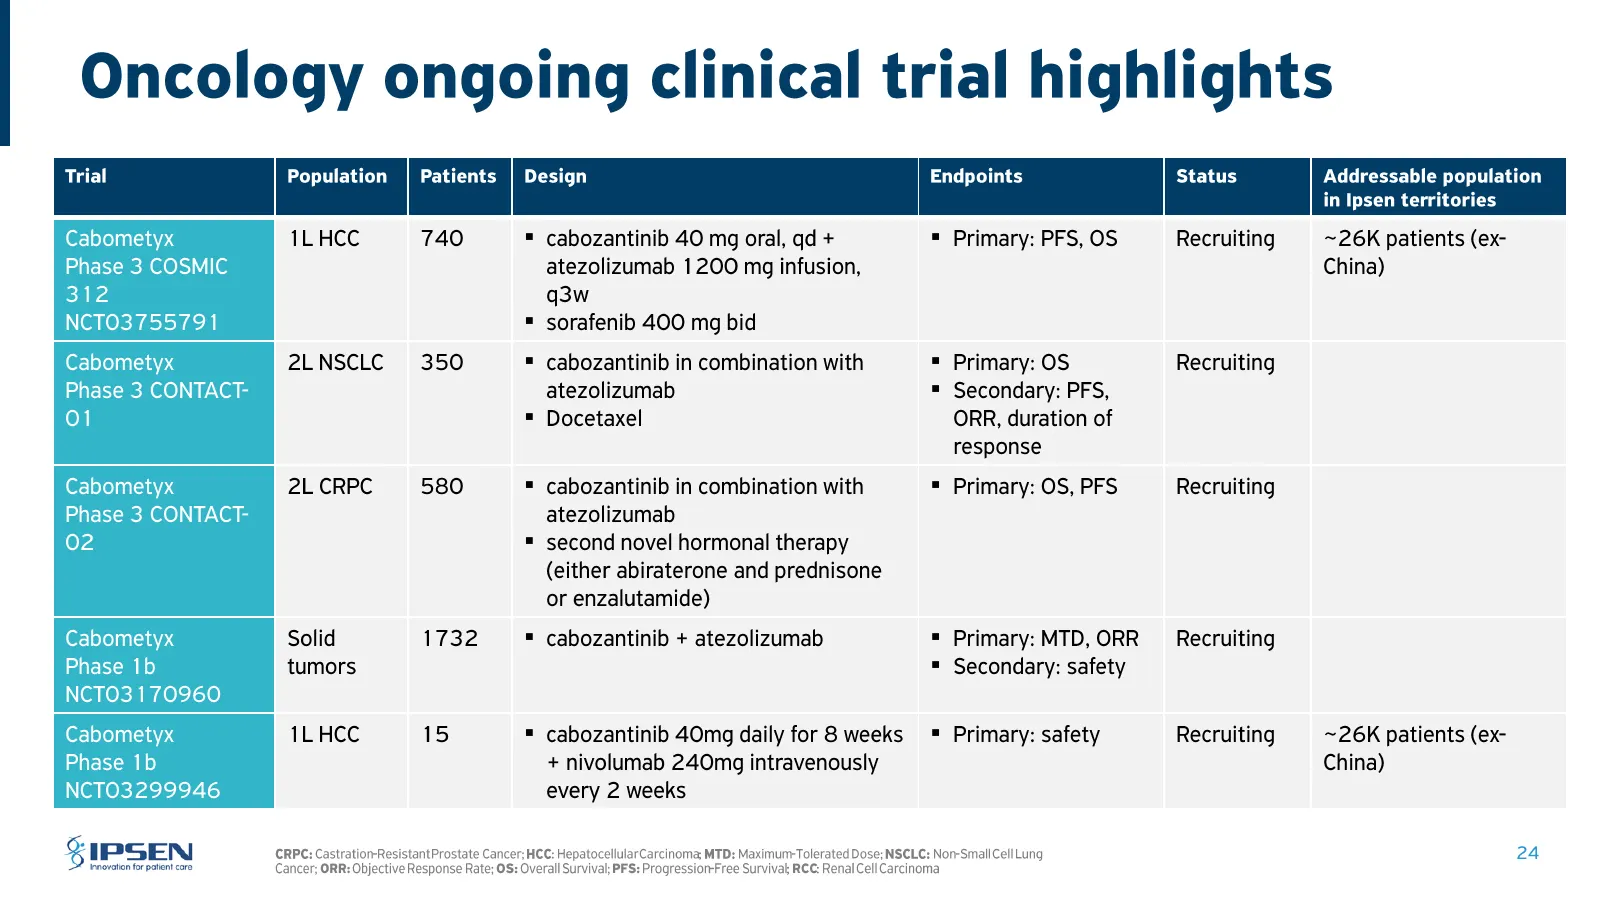
Slide 24: Oncology ongoing clinical trial highlights
Oncology ongoing clinical trial highlights GEES 2 SESE Cabometyx 1L HCC = cabozantinib 40 mg oral, qd + = Primary: PFS, OS Recruiting ~26K patients (ex- Phase 3 COSMIC atezolizumab 1200 mg infusion, China) 312 q3w NCT03755791 = sorafenib 400 mg bid Cabometyx 2LNSCLC 350 = cabozantinib in combination
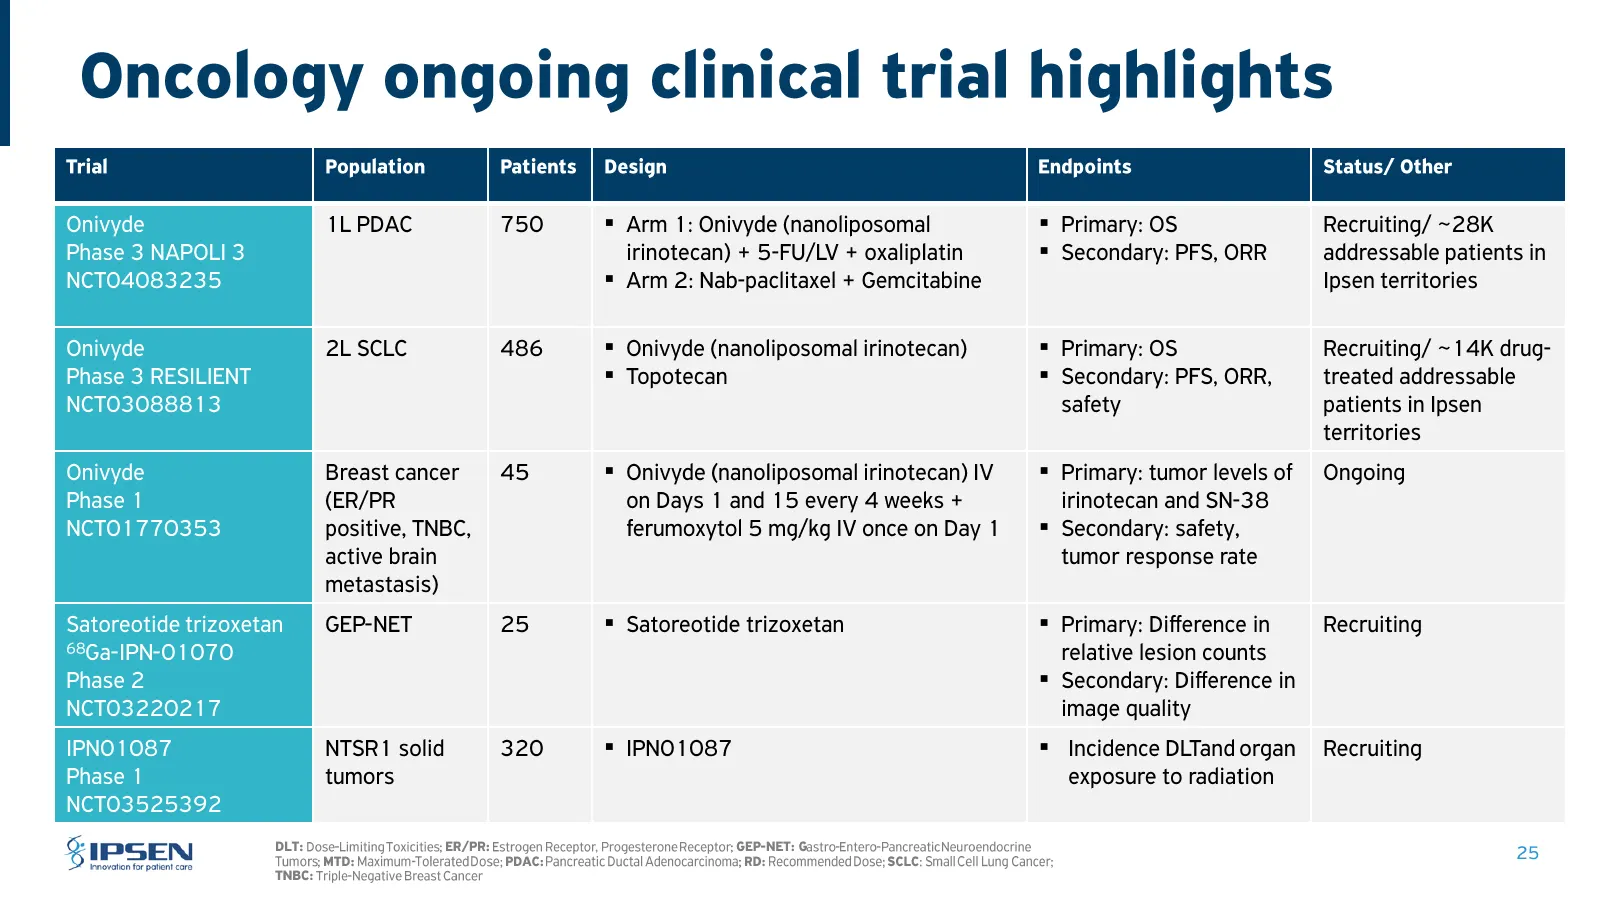
Slide 25: Oncology ongoing clinical trial highlights
Oncology ongoing clinical trial highlights Lc ice Llc Gc Onivyde 1L PDAC Phase 3 NAPOLI 3 NCT0408323 Onivyde 2L SCLC Phase 3 RESILIENT NCTO3088813 Onivyde Breast cancer Phase 1 (ER/PR NCTO1770353 positive, TNBC, active brain metastasis) Satoreotide trizoxetan GEP-NET 68Ga-IPN-O1070 Phase 2 NCTO32202
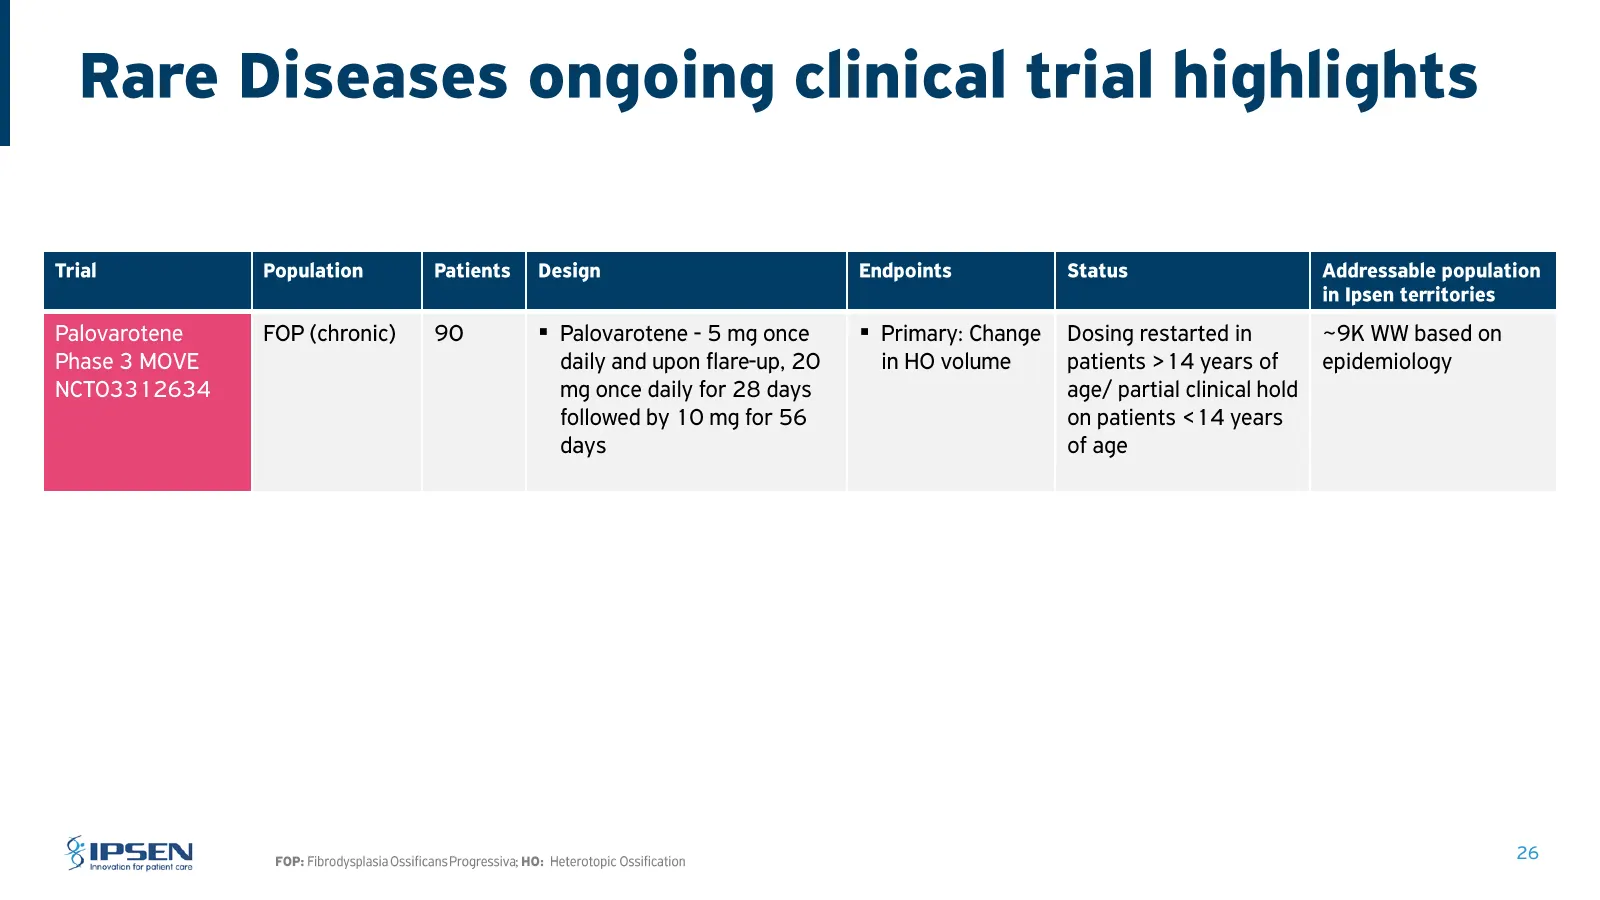
Slide 26: Rare Diseases ongoing clinical trial highlights
Rare Diseases ongoing clinical trial highlights jal Population Status Addressable population Ipsen te ies Palovarotene FOP (chronic) 90 = Palovarotene - 5 mg once = Primary: Change Dosing restarted in ~9K WW based on Phase 3 MOVE daily and upon flare-up, 20 in HO volume patients > 14 years of epidem
Source: Internet Archive copy of ipsen.com
More decks from Ipsen SA
 Q3 2026 Earnings Presentation20 slides · Oct 22, 2026
 H1 2026 Earnings Presentation38 slides · Jul 30, 2026
 Q1 2026 Earnings Presentation21 slides · Apr 23, 2026
 FY 2025 Earnings Presentation36 slides · Feb 12, 2026
 J.P. Morgan Healthcare Conference 202627 slides · January 2026
 Q3 2025 Earnings Presentation22 slides · Oct 22, 2025