Argo Group International Holdings Ltd
Argo Group International — Q4 2017 Earnings Presentation
11 slides from Argo Group International's earnings presentation, Feb 14, 2018
Slide 1: 2017 Q4 Earnings Call Supplement
2017 Earnings Call Supplement Q4 Exhibit 99.1
Slide 2: Forward-looking statements
This presentation may include forward-looking statements, both with respect to Argo Group and its industry, that reflect our current views with respect to future events and financial performance. These statements are made pursuant to the safe harbor provisions of the Private Securities Litigation Re
Slide 3: 4Q 2017 Operating Results
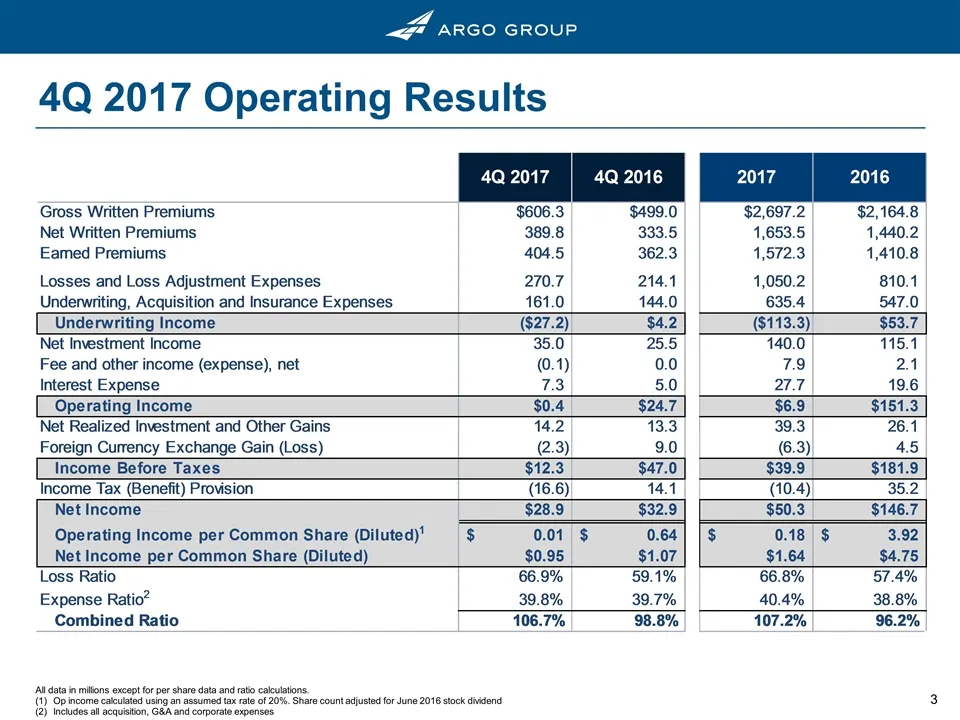
4Q 2017 Operating Results All data in millions except for per share data and ratio calculations. Op income calculated using an assumed tax rate of 20%. Share count adjusted for June 2016 stock dividend Includes all acquisition, G&A and corporate expenses
Slide 4: 2017 Peer CAT Losses Summary
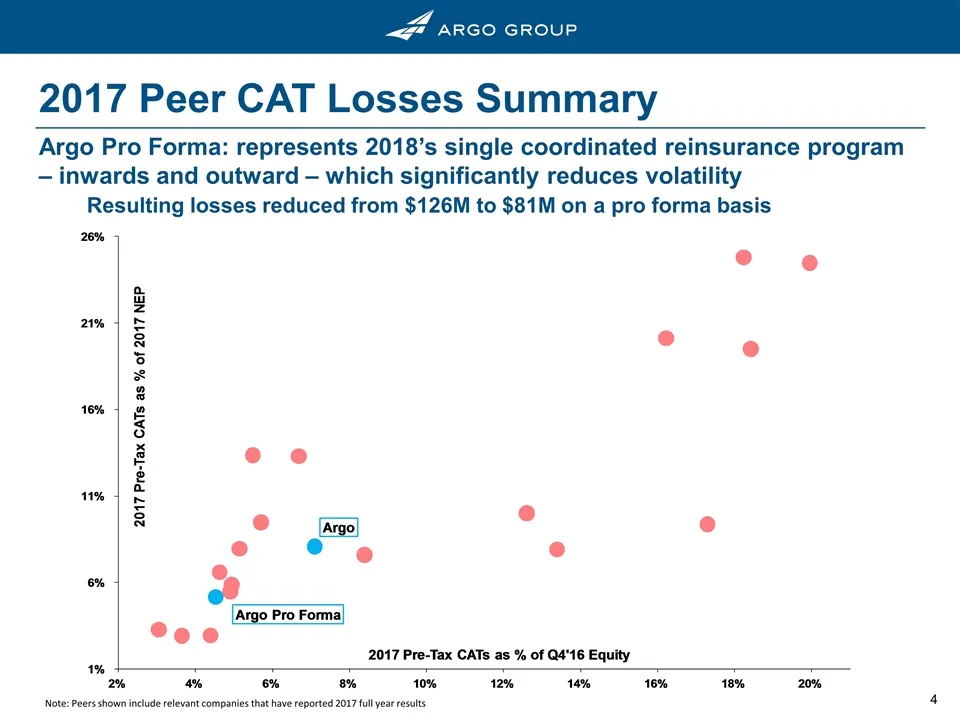
2017 Peer CAT Losses Summary Note: Peers shown include relevant companies that have reported 2017 full year results Argo Pro Forma: represents 2018’s single coordinated reinsurance program – inwards and outward – which significantly reduces volatility Resulting losses reduced from $126M to $81M on a
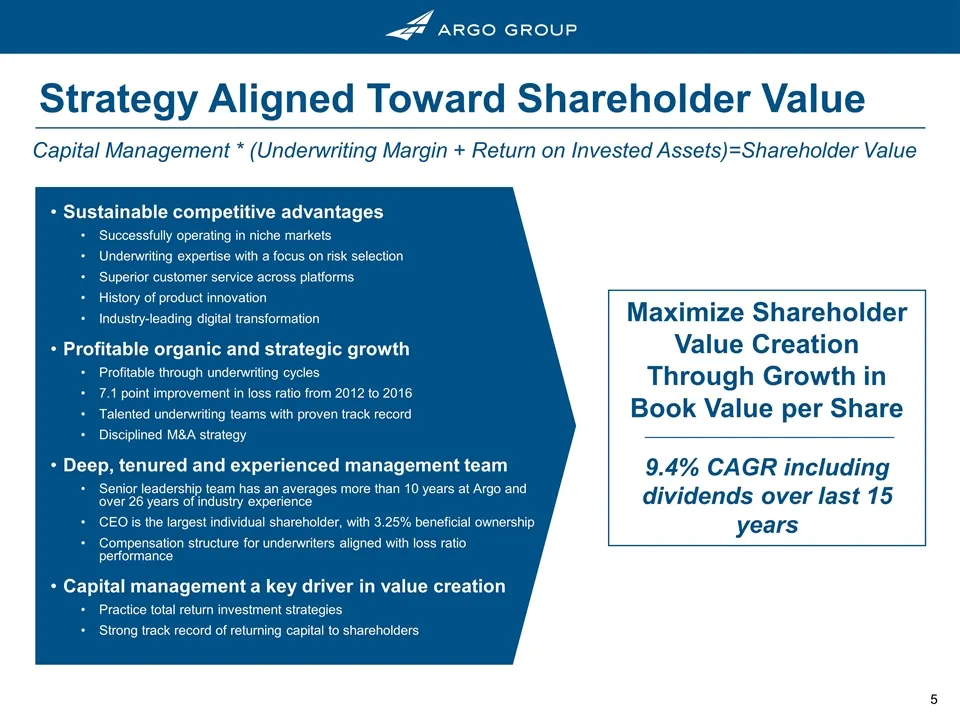
Slide 5: Capital Management: Maximize Shareholder Value Creation
Capital Management * (Underwriting Margin + Return on Invested Assets)=Shareholder Value Maximize Shareholder Value Creation Through Growth in Book Value per Share 9.4% CAGR including dividends over last 15 years Strategy Aligned Toward Shareholder Value Sustainable competitive advantages Successful
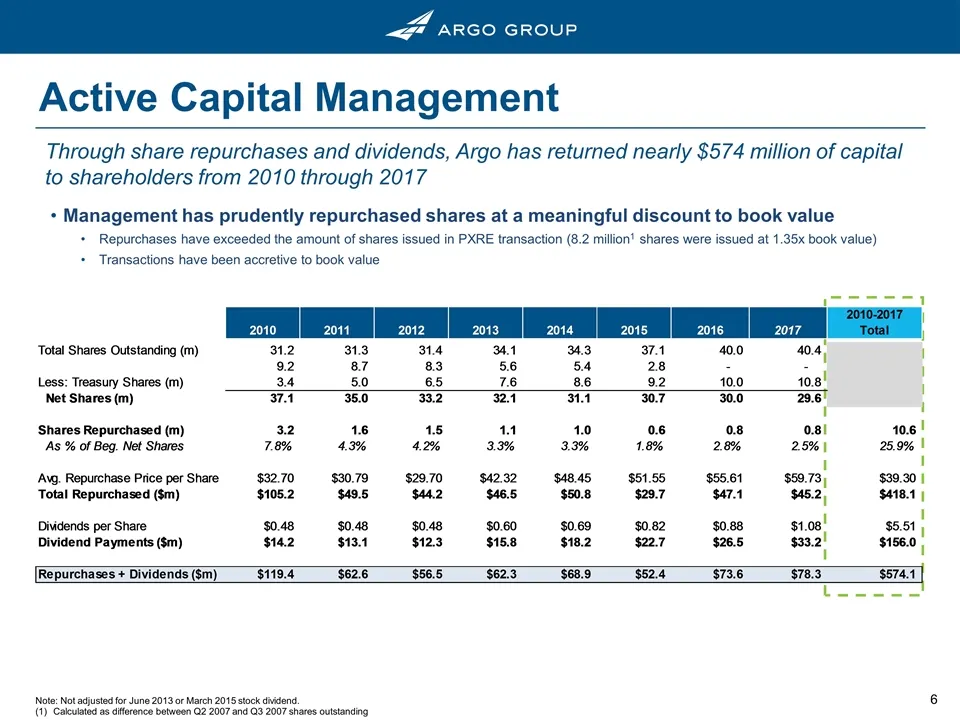
Slide 6: Active Capital Management
Active Capital Management Through share repurchases and dividends, Argo has returned nearly $574 million of capital to shareholders from 2010 through 2017 Management has prudently repurchased shares at a meaningful discount to book value Repurchases have exceeded the amount of shares issued in PXRE
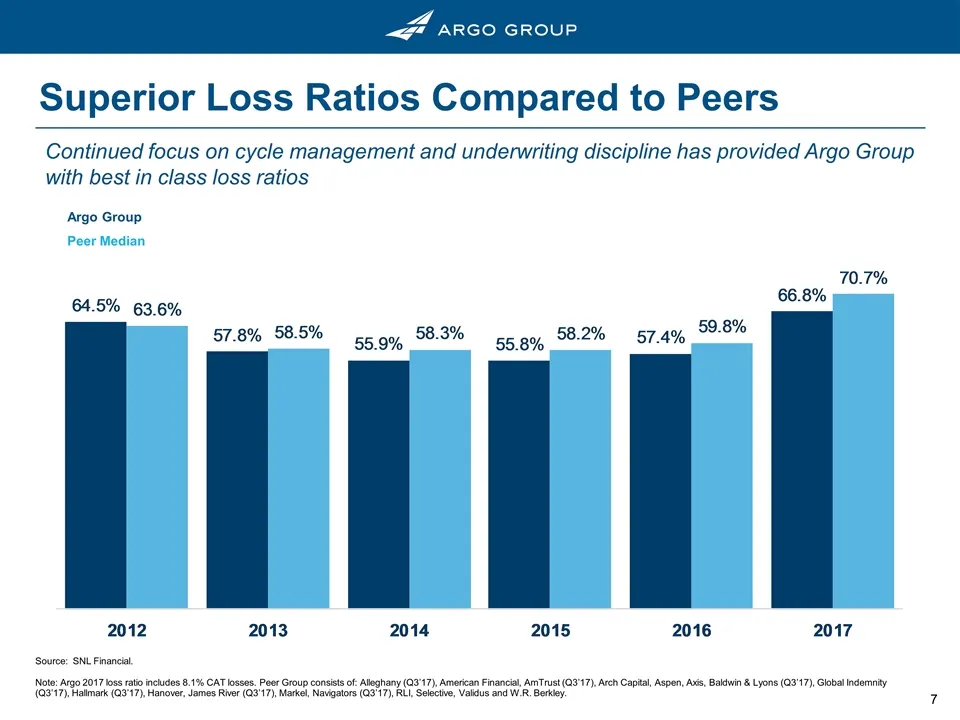
Slide 7: Superior Loss Ratios Compared to Peers
Superior Loss Ratios Compared to Peers Continued focus on cycle management and underwriting discipline has provided Argo Group with best in class loss ratios Argo Group Peer Median Source: SNL Financial. Note: Argo 2017 loss ratio includes 8.1% CAT losses. Peer Group consists of: Alleghany (Q3’17),
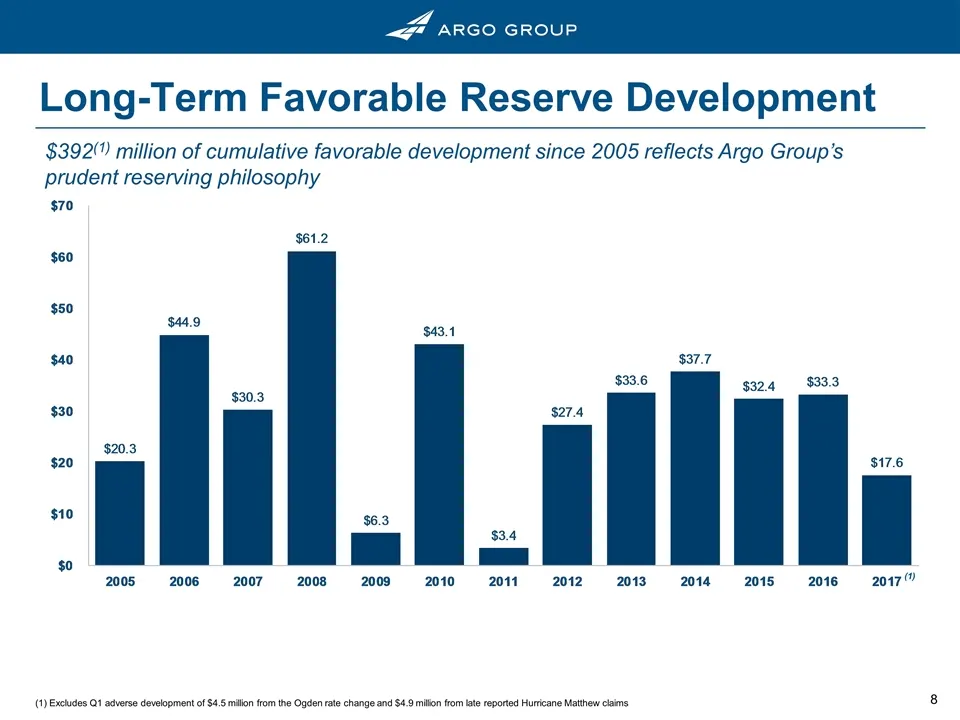
Slide 8: Long-Term Favorable Reserve Development
Long-Term Favorable Reserve Development $392(1) million of cumulative favorable development since 2005 reflects Argo Group’s prudent reserving philosophy (1) (1) Excludes Q1 adverse development of $4.5 million from the Ogden rate change and $4.9 million from late reported Hurricane Matthew claims
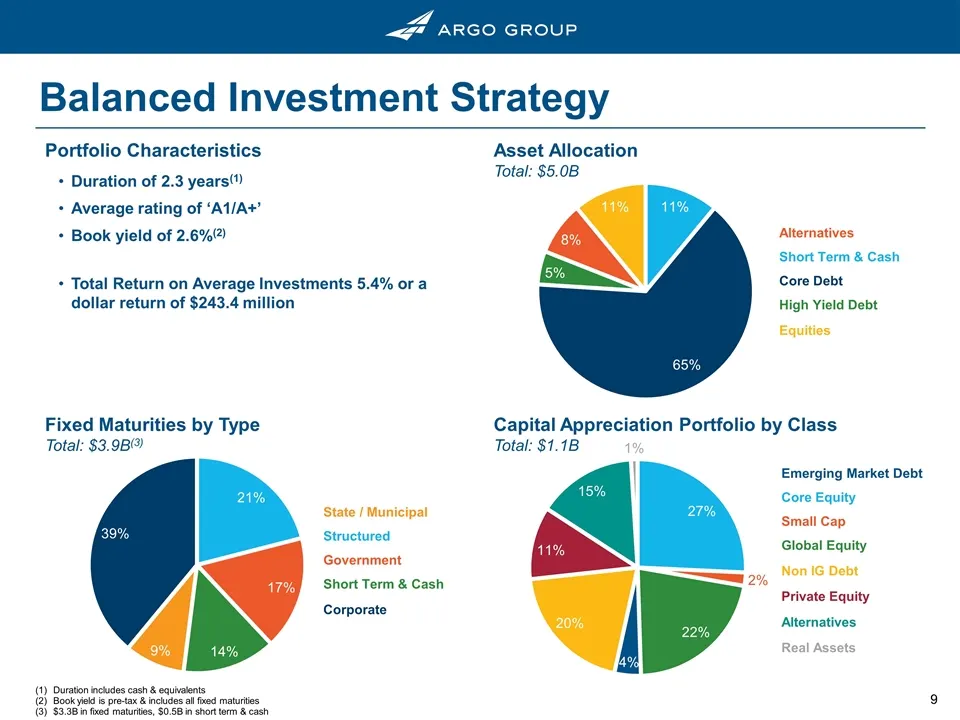
Slide 9: Balanced Investment Strategy
Balanced Investment Strategy Duration includes cash & equivalents Book yield is pre-tax & includes all fixed maturities $3.3B in fixed maturities, $0.5B in short term & cash Portfolio Characteristics Asset Allocation Total: $5.0B Fixed Maturities by Type Total: $3.9B(3) Capital Appreciation Portfoli
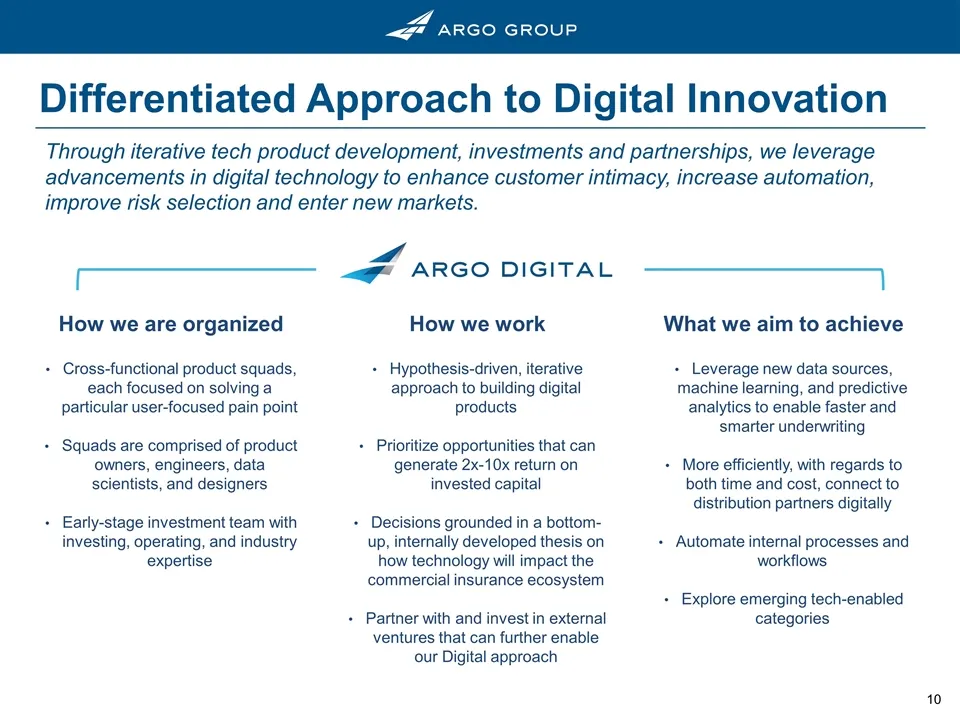
Slide 10: Differentiated Approach to Digital Innovation
Differentiated Approach to Digital Innovation Through iterative tech product development, investments and partnerships, we leverage advancements in digital technology to enhance customer intimacy, increase automation, improve risk selection and enter new markets. How we are organized Cross-functiona
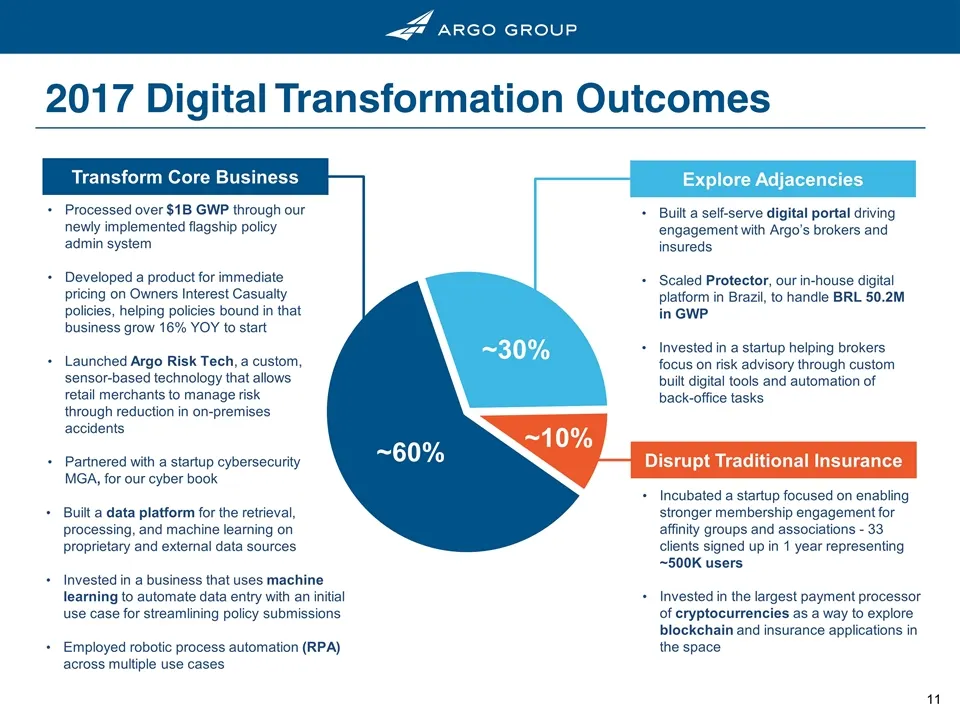
Slide 11: 2017 Digital Transformation Outcomes
2017 Digital Transformation Outcomes Processed over $1B GWP through our newly implemented flagship policy admin system Developed a product for immediate pricing on Owners Interest Casualty policies, helping policies bound in that business grow 16% YOY to start Launched Argo Risk Tech, a custom, sens
Source: SEC EDGAR · 8-K filed Feb 14, 2018
More decks from Argo Group International Holdings Ltd
 Proxy Contest (November 2022)39 slides · Nov 18, 2022
 Corporate Update (September 2022)23 slides · Sep 8, 2022
 Investor Presentation (February 2022)24 slides · Feb 23, 2022
 Q3 2021 Earnings Presentation7 slides · Nov 3, 2021
 Investor Day (March 2021)59 slides · Mar 12, 2021
 Investor Presentation (November 2020)17 slides · Nov 10, 2020