The Aaron's — Aaron's Company — Investor Presentation (July 2021)
28 slides from The Aaron's's investor presentation, Jul 27, 2021

Slide 1: Company Overview July 27, 2021
0 Company Overview July 27, 2021
Slide 2: Special Note Regarding Forward-Looking Information & Use of Non-GAAP Information
. 1 Special Note Regarding Forward-Looking Information & Use of Non-GAAP Information Except for historical information contained herein, the matters set forth in this presentation are forward-looking statements. These statements are based on management’s current expectations and plans, which involve
Slide 3: The Aaron's Company Overview
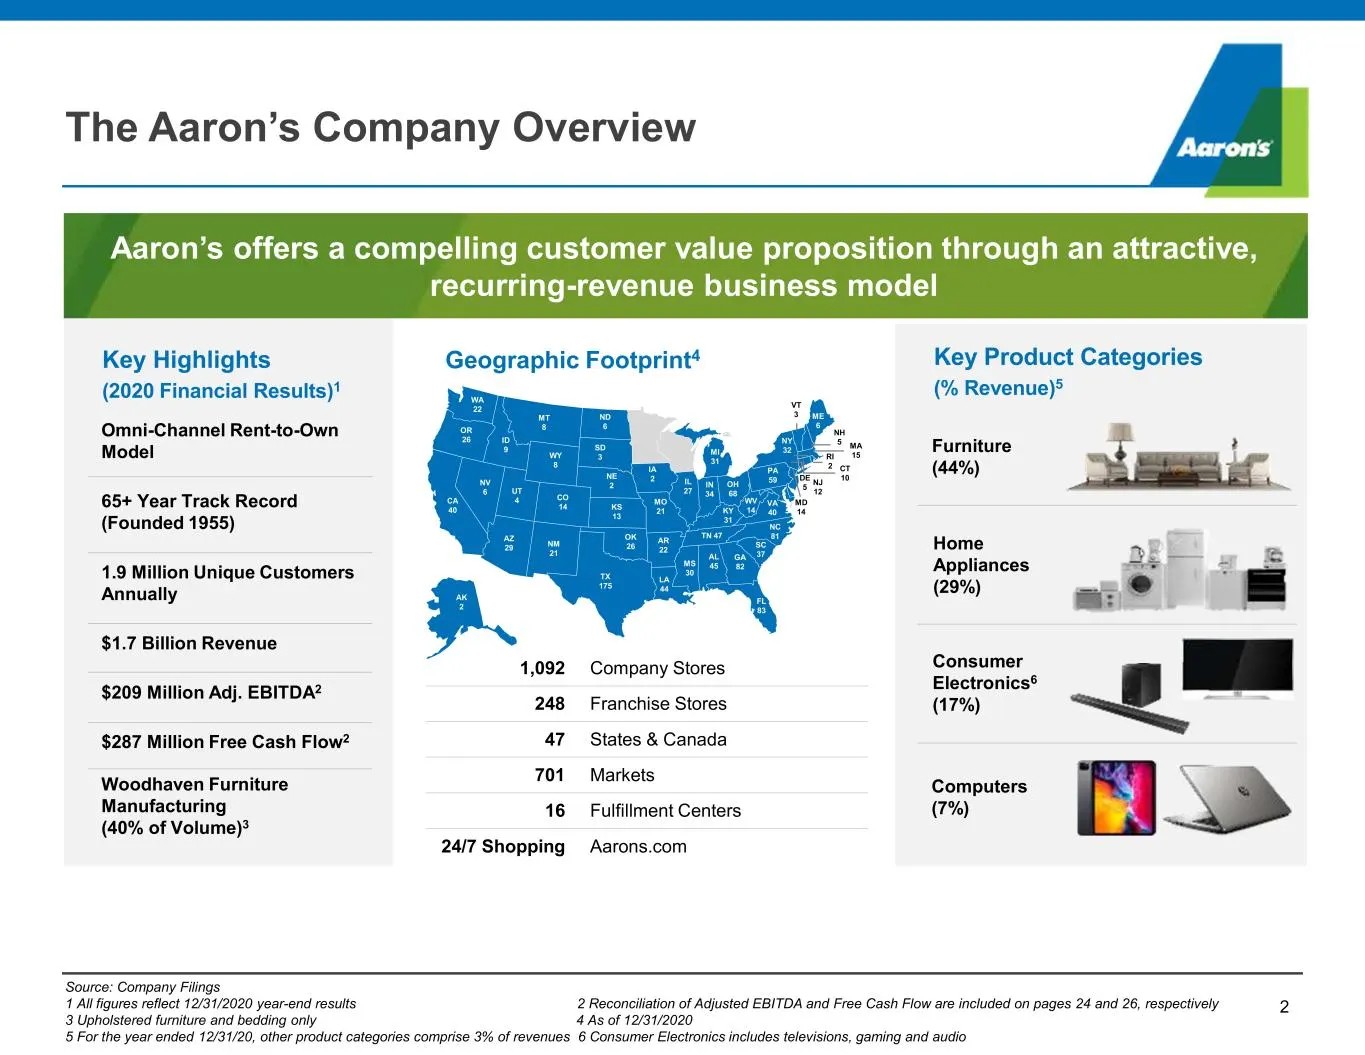
. The Aaron’s Company Overview 2 Geographic Footprint4 Key Product Categories (% Revenue)5 Omni-Channel Rent-to-Own Model 65+ Year Track Record (Founded 1955) 1.9 Million Unique Customers Annually $1.7 Billion Revenue $209 Million Adj. EBITDA2 $287 Million Free Cash Flow2 Woodhaven Furniture Manufac
Slide 4: Key Investment Highlights
. Key Investment Highlights 3 Large, resilient customer base representing ~30% of the U.S. population Compelling customer value proposition driven by competitive pricing, high approval rates, and best-in-class customer service Digitally-enabled, omni-channel strategy that provides an integrated onli
Slide 5: Aaron's Mission Guides Our Strategic Priorities
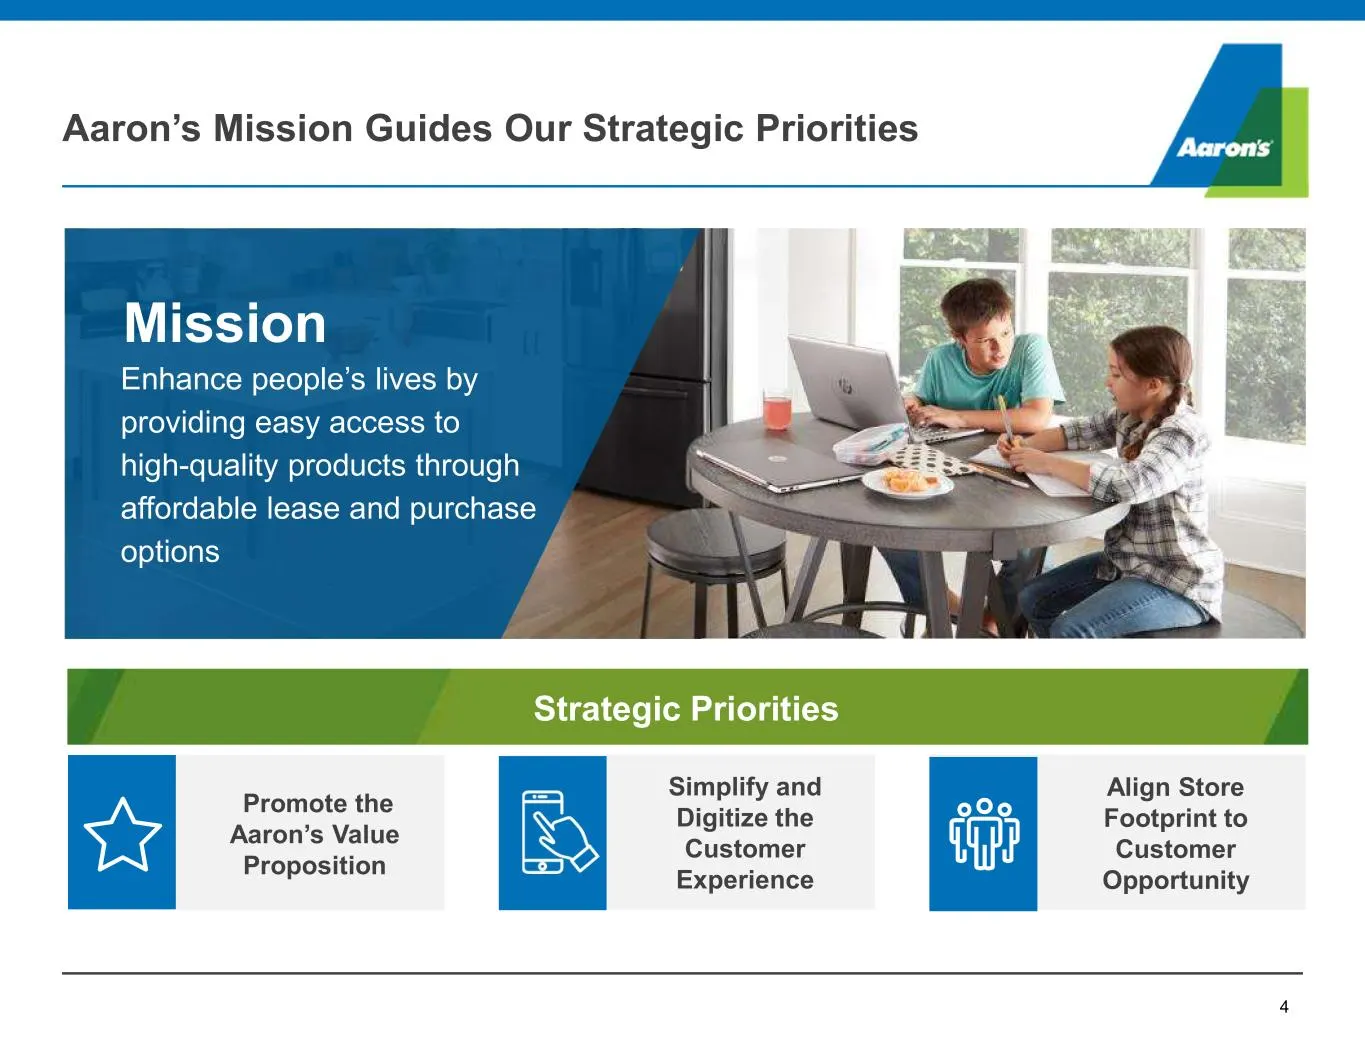
. Enhance people’s lives by providing easy access to high-quality products through affordable lease and purchase options Mission Simplify and Digitize the Customer Experience Align Store Footprint to Customer Opportunity 4 Strategic Priorities Aaron’s Mission Guides Our Strategic Priorities Promote
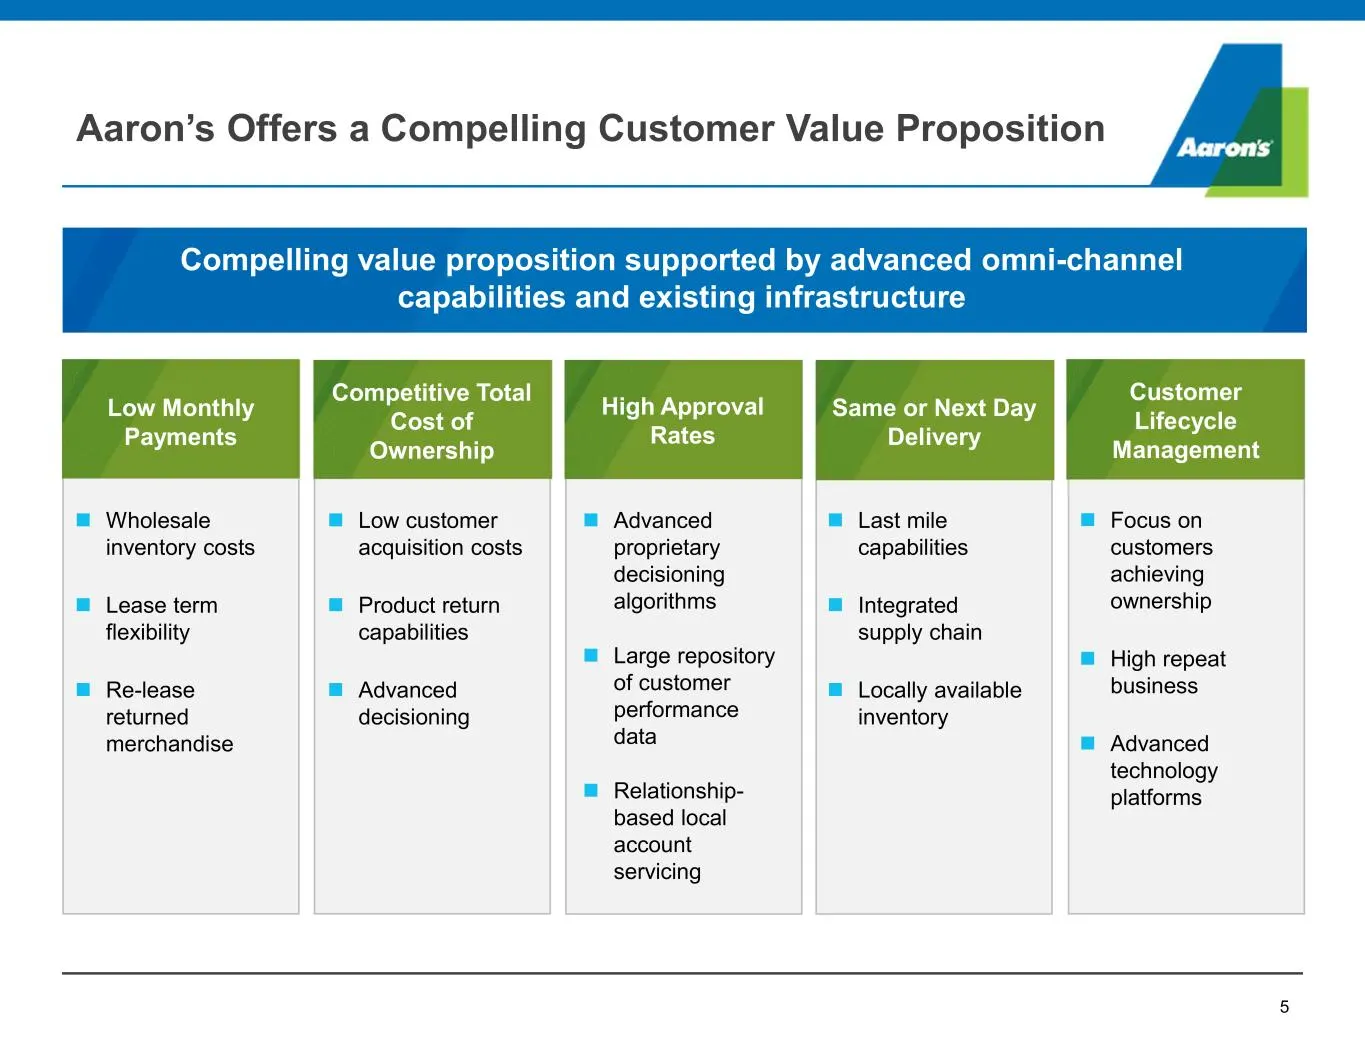
Slide 6: Aaron's Offers a Compelling Customer Value Proposition
. Aaron’s Offers a Compelling Customer Value Proposition Wholesale inventory costs Lease term flexibility Re-lease returned merchandise 5 Low Monthly Payments Competitive Total Cost of Ownership Low customer acquisition costs Product return capabilities Advanced decisioning High Approval
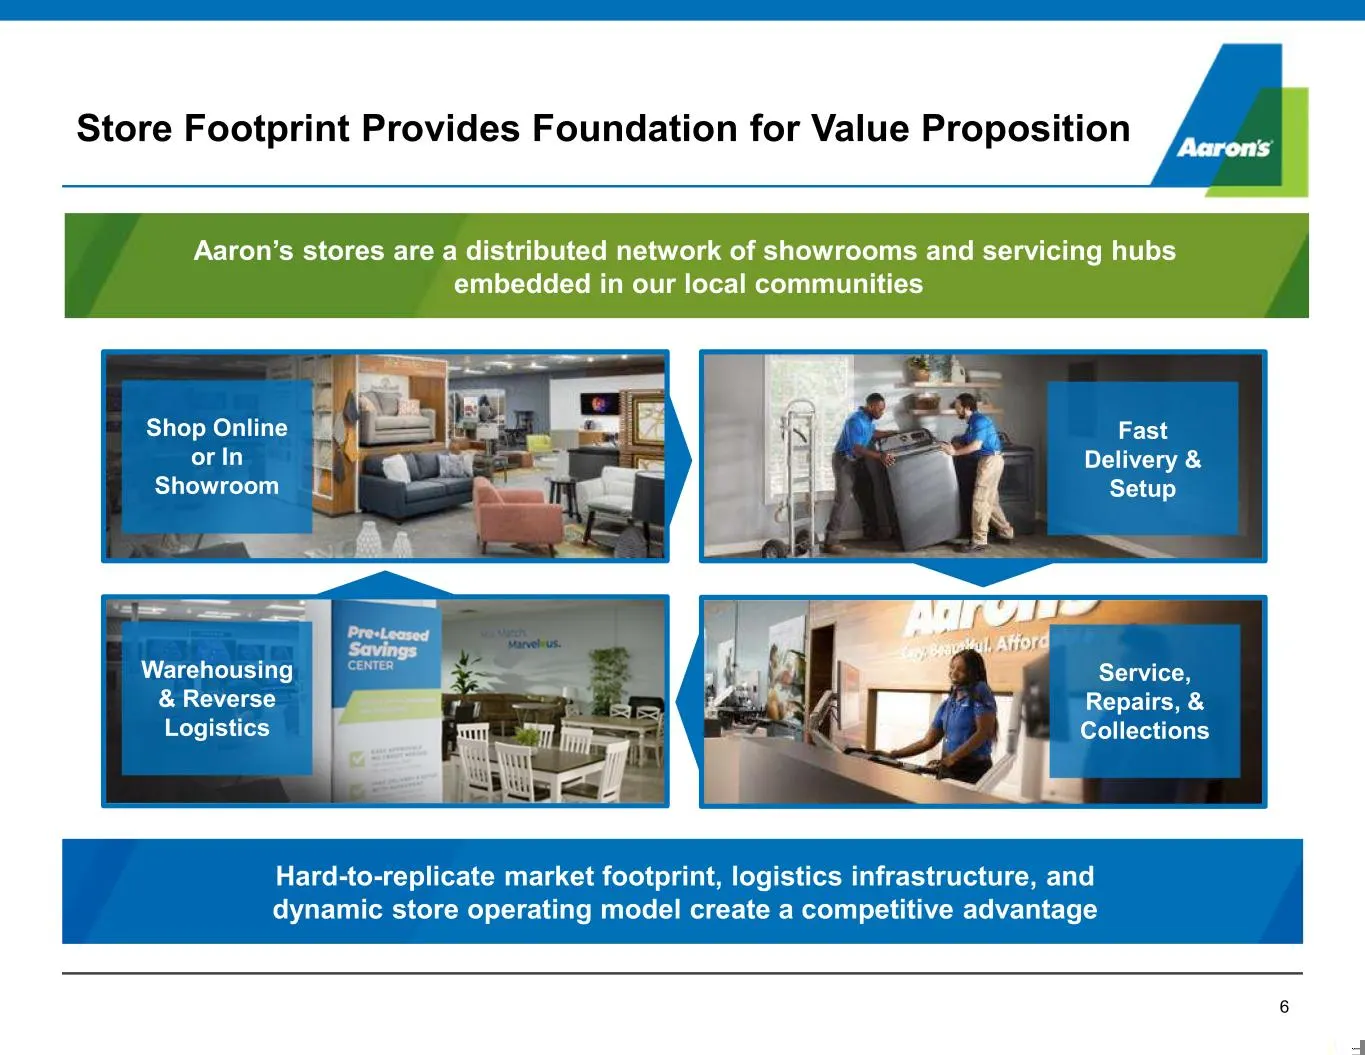
Slide 7: Store Footprint Provides Foundation for Value Proposition
. 6 Service, Repairs, & Collections Warehousing & Reverse Logistics Hard-to-replicate market footprint, logistics infrastructure, and dynamic store operating model create a competitive advantage Fast Delivery & Setup Shop Online or In Showroom Aaron’s stores are a distributed network of showrooms an
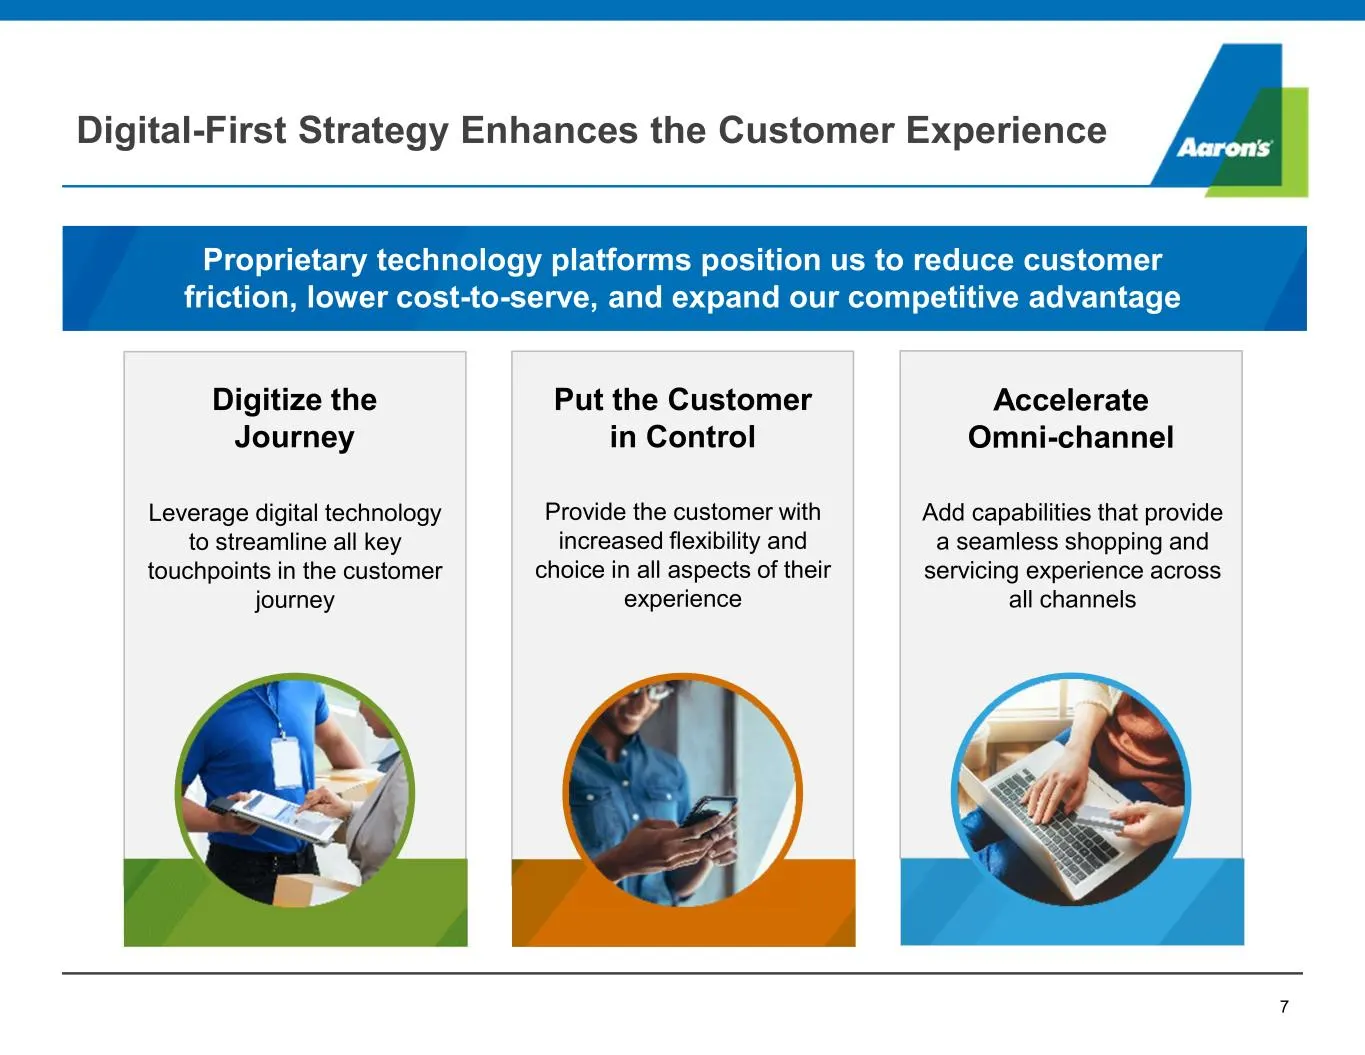
Slide 8: Digital-First Strategy Enhances the Customer Experience
. 7 Leverage digital technology to streamline all key touchpoints in the customer journey Digitize the Journey Put the Customer in Control Accelerate Omni-channel Provide the customer with increased flexibility and choice in all aspects of their experience Add capabilities that provide a seamless sh
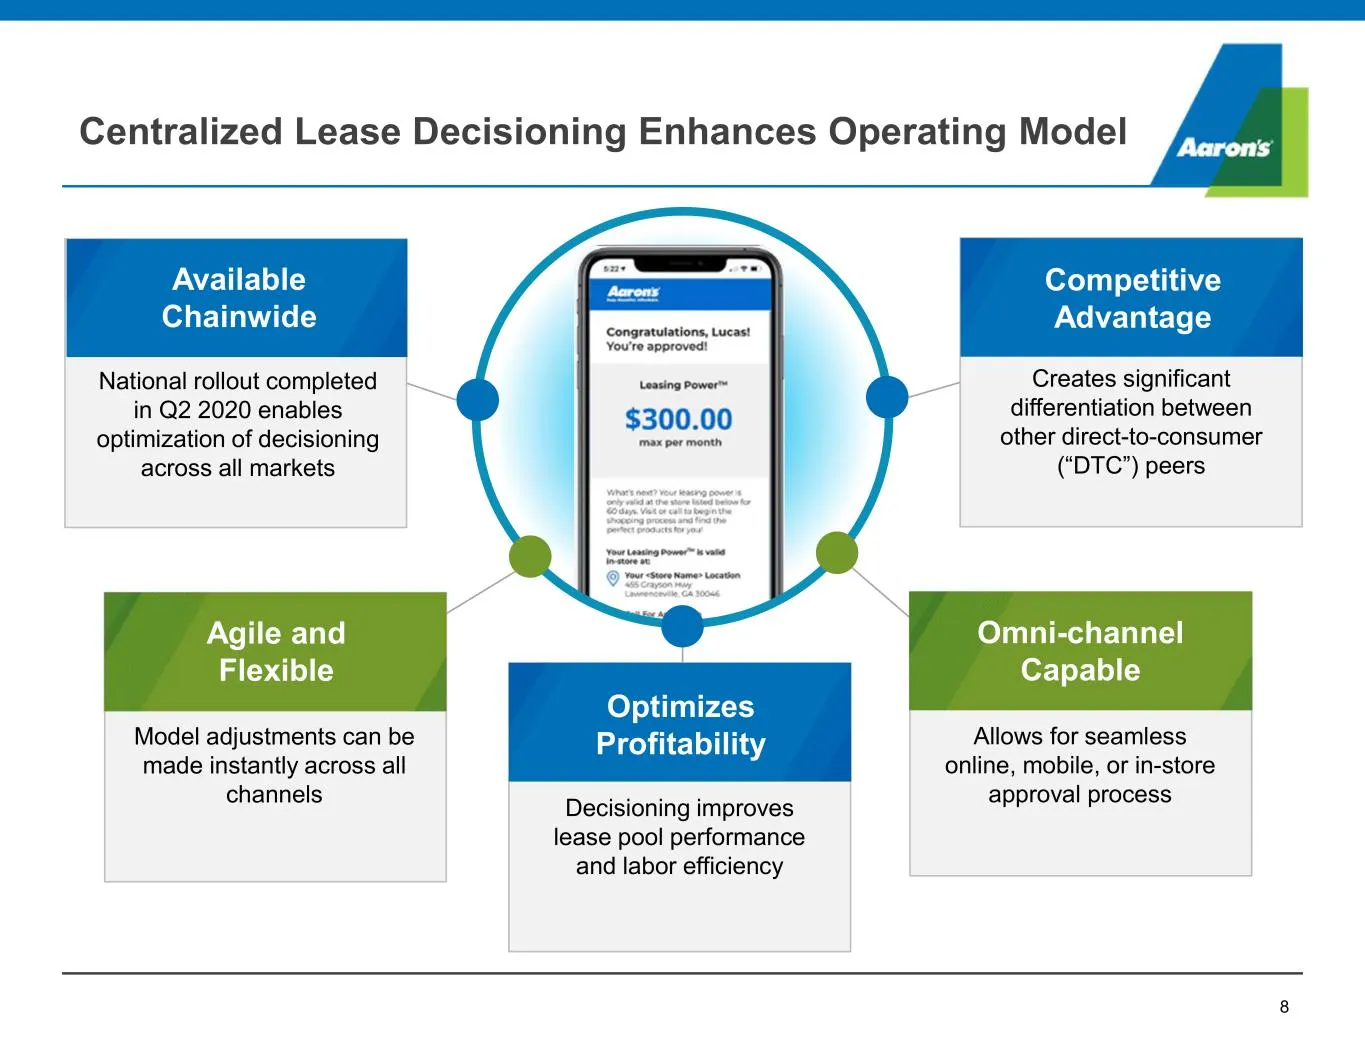
Slide 9: Centralized Lease Decisioning Enhances Operating Model
. Agile and Flexible 8 Decisioning improves lease pool performance and labor efficiency Model adjustments can be made instantly across all channels National rollout completed in Q2 2020 enables optimization of decisioning across all markets Creates significant differentiation between other direct-to
Slide 10: Aarons.com is an Industry Leading E-Commerce Platform
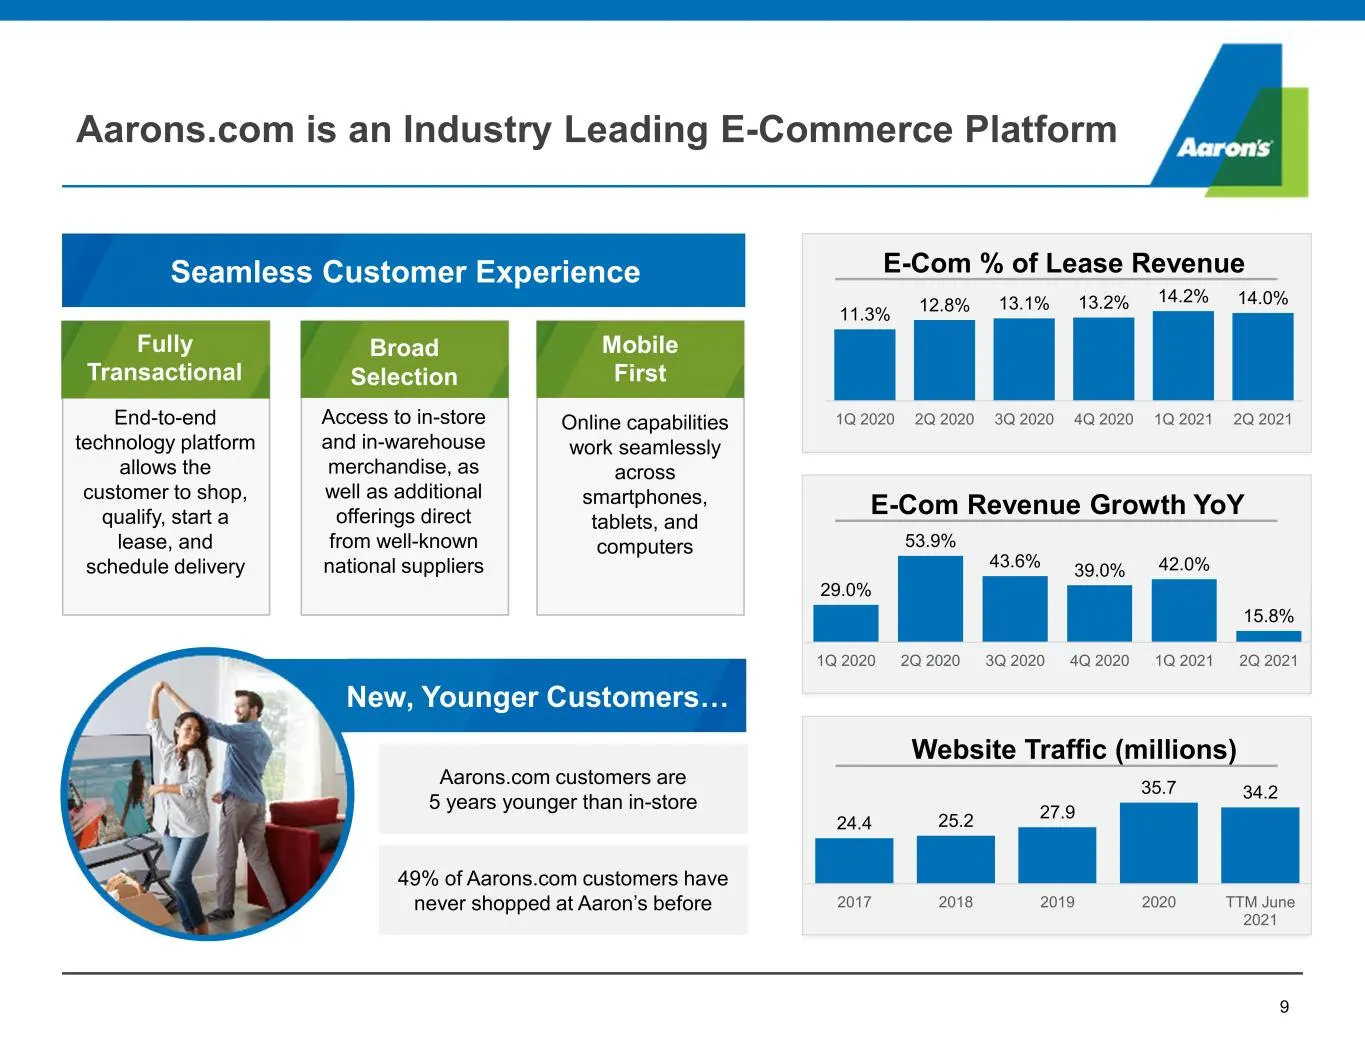
. Aarons.com is an Industry Leading E-Commerce Platform 9 New, Younger Customers… Aarons.com customers are 5 years younger than in-store 49% of Aarons.com customers have never shopped at Aaron’s before Seamless Customer Experience End-to-end technology platform allows the customer to shop, qualify,
Slide 11: New Concept Stores Improve Customer Experience
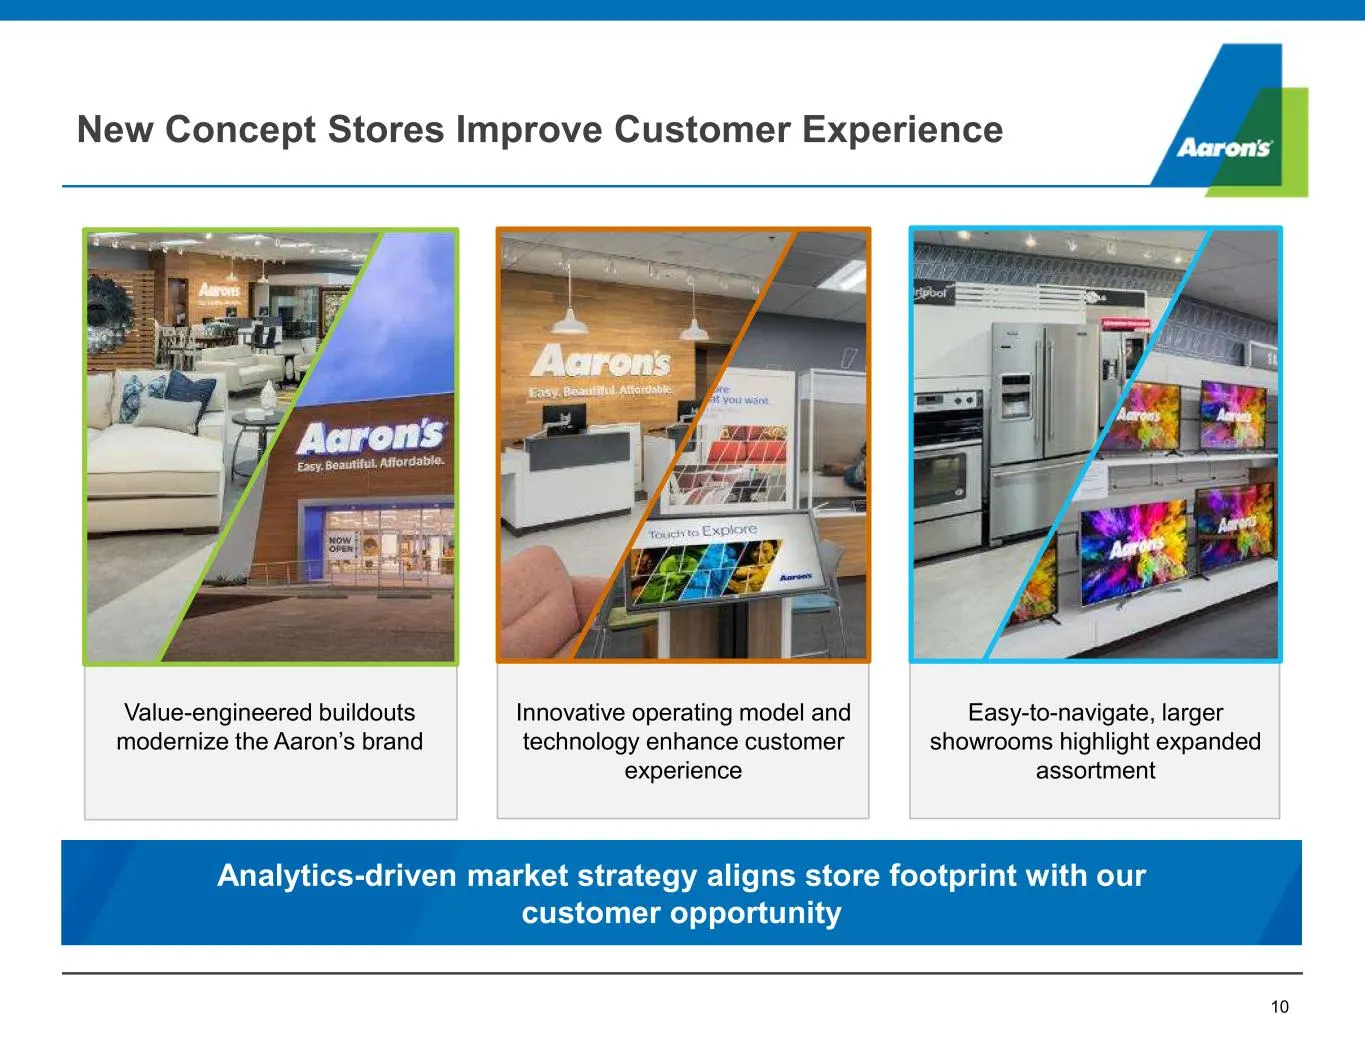
. 10 New Concept Stores Improve Customer Experience Easy-to-navigate, larger showrooms highlight expanded assortment Innovative operating model and technology enhance customer experience Value-engineered buildouts modernize the Aaron’s brand Analytics-driven market strategy aligns store footprint wi
Slide 12: Real Estate Strategy Leads to Fewer, More Profitable Stores
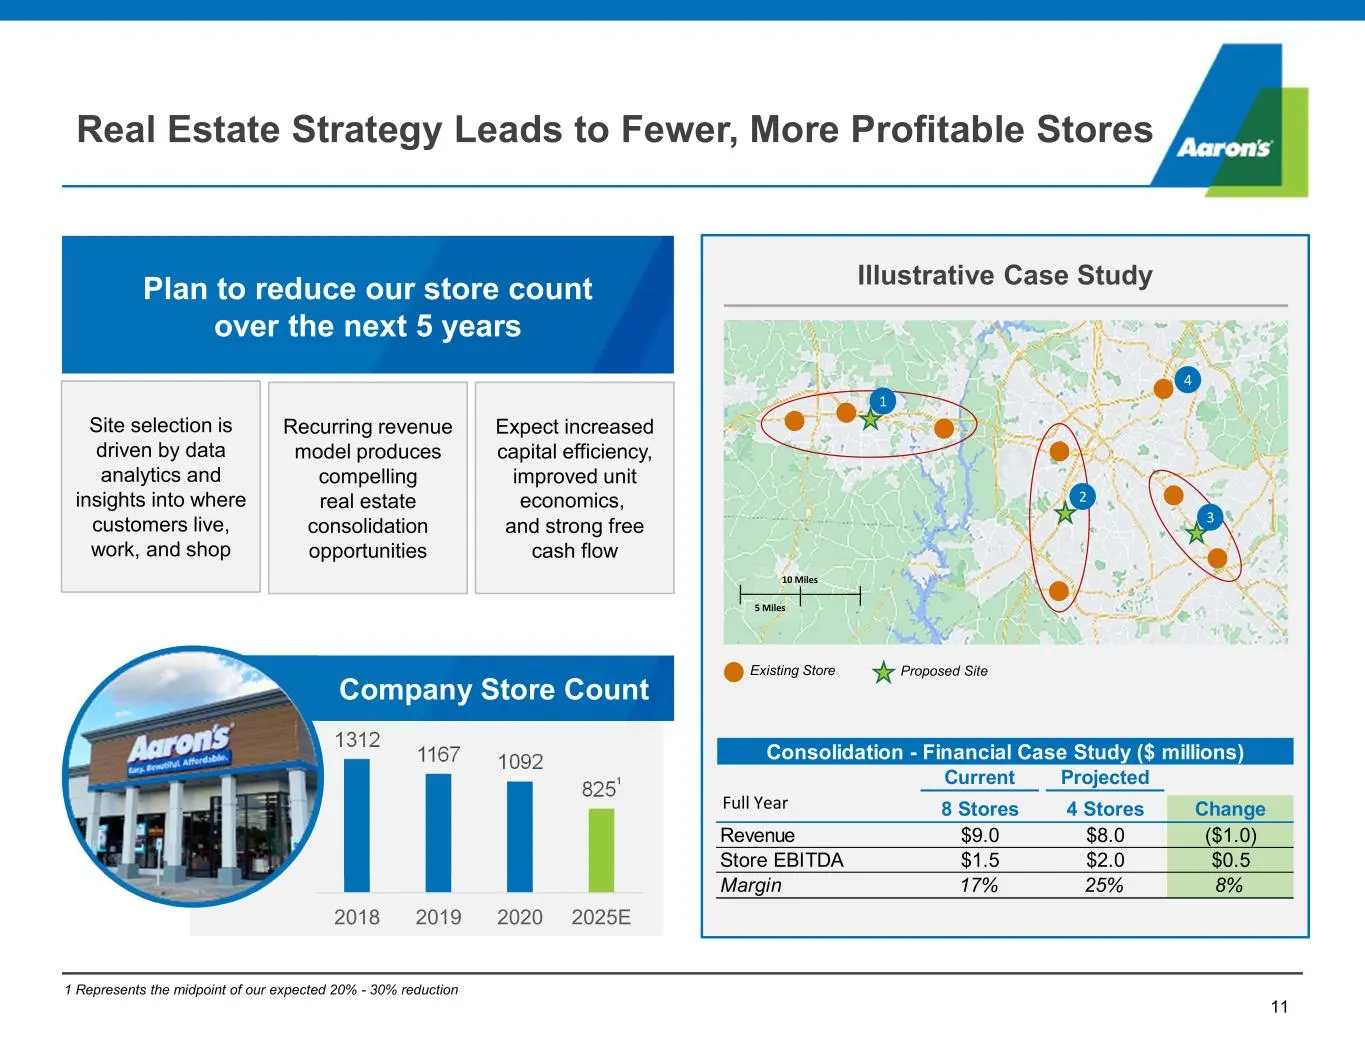
. 1312 1167 1092 825 1 2018 2019 2020 2025E Site selection is driven by data analytics and insights into where customers live, work, and shop Recurring revenue model produces compelling real estate consolidation opportunities 11 A A A A A A A A 1 2 3 4 Illustrative Case Study Proposed SiteExisting S
Slide 13: GenNext store projects
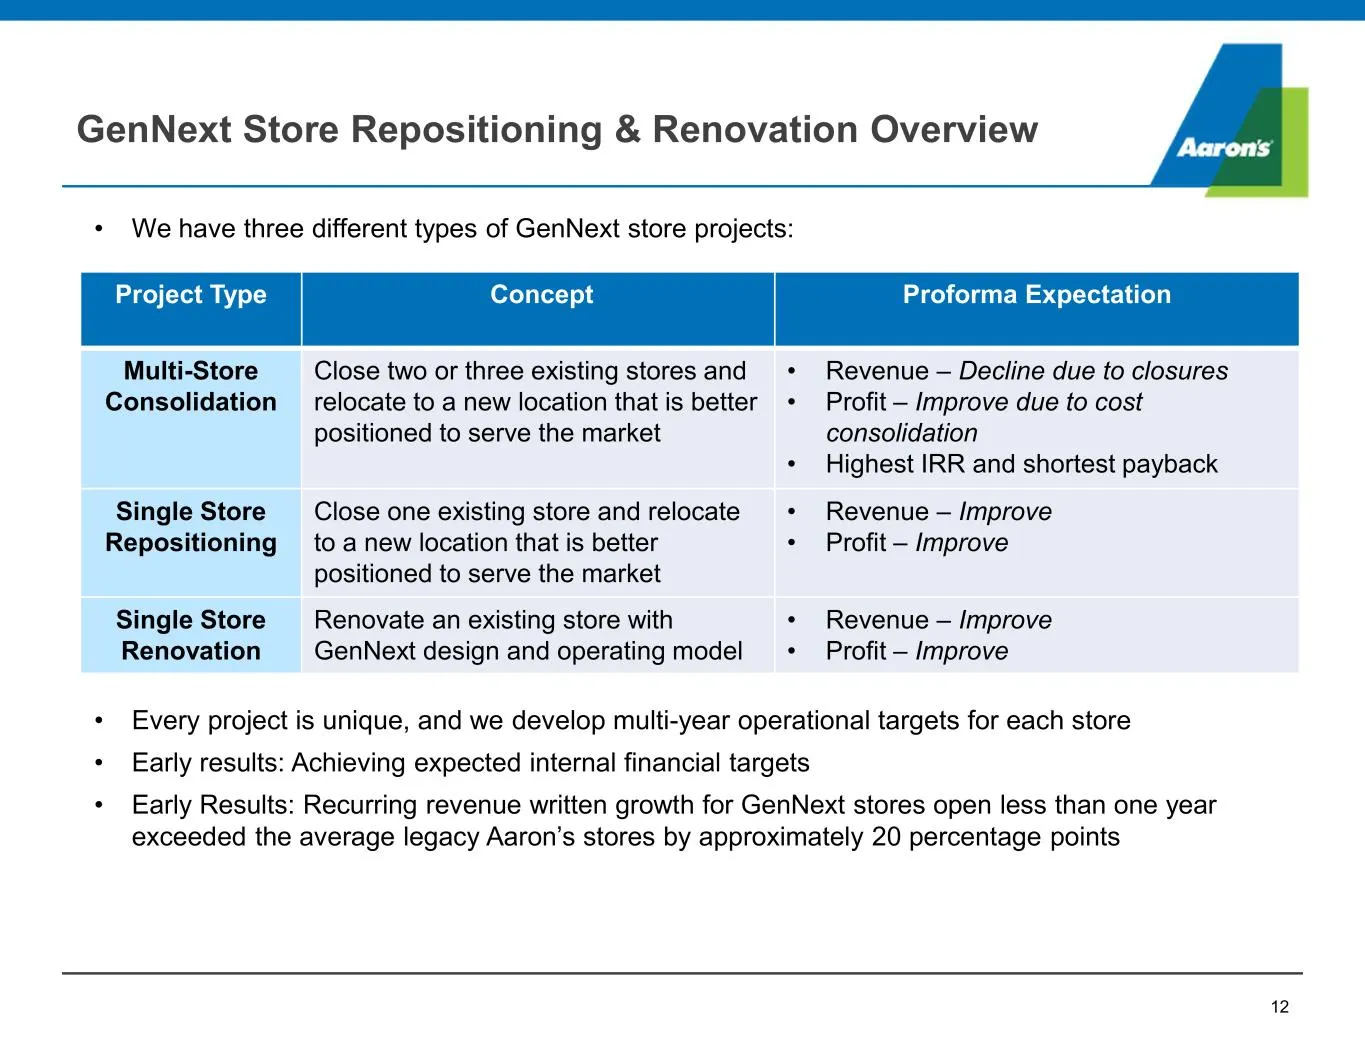
. • We have three different types of GenNext store projects: • Every project is unique, and we develop multi-year operational targets for each store • Early results: Achieving expected internal financial targets • Early Results: Recurring revenue written growth for GenNext stores open less than one
Slide 14: Historical Financial Performance
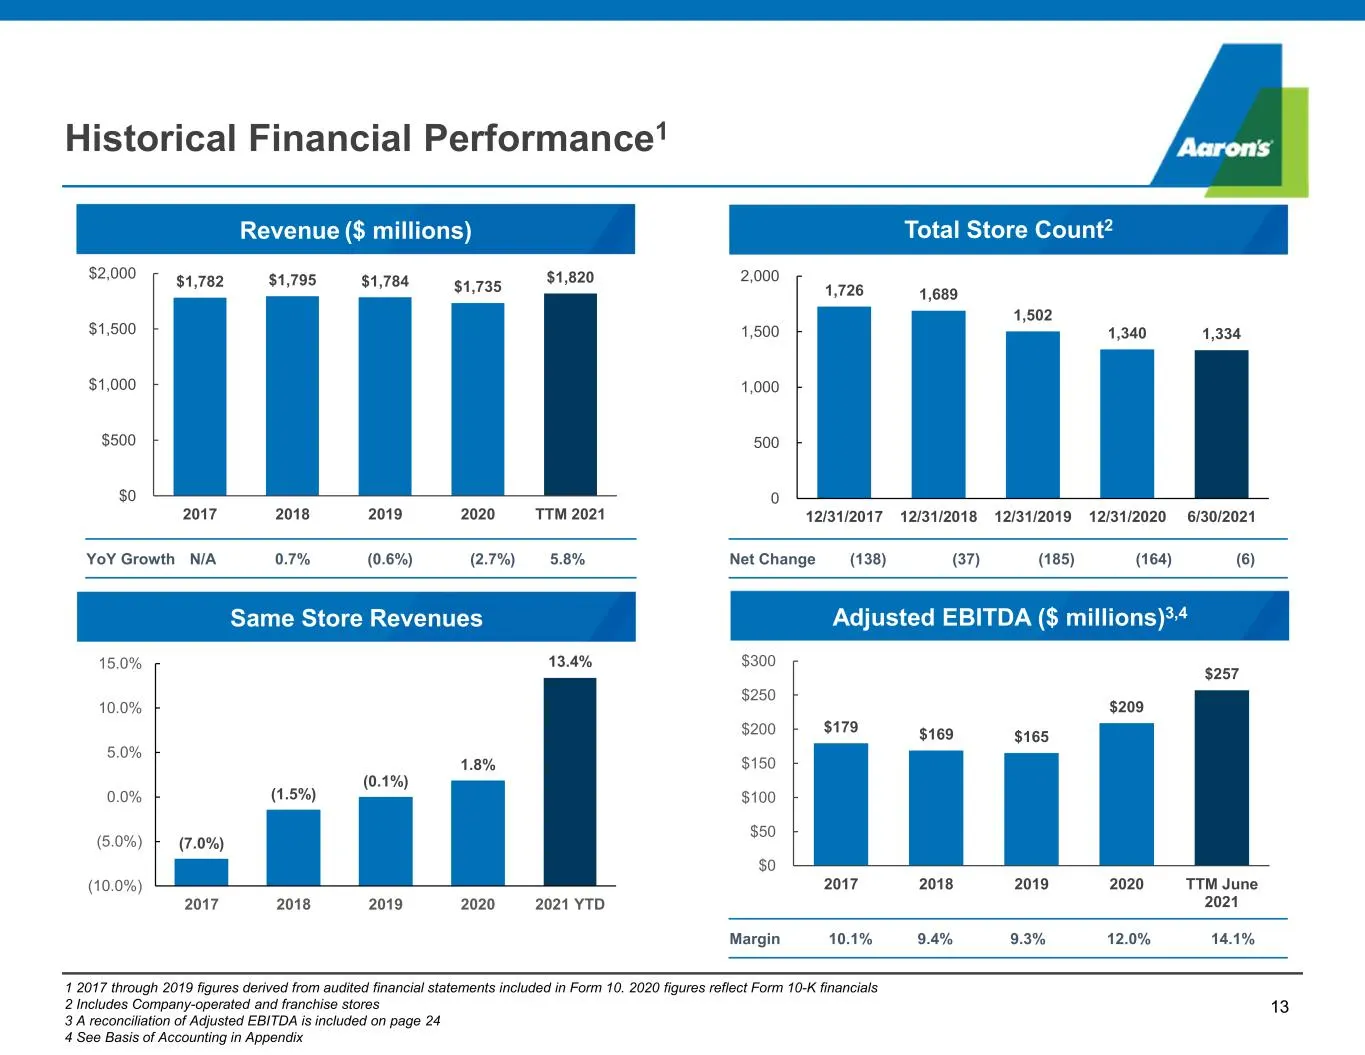
. YoY Growth N/A 0.7% (0.6%) (2.7%) 5.8% 13 Historical Financial Performance1 1 2017 through 2019 figures derived from audited financial statements included in Form 10. 2020 figures reflect Form 10-K financials 2 Includes Company-operated and franchise stores 3 A reconciliation of Adjusted EBITDA is
Slide 15: Q2 2021 Performance
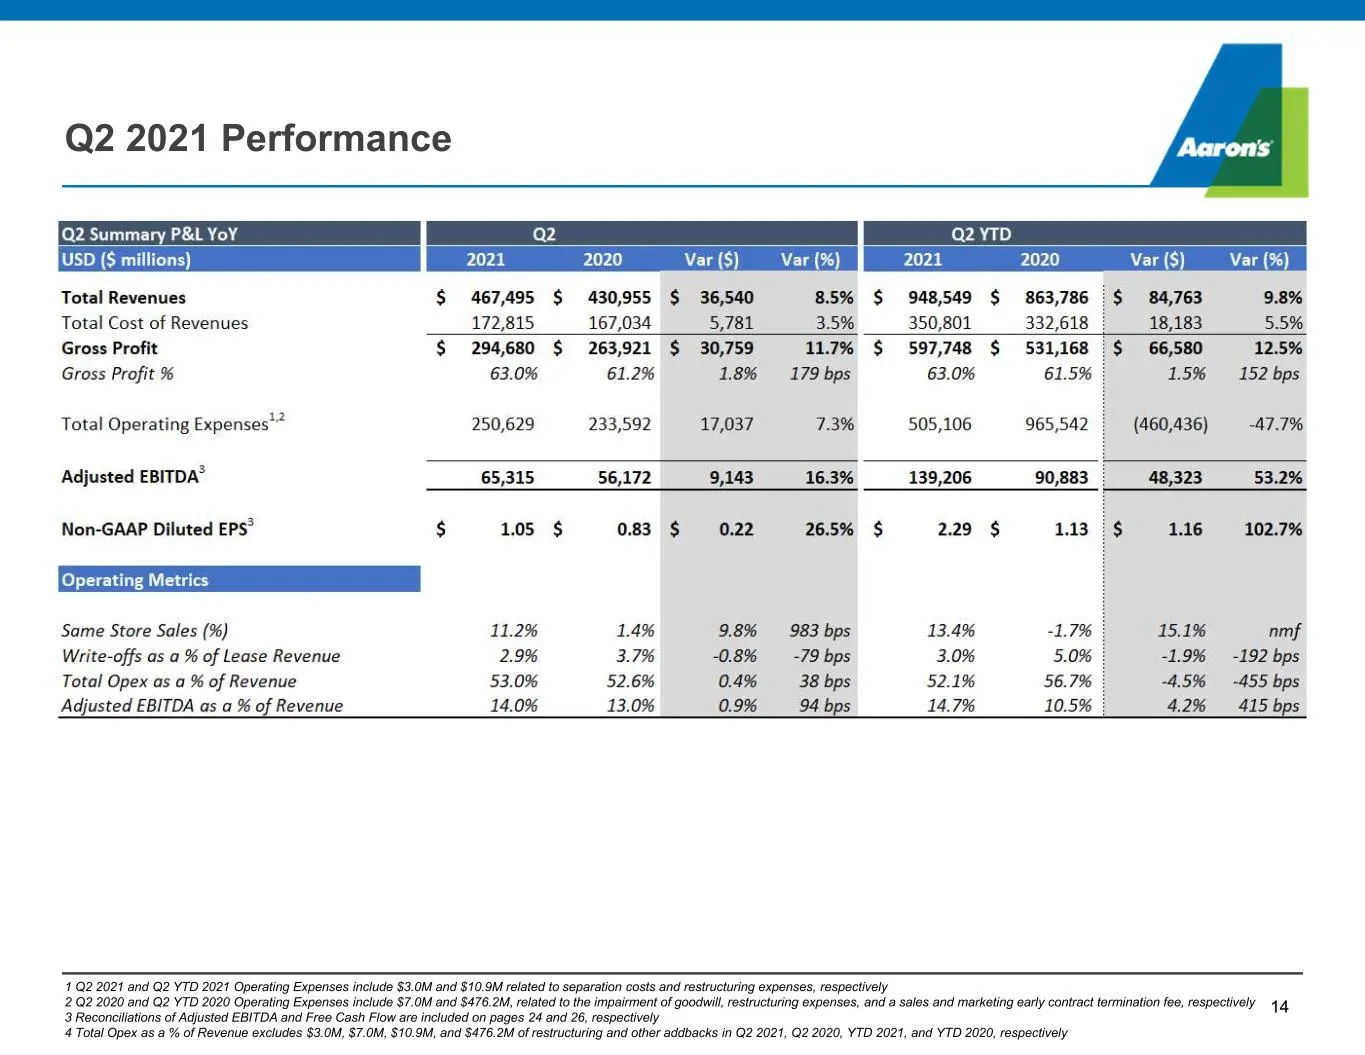
. 14 Q2 2021 Performance 1 Q2 2021 and Q2 YTD 2021 Operating Expenses include $3.0M and $10.9M related to separation costs and restructuring expenses, respectively 2 Q2 2020 and Q2 YTD 2020 Operating Expenses include $7.0M and $476.2M, related to the impairment of goodwill, restructuring expenses, a
Slide 16: Strong and Flexible Balance Sheet
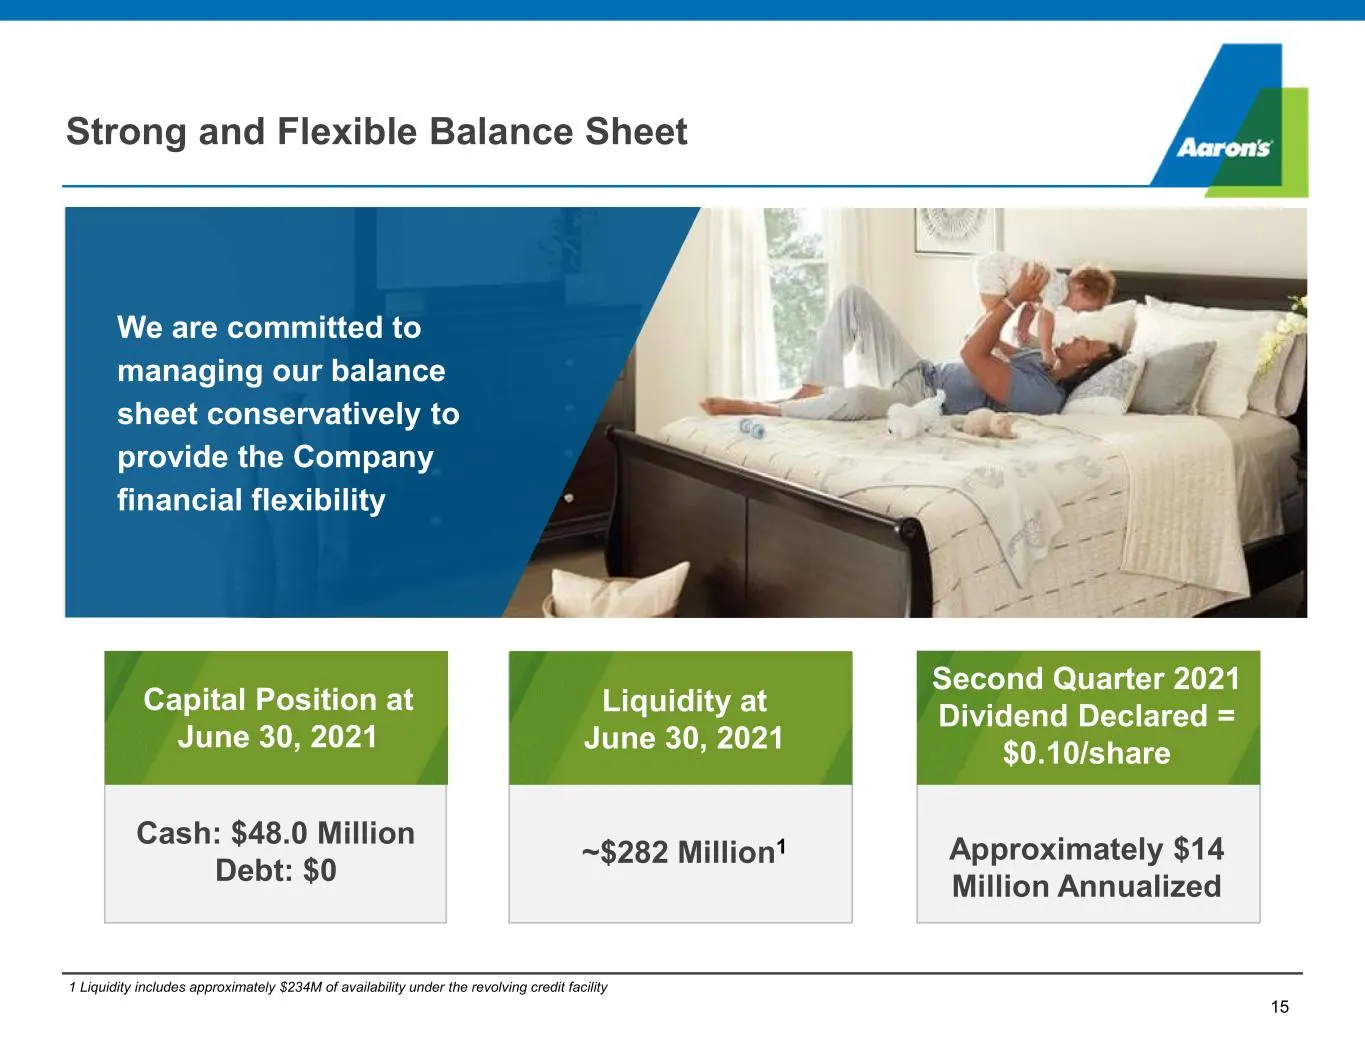
. Strong and Flexible Balance Sheet Liquidity at June 30, 2021 ~$282 Million1 Capital Position at June 30, 2021 Cash: $48.0 Million Debt: $0 1 Liquidity includes approximately $234M of availability under the revolving credit facility 15 Second Quarter 2021 Dividend Declared = $0.10/share Approximate
Slide 17: 2021 Outlook
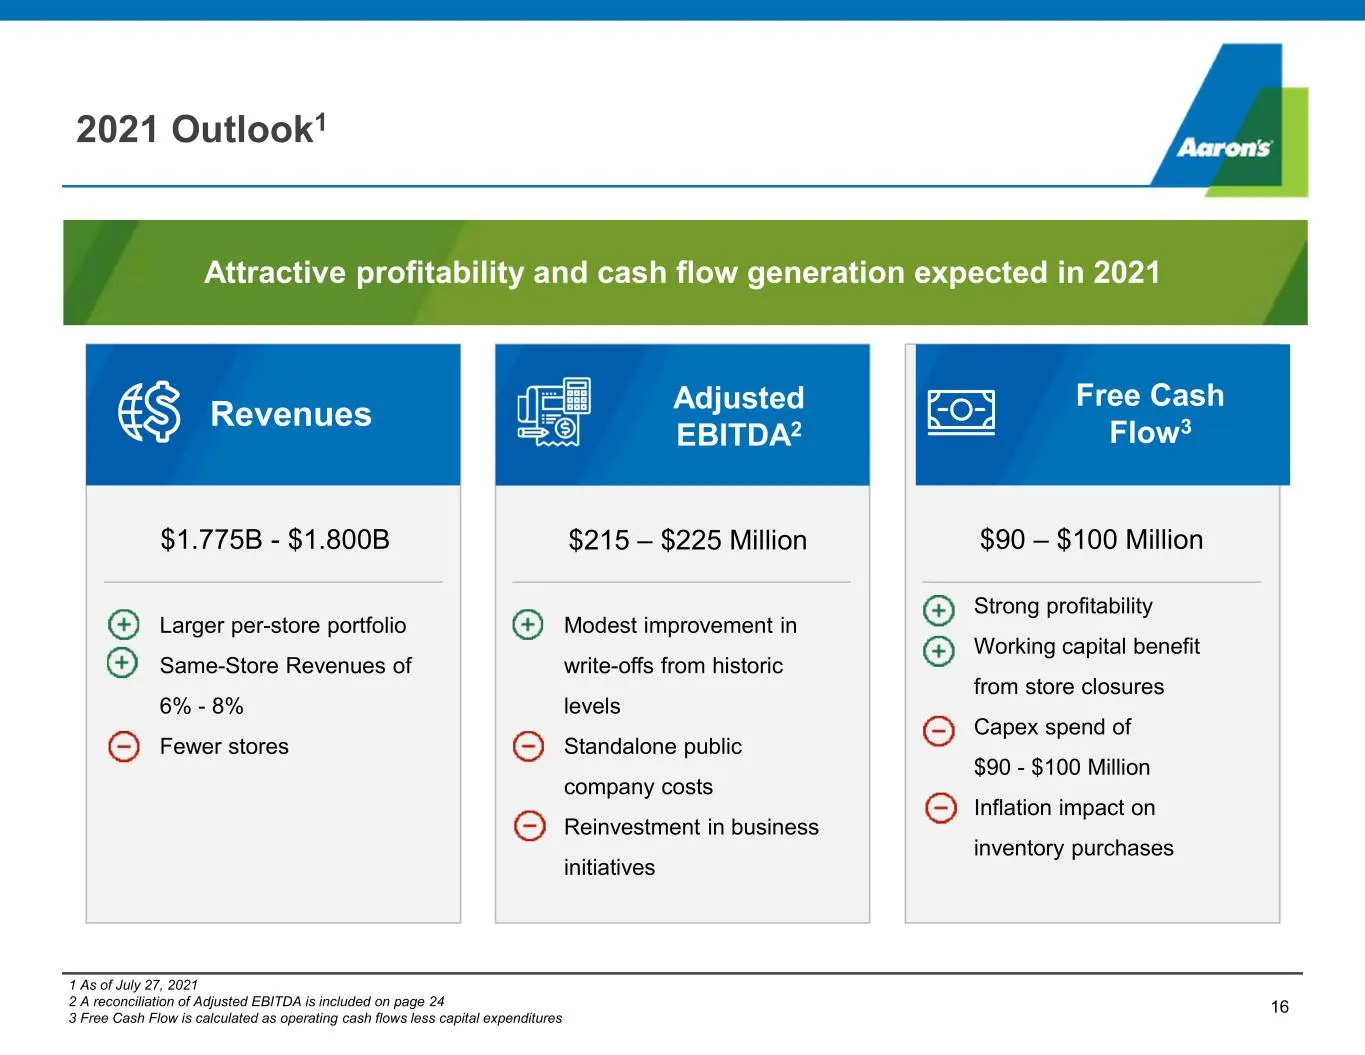
. • Larger per-store portfolio • Same-Store Revenues of 6% - 8% • Fewer stores • Modest improvement in write-offs from historic levels • Standalone public company costs • Reinvestment in business initiatives • Strong profitability • Working capital benefit from store closures • Capex spend of • $90
Slide 18: Commitment to Regulatory Compliance
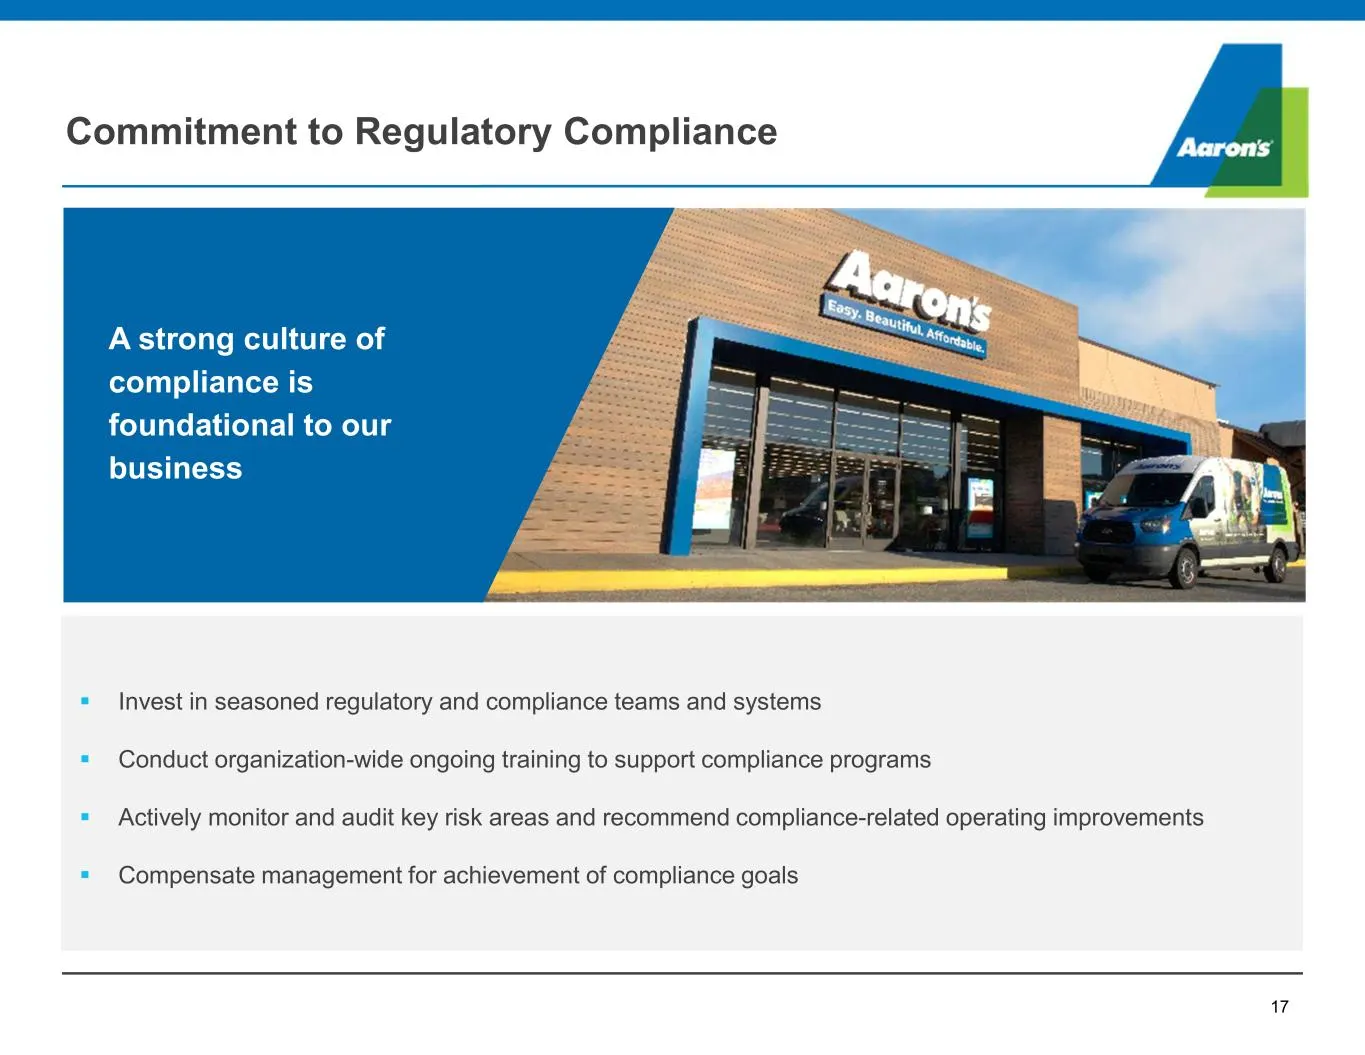
. A strong culture of compliance is foundational to our business Commitment to Regulatory Compliance 17 Invest in seasoned regulatory and compliance teams and systems Conduct organization-wide ongoing training to support compliance programs Actively monitor and audit key risk areas and recomme
Slide 19: Committed to the Environment, Our Communities, and Strong Corporate Governance
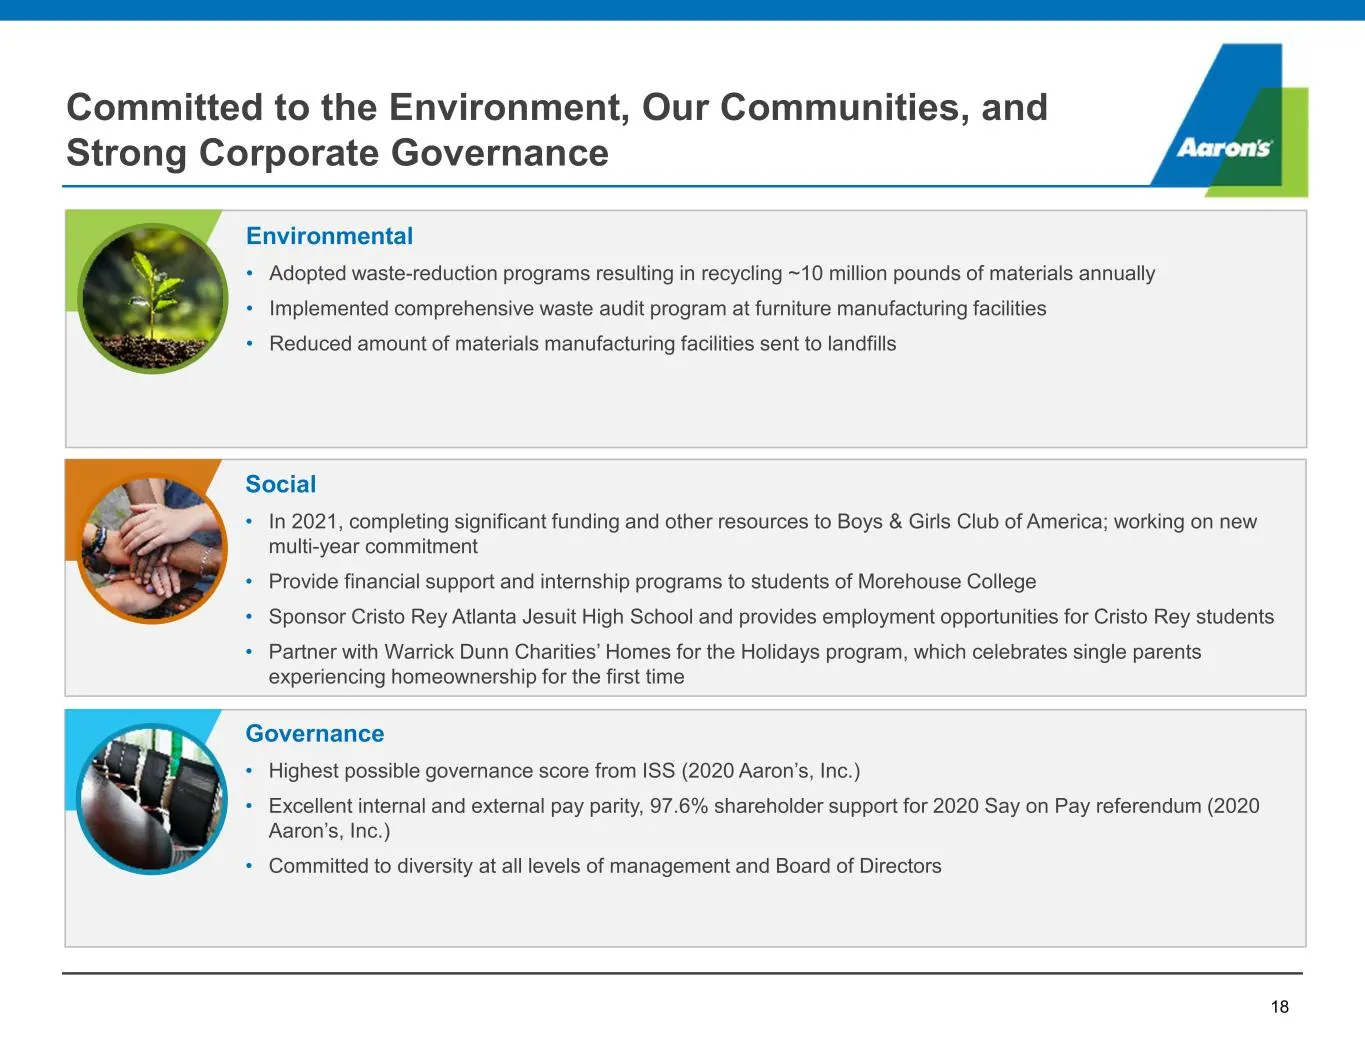
. Committed to the Environment, Our Communities, and Strong Corporate Governance 18 Environmental • Adopted waste-reduction programs resulting in recycling ~10 million pounds of materials annually • Implemented comprehensive waste audit program at furniture manufacturing facilities • Reduced amount

Slide 20: Thank You
Thank You
Slide 21: Appendix
Appendix
Slide 22: Non-GAAP Financial Information
. We report our financial results in accordance with accounting principles generally accepted in the United States (“GAAP”). We supplement the reporting of our financial information determined under GAAP with certain non-GAAP financial information. These non-GAAP financial measures, however, should
Slide 23: Non-GAAP Measures Definitions
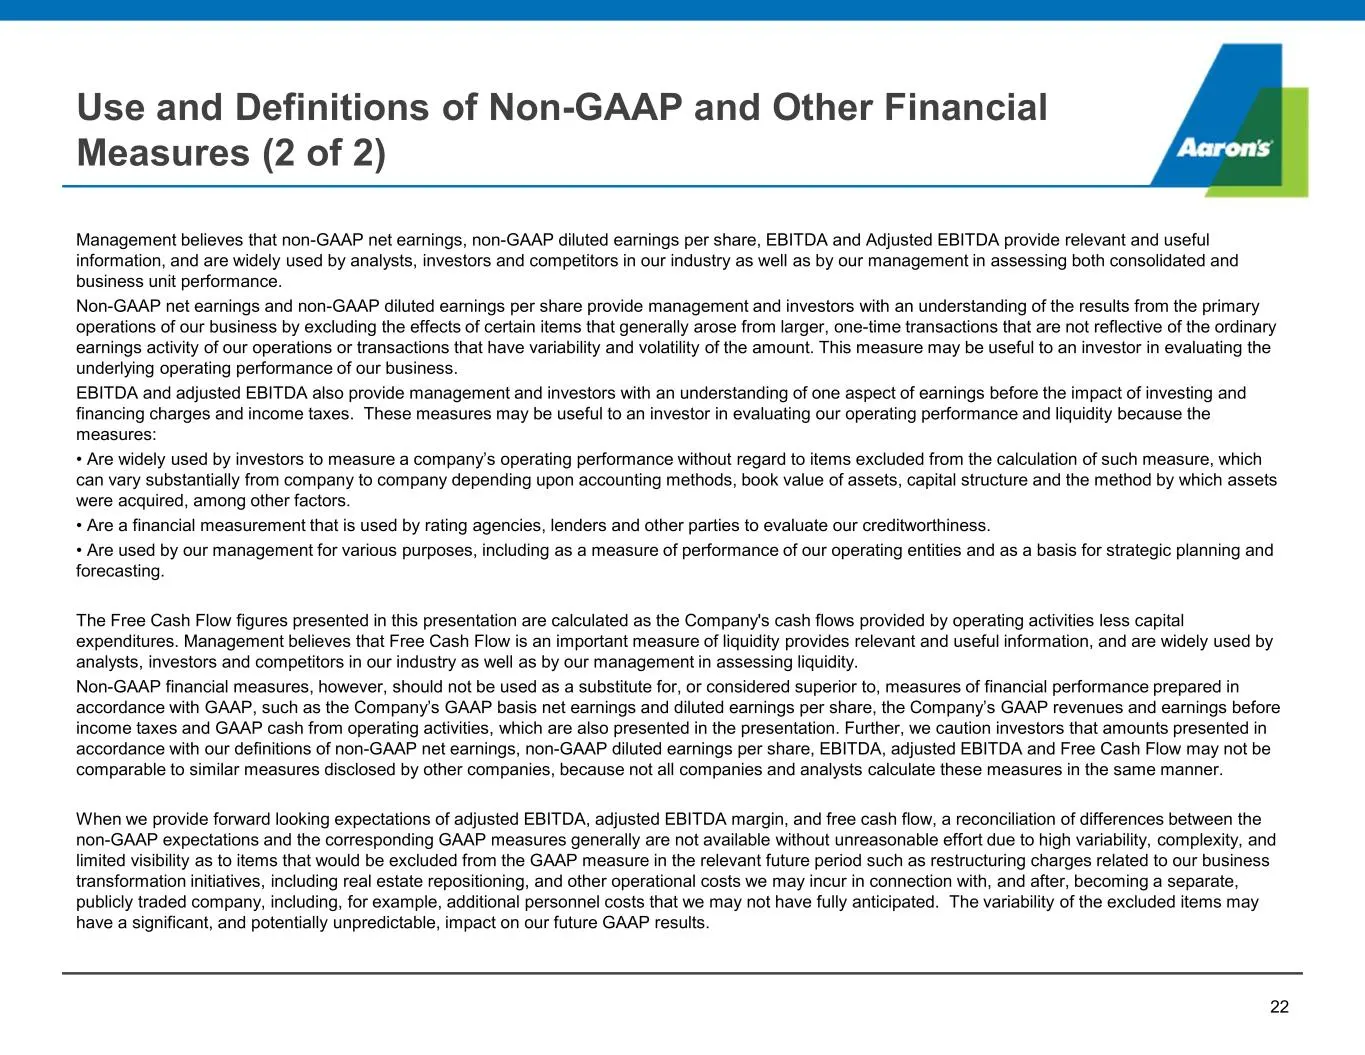
. Management believes that non-GAAP net earnings, non-GAAP diluted earnings per share, EBITDA and Adjusted EBITDA provide relevant and useful information, and are widely used by analysts, investors and competitors in our industry as well as by our management in assessing both consolidated and busine
Slide 24: Basis of Accounting
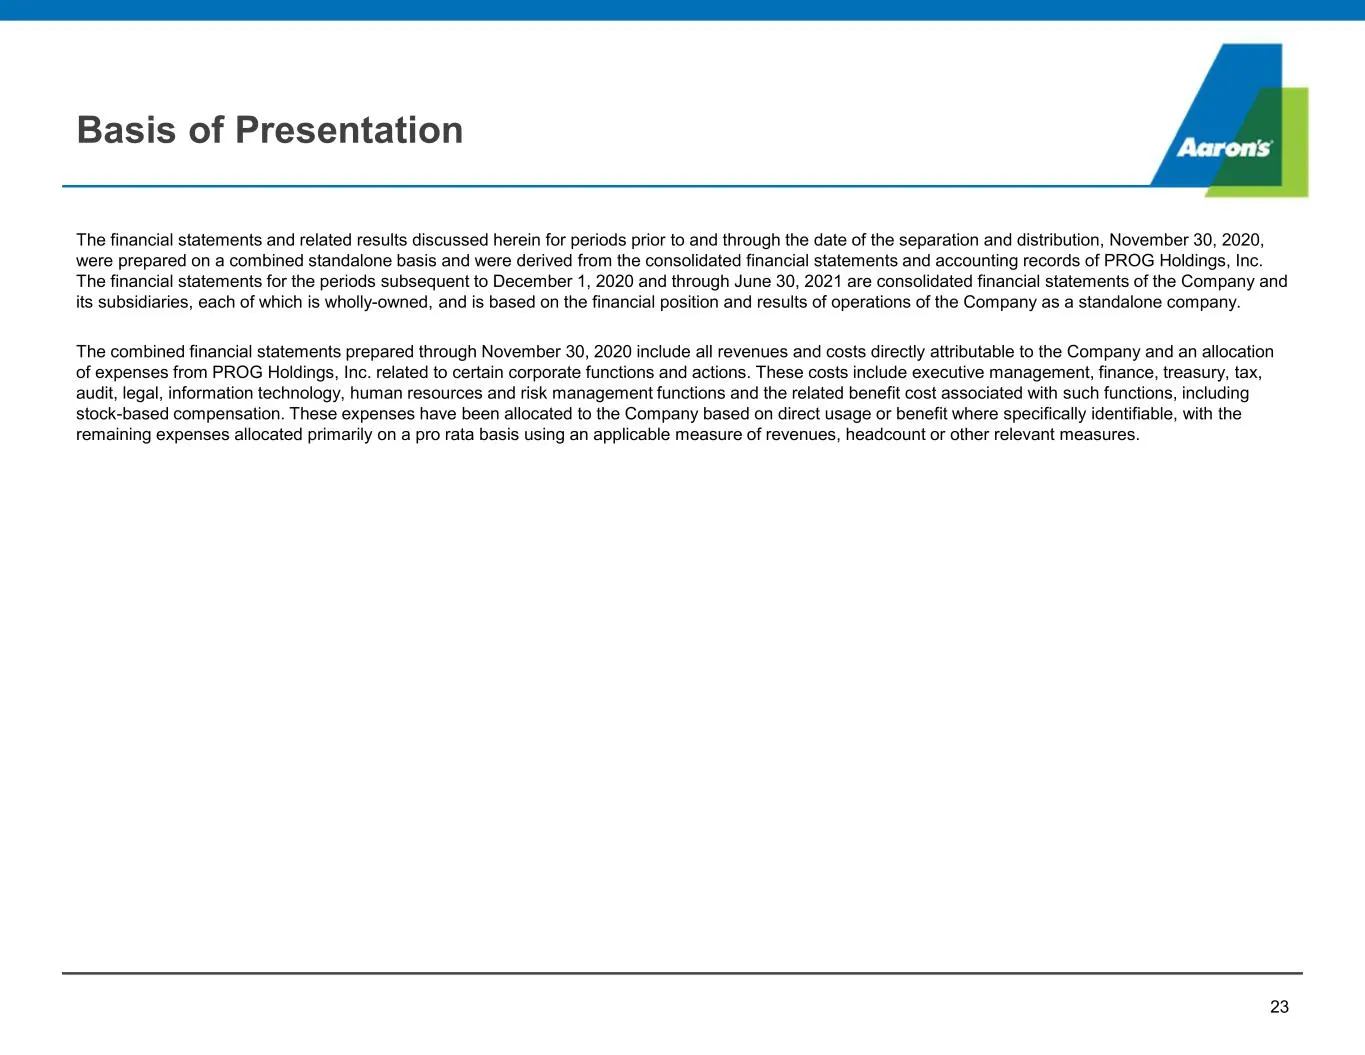
. The financial statements and related results discussed herein for periods prior to and through the date of the separation and distribution, November 30, 2020, were prepared on a combined standalone basis and were derived from the consolidated financial statements and accounting records of PROG Hol
Slide 25: Reconciliation to Adjusted EBITDA
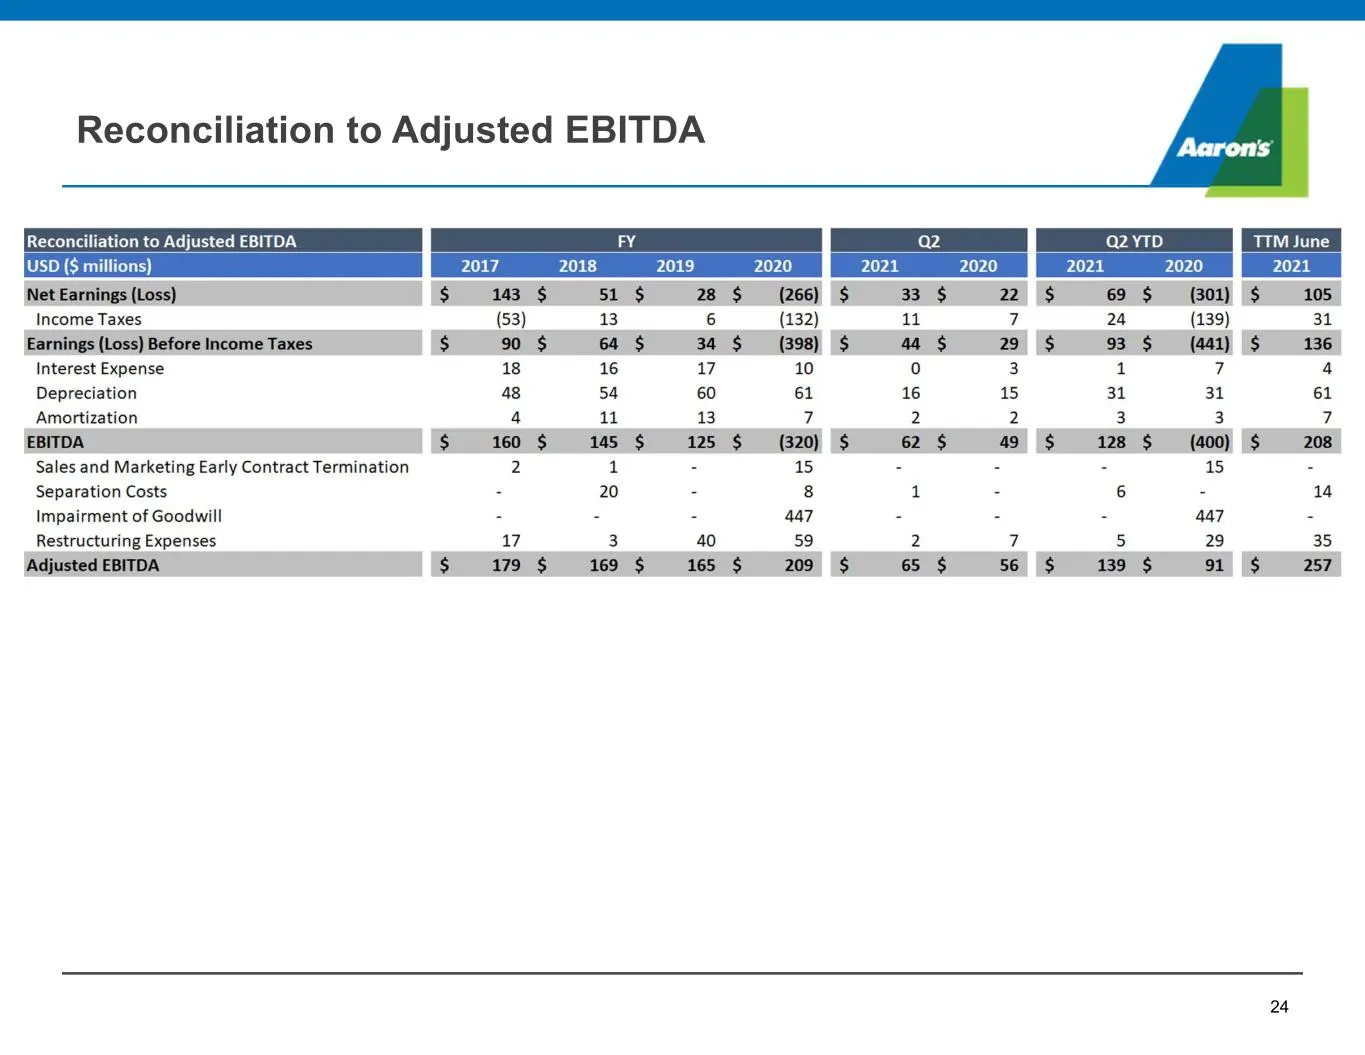
. Reconciliation to Adjusted EBITDA 24
Slide 26: Reconciliation of 2021 Current Outlook Projected
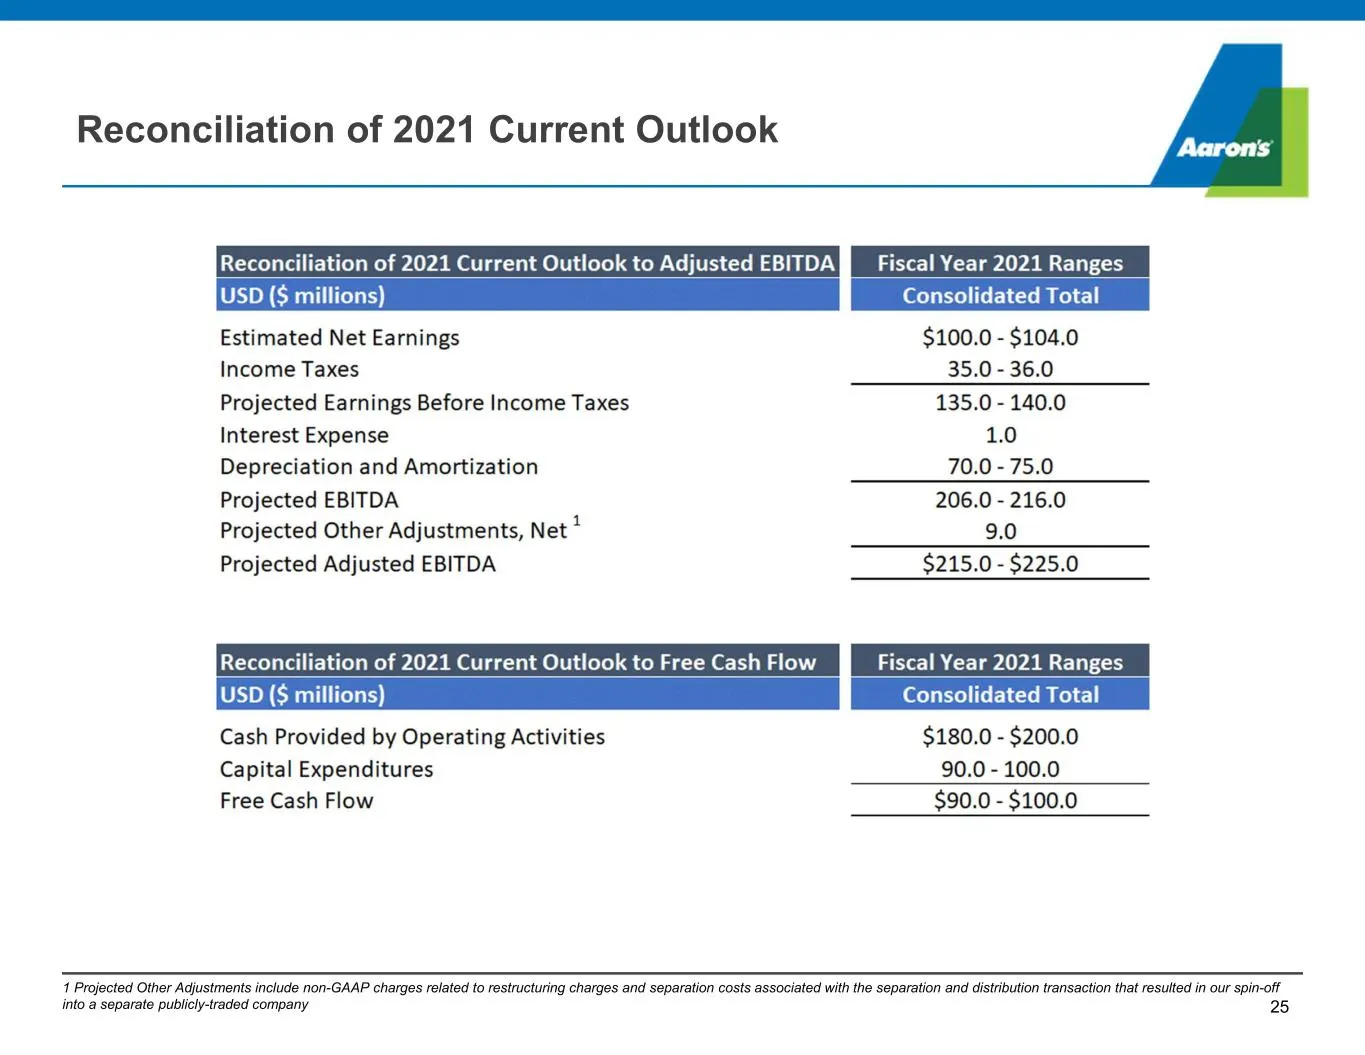
. Reconciliation of 2021 Current Outlook 25 1 Projected Other Adjustments include non-GAAP charges related to restructuring charges and separation costs associated with the separation and distribution transaction that resulted in our spin-off into a separate publicly-traded company
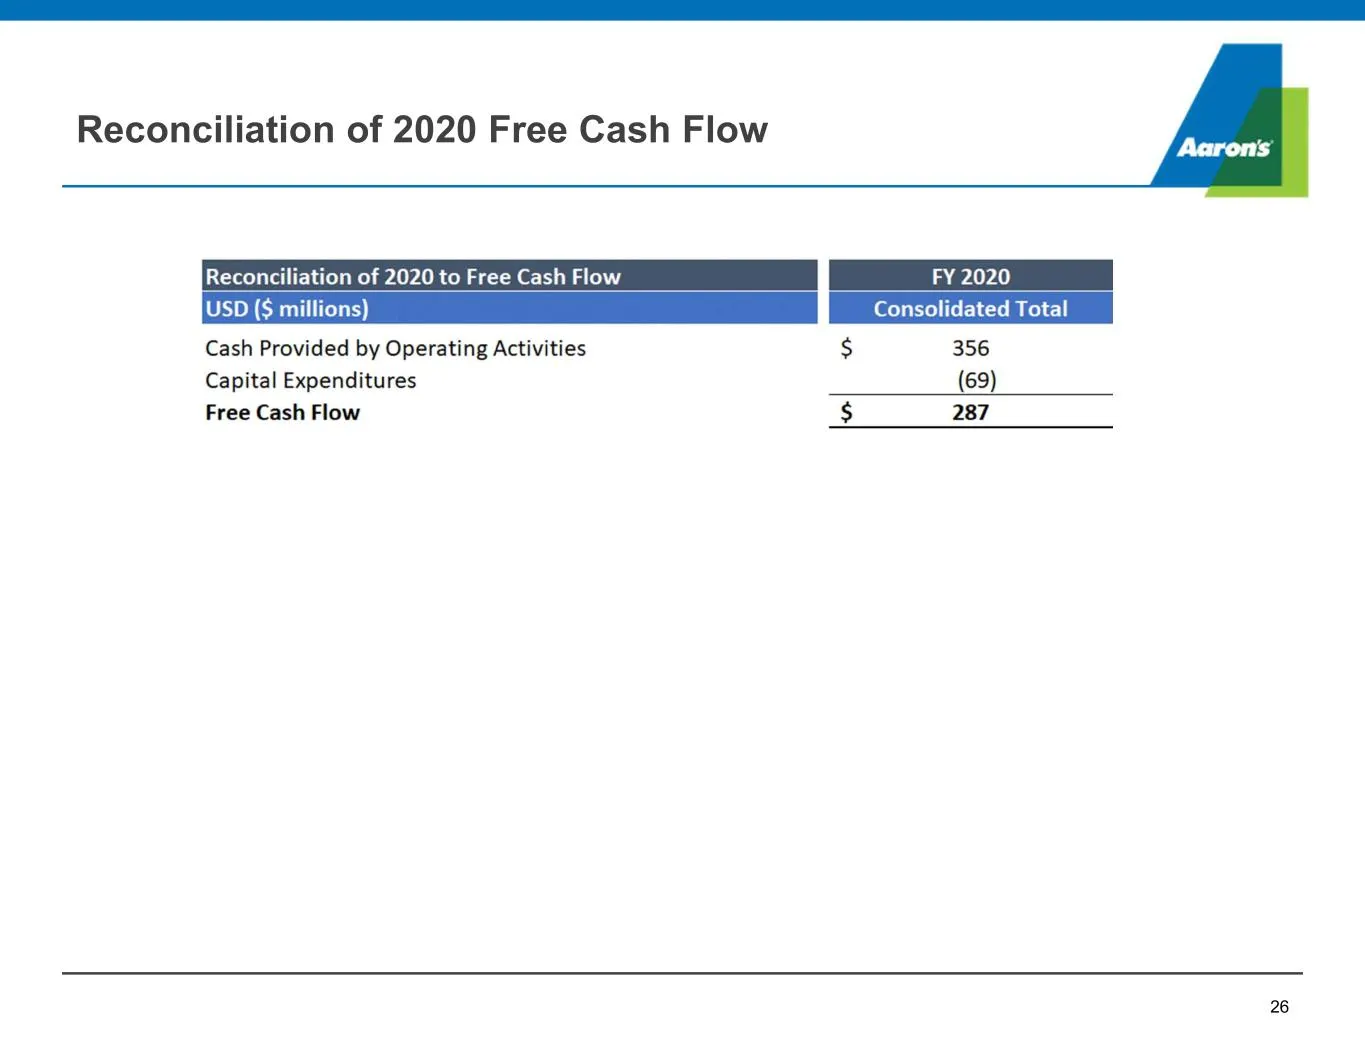
Slide 27: Reconciliation of 2020 Free Cash Flow
. Reconciliation of 2020 Free Cash Flow 26
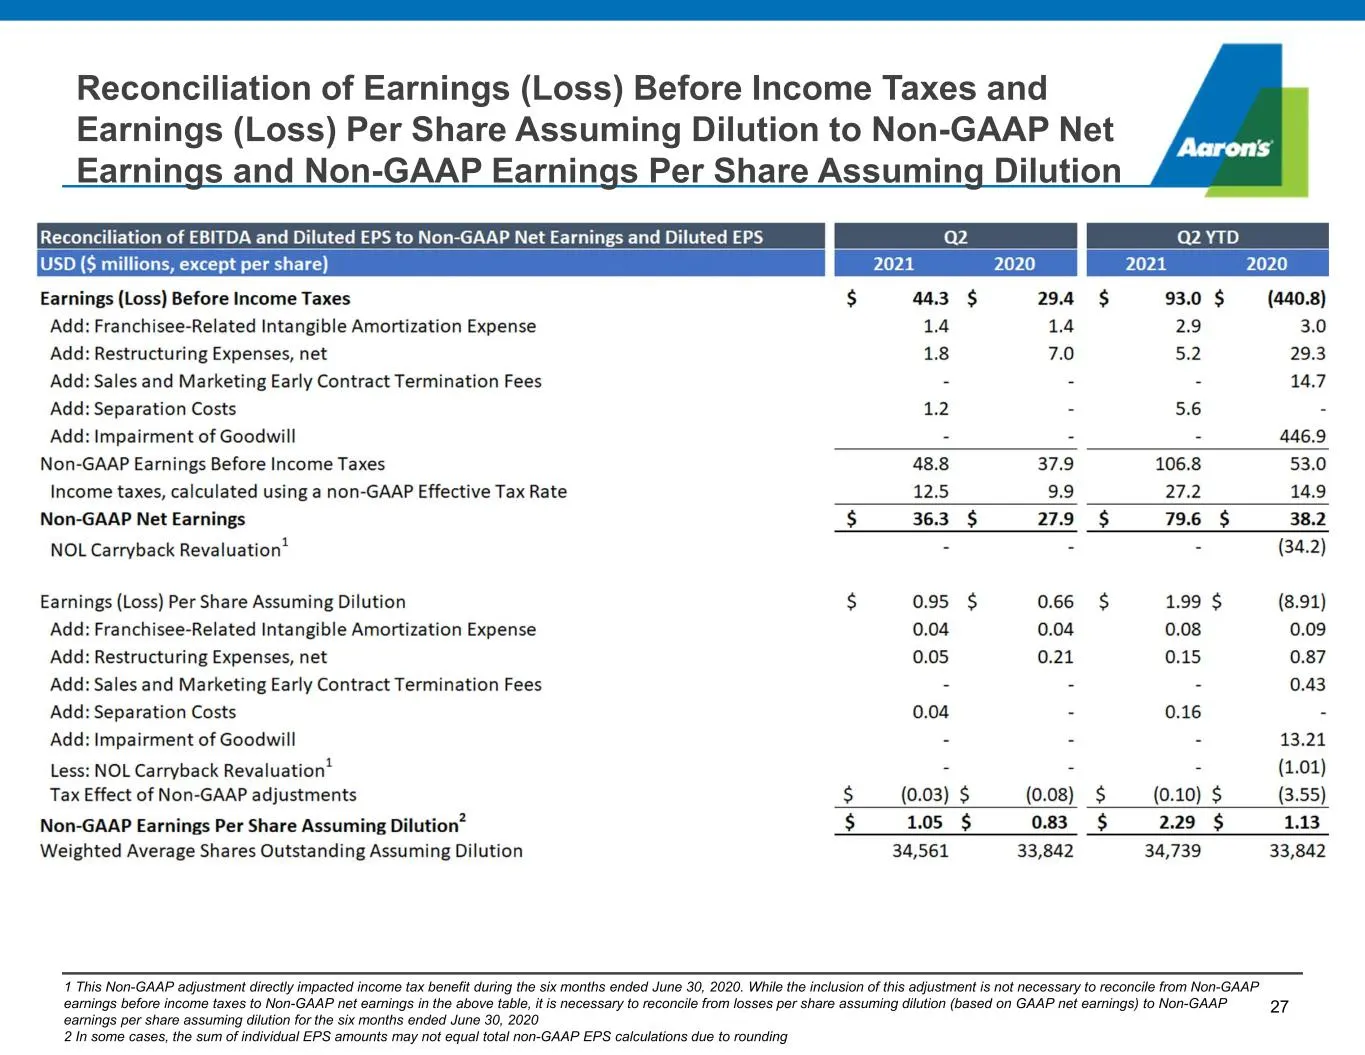
Slide 28: Reconciliation of Earnings (Loss) Before Income Taxes to Non-GAAP Net Earnings
. 27 Reconciliation of Earnings (Loss) Before Income Taxes and Earnings (Loss) Per Share Assuming Dilution to Non-GAAP Net Earnings and Non-GAAP Earnings Per Share Assuming Dilution 1 This Non-GAAP adjustment directly impacted income tax benefit during the six months ended June 30, 2020. While the i
Source: SEC EDGAR · 8-K filed Jul 27, 2021
More decks from The Aaron's Company Inc.
 Q1 2024 Earnings Presentation26 slides · May 6, 2024
 Aaron's Company — FY2023 Earnings Presentation32 slides · Feb 26, 2024
 Q4 2023 Earnings Presentation32 slides · Feb 26, 2024
 Q3 2023 Earnings Presentation23 slides · Oct 23, 2023
 Aaron's Company — Q2 2023 Earnings Presentation23 slides · Jul 31, 2023
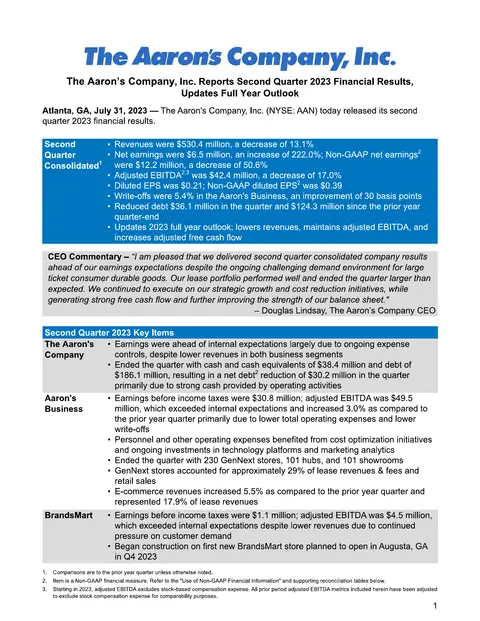 Q2 2023 Earnings Presentation19 slides · Jul 31, 2023