Hudson City Bancorp — Investor Presentation (February 2009)
30 slides from Hudson City Bancorp's investor presentation, Feb 9, 2009
Slide 1: Growth, Efficiency, Financial Strength, Asset Quality
growth efficiency financial strength asset quality
Slide 2: Forward-Looking Statements
Forward-Looking Statements This presentation may contain forward-looking statements within the meaning of the Private Securities Litigation Reform Act of 1995. These forward-looking statements include, but are not limited to, statements about (i) Hudson City Bancorp, Inc.'s ("Hudson City" or "HCBK")
Slide 3: Overview
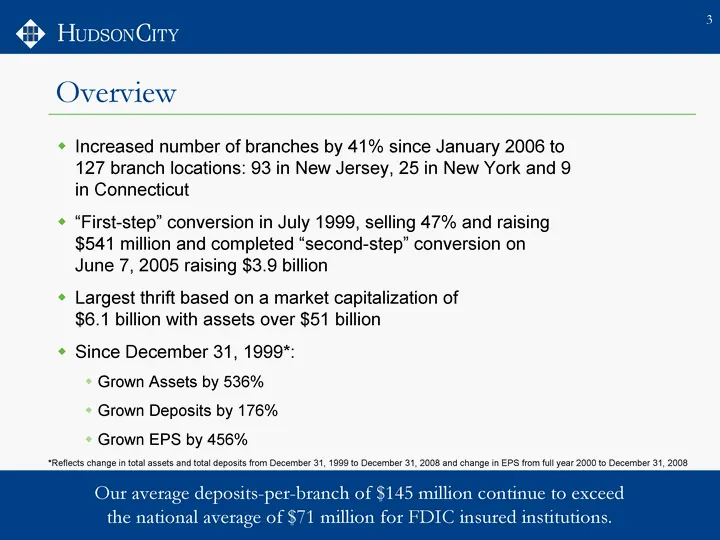
Our average deposits-per-branch of $145 million continue to exceed the national average of $71 million for FDIC insured institutions. Increased number of branches by 41% since January 2006 to 127 branch locations: 93 in New Jersey, 25 in New York and 9 in Connecticut "First-step" conversion in July
Slide 4: Simple, Consistent Operating Model
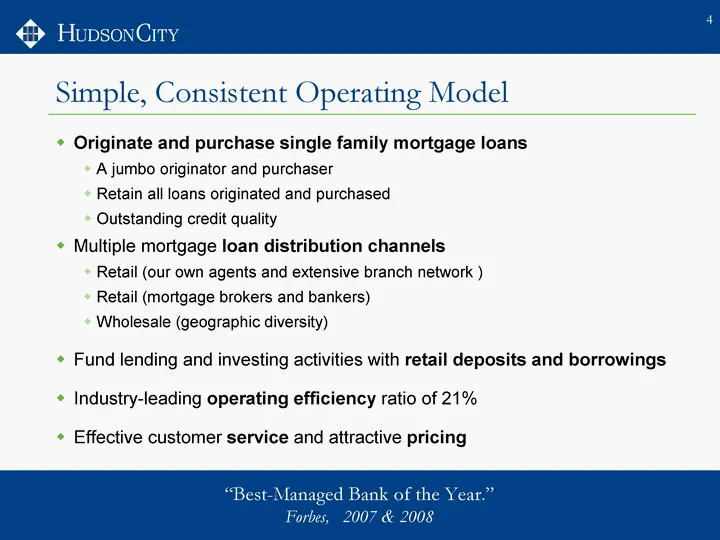
"Best-Managed Bank of the Year." Forbes, 2007 & 2008 Simple, Consistent Operating Model Originate and purchase single family mortgage loans A jumbo originator and purchaser Retain all loans originated and purchased Outstanding credit quality Multiple mortgage loan distribution channels Retail (our o

Slide 5: Growth
growth
Slide 6: More than 20% compounded annual asset growth
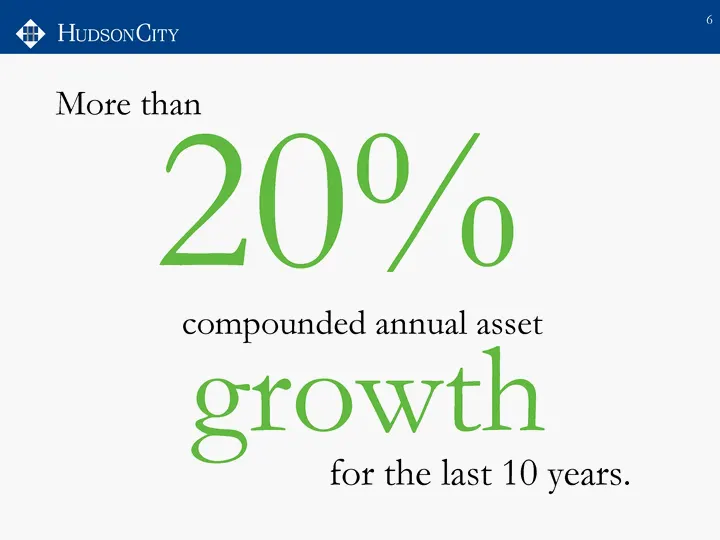
More than 20% compounded annual asset growth for the last 10 years.
Slide 7: Strong Asset Growth
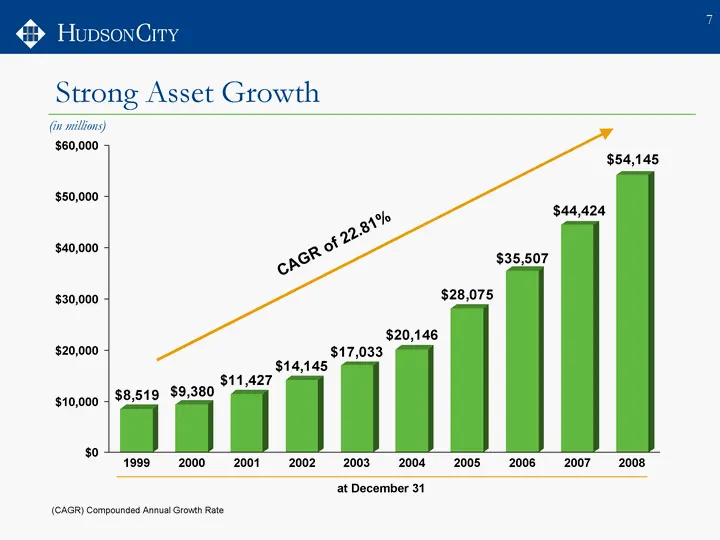
Strong Asset Growth (in millions) (CAGR) Compounded Annual Growth Rate
Slide 8: Residential Mortgage Lending Growth
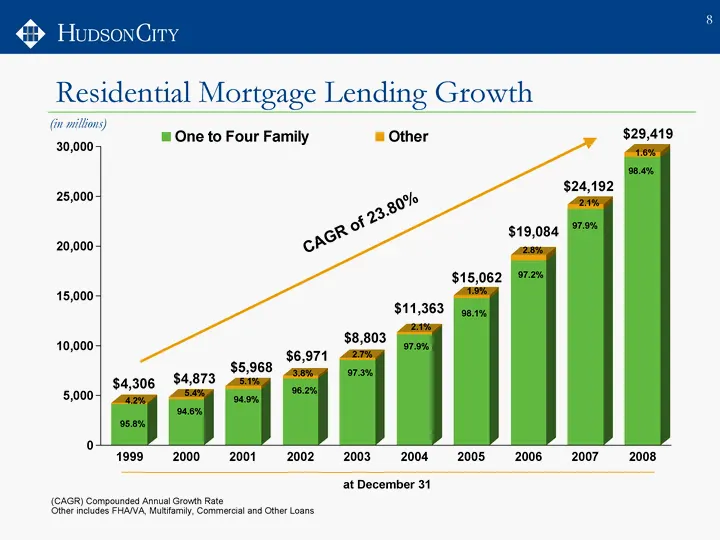
Residential Mortgage Lending Growth (in millions) (CAGR) Compounded Annual Growth Rate Other includes FHA/VA, Multifamily, Commercial and Other Loans
Slide 9: Strategy: Focused Growth
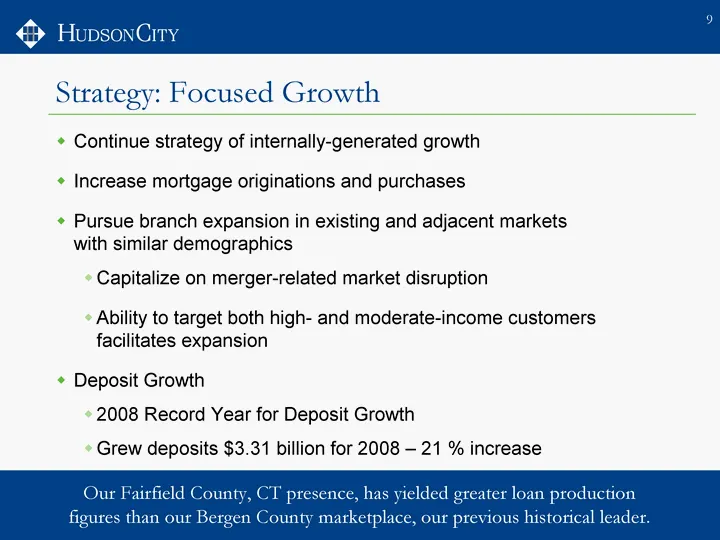
Our Fairfield County, CT presence, has yielded greater loan production figures than our Bergen County marketplace, our previous historical leader. Continue strategy of internally-generated growth Increase mortgage originations and purchases Pursue branch expansion in existing and adjacent markets wi
Slide 10: Growth in Desirable Markets
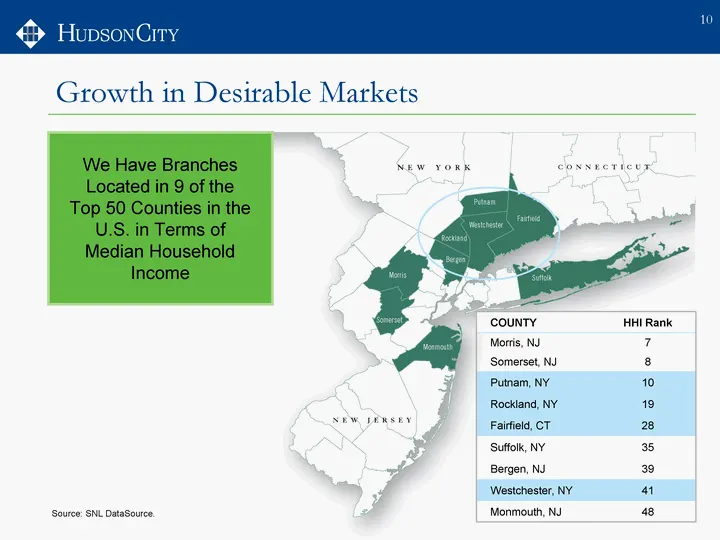
Growth in Desirable Markets COUNTY HHI Rank Morris, NJ 7 Somerset, NJ 8 Putnam, NY 10 Rockland, NY 19 Fairfield, CT 28 Suffolk, NY 35 Bergen, NJ 39 Westchester, NY 41 Monmouth, NJ 48 Source: SNL DataSource. We Have Branches Located in 9 of the Top 50 Counties in the U.S. in Terms of Median Household
Slide 11: Strong Growth in New Markets
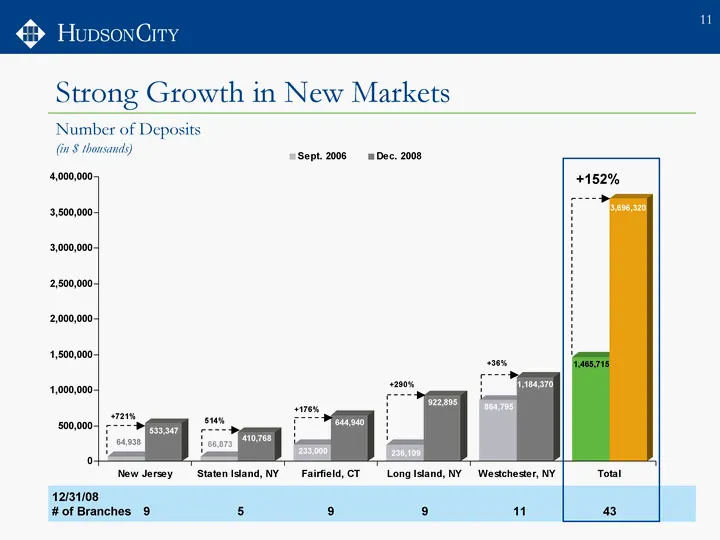
12/31/08 # of Branches 9 5 9 9 11 43 Sept. 2006 Dec. 2008 New Jersey 64938 533347 Staten Island, NY 66873 410768 Fairfield, CT 233000 644940 Long Island, NY 236109 922895 Westchester, NY 864795 1184370 Total 1465715 3696320 Strong Growth in New Markets Number of Deposits (in $ thousands) +290% +176%
Slide 12: Winning Formula
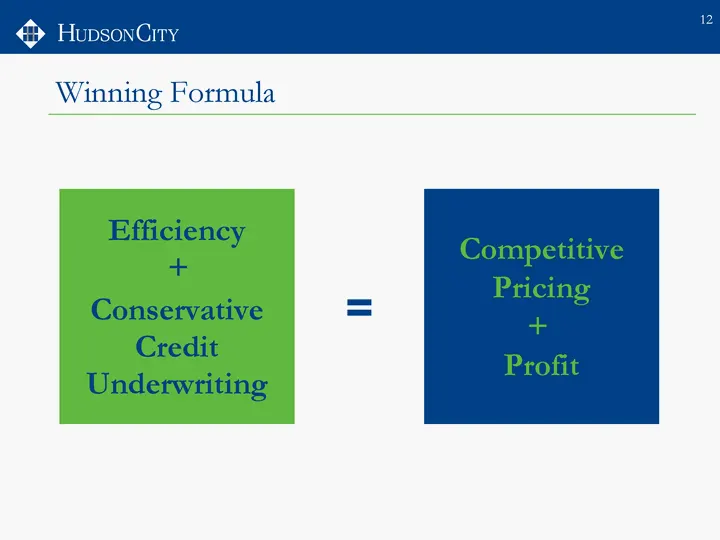
Winning Formula = Efficiency + Conservative Credit Underwriting Competitive Pricing + Profit
Slide 13: Efficiency
efficiency
Slide 14: Frugality measured by efficiency ratio
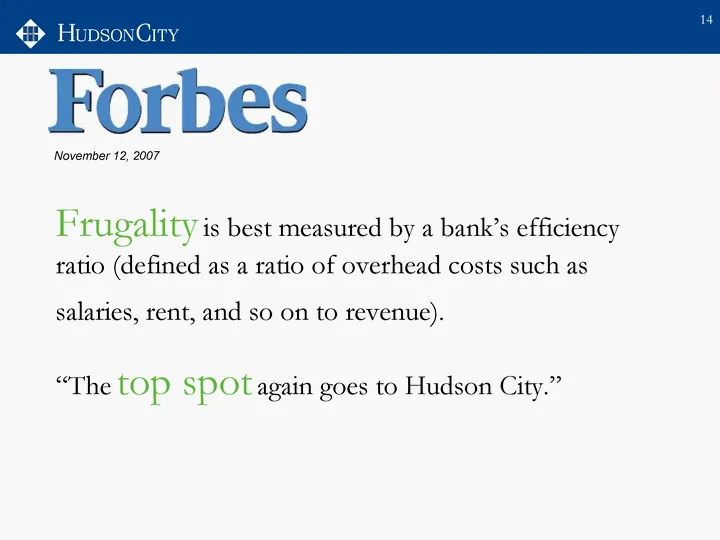
Frugality is best measured by a bank's efficiency ratio (defined as a ratio of overhead costs such as salaries, rent, and so on to revenue). "The top spot again goes to Hudson City." November 12, 2007
Slide 15: Industry-Leading Operational Efficiency
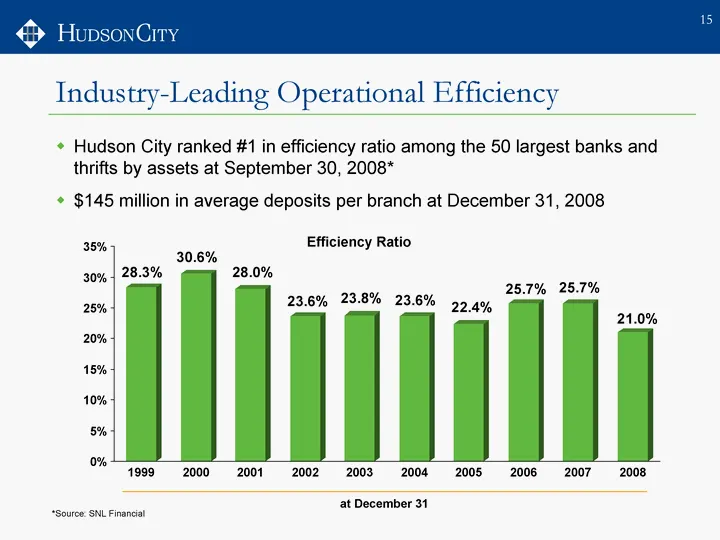
*Source: SNL Financial Industry-Leading Operational Efficiency Hudson City ranked #1 in efficiency ratio among the 50 largest banks and thrifts by assets at September 30, 2008* $145 million in average deposits per branch at December 31, 2008 Efficiency Ratio at December 31

Slide 16: Asset Quality
asset quality
Slide 17: Home Price Index for Major US Markets
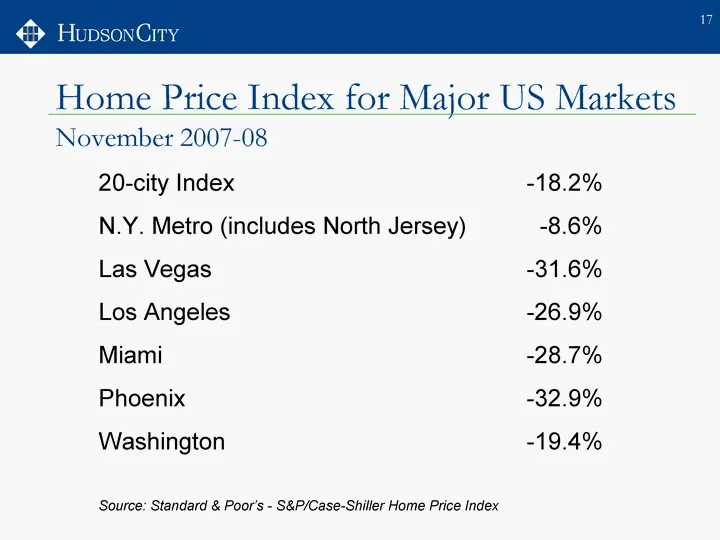
Home Price Index for Major US Markets November 2007-08 20-city Index -18.2% N.Y. Metro (includes North Jersey) -8.6% Las Vegas -31.6% Los Angeles -26.9% Miami -28.7% Phoenix -32.9% Washington -19.4% Source: Standard & Poor's - S&P/Case-Shiller Home Price Index
Slide 18: Maximum Loan-To-Value
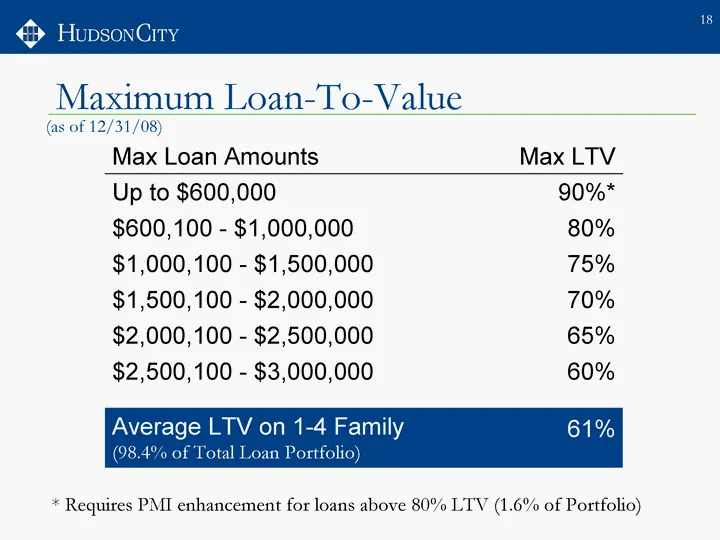
Maximum Loan-To-Value Max Loan Amounts Max LTV Up to $600,000 90%* $600,100 - $1,000,000 80% $1,000,100 - $1,500,000 75% $1,500,100 - $2,000,000 70% $2,000,100 - $2,500,000 65% $2,500,100 - $3,000,000 60% Average LTV on 1-4 Family (98.4% of Total Loan Portfolio) 61% * Requires PMI enhancement for lo
Slide 19: Non-Performing Loans and Total Loans
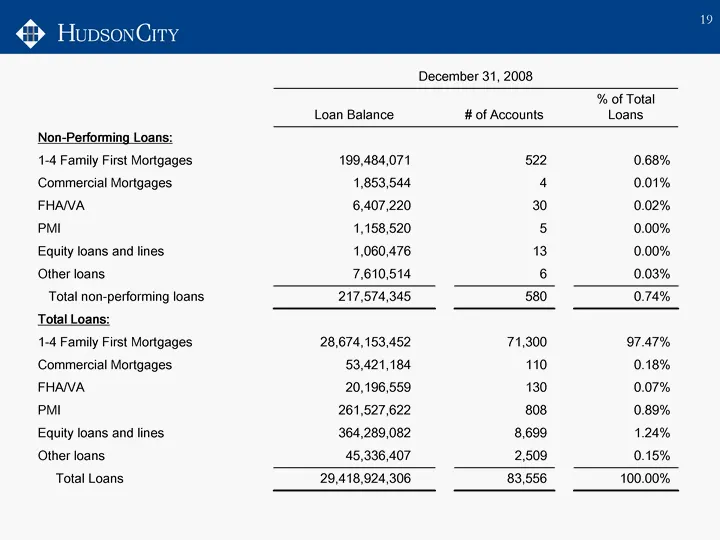
December 31, 2008 December 31, 2008 December 31, 2008 December 31, 2008 December 31, 2008 Loan Balance # of Accounts % of Total Loans Non-Performing Loans: 1-4 Family First Mortgages 199,484,071 522 0.68% Commercial Mortgages 1,853,544 4 0.01% FHA/VA 6,407,220 30 0.02% PMI 1,158,520 5 0.00% Equity l
Slide 20: Provision for Loan Losses and Net Charge-offs
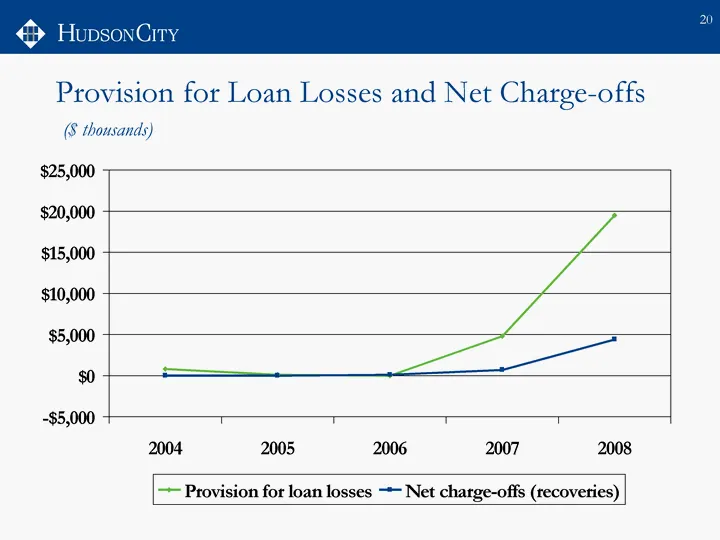
Provision for Loan Losses and Net Charge-offs ($ thousands)
Slide 21: Conservative underwriting standards
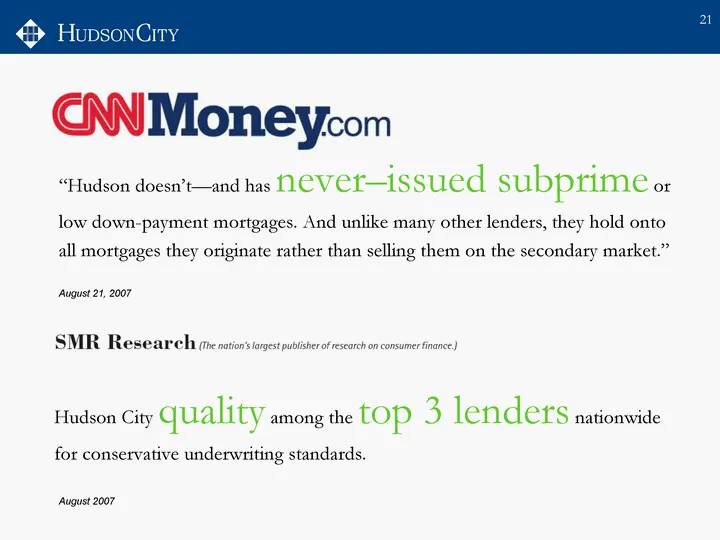
Hudson City quality among the top 3 lenders nationwide for conservative underwriting standards. "Hudson doesn't--and has never-issued subprime or low down-payment mortgages. And unlike many other lenders, they hold onto all mortgages they originate rather than selling them on the secondary market."

Slide 22: Financial Strength
financial strength
Slide 23: Earnings and Dividends Growth
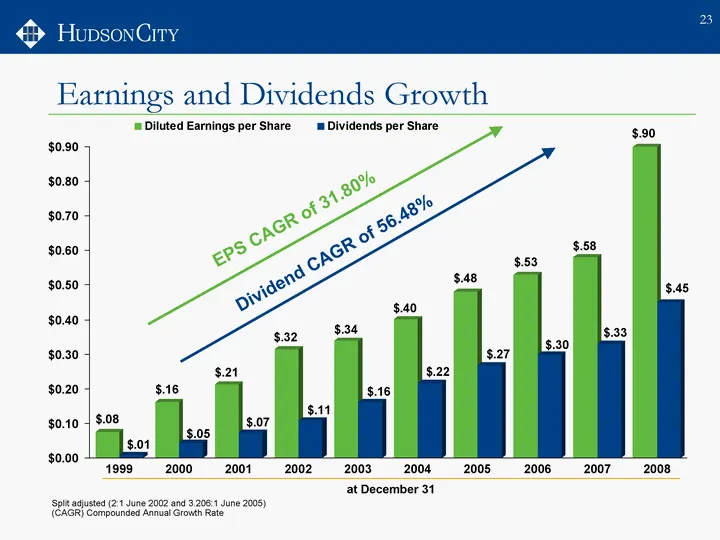
Split adjusted (2:1 June 2002 and 3.206:1 June 2005) (CAGR) Compounded Annual Growth Rate Earnings and Dividends Growth
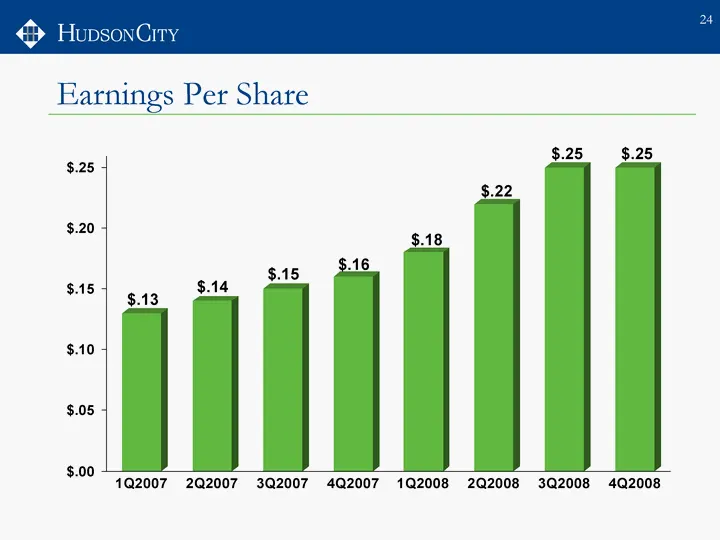
Slide 24: Earnings Per Share
Hupson Earnings Per Share 25 1.25 $.25 & 5 20 s $.18 16 $.15 14 $15) cag $. $10 192007 2Q2007 302007 4Q2007 1Q2008 202008 302008 402008
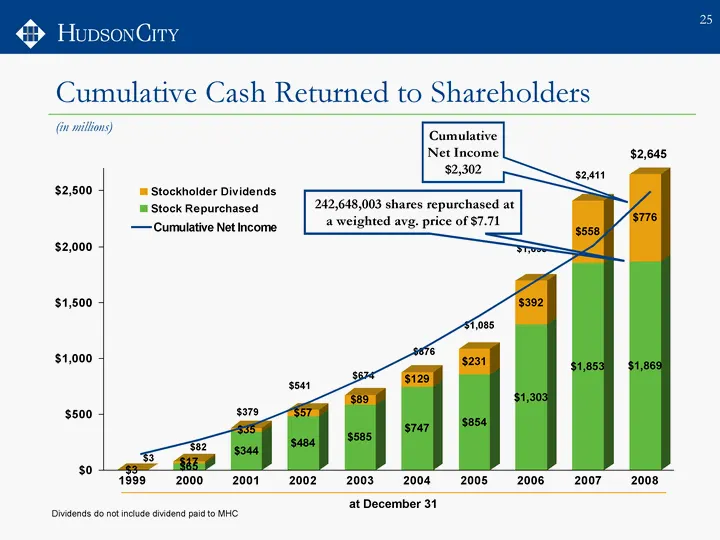
Slide 25: Cumulative Cash Returned to Shareholders
Cumulative Cash Returned to Shareholders Dividends do not include dividend paid to MHC (in millions)
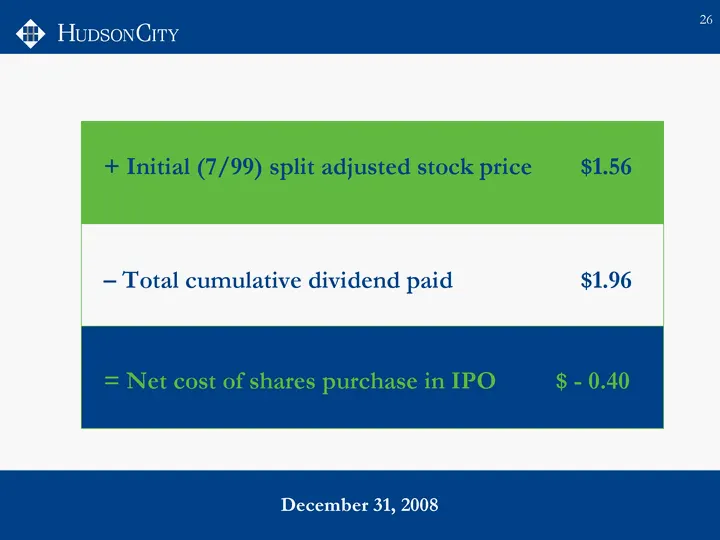
Slide 26: Net cost of shares purchased in IPO
December 31, 2008 + Initial (7/99) split adjusted stock price $1.56 - - Total cumulative dividend paid $1.96 = Net cost of shares purchase in IPO $ - 0.40
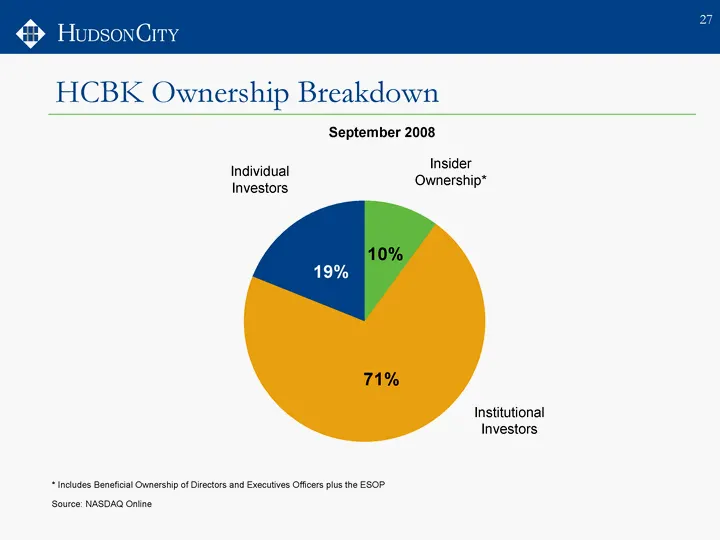
Slide 27: HCBK Ownership Breakdown
Insider Ownership Institutional Ownership Non-Institutional Ownership HCBK Ownership 10 71 19 HCBK Ownership Breakdown Institutional Investors Individual Investors Insider Ownership* * Includes Beneficial Ownership of Directors and Executives Officers plus the ESOP Source: NASDAQ Online September 20

Slide 28: Best-Managed Bank of the Year
"Best-Managed Bank of the Year." 2007 & 2008 12/22/08
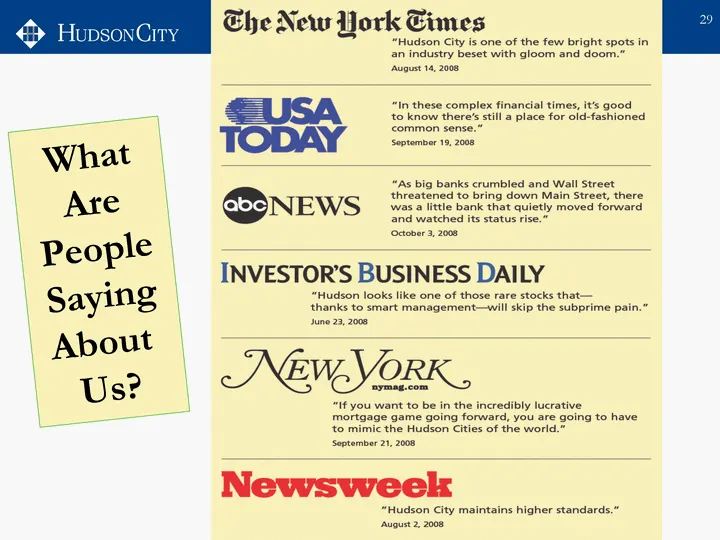
Slide 29: What Are People Saying About Us?
What Are People Saying About Us?
Slide 30: Growth, Efficiency, Financial Strength, Asset Quality
growth efficiency financial strength asset quality
Source: SEC EDGAR · 8-K filed Feb 9, 2009
More decks from Hudson City Bancorp Inc
 Citigroup 2013 US Financial Services Conference30 slides · Mar 6, 2013
 BancAnalysts Association of Boston Conference 201229 slides · Nov 2, 2012
 Barclays Global Financial Services Conference 201234 slides · Sep 10, 2012
 Merger or Acquisition (August 2012)32 slides · Aug 27, 2012
 Shareholder Meeting (April 2012)20 slides · Apr 25, 2012
 Shareholder Meeting (April 2011)38 slides · Apr 19, 2011