Mohawk Industries, Inc. · NYSE:MHK
Mohawk Industries — DAL Tile International — Merger or Acquisition (February 2002)
31 slides from Mohawk Industries's merger presentation, Feb 19, 2002

Slide 1: Mohawk Industries, Inc.
INDUSTRIES, INC.

Slide 2: Forward-Looking Statements
FORWARD-LOOKING STATEMENTS Safe Harbor Statement under the Private Securities Litigation Reform Act of 1985: Certain of the statements in this presentation, particularly those anticipating future financial performance, business prospects, growth and operating strategies, new products and similar mat
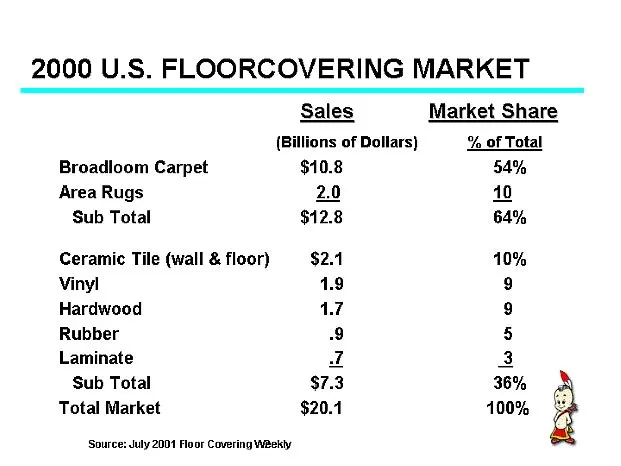
Slide 3: 2000 U.S. Floorcovering Market
2000 U.S. FLOORCOVERING MARKET Sales Market Share (Billions of Dollars) % of Total Broadloom Carpet $10.8 54% Area Rugs 2.0 10 ‘Sub Total $12.8 64% Ceramic Tile (wall & floor) $2.1 10% Vinyl 1.9 9 Hardwood 1.7 9 Rubber 9 5 Laminate a 3 Sub Total $7.3 36% Total Market $20.1 100% ‘Source: July 2001 Fl
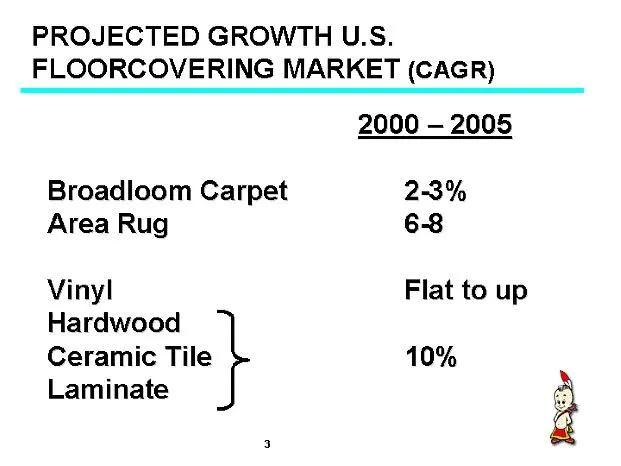
Slide 4: Projected Growth U.S. Floorcovering Market (CAGR)
PROJECTED GROWTH U.S. FLOORCOVERING MARKET (CAGR) 2000 — 2005 Broadloom Carpet 23% Area Rug 68 Vinyl Flat to up Hardwood Ceramic Tile 10% Laminate
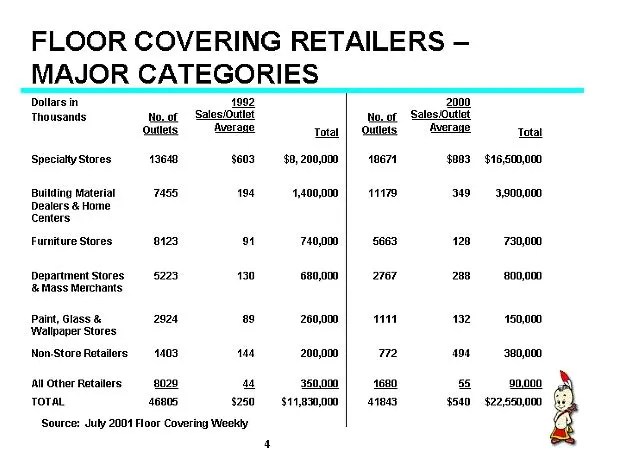
Slide 5: Floor Covering Retailers — Major Categories
FLOOR COVERING RETAILERS — MAJOR CATEGORIES Dollars in Thousands Specialty Stores Building Material Dealers & Home Centers Furniture Stores Department Stores. ‘& Mass Merchants, Paint, Glass & Wallpaper Stores Non Store Retailers All Other Retallers TOTAL. 902 to.or SalesiOutlot ‘outers 13640 7485 0
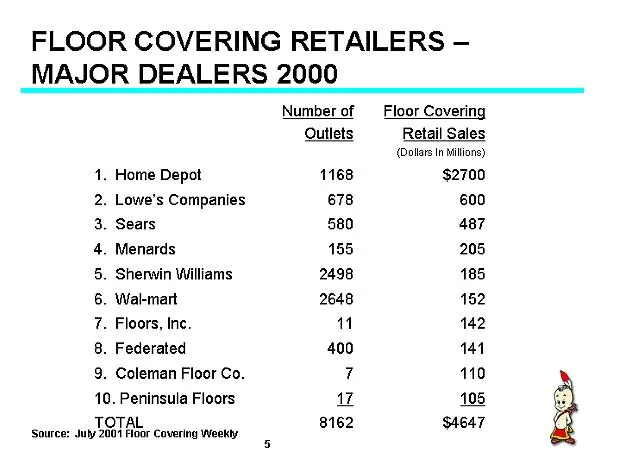
Slide 6: Floor Covering Retailers — Major Dealers 2000
FLOOR COVERING RETAILERS — MAJOR DEALERS 2000 Number of — Floor Covering Outlets Retail Sales 1. Home Depot 1168 $2700 2. Lowe's Companies 678 600 3. Sears 580 487 4. Menards 155 205 5. Sherwin Williams 2498 185, 6. Wal-mart 2648 152 7. Floors, Inc. 11 142 8. Federated 400 144 9. Coleman Floor Co. 7
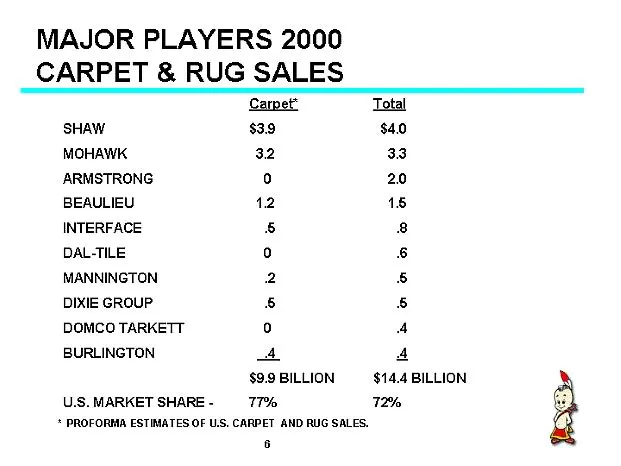
Slide 7: Major Players 2000 Carpet & Rug Sales
MAJOR PLAYERS 2000 CARPET & RUG SALES Camet Total SHAW $3.9 $4.0 MOHAWK 32 33 ARMSTRONG C) 20 BEAULIEU 12 18 INTERFACE 5 8 DAL-TILE 0 6 MANNINGTON 2 5 DIXIE GROUP 5 5 DOMCO TARKETT 0 A BURLINGTON A 4 S99BILLION $14.4 BILLION U.S.MARKET SHARE- 77% TM * PROFORMA ESTIMATES OF US. CARPET AND RUG SALES.
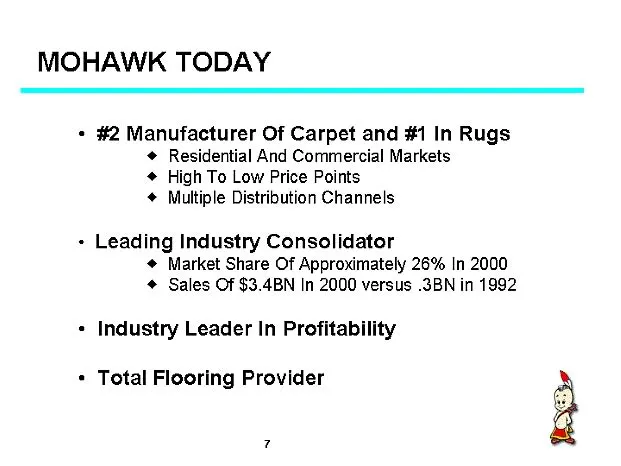
Slide 8: Mohawk Today
MOHAWK TODAY + #2 Manufacturer Of Carpet and #1 In Rugs Residential And Commercial Markets High To Low Price Points Multiple Distribution Channels + Leading Industry Consolidator ¢ Market Share Of Approximately 26% In 2000 Sales Of $3.4BN In 2000 versus .3BN in 1992 + Industry Leader In Profitabilit
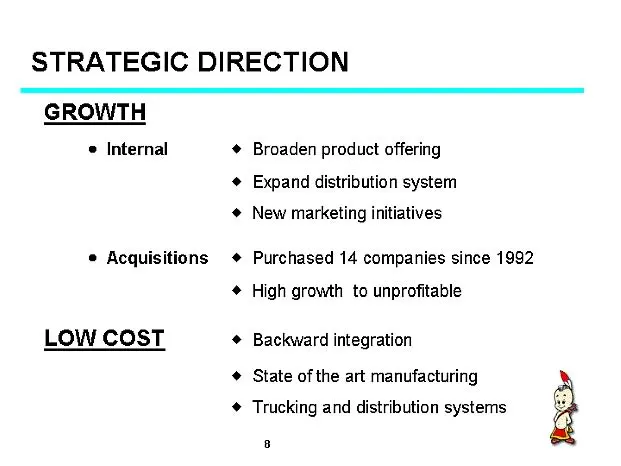
Slide 9: Strategic Direction
STRATEGIC DIRECTION GROWTH © Internal Broaden product offering Expand distribution system New marketing initiatives © Acquisitions Purchased 14 companies since 1992 High growth to unprofitable LOW COST Backward integration State of the art manufacturing . ° Trucking and distribution systems 8
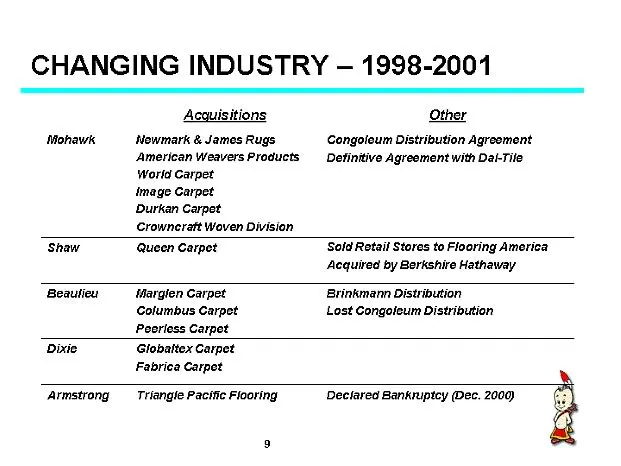
Slide 10: Changing Industry — 1998-2001
CHANGING INDUSTRY — 1998-2001 Acquisitions Other Mohawis Nowmark & James Rugs Congoleum Distribution Agroomont American Weavers Products Definitive Agreement with Dat-Tile World Carpet image Carpet Durkan Carpet Crowneratt Woven Division Shaw ‘Queen Carpet Sold Retail Stores to Flooring America Acqu
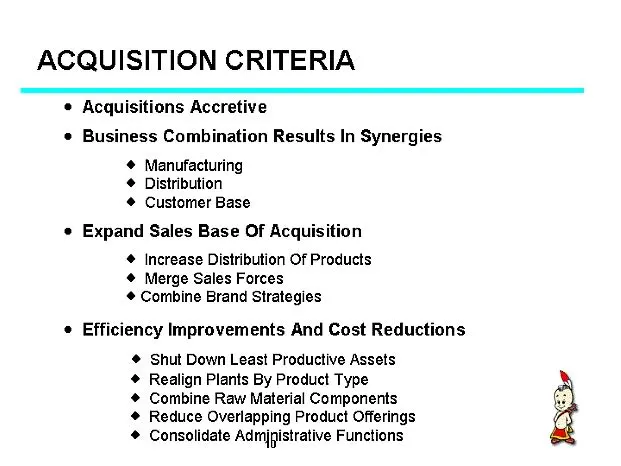
Slide 11: Acquisition Criteria
ACQUISITION CRITERIA © Acquisitions Accretive « Business Combination Results In Synergies Manufacturing Distribution Customer Base ° Expand Sales Base Of Acquisition © Increase Distribution Of Products Merge Sales Forces Combine Brand Strategies © Efficiency Improvements And Cost Reductions Shut Dow
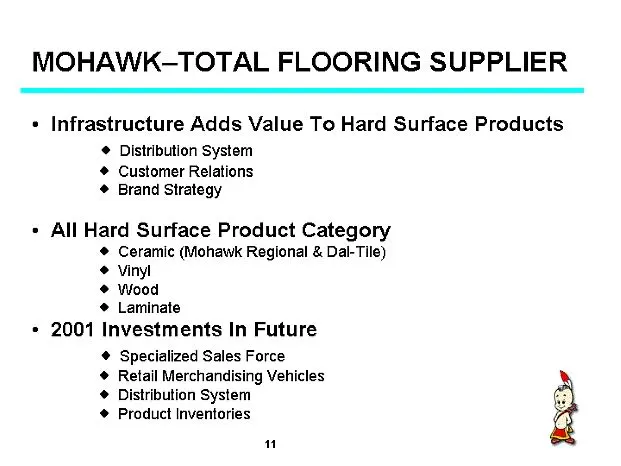
Slide 12: Mohawk - Total Flooring Supplier
MOHAWK-TOTAL FLOORING SUPPLIER + Infrastructure Adds Value To Hard Surface Products © Distribution System * Customer Relations Brand Strategy * All Hard Surface Product Category * Ceramic (Mohawk Regional & Dal-Tile) * vinyl * Wood * Laminate * 2001 Investments In Future @ Specialized Sales Force Re
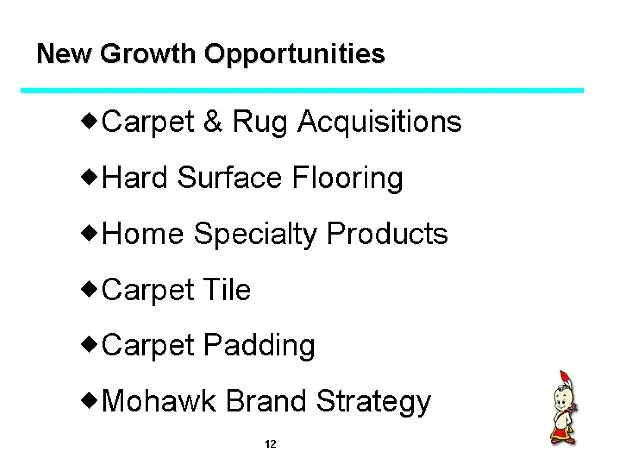
Slide 13: New Growth Opportunities
New Growth Opportunities Carpet & Rug Acquisitions Hard Surface Flooring Home Specialty Products Carpet Tile Carpet Padding Mohawk Brand Strategy 2
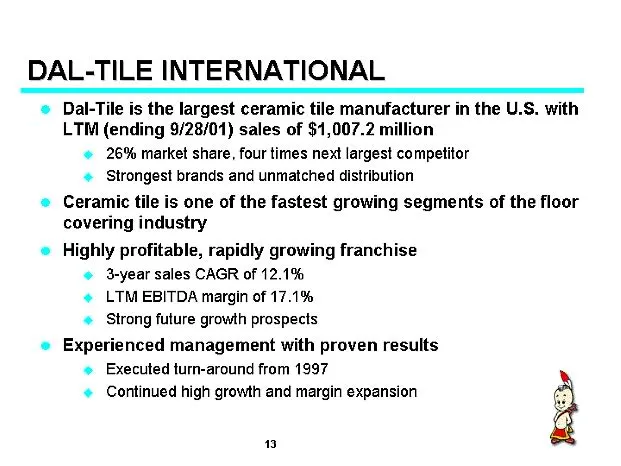
Slide 14: Dal-Tile International
DAL-TILE INTERNATIONAL © Dal-Tile is the largest cerami manufacturer in the U.S. with LTM (ending 9/28/01) sales of $1,007.2 million © 26% market share, four times next largest competitor ~ Strongest brands and unmatched distribution © Ceramic tile is one of the fastest growing segments of the floor
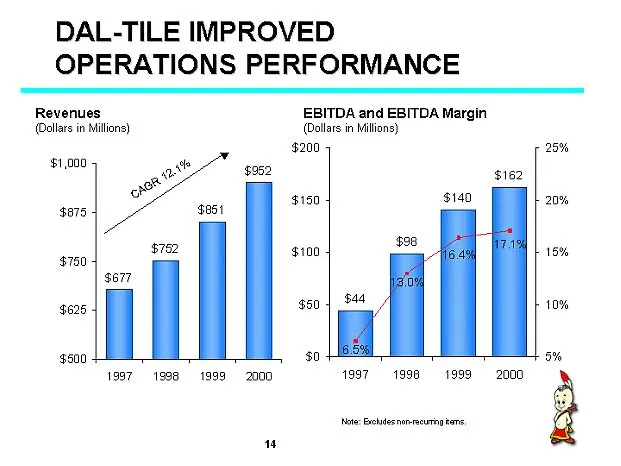
Slide 15: Dal-Tile Improved Operations Performance
DAL-TILE IMPROVED OPERATIONS PERFORMANCE Revenues EBITDA and EBITDA Margin alas in Mion) (Palais Mons) $200 25% $1,000 ee $190 20% $875 $752 100 15% $750 : sort $006 $60 10% $600 so % 1997” 1998” 1999” 2000 4997 1998 1999 2000 Ne: aches none ers
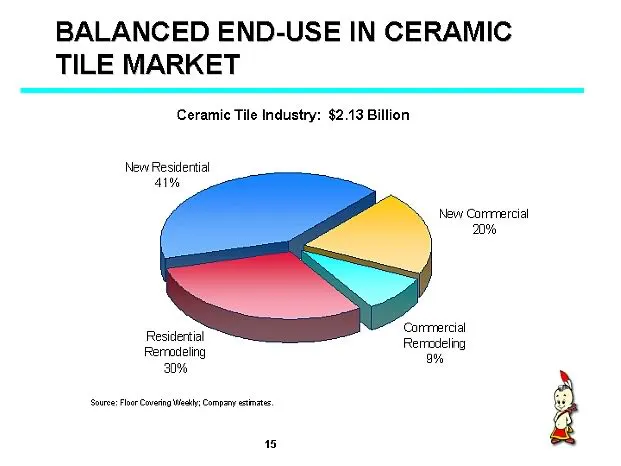
Slide 16: Balanced End-Use in Ceramic Tile Market
BALANCED END-USE IN CERAMIC TILE MARKET Ceramic Tile Industry: $2.13 Billion New Residential 41% New Carrmercial 20% Commercial Residential Remndeing Remodeling 30% Snr: Fler Coven West: Company inate. 6
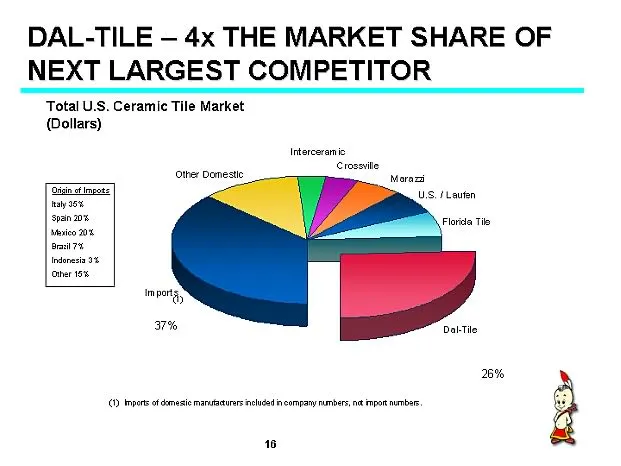
Slide 17: Dal-Tile — 4x the Market Share of Next Largest Competitor
DAL-TILE — 4x THE MARKET SHARE OF NEXT LARGEST COMPETITOR Total U.S. Ceramic Tile Market (@ollars) othe Demeste W% DaLTile 26% (1) Inger of dmesio maracas neice ncurapayrumbes nt tmpon mb. G 6
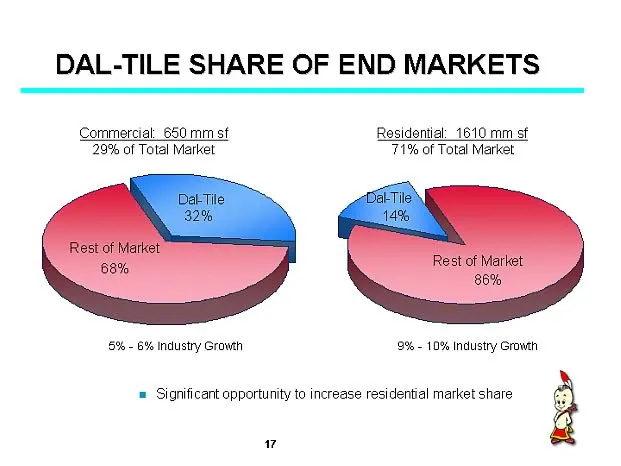
Slide 18: Dal-Tile Share of End Markets
DAL-TILE SHARE OF END MARKETS Commercial: 650 mm st Residential: 1610 mm sf 29% of Total Market 71% of Total Market 6% - 6% Industry Growth 2% - 10% Industry Growth = Significant opportunity to increase residential market share
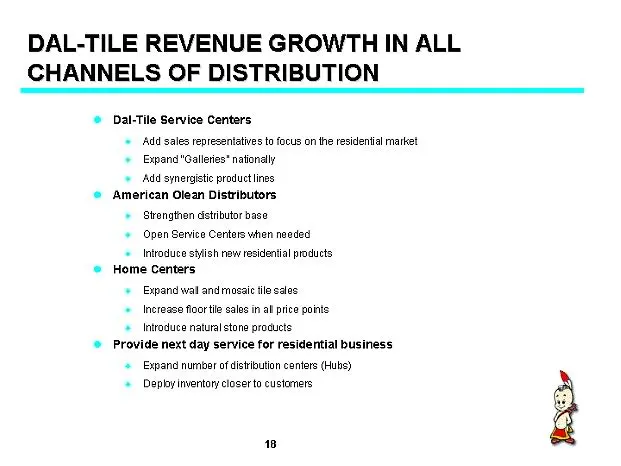
Slide 19: Dal-Tile Revenue Growth in All Channels of Distribution
DAL-TILE REVENUE GROWTH IN ALL CHANNELS OF DISTRIBUTION © Dal-Tile Service Centers © Add sales representatives to focus on the residential market © Expand "Galleies* nationally © Add synergistic product ines © American Olean Distributors © Strengthen estibutor base Open Service Centers when necded ©
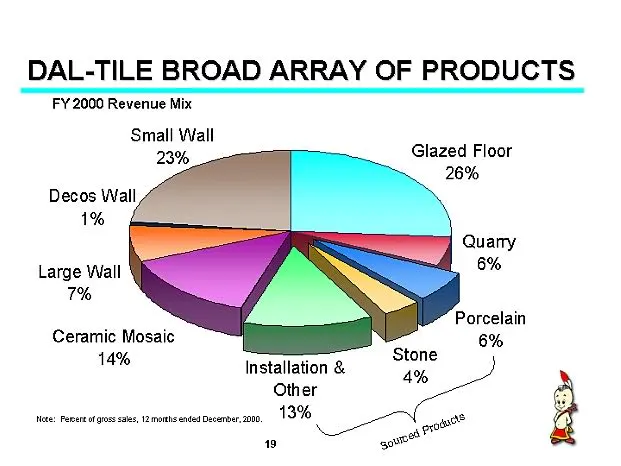
Slide 20: Dal-Tile Broad Array of Products
DAL-TILE BROAD ARRAY OF PRODUCTS FY 2000 Revenue Mix Small Wall 23% Glazed Floor 26% Decos Wall 1% le Large Wall 7% Ceramic Mosaic 14% Installation & Other 13% 08 » govt ee: Fee oes, 12 mons ended Dende, 2000,
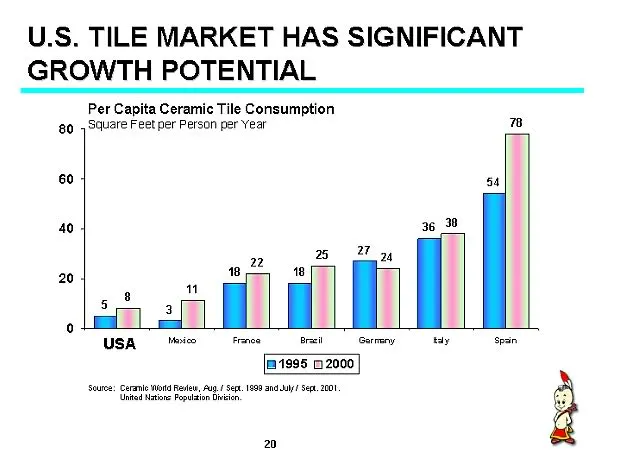
Slide 21: U.S. Tile Market Has Significant Growth Potential
U.S. TILE MARKET HAS SIGNIFICANT GROWTH POTENTIAL Per Capita Ceramic Tile Consumption ao Square Feet per Person per Year 7B 60 54 40 36 30 n ay 20:4 18 18 " 8 ° USA "im Fence rl Garry ey psn [195 02000 Sevce: x ape S10 a 2 20
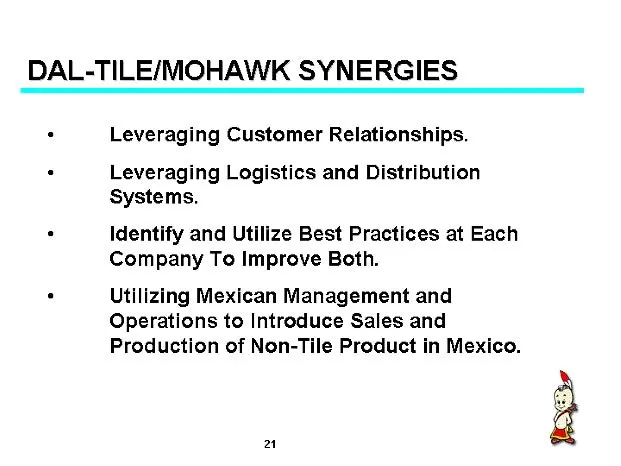
Slide 22: Dal-Tile/Mohawk Synergies
DAL-TILE/MOHAWK SYNERGIES . Leveraging Customer Relationships. . Leveraging Logistics and Distribution Systems. . Identify and Utilize Best Practices at Each Company To Improve Both. . Utilizing Mexican Management and Operations to Introduce Sales and Production of Non-Tile Product in Mexico. e
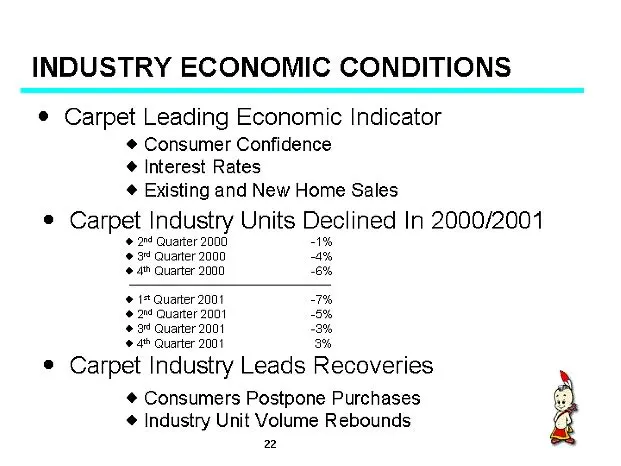
Slide 23: Industry Economic Conditions
INDUSTRY ECONOMIC CONDITIONS ¢ Carpet Leading Economic Indicator ¢ Consumer Confidence ¢ Interest Rates Existing and New Home Sales © Carpet Industry Units Declined In 2000/2001 ¢ 2% Quarter 2000 3° Quarter 2000, ae 4 Quarter 2000 6% © 1 Quarter 2001 ¢ 20 Quarter 2001 © 39 Quarter 2001 ¢4 Quarter 20
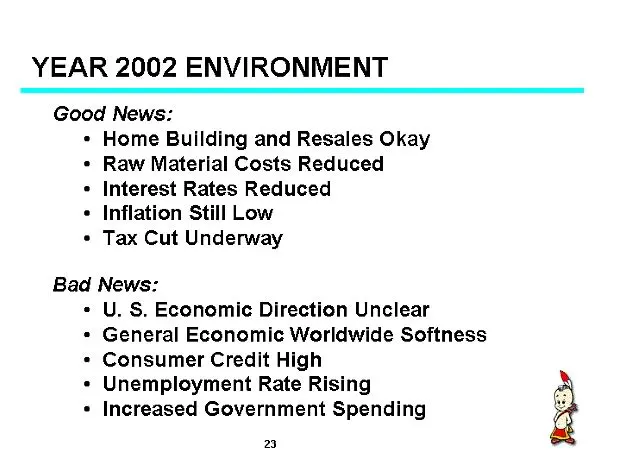
Slide 24: Year 2002 Environment
YEAR 2002 ENVIRONMENT Good News: + Home Building and Resales Okay + Raw Material Costs Reduced + Interest Rates Reduced + Inflation Still Low * Tax Cut Underway Bad News: + U. S. Economic Direction Unclear + General Economic Worldwide Softness + Consumer Credit High + Unemployment Rate Rising + Incr
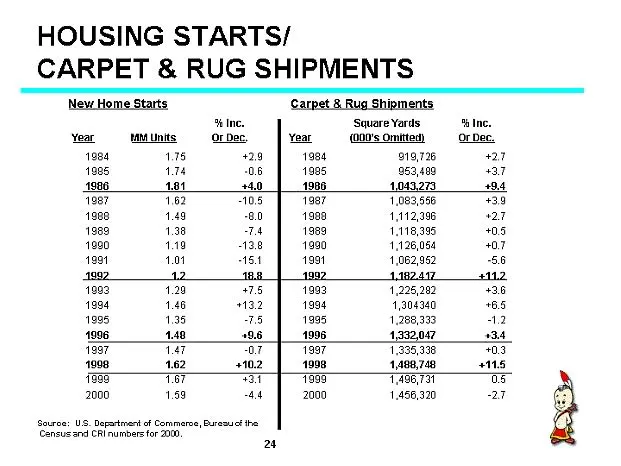
Slide 25: Housing Starts/Carpet & Rug Shipments
HOUSING STARTS/ CARPET & RUG SHIPMENTS New Home Starts Carpet & Rug Shipments Inc, ‘Square Yards Inc, Year MMUnits_——_ Or Dar. Year —-«(@00's Omitted) ——Or Dec. 1984 415 429 1934 219,726 427 1085 114 08 1935 253,409 437 1986 181 +40 1986 1943.273 19.4 1987 1.62 105 1987 1,083,566 430 1988 1.49 80 19
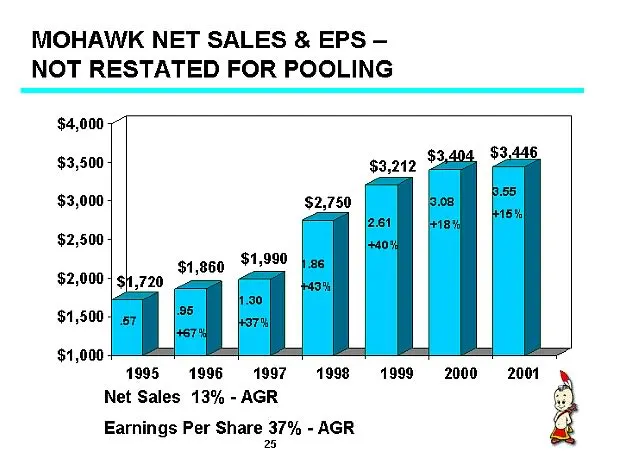
Slide 26: Mohawk Net Sales & EPS — Not Restated for Pooling
MOHAWK NET SALES & EPS — NOT RESTATED FOR POOLING Net Sales 13% -AGR 1995 1996 1997 1998 1999 2000 2001 Earnings Per Share 37% - AGR 3 25
Slide 27: Cash Flow
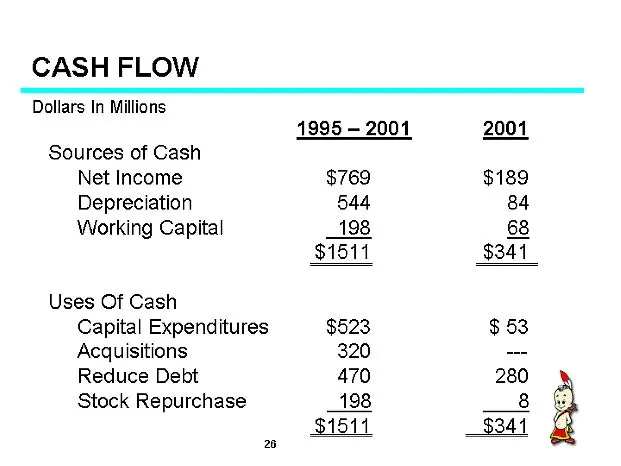
CASH FLOW Dollars In Millions 1995 — 2001 2001 Sources of Cash Net Income $769 $189 Depreciation 544 84 Working Capital _198 68 $1511 $341 Uses Of Cash Capital Expenditures $ 53 Acquisitions — Reduce Debt 280 Stock Repurchase 28
Slide 28: Mohawk Financial Measurements
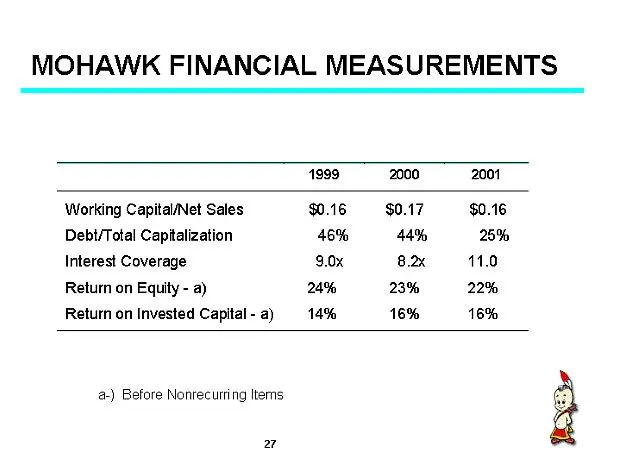
MOHAWK FINANCIAL MEASUREMENTS 1999 2000 2001 Working CapitalNet Sales $0.16 $0.17 $0.16 Debt/Total Capitalization 46% 44% 28% Interest Coverage 9.0x Bx = 11.0 Return on Equity - a) 24% 23% 22% Return on Invested Capital-a) 14% 16% 16% @) Before Nonrecurring Items a
Slide 29: Mohawk Fourth Quarter Sales and Earnings Per Share
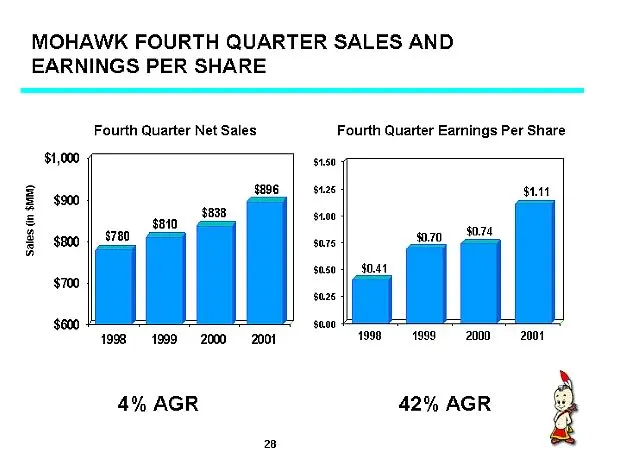
MOHAWK FOURTH QUARTER SALES AND EARNINGS PER SHARE Fourth Quarter Net Sales Fourth Quarter Earnings Per Share $1,000 x80 5125 $100 Sales (in $a) sa7s suse 5025 sooo 4 4998 1999 ©2000-2001 1998" 1999” 2000” 2001 4% AGR 42% AGR 28
Slide 30: Fourth Quarter Gross Profit and Operating Income
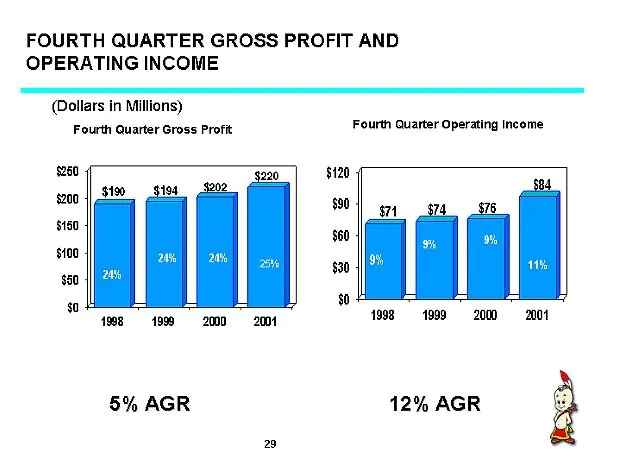
FOURTH QUARTER GROSS PROFIT AND OPERATING INCOME (Dollars in Millions) Fourth Quarter Gross Profit Fourth Quarter Operating Income a 220 $120 $19 ster 8 s200 $0) gsr 6 160 ; $60 sto0 ; 30 $60 0 ee 1998 20002001 1998 19992000 5% AGR 12% AGR

Slide 31: Industries, Inc.
INDUSTRIES, INC.
Source: SEC EDGAR · 425 filed Feb 19, 2002
More decks from Mohawk Industries, Inc.
 Q1 2026 Earnings Presentation39 slides · May 1, 2026
 Q4 2025 Earnings Presentation39 slides · Feb 13, 2026
 Q4 2025 Earnings Presentation39 slides · February 2026
 Q2 2025 Earnings Presentation39 slides · Jul 25, 2025
 Q4 2024 Earnings Presentation37 slides · Feb 7, 2025
 Q3 2025 Earnings Presentation39 slides · 2025