American Electric Power Company, Inc. · NASDAQ:AEP
American Electric Power — Q2 2021 Earnings Presentation
40 slides from American Electric Power's earnings presentation, Jul 22, 2021
Slide 1: 2nd Quarter 2021 Earnings Release Presentation
2ND QUARTER 2021 EARNINGS RELEASE PRESENTATION July 22, 2021

Slide 2: Safe Harbor Statement Under the Private Securities Litigation Reform Act of 1995
“Safe Harbor” Statement Under the Private Securities Litigation Reform Act of 1995 This presentation contains forward-looking statements within the meaning of Section 21E of the Securities Exchange Act of 1934. Although AEP and each of its Registrant Subsidiaries believe that their expectations are
Slide 3: Non-GAAP Financial Measures
Non-GAAP Financial Measures AEP reports its financial results in accordance with accounting principles generally accepted in the United States (GAAP). AEP supplements the reporting of financial information determined in accordance with GAAP with certain non-GAAP financial measures, including operati
Slide 4: 2nd Quarter 2021 Business Update
2nd Quarter 2021 Business Update Reaffirm 2021 operating earnings guidance range of $4.55-$4.75 and 5%-7% long-term growth rate Update on the economy and load Current regulatory activity: Arkansas, Indiana, Louisiana, Ohio, Oklahoma, Texas (SWEPCO), CCR/ELG, Transmission Execute on AEP’s cle
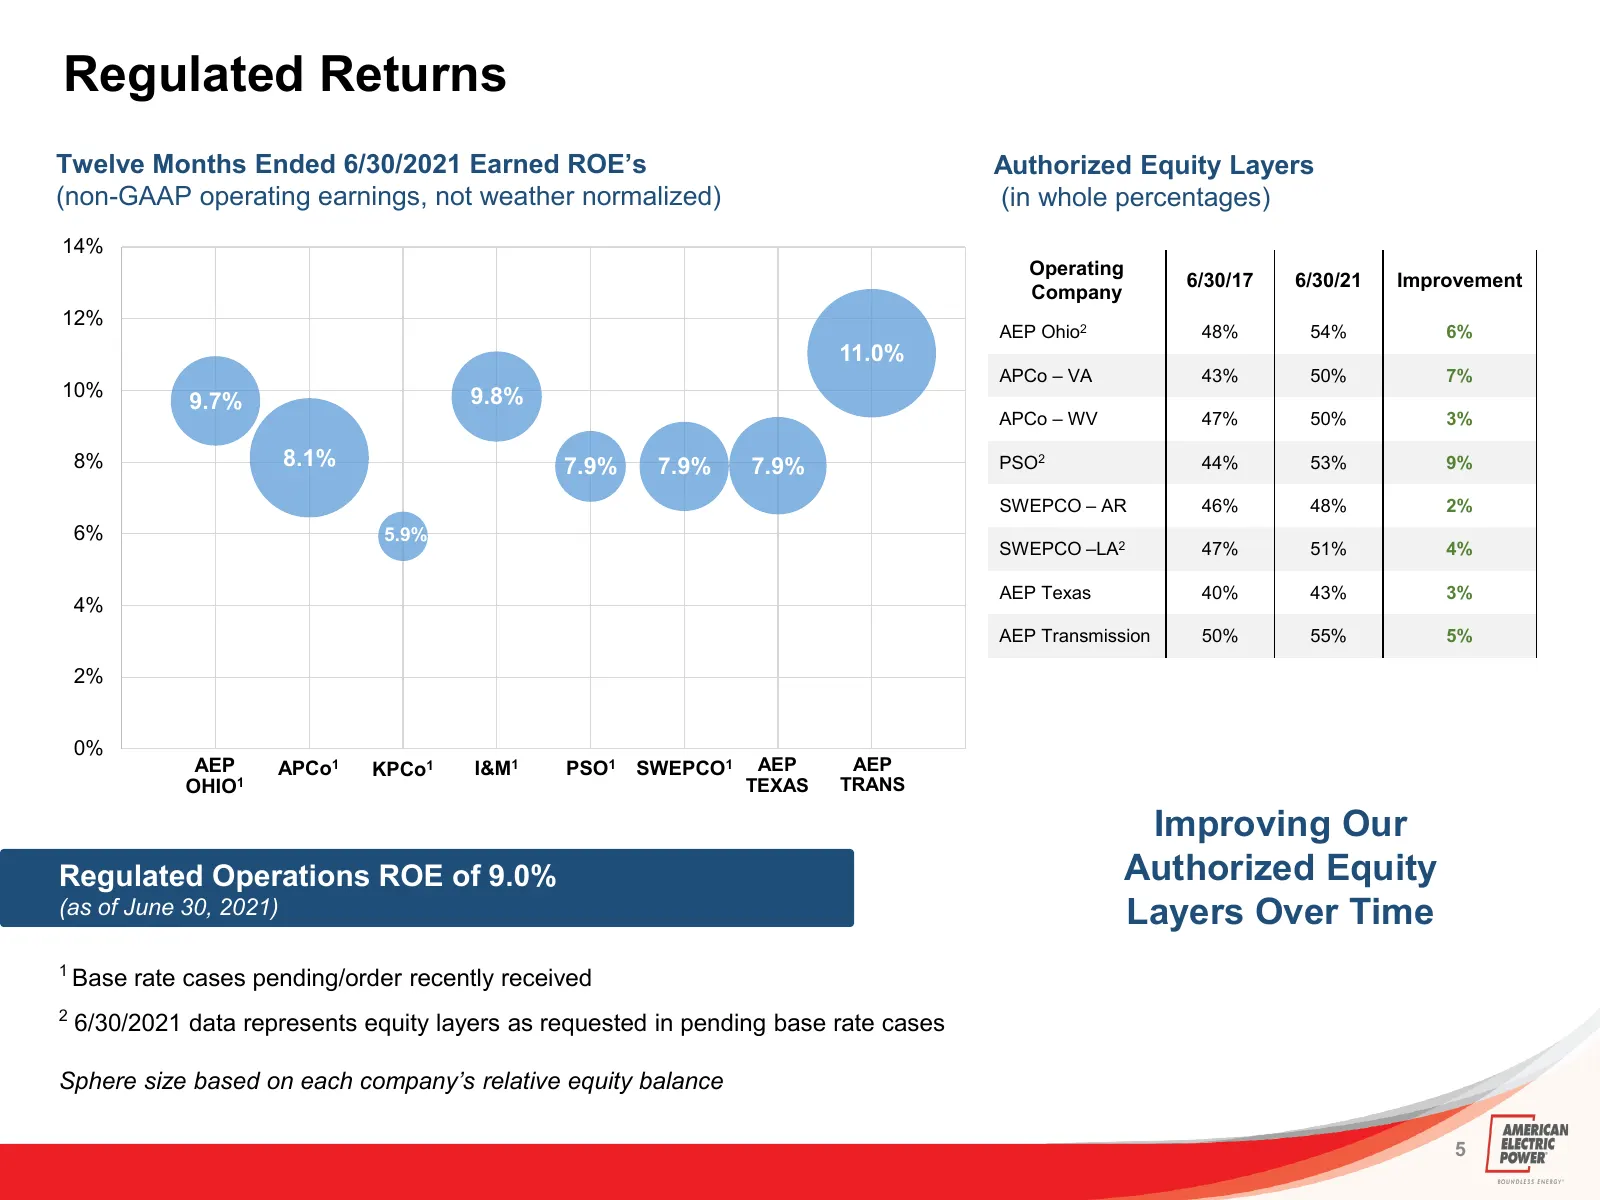
Slide 5: Regulated Returns
Regulated Returns Twelve Months Ended 6/30/2021 Earned ROE’s Authorized Equity Layers (non-GAAP operating earnings, not weather normalized) (in whole percentages) 14% Operating 6/30/17 6/30/21 Improvement Company 12% AEP Ohio2 48% 54% 6% 11.0% APCo – VA 43% 50% 7% 10% 9.8% 9.7% APCo – WV 47% 50% 3%
Slide 6: 2nd Quarter 2021 Financial Update
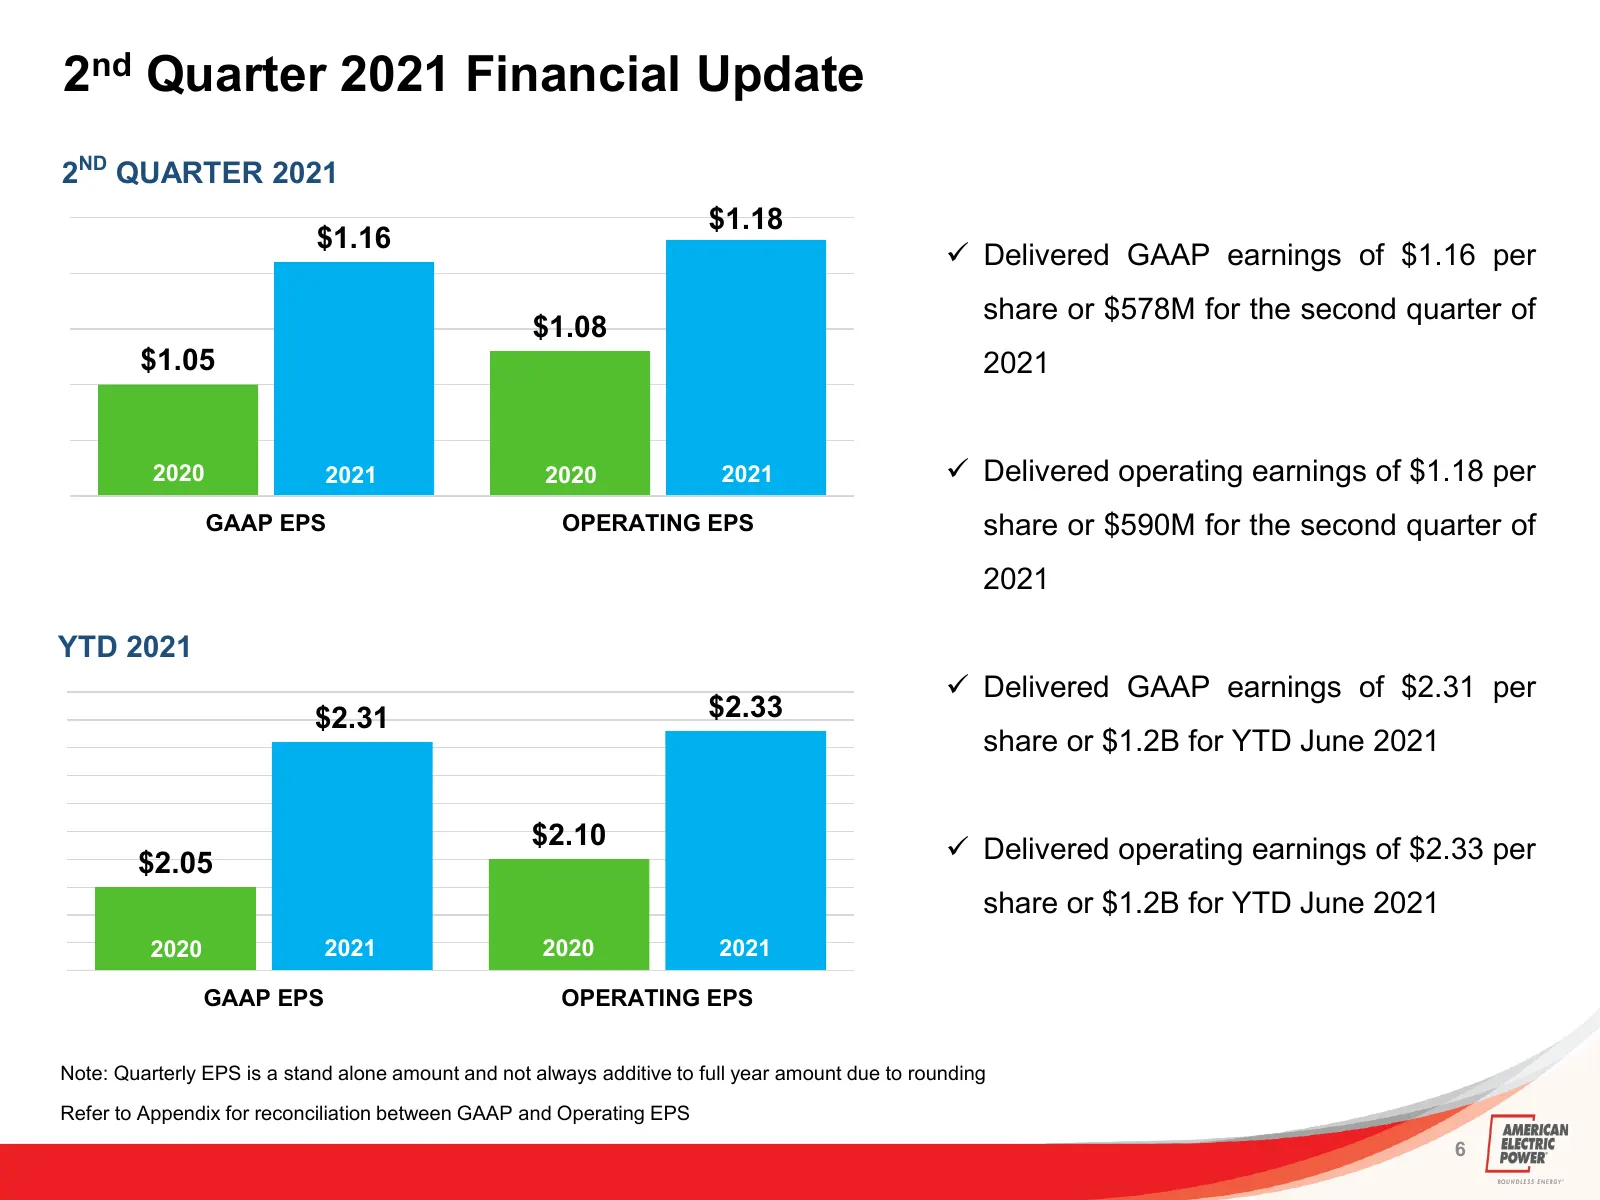
2nd Quarter 2021 Financial Update 2ND QUARTER 2021 $1.18 $1.16 Delivered GAAP earnings of $1.16 per share or $578M for the second quarter of $1.08 $1.05 2021 2020 2021 2020 2021 Delivered operating earnings of $1.18 per GAAP EPS OPERATING EPS share or $590M for the second quarter of 2021 2020 20
Slide 7: 2nd Quarter Operating Earnings Segment Detail
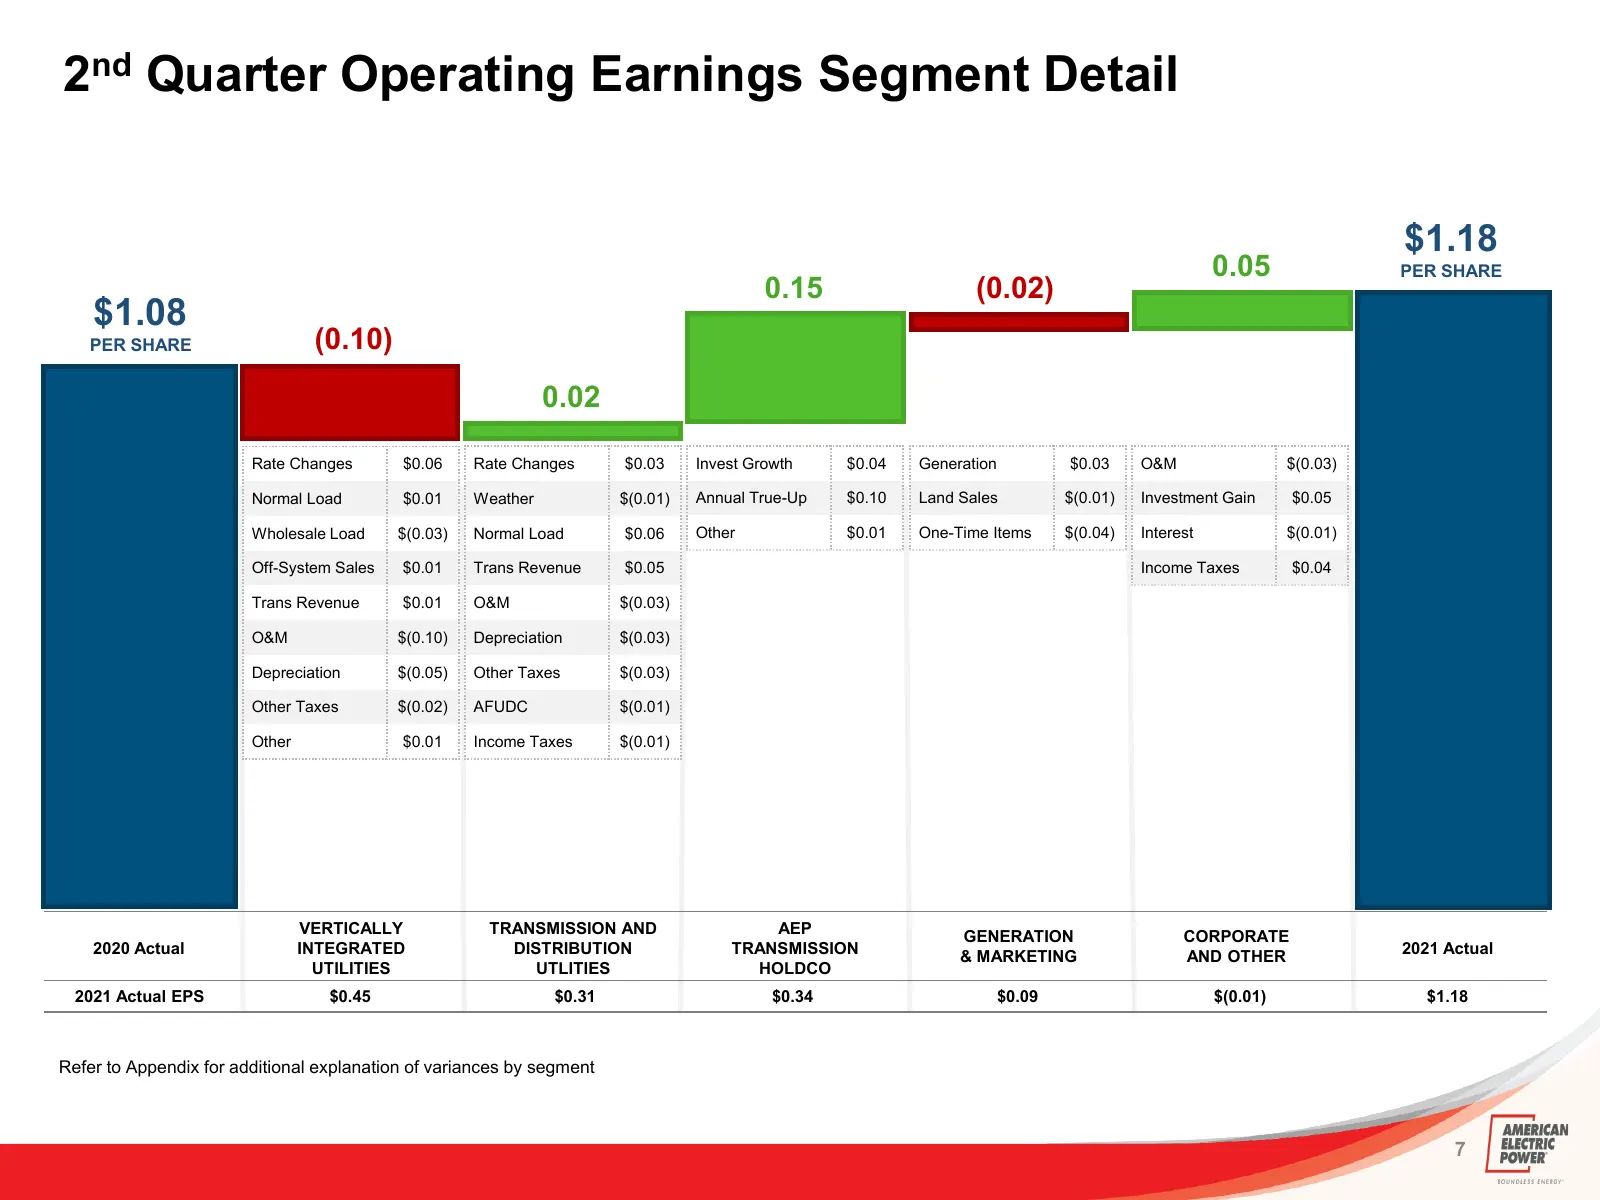
2nd Quarter Operating Earnings Segment Detail $1.18 0.05 PER SHARE 0.15 (0.02) $1.08 PER SHARE (0.10) 0.02 Rate Changes $0.06 Rate Changes $0.03 Invest Growth $0.04 Generation $0.03 O&M $(0.03) Normal Load $0.01 Weather $(0.01) Annual True-Up $0.10 Land Sales $(0.01) Investment Gain $0.05 Wholesale
Slide 8: YTD Operating Earnings Segment Detail
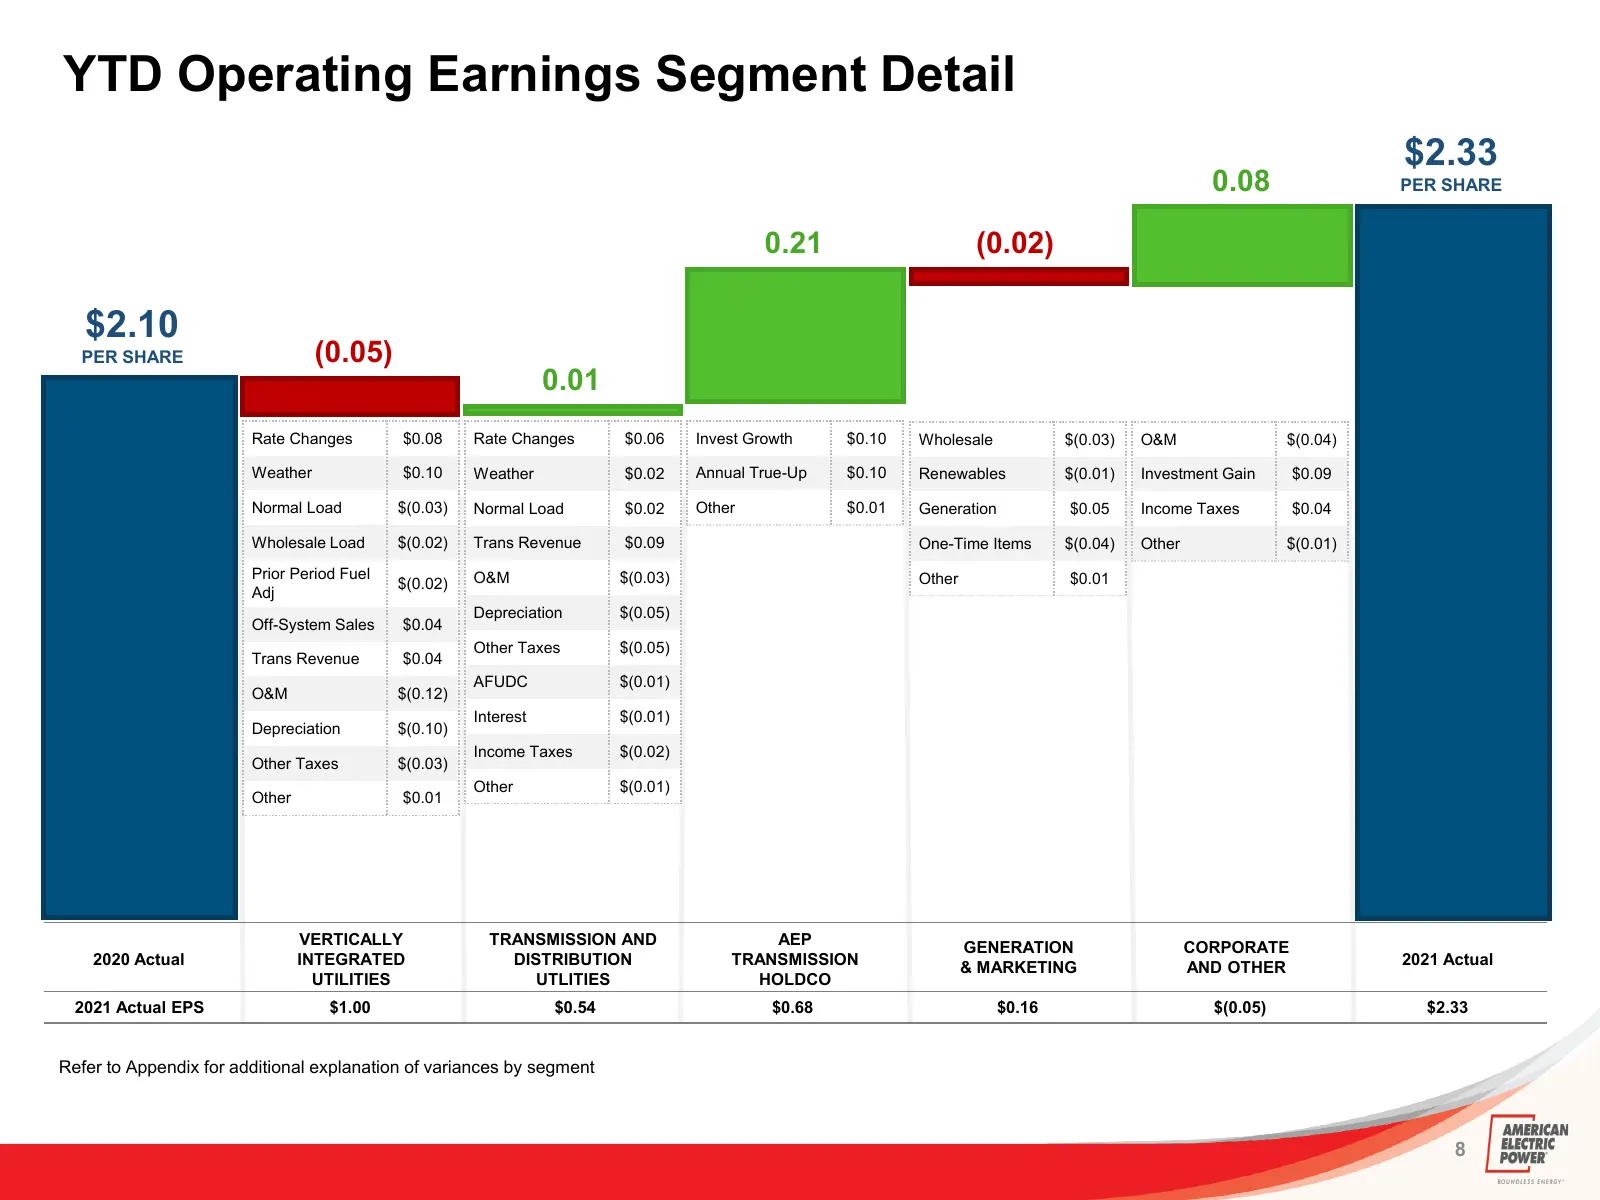
YTD Operating Earnings Segment Detail $2.33 0.08 PER SHARE 0.21 (0.02) $2.10 PER SHARE (0.05) 0.01 Rate Changes $0.08 Rate Changes $0.06 Invest Growth $0.10 Wholesale $(0.03) O&M $(0.04) Weather $0.10 Weather $0.02 Annual True-Up $0.10 Renewables $(0.01) Investment Gain $0.09 Normal Load $(0.03) Nor
Slide 9: Weather Normalized Billed Retail Load Trends
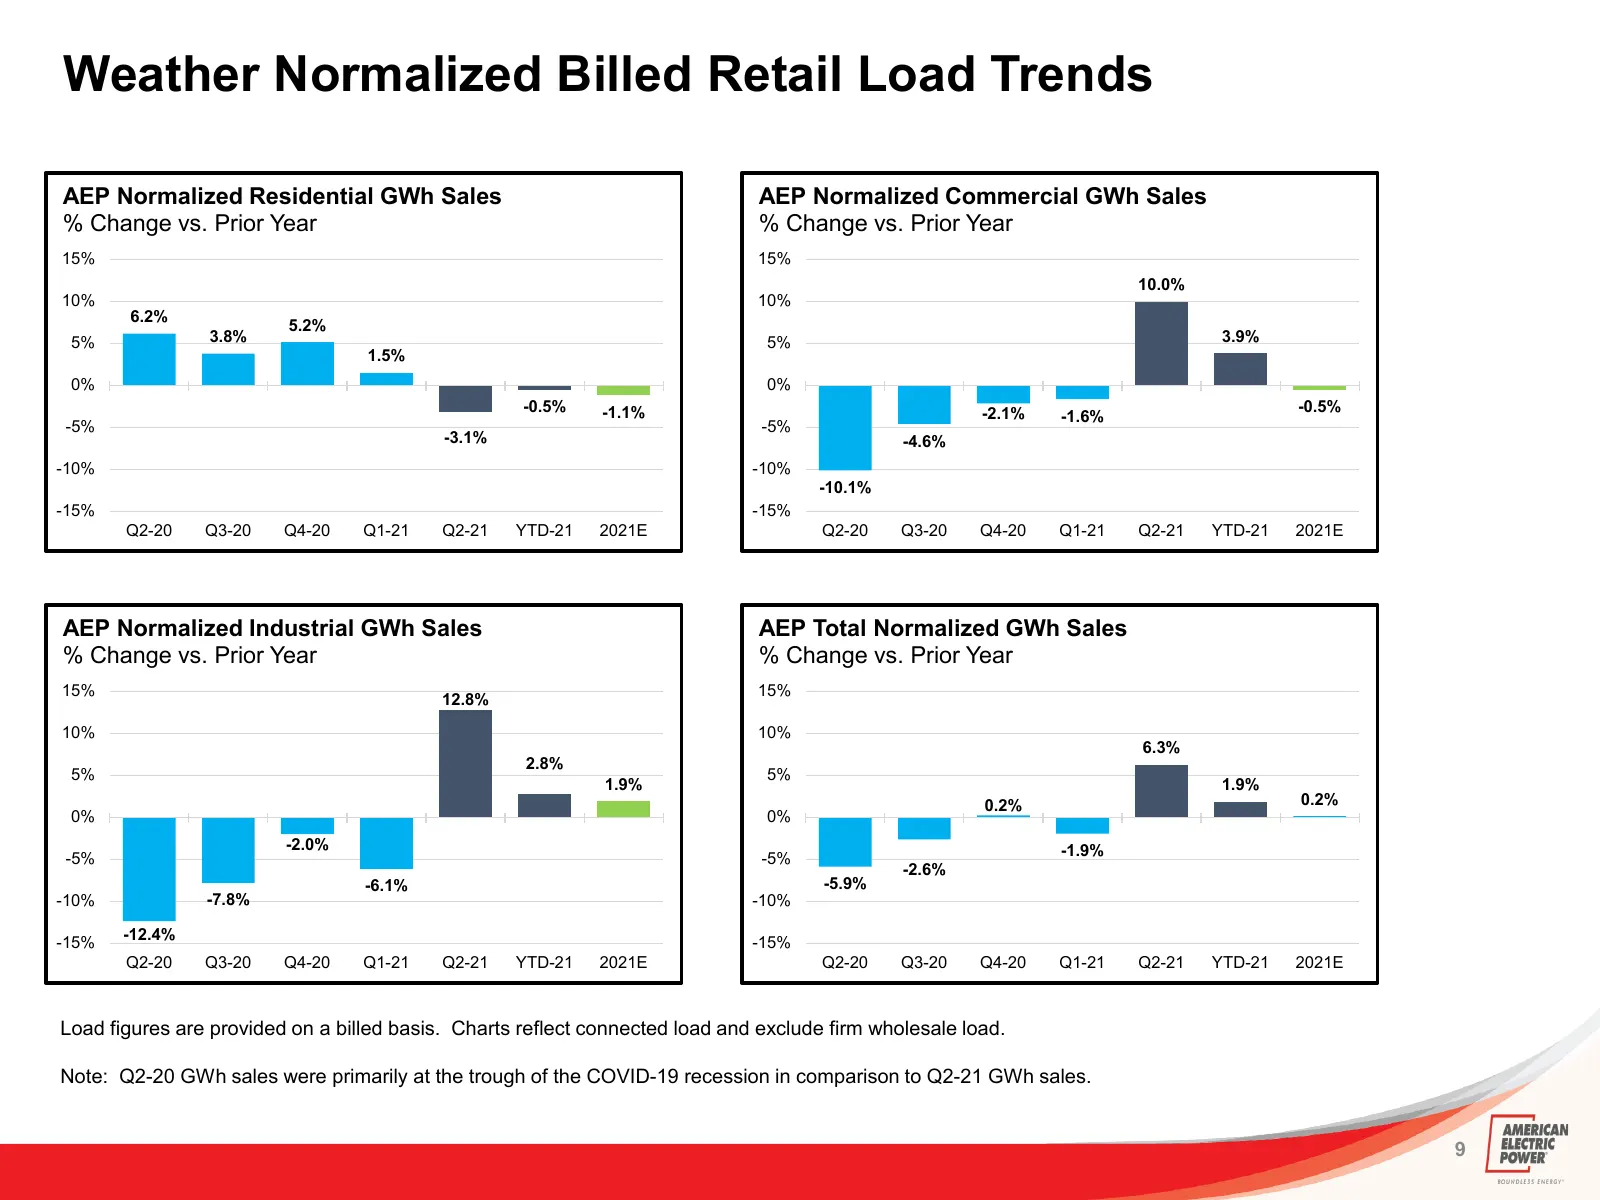
Weather Normalized Billed Retail Load Trends AEP Normalized Residential GWh Sales AEP Normalized Commercial GWh Sales % Change vs. Prior Year % Change vs. Prior Year 15% 15% 10.0% 10% 10% 6.2% 5.2% 5% 3.8% 5% 3.9% 1.5% 0% 0% -0.5% -1.1% -2.1% -0.5% -1.6% -5% -5% -3.1% -4.6% -10% -10% -10.1% -15% -15
Slide 10: AEP Retail Load Recovery
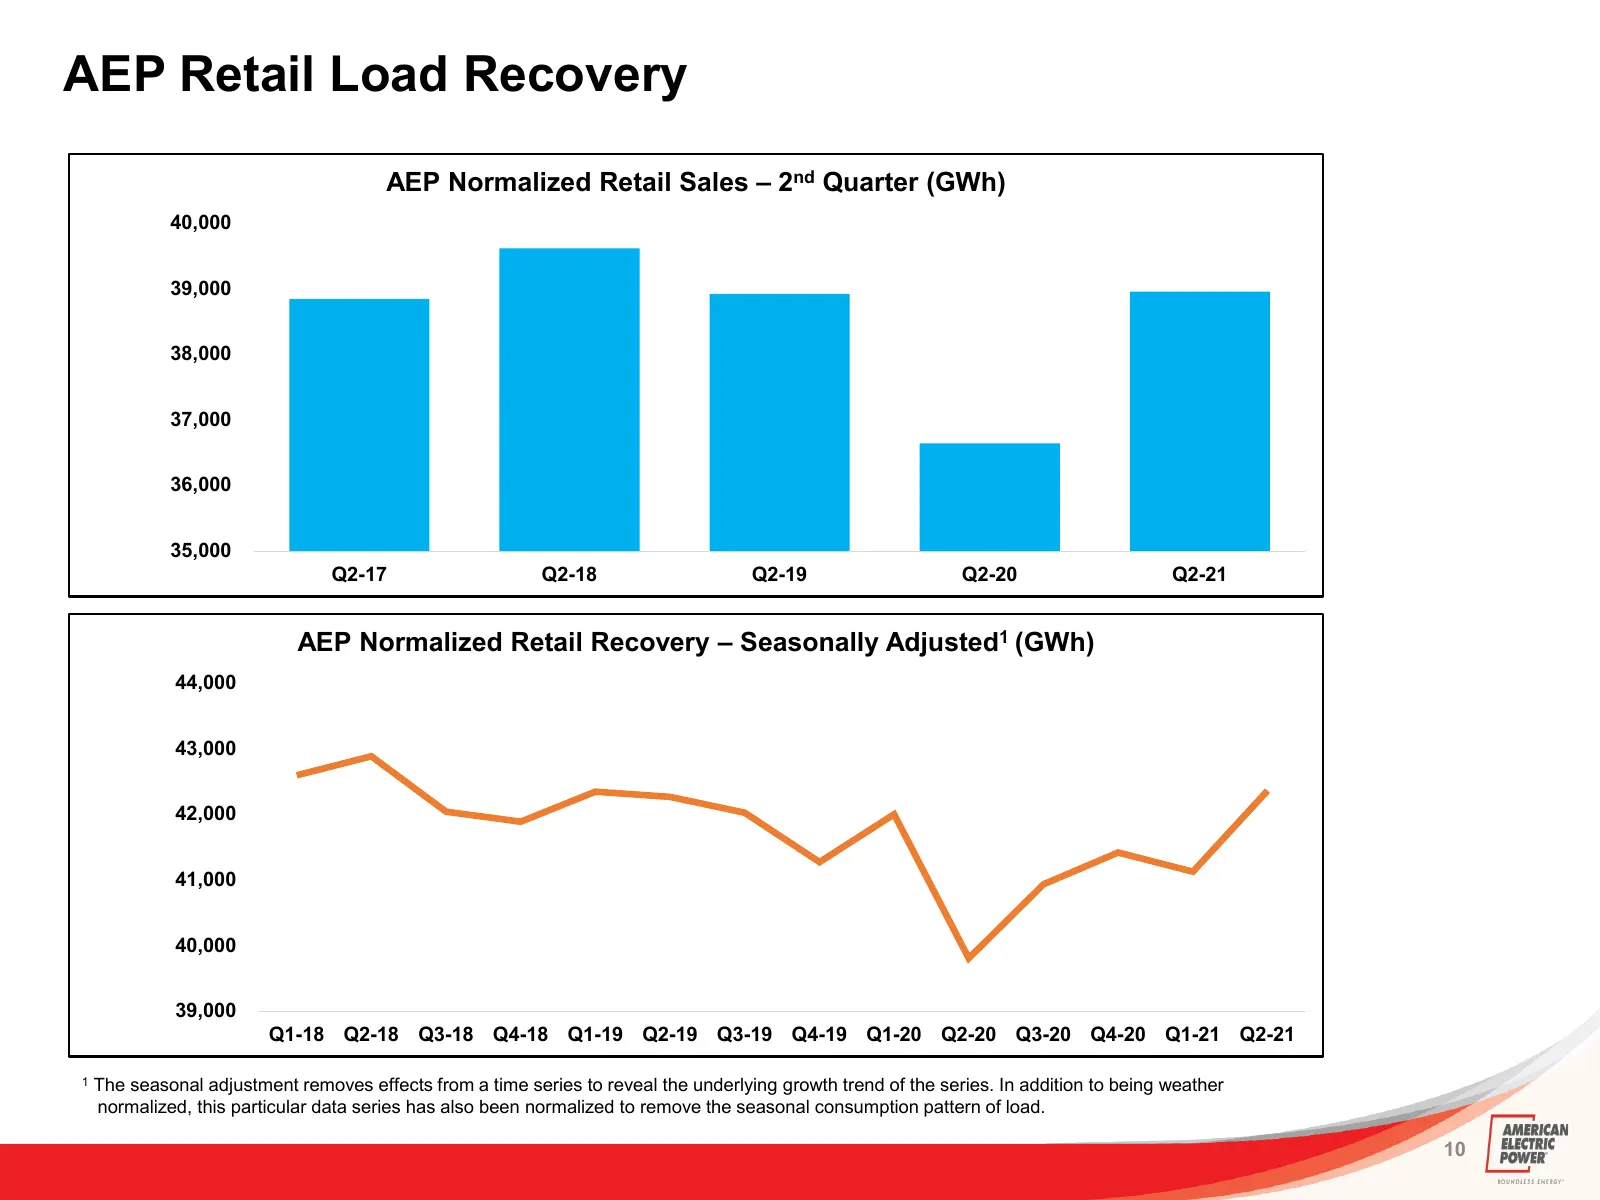
AEP Retail Load Recovery AEP Normalized Retail Sales – 2nd Quarter (GWh) 40,000 39,000 38,000 37,000 36,000 35,000 Q2-17 Q2-18 Q2-19 Q2-20 Q2-21 AEP Normalized Retail Recovery – Seasonally Adjusted1 (GWh) 44,000 43,000 42,000 41,000 40,000 39,000 Q1-18 Q2-18 Q3-18 Q4-18 Q1-19 Q2-19 Q3-19 Q4-19 Q1-20
Slide 11: Capitalization & Liquidity
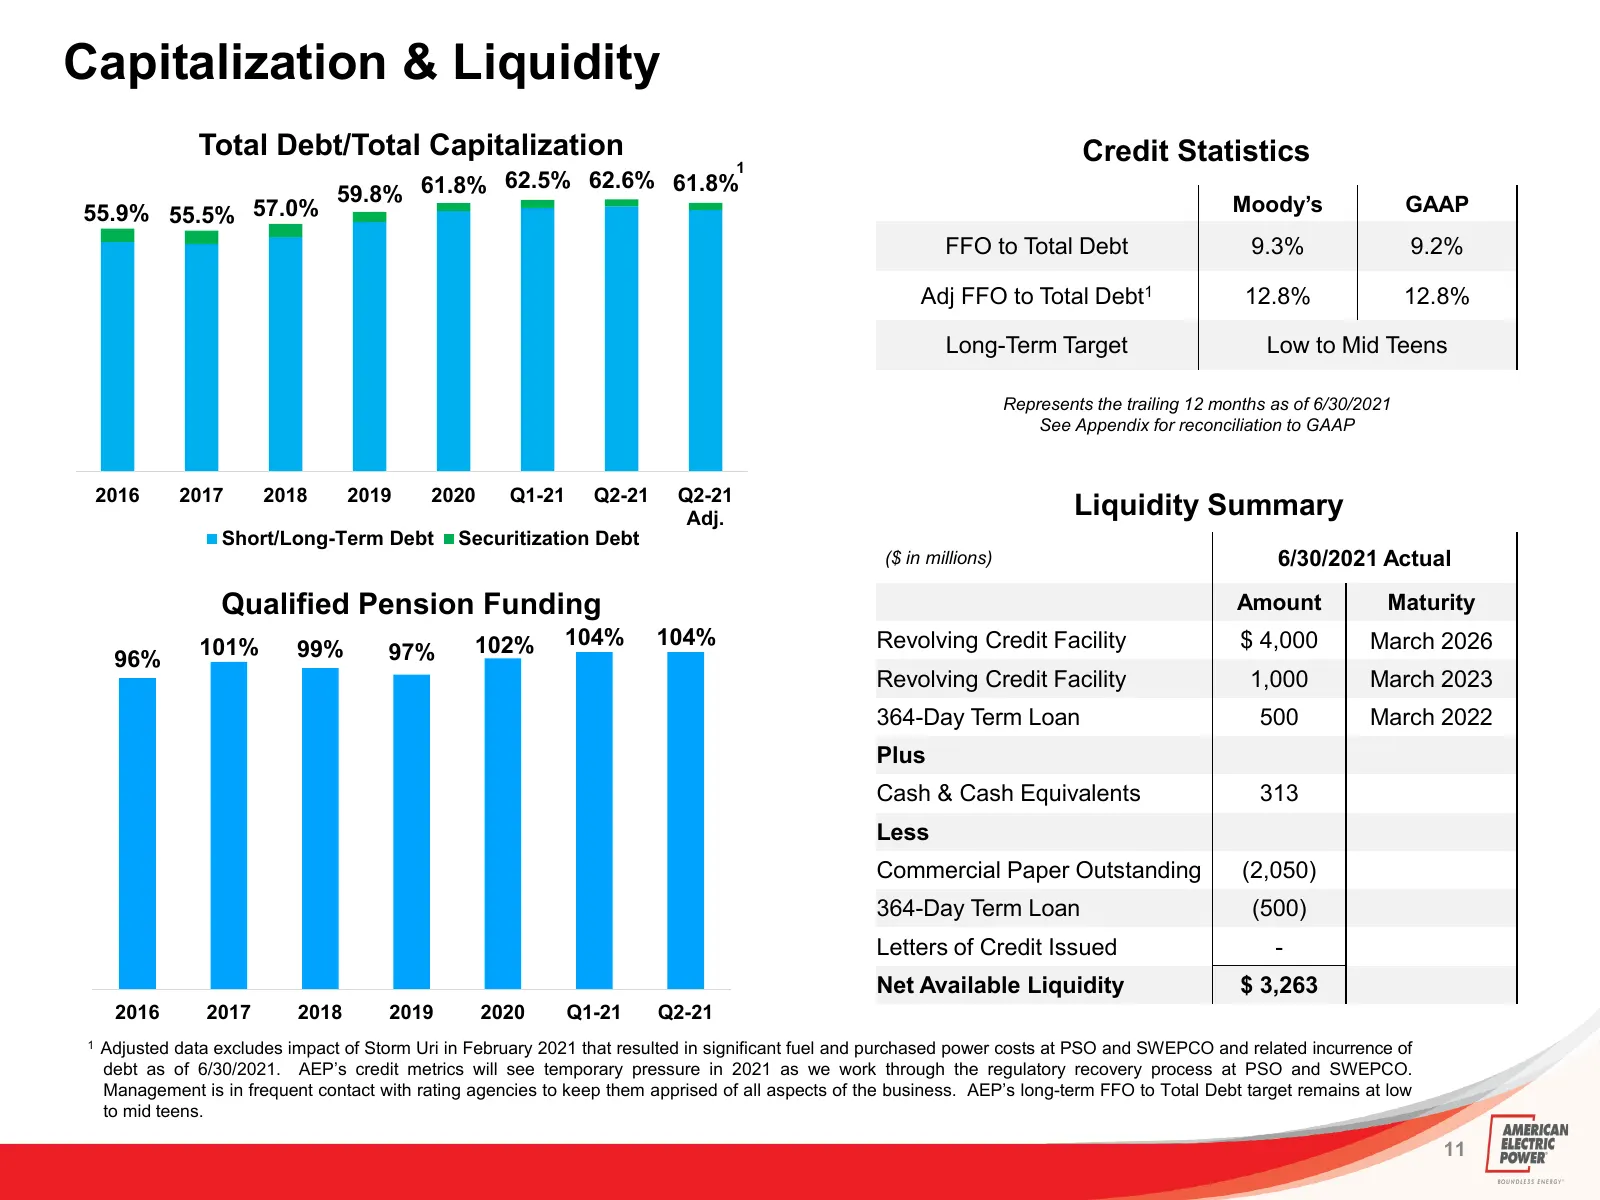
Capitalization & Liquidity Total Debt/Total Capitalization Credit Statistics 1 62.5% 62.6% 61.8% 59.8% 61.8% Moody’s GAAP 55.9% 55.5% 57.0% FFO to Total Debt 9.3% 9.2% Adj FFO to Total Debt1 12.8% 12.8% Long-Term Target Low to Mid Teens Represents the trailing 12 months as of 6/30/2021 See Appendix
Slide 12: Summary
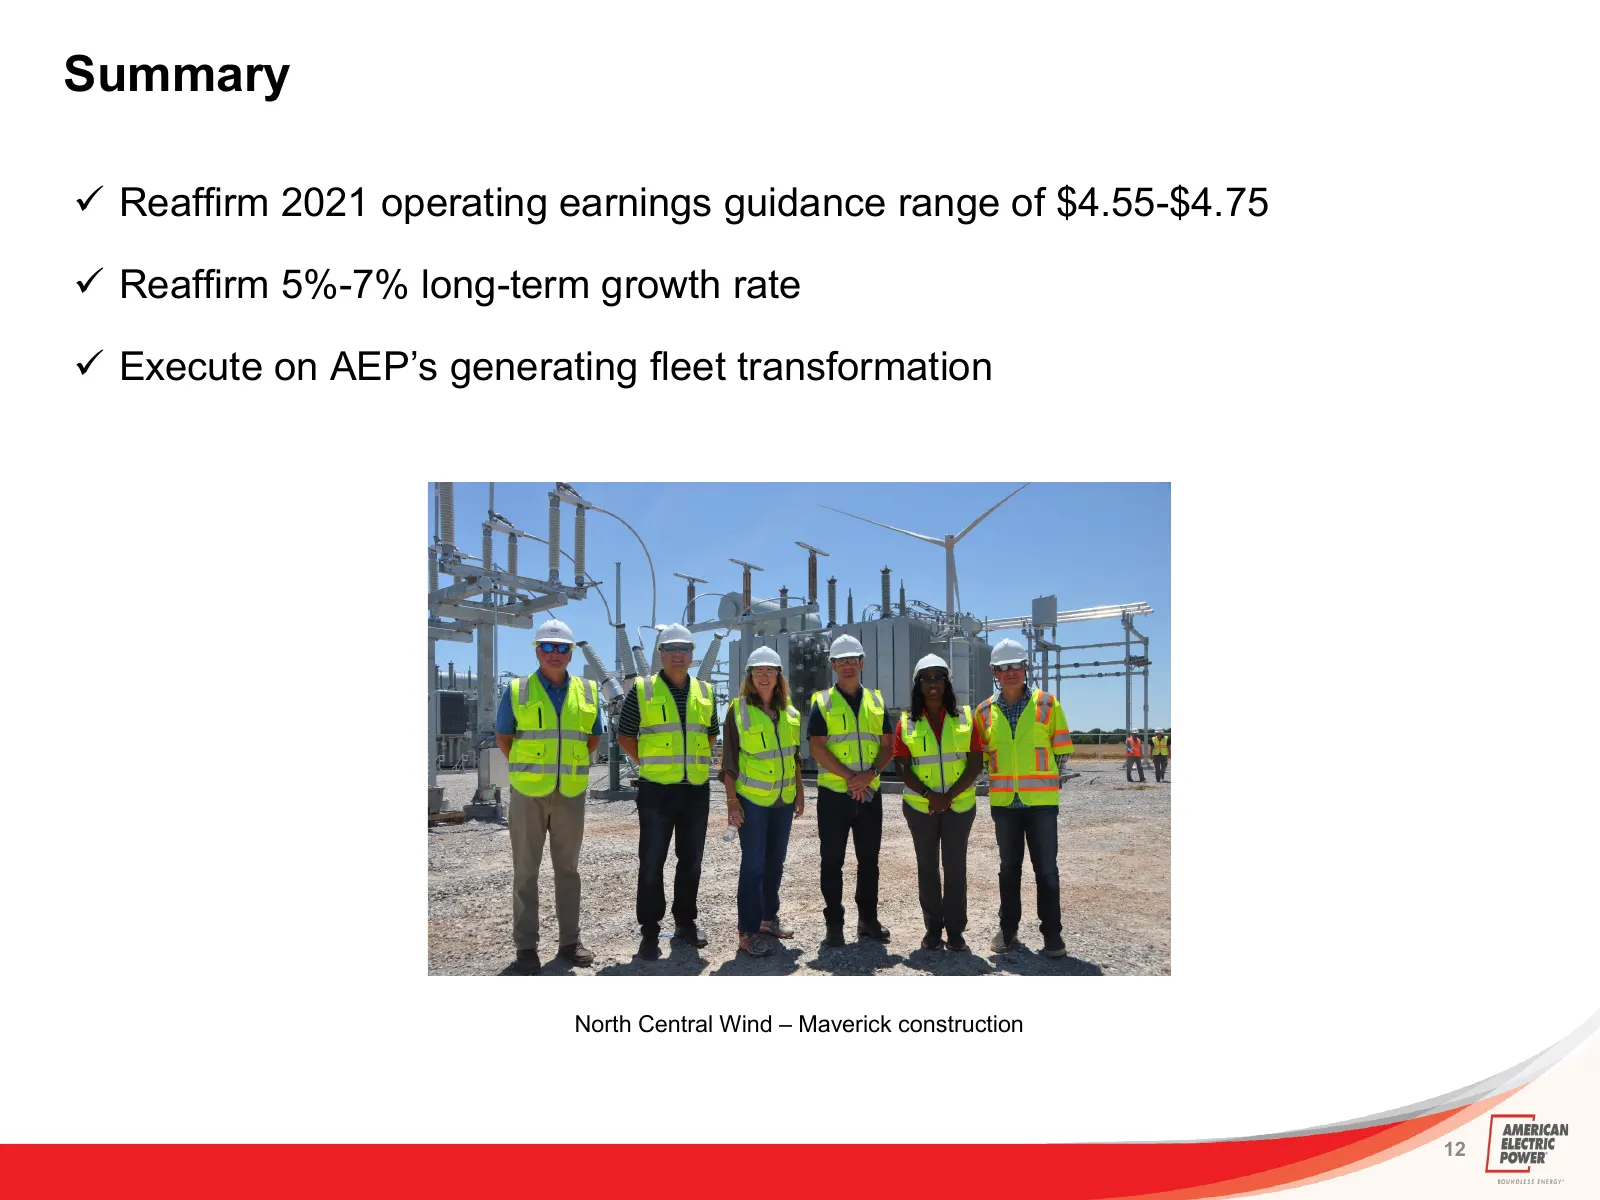
Summary Reaffirm 2021 operating earnings guidance range of $4.55-$4.75 Reaffirm 5%-7% long-term growth rate Execute on AEP’s generating fleet transformation North Central Wind – Maverick construction 12
Slide 13: Appendix
APPENDIX 13
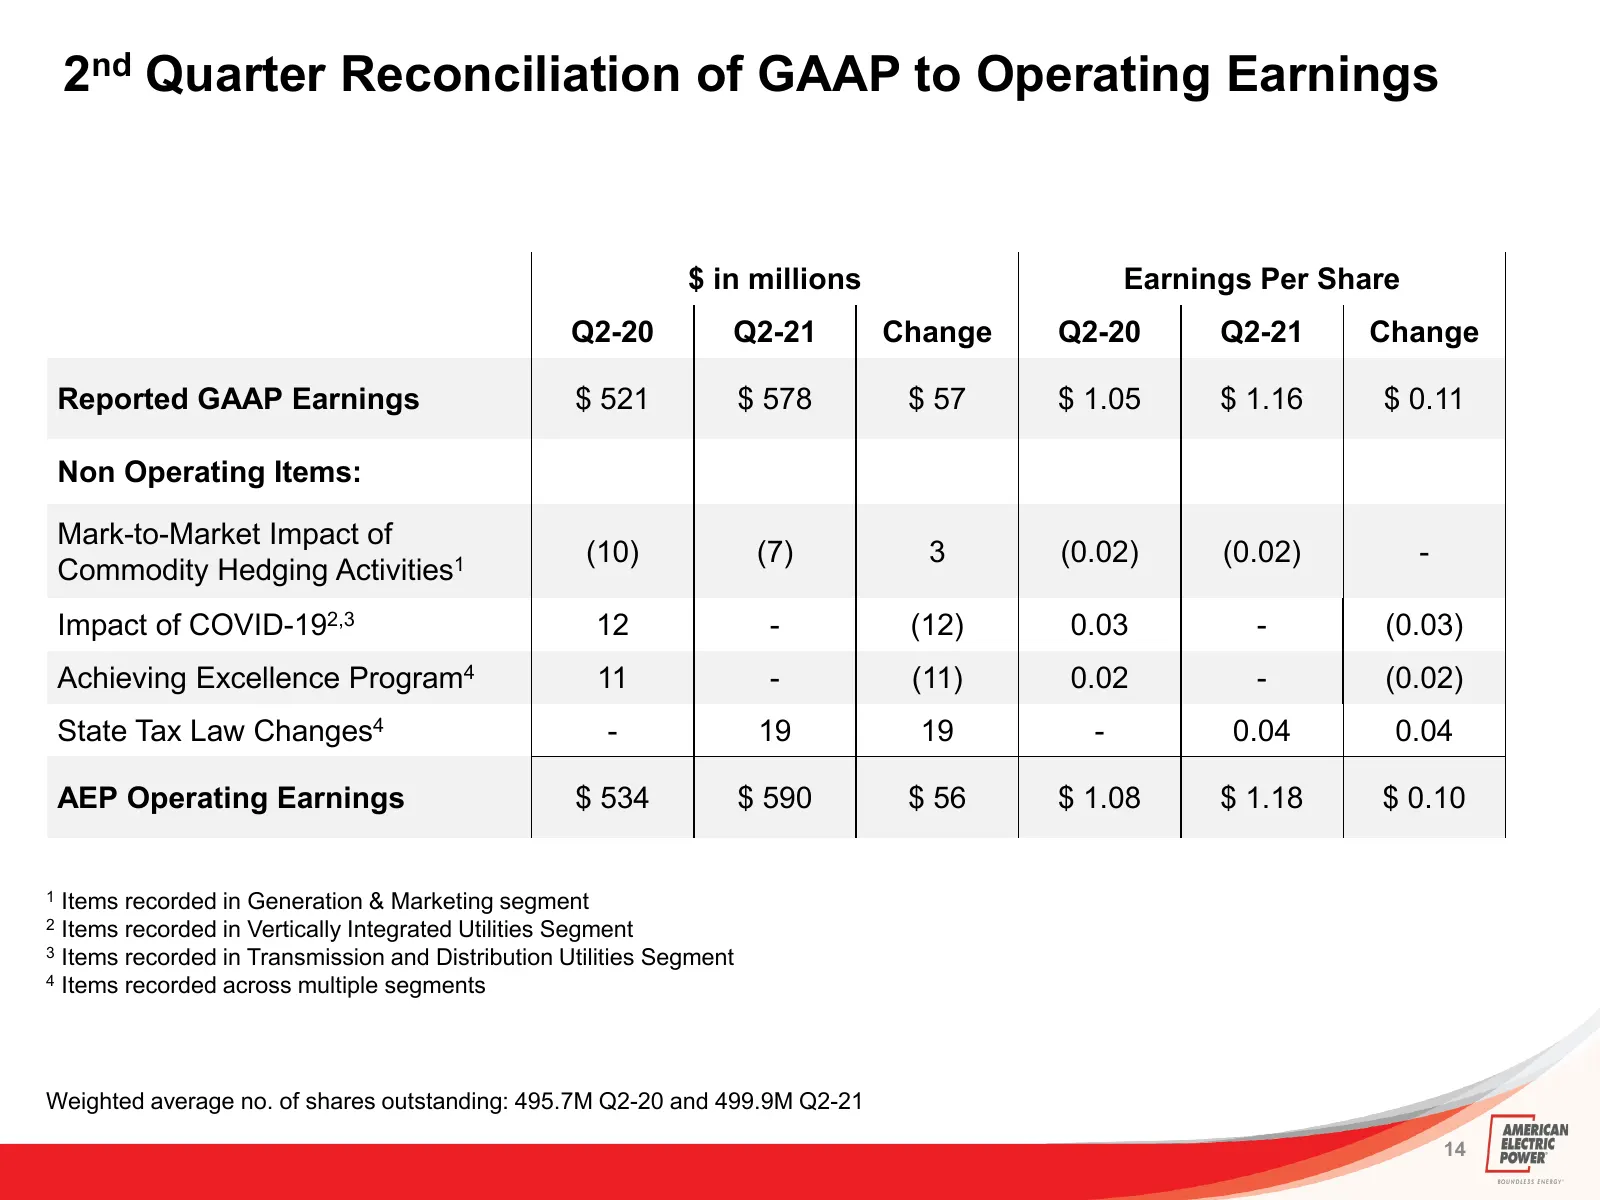
Slide 14: 2nd Quarter Reconciliation of GAAP to Operating Earnings
2nd Quarter Reconciliation of GAAP to Operating Earnings $ in millions Earnings Per Share Q2-20 Q2-21 Change Q2-20 Q2-21 Change Reported GAAP Earnings $ 521 $ 578 $ 57 $ 1.05 $ 1.16 $ 0.11 Non Operating Items: Mark-to-Market Impact of (10) (7) 3 (0.02) (0.02) - Commodity Hedging Activities1 Impact o
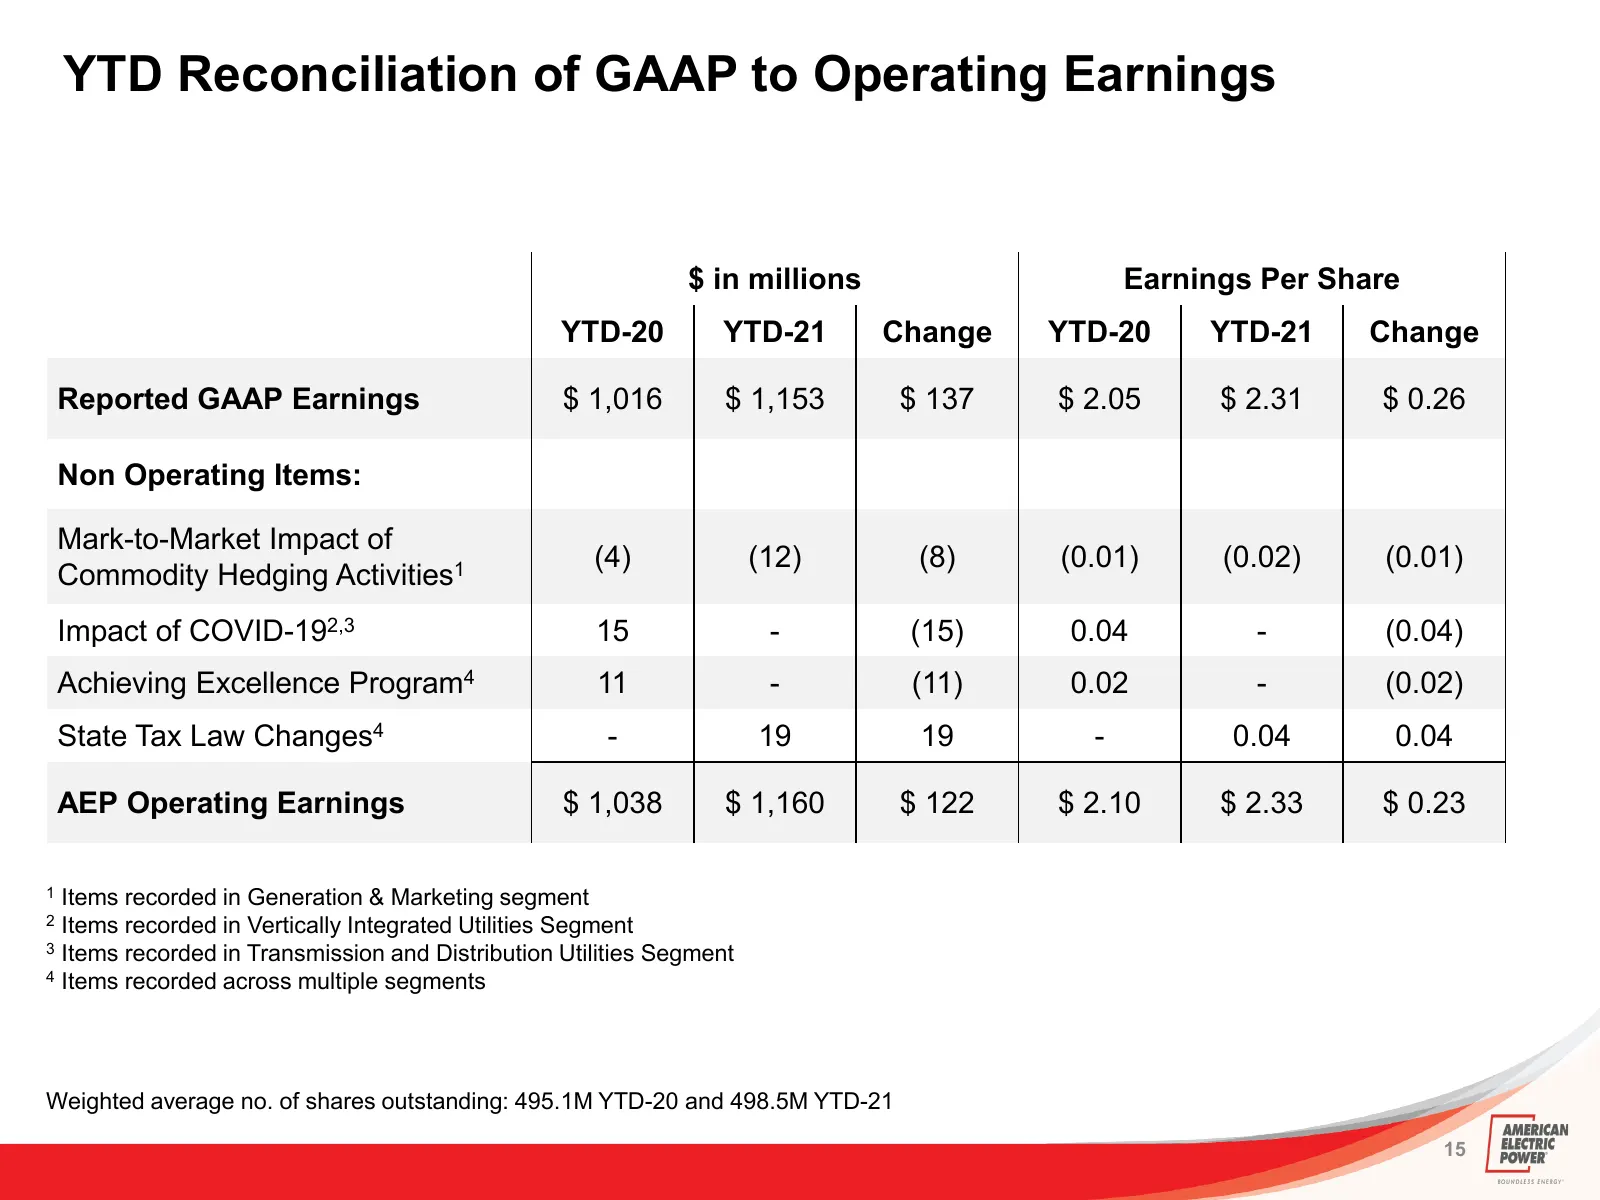
Slide 15: YTD Reconciliation of GAAP to Operating Earnings
YTD Reconciliation of GAAP to Operating Earnings $ in millions Earnings Per Share YTD-20 YTD-21 Change YTD-20 YTD-21 Change Reported GAAP Earnings $ 1,016 $ 1,153 $ 137 $ 2.05 $ 2.31 $ 0.26 Non Operating Items: Mark-to-Market Impact of (4) (12) (8) (0.01) (0.02) (0.01) Commodity Hedging Activities1
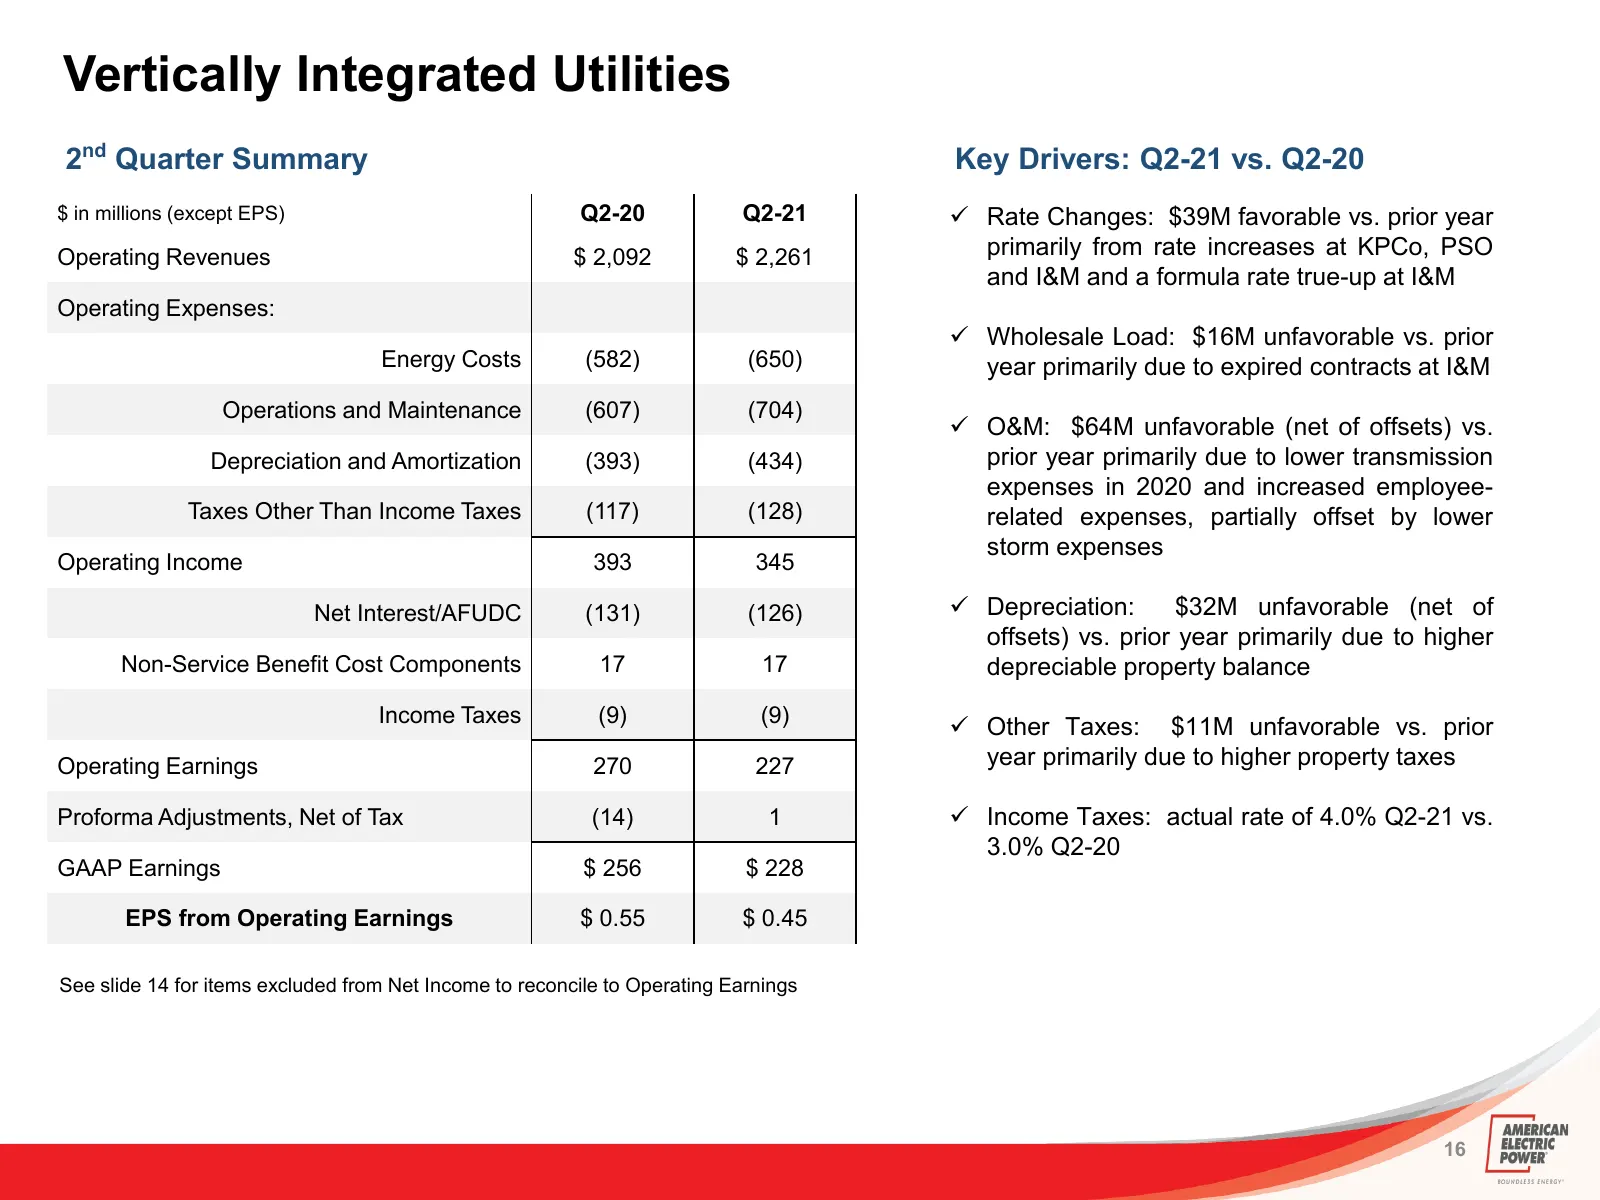
Slide 16: Vertically Integrated Utilities - 2nd Quarter
Vertically Integrated Utilities 2nd Quarter Summary Key Drivers: Q2-21 vs. Q2-20 $ in millions (except EPS) Q2-20 Q2-21 Rate Changes: $39M favorable vs. prior year Operating Revenues $ 2,092 $ 2,261 primarily from rate increases at KPCo, PSO and I&M and a formula rate true-up at I&M Operating Expe
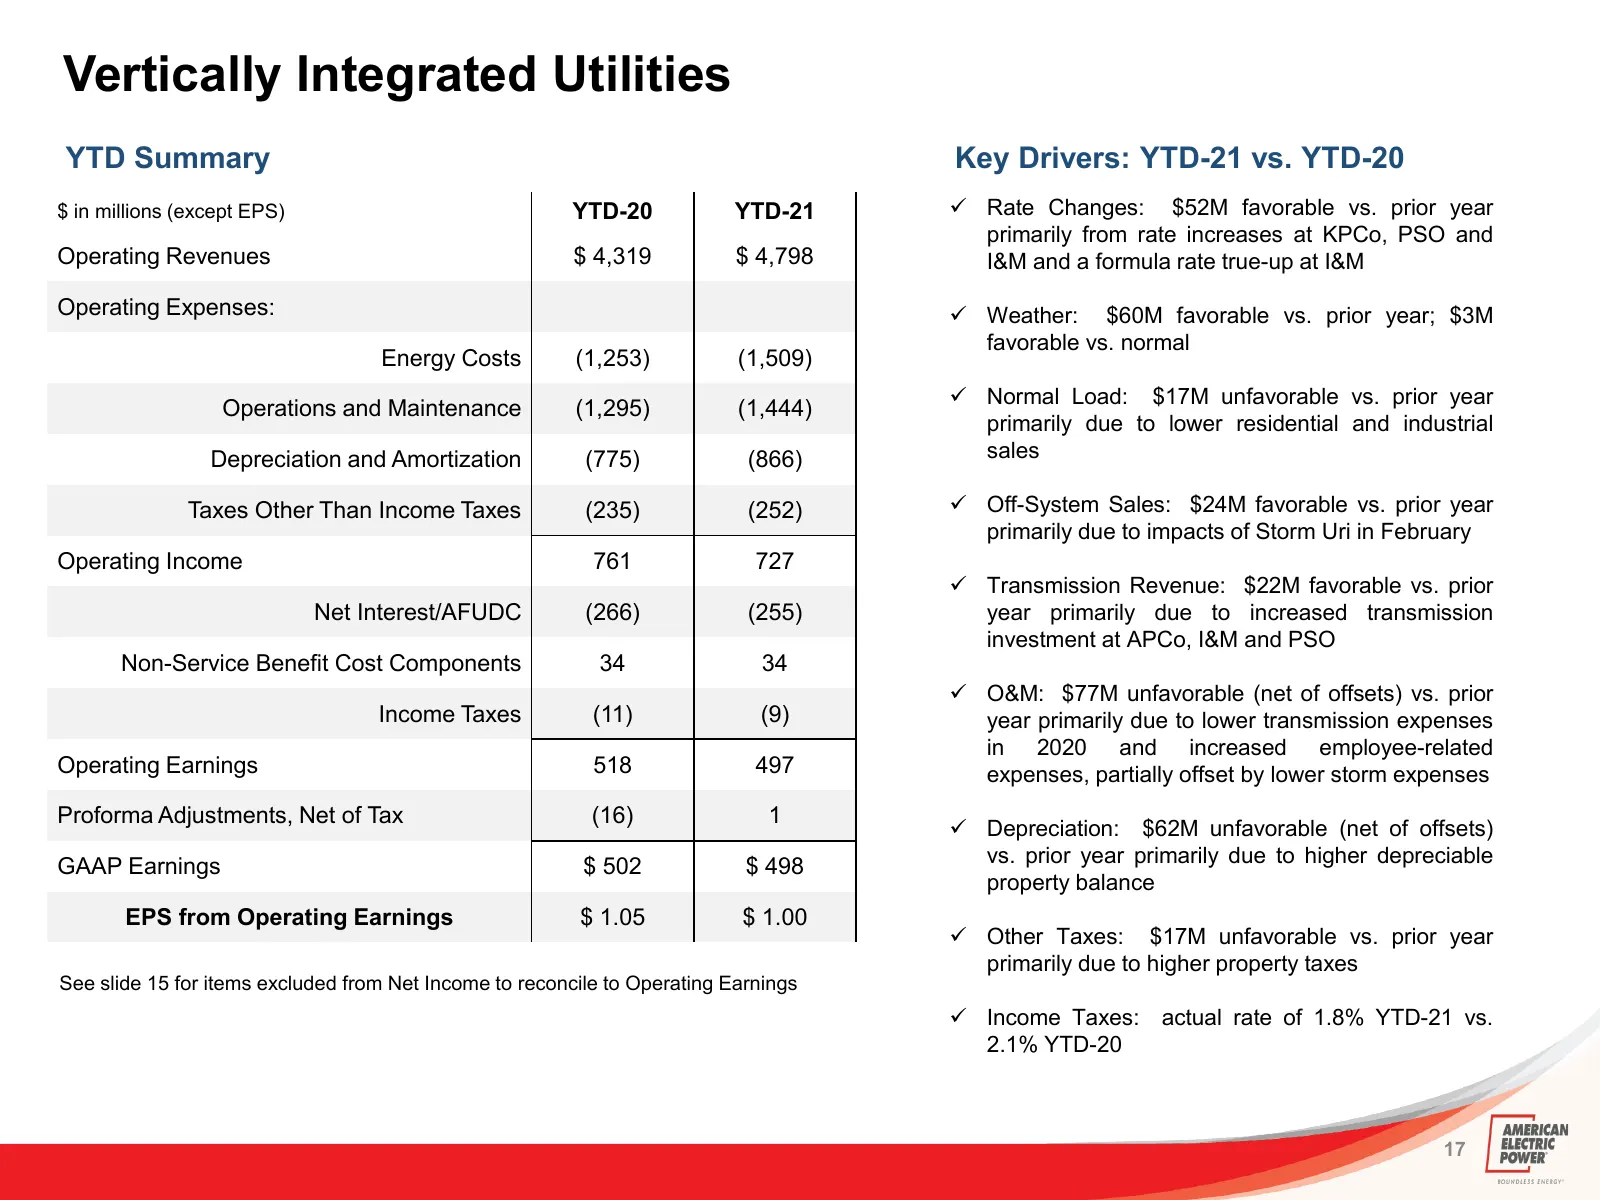
Slide 17: Vertically Integrated Utilities - YTD
Vertically Integrated Utilities YTD Summary Key Drivers: YTD-21 vs. YTD-20 $ in millions (except EPS) YTD-20 YTD-21 Rate Changes: $52M favorable vs. prior year primarily from rate increases at KPCo, PSO and Operating Revenues $ 4,319 $ 4,798 I&M and a formula rate true-up at I&M Operating Expenses
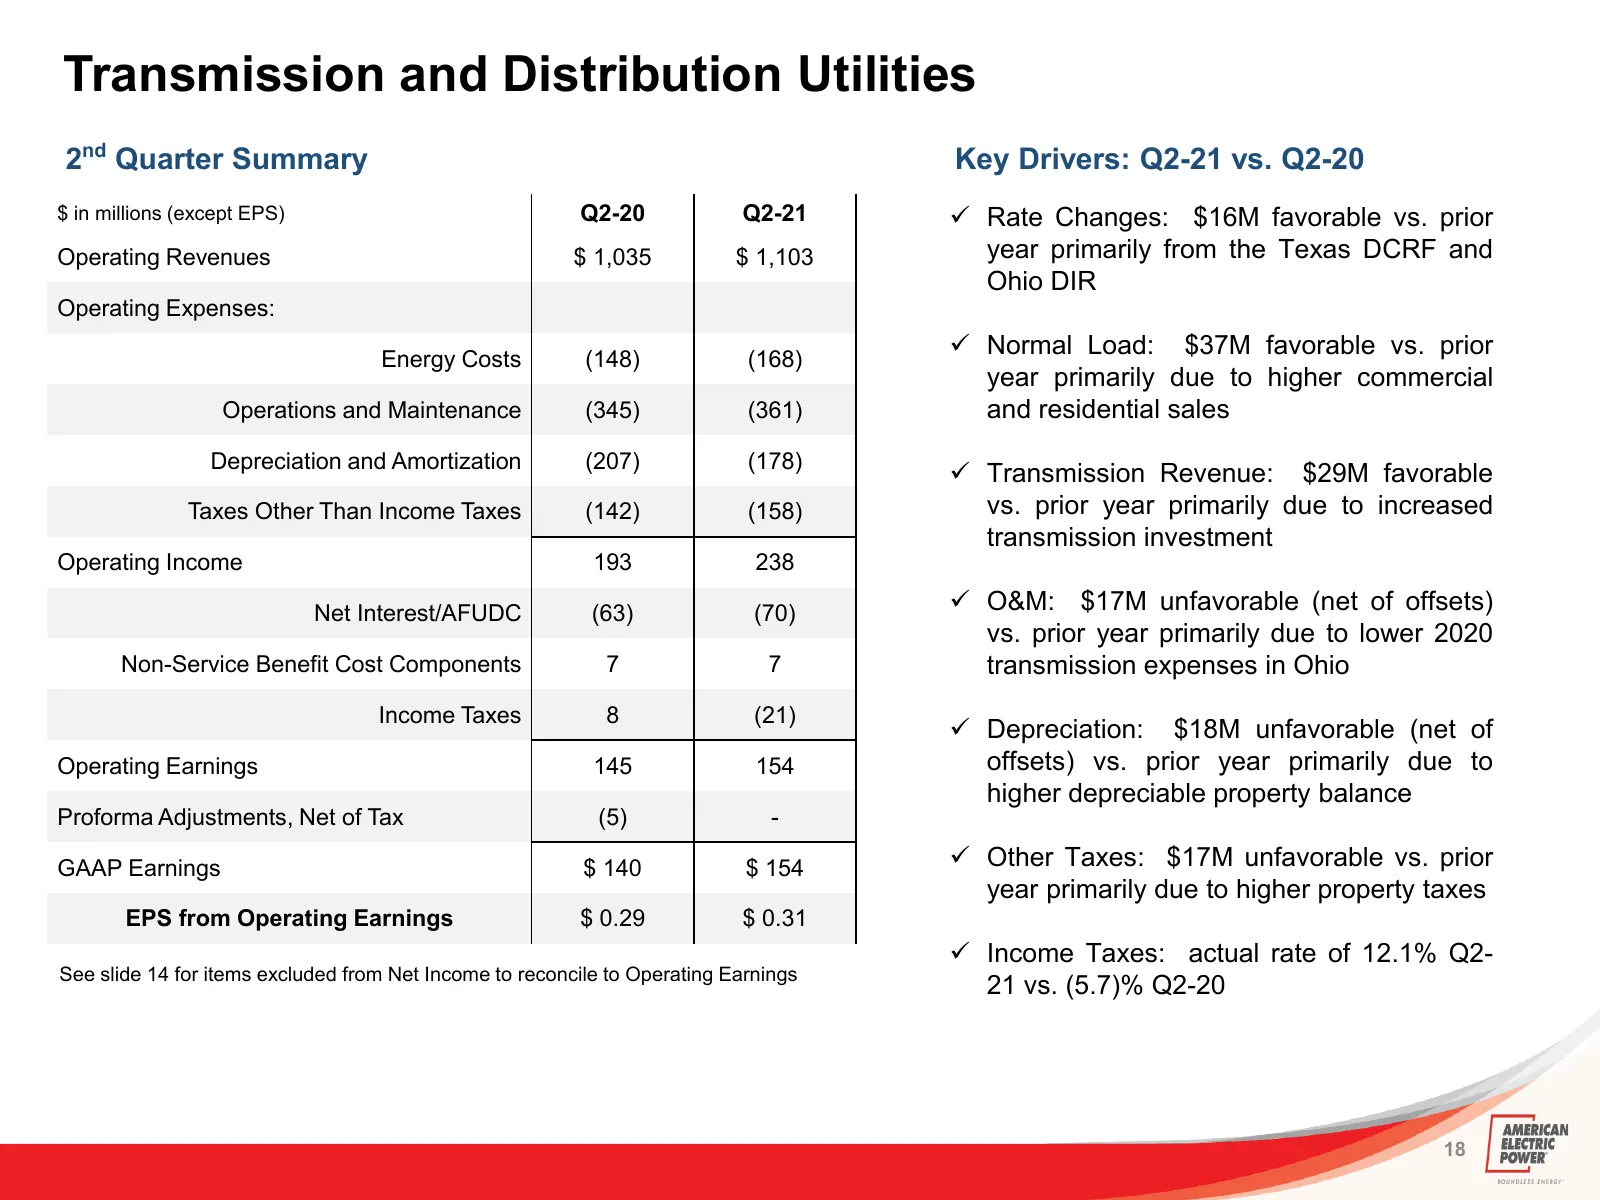
Slide 18: Transmission and Distribution Utilities - 2nd Quarter
Transmission and Distribution Utilities 2nd Quarter Summary Key Drivers: Q2-21 vs. Q2-20 $ in millions (except EPS) Q2-20 Q2-21 Rate Changes: $16M favorable vs. prior Operating Revenues $ 1,035 $ 1,103 year primarily from the Texas DCRF and Ohio DIR Operating Expenses: Energy Costs (148) (168) N
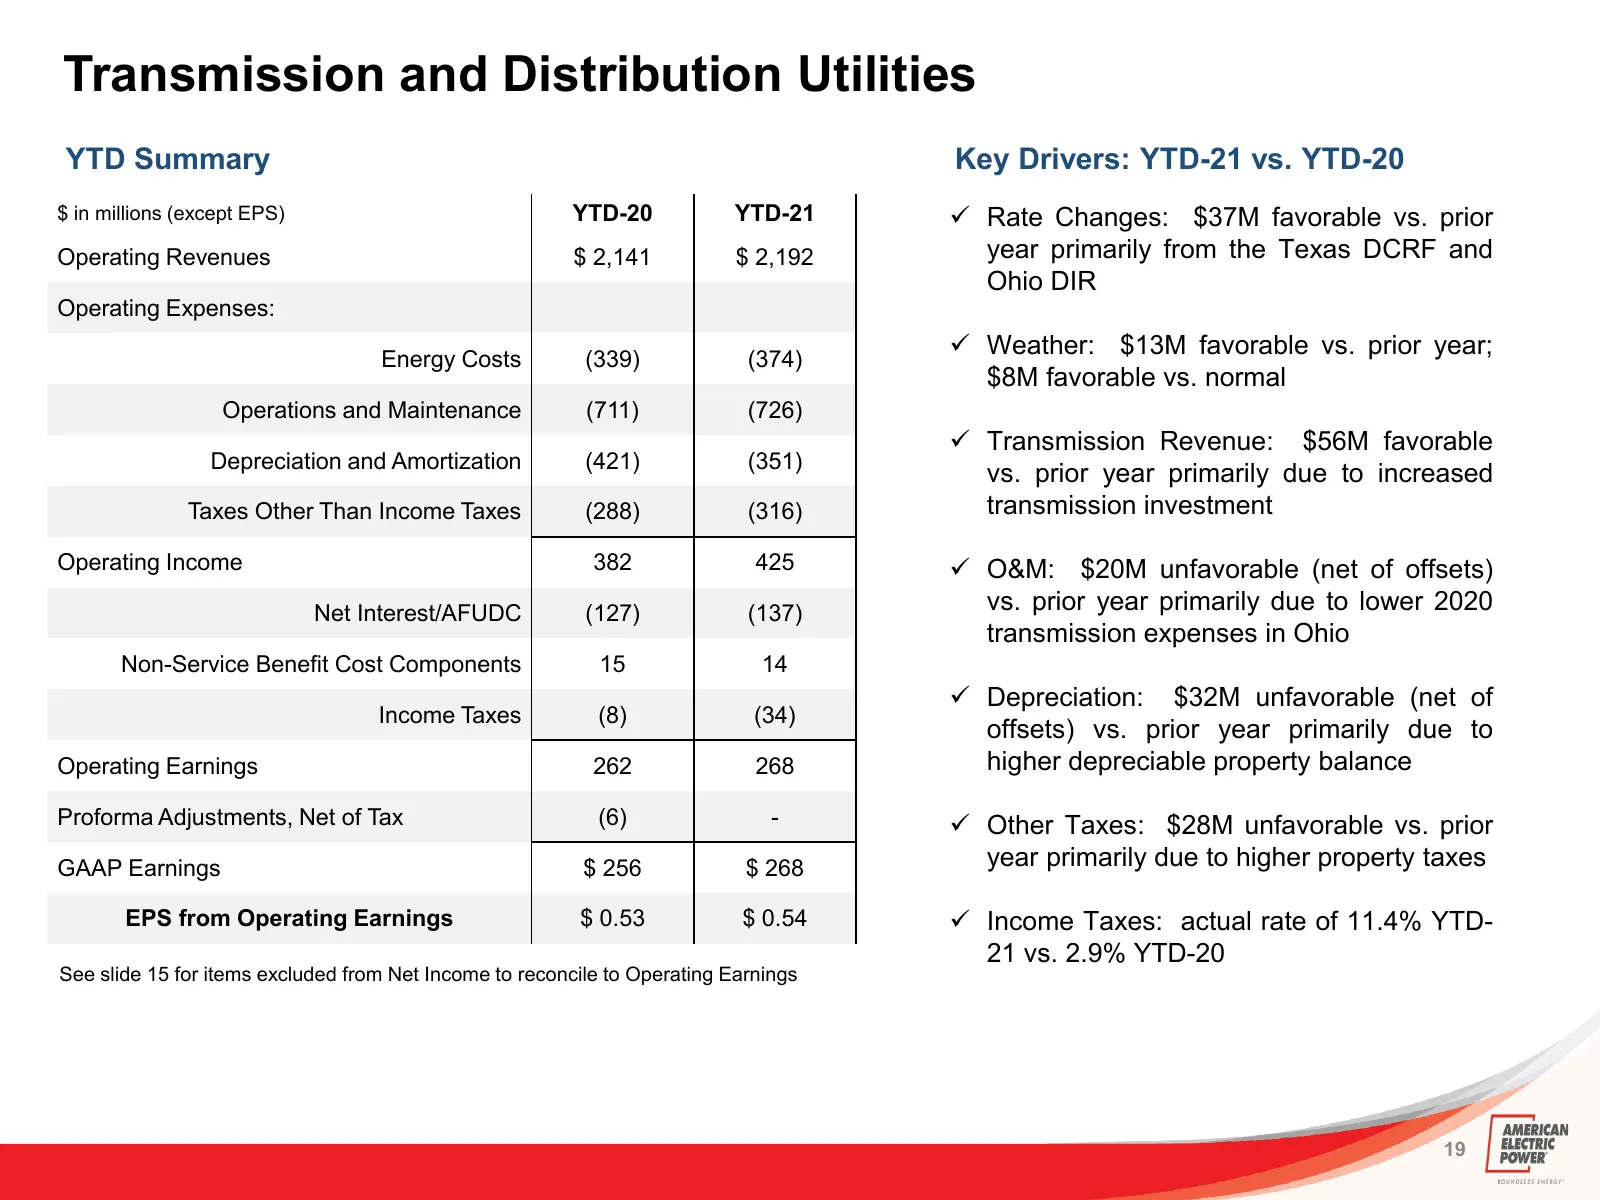
Slide 19: Transmission and Distribution Utilities - YTD
Transmission and Distribution Utilities YTD Summary Key Drivers: YTD-21 vs. YTD-20 $ in millions (except EPS) YTD-20 YTD-21 Rate Changes: $37M favorable vs. prior Operating Revenues $ 2,141 $ 2,192 year primarily from the Texas DCRF and Ohio DIR Operating Expenses: Energy Costs (339) (374) Weath
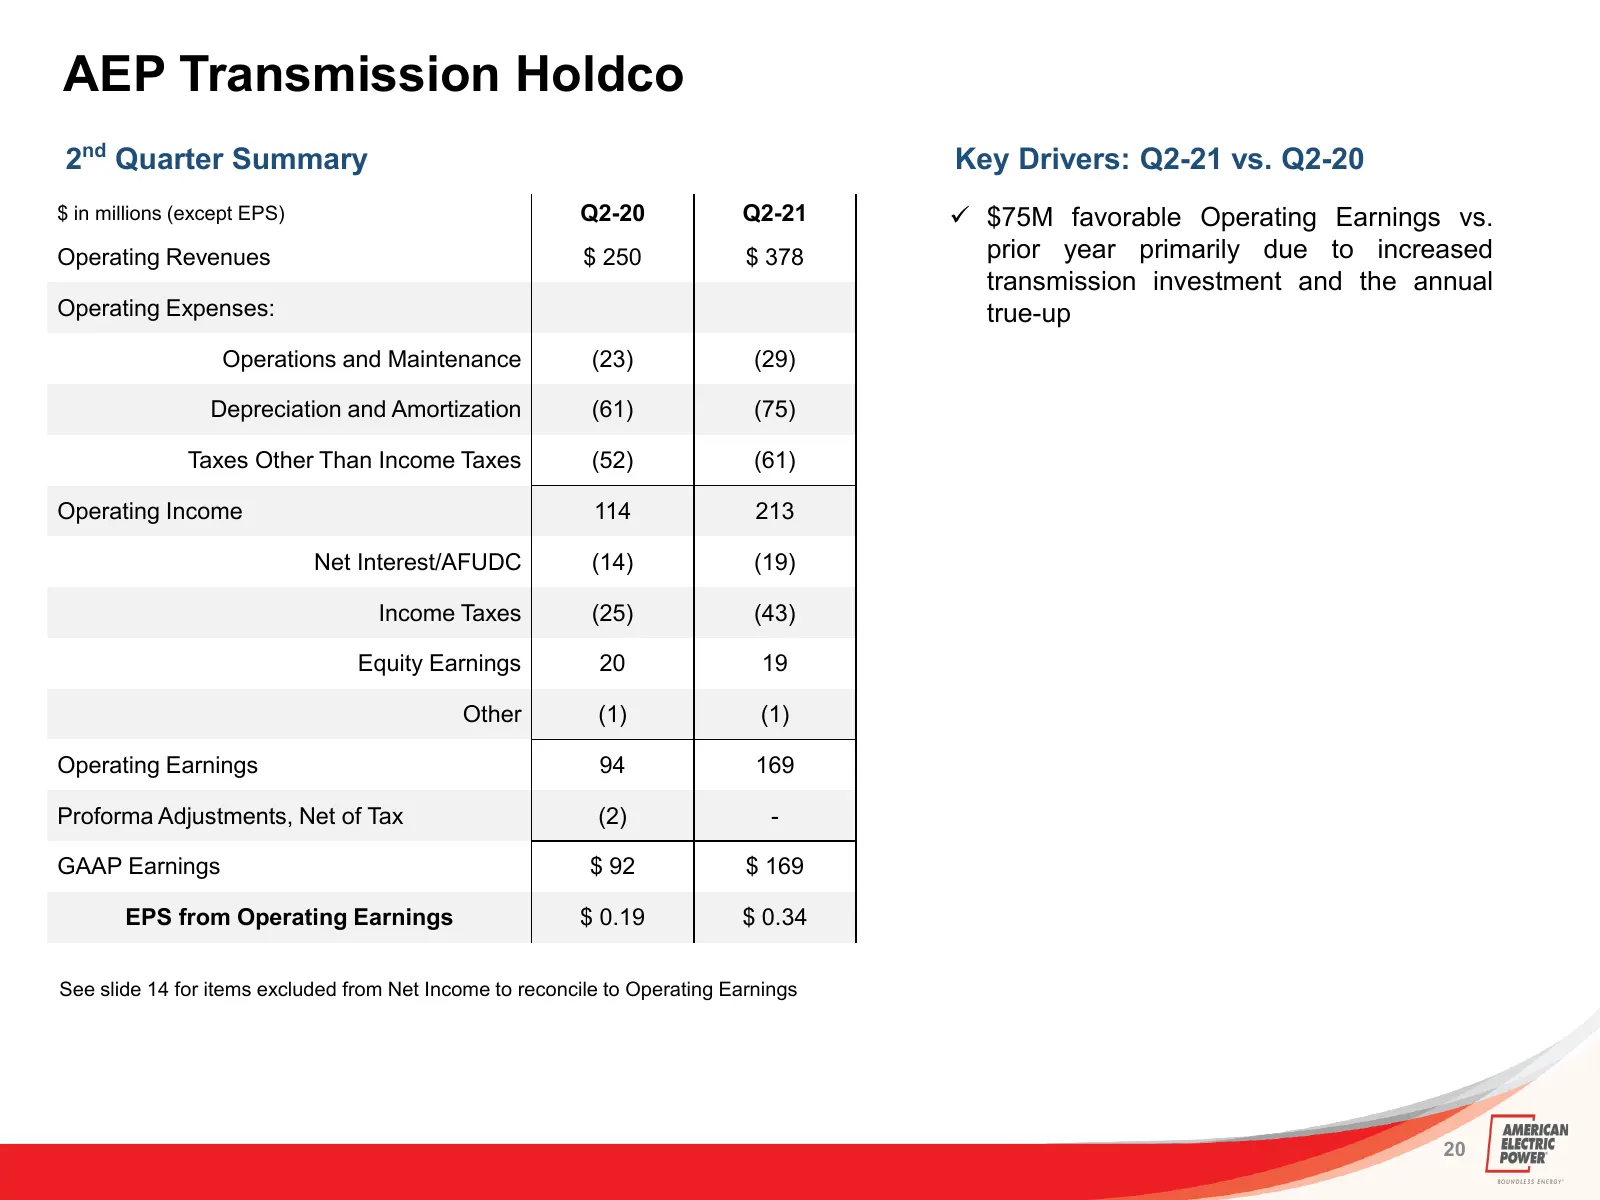
Slide 20: AEP Transmission Holdco - 2nd Quarter
AEP Transmission Holdco 2nd Quarter Summary Key Drivers: Q2-21 vs. Q2-20 $ in millions (except EPS) Q2-20 Q2-21 $75M favorable Operating Earnings vs. Operating Revenues $ 250 $ 378 prior year primarily due to increased transmission investment and the annual Operating Expenses: true-up Operations a
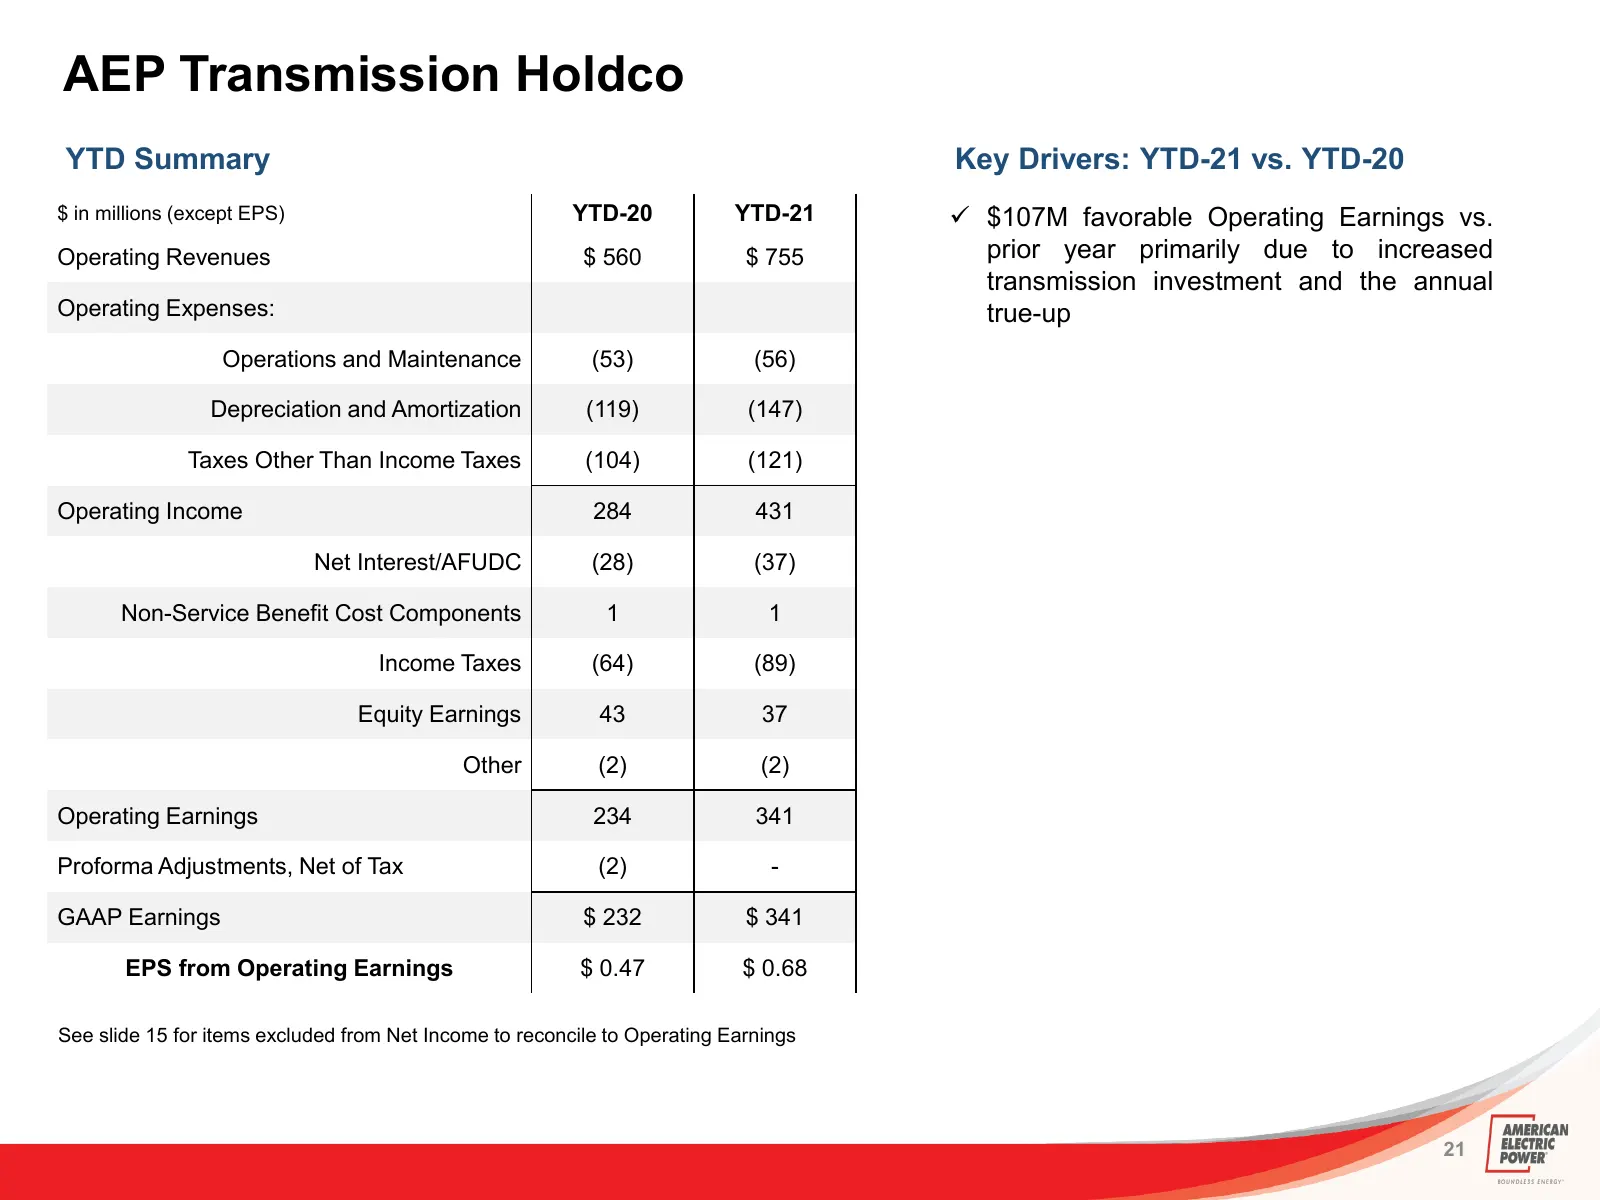
Slide 21: AEP Transmission Holdco - YTD
AEP Transmission Holdco YTD Summary Key Drivers: YTD-21 vs. YTD-20 $ in millions (except EPS) YTD-20 YTD-21 $107M favorable Operating Earnings vs. Operating Revenues $ 560 $ 755 prior year primarily due to increased transmission investment and the annual Operating Expenses: true-up Operations and
Slide 22: Generation & Marketing - 2nd Quarter
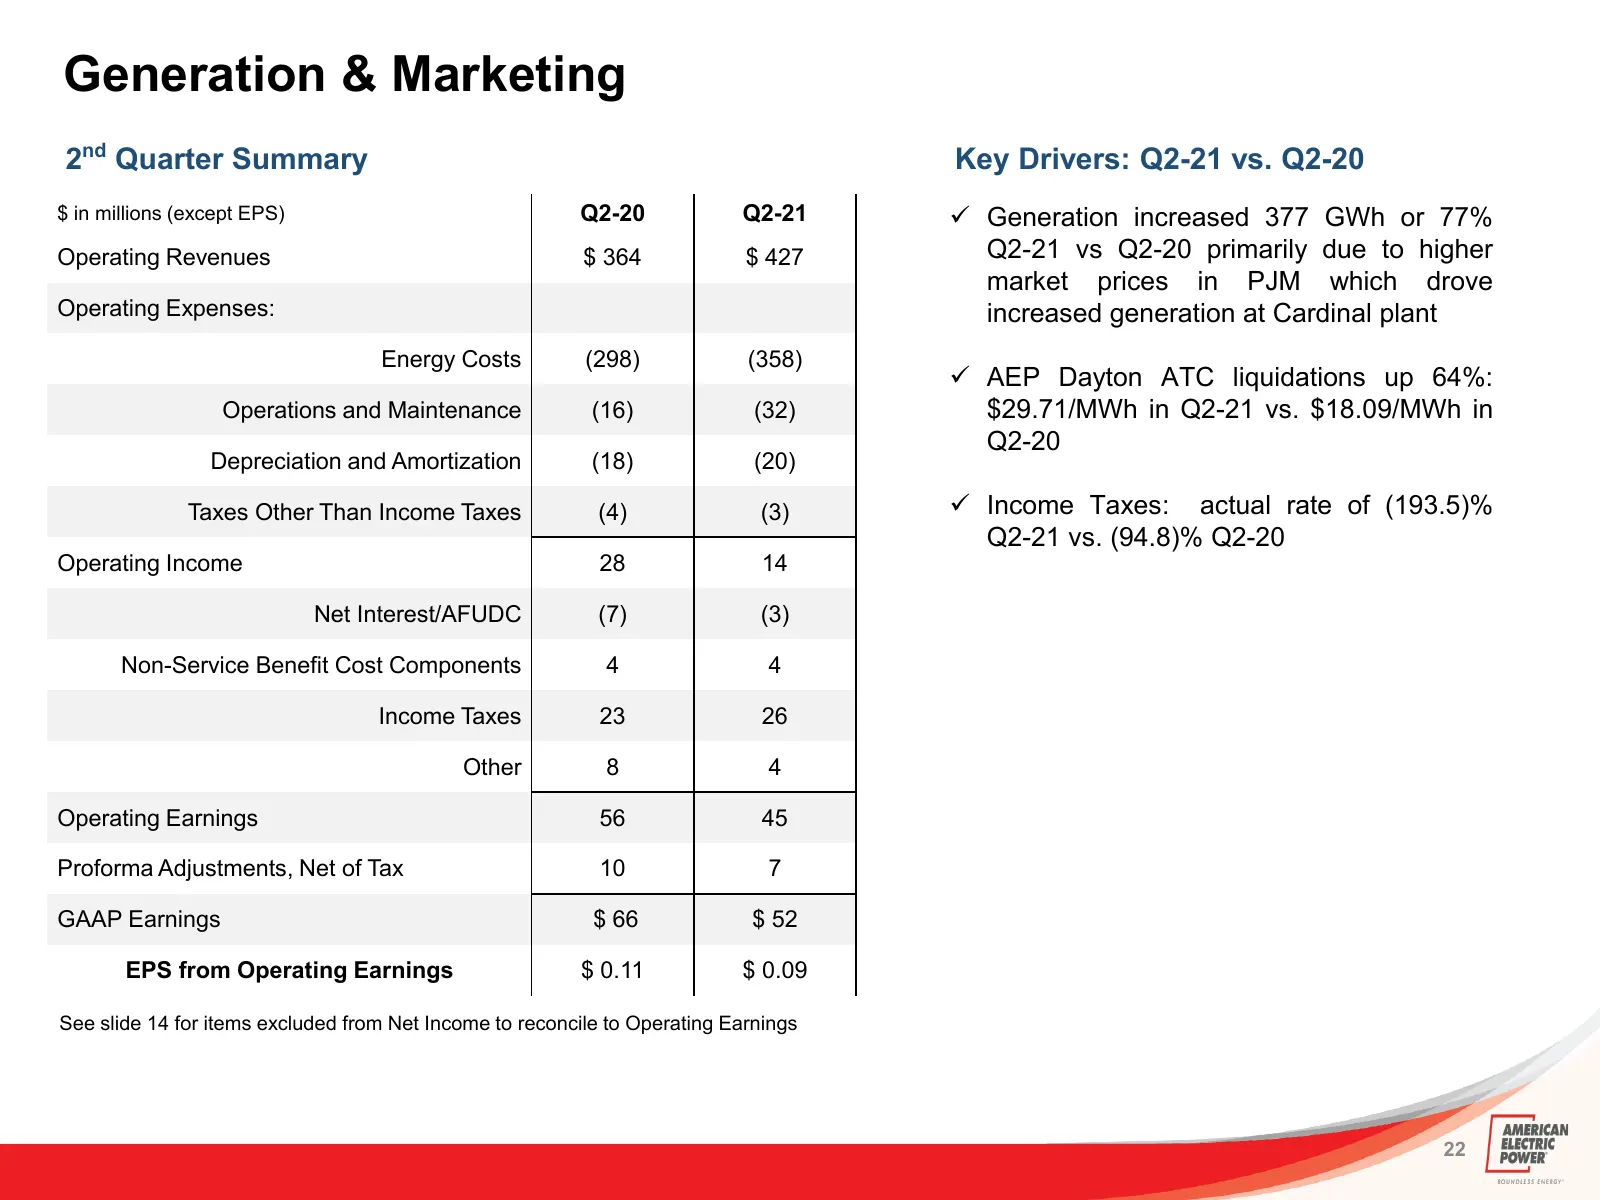
Generation & Marketing 2nd Quarter Summary Key Drivers: Q2-21 vs. Q2-20 $ in millions (except EPS) Q2-20 Q2-21 Generation increased 377 GWh or 77% Operating Revenues $ 364 $ 427 Q2-21 vs Q2-20 primarily due to higher market prices in PJM which drove Operating Expenses: increased generation at Card
Slide 23: Generation & Marketing - YTD
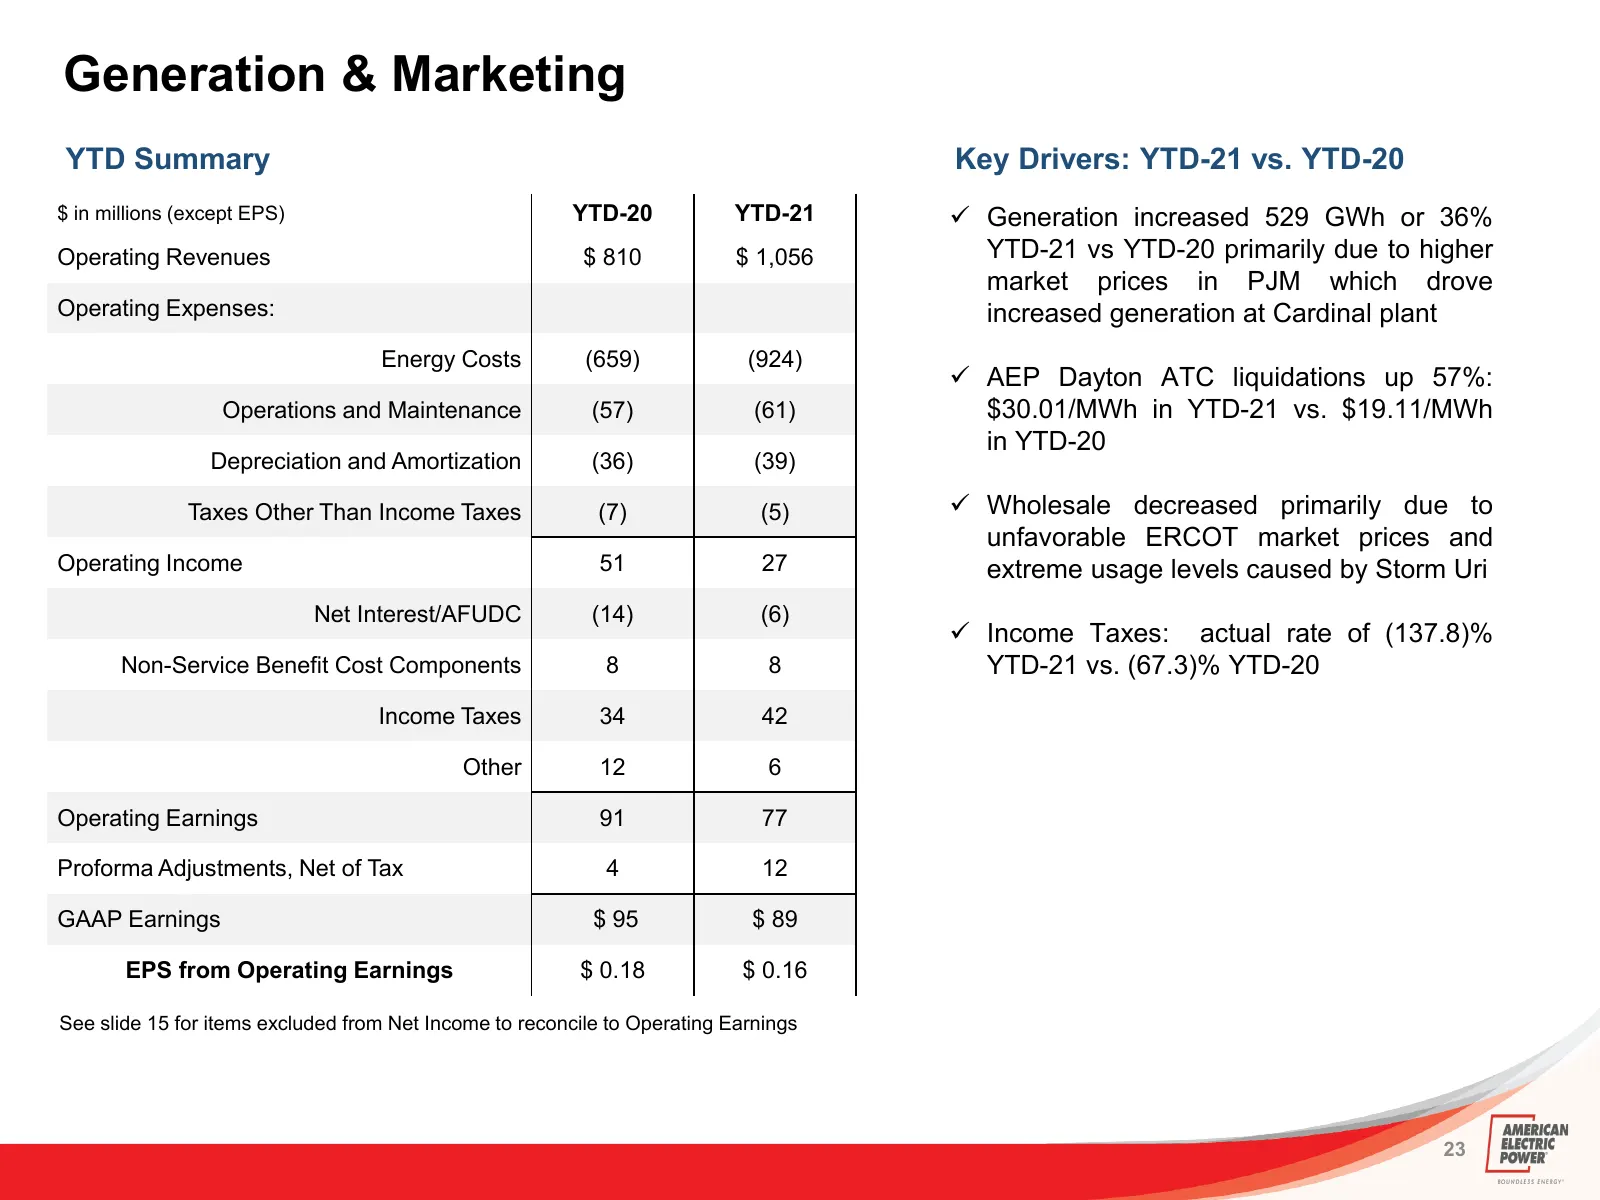
Generation & Marketing YTD Summary Key Drivers: YTD-21 vs. YTD-20 $ in millions (except EPS) YTD-20 YTD-21 Generation increased 529 GWh or 36% Operating Revenues $ 810 $ 1,056 YTD-21 vs YTD-20 primarily due to higher market prices in PJM which drove Operating Expenses: increased generation at Card
Slide 24: 2nd Quarter Rate Performance
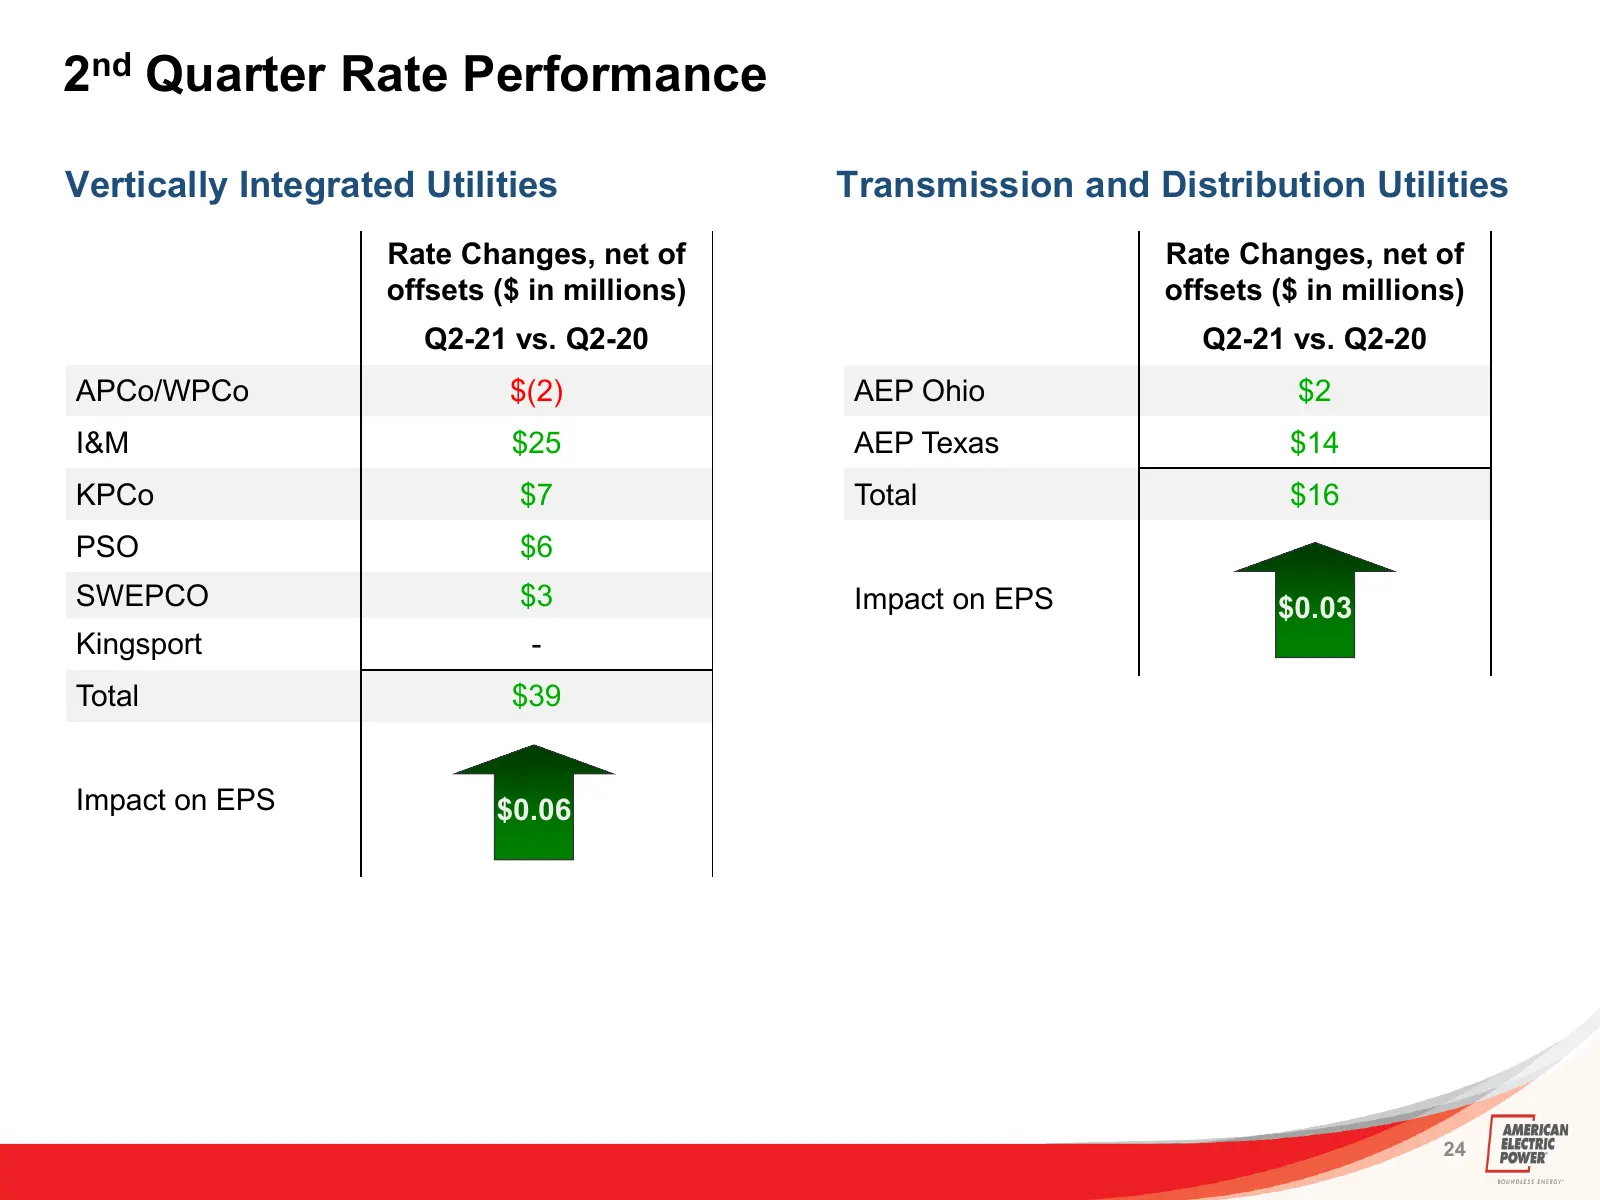
2nd Quarter Rate Performance Vertically Integrated Utilities Transmission and Distribution Utilities Rate Changes, net of Rate Changes, net of offsets ($ in millions) offsets ($ in millions) Q2-21 vs. Q2-20 Q2-21 vs. Q2-20 APCo/WPCo $(2) AEP Ohio $2 I&M $25 AEP Texas $14 KPCo $7 Total $16 PSO $6 SWE
Slide 25: YTD Rate Performance
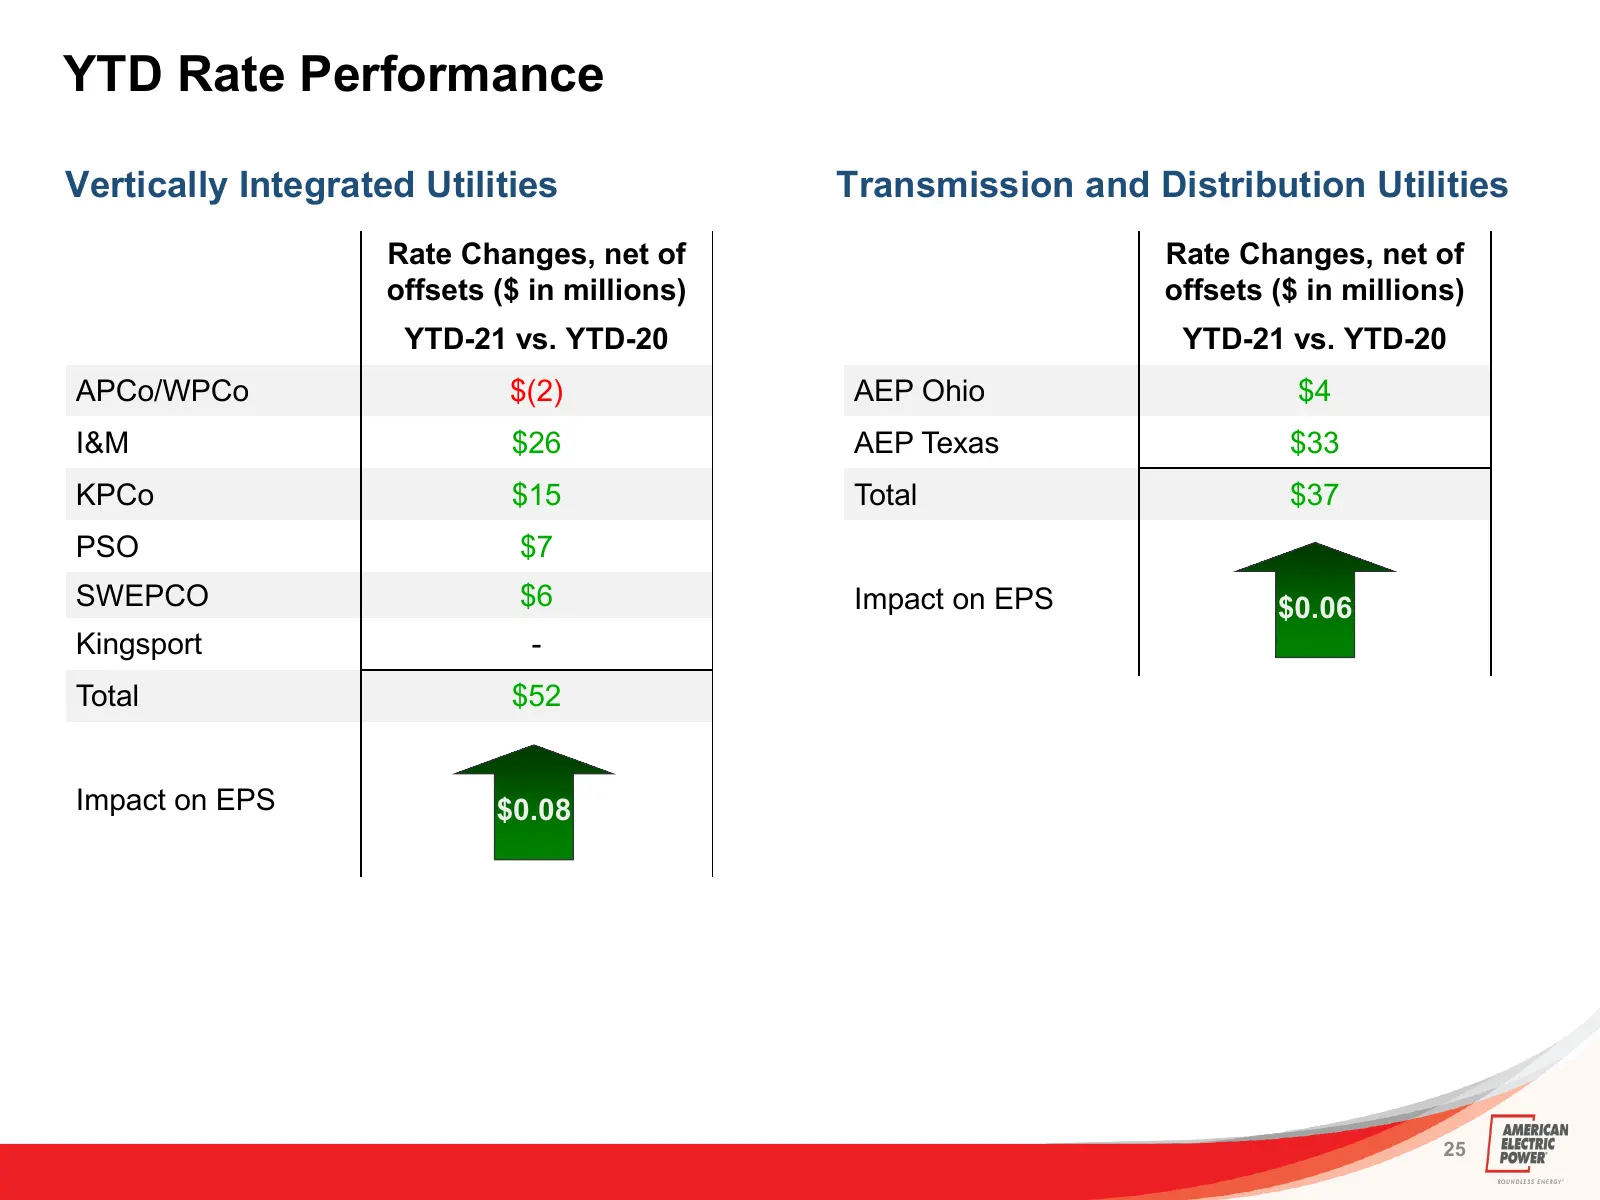
YTD Rate Performance Vertically Integrated Utilities Transmission and Distribution Utilities Rate Changes, net of Rate Changes, net of offsets ($ in millions) offsets ($ in millions) YTD-21 vs. YTD-20 YTD-21 vs. YTD-20 APCo/WPCo $(2) AEP Ohio $4 I&M $26 AEP Texas $33 KPCo $15 Total $37 PSO $7 SWEPCO
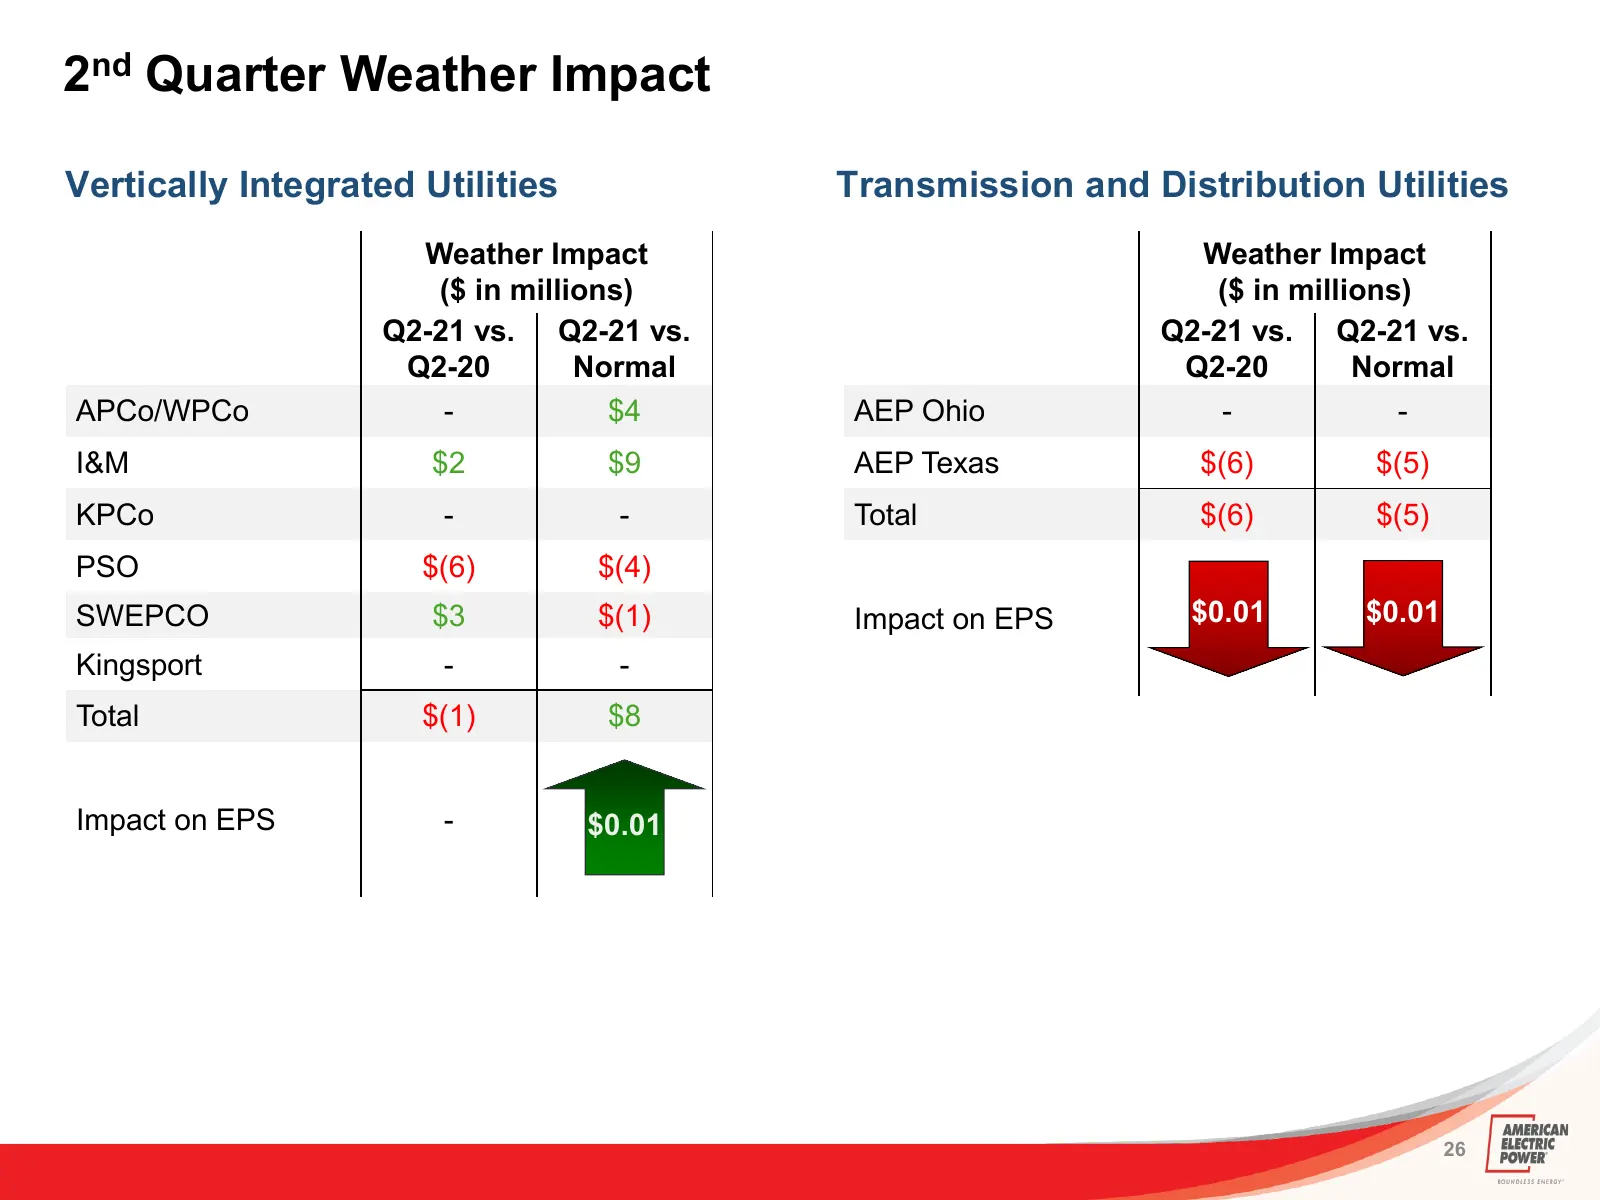
Slide 26: 2nd Quarter Weather Impact
2nd Quarter Weather Impact Vertically Integrated Utilities Transmission and Distribution Utilities Weather Impact Weather Impact ($ in millions) ($ in millions) Q2-21 vs. Q2-21 vs. Q2-21 vs. Q2-21 vs. Q2-20 Normal Q2-20 Normal APCo/WPCo - $4 AEP Ohio - - I&M $2 $9 AEP Texas $(6) $(5) KPCo - - Total
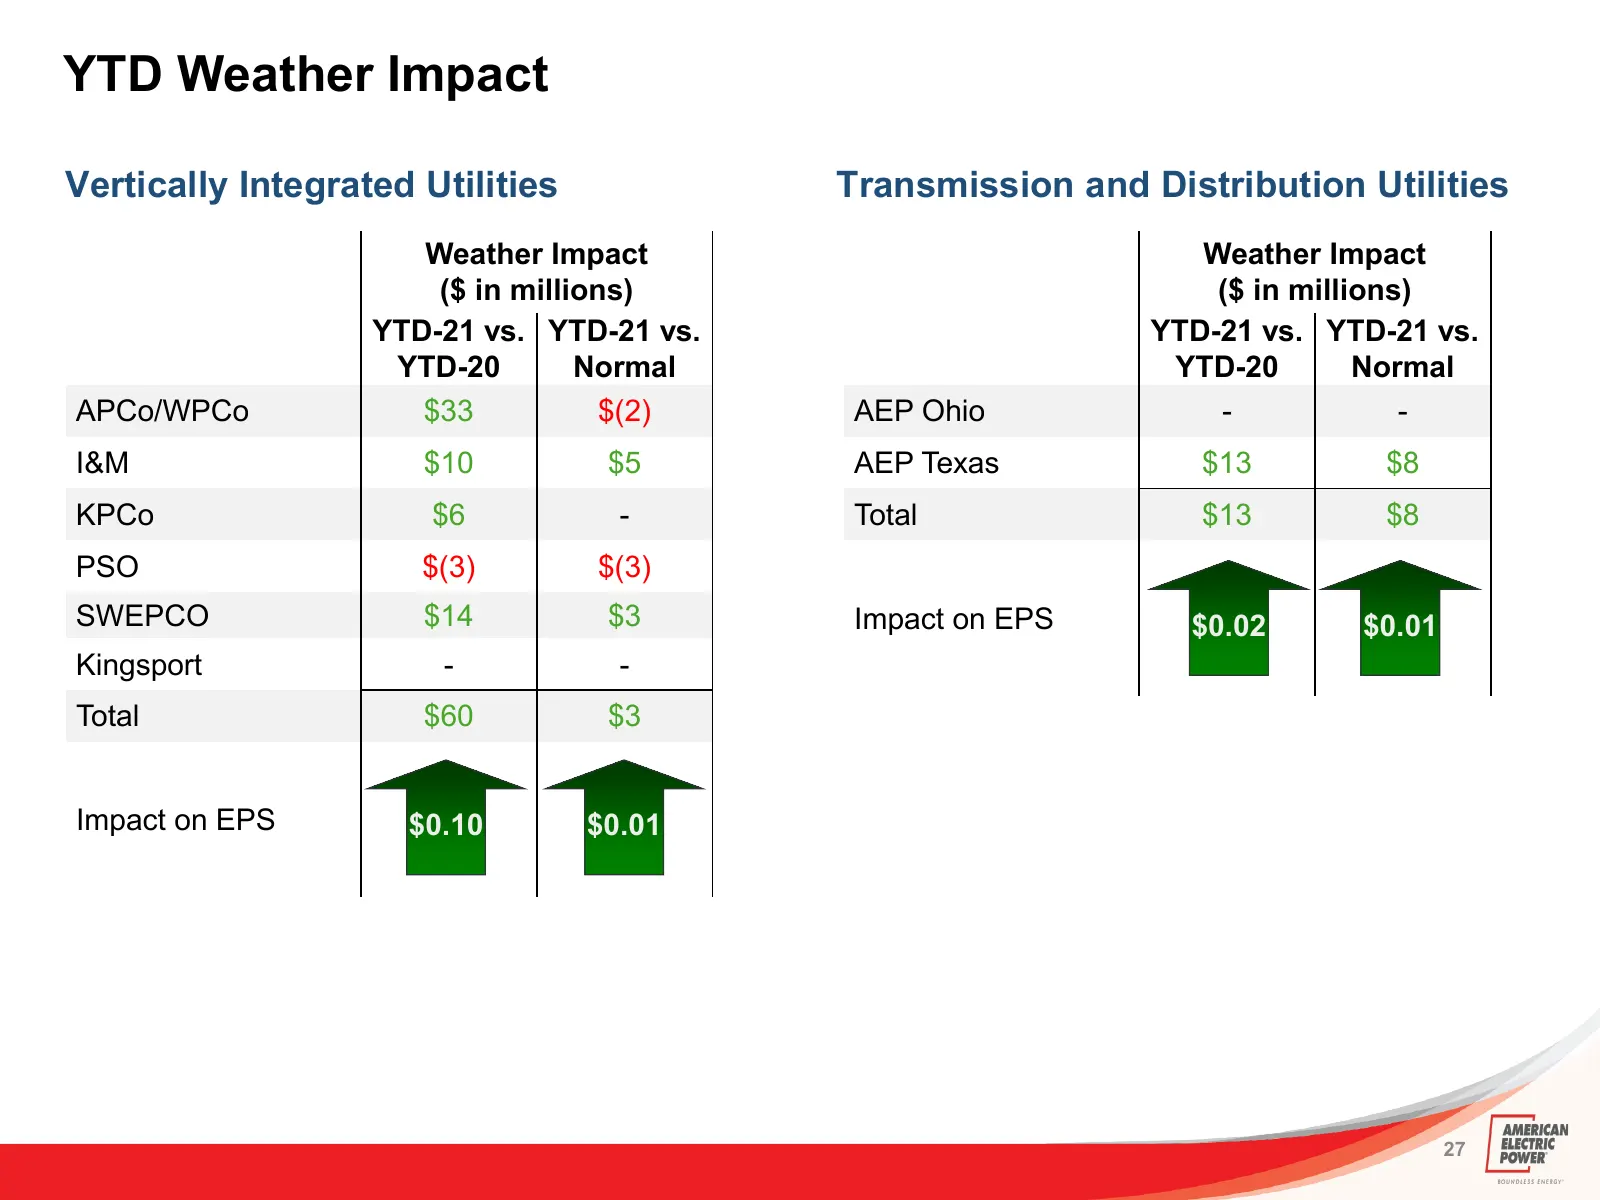
Slide 27: YTD Weather Impact
YTD Weather Impact Vertically Integrated Utilities Transmission and Distribution Utilities Weather Impact Weather Impact ($ in millions) ($ in millions) YTD-21 vs. YTD-21 vs. YTD-21 vs. YTD-21 vs. YTD-20 Normal YTD-20 Normal APCo/WPCo $33 $(2) AEP Ohio - - I&M $10 $5 AEP Texas $13 $8 KPCo $6 - Total
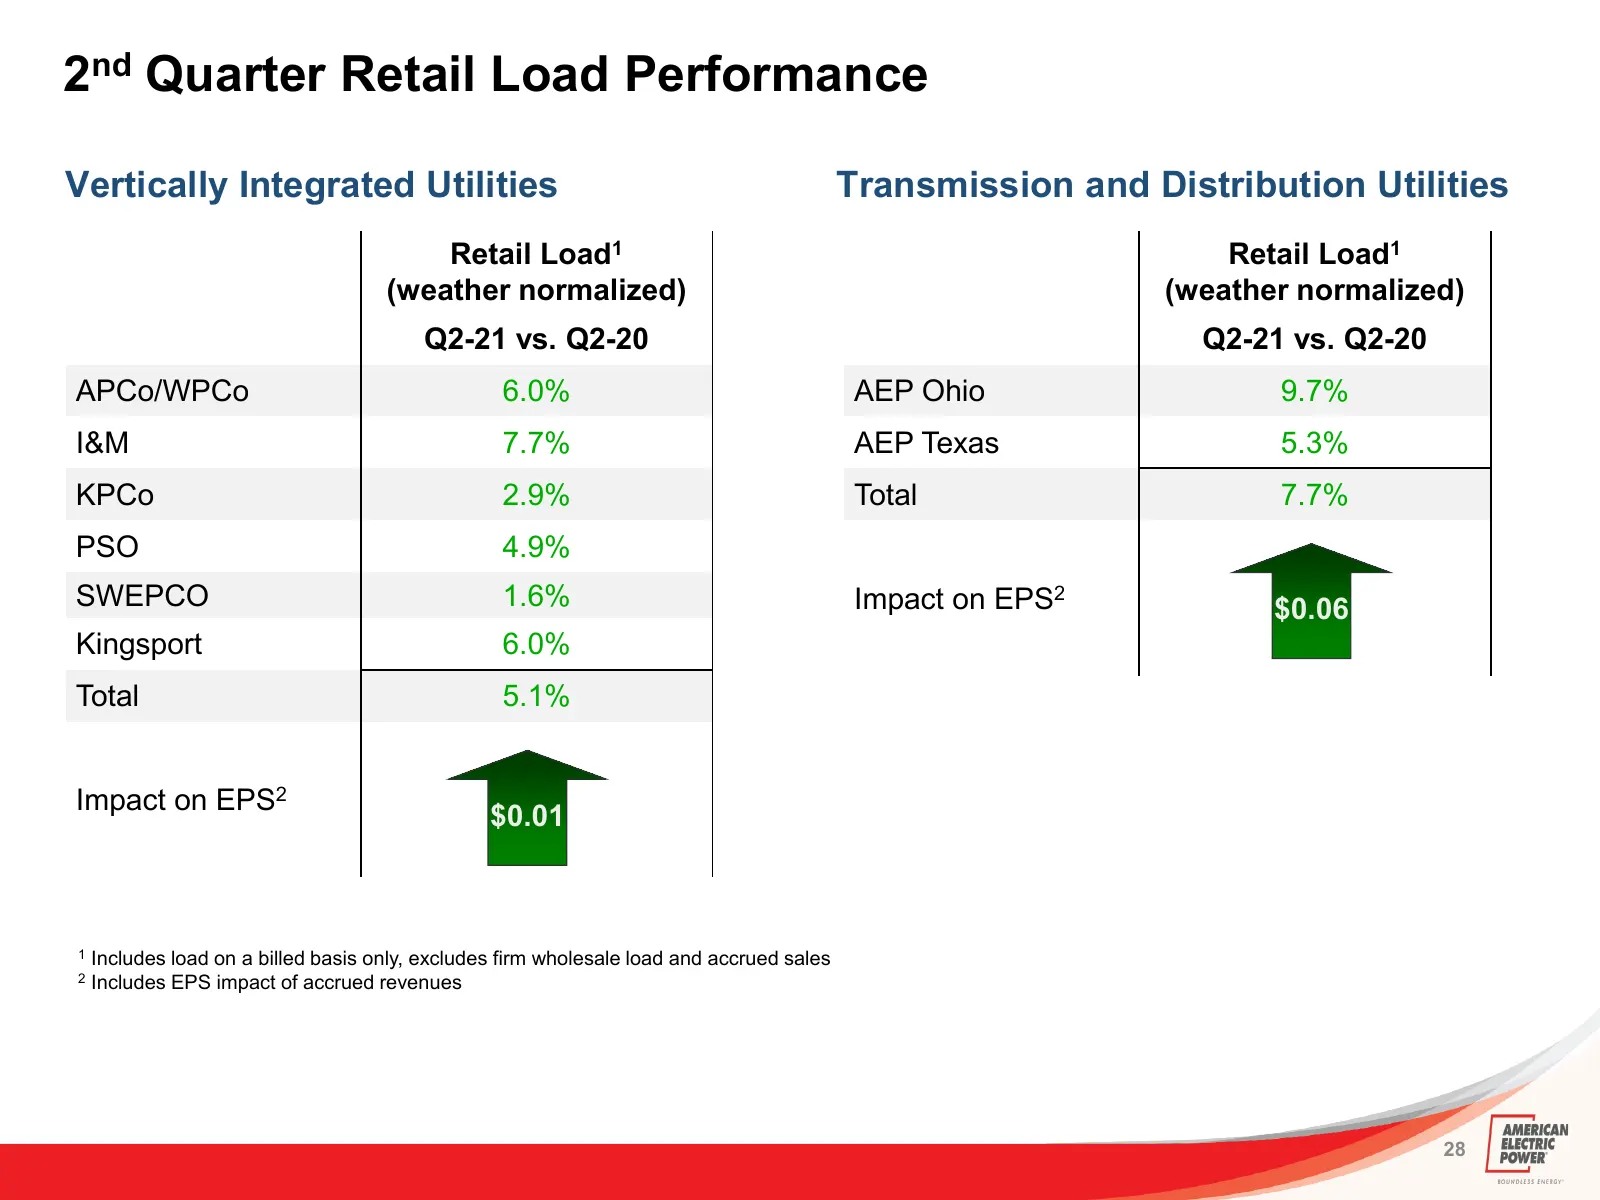
Slide 28: 2nd Quarter Retail Load Performance
2nd Quarter Retail Load Performance Vertically Integrated Utilities Transmission and Distribution Utilities Retail Load1 Retail Load1 (weather normalized) (weather normalized) Q2-21 vs. Q2-20 Q2-21 vs. Q2-20 APCo/WPCo 6.0% AEP Ohio 9.7% I&M 7.7% AEP Texas 5.3% KPCo 2.9% Total 7.7% PSO 4.9% SWEPCO 1.
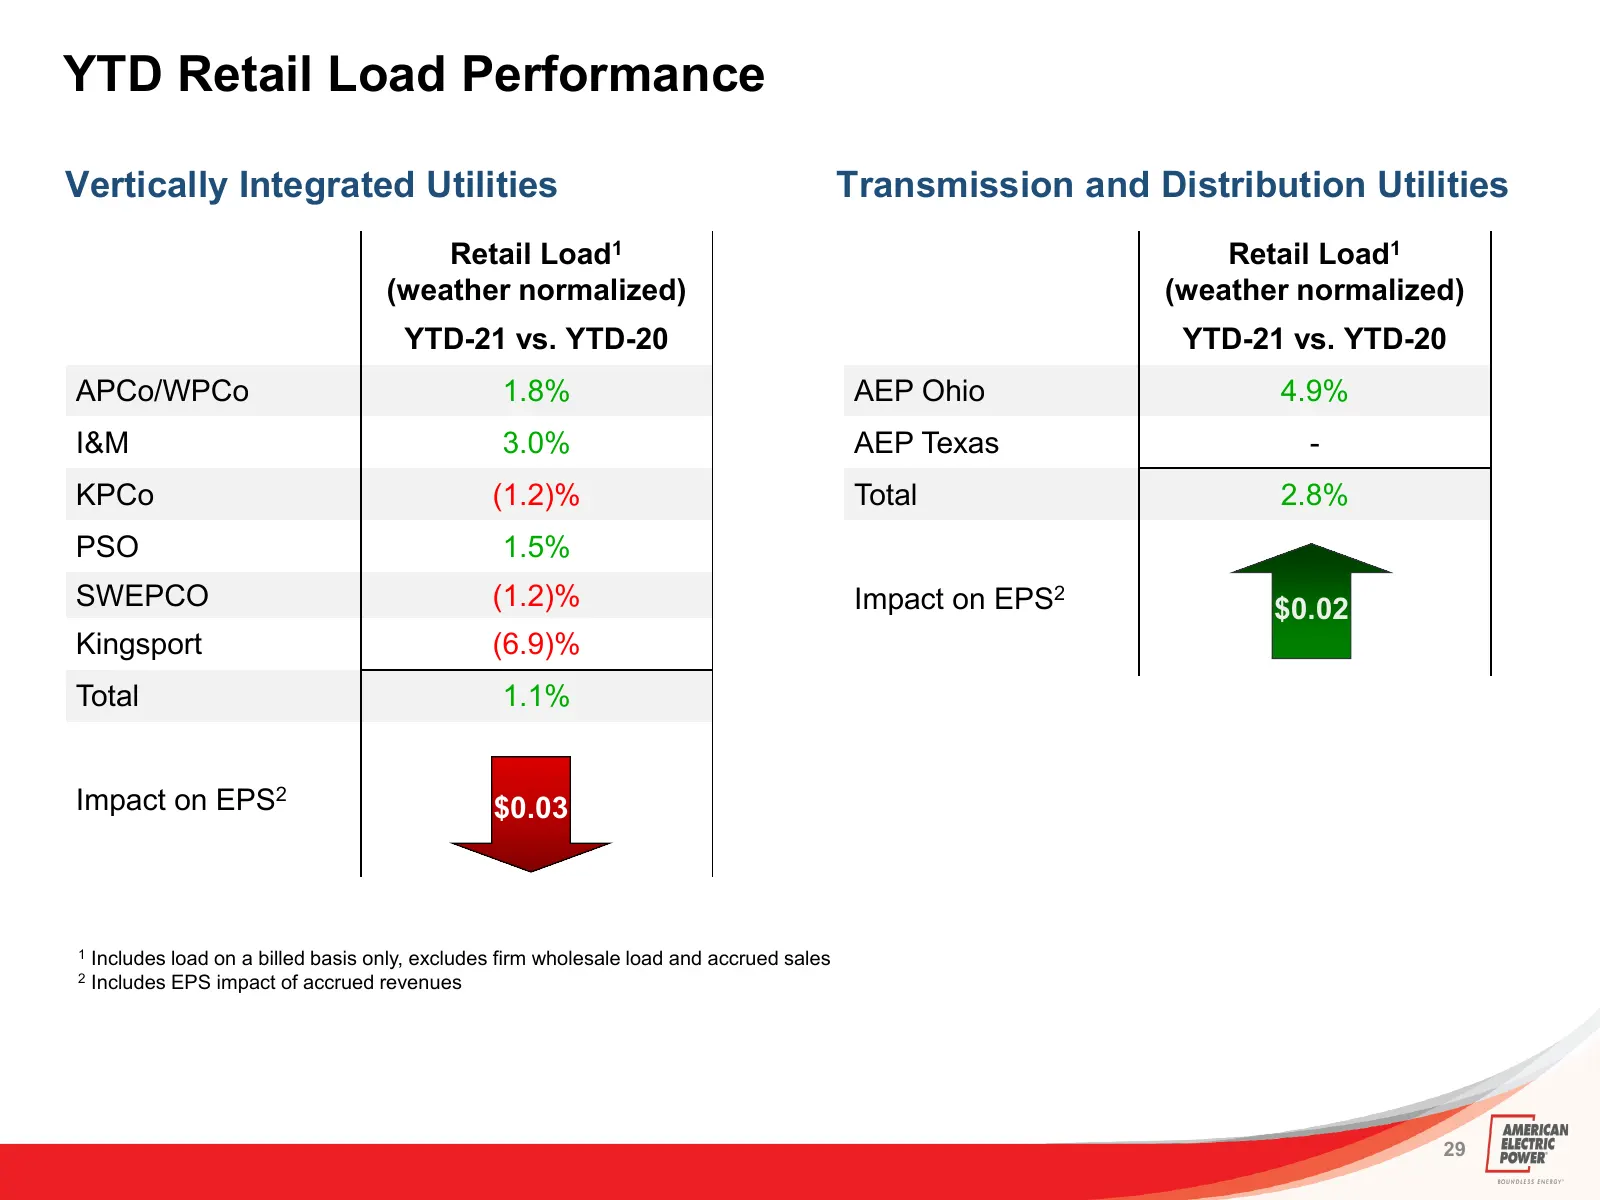
Slide 29: YTD Retail Load Performance
YTD Retail Load Performance Vertically Integrated Utilities Transmission and Distribution Utilities Retail Load1 Retail Load1 (weather normalized) (weather normalized) YTD-21 vs. YTD-20 YTD-21 vs. YTD-20 APCo/WPCo 1.8% AEP Ohio 4.9% I&M 3.0% AEP Texas - KPCo (1.2)% Total 2.8% PSO 1.5% SWEPCO (1.2)%
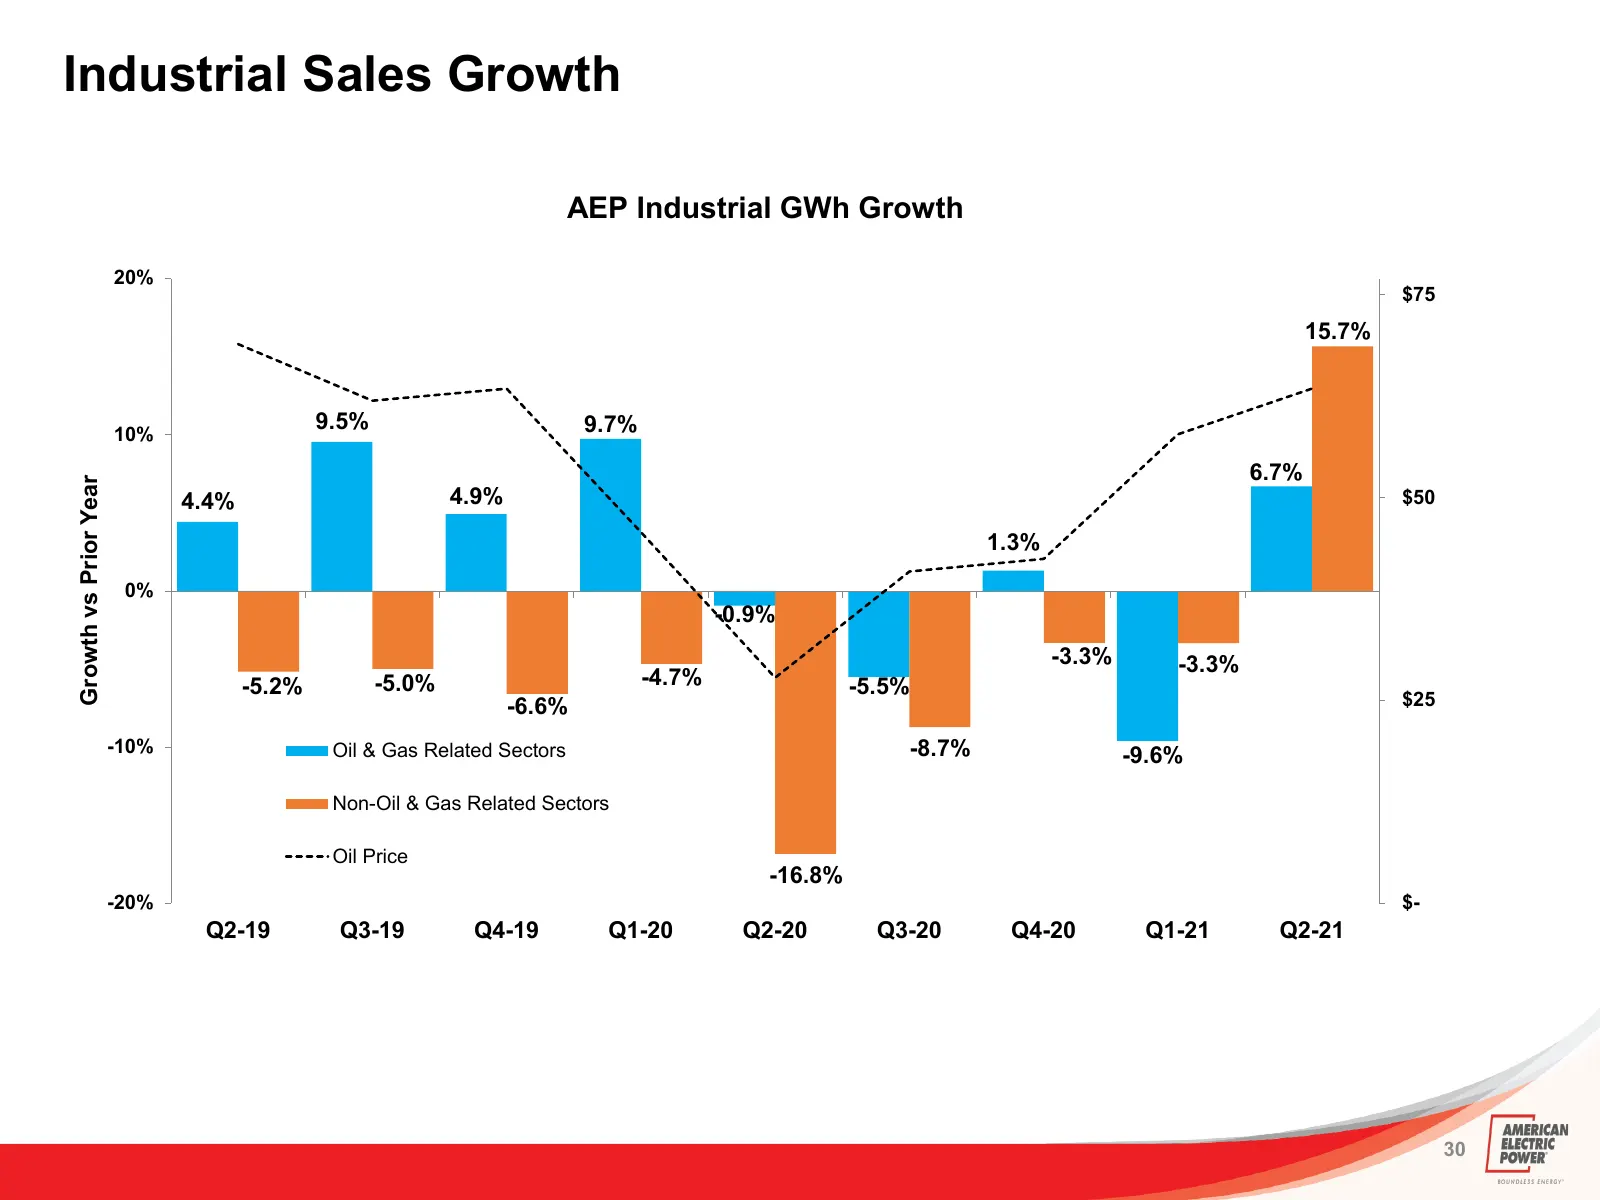
Slide 30: Industrial Sales Growth
Industrial Sales Growth AEP Industrial GWh Growth 20% $75 15.7% 9.5% 9.7% 10% 6.7% Growth vs Prior Year 4.4% 4.9% $50 1.3% 0% -0.9% -3.3% -3.3% -5.2% -5.0% -4.7% -5.5% -6.6% $25 -10% Oil & Gas Related Sectors -8.7% -9.6% Non-Oil & Gas Related Sectors Oil Price -16.8% -20% $- Q2-19 Q3-19 Q4-19 Q1-20
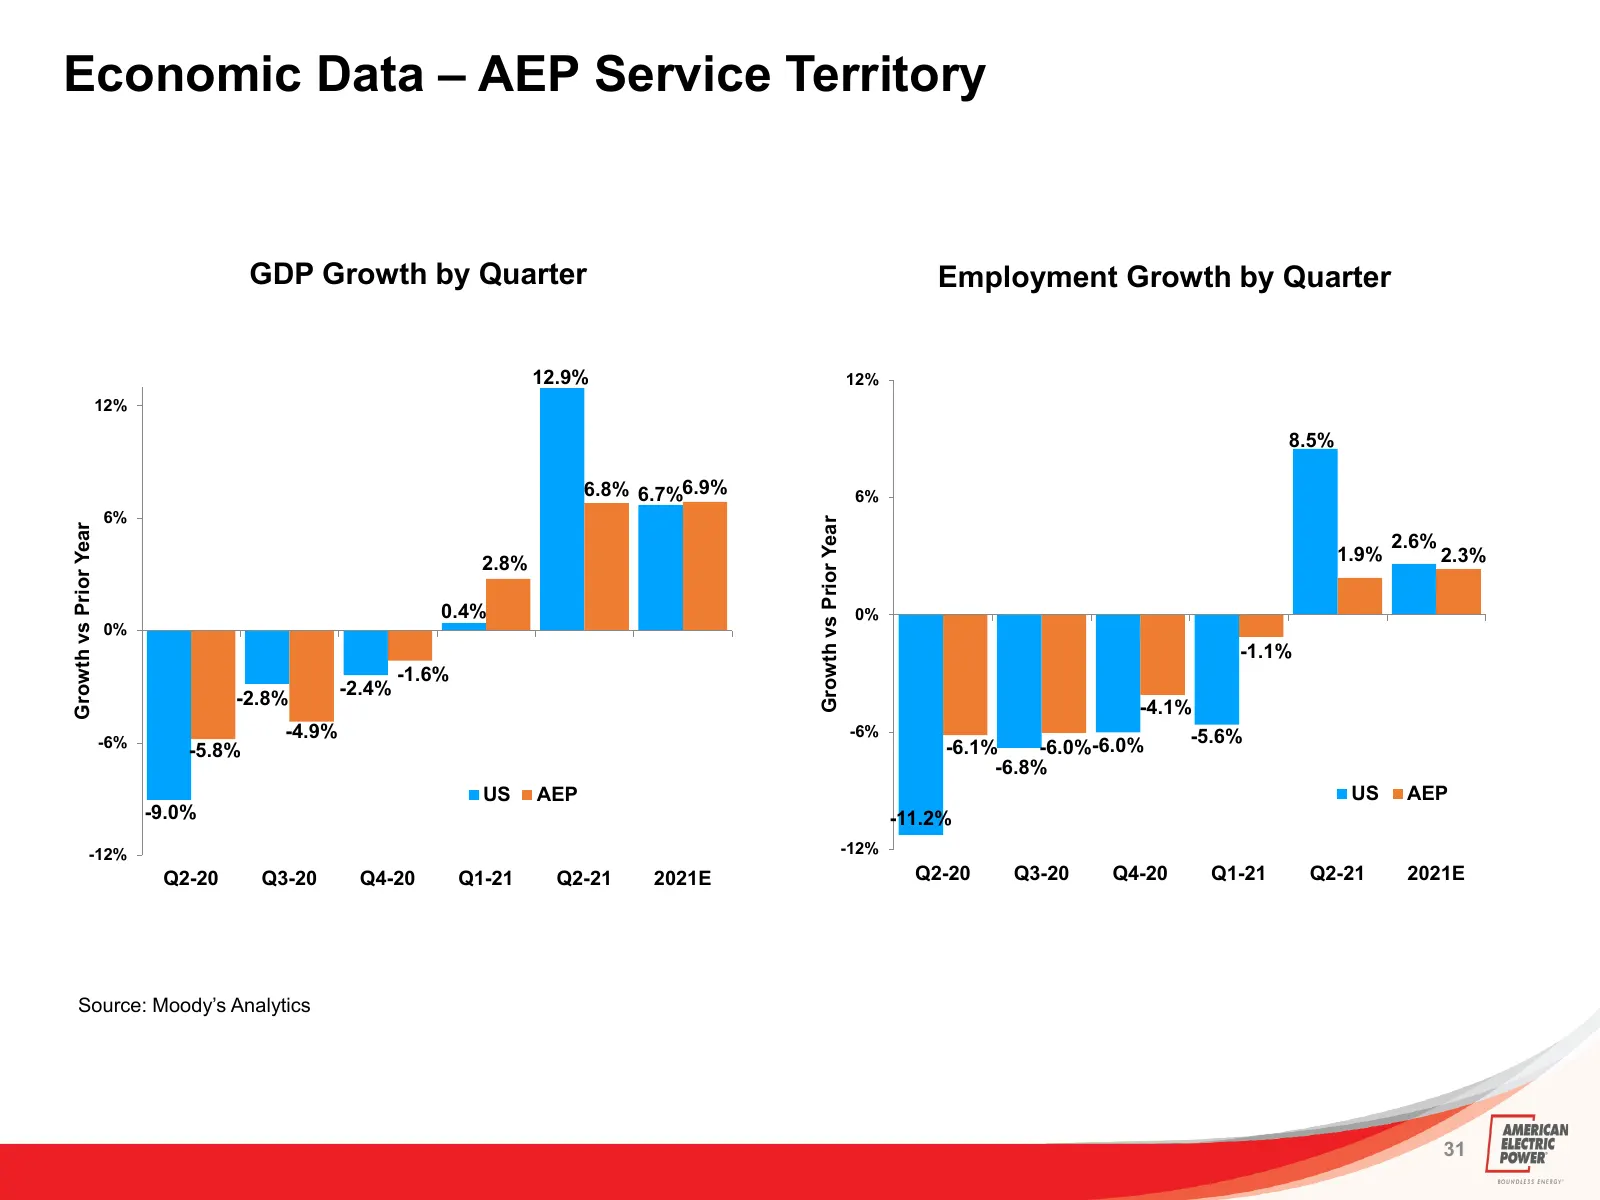
Slide 31: Economic Data – AEP Service Territory
Economic Data – AEP Service Territory GDP Growth by Quarter Employment Growth by Quarter 12.9% 12% 12% 8.5% 6.8% 6.7%6.9% 6% 6% Growth vs Prior Year Growth vs Prior Year 2.6% 2.8% 1.9% 2.3% 0.4% 0% 0% -1.1% -1.6% -2.4% -2.8% -4.1% -6% -4.9% -6% -5.6% -5.8% -6.1% -6.0% -6.0% -6.8% US AEP US AEP -9.0%
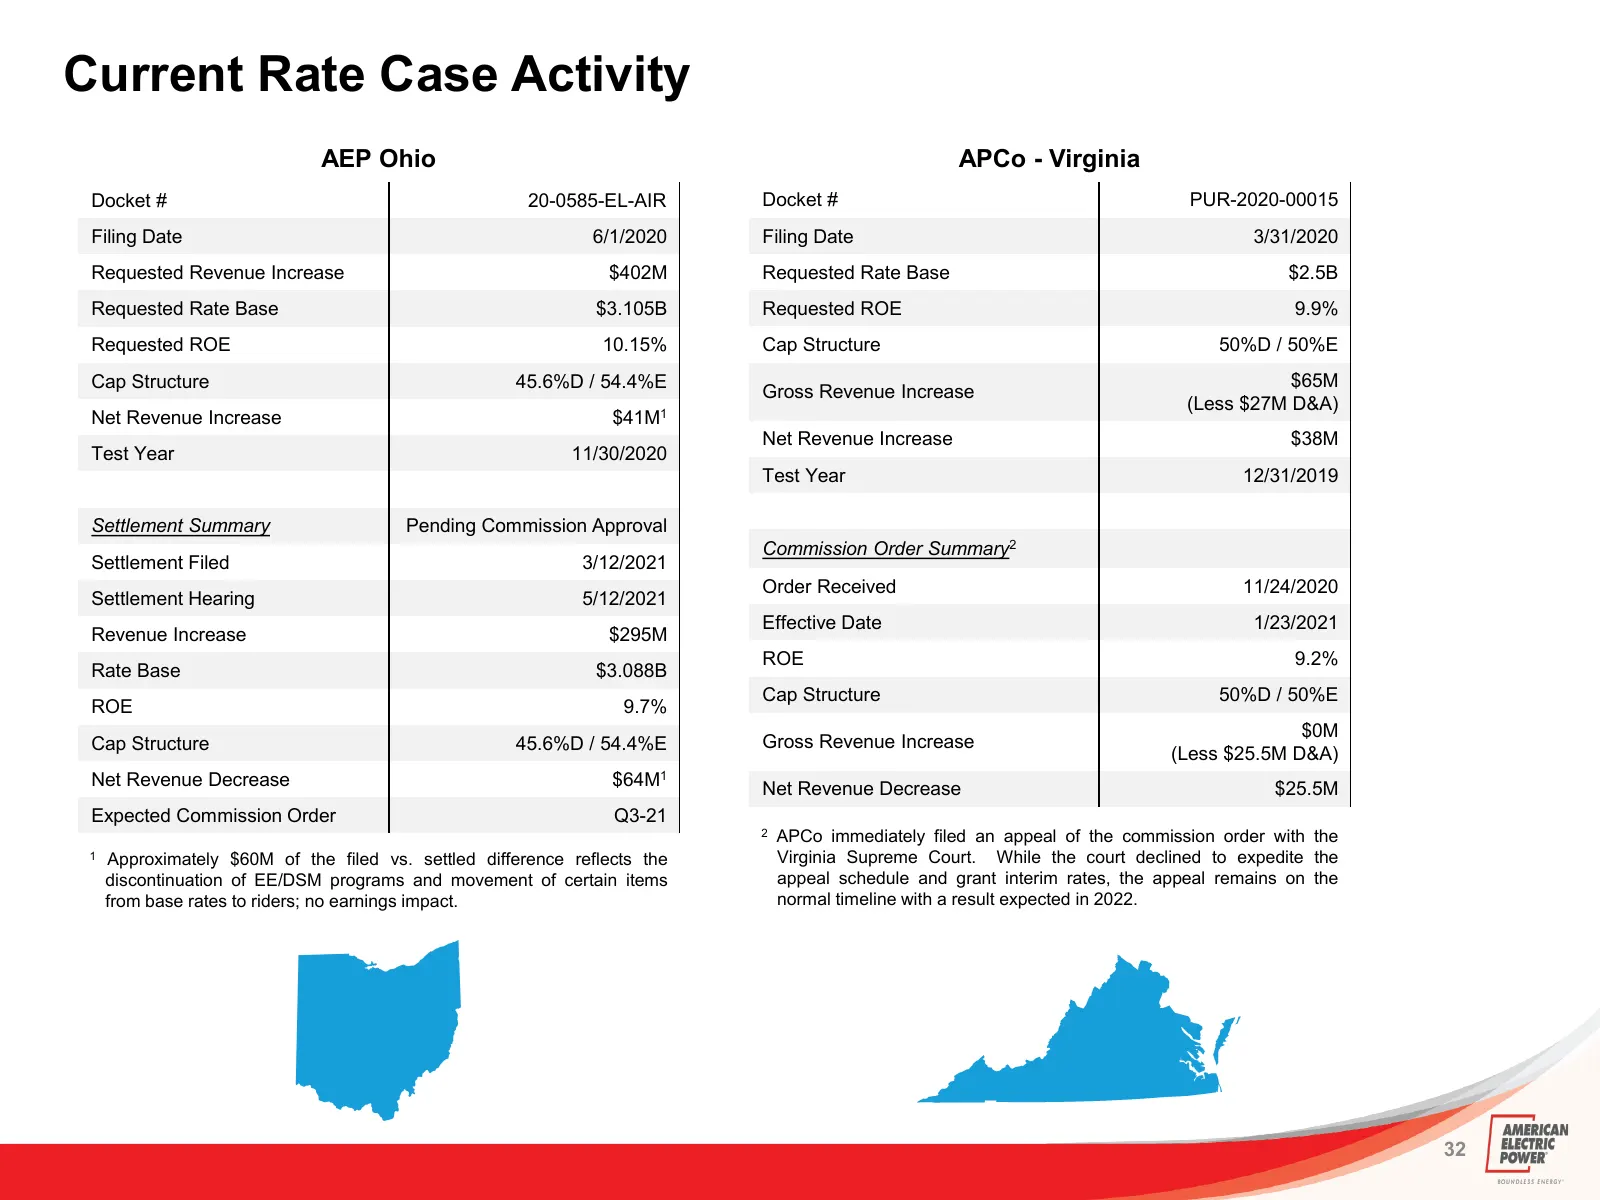
Slide 32: Current Rate Case Activity
Current Rate Case Activity AEP Ohio APCo - Virginia Docket # 20-0585-EL-AIR Docket # PUR-2020-00015 Filing Date 6/1/2020 Filing Date 3/31/2020 Requested Revenue Increase $402M Requested Rate Base $2.5B Requested Rate Base $3.105B Requested ROE 9.9% Requested ROE 10.15% Cap Structure 50%D / 50%E Cap
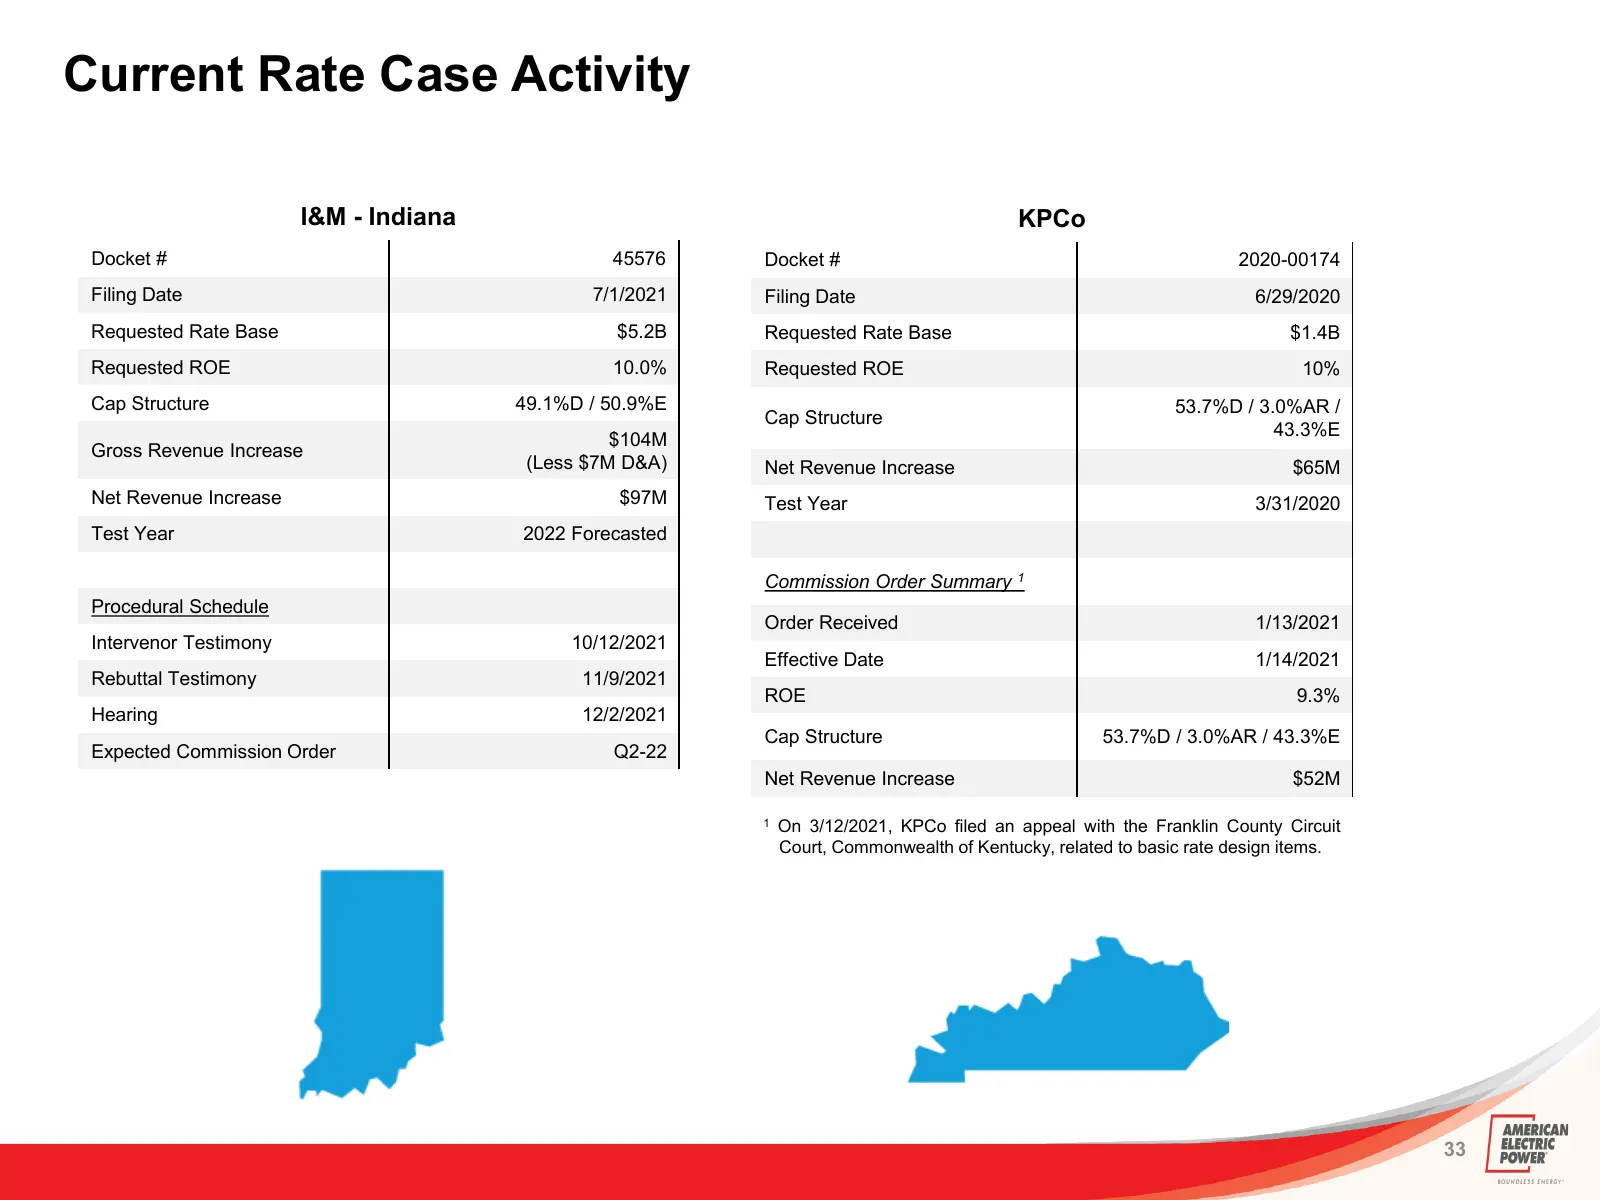
Slide 33: Current Rate Case Activity
Current Rate Case Activity I&M - Indiana KPCo Docket # 45576 Docket # 2020-00174 Filing Date 7/1/2021 Filing Date 6/29/2020 Requested Rate Base $5.2B Requested Rate Base $1.4B Requested ROE 10.0% Requested ROE 10% Cap Structure 49.1%D / 50.9%E 53.7%D / 3.0%AR / Cap Structure 43.3%E $104M Gross Reven
Slide 34: Current Rate Case Activity
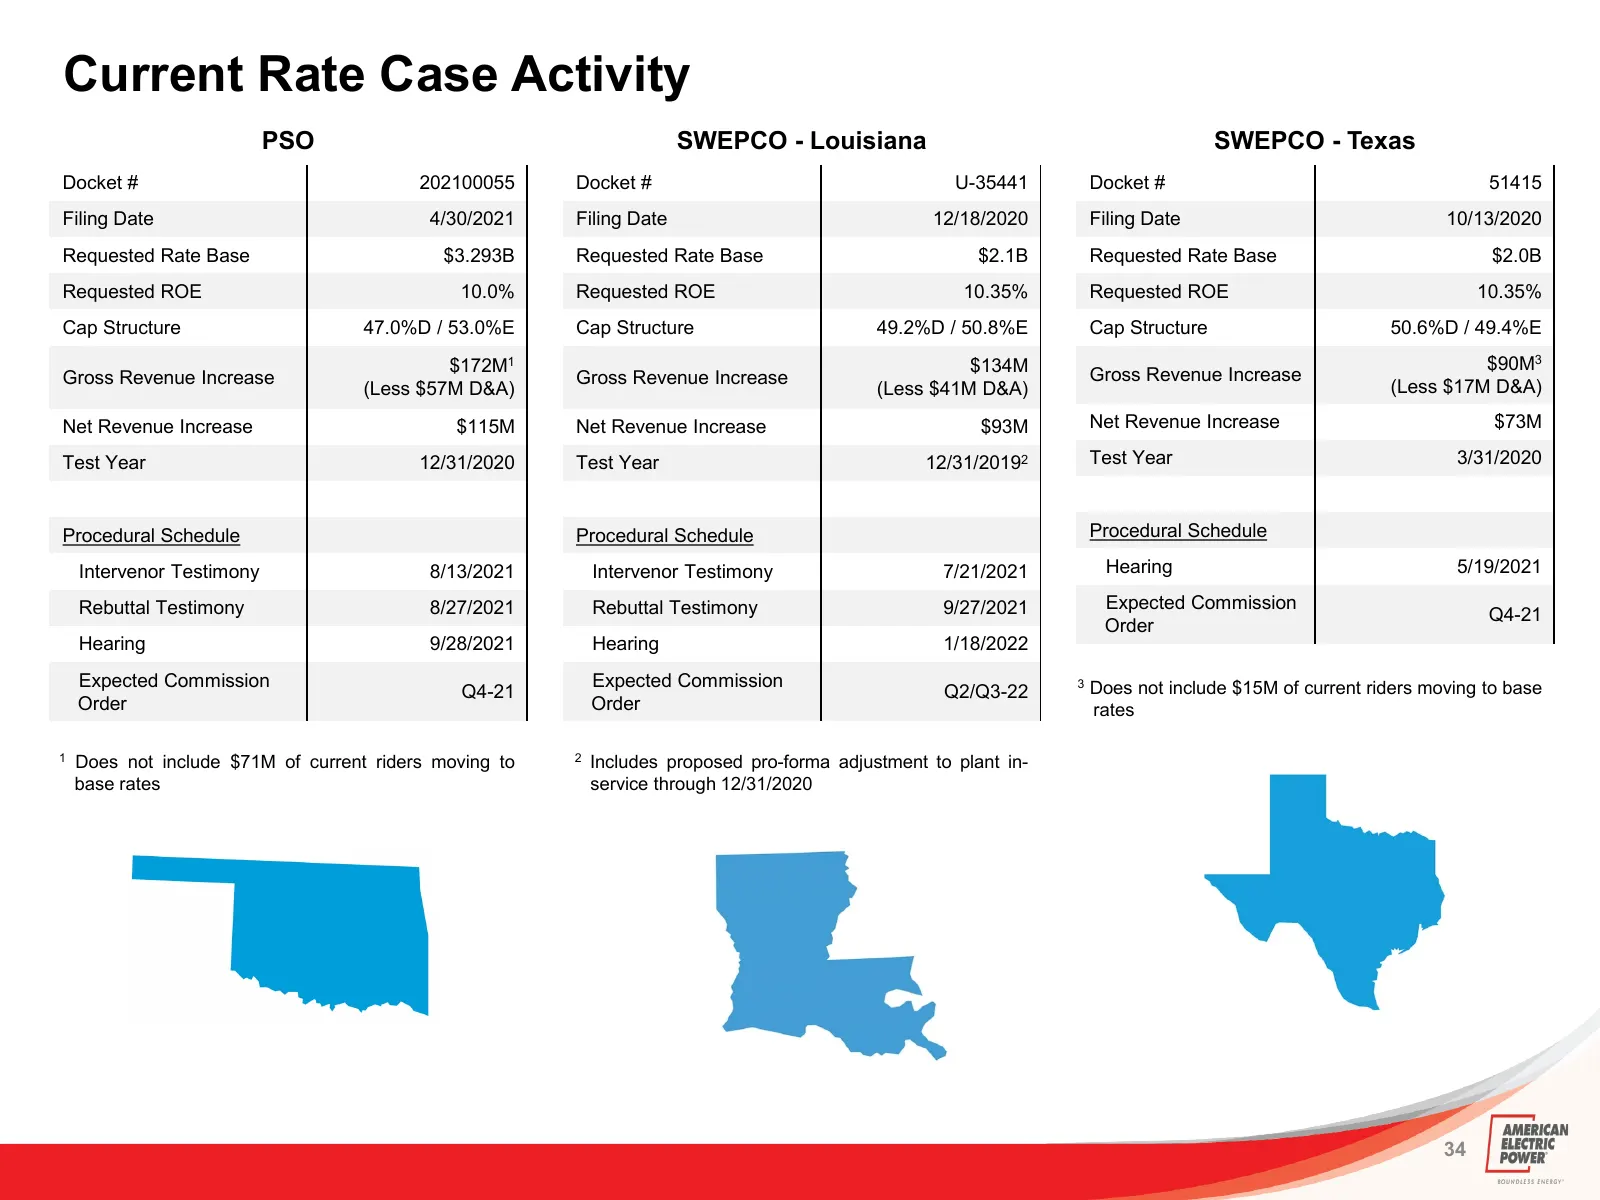
Current Rate Case Activity PSO SWEPCO - Louisiana SWEPCO - Texas Docket # 202100055 Docket # U-35441 Docket # 51415 Filing Date 4/30/2021 Filing Date 12/18/2020 Filing Date 10/13/2020 Requested Rate Base $3.293B Requested Rate Base $2.1B Requested Rate Base $2.0B Requested ROE 10.0% Requested ROE 10
Slide 35: North Central Wind Overview
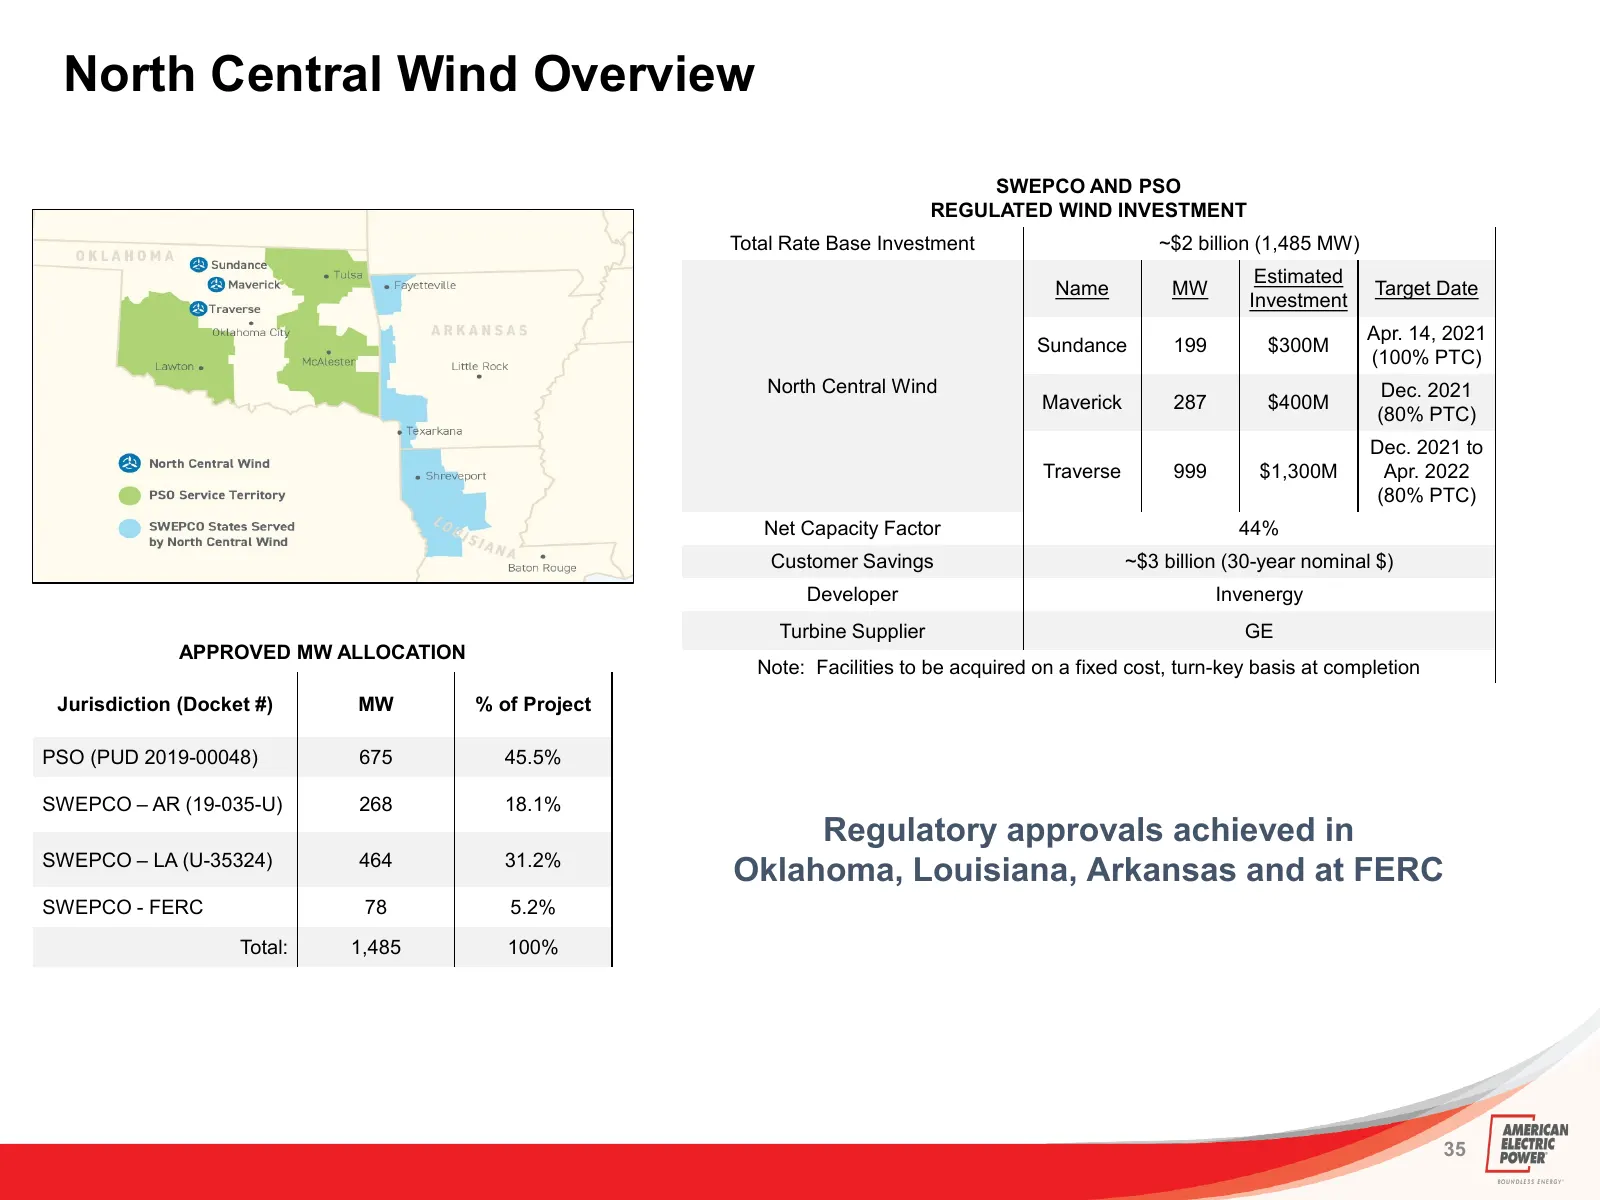
North Central Wind Overview SWEPCO AND PSO REGULATED WIND INVESTMENT Total Rate Base Investment ~$2 billion (1,485 MW) Estimated Name MW Target Date Investment Apr. 14, 2021 Sundance 199 $300M (100% PTC) North Central Wind Dec. 2021 Maverick 287 $400M (80% PTC) Dec. 2021 to Traverse 999 $1,300M Apr.
Slide 36: Future Forward - Advancing Towards a Clean Energy Future
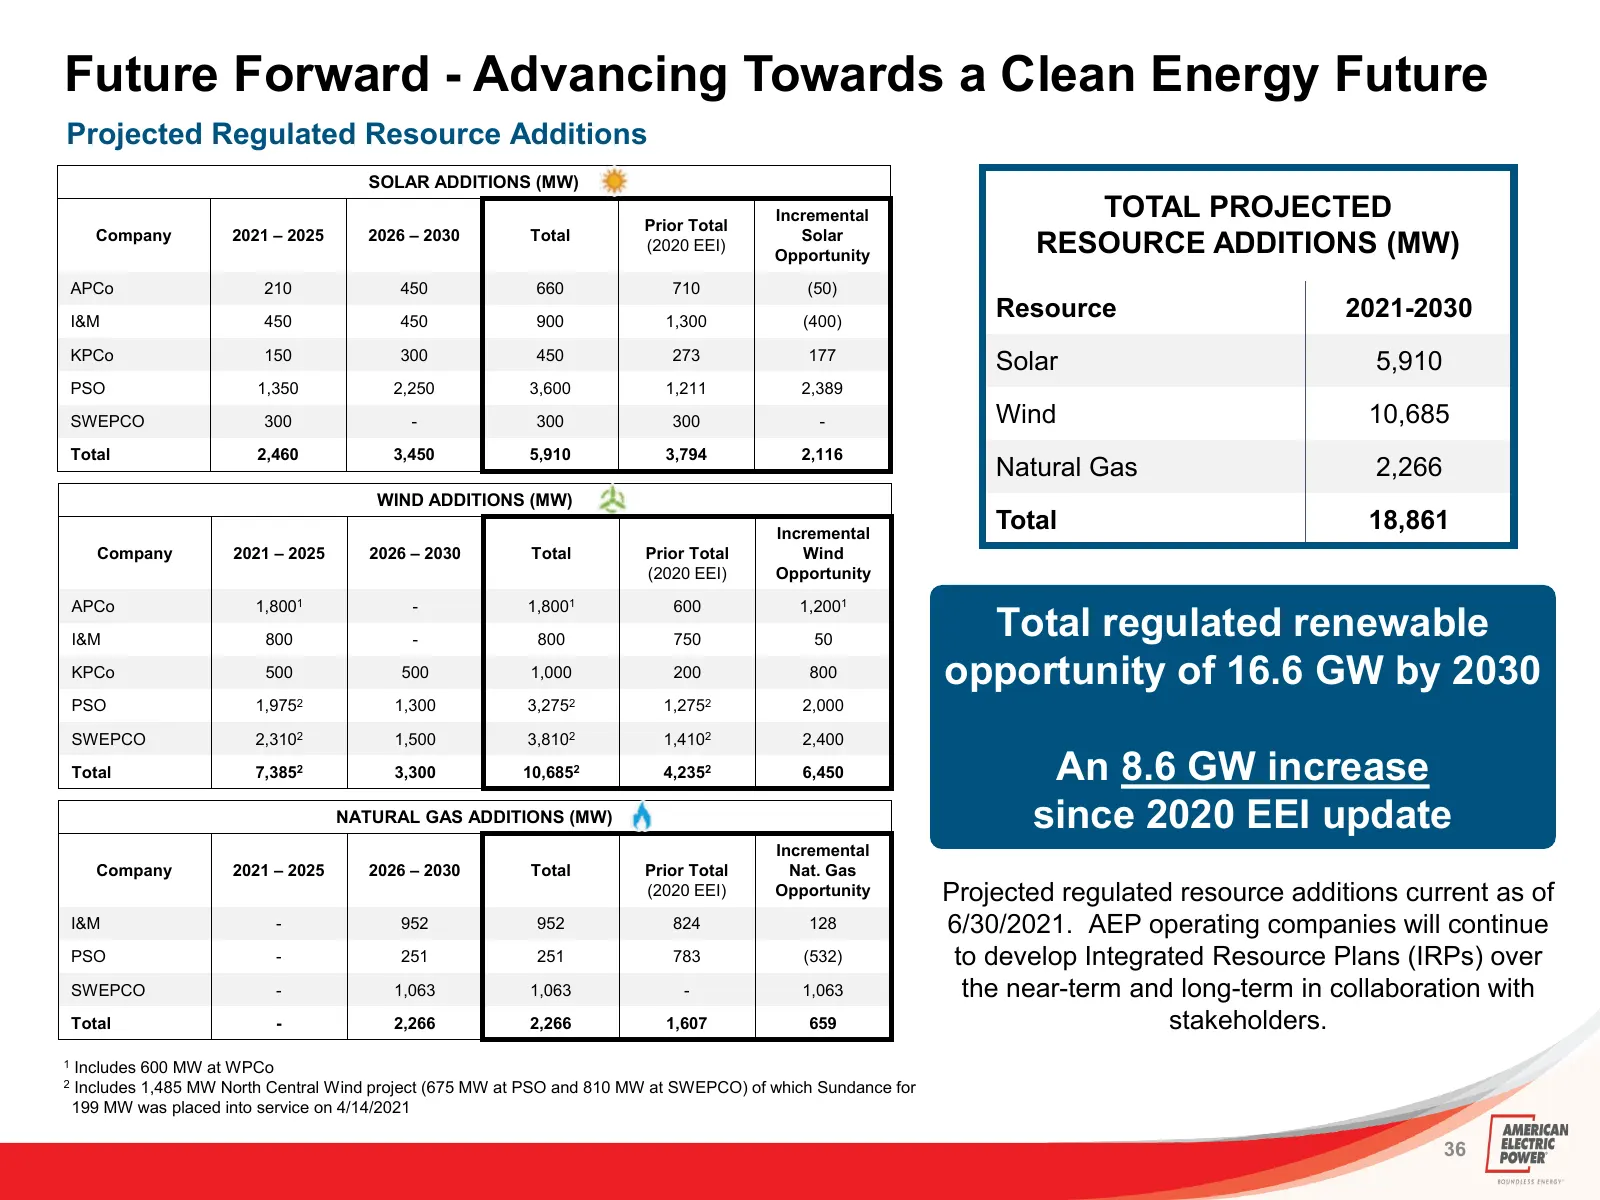
Future Forward - Advancing Towards a Clean Energy Future Projected Regulated Resource Additions SOLAR ADDITIONS (MW) Prior Total Incremental TOTAL PROJECTED Company 2021 – 2025 2026 – 2030 Total (2020 EEI) Solar Opportunity RESOURCE ADDITIONS (MW) APCo 210 450 660 710 (50) I&M 450 450 900 1,300 (400
Slide 37: Future Forward - Advancing Towards a Clean Energy Future
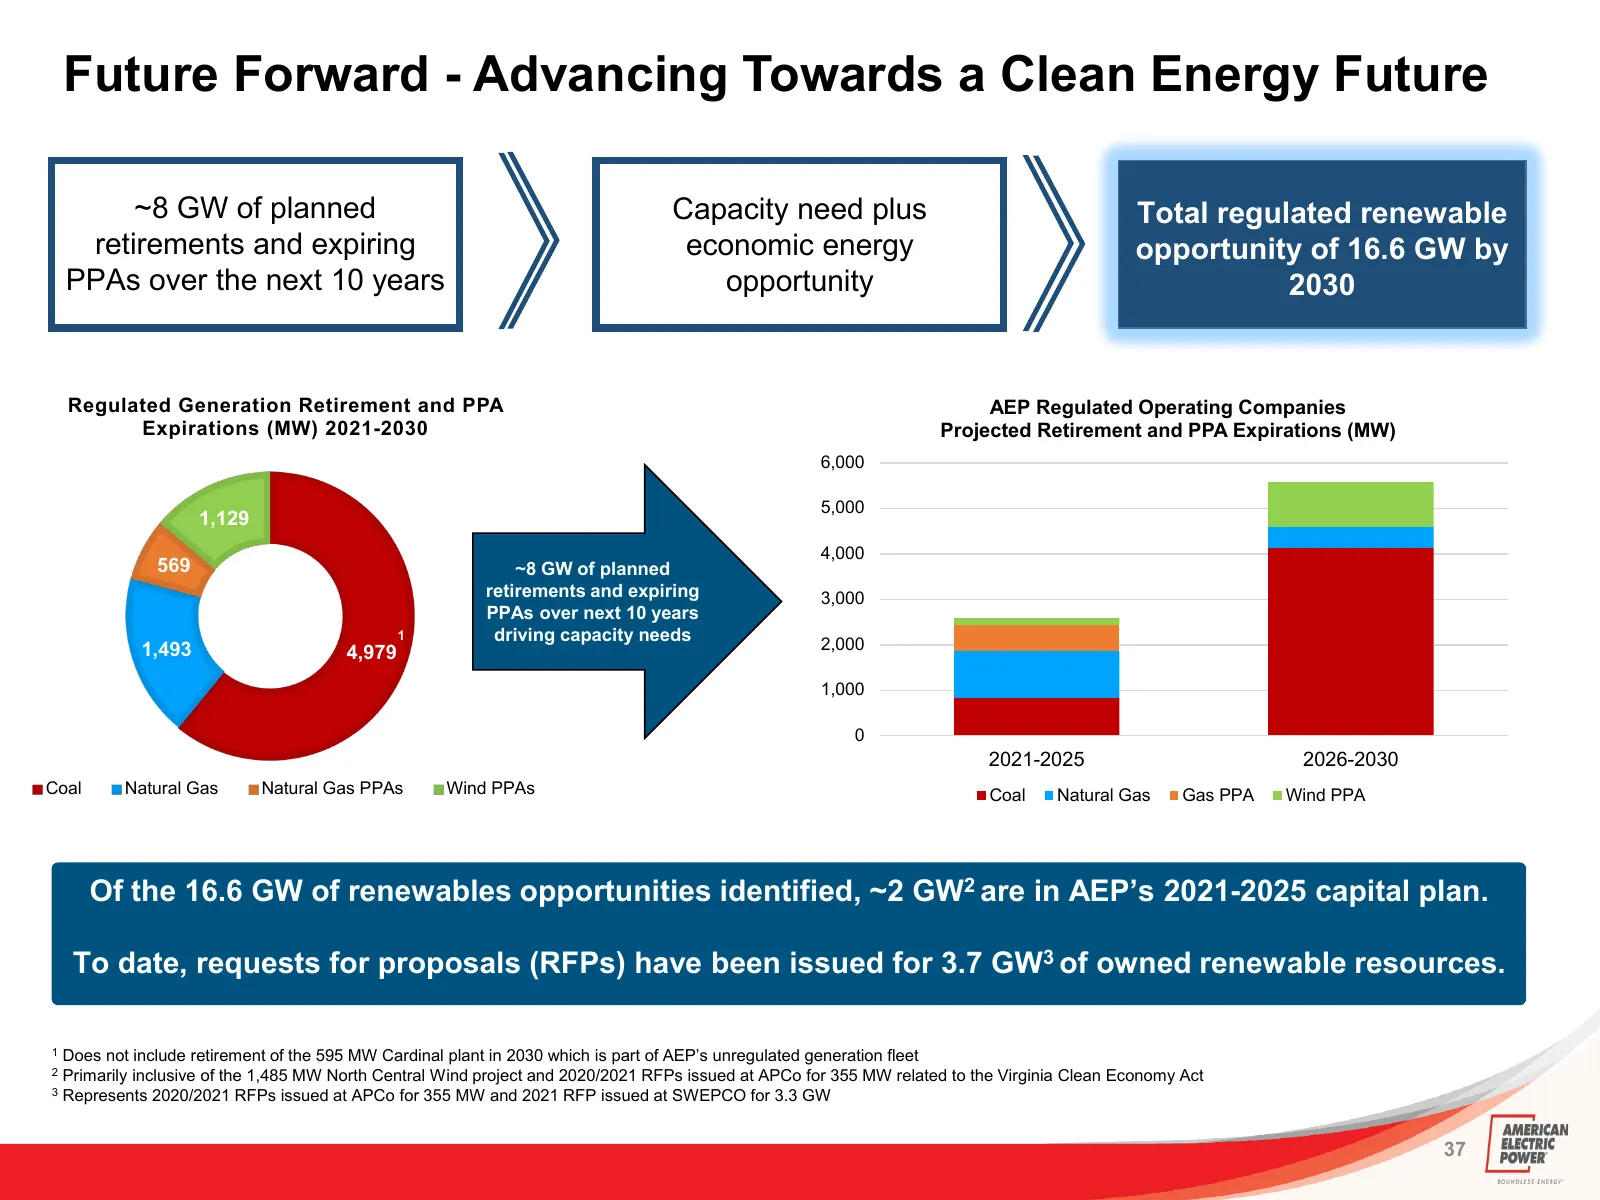
Future Forward - Advancing Towards a Clean Energy Future ~8 GW of planned Capacity need plus Total regulated renewable retirements and expiring economic energy opportunity of 16.6 GW by PPAs over the next 10 years opportunity 2030 Regulated Generation Retirement and PPA AEP Regulated Operating Compa
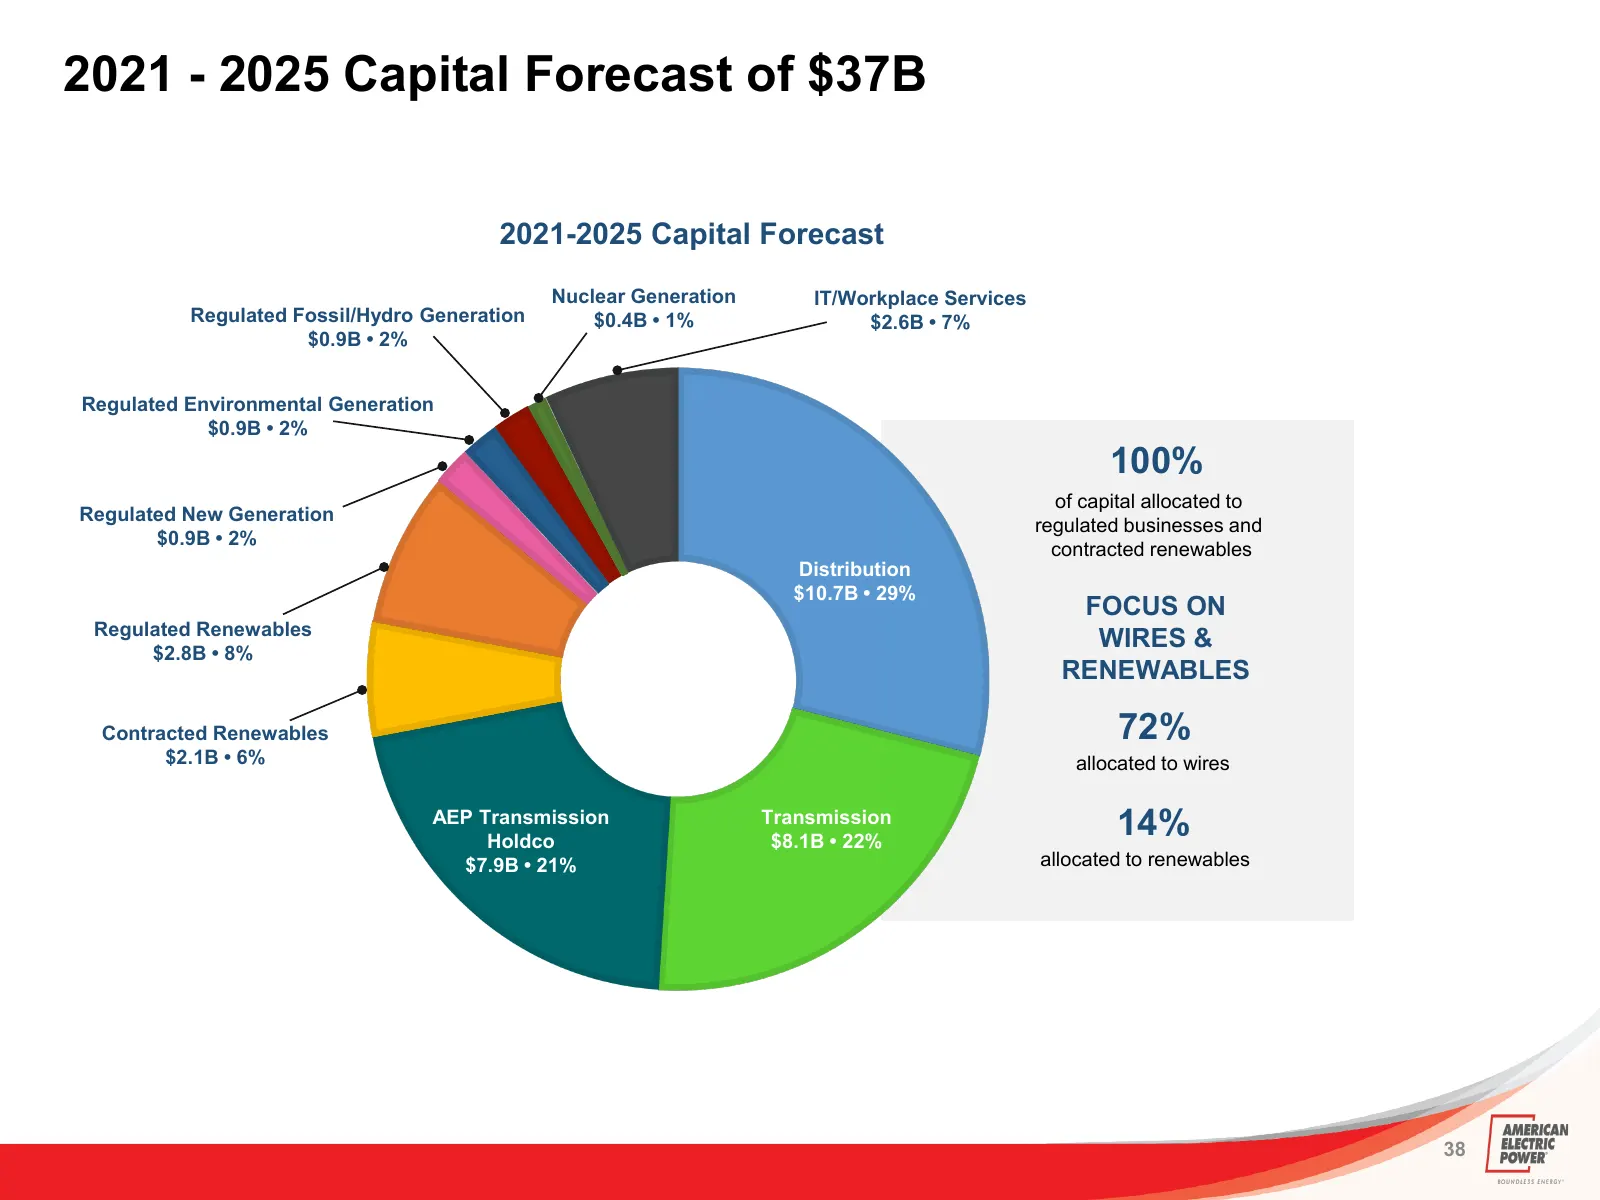
Slide 38: 2021 - 2025 Capital Forecast of $37B
2021 - 2025 Capital Forecast of $37B 2021-2025 Capital Forecast Nuclear Generation IT/Workplace Services Regulated Fossil/Hydro Generation $0.4B • 1% $2.6B • 7% $0.9B • 2% Regulated Environmental Generation $0.9B • 2% 100% of capital allocated to Regulated New Generation regulated businesses and $0.
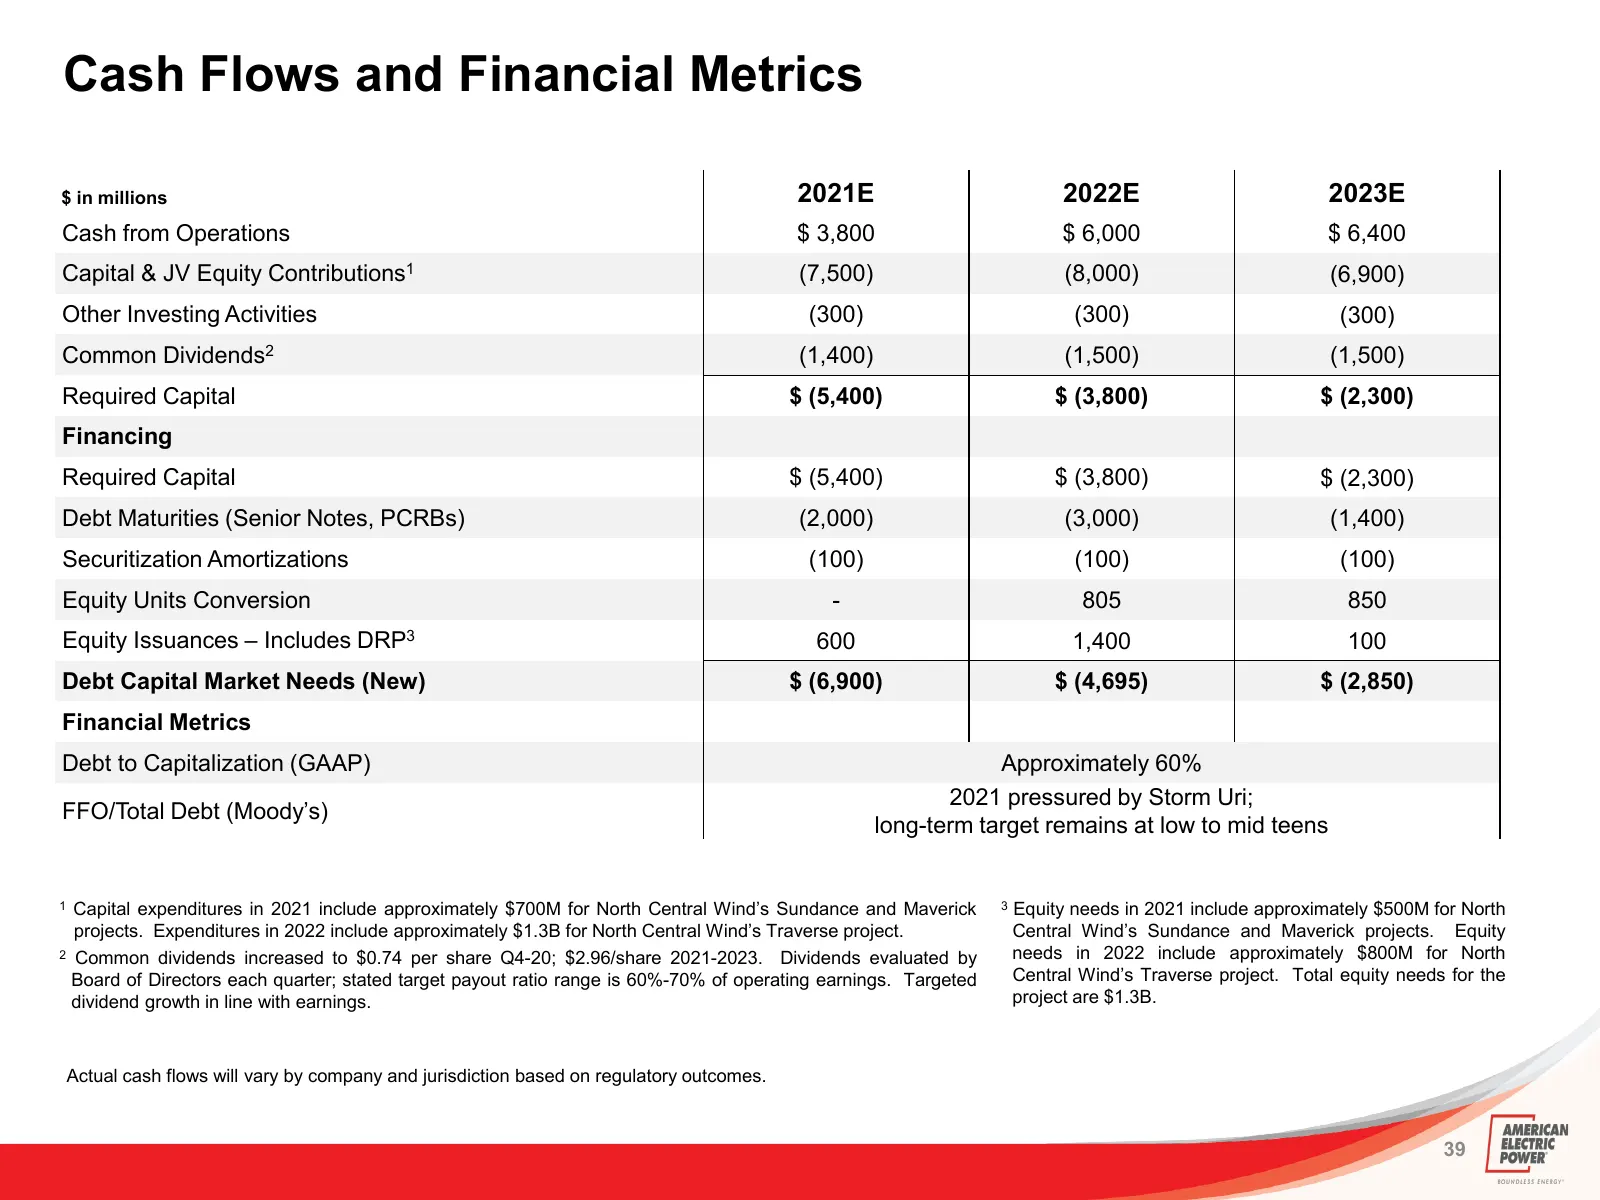
Slide 39: Cash Flows and Financial Metrics
Cash Flows and Financial Metrics $ in millions 2021E 2022E 2023E Cash from Operations $ 3,800 $ 6,000 $ 6,400 Capital & JV Equity Contributions1 (7,500) (8,000) (6,900) Other Investing Activities (300) (300) (300) Common Dividends2 (1,400) (1,500) (1,500) Required Capital $ (5,400) $ (3,800) $ (2,30
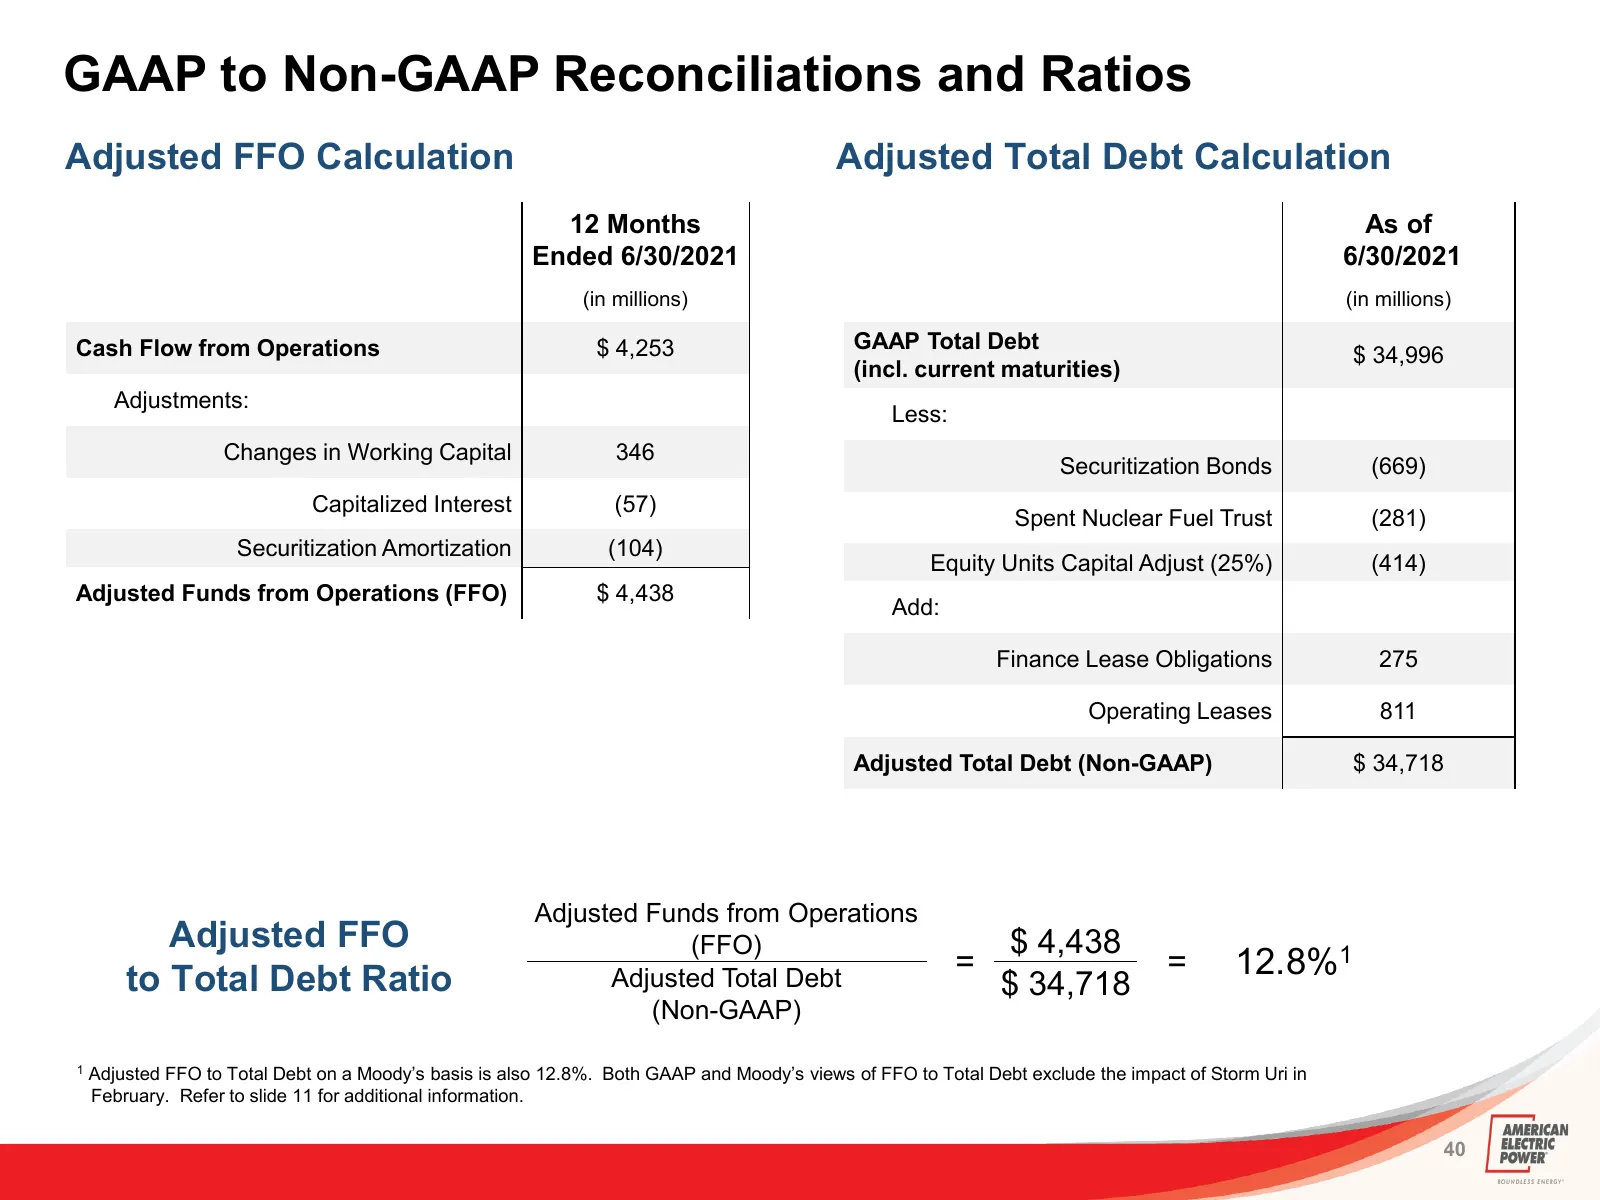
Slide 40: GAAP to Non-GAAP Reconciliations and Ratios
GAAP to Non-GAAP Reconciliations and Ratios Adjusted FFO Calculation Adjusted Total Debt Calculation 12 Months As of Ended 6/30/2021 6/30/2021 (in millions) (in millions) Cash Flow from Operations $ 4,253 GAAP Total Debt $ 34,996 (incl. current maturities) Adjustments: Less: Changes in Working Capit
Source: 6ix earnings call
More decks from American Electric Power Company, Inc.
 Q3 2026 Earnings Presentation40 slides · Oct 28, 2026
 Q3 2026 Earnings Presentation12 slides · Oct 28, 2026
 Q2 2026 Earnings Presentation41 slides · Jul 30, 2026
 Q2 2026 Earnings Presentation39 slides · Jul 30, 2026
 Q2 2026 Earnings Presentation12 slides · Jun 30, 2026
 Q1 2026 Earnings Presentation39 slides · May 5, 2026