TORC Oil & Gas — Investor Presentation (September 2015)
33 slides from TORC Oil & Gas's investor presentation, September 2015
Slide 1: TORC Oil & Gas Ltd. September 2015
T@RC Oil & Gas Ltd September 2015
Slide 2: Forward-Looking Statements
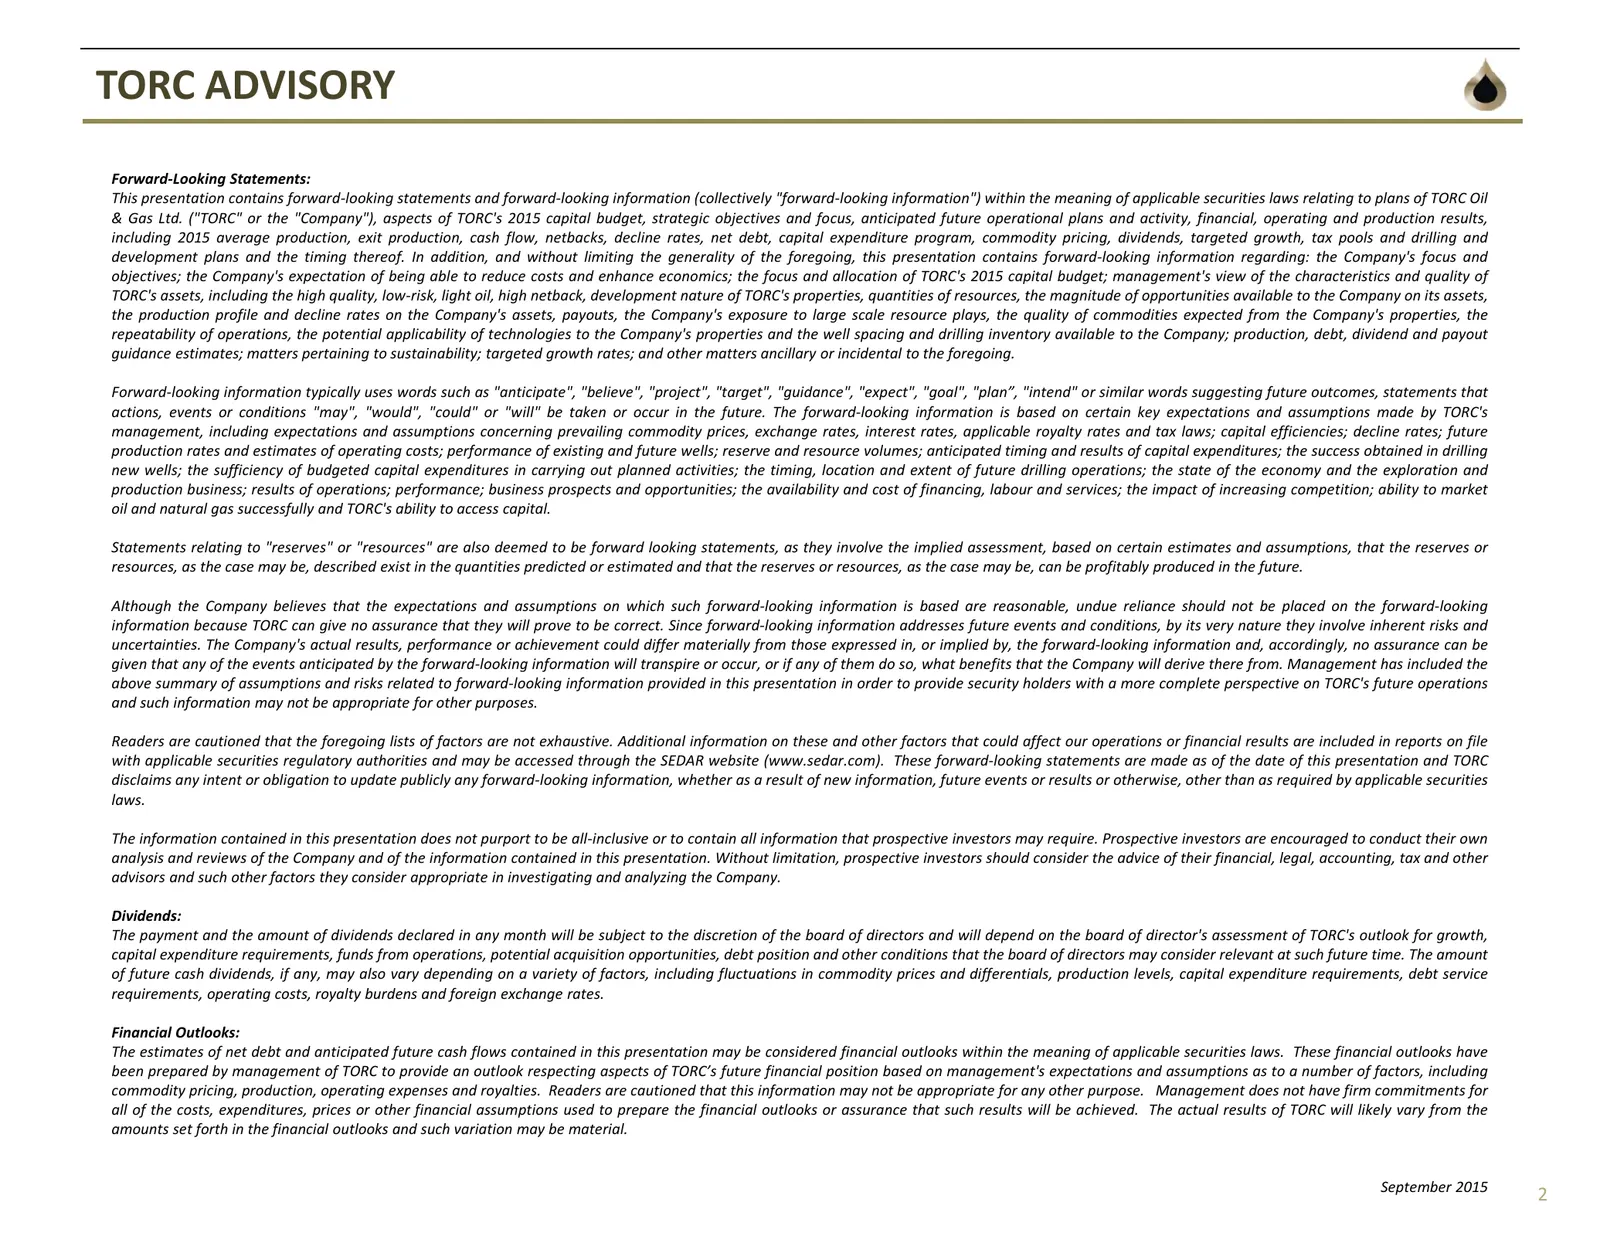
TORC ADVISORY Forward‐Looking Statements: This presentation contains forward‐looking statements and forward‐looking information (collectively "forward‐looking information") within the meaning of applicable securities laws relating to plans of TORC Oil & Gas Ltd. ("TORC" or the "Company"), aspects of
Slide 3: Non-GAAP Measures and Reserves Information
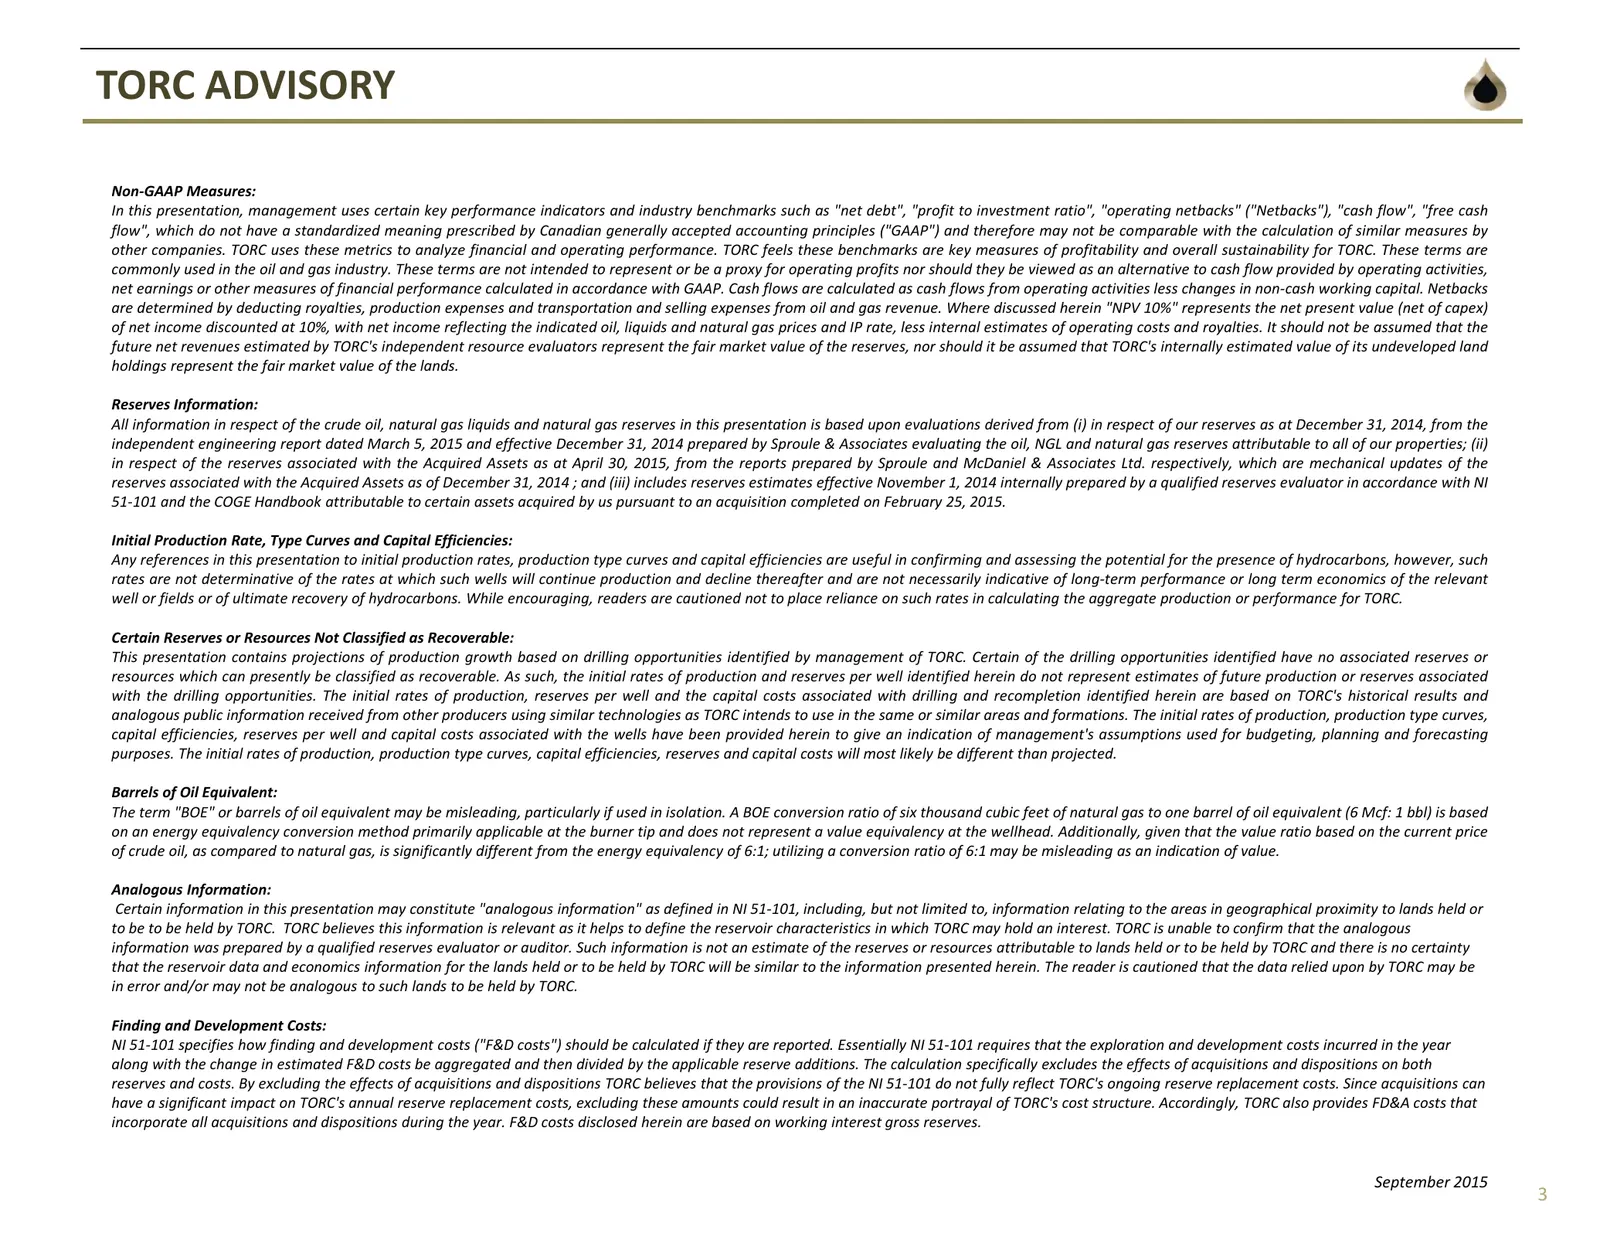
TORC ADVISORY Non‐GAAP Measures: In this presentation, management uses certain key performance indicators and industry benchmarks such as "net debt", "profit to investment ratio", "operating netbacks" ("Netbacks"), "cash flow", "free cash flow", which do not have a standardized meaning prescribed by
Slide 4: Corporate Snapshot
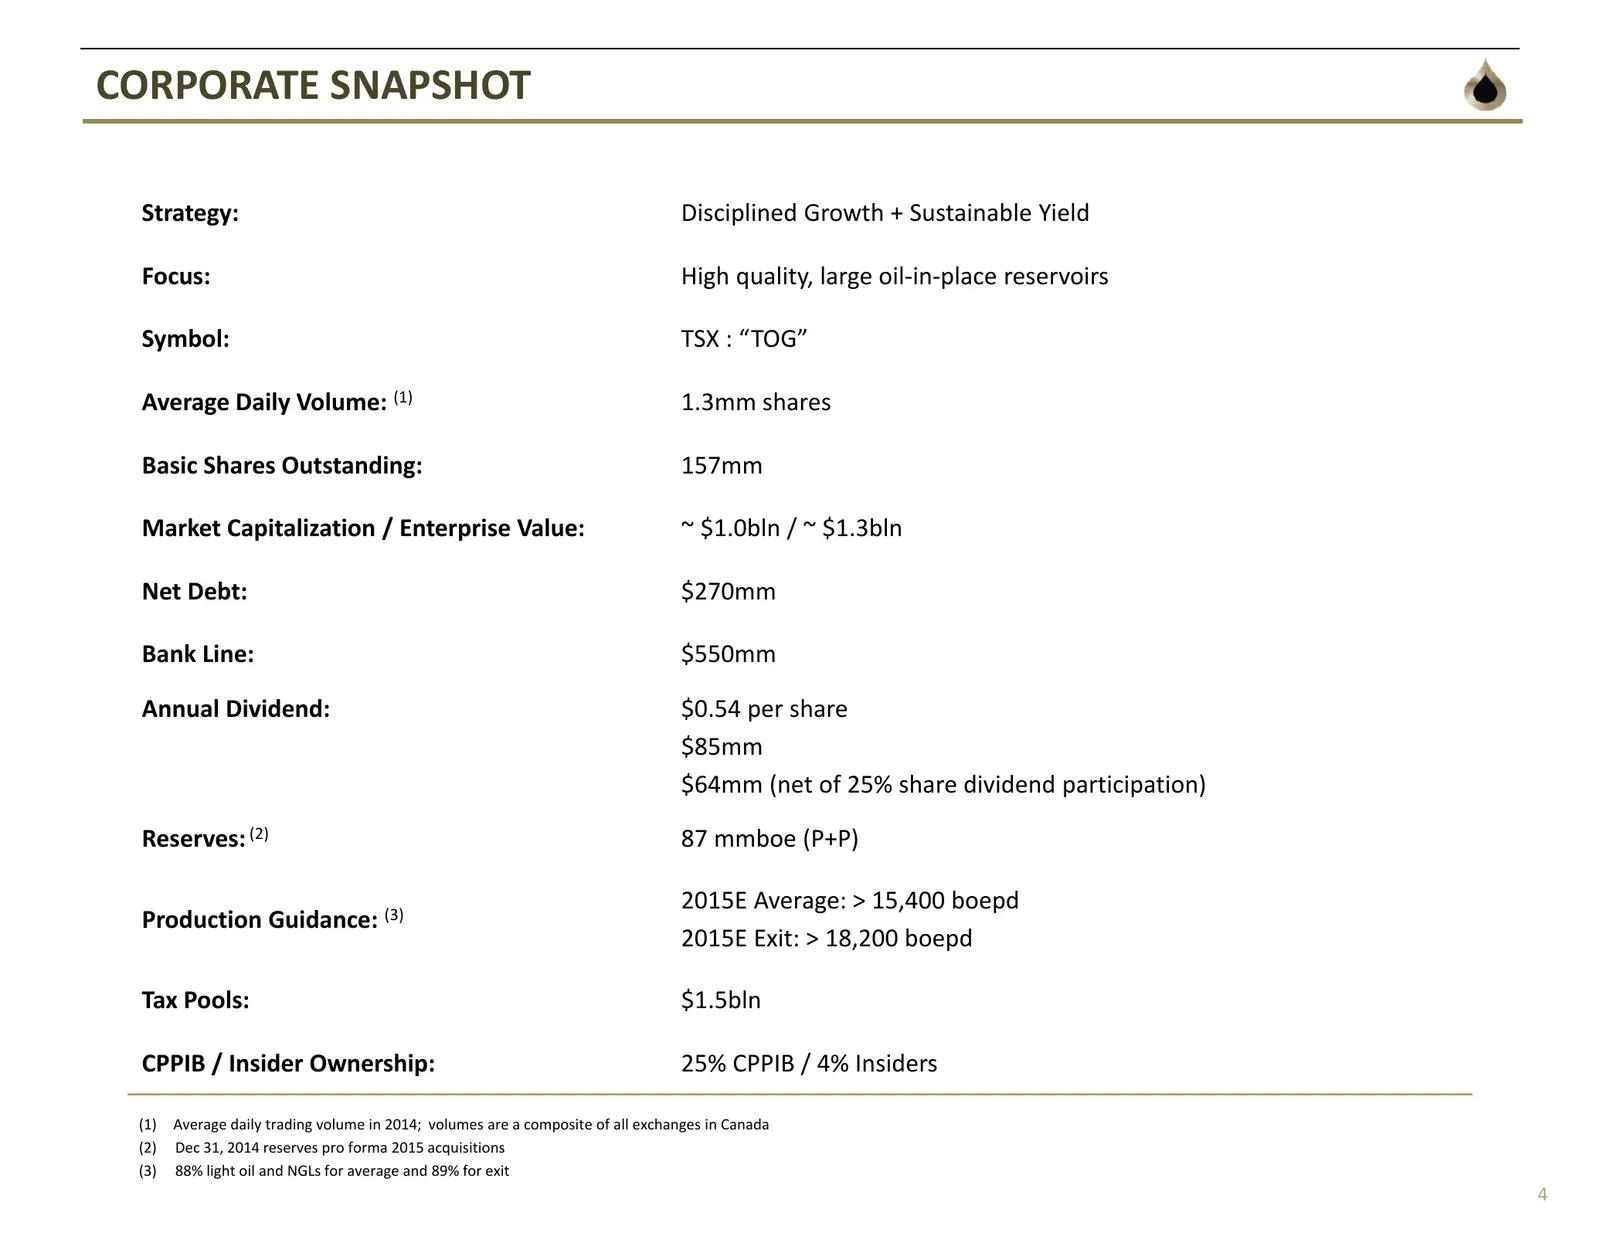
CORPORATE SNAPSHOT Strategy: Disciplined Growth + Sustainable Yield Focus: High quality, large oil‐in‐place reservoirs Symbol: TSX : “TOG” Average Daily Volume: (1) 1.3mm shares Basic Shares Outstanding: 157mm Market Capitalization / Enterprise Value: ~ $1.0bln / ~ $1.3bln Net Debt: $270mm Bank Line
Slide 5: Foundation of TORC – Building a Light Oil Growth Platform
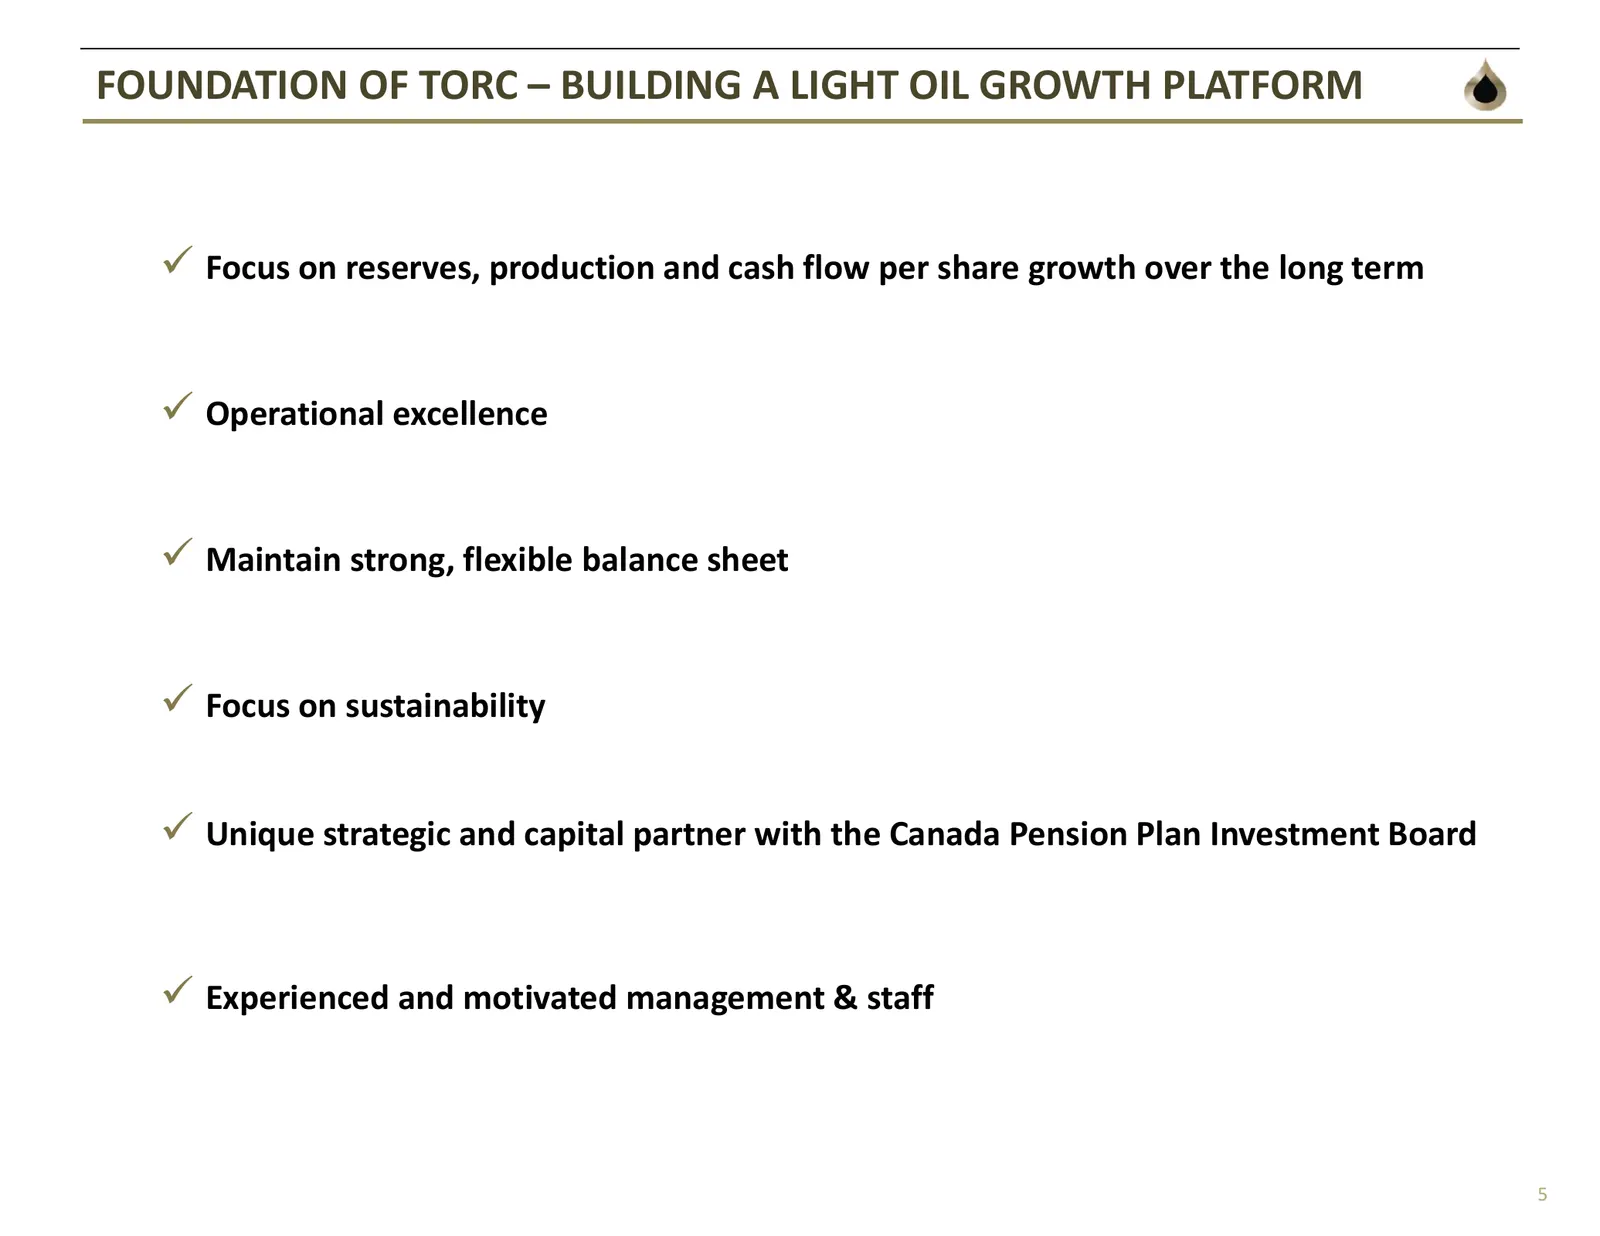
FOUNDATION OF TORC – BUILDING A LIGHT OIL GROWTH PLATFORM Focus on reserves, production and cash flow per share growth over the long term Operational excellence Maintain strong, flexible balance sheet Focus on sustainability Unique strategic and capital partner with the Canada Pension Plan
Slide 6: Life Cycle of Resource Exploitation
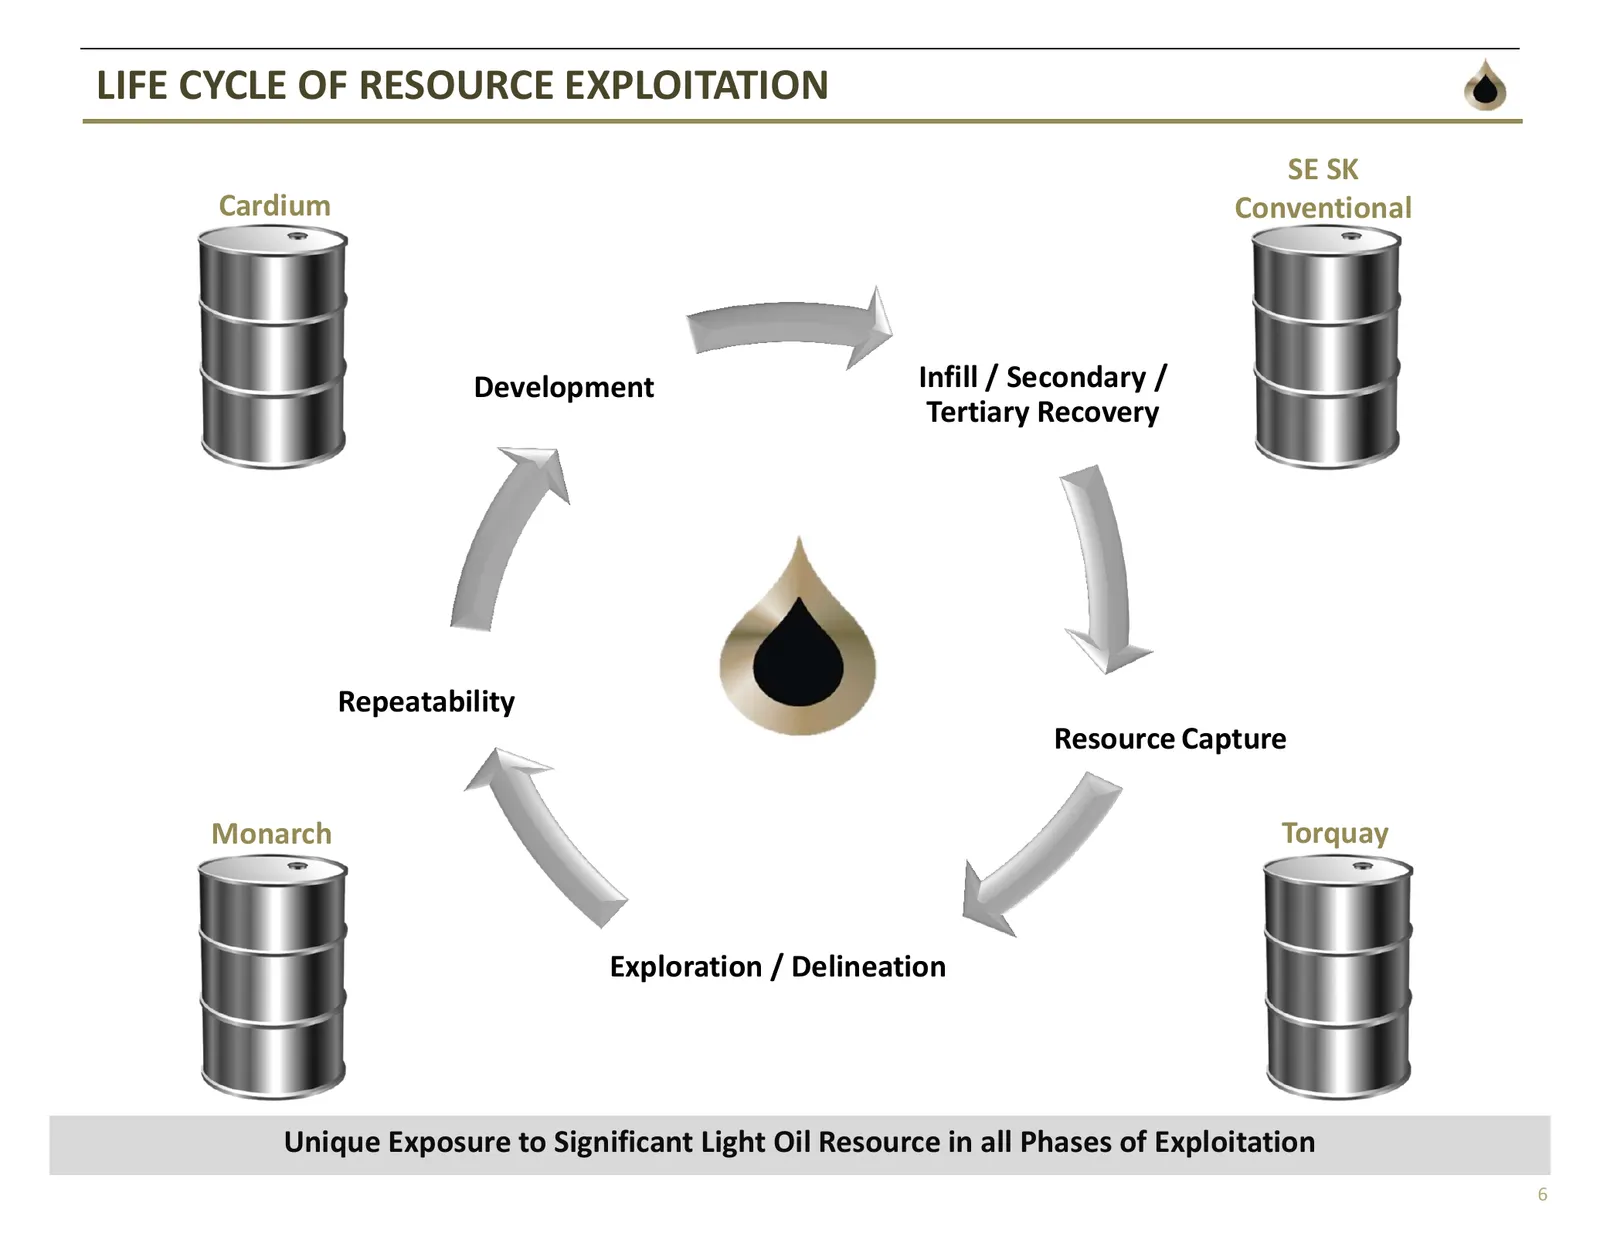
LIFE CYCLE OF RESOURCE EXPLOITATION SE SK Cardium Conventional Development Infill / Secondary / Tertiary Recovery Repeatability Resource Capture Monarch Torquay Exploration / Delineation Unique Exposure to Significant Light Oil Resource in all Phases of Exploitation 6
Slide 7: Balanced Light Oil Asset Base
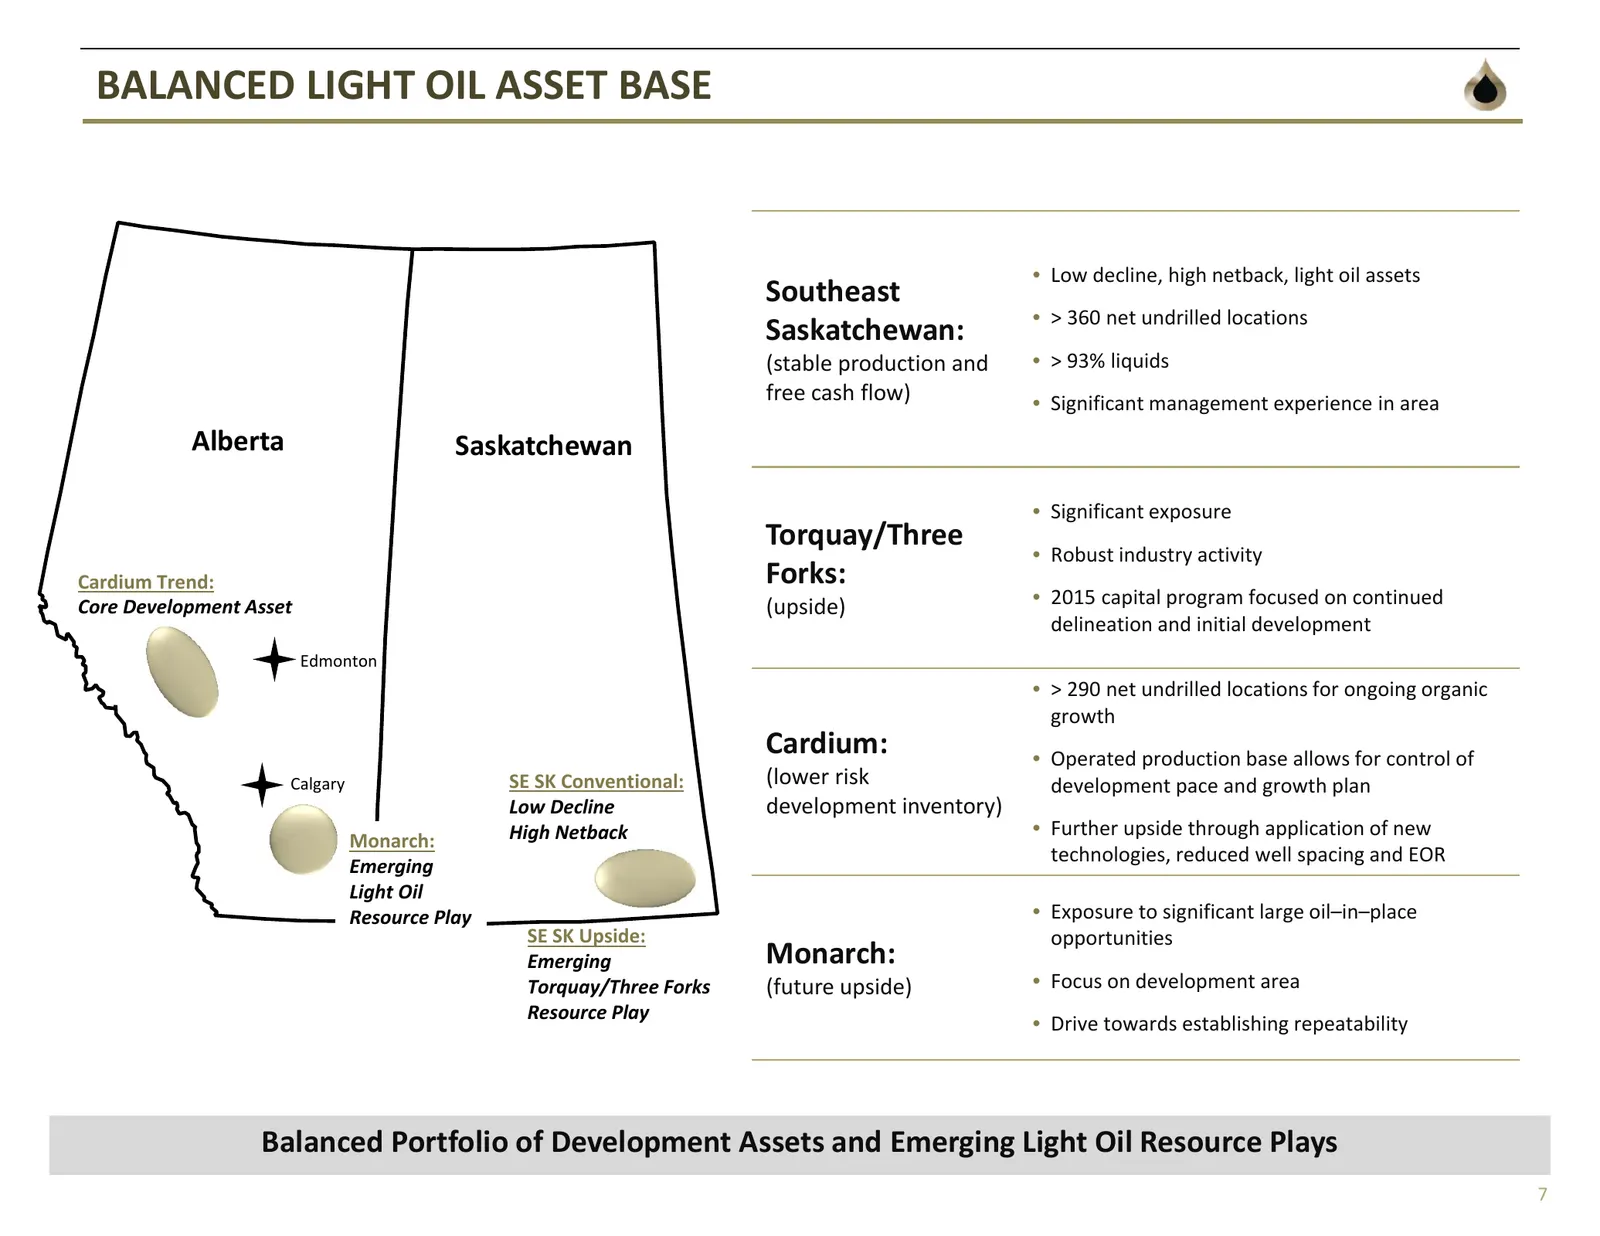
BALANCED LIGHT OIL ASSET BASE • Low decline, high netback, light oil assets Southeast • > 360 net undrilled locations Saskatchewan: (stable production and • > 93% liquids free cash flow) • Significant management experience in area Alberta Saskatchewan • Significant exposure Torquay/Three • Robust in
Slide 8: Southeast Saskatchewan: Cash Flow Generation Plus Upside Potential
Southeast Saskatchewan | Cash Flow Generation Plus Upside Potential
Slide 9: SE Saskatchewan Conventional – Cash Flow Engine
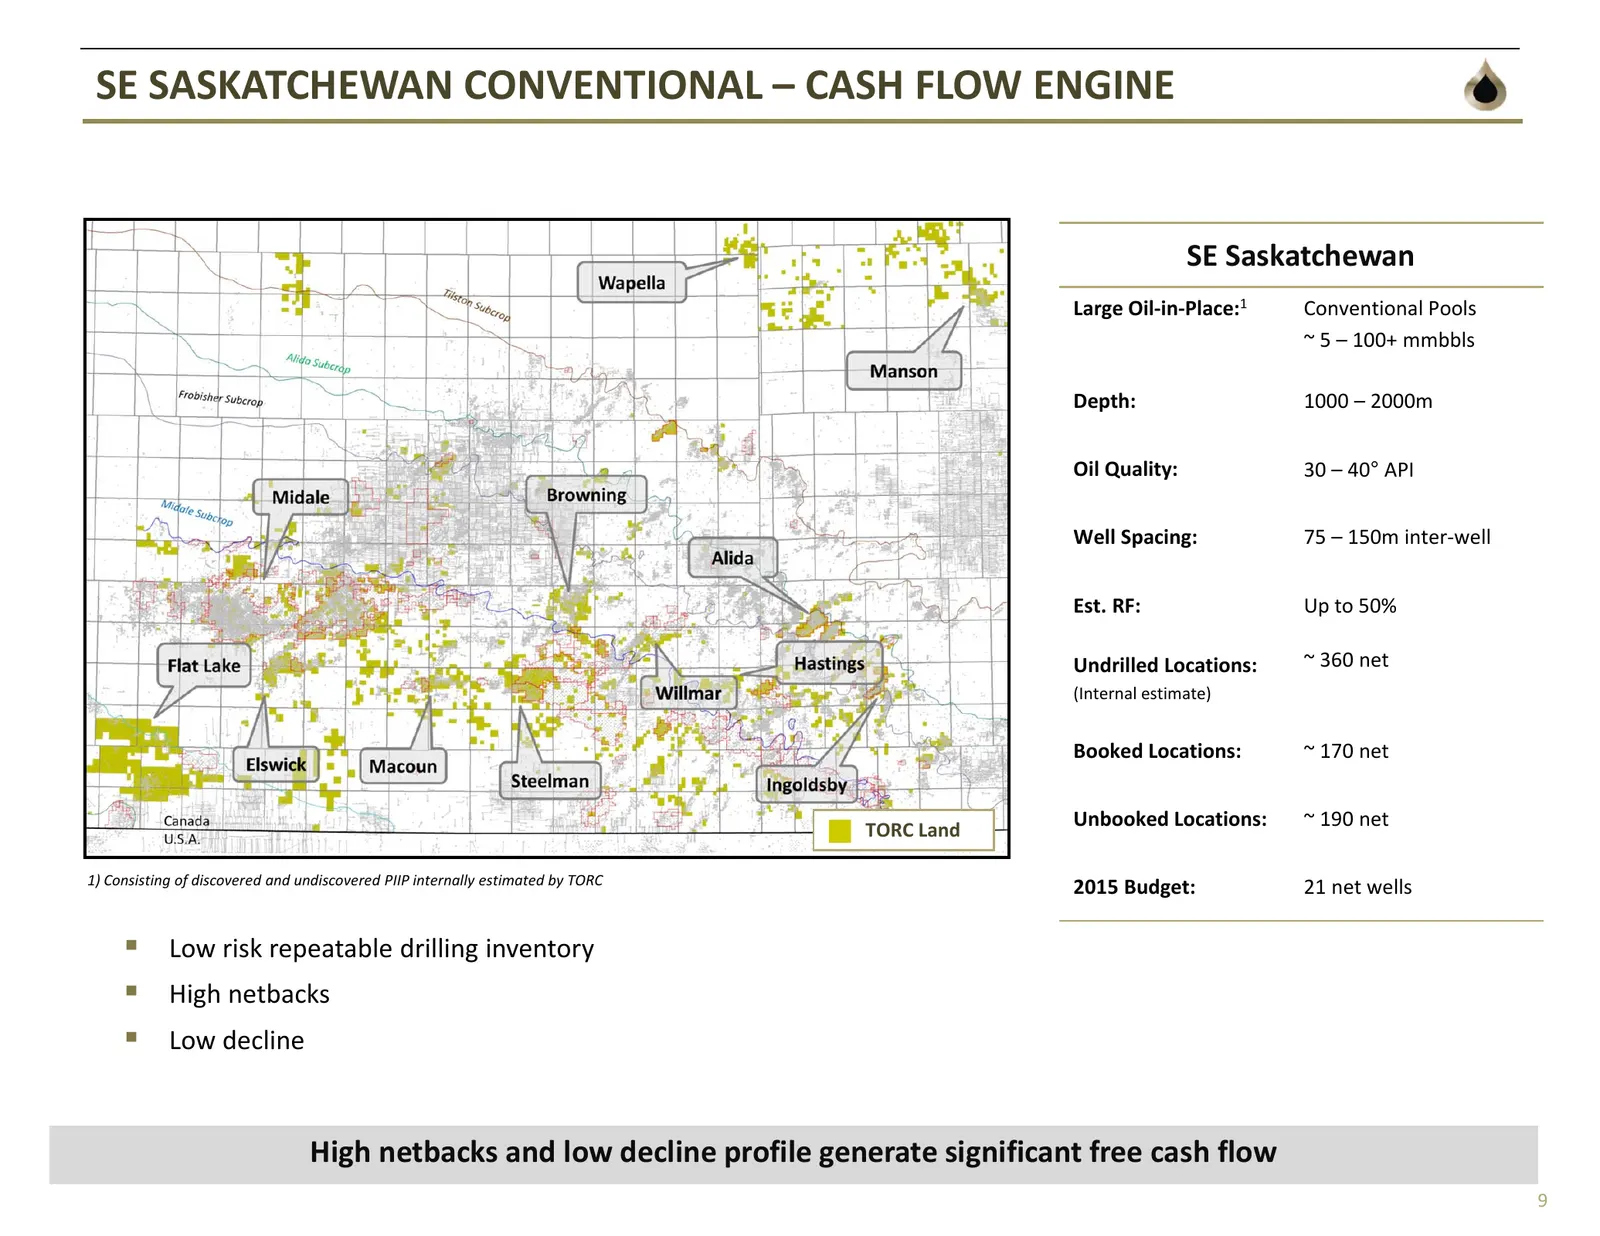
SE SASKATCHEWAN CONVENTIONAL – CASH FLOW ENGINE SE Saskatchewan Large Oil‐in‐Place:1 Conventional Pools ~ 5 – 100+ mmbbls Depth: 1000 – 2000m Oil Quality: 30 – 40° API Well Spacing: 75 – 150m inter‐well Est. RF: Up to 50% Undrilled Locations: ~ 360 net (Internal estimate) Booked Locations: ~ 170 net
Slide 10: SE Saskatchewan Conventional – Cash Flow Engine: Type Curve
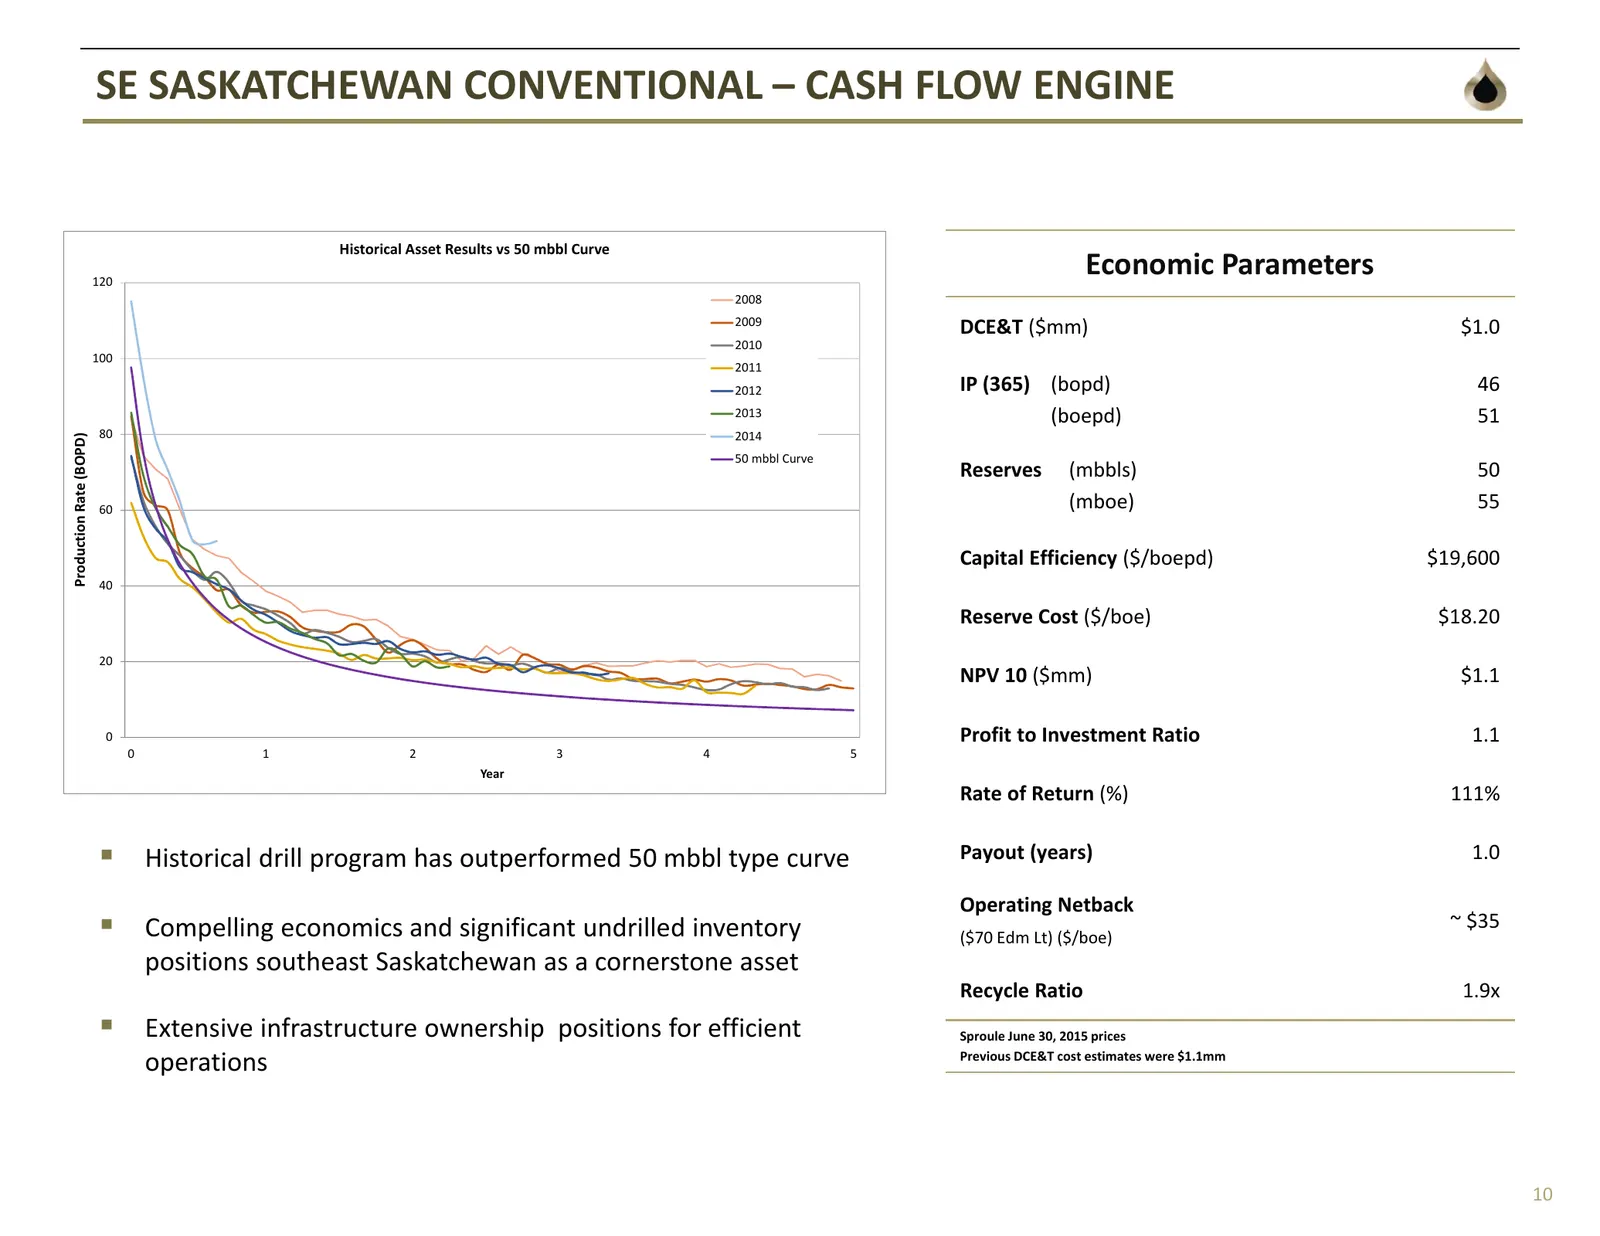
SE SASKATCHEWAN CONVENTIONAL – CASH FLOW ENGINE Historical Asset Results vs 50 mbbl Curve 120 Economic Parameters 2008 2009 DCE&T ($mm) $1.0 2010 100 2011 2012 IP (365) (bopd) 46 2013 (boepd) 51 80 2014 Production Rate (BOPD) 50 mbbl Curve Reserves (mbbls) 50 60 (mboe) 55 Capital Efficiency ($/boepd
Slide 11: SE Saskatchewan – Torquay / Three Forks Upside
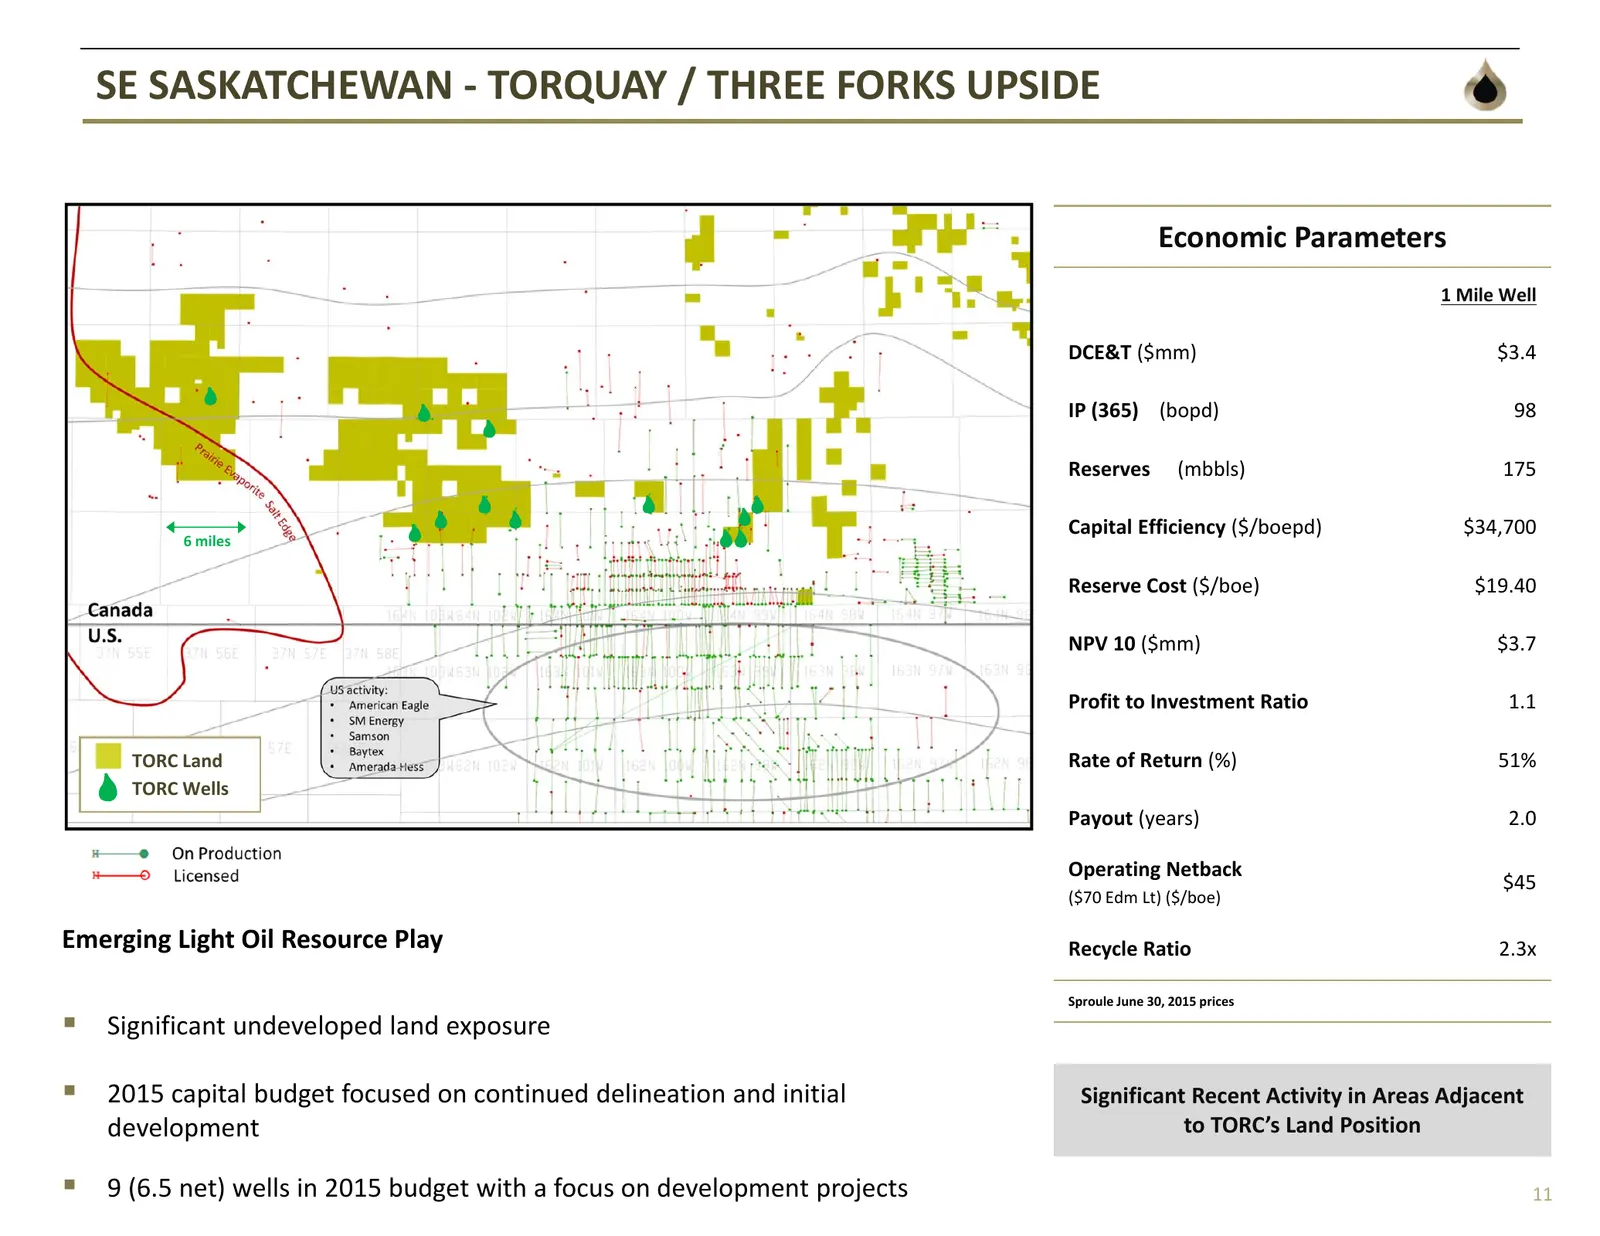
SE SASKATCHEWAN ‐ TORQUAY / THREE FORKS UPSIDE Economic Parameters 1 Mile Well DCE&T ($mm) $3.4 IP (365) (bopd) 98 Reserves (mbbls) 175 Capital Efficiency ($/boepd) $34,700 6 miles Reserve Cost ($/boe) $19.40 NPV 10 ($mm) $3.7 Profit to Investment Ratio 1.1 TORC Land Rate of Return (%) 51% TORC Well
Slide 12: Southeast Saskatchewan – Free Cash Flow Machine
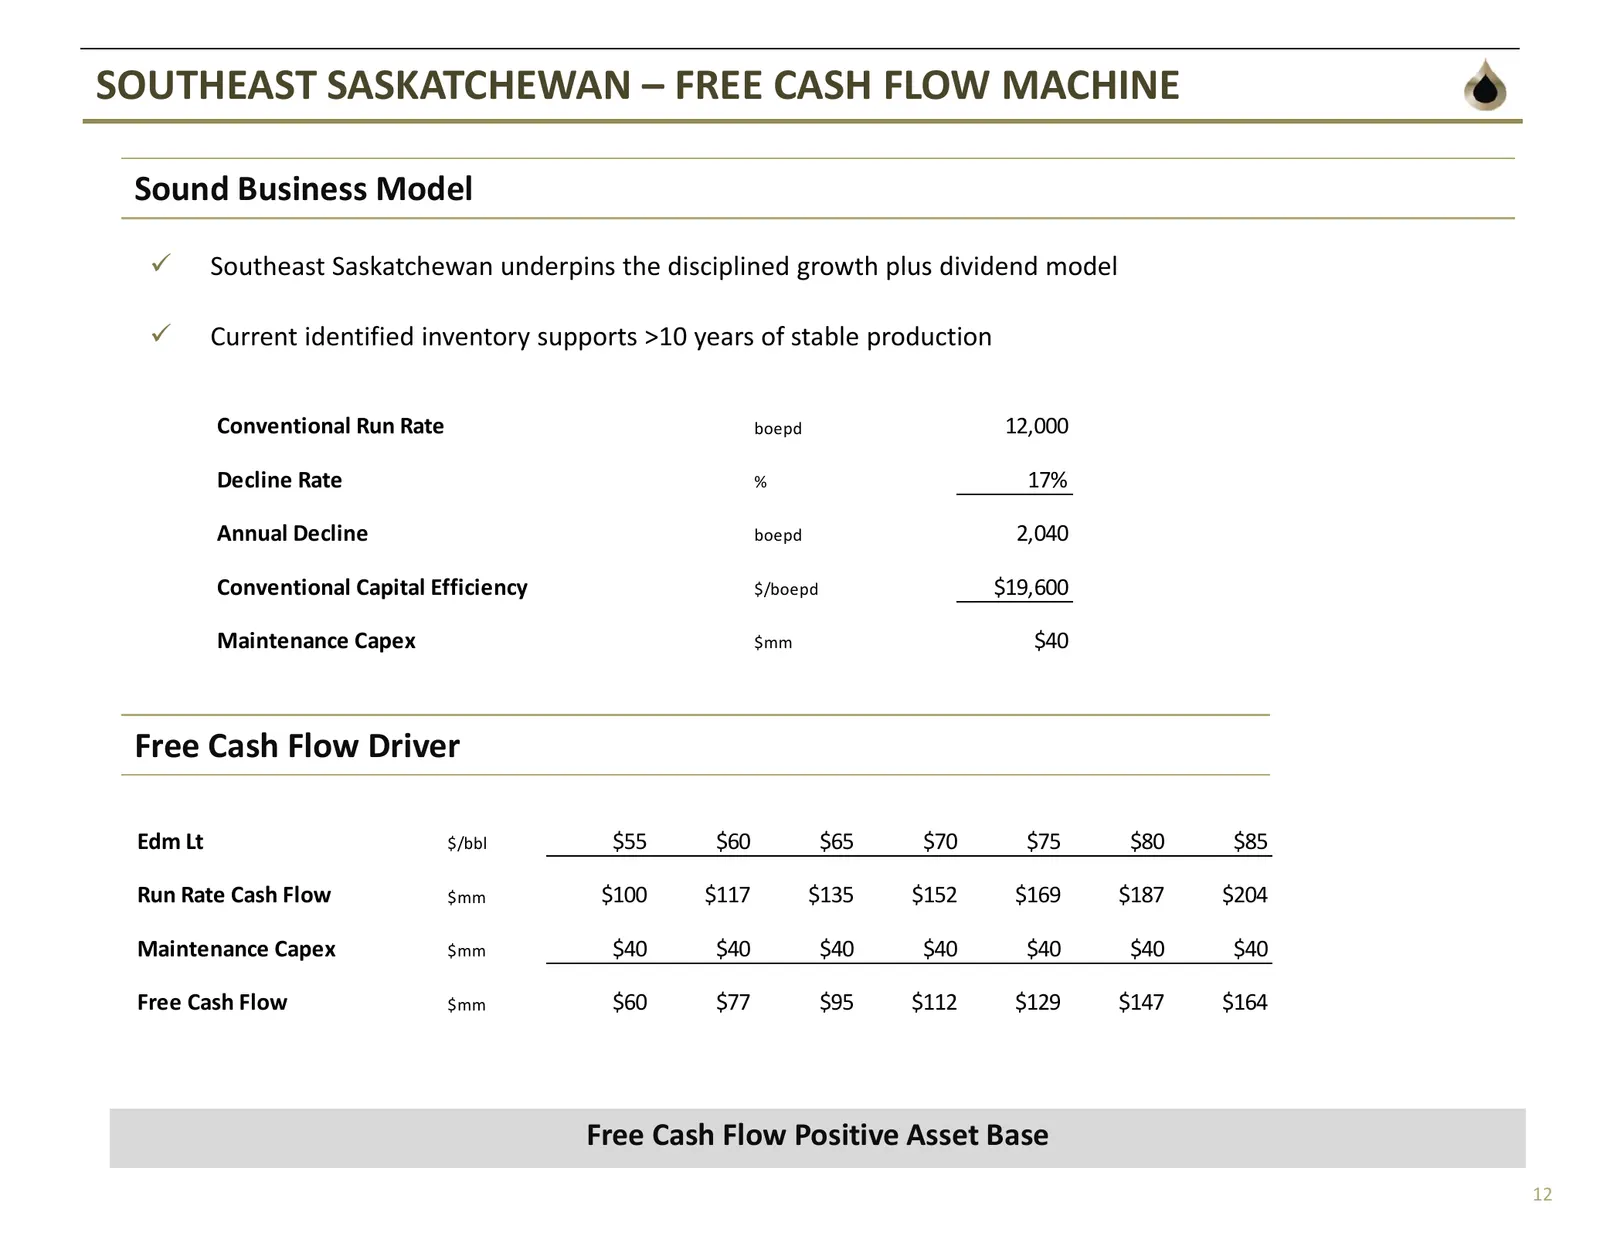
SOUTHEAST SASKATCHEWAN – FREE CASH FLOW MACHINE Sound Business Model Southeast Saskatchewan underpins the disciplined growth plus dividend model Current identified inventory supports >10 years of stable production Conventional Run Rate boepd 12,000 Decline Rate % 17% Annual Decline boepd 2,040 C
Slide 13: Cardium Development
Cardium | Development
Slide 14: Cardium Trend – Significant Undrilled Development Inventory
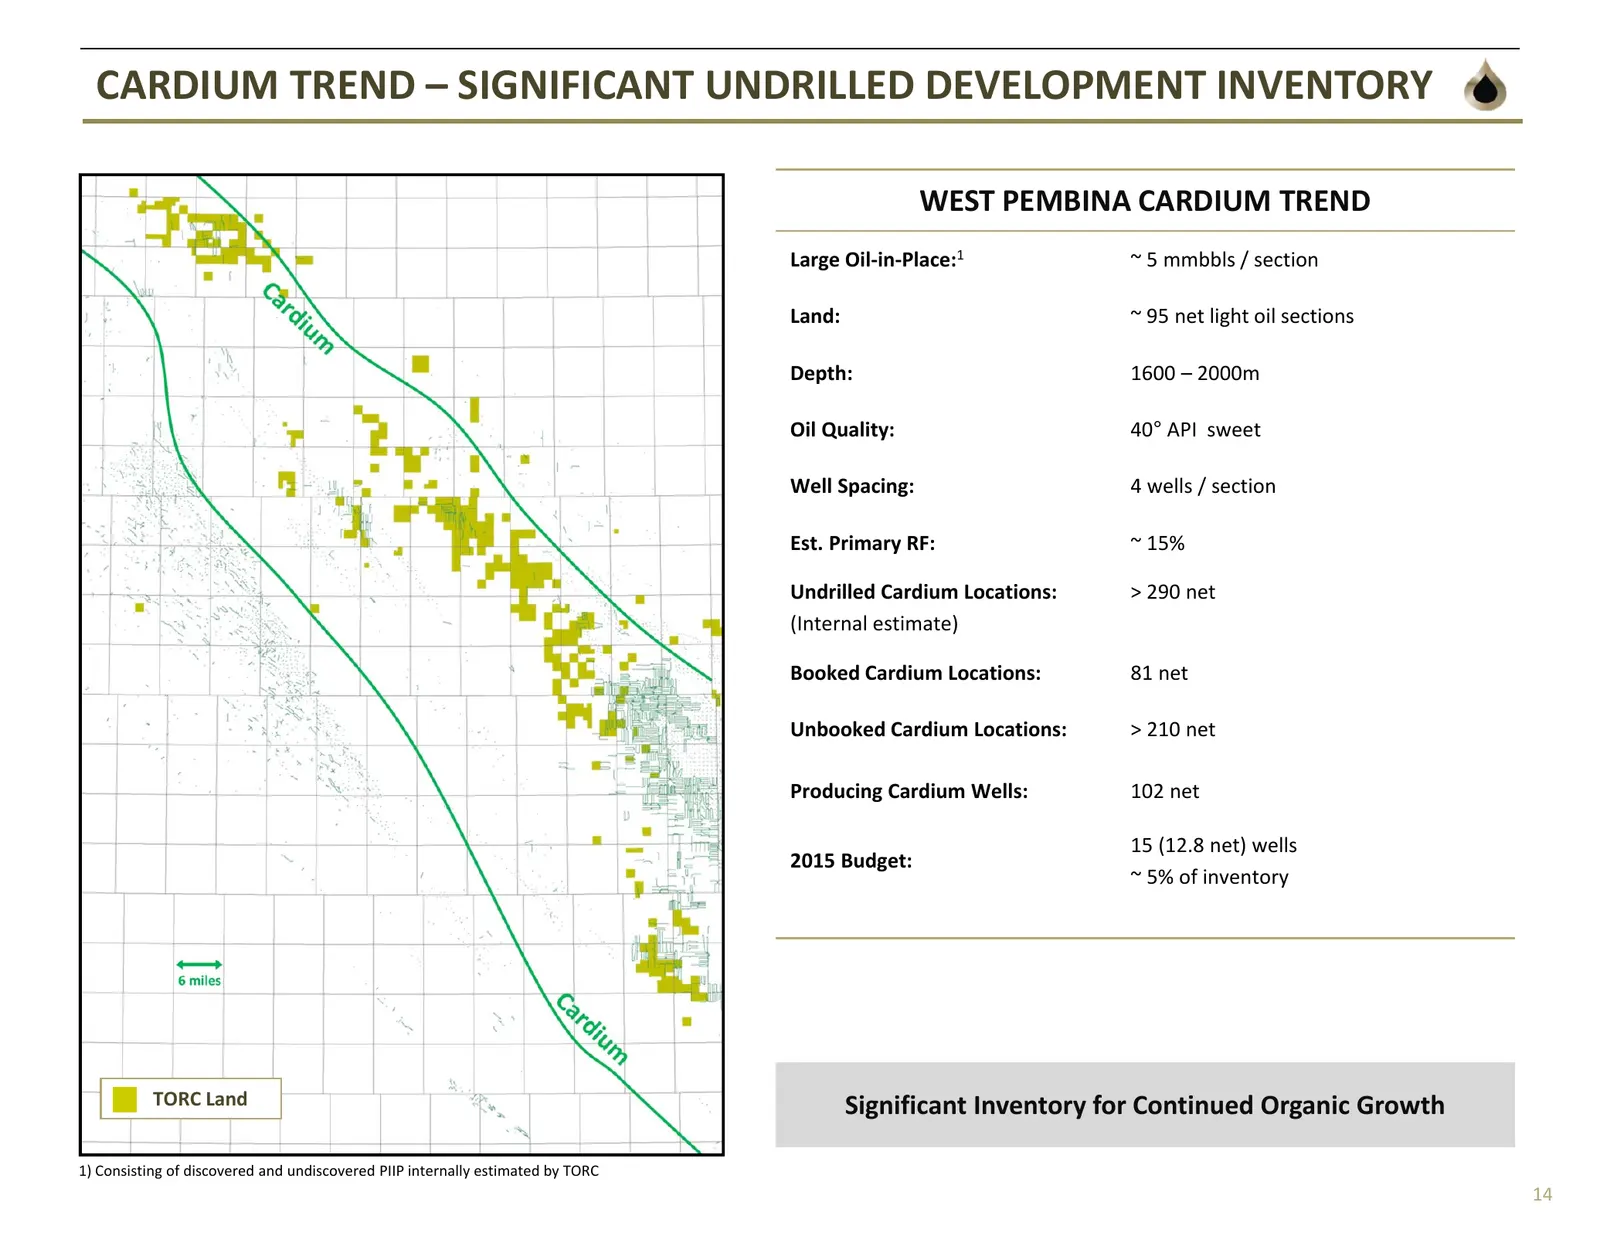
CARDIUM TREND – SIGNIFICANT UNDRILLED DEVELOPMENT INVENTORY WEST PEMBINA CARDIUM TREND Large Oil‐in‐Place:1 ~ 5 mmbbls / section Land: ~ 95 net light oil sections Depth: 1600 – 2000m Oil Quality: 40° API sweet Well Spacing: 4 wells / section Est. Primary RF: ~ 15% Undrilled Cardium Locations: > 290
Slide 15: Development Drilling – Cardium Results
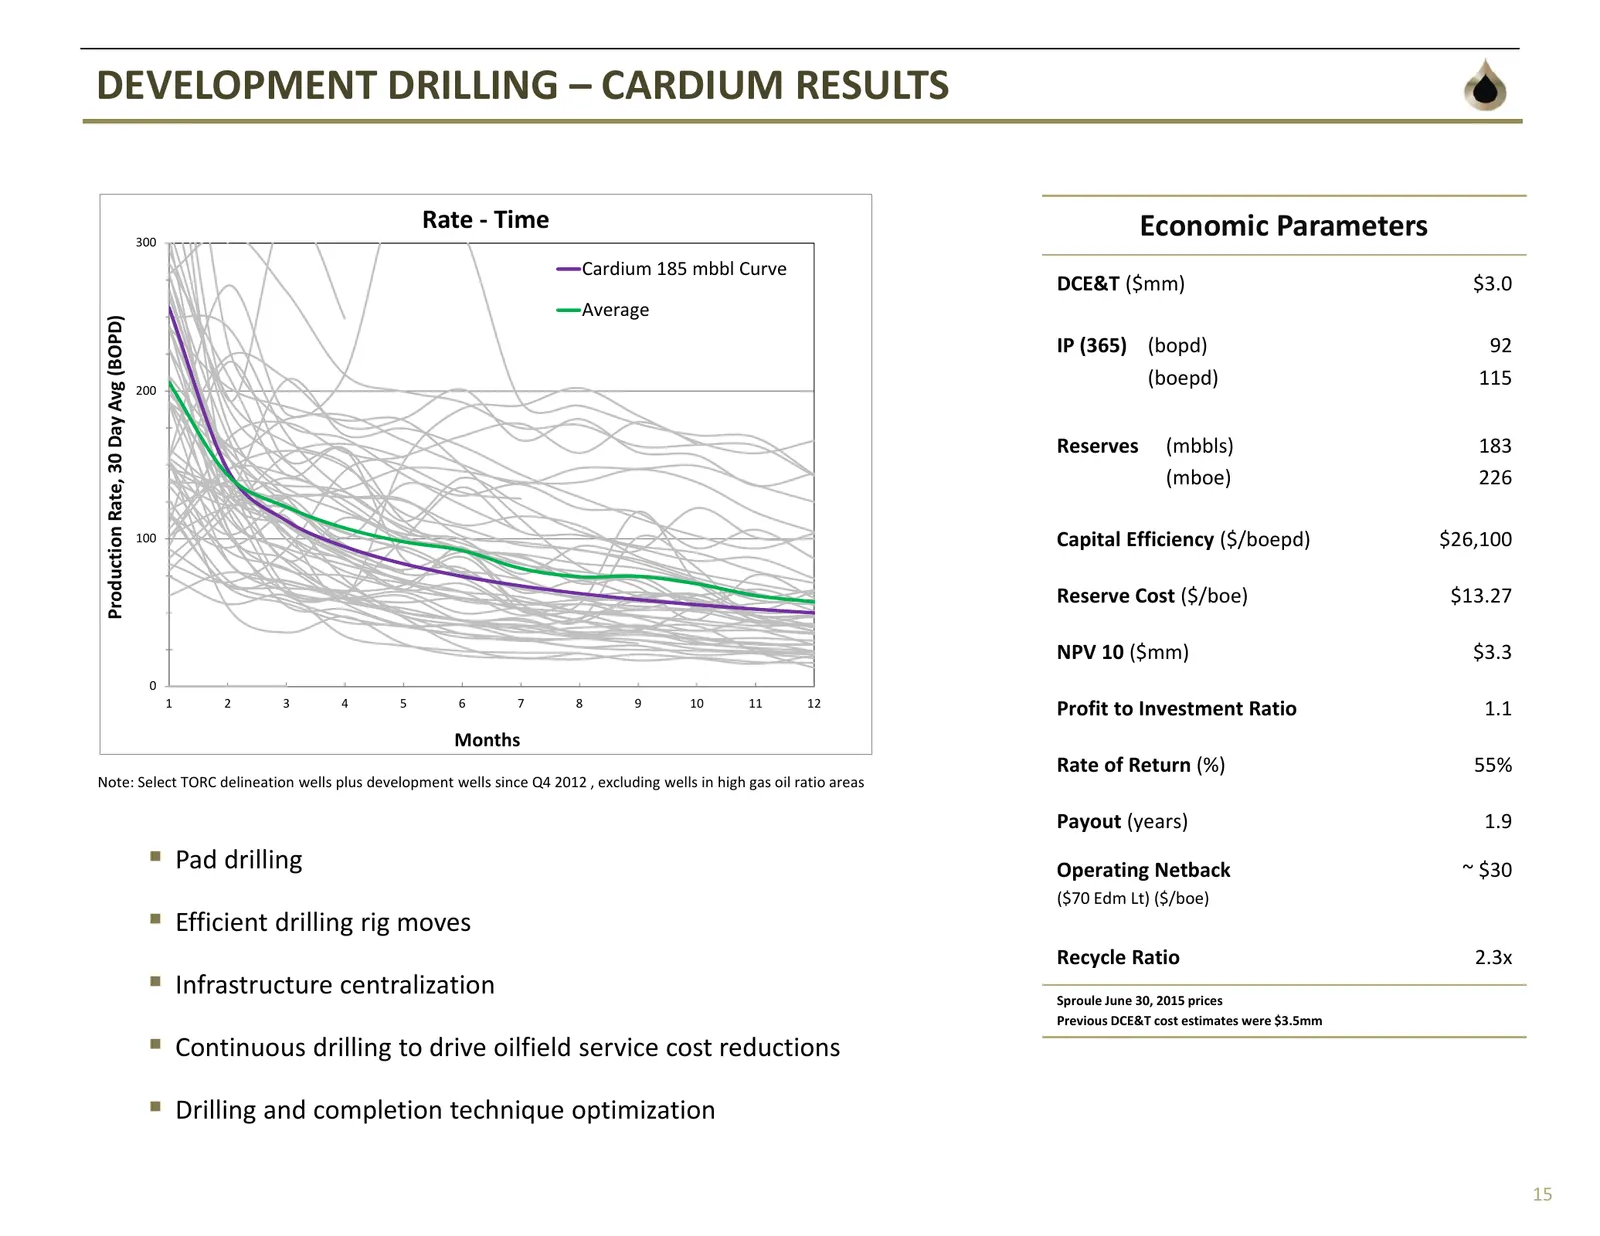
DEVELOPMENT DRILLING – CARDIUM RESULTS Rate ‐ Time Economic Parameters 300 Cardium 185 mbbl Curve DCE&T ($mm) $3.0 Average Production Rate, 30 Day Avg (BOPD) IP (365) (bopd) 92 200 (boepd) 115 Reserves (mbbls) 183 (mboe) 226 100 Capital Efficiency ($/boepd) $26,100 Reserve Cost ($/boe) $13.27 NPV 10
Slide 16: Financial Overview
Financial Overview
Slide 17: 2015: Taking Advantage of Relative Positioning
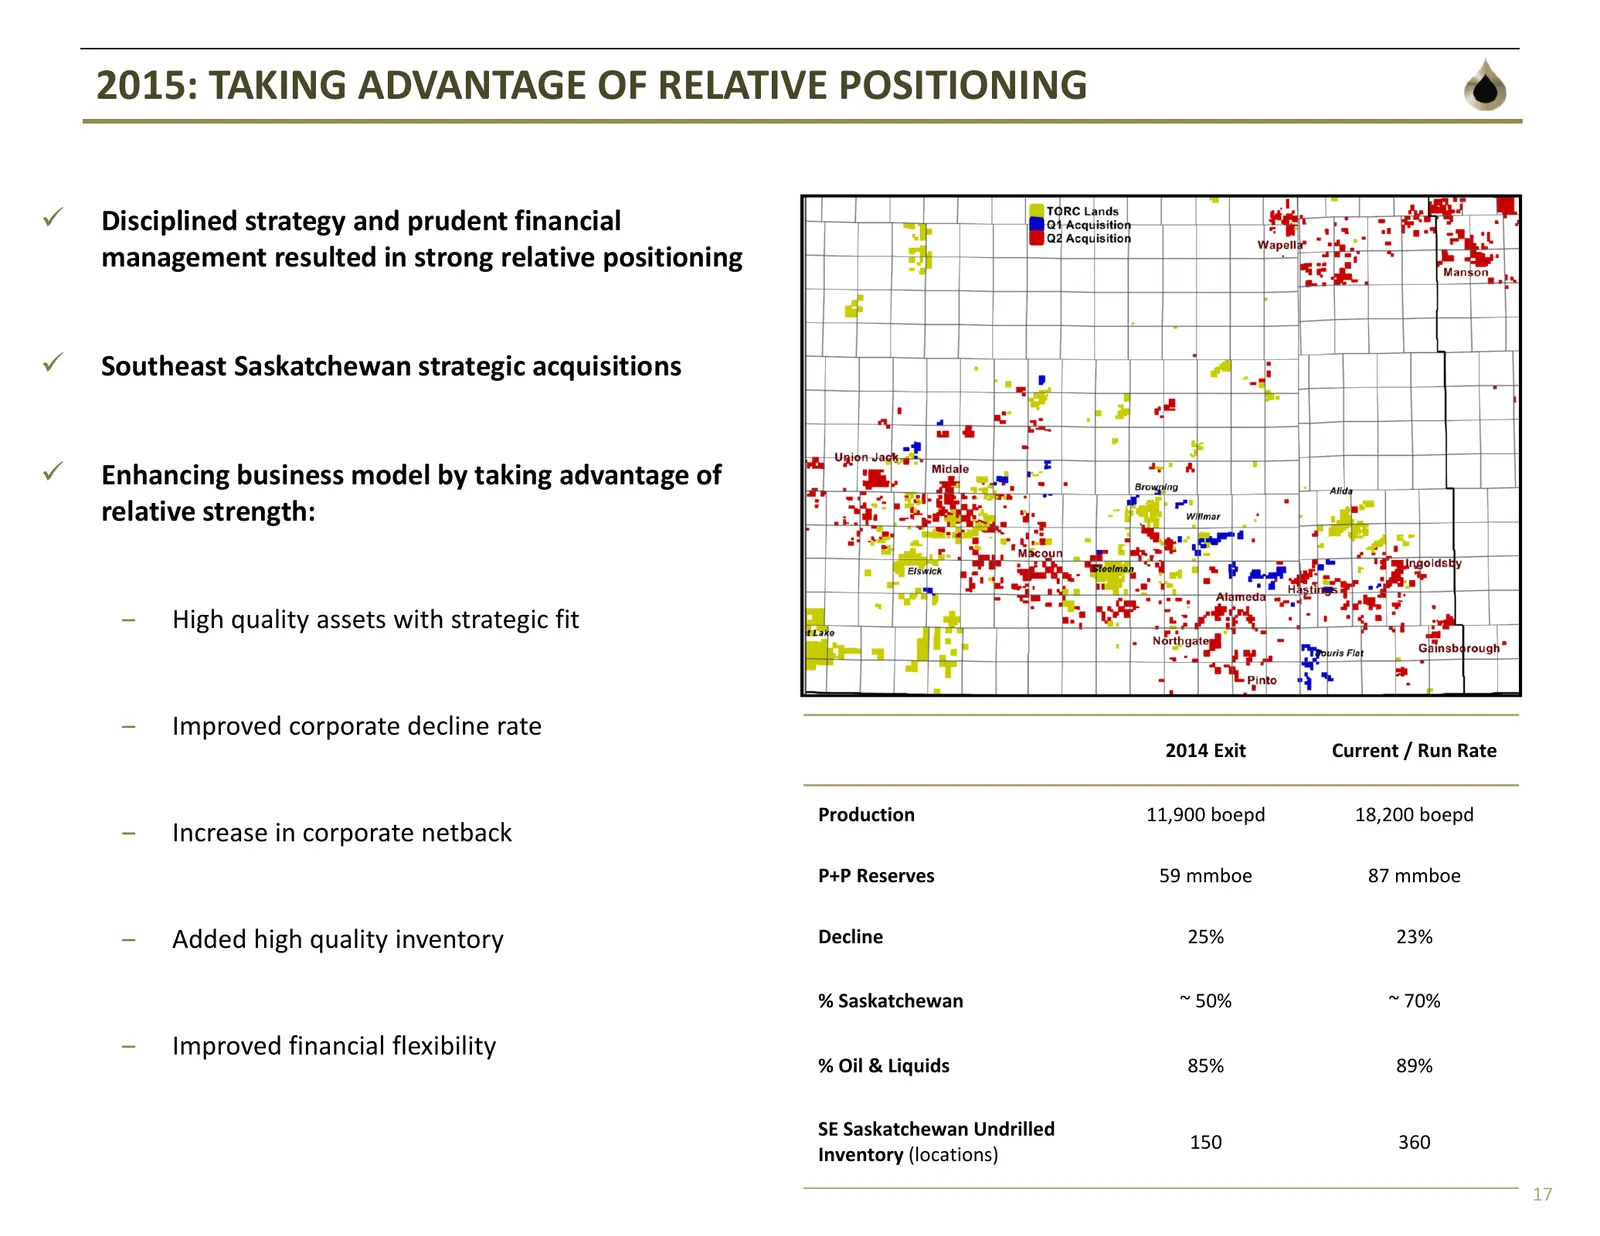
2015: TAKING ADVANTAGE OF RELATIVE POSITIONING Disciplined strategy and prudent financial management resulted in strong relative positioning Southeast Saskatchewan strategic acquisitions Enhancing business model by taking advantage of relative strength: ‒ High quality assets with strategic fit
Slide 18: 2015 Capital Program – Balanced Approach to Market Volatility
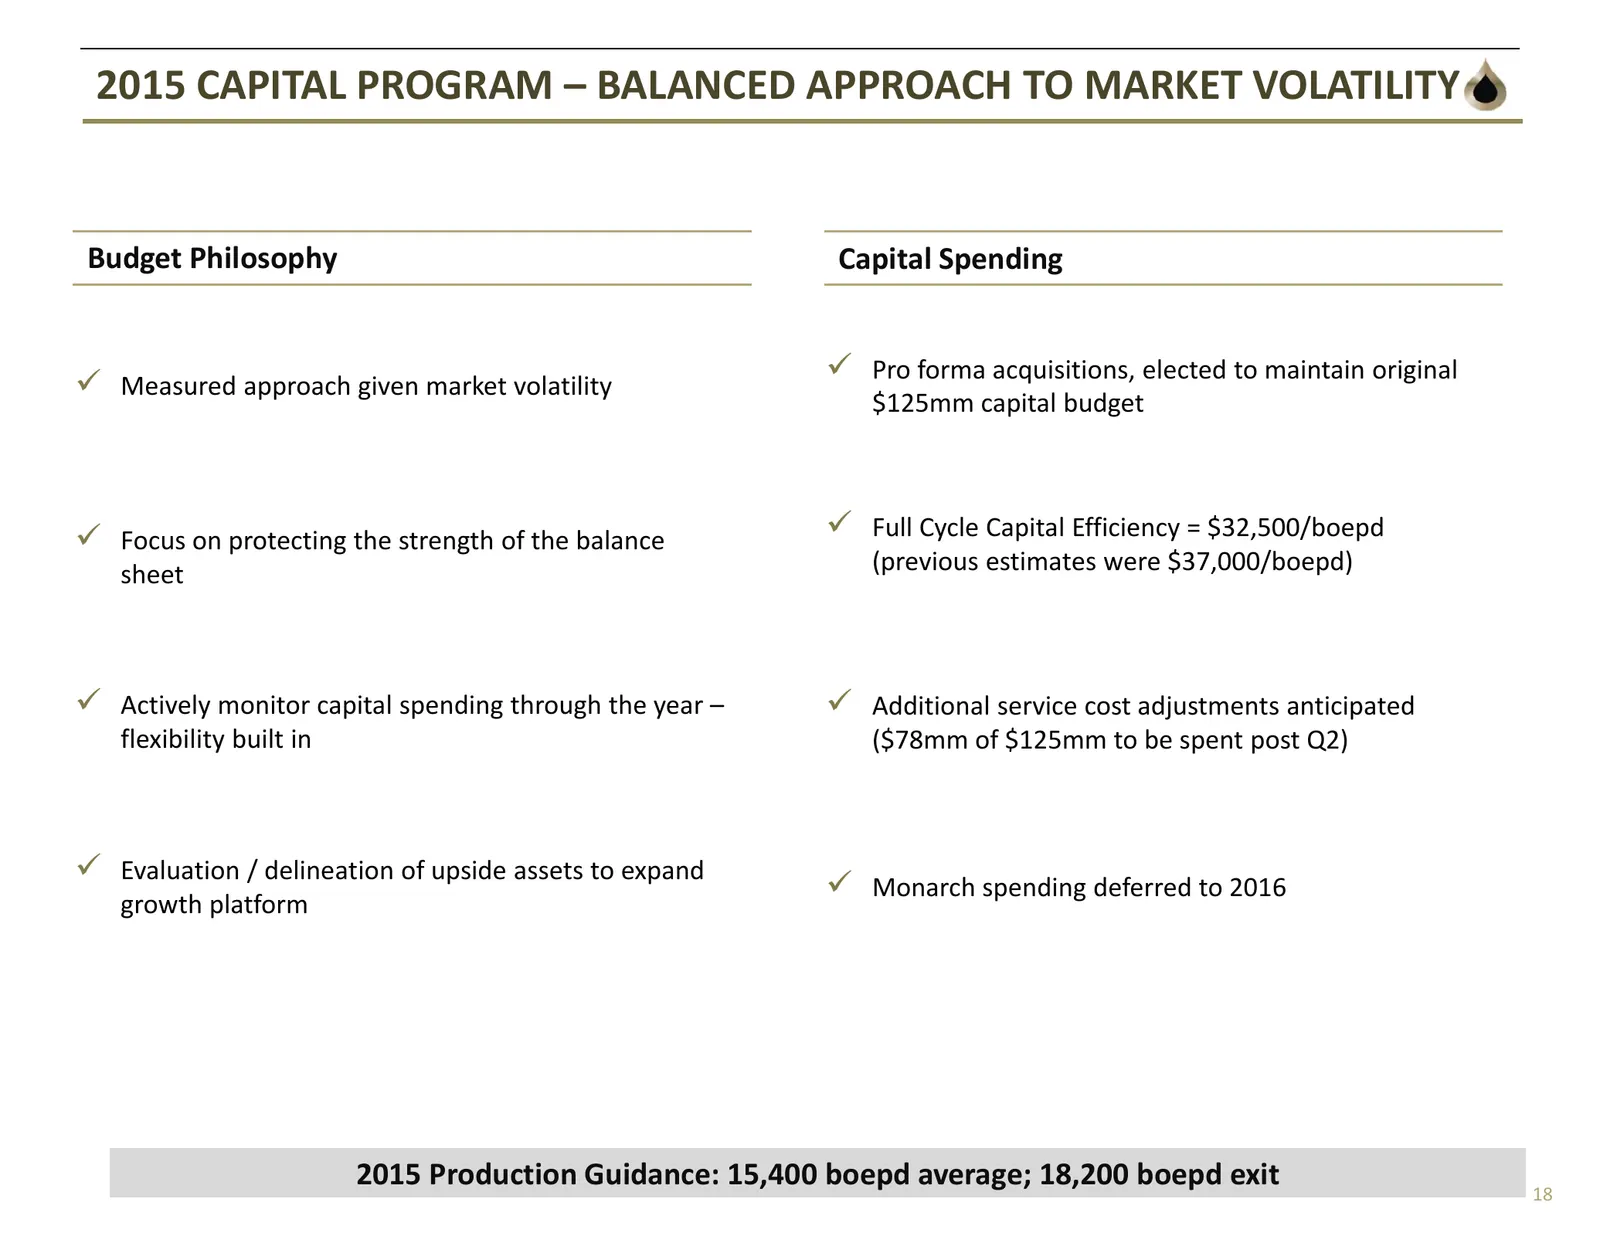
2015 CAPITAL PROGRAM – BALANCED APPROACH TO MARKET VOLATILITY Budget Philosophy Capital Spending Measured approach given market volatility Pro forma acquisitions, elected to maintain original $125mm capital budget Focus on protecting the strength of the balance Full Cycle Capital Efficiency
Slide 19: Sustainability Analysis
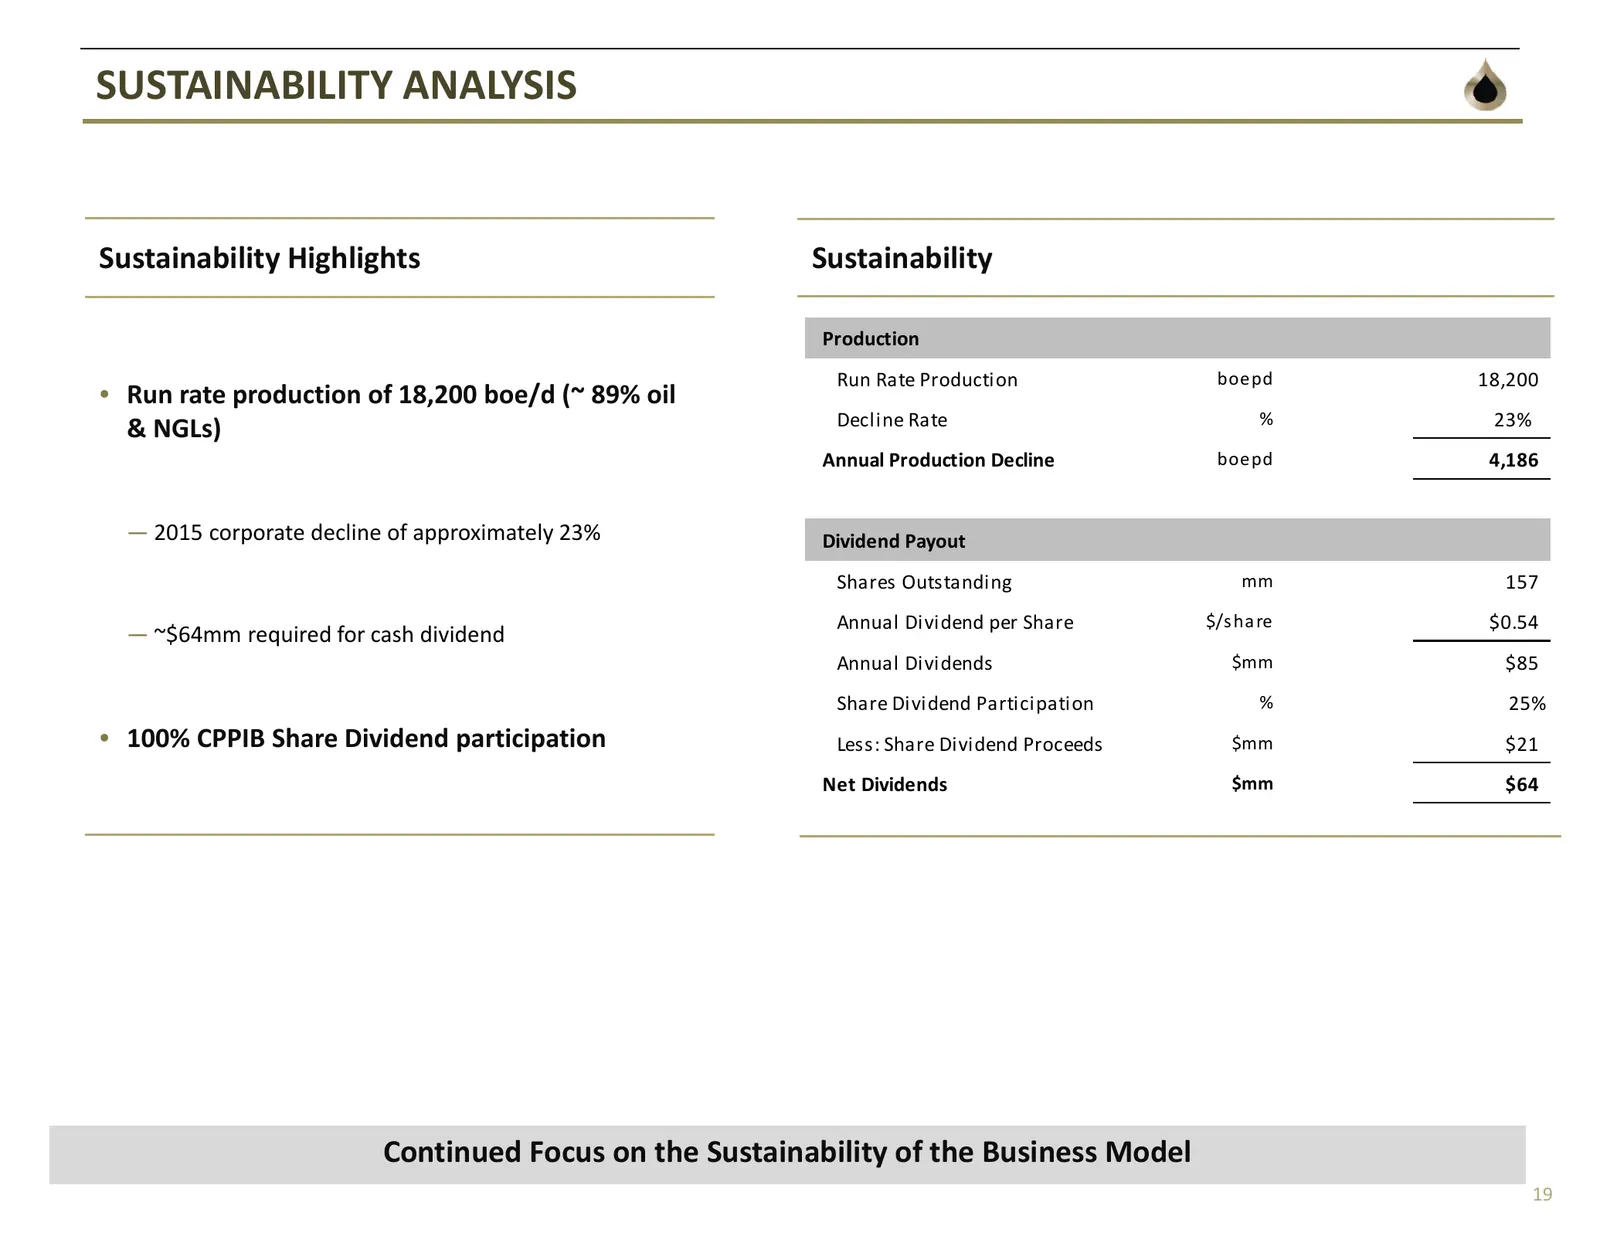
SUSTAINABILITY ANALYSIS Sustainability Highlights Sustainability Production Run Rate Production boepd 18,200 • Run rate production of 18,200 boe/d (~ 89% oil Decline Rate % 23% & NGLs) Annual Production Decline boepd 4,186 ― 2015 corporate decline of approximately 23% Dividend Payout Shares Outstand
Slide 20: Sustainability Analysis: Commodity Sensitivity
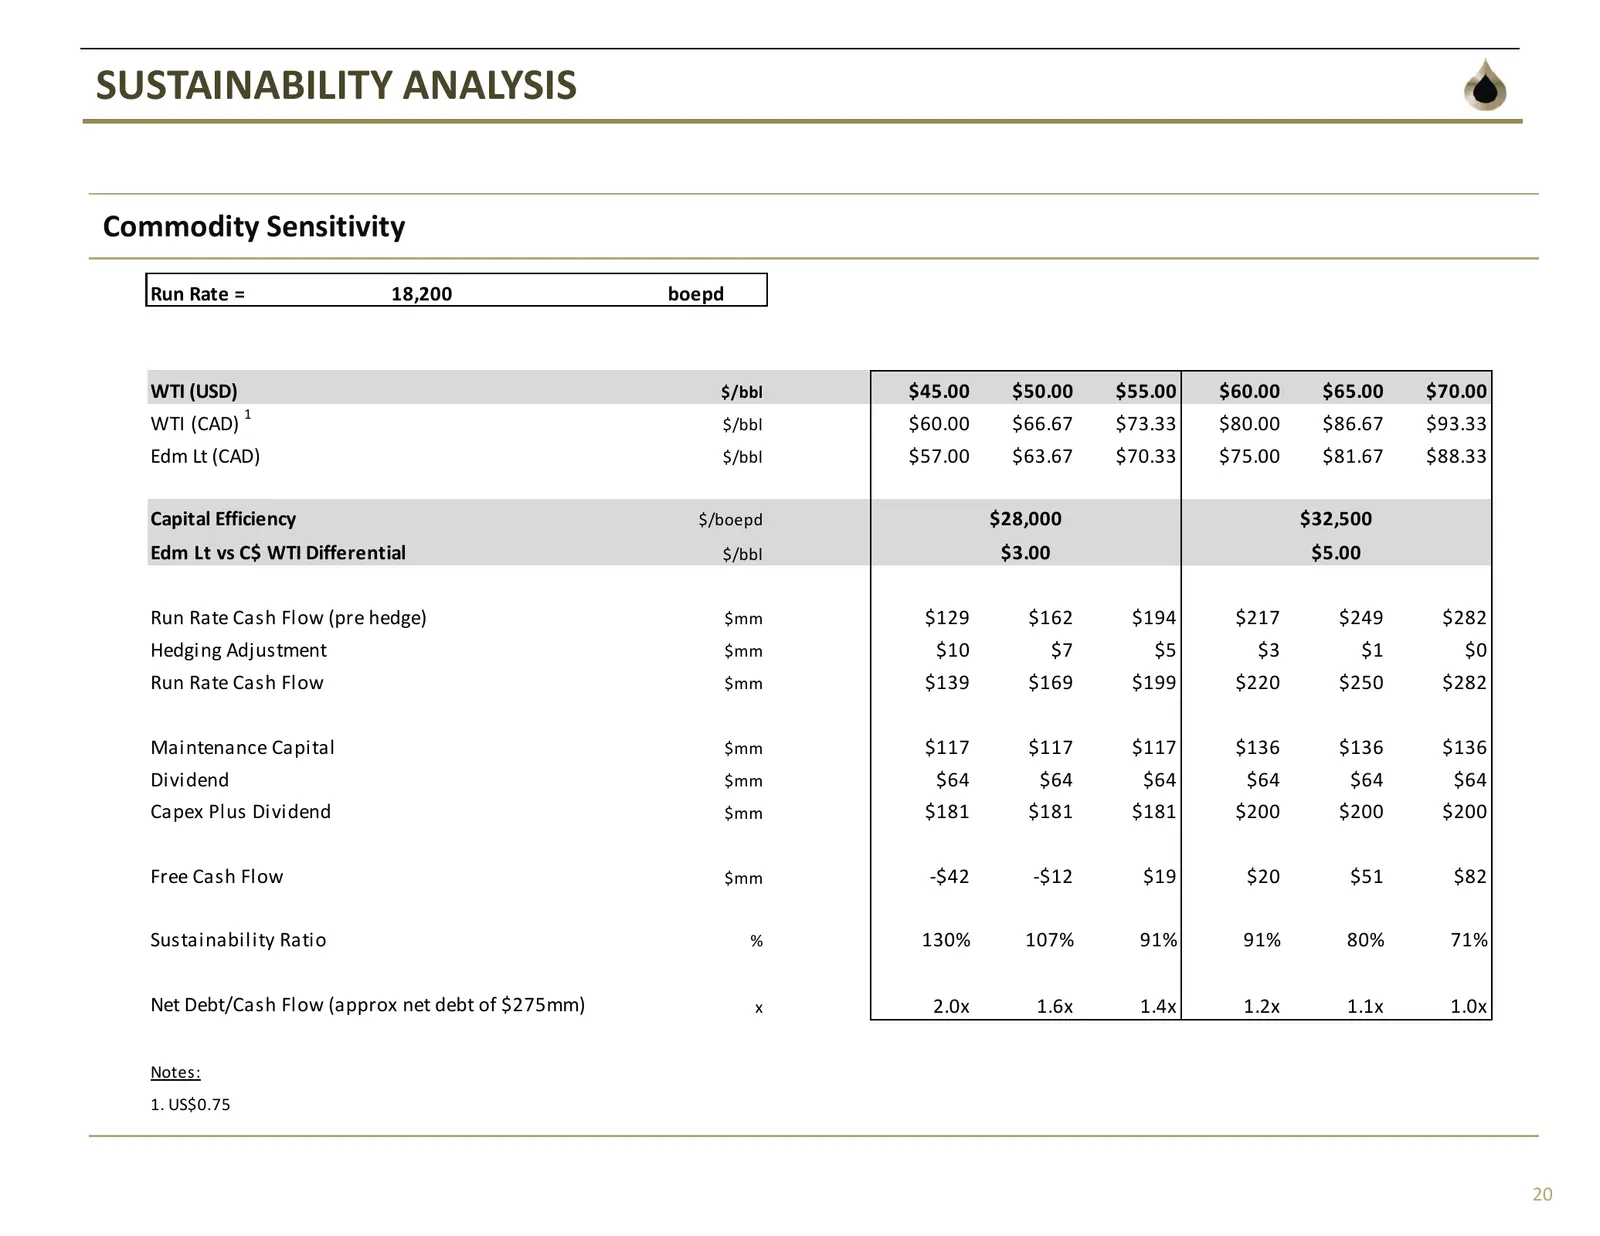
SUSTAINABILITY ANALYSIS Commodity Sensitivity Run Rate = 18,200 boepd WTI (USD) $/bbl $45.00 $50.00 $55.00 $60.00 $65.00 $70.00 1 WTI (CAD) $/bbl $60.00 $66.67 $73.33 $80.00 $86.67 $93.33 Edm Lt (CAD) $/bbl $57.00 $63.67 $70.33 $75.00 $81.67 $88.33 Capital Efficiency $/boepd $28,000 $32,500 Edm Lt v
Slide 21: Roll Forward Scenario Analysis – Lower Price Environment
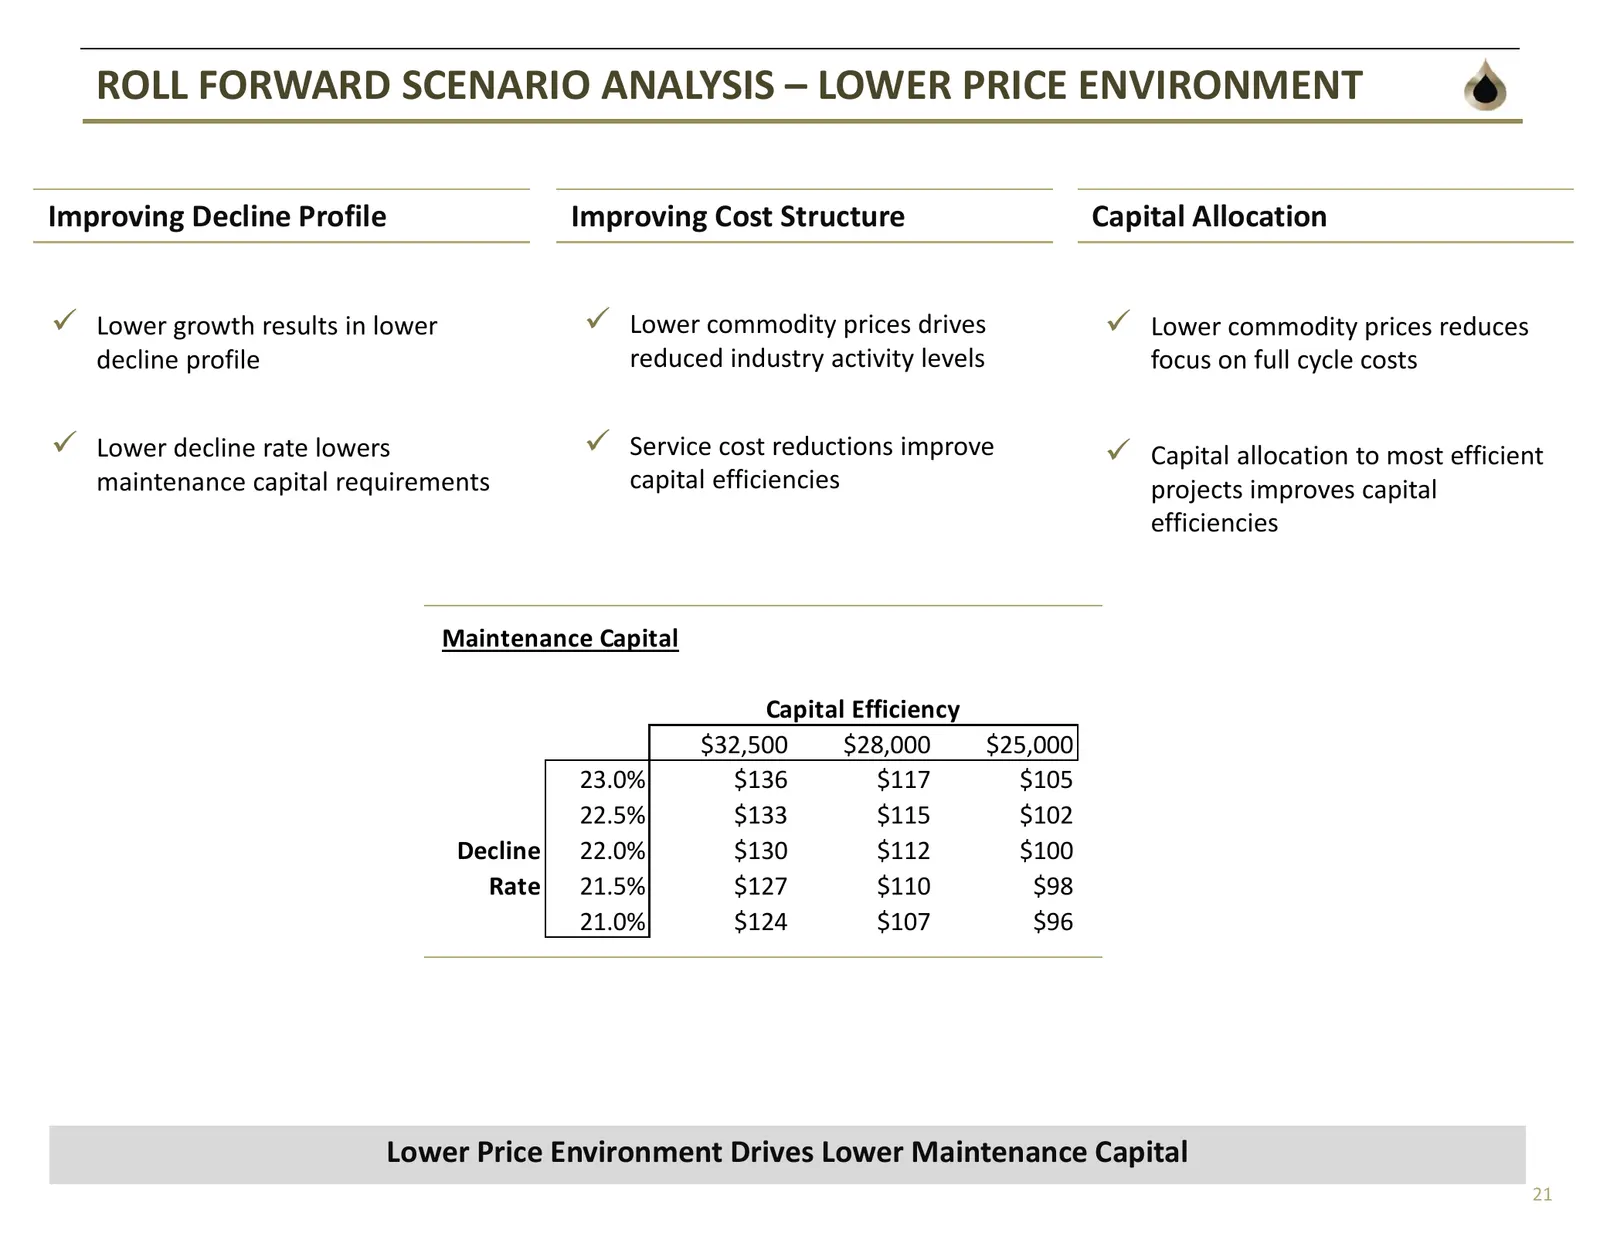
ROLL FORWARD SCENARIO ANALYSIS – LOWER PRICE ENVIRONMENT Improving Decline Profile Improving Cost Structure Capital Allocation Lower growth results in lower Lower commodity prices drives Lower commodity prices reduces decline profile reduced industry activity levels focus on full cycle costs
Slide 22: Balance Sheet Strength & Hedging
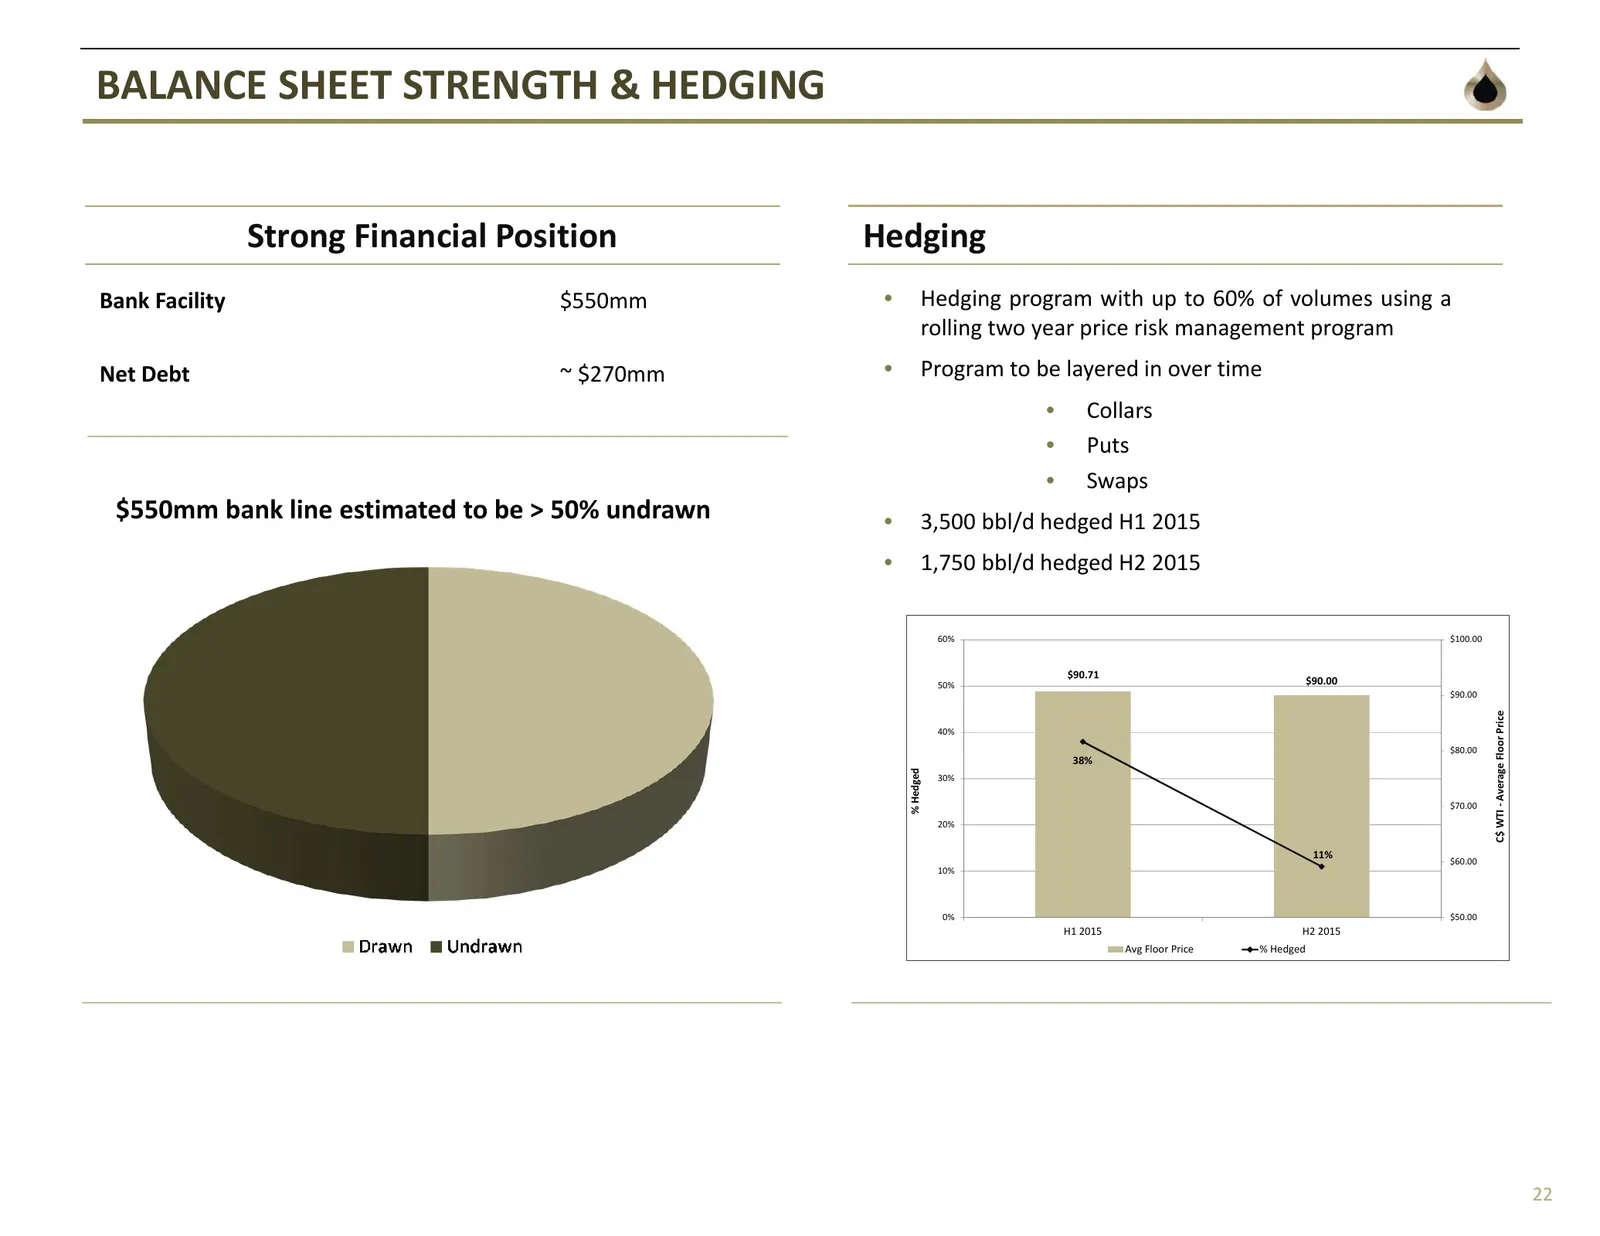
BALANCE SHEET STRENGTH & HEDGING Strong Financial Position Hedging Bank Facility $550mm • Hedging program with up to 60% of volumes using a rolling two year price risk management program Net Debt ~ $270mm • Program to be layered in over time • Collars • Puts • Swaps $550mm bank line estimated to be
Slide 23: Dividend + Disciplined Growth Checklist
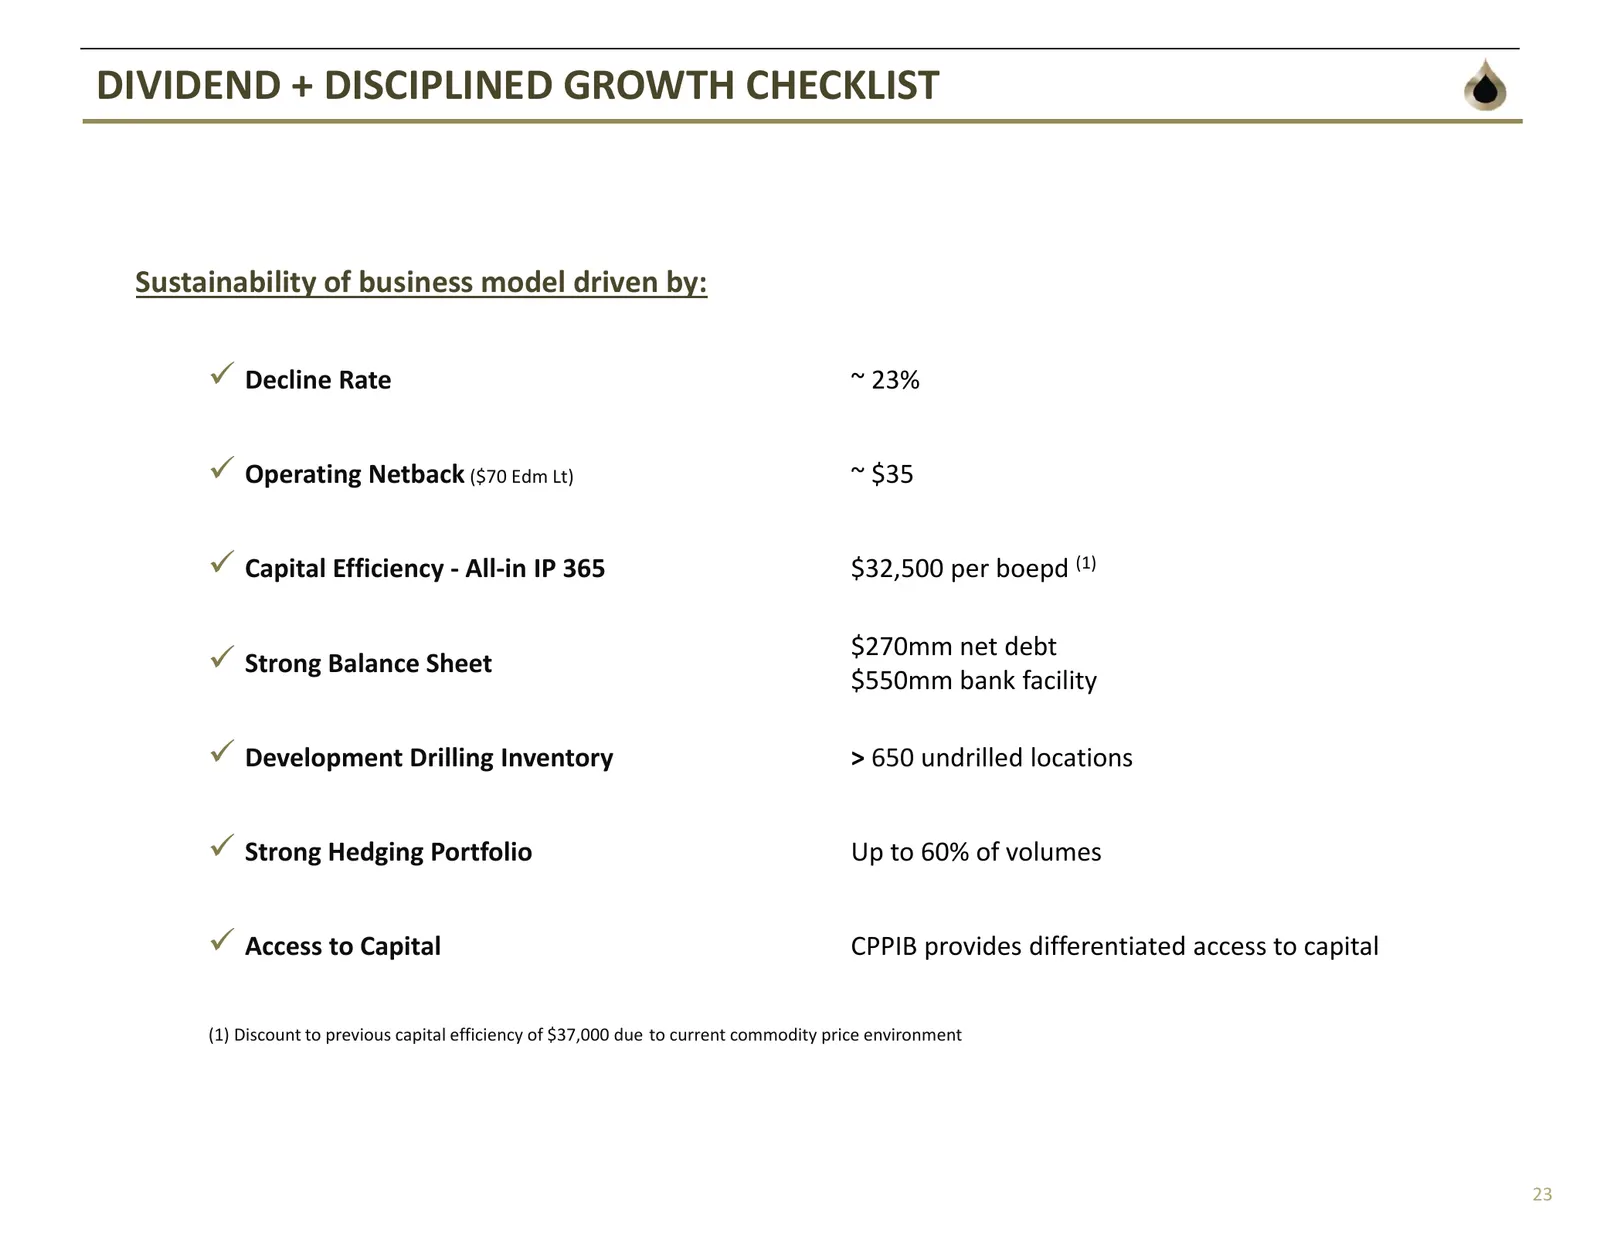
DIVIDEND + DISCIPLINED GROWTH CHECKLIST Sustainability of business model driven by: Decline Rate ~ 23% Operating Netback ($70 Edm Lt) ~ $35 Capital Efficiency ‐ All‐in IP 365 $32,500 per boepd (1) $270mm net debt Strong Balance Sheet $550mm bank facility Development Drilling Inventory > 65

Slide 24: Summary
Summary
Slide 25: Investment Highlights – Well Positioned for Controlled Growth
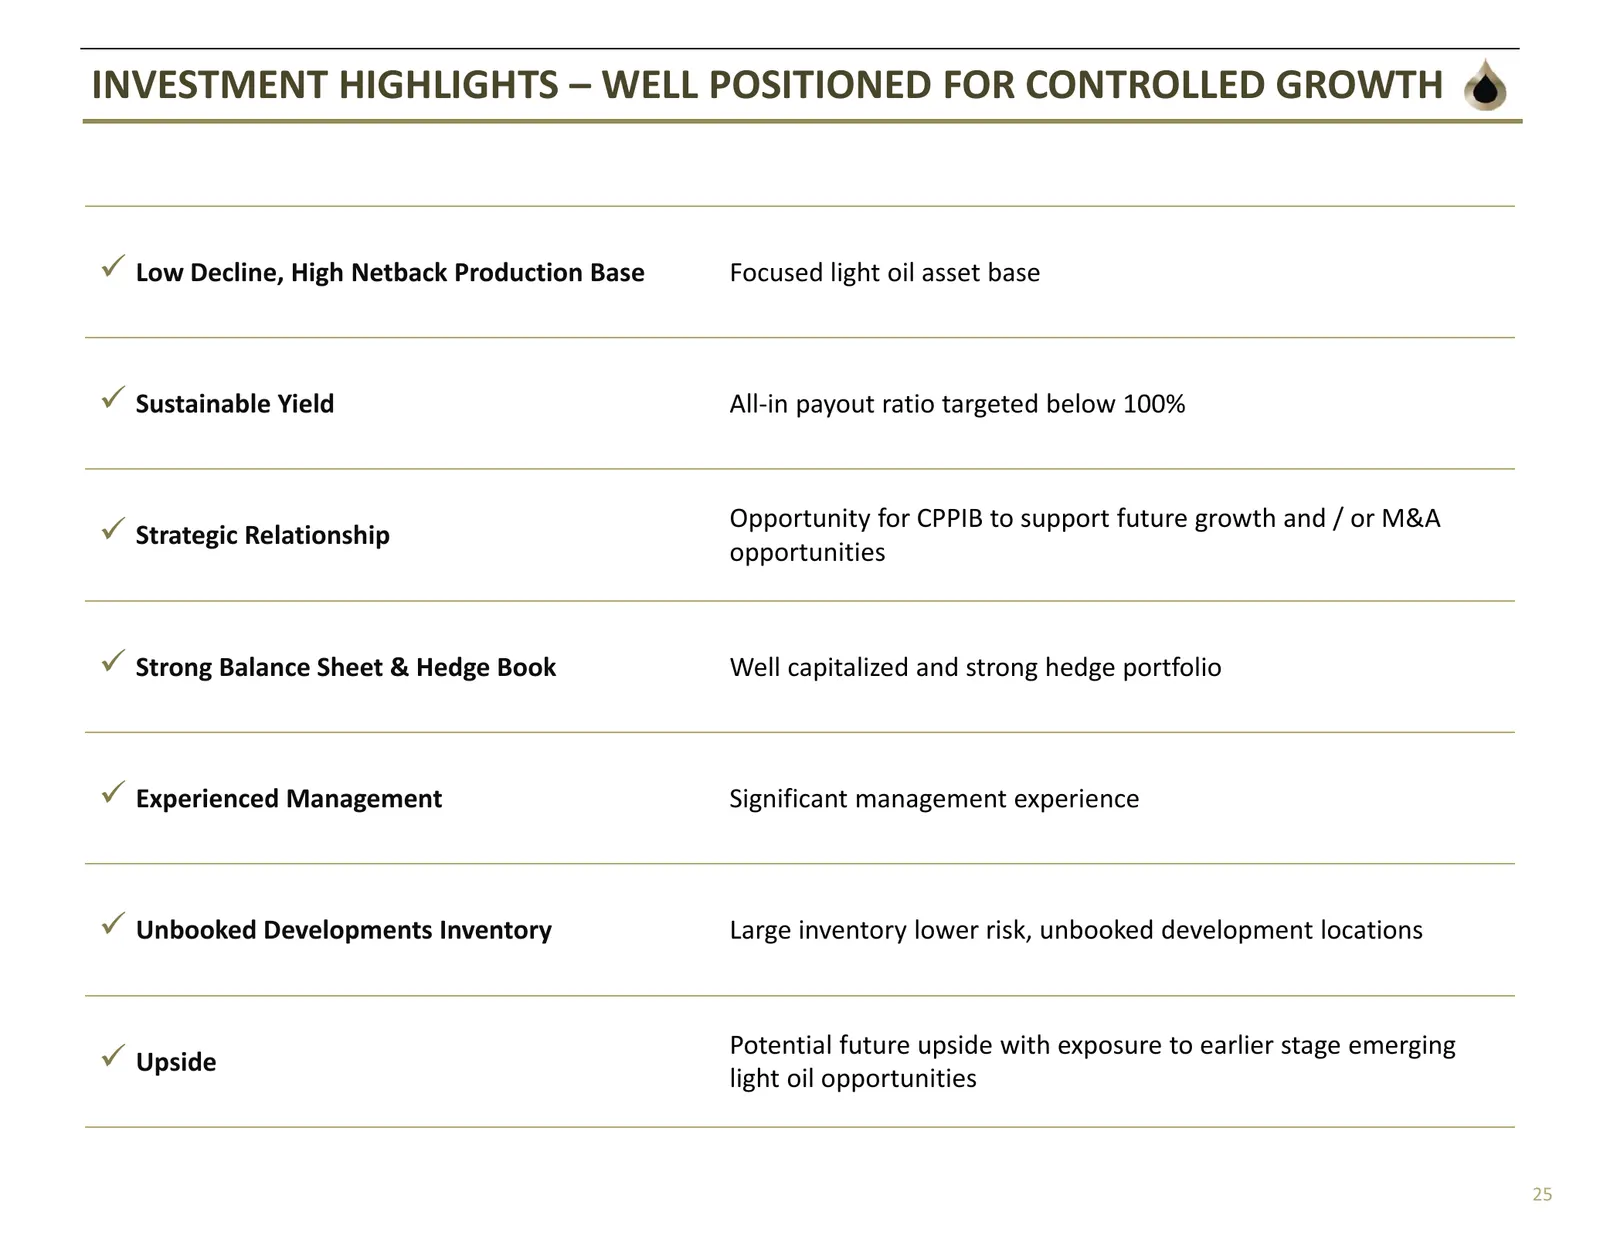
INVESTMENT HIGHLIGHTS – WELL POSITIONED FOR CONTROLLED GROWTH Low Decline, High Netback Production Base Focused light oil asset base Sustainable Yield All‐in payout ratio targeted below 100% Opportunity for CPPIB to support future growth and / or M&A Strategic Relationship opportunities Stro
Slide 26: Corporate Information
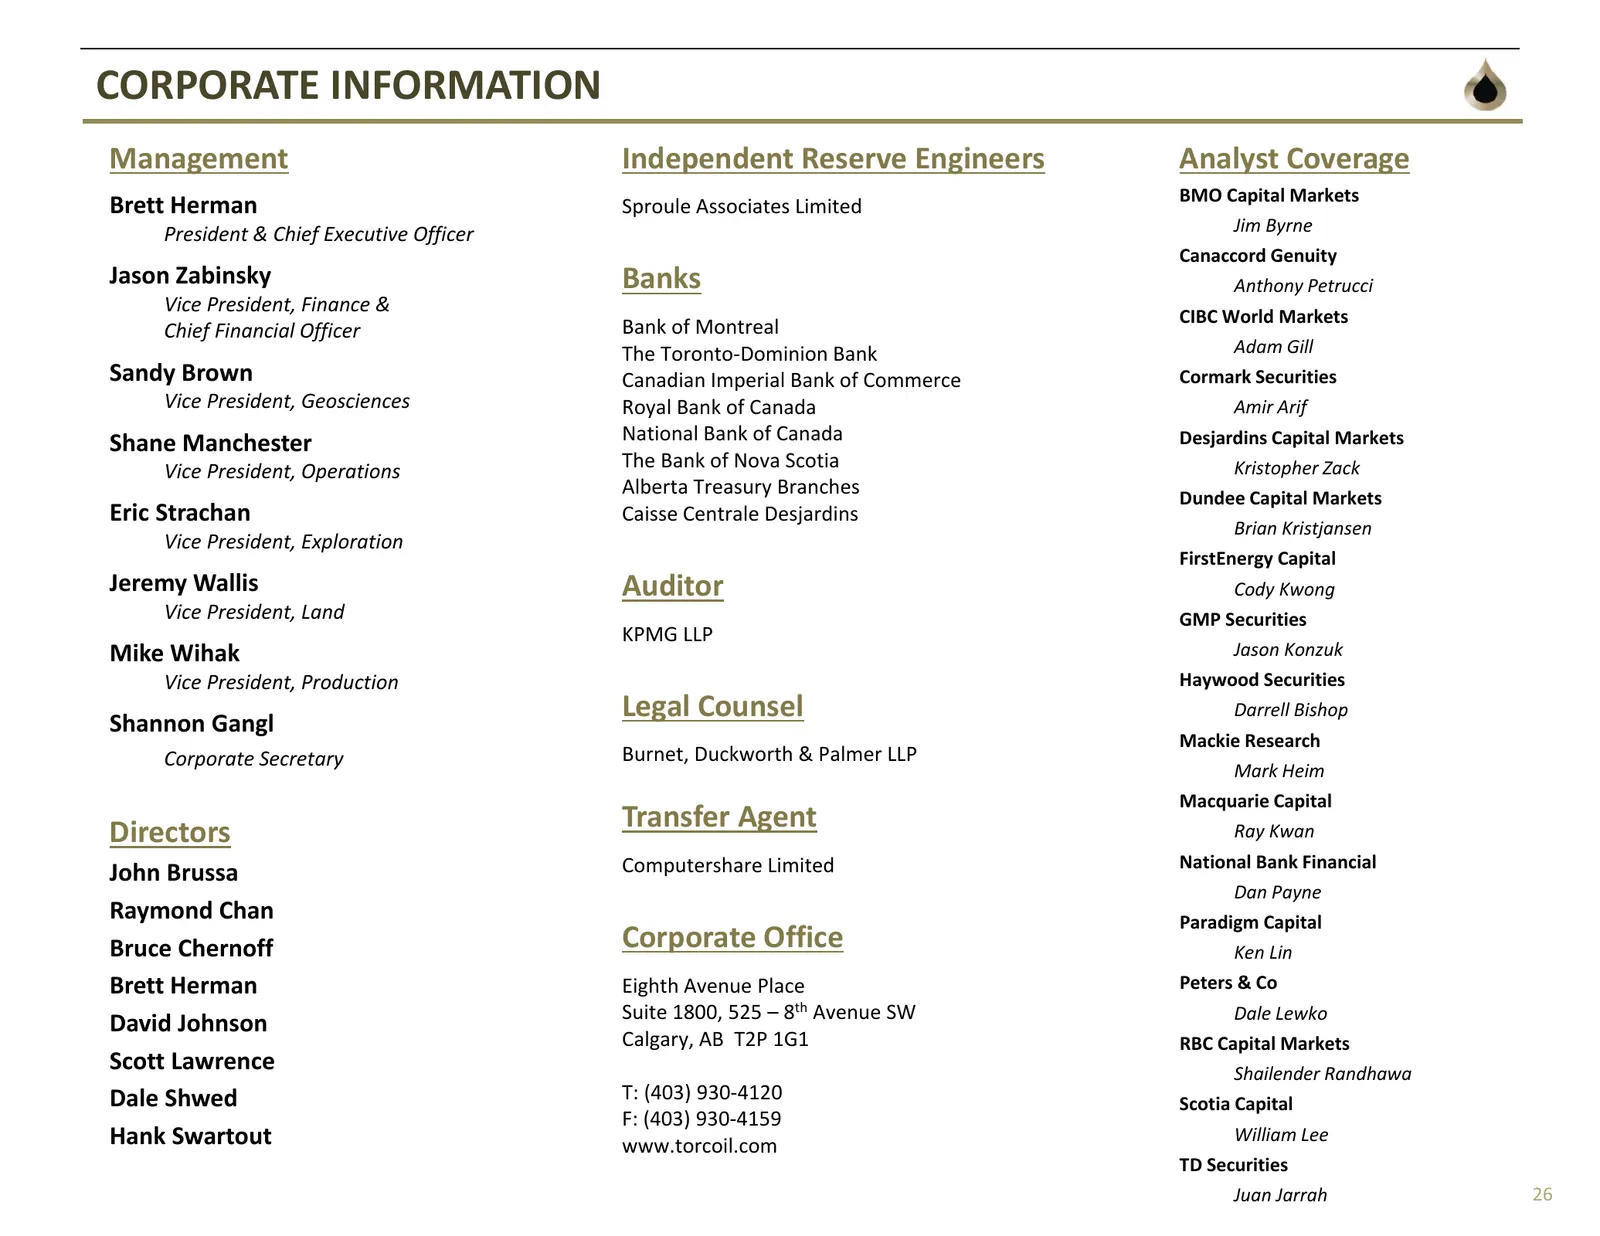
CORPORATE INFORMATION Management Independent Reserve Engineers Analyst Coverage BMO Capital Markets Brett Herman Sproule Associates Limited President & Chief Executive Officer Jim Byrne Canaccord Genuity Jason Zabinsky Banks Anthony Petrucci Vice President, Finance & CIBC World Markets Chief Financi

Slide 27: Appendix
Appendix
Slide 28: Modeling Assumptions
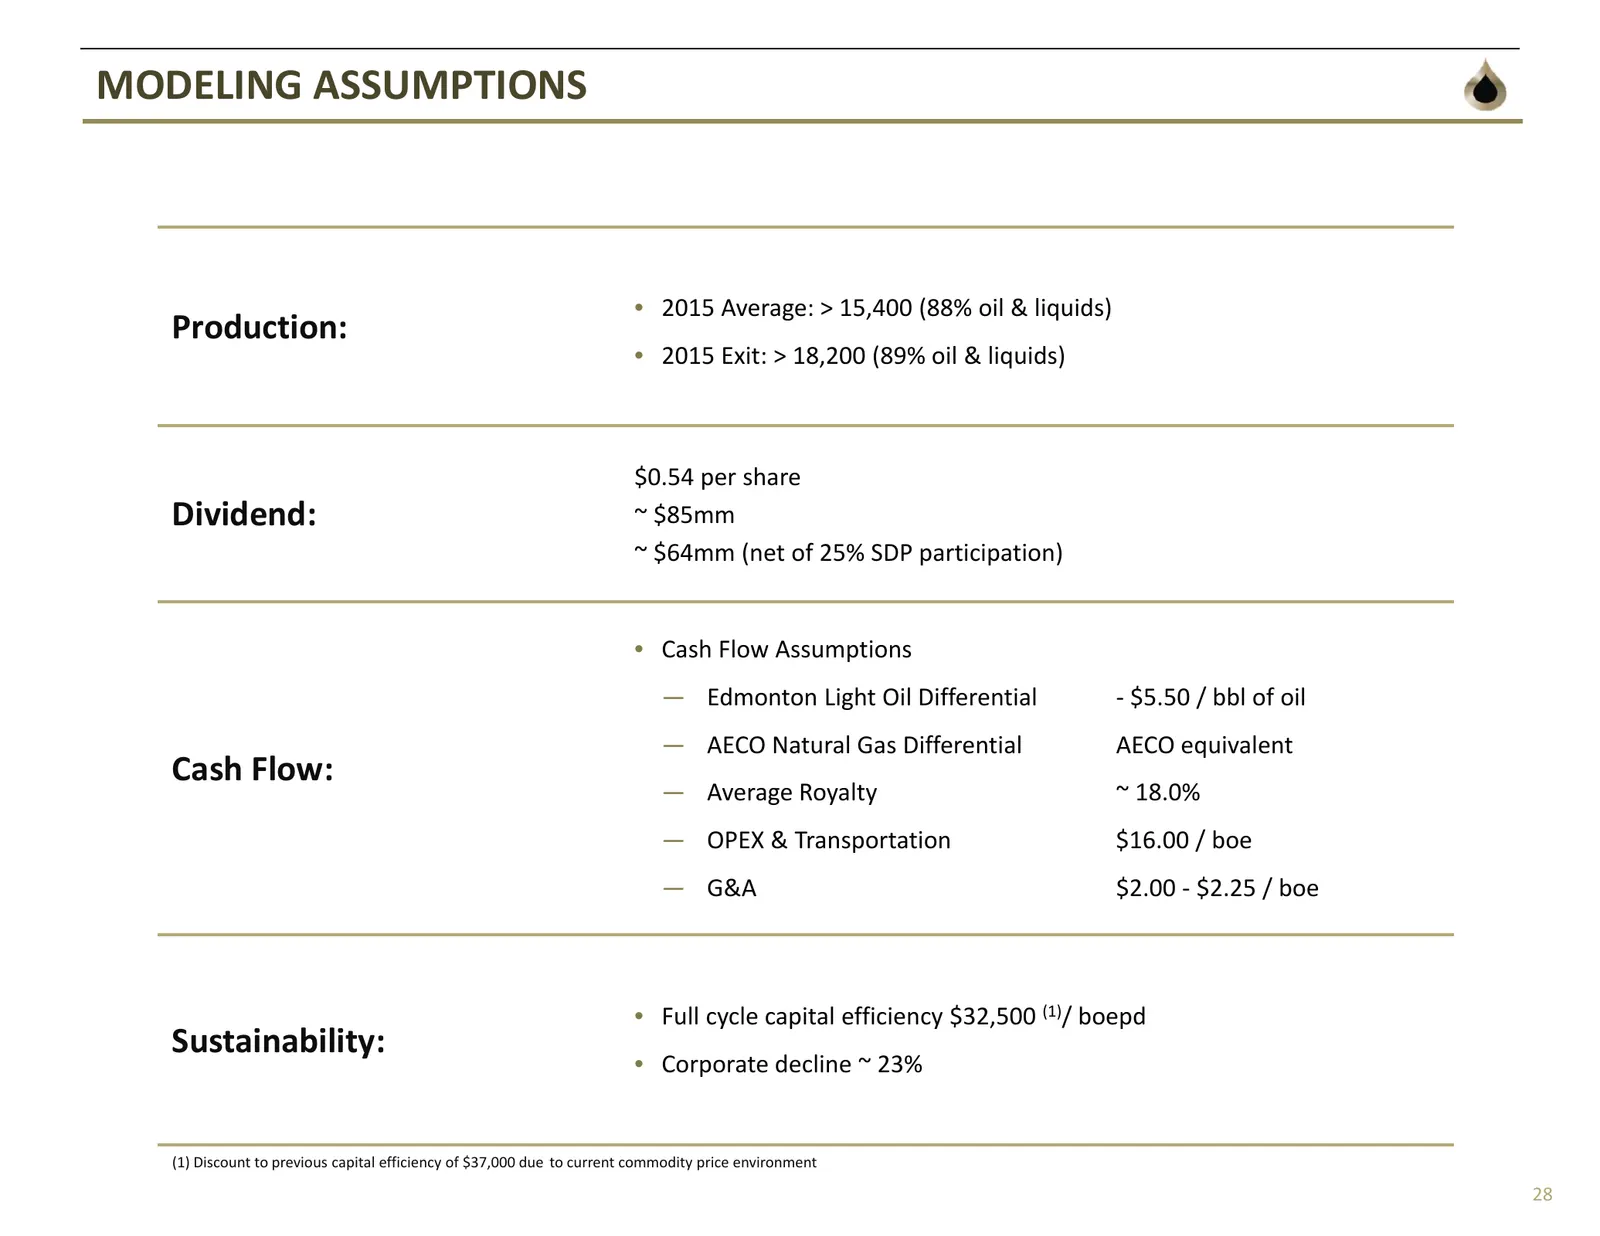
MODELING ASSUMPTIONS • 2015 Average: > 15,400 (88% oil & liquids) Production: • 2015 Exit: > 18,200 (89% oil & liquids) $0.54 per share Dividend: ~ $85mm ~ $64mm (net of 25% SDP participation) • Cash Flow Assumptions ― Edmonton Light Oil Differential ‐ $5.50 / bbl of oil ― AECO Natural Gas Different
Slide 29: TORC Reserves – Significant Resource & Economic Growth
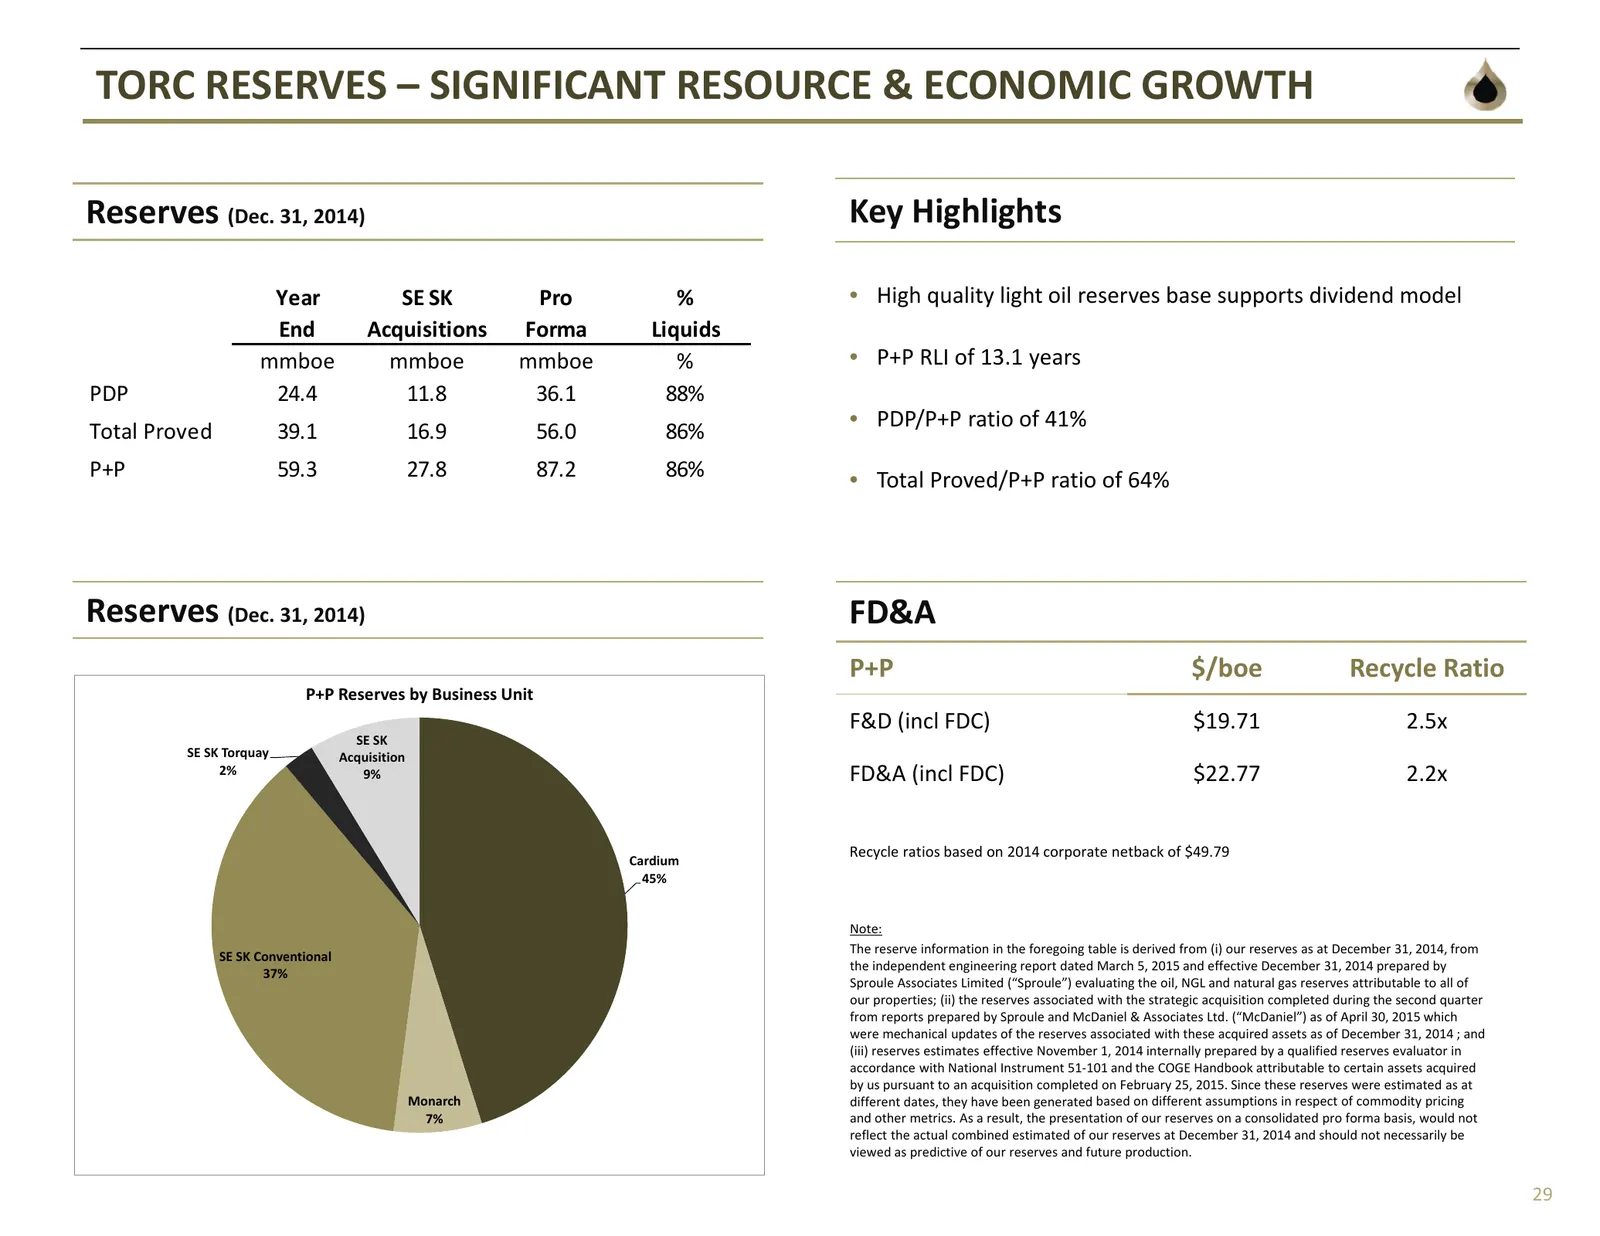
TORC RESERVES – SIGNIFICANT RESOURCE & ECONOMIC GROWTH Reserves (Dec. 31, 2014) Key Highlights Year SE SK Pro % • High quality light oil reserves base supports dividend model End Acquisitions Forma Liquids mmboe mmboe mmboe % • P+P RLI of 13.1 years PDP 24.4 11.8 36.1 88% • PDP/P+P ratio of 41% Tota
Slide 30: Hedging Program
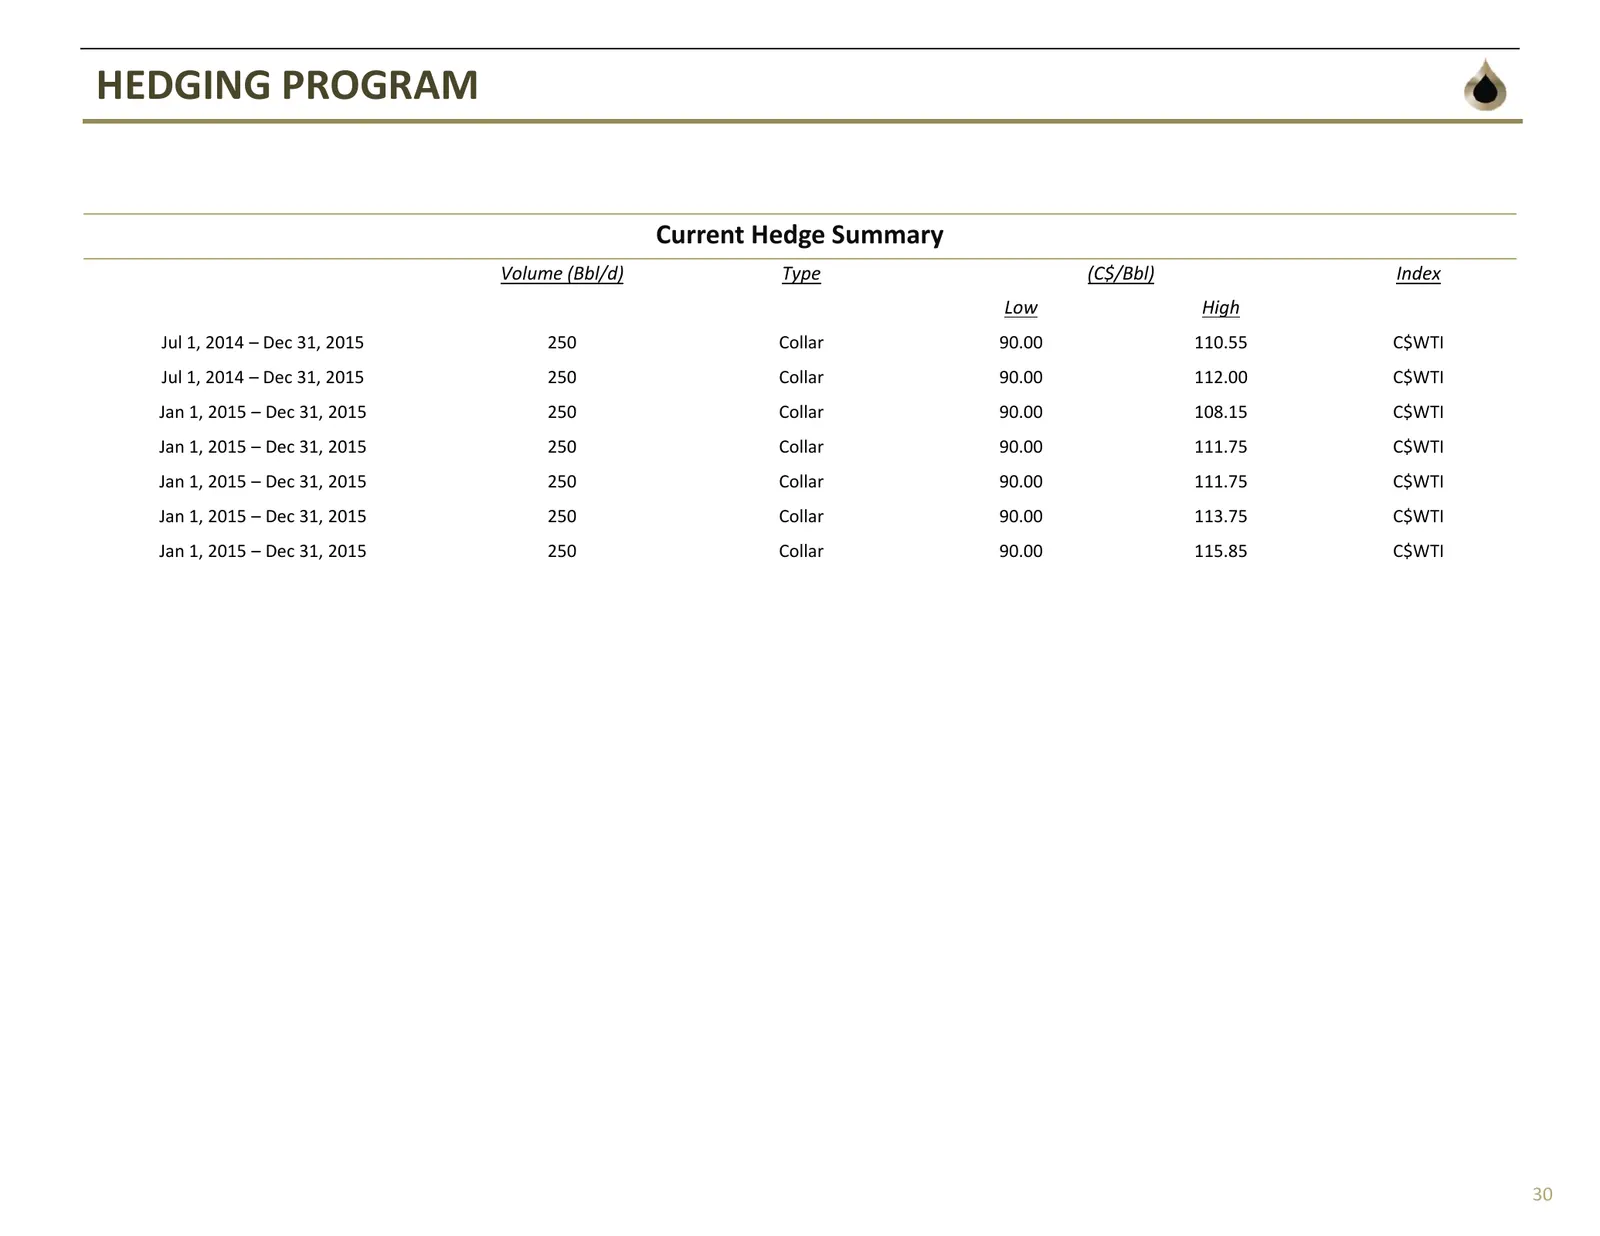
HEDGING PROGRAM Current Hedge Summary Volume (Bbl/d) Type (C$/Bbl) Index Low High Jul 1, 2014 – Dec 31, 2015 250 Collar 90.00 110.55 C$WTI Jul 1, 2014 – Dec 31, 2015 250 Collar 90.00 112.00 C$WTI Jan 1, 2015 – Dec 31, 2015 250 Collar 90.00 108.15 C$WTI Jan 1, 2015 – Dec 31, 2015 250 Collar 90.00 111
Slide 31: Significant Cornerstone Investment from CPPIB
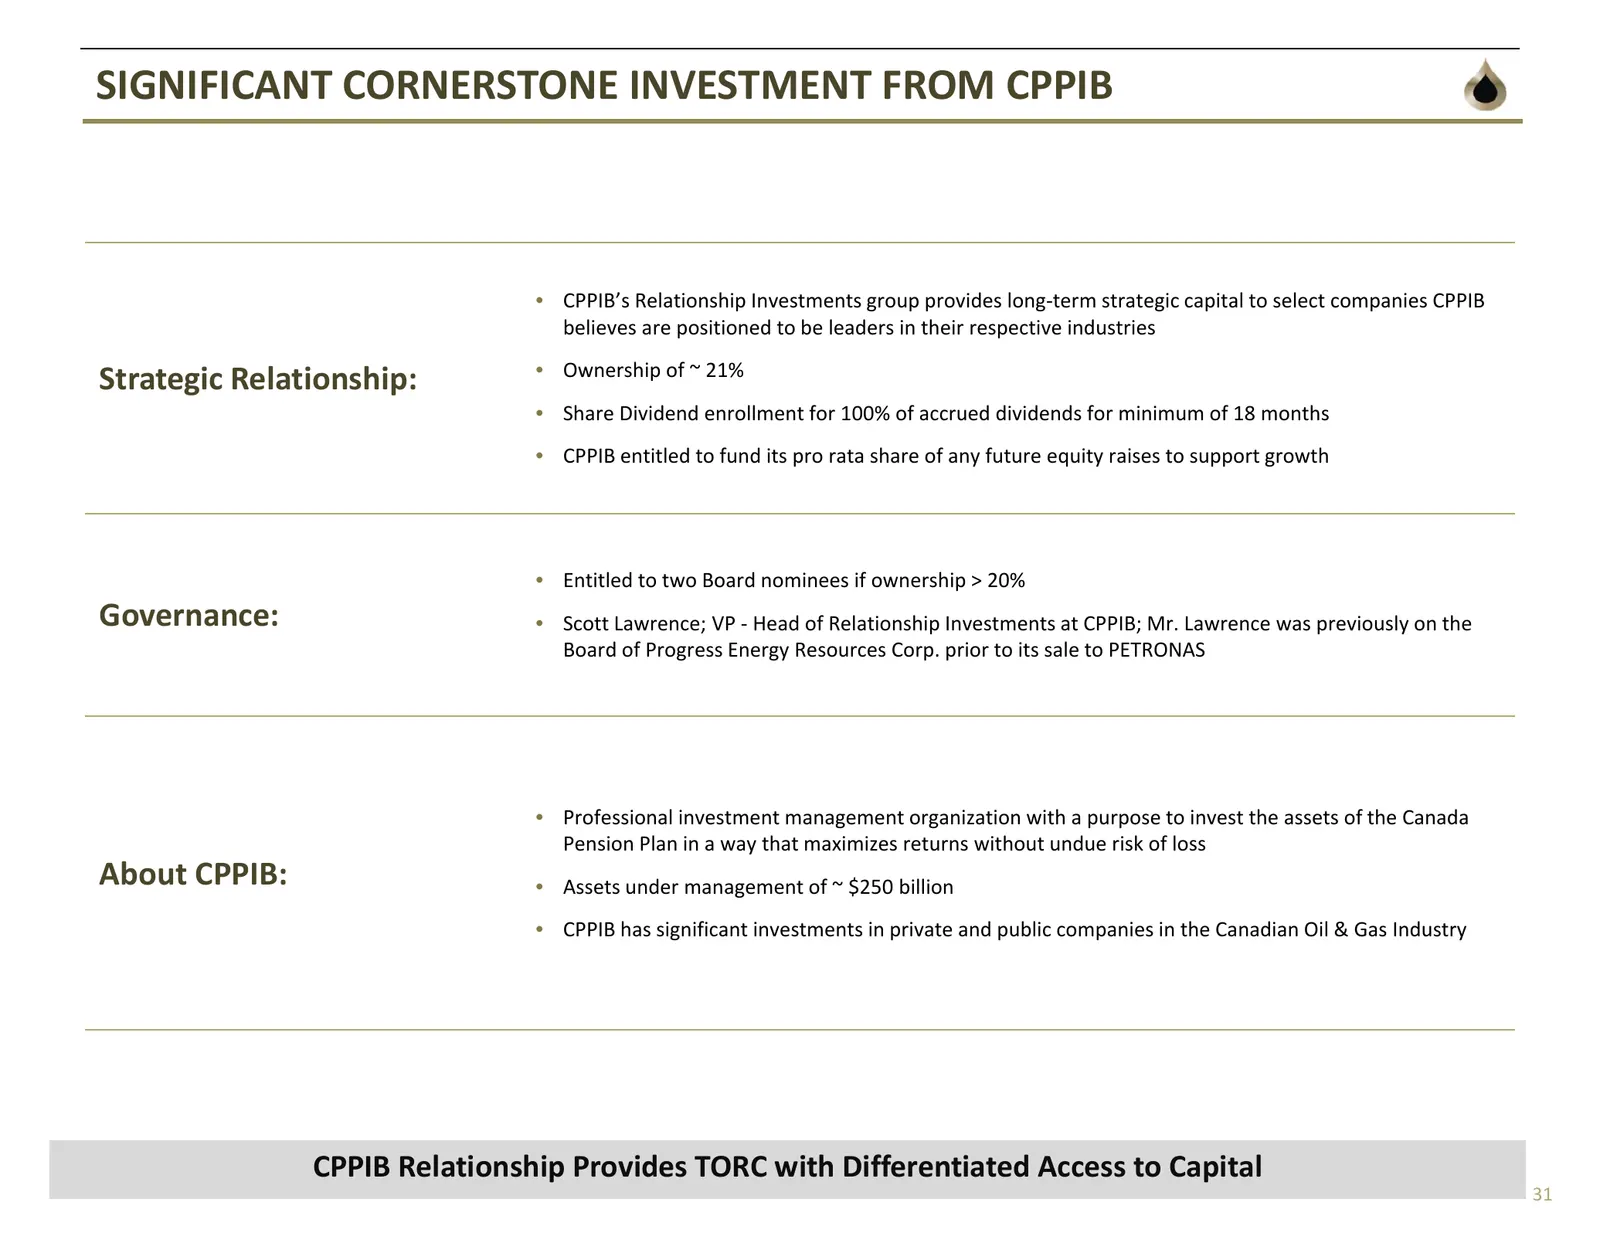
SIGNIFICANT CORNERSTONE INVESTMENT FROM CPPIB • CPPIB’s Relationship Investments group provides long‐term strategic capital to select companies CPPIB believes are positioned to be leaders in their respective industries • Ownership of ~ 21% Strategic Relationship: • Share Dividend enrollment for 100%
Slide 32: Monarch Prospect: Exposure to Emerging Light Oil Resource
Monarch Prospect | Exposure to Emerging Light Oil Resource
Slide 33: Monarch Prospect – Large Oil-in-Place Exposure
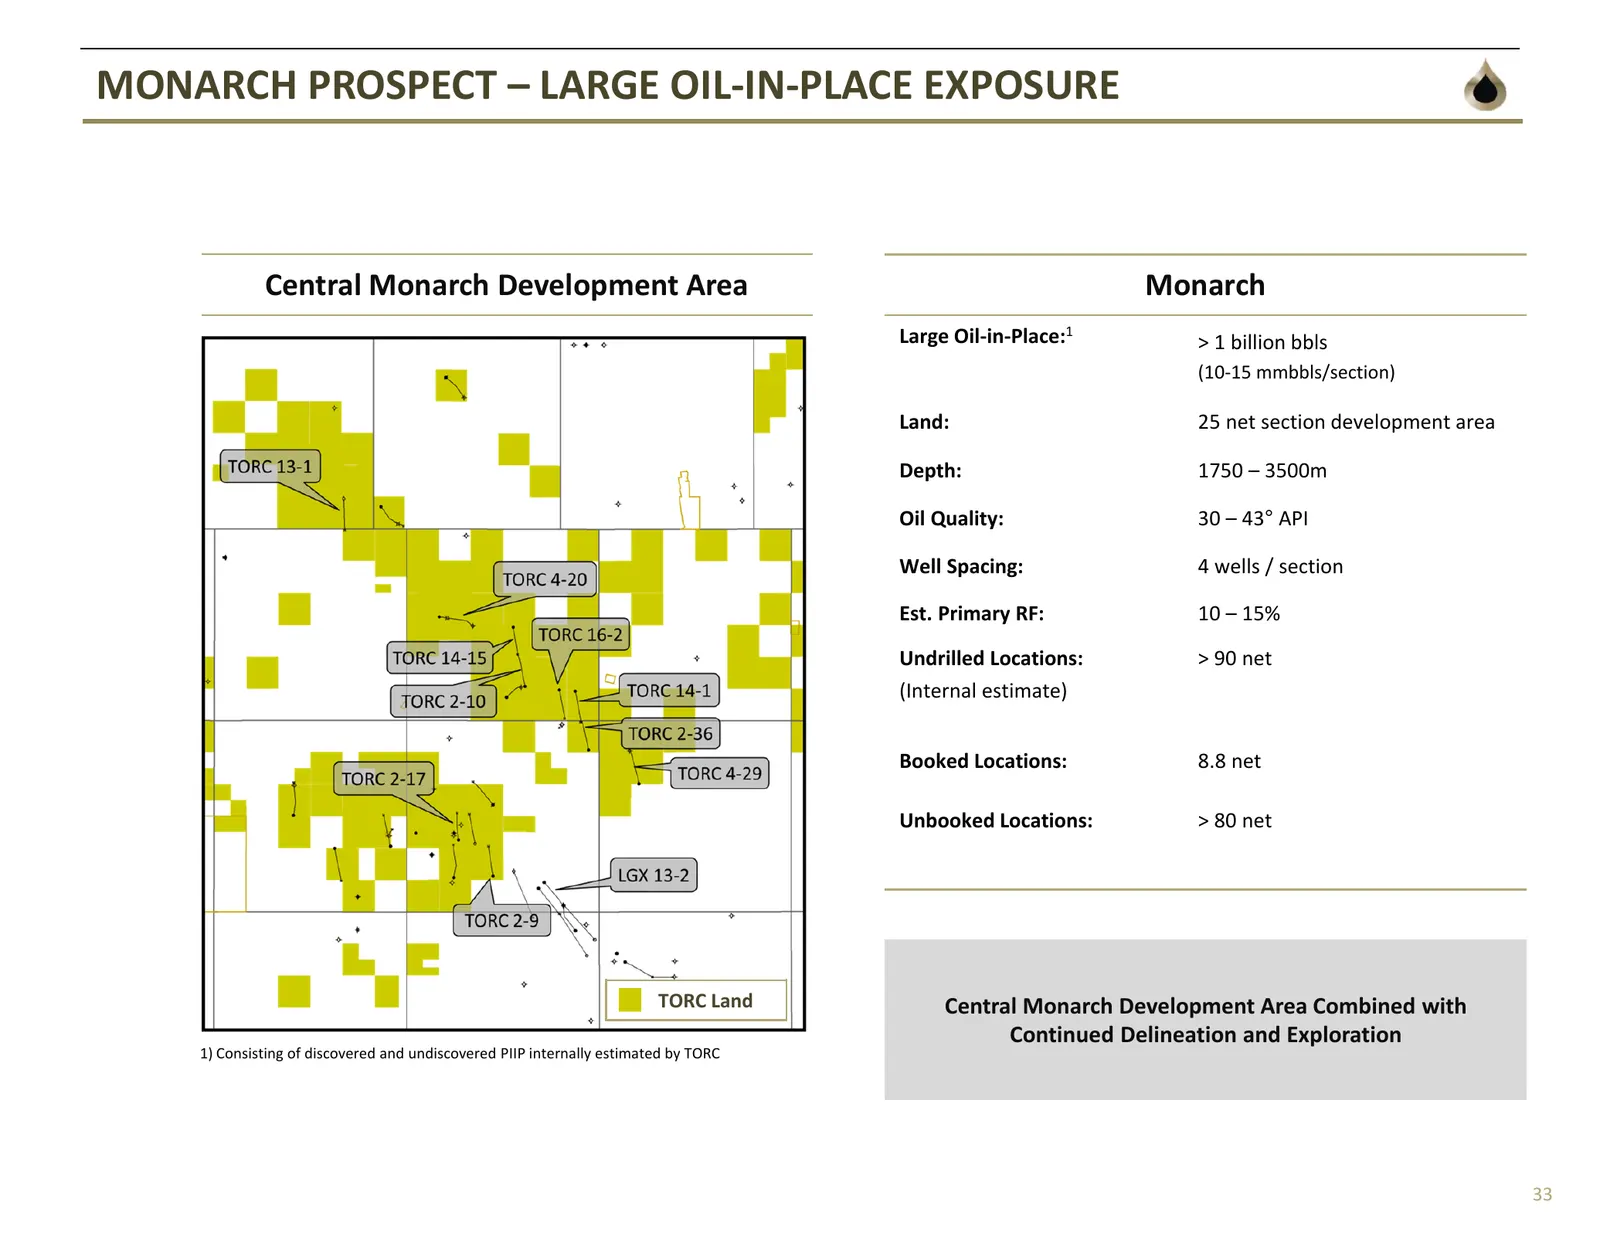
MONARCH PROSPECT – LARGE OIL‐IN‐PLACE EXPOSURE Central Monarch Development Area Monarch Large Oil‐in‐Place:1 > 1 billion bbls (10‐15 mmbbls/section) Land: 25 net section development area Depth: 1750 – 3500m Oil Quality: 30 – 43° API Well Spacing: 4 wells / section Est. Primary RF: 10 – 15% Undrilled
Source: Internet Archive copy of torcoil.com
More decks from TORC Oil & Gas Ltd
 Investor Presentation (July 2018)36 slides · July 2018
 Investor Presentation (August 2017)34 slides · August 2017
 Investor Presentation (May 2017)34 slides · May 2017
 Investor Presentation (October 2016)30 slides · October 2016
 Investor Presentation (June 2016)29 slides · June 2016
 Investor Presentation (May 2016)29 slides · May 2016