McMoRan Exploration — Howard Weil 39th Annual Energy Conference (March 2011)
31 slides from McMoRan Exploration's conference presentation, Mar 28, 2011
Slide 1: Howard Weil Annual Energy Conference
Howard Weil 39% Annial Energy Conference ATES TRAN OF e LISTED NYSE. <)-www.memorariycom
Slide 2: Forward-looking statements
McMORAN EXPLORATION Co. This is an oral presentation which is accompanied by slides. Readers are urged to review our SEC filings. This presentation contains forward-looking statements that involve a number of assumptions, risks and uncertainties that could cause actual results to differ materially f
Slide 3: McMoRan Overview
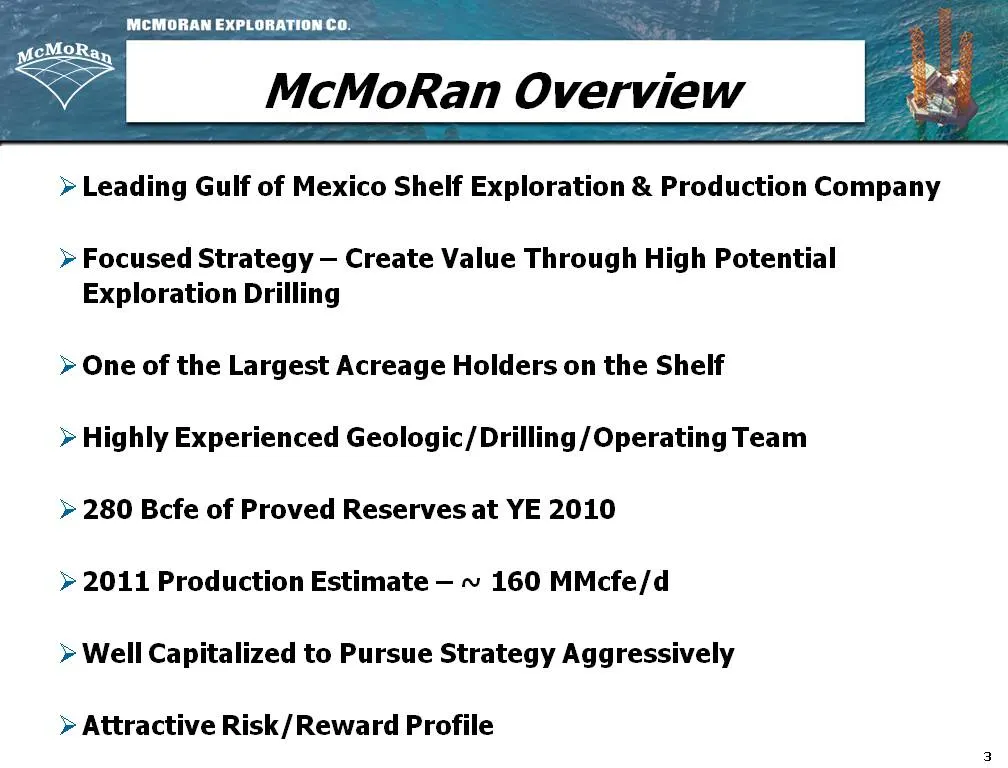
MCMORAN EXPLORATION Co. ycMoRan McMoRan Overview > Leading Gulf of Mexico Shelf Exploration & Production Company > Focused Strategy — Create Value Through High Potential Exploration Drilling > One of the Largest Acreage Holders on the Shelf > Highly Experienced Geologic/ Drilling /Operating Team >»
Slide 4: Recent Highlights
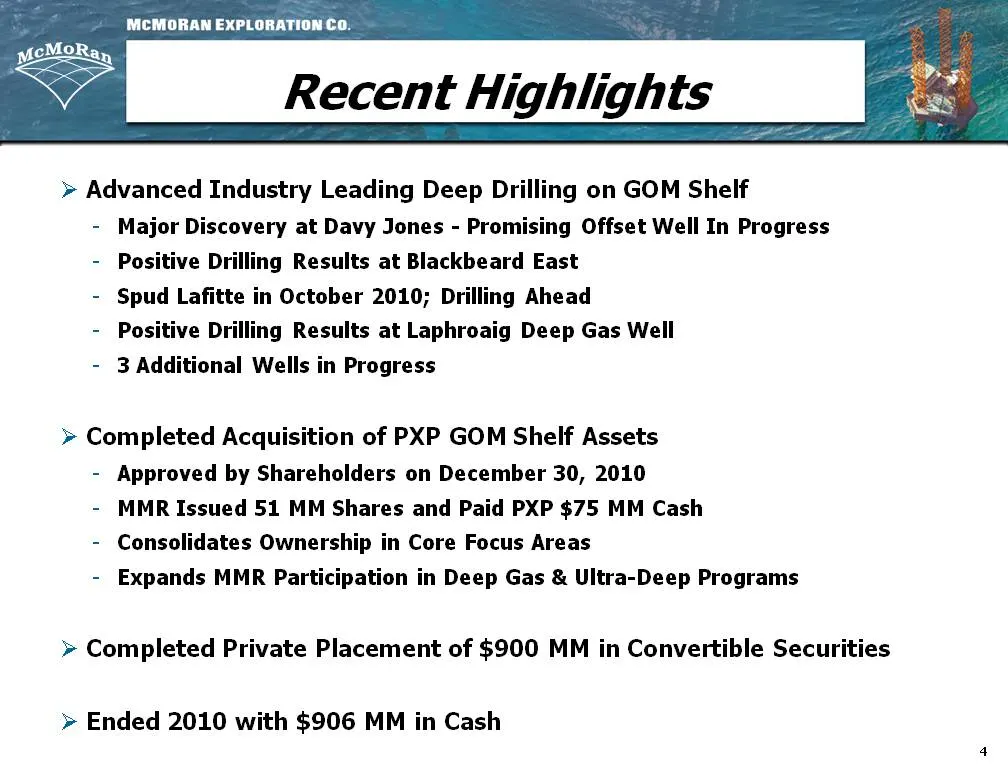
MCMORAN EXPLORATION Co. Recent Highlights » Advanced Industry Leading Deep Drilling on GOM Shelf - Major Discovery at Davy Jones - Promising Offset Well In Progress Positive Drilling Results at Blackbeard East Spud Lafitte in October 2010; Drilling Ahead Positive Drilling Results at Laphroaig Deep G
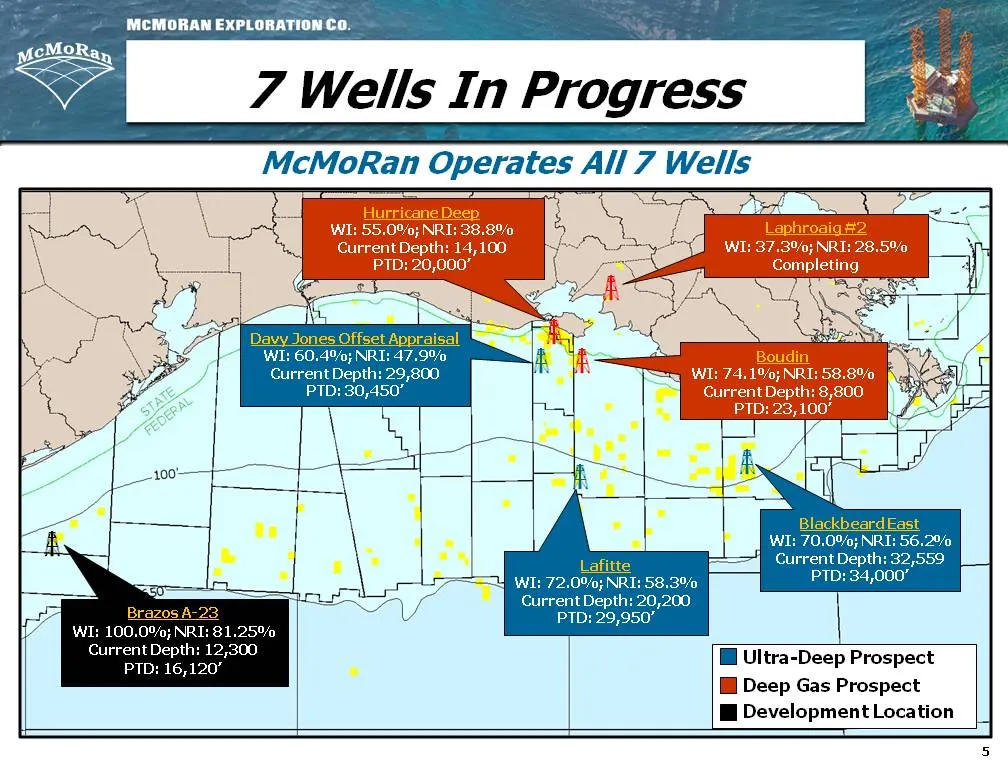
Slide 5: McMoRan Operates All Wells
McMORAN EXPLORATION Co. McMoRan Operates All 7 Wells —— Blackbeard East WI: 70.00; NRI: 56.2% Lafitte eed Current Depth: 32,559 Sve: WI: 72.0%; NRT: 58.3% PTD: 34,000’ Current Depth: 20,200 Brazos A-23 / PTD: 29,950" WI: 100.0%; NRI: 81.25% Current Depth: 12,300 PTD: 16,120" Bf Ultra-Deep Prospect [
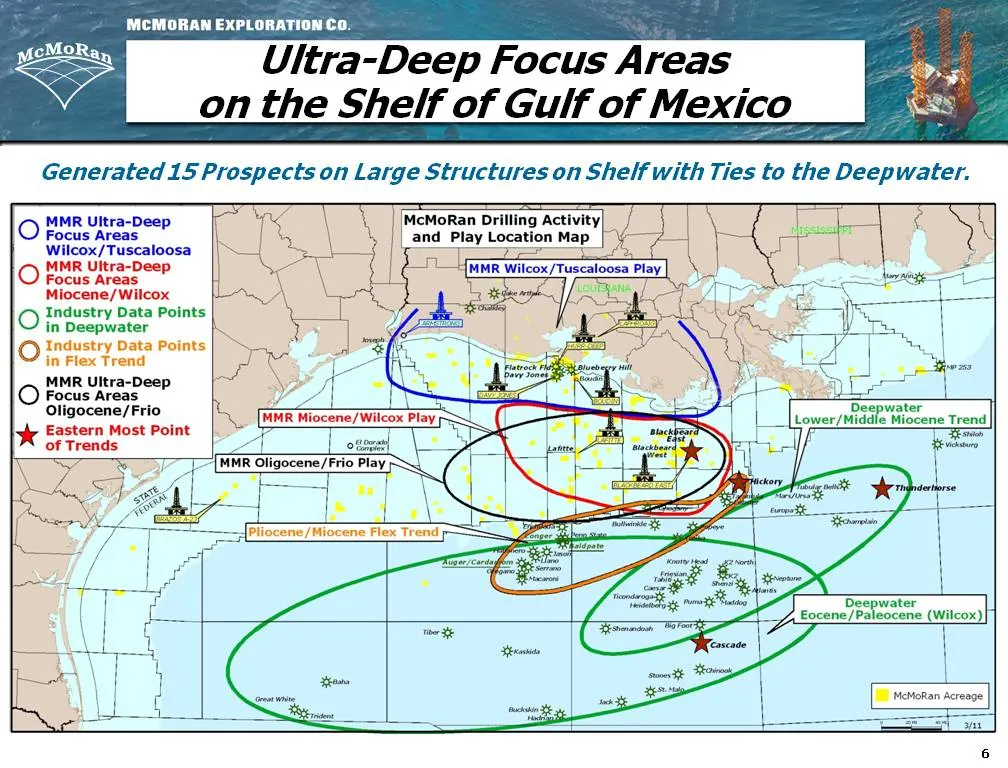
Slide 6: Ultra-Deep Focus Areas
MCMORAN EXPLORATION Co. Ultra-Deep Focus Areas on the Shelf of Gulf of Mexico__ Generated 15 Prospects on Large Structures on Shelf with Ties to the Deepwater. MMR Ultra-Deep McMoRan Drilling Activity] Focus Areas and Play Location Map Wilcox/Tuscaloosa O MMR Ultra-Deep MMR Wilcox/Tuscaloosa Play Fo
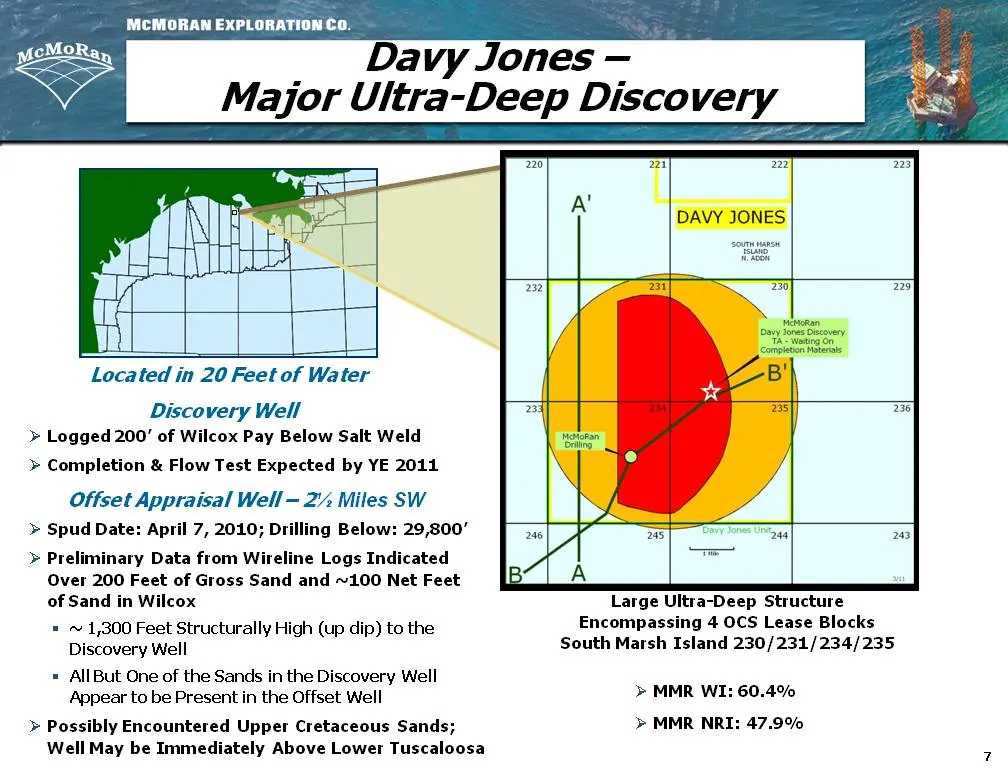
Slide 7: Davy Jones - Major Ultra-Deep Discovery
MCMORAN EXPLORATION Co. Davy Jones — Major Ultra-Deep Discovery evy Jones Bacovery compiecon Holes Located in 20 Feet of Water B' Discovery Well = > Logged 200’ of Wilcox Pay Below Salt Weld > Completion & Flow Test Expected by YE 2011 Offset Appraisal Well — 22 Miles SW > Spud Date: April 7, 2010;
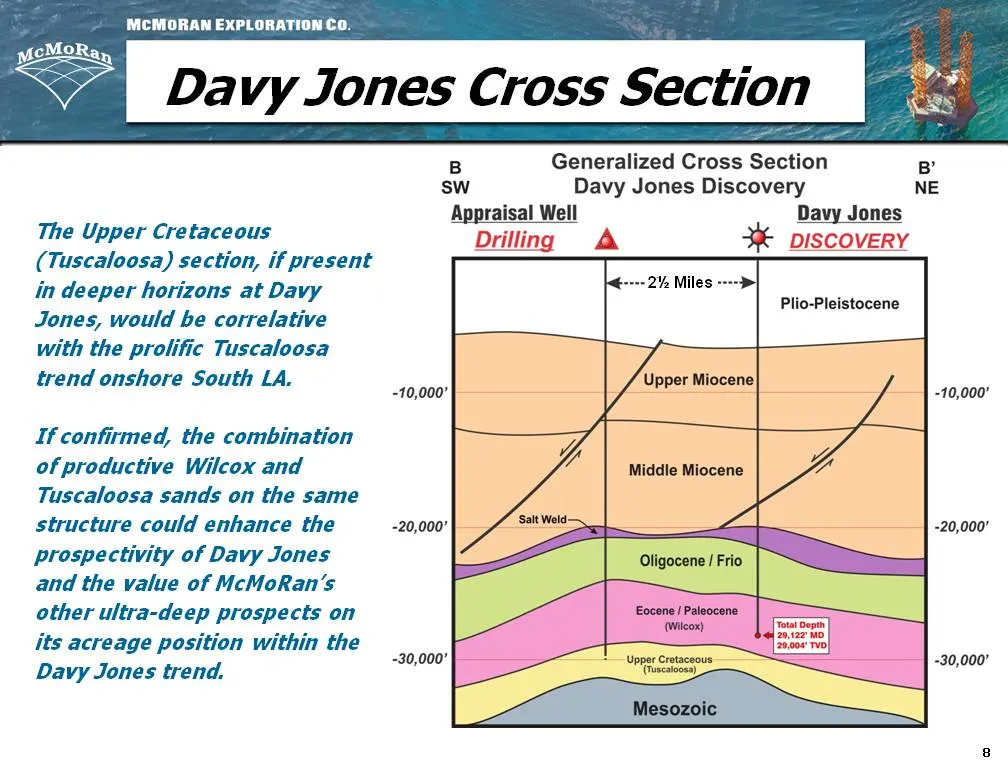
Slide 8: Davy Jones Cross Section
MCMORAN EXPLORATION Co. saa Davy Jones Cross Section B Generalized Cross Section B sw Davy Jones Discovery NE Appraisal Well Davy Jones The Upper Cretaceous Drilling A % seeGVERE (Tuscaloosa) section, if present in deeper horizons at Davy [<----2% Miles ~~) Plio-Pleistocene Jones, would be correlati
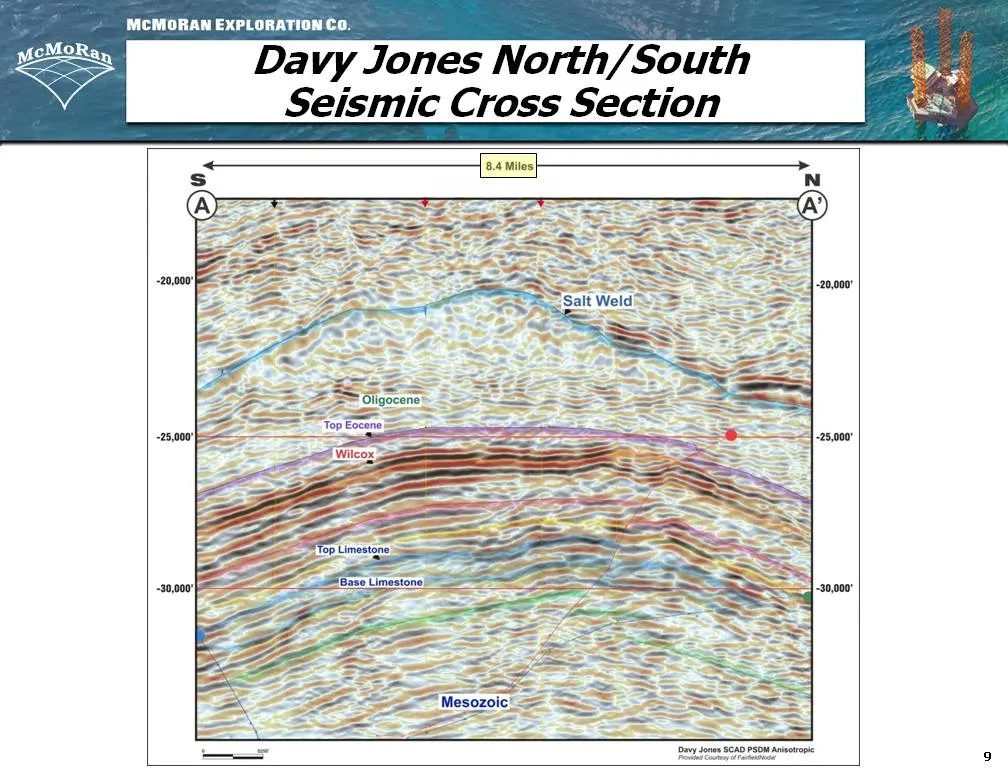
Slide 9: Davy Jones North/South Seismic Cross Section
MCMORAN EXPLORATIONCoO. Davy Jones North/South Seismic Cross Section
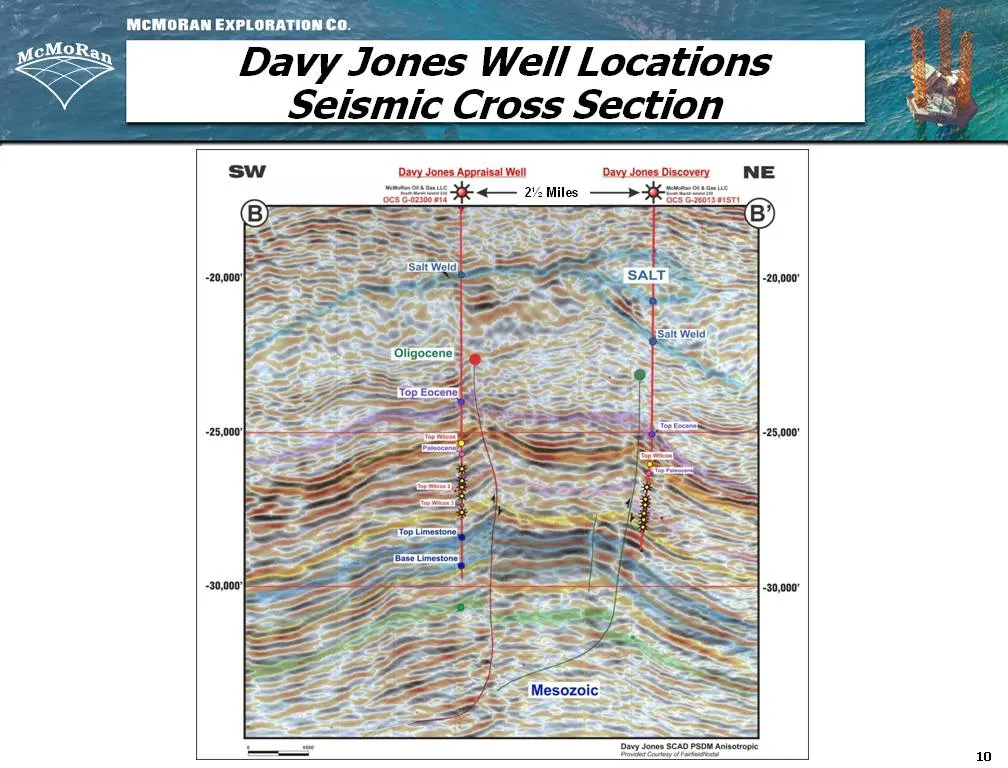
Slide 10: Davy Jones Well Locations Seismic Cross Section
MCMORAN EXPLORATIONCoO. Davy Jones Well Locations ° Seismic Cross Section oe
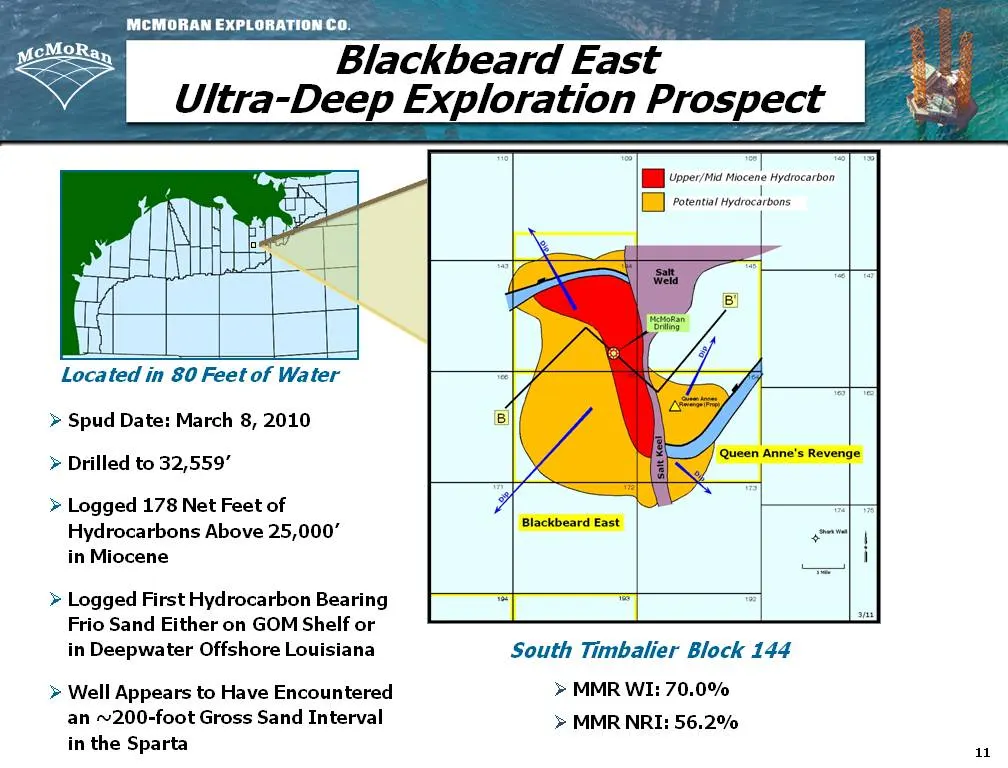
Slide 11: Blackbeard East
MCMORAN EXPLORATION Co. Blackbeard East Ultra-Deep Exploration Prospect * Em rer hace ccrton [Bil Potent ytrocrbons ch ey | Bi ‘9 Located in 80 Feet of Water > Spud Date: March 8, 2010 B) > Drilled to 32,559" > Logged 178 Net Feet of : Hydrocarbons Above 25,000" ae goon | in Miocene i > Logged First
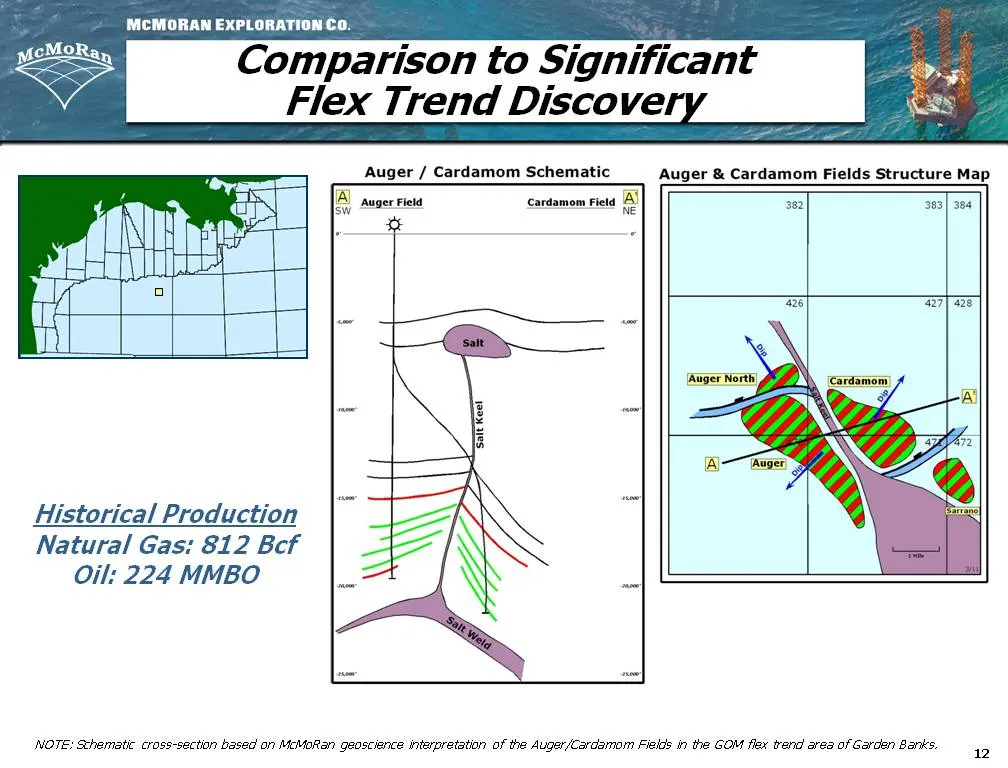
Slide 12: Comparison to Significant Flex Trend Discovery
MCMORAN EXPLORATION Co. Comparison to Significant Flex Trend Discover Auger / Cardamom Schematic Auger & Cardamom Fields Structure Map pod ie | 28 ia Salt Keer Historical Production a Natural Gas: 812 Bcf | Oil: 224 MMBO aA = NOTE: Schematic cross-section based on McMoRan geoscience interpretation o
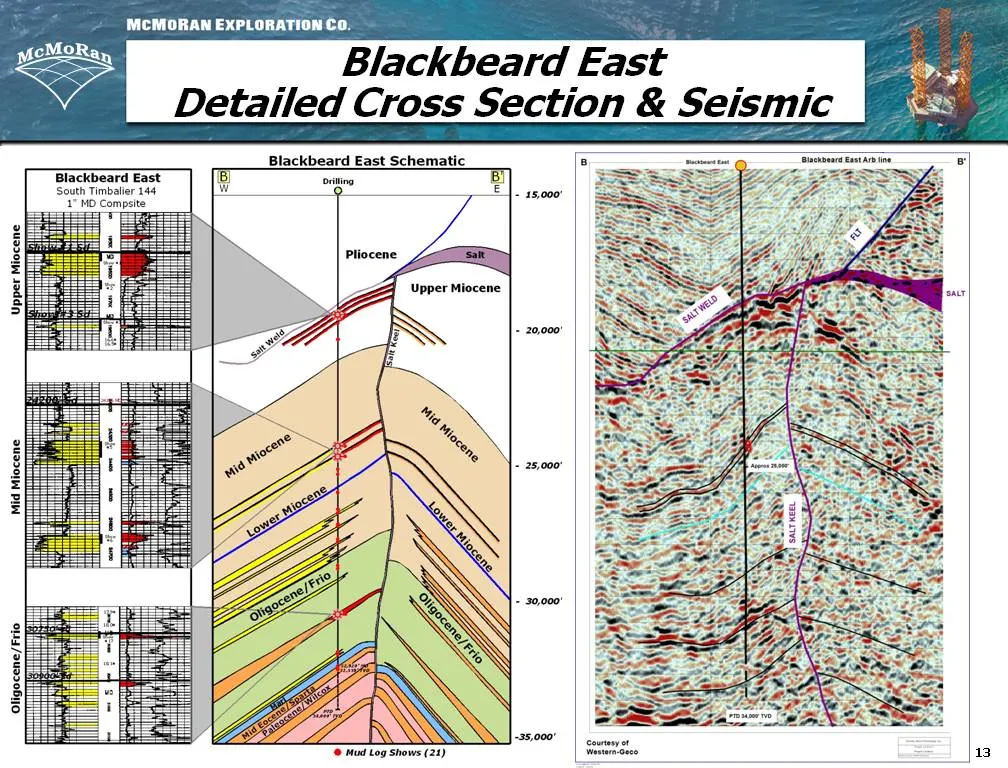
Slide 13: Blackbeard East Detailed Cross Section & Seismic
MCMORAN EXPLORATION Co. Blackbeard East Detailed Cross Section & Seismic Blackbeard East Schematic Blackbeard East 8 ata B ‘South Timbalier 144 = 9 E 1. 15,000 TMD Compste Soe Ee ; " bal = Fi Upper Miocene 5 s = 20,000 g + 25,000 z z = 30,000 ‘Mad Log Shows (24)
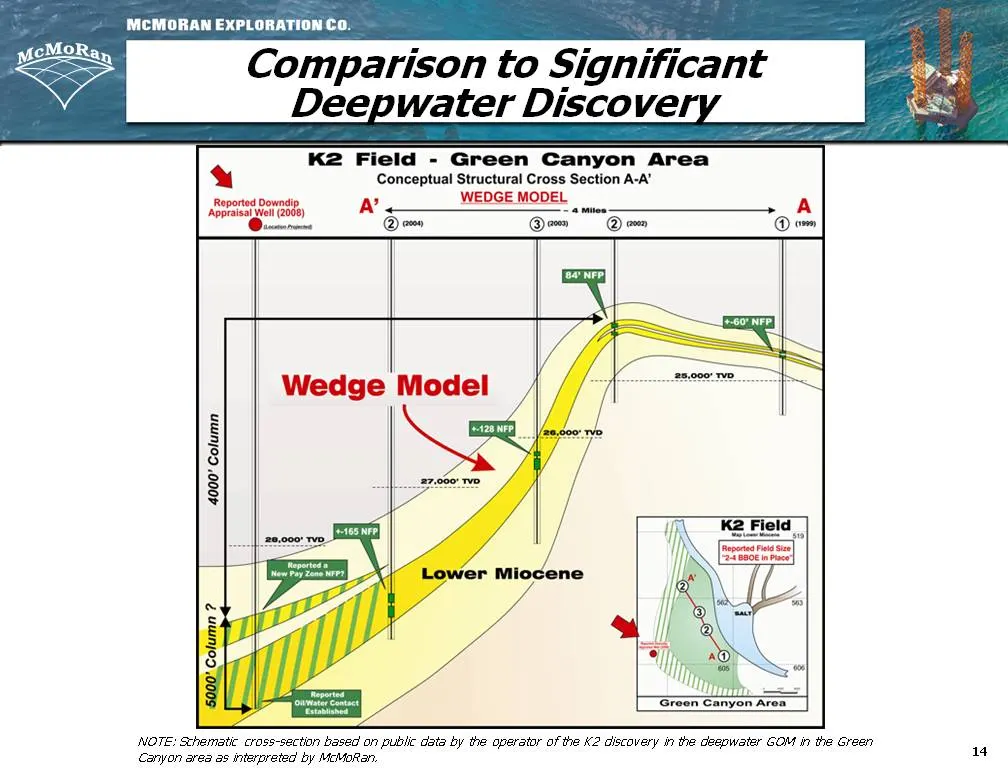
Slide 14: Comparison to Significant Deepwater Discovery
MCMORAN EXPLORATIONCoO. Comparison to Significant Deepwater Discover, K2 Field - Green Canyon Area a Conceptual Structural Cross Section A-A’ WEDGE MODEL A = a mee > @em 4000’ Column At es Ta, mas Green Canyon Area NOTE: Schematic cross-section based on public data by the operator of the K2 discover
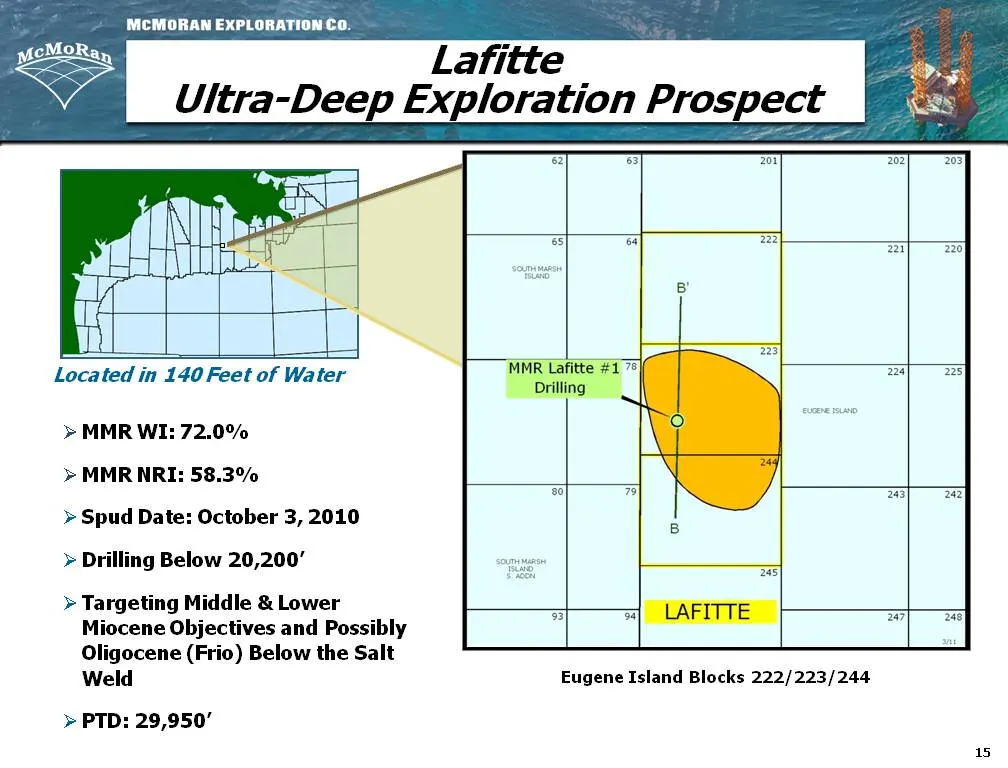
Slide 15: Lafitte
MCMORAN EXPLORATION Co. Lafitte Ultra-Deep Exploration Prospect 22] 73] Tor Ton ED ss ei Ta ai Es) a as Located in 140 Feet of Water > MMR WI: 72.0% > MMR NRI: 58.3% way aa >» Spud Date: October 3, 2010 > Drilling Below 20,200’ » Targeting Middle & Lower Miocene Objectives and Possibly Oligocene (Fr
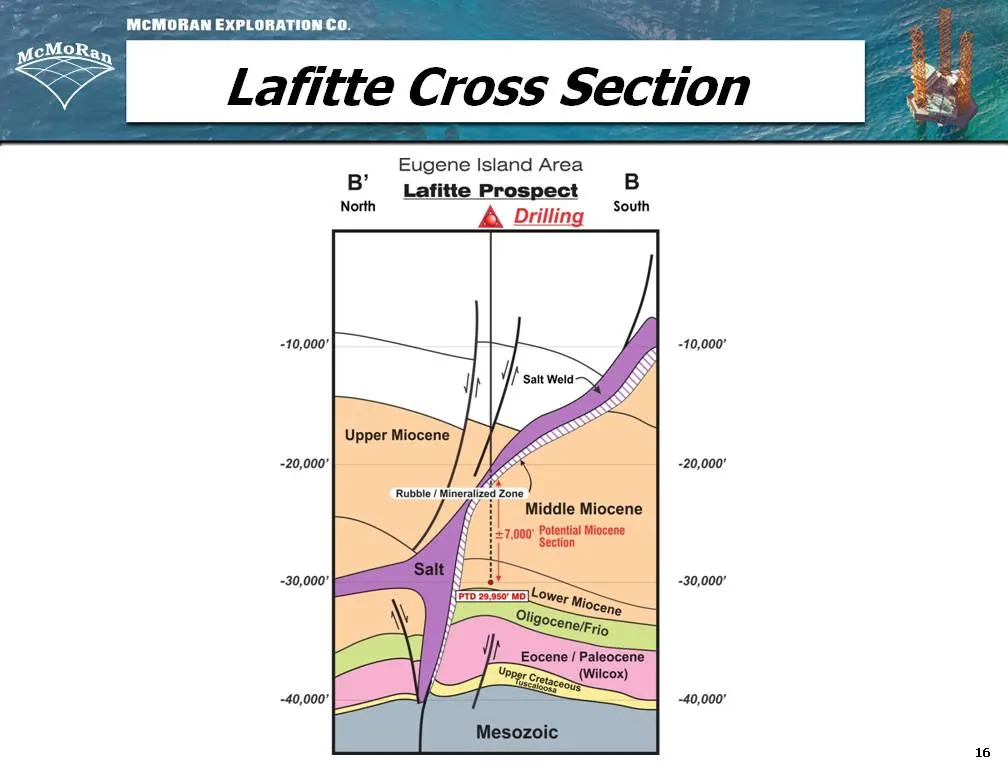
Slide 16: Lafitte Cross Section
MCMORAN EXPLORATIONCoO. North -10,000° -20,000' ~30,000" -40,000' 16
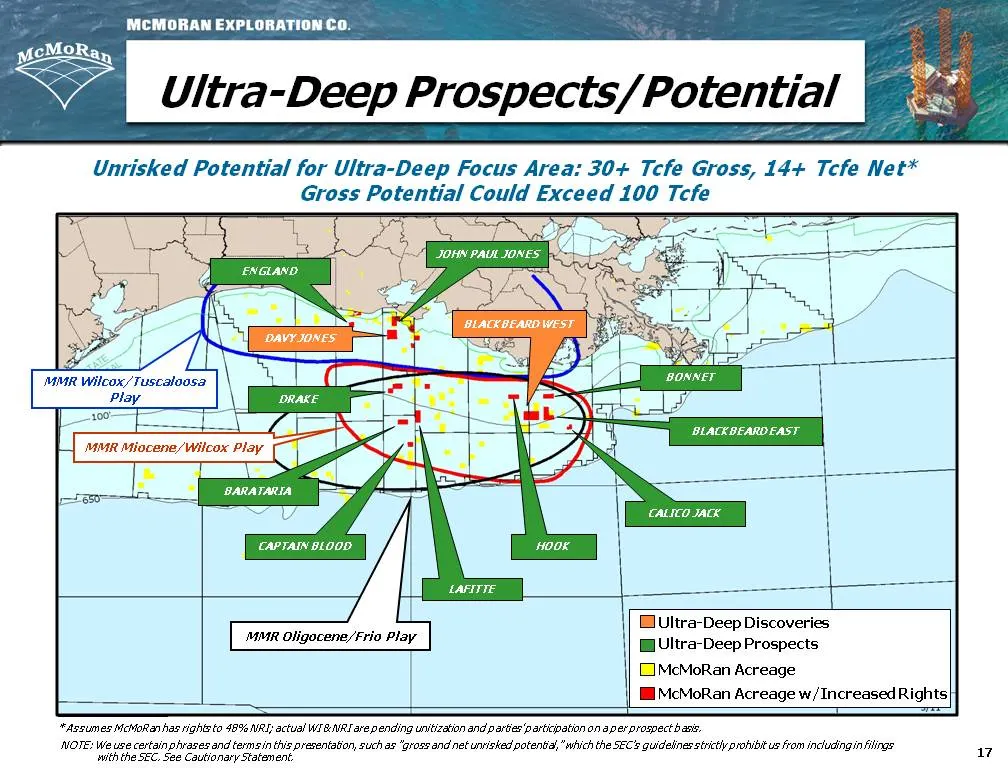
Slide 17: Unrisked Potential for Ultra-Deep Focus Area
MCMORAN EXPLORATION Co. Unrisked Potential for Ultra-Deep Focus Area: 30+ Tcfe Gross, 14+ Tcfe Net* Gross Potential Could Exceed 100 Tcfe ~ < MMR Wilcox/ Tuscaloosa 1 = Play \ ; == aE 7 I MMR Oligocene/Frio Play Uultra-Deep Discoveries WUltra-Deep Prospects [McMoRan Acreage I McMoRan Acreage w/Incre
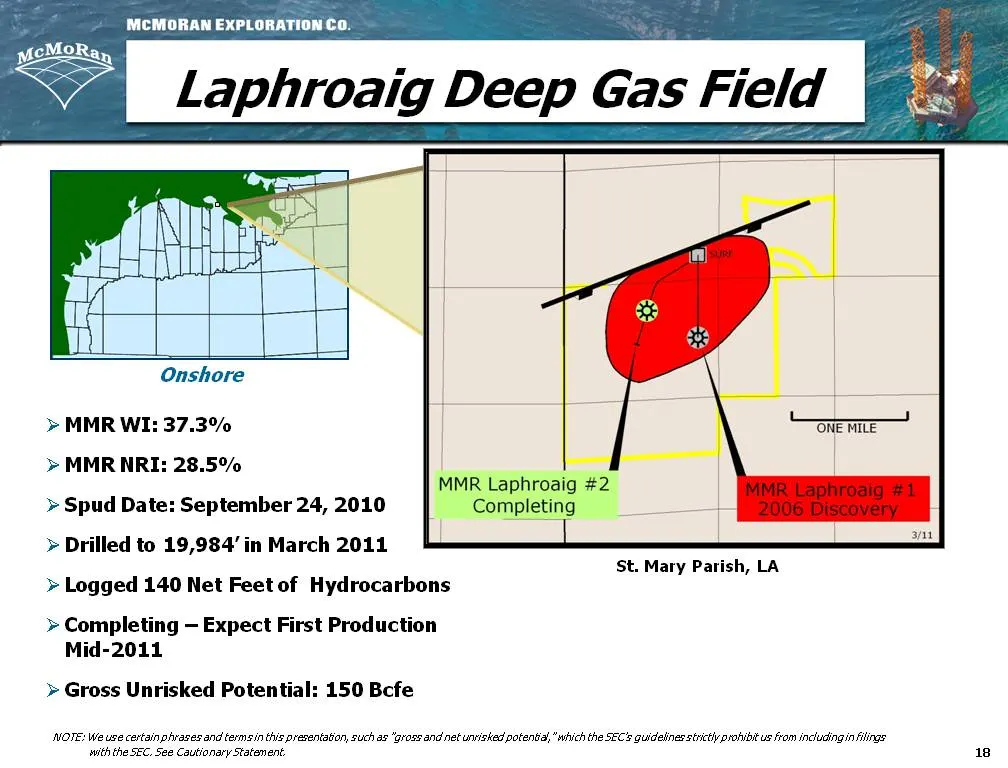
Slide 18: Onshore
MCMORAN EXPLORATION Co. Onshore > MMR WI: 37.3% | ‘“onene > MMR NRI: 28.5% >» Spud Date: September 24, 2010 > Drilled to 19,984’ in March 2011 » Logged 140 Net Feet of Hydrocarbons | | | ant St. Mary Parish, LA >» Completing — Expect First Production Mid-2011 > Gross Unrisked Potential: 150 Bcfe NOT
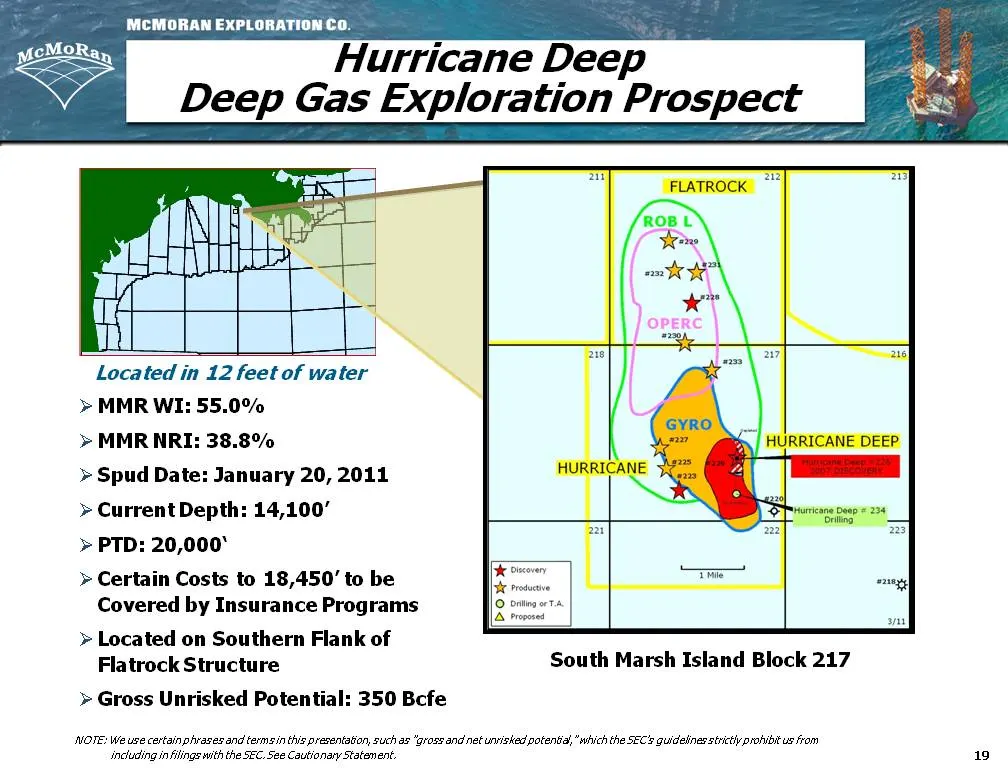
Slide 19: Hurricane Deep
MCMORAN EXPLORATION Co. Hurricane Deep Deep Gas Exploration Prospect Pal att Sa aa Located in 12 feet of water > MMR WI: 55.0% > MMR NRI: 38.8% » Spud Date: January 20, 2011 >» Current Depth: 14,100’ > PTD: 20,000° >» Certain Costs to 18,450’ to be Covered by Insurance Programs > Located on Southern
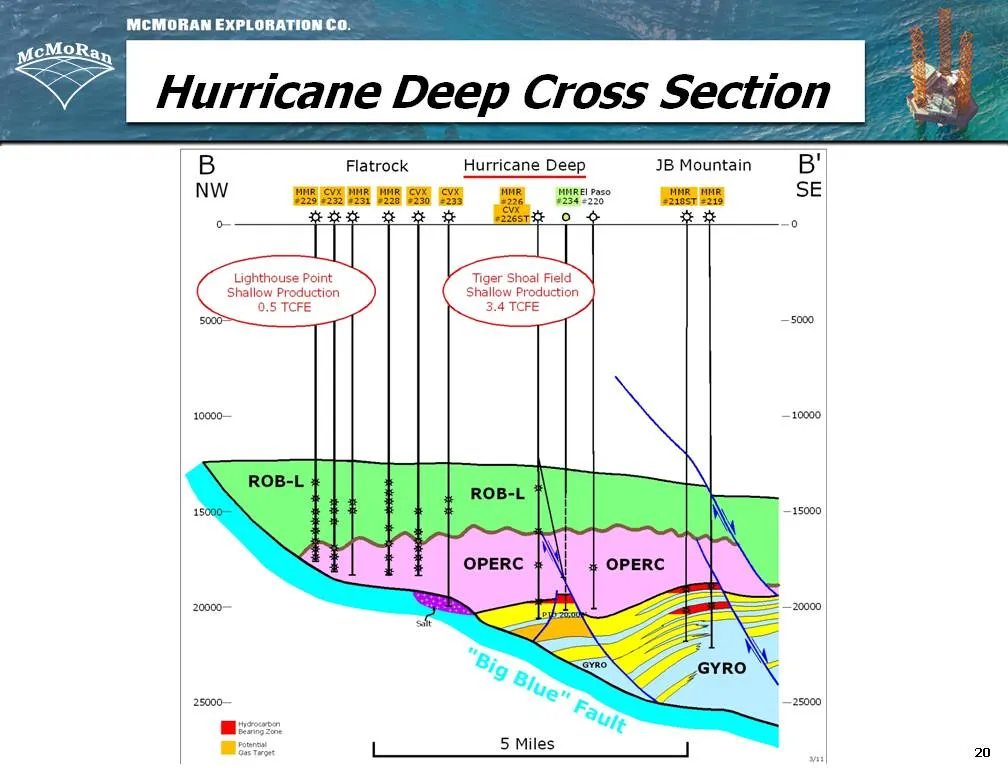
Slide 20: Hurricane Deep Cross Section
<> Hurricane Deep Cross Section JB Mountain Flatrock Hurricane Deep nw BS SS WS we AS SS e.. ae? AMES e ee as Hot - if Lighthouse Point Shallow Production 5 TCE aa, Tiger Shoal Field Shallow Production 3.4 TCE ke eae —5000 20
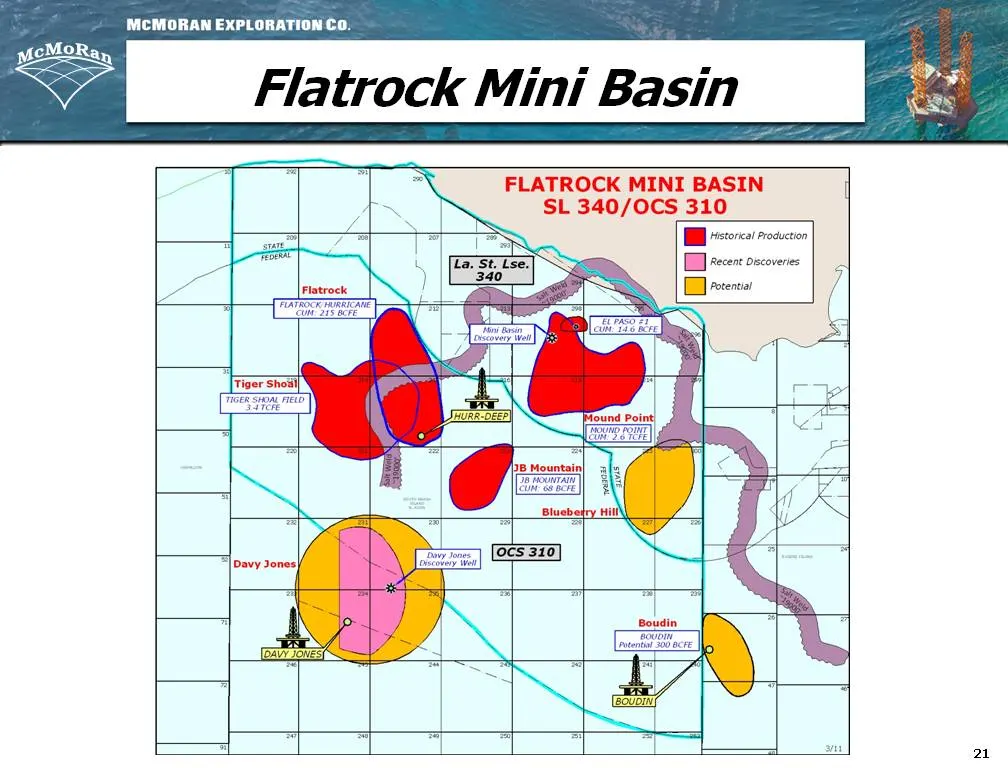
Slide 21: Flatrock Mini Basin
MCMORAN EXPLORATIONCoO. Flatrock Mini Basin - FLATROCK MINI BASIN SL 340/0CS 310 | —s Sa 7 [i 0101 rocuction # - \ | [fa stitse] = [Dl Recent viscoveries 7 ) | [sao 4 Zz Fistrock | = Dh reenoas / = oe Z| a 21
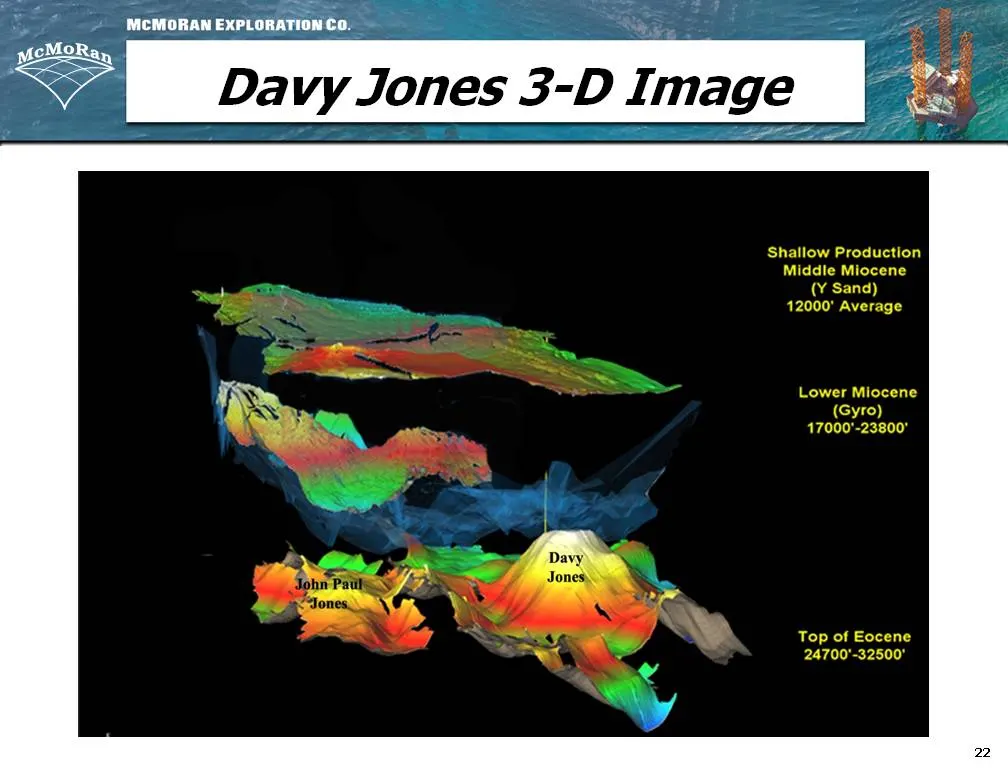
Slide 22: Davy Jones Shallow Production
|) MCMORANEXPLORATIONCO. SS Davy Jones mage : Shallow Production Middle Miocene (¥ Sand) 12000' Average Lower Miocene (Gyro) 17000'-23800" Top of Eocene 24700'-32500'
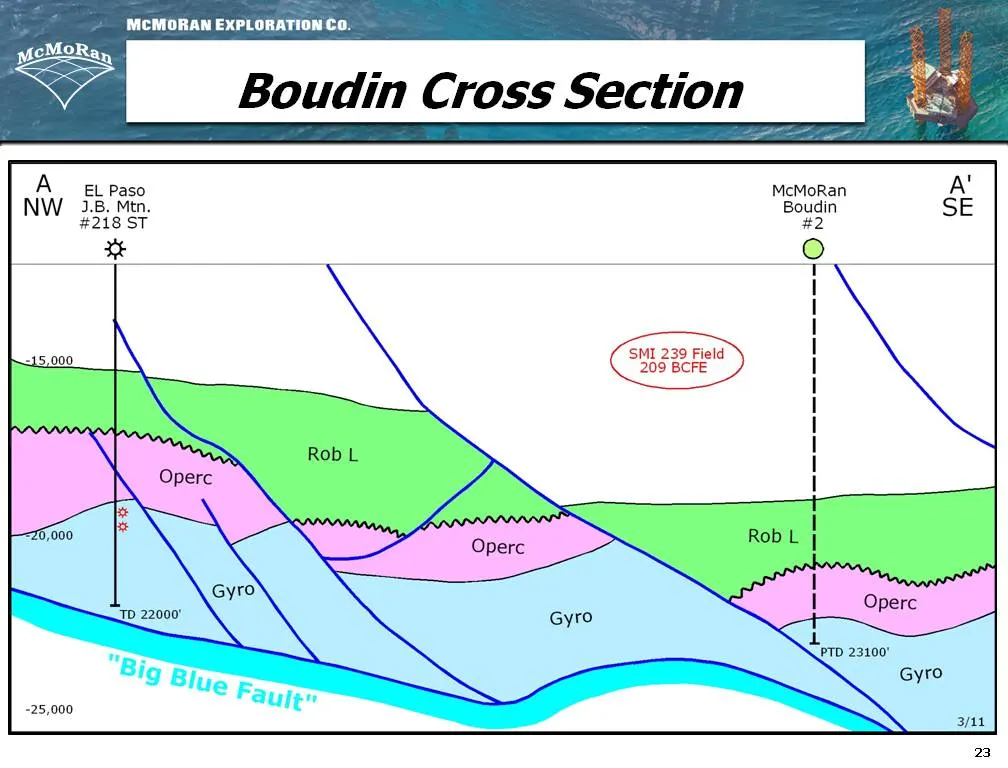
Slide 23: Boudin Cross Section
MoRa, ; Z Boudin Cross Section é McMoRan Boudin #2 T | I | | 209 BCFE I | I | | | | PTD 23100° Gyro
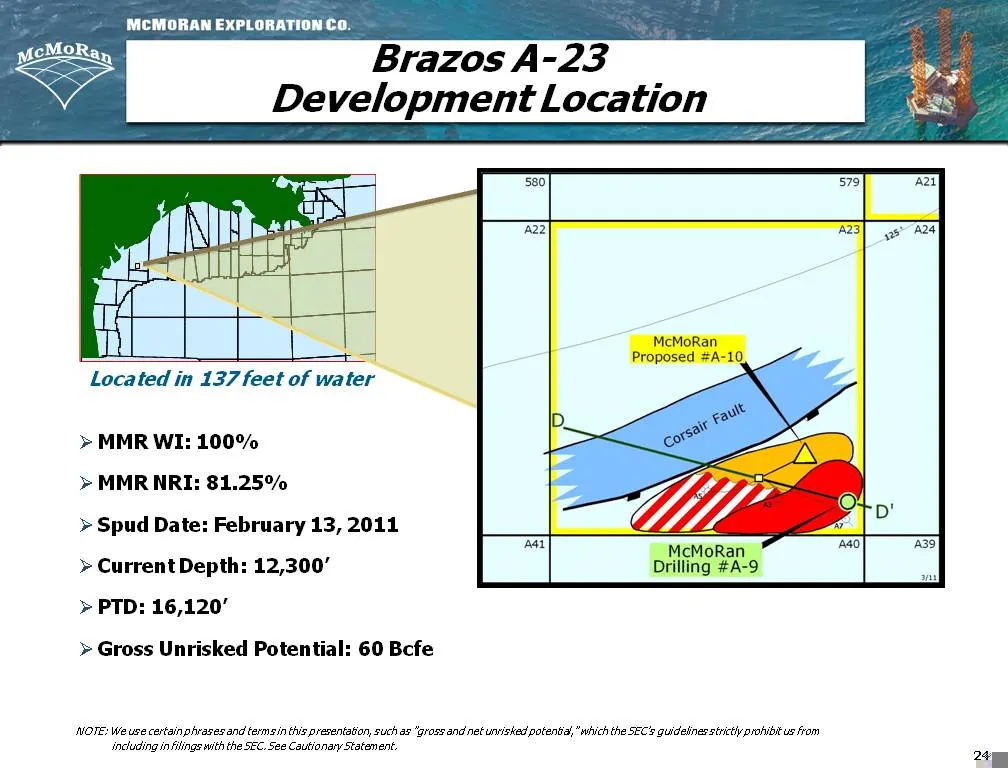
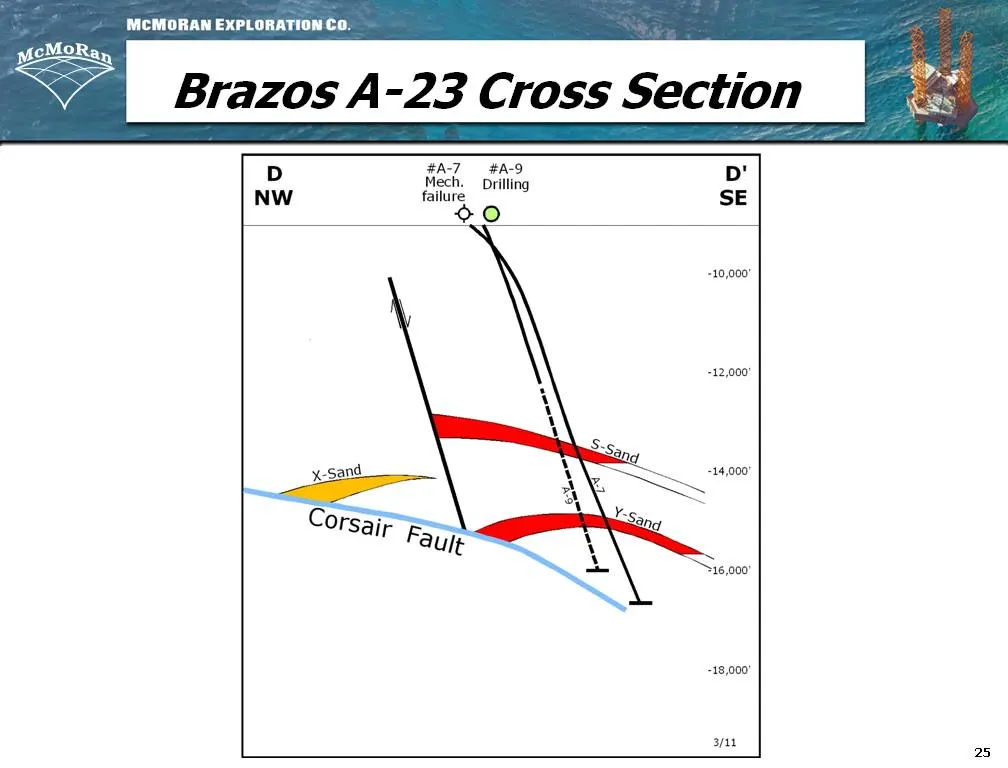
Slide 24: Brazos A-23
MCMORAN EXPLORATION Co. Brazos A-23 Development Location 580 7A22 Located in 137 feet of water | > MMR WI: 100% > MMR NRI: 81.25% >» Spud Date: February 13, 2011 » Current Depth: 12,300’ > PTD: 16,120’ > Gross Unrisked Potential: 60 Bcfe WOTE: We ure certain pivases and termsin th’s presentation, su
Slide 25: Brazos A-23 Cross Section
MCMORAN EXPLORATIONCoO. ycMoRan Brazos A-23 Cross Section #A-7 #A-9 . D Mech. —prilling D NW failure SE Rome) -18,000 ayn 25
Slide 26: 2011 Outlook Summary
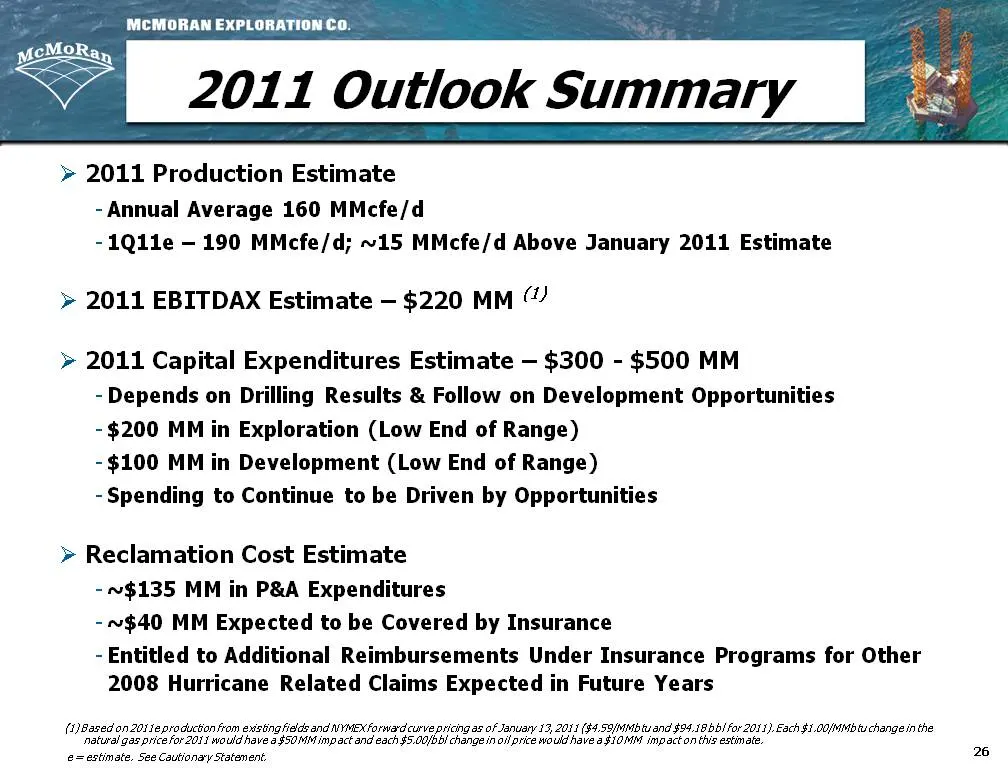
MCMORAN EXPLORATION Co. 2011 Outlook Summary >» 2011 Production Estimate - Annual Average 160 MMcfe/d -1Q11e — 190 MMcfe/d; ~15 MMcfe/d Above January 2011 Estimate > 2011 EBITDAX Estimate —- $220 MM > 2011 Capital Expenditures Estimate — $300 - $500 MM - Depends on Drilling Results & Follow on Devel
Slide 27: McMoRan Overview
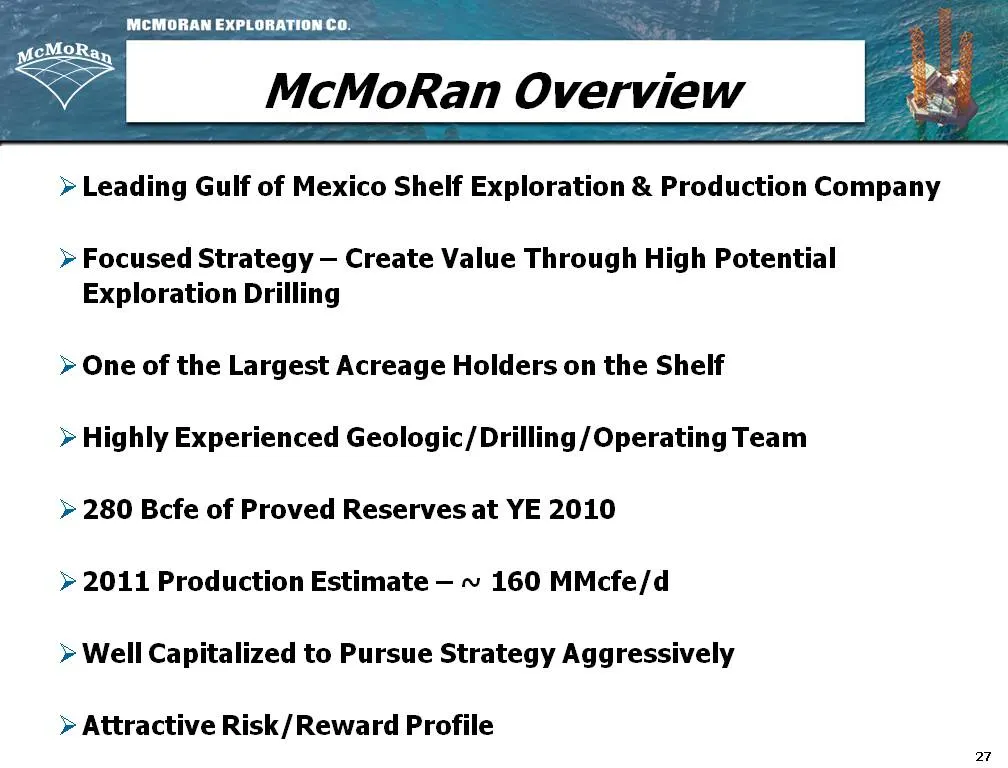
MCMORAN EXPLORATION Co. ycMoRan McMoRan Overview > Leading Gulf of Mexico Shelf Exploration & Production Company > Focused Strategy — Create Value Through High Potential Exploration Drilling > One of the Largest Acreage Holders on the Shelf > Highly Experienced Geologic/ Drilling /Operating Team >»
Slide 28: NYSE Listed
LISTED = NYSE"; www. memorar oth
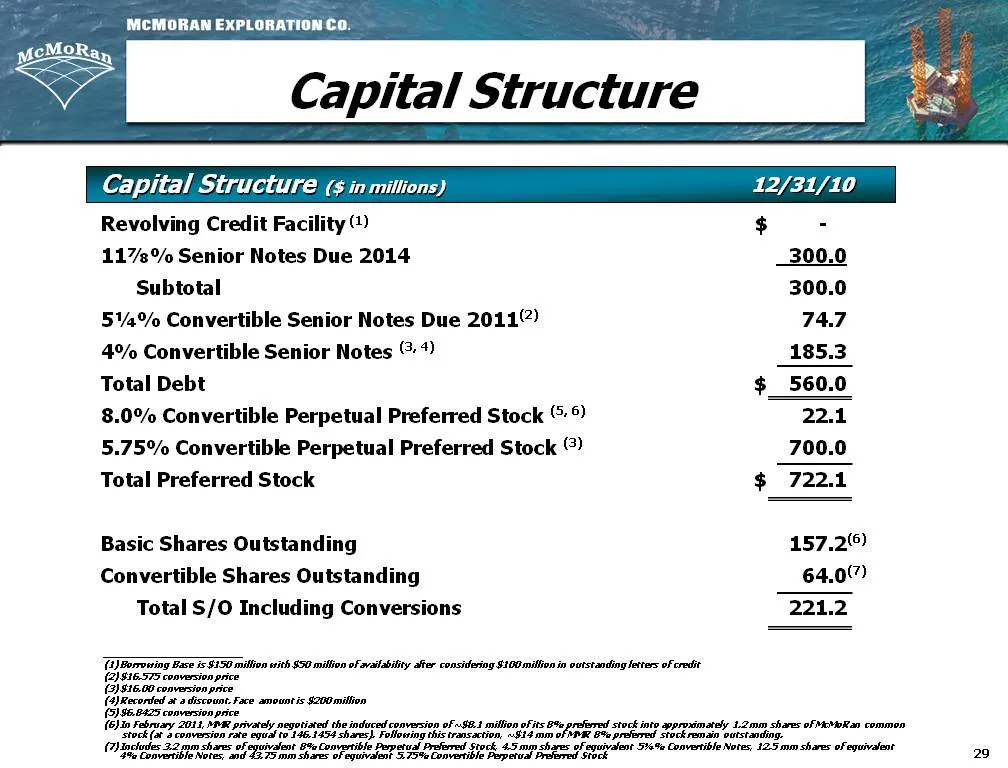
Slide 29: Capital Structure
MCMORAN EXPLORATION Co. Capital Structure (¢ in mill 12/31/11 Revolving Credit Faci q $ - 117s°% Senior Notes Due 2014 300.0 Subtotal 300.0 5%% Convertible Senior Notes Due 20117) 74.7 4% Convertible Senior Notes @ +) 185.3 Total Debt $ 560.0 8.0% Convertible Perpetual Preferred Stock © ° 22.1 5.75%
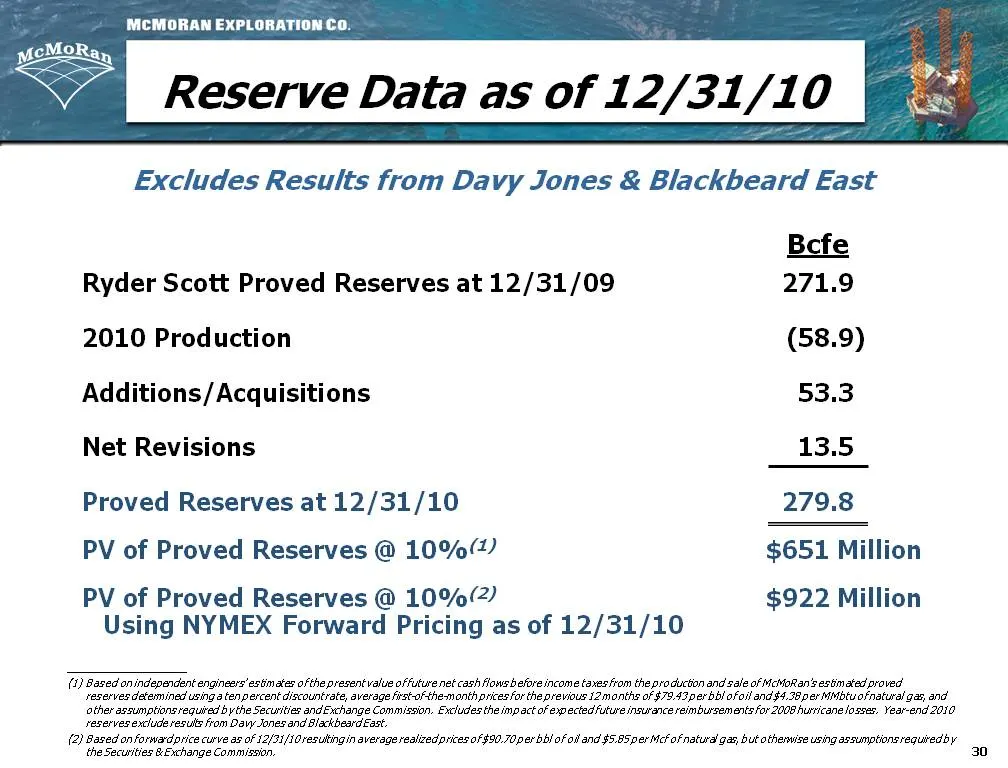
Slide 30: Reserve Data as of 12/31/10
MCMORAN EXPLORATION Co. ycMoRan va. Reserve Data as of 12/31/10 Excludes Results from Davy Jones & Blackbeard East Bcfe Ryder Scott Proved Reserves at 12/31/09 271.9 2010 Production (58.9) Additions/Acquisitions 53.3 Net Revisions 13.5 Proved Reserves at 12/31/10 279.8 PV of Proved Reserves @ 10% $6
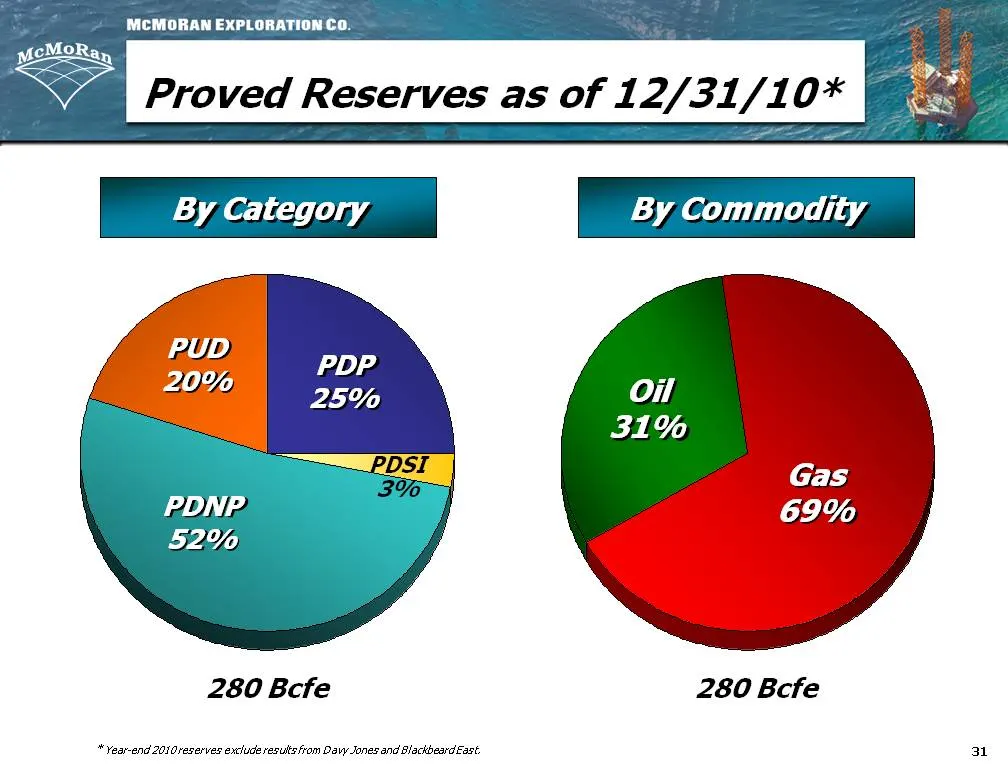
Slide 31: Proved Reserves as of 12/31/10
MCMORAN EXPLORATION Co. cMoRay ps se: Proved Reserves as of 12/31/10* By Category By Commodity 280 Bcfe 280 Bcfe "Year-end 2010reserves exclude results from Davy Jones and Blackbeard East. 31
Source: SEC EDGAR · 8-K filed Mar 28, 2011
More decks from McMoRan Exploration Company
 Global Metals, Mining & Steel Conference 201333 slides · May 14, 2013
 Q1 2013 Earnings Presentation46 slides · Apr 19, 2013
 Merger or Acquisition (February 2013)35 slides · Feb 25, 2013
 Merger or Acquisition (January 2013)30 slides · Jan 17, 2013
 Investor Presentation (August 2012)29 slides · Aug 14, 2012
 Susquehanna 2012 Energy & Resources Conference21 slides · May 9, 2012