Detection Technology Oy · OMXHEX:DETEC
Detection Technology Oy — Q3 2022 Earnings Presentation
16 slides from Detection Technology Oy's earnings presentation, Oct 26, 2022

Slide 1: Q3 January–September 2022 Business review
Q3 January–September 2022 Business review President and CEO Hannu Martola | 26 October 2022
Slide 2: Q3 2022 net sales and EBIT key figures
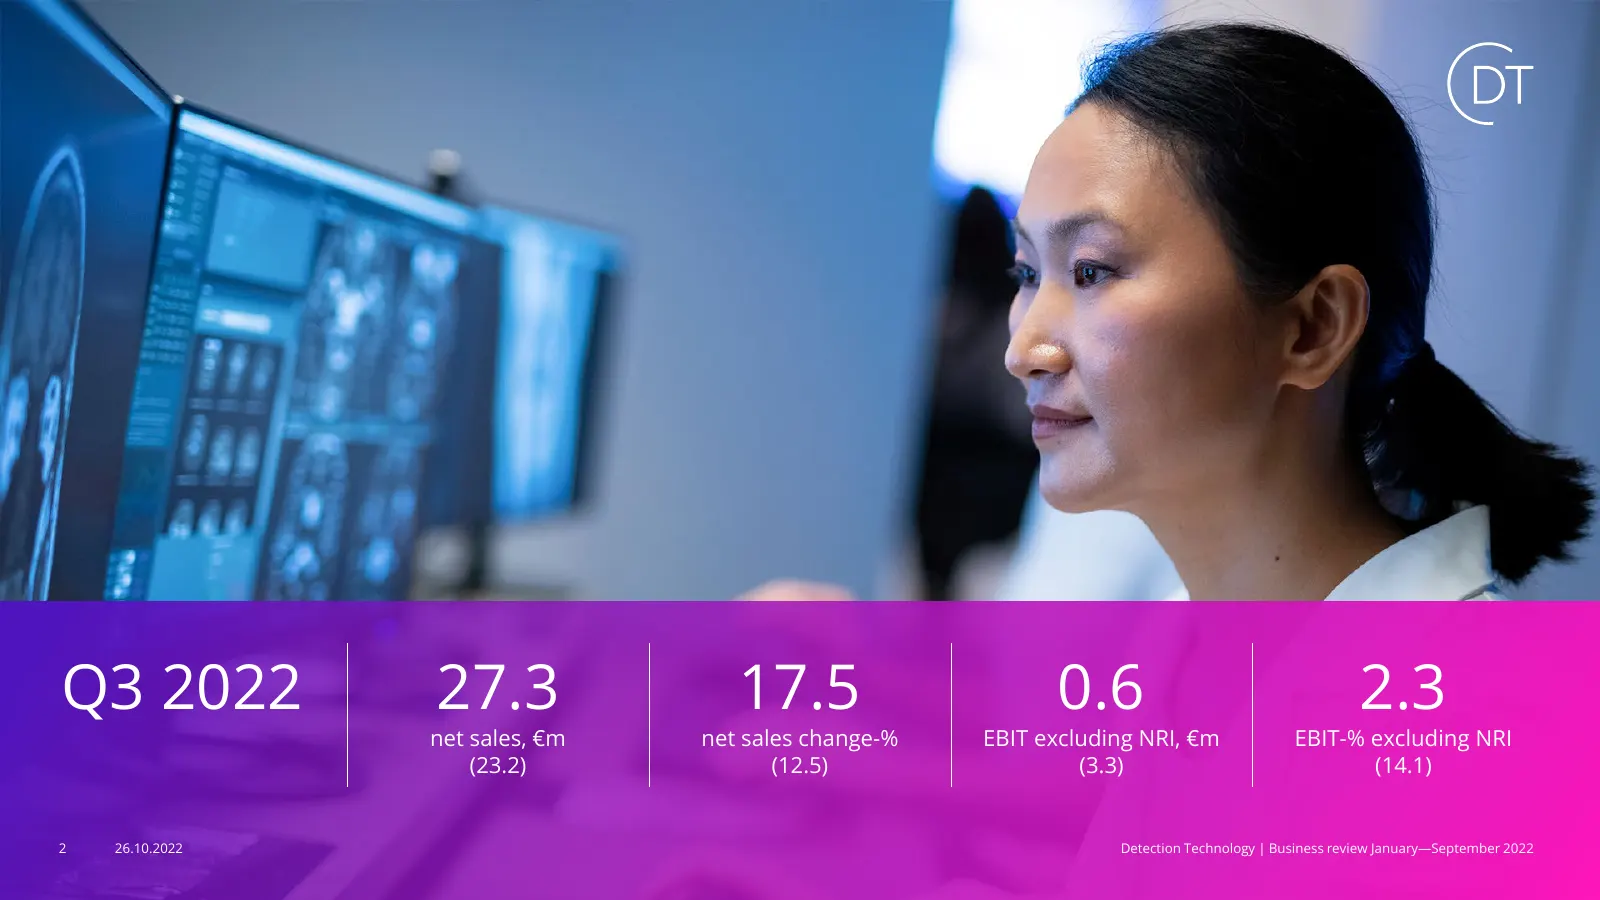
Q3 2022 27.3 17.5 0.6 2.3 net sales, €m net sales change-% EBIT excluding NRI, €m EBIT-% excluding NRI (23.2) (12.5) (3.3) (14.1) 2 26.10.2022 Detection Technology | Business review January—September 2022
Slide 3: Double-digit growth in sales, unsatisfactory profitability
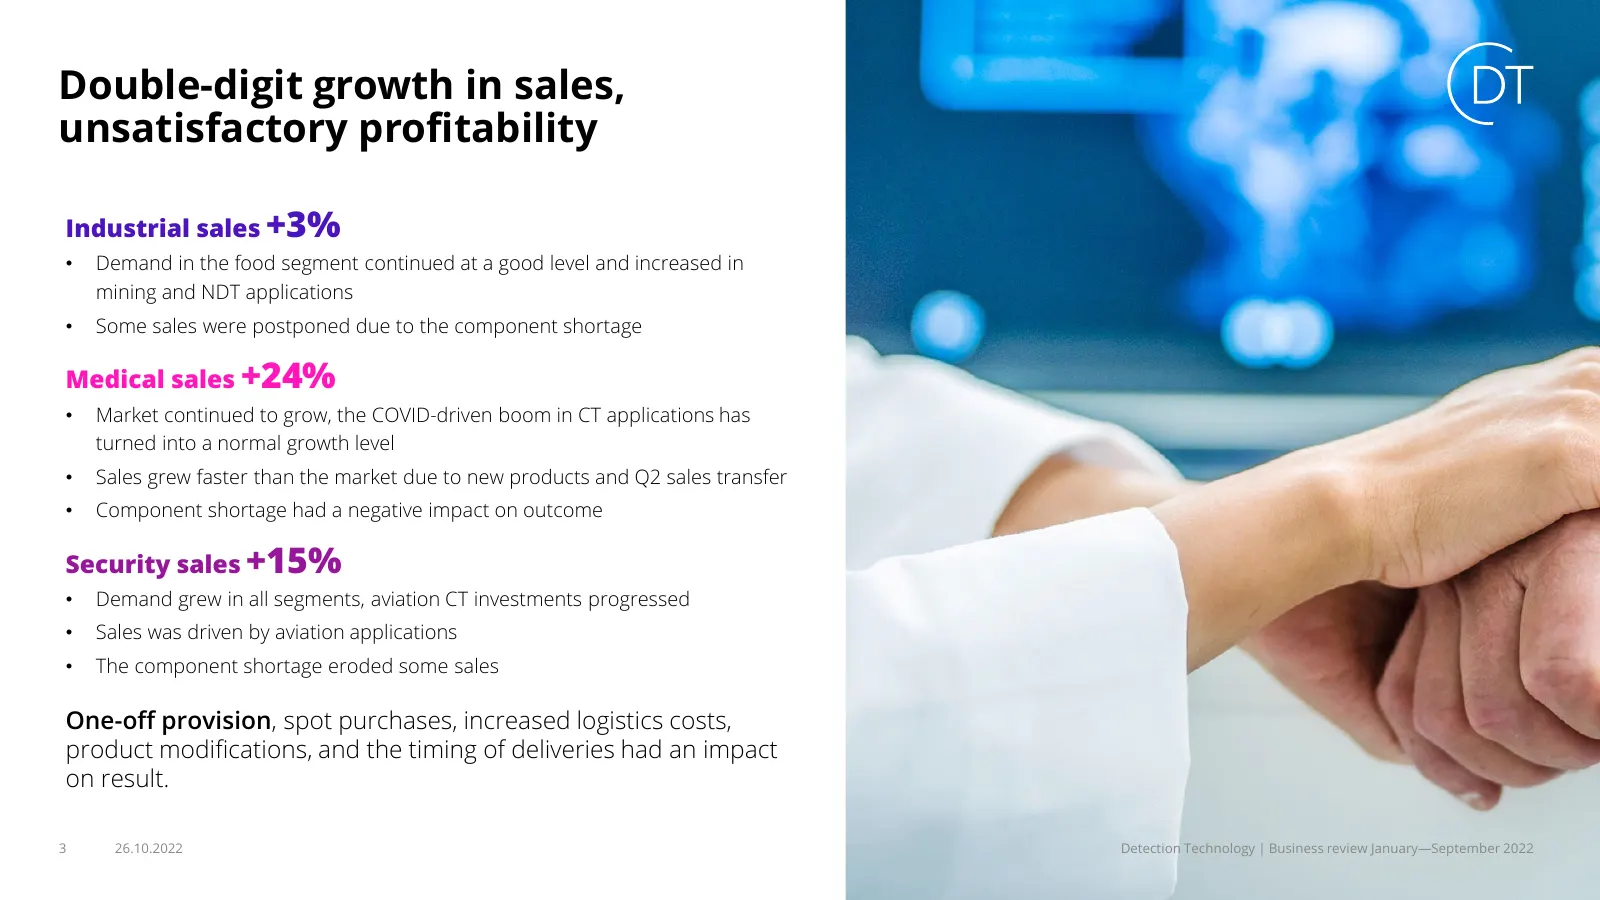
Double-digit growth in sales, unsatisfactory profitability Industrial sales +3% • Demand in the food segment continued at a good level and increased in mining and NDT applications • Some sales were postponed due to the component shortage Medical sales +24% • Market continued to grow, the COVID-drive
Slide 4: Net sales by quarter
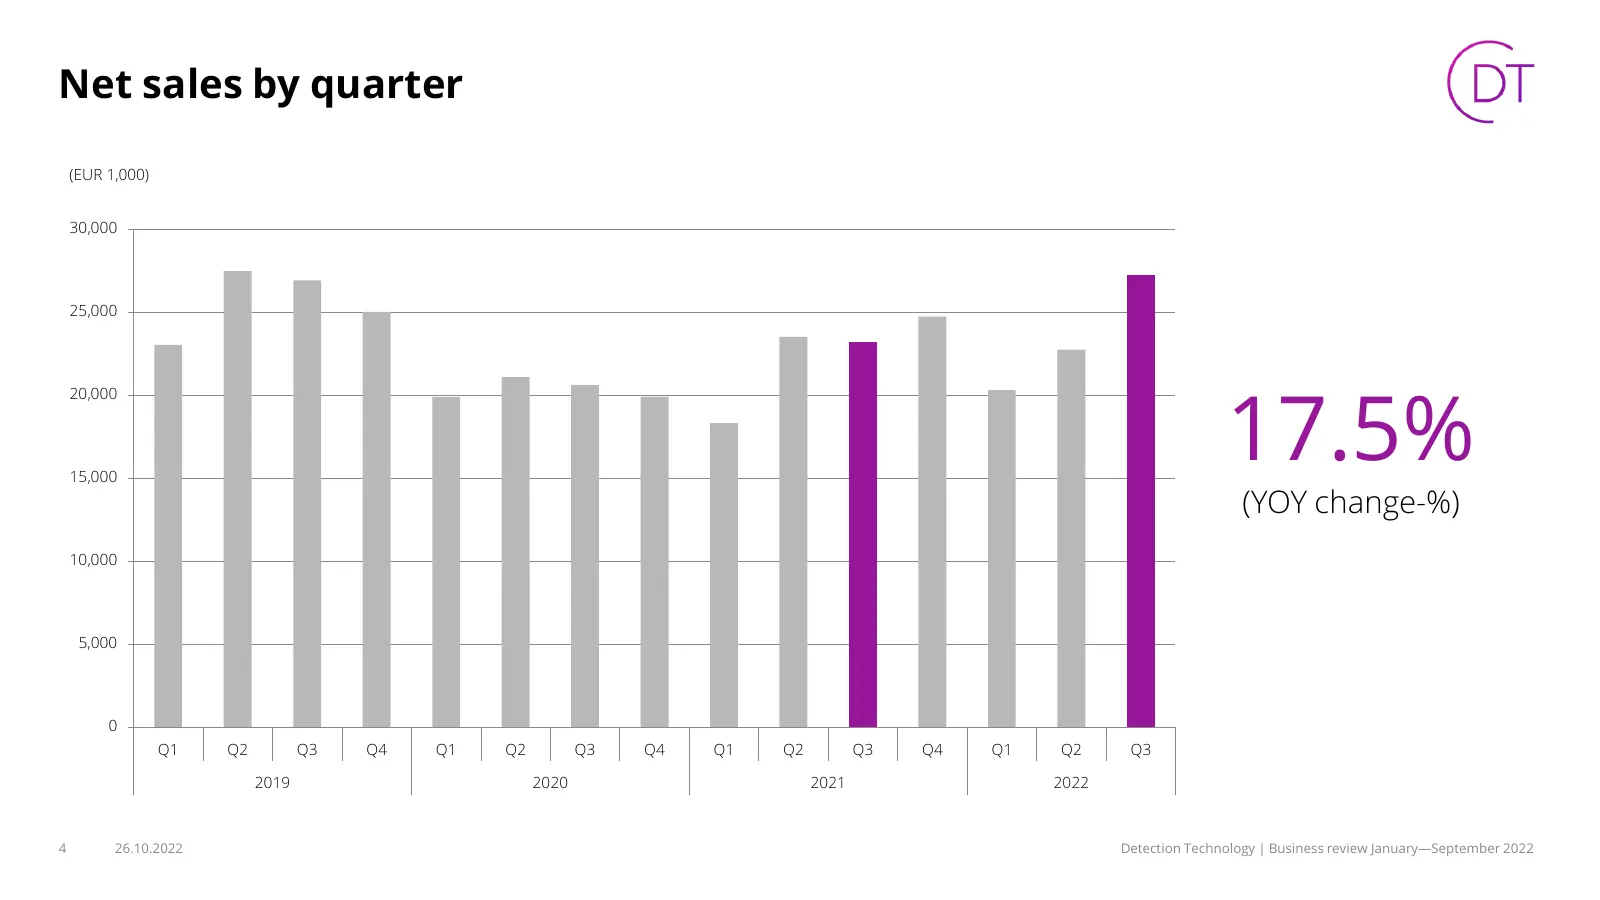
Net sales by quarter (EUR 1,000) 30,000 25,000 17.5% 20,000 15,000 (YOY change-%) 10,000 5,000 0 Q1 Q2 Q3 Q4 Q1 Q2 Q3 Q4 Q1 Q2 Q3 Q4 Q1 Q2 Q3 2019 2020 2021 2022 4 26.10.2022 Detection Technology | Business review January—September 2022
Slide 5: Operating profit
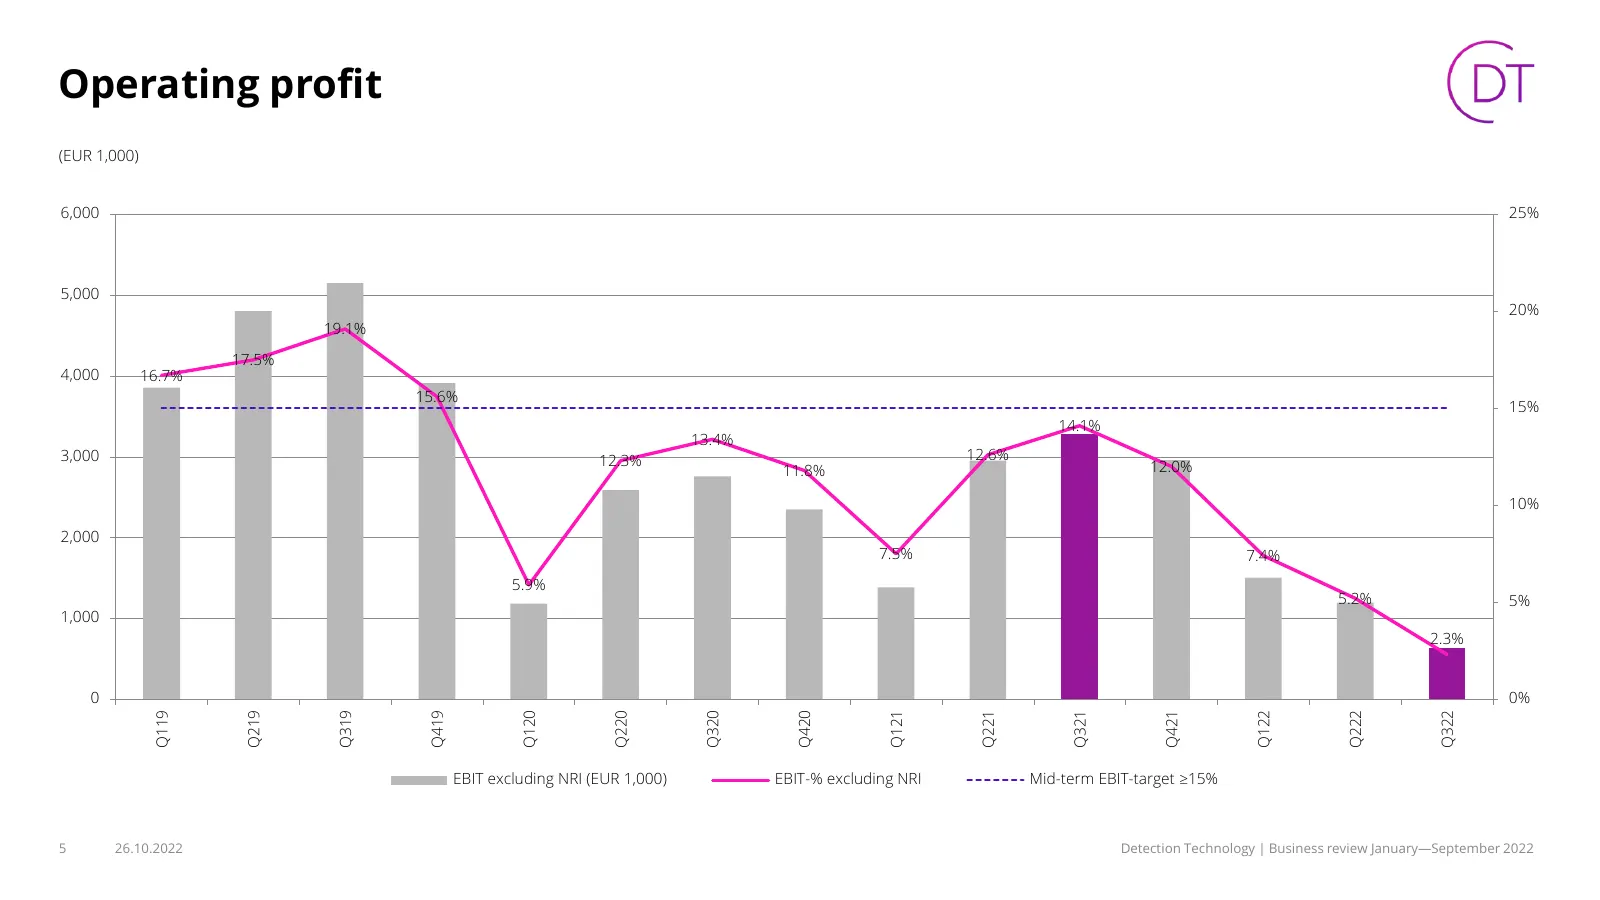
Operating profit (EUR 1,000) 6,000 25% 5,000 20% 19.1% 17.5% 4,000 16.7% 15.6% 15% 14.1% 13.4% 3,000 12.3% 12.6% 11.8% 12.0% 10% 2,000 7.5% 7.4% 5.9% 5.2% 5% 1,000 2.3% 0 0% Q119 Q219 Q319 Q419 Q120 Q220 Q320 Q420 Q121 Q221 Q321 Q421 Q122 Q222 Q322 EBIT excluding NRI (EUR 1,000) EBIT-% excluding NRI
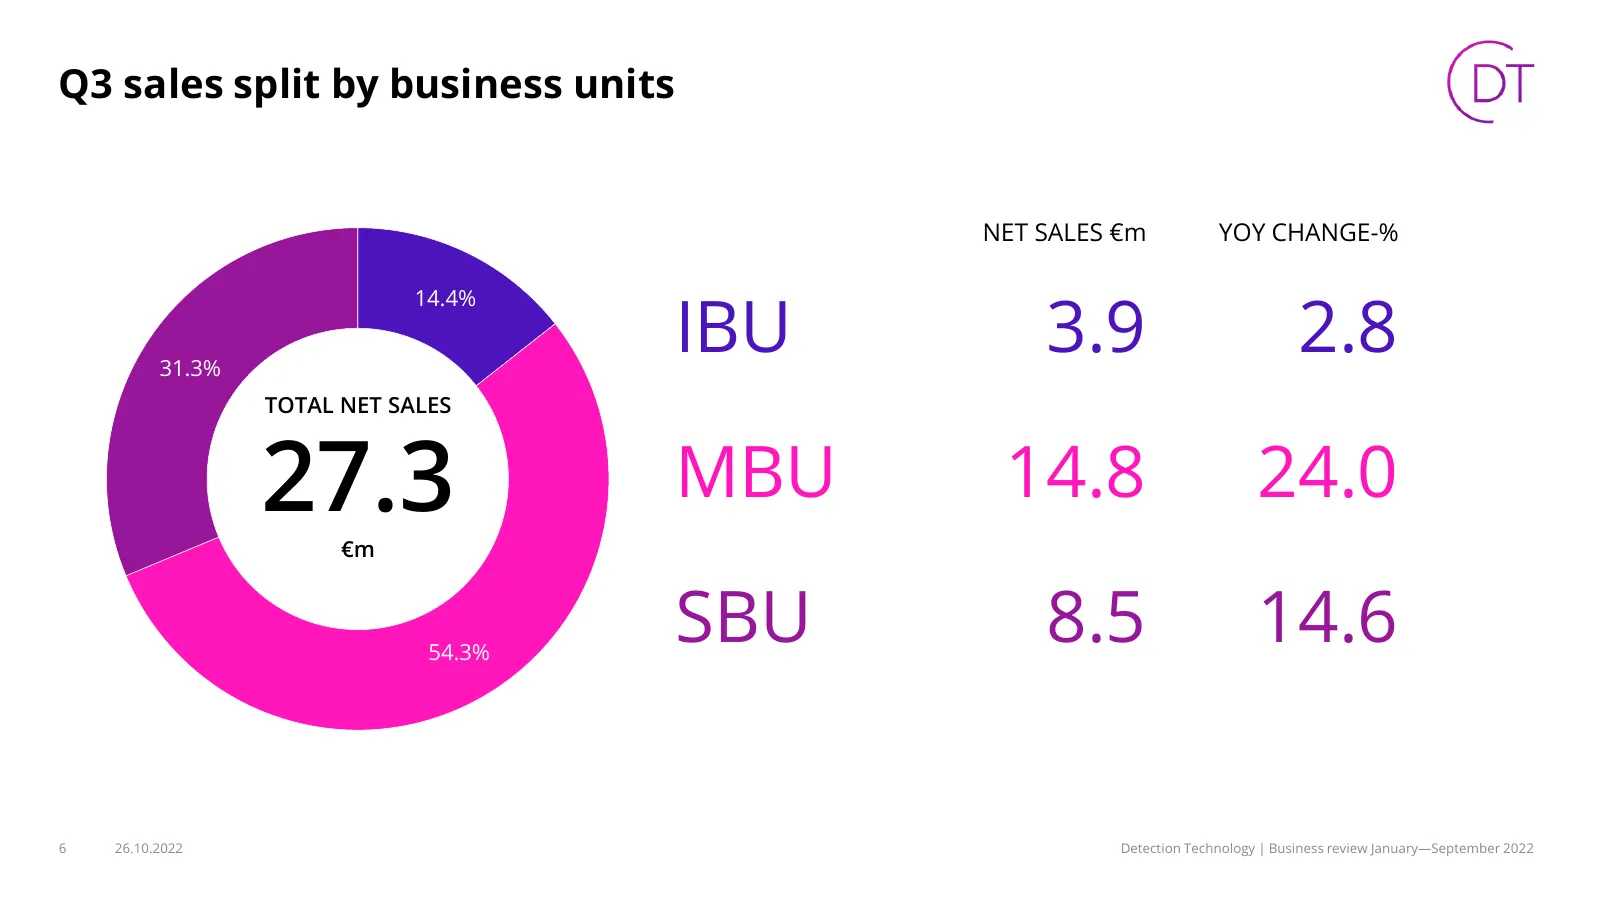
Slide 6: Q3 sales split by business units
Q3 sales split by business units NET SALES €m YOY CHANGE-% IBU 3.9 2.8 14.4% 31.3% TOTAL NET SALES 27.3 €m MBU 14.8 24.0 54.3% SBU 8.5 14.6 6 26.10.2022 Detection Technology | Business review January—September 2022
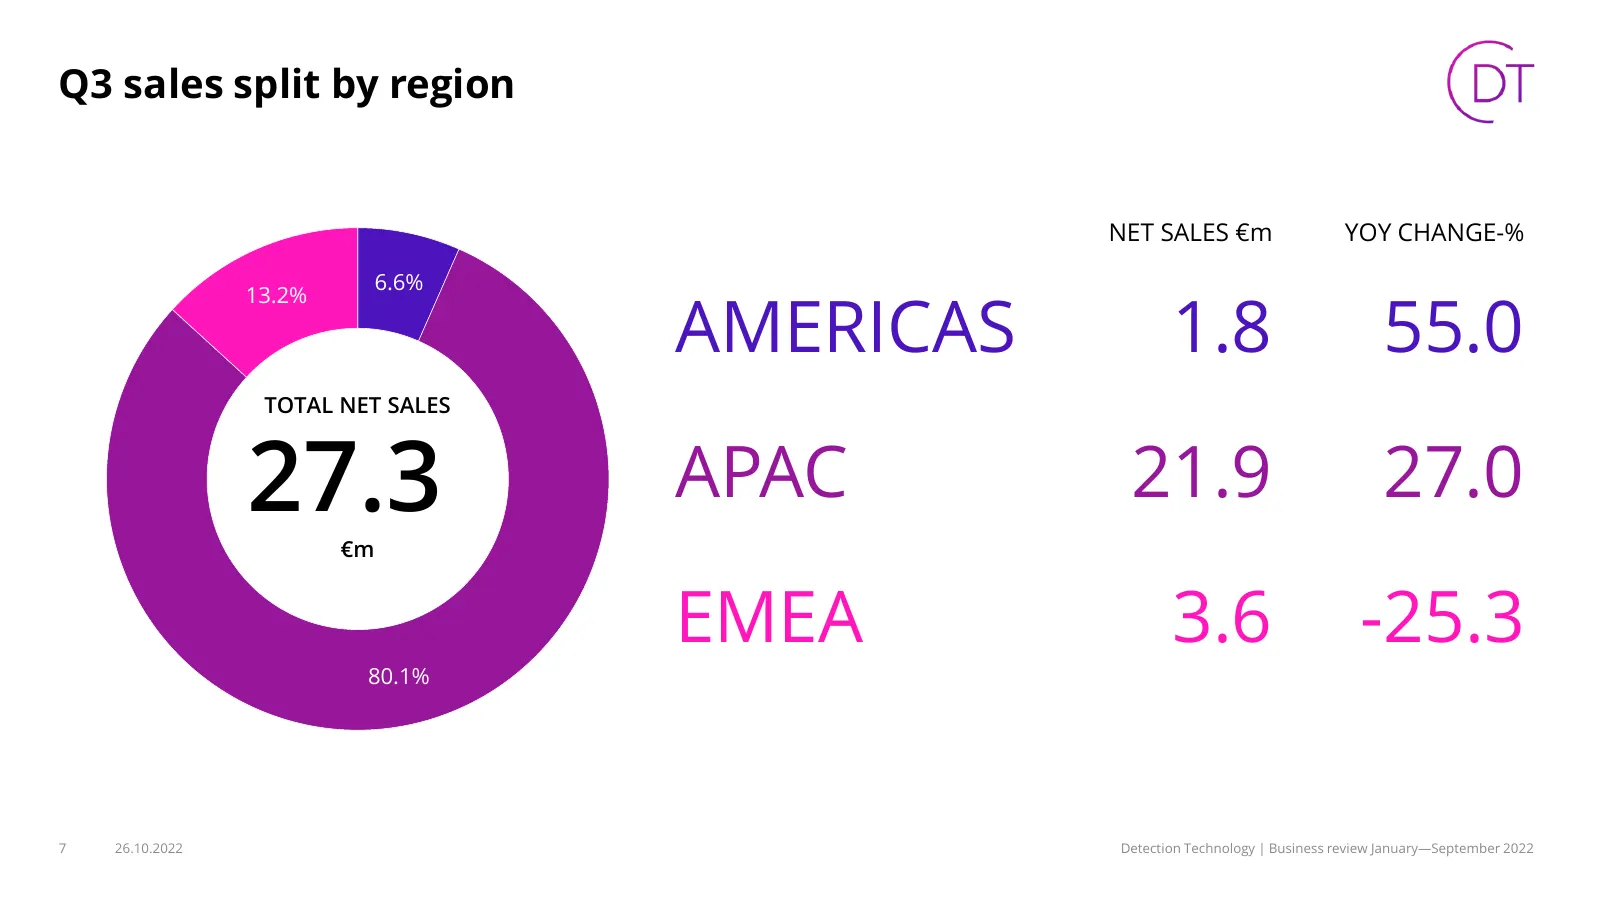
Slide 7: Q3 sales split by region
Q3 sales split by region NET SALES €m YOY CHANGE-% 6.6% AMERICAS 1.8 55.0 13.2% TOTAL NET SALES 27.3 €m APAC 21.9 27.0 EMEA 3.6 -25.3 80.1% 7 26.10.2022 Detection Technology | Business review January—September 2022
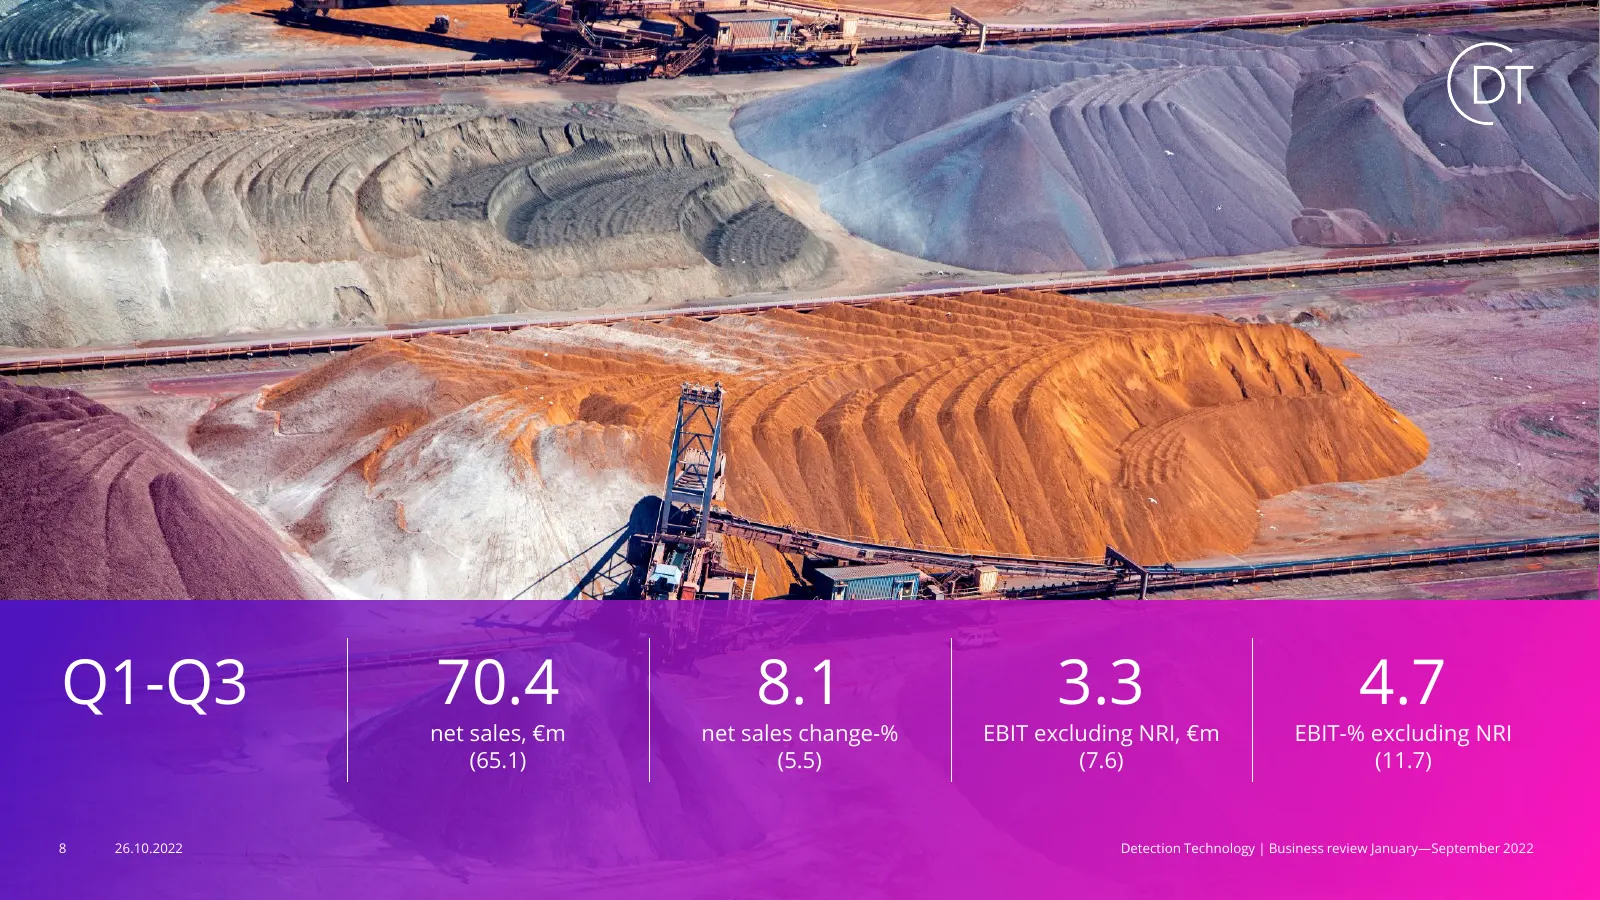
Slide 8: Q1-Q3 net sales and EBIT key figures
Q1-Q3 70.4 8.1 3.3 4.7 net sales, €m net sales change-% EBIT excluding NRI, €m EBIT-% excluding NRI (65.1) (5.5) (7.6) (11.7) 8 26.10.2022 Detection Technology | Business review January—September 2022
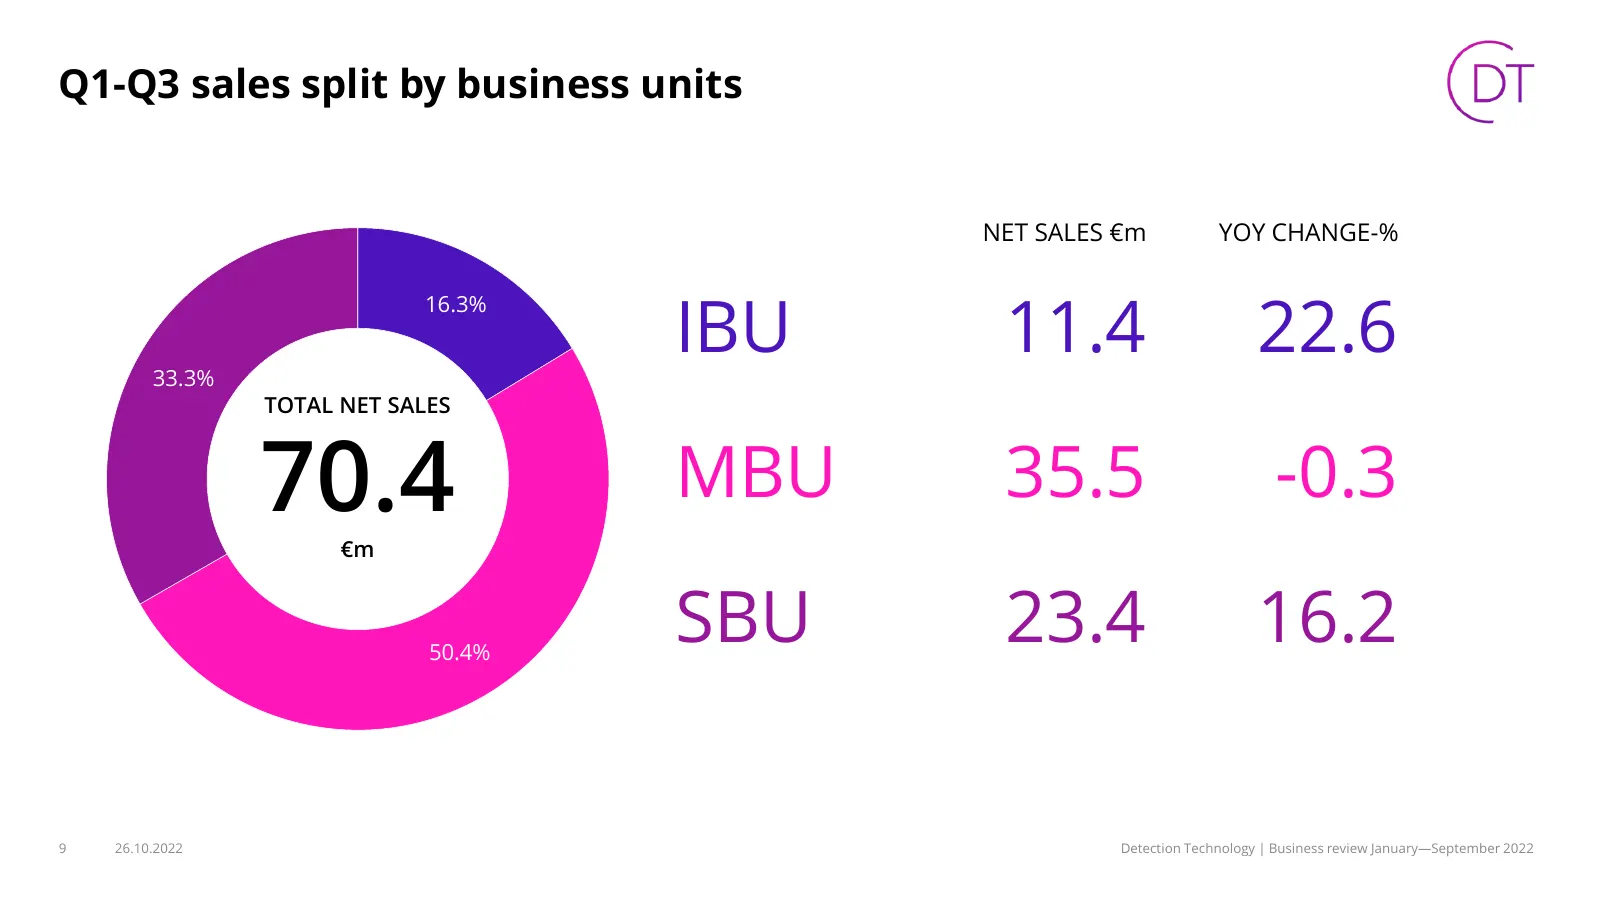
Slide 9: Q1-Q3 sales split by business units
Q1-Q3 sales split by business units NET SALES €m YOY CHANGE-% IBU 11.4 22.6 16.3% 33.3% TOTAL NET SALES 70.4 €m MBU 35.5 -0.3 50.4% SBU 23.4 16.2 9 26.10.2022 Detection Technology | Business review January—September 2022
Slide 10: Q1-Q3 sales split by region
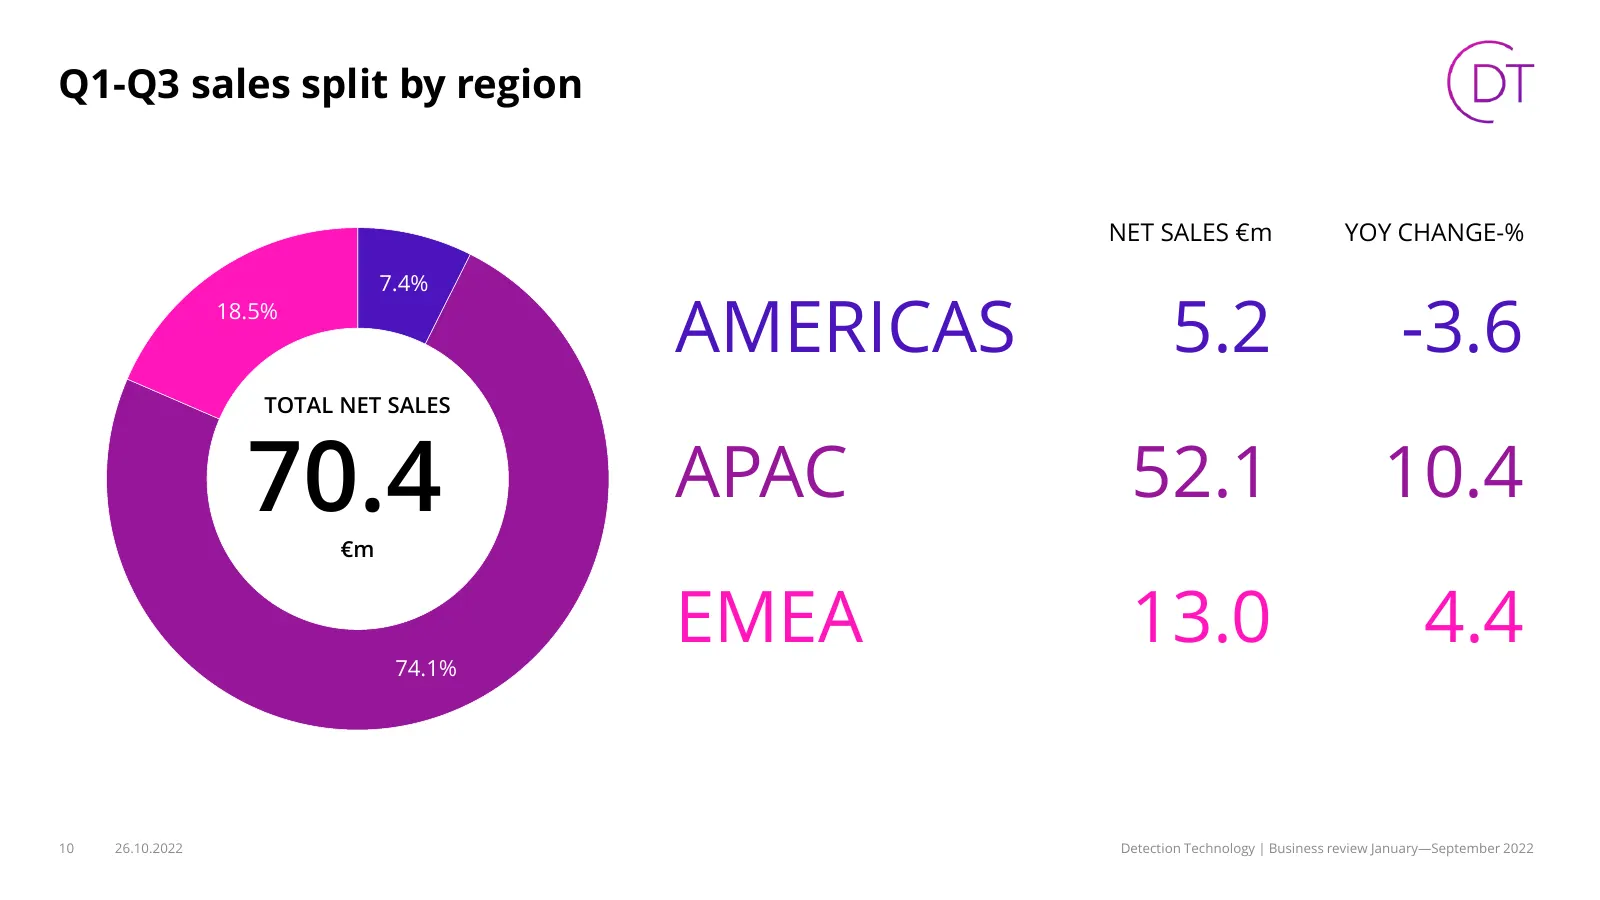
Q1-Q3 sales split by region NET SALES €m YOY CHANGE-% 7.4% 18.5% AMERICAS 5.2 -3.6 TOTAL NET SALES 70.4 €m APAC 52.1 10.4 74.1% EMEA 13.0 4.4 10 26.10.2022 Detection Technology | Business review January—September 2022
Slide 11: Key figures
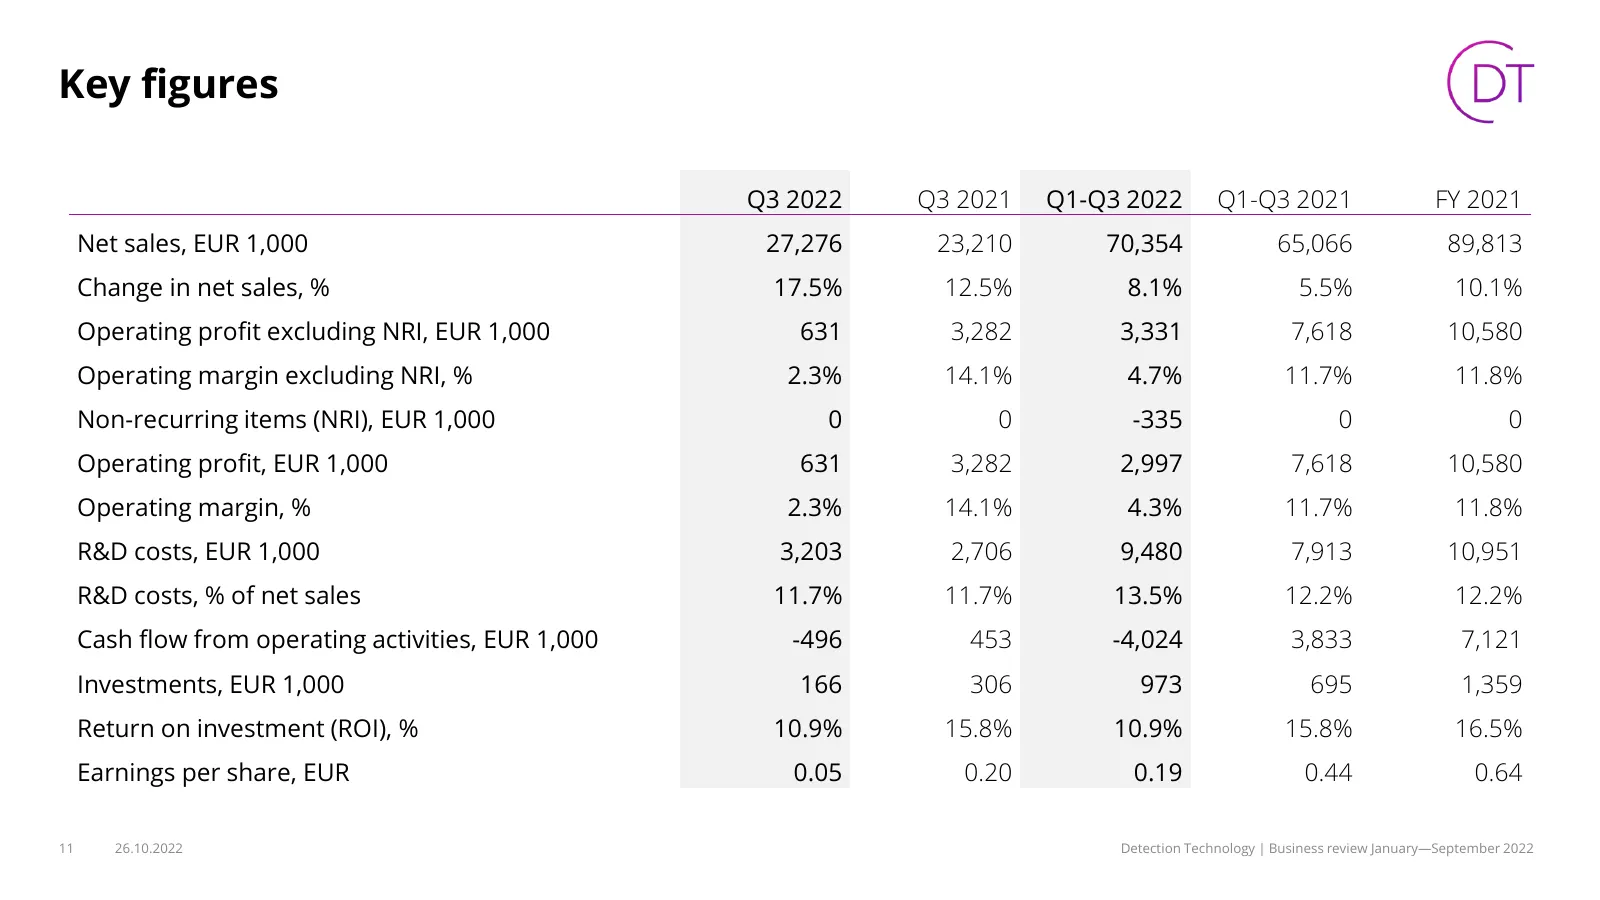
Key figures Q3 2022 Q3 2021 Q1-Q3 2022 Q1-Q3 2021 FY 2021 Net sales, EUR 1,000 27,276 23,210 70,354 65,066 89,813 Change in net sales, % 17.5% 12.5% 8.1% 5.5% 10.1% Operating profit excluding NRI, EUR 1,000 631 3,282 3,331 7,618 10,580 Operating margin excluding NRI, % 2.3% 14.1% 4.7% 11.7% 11.8% No
Slide 12: Strategy highlights
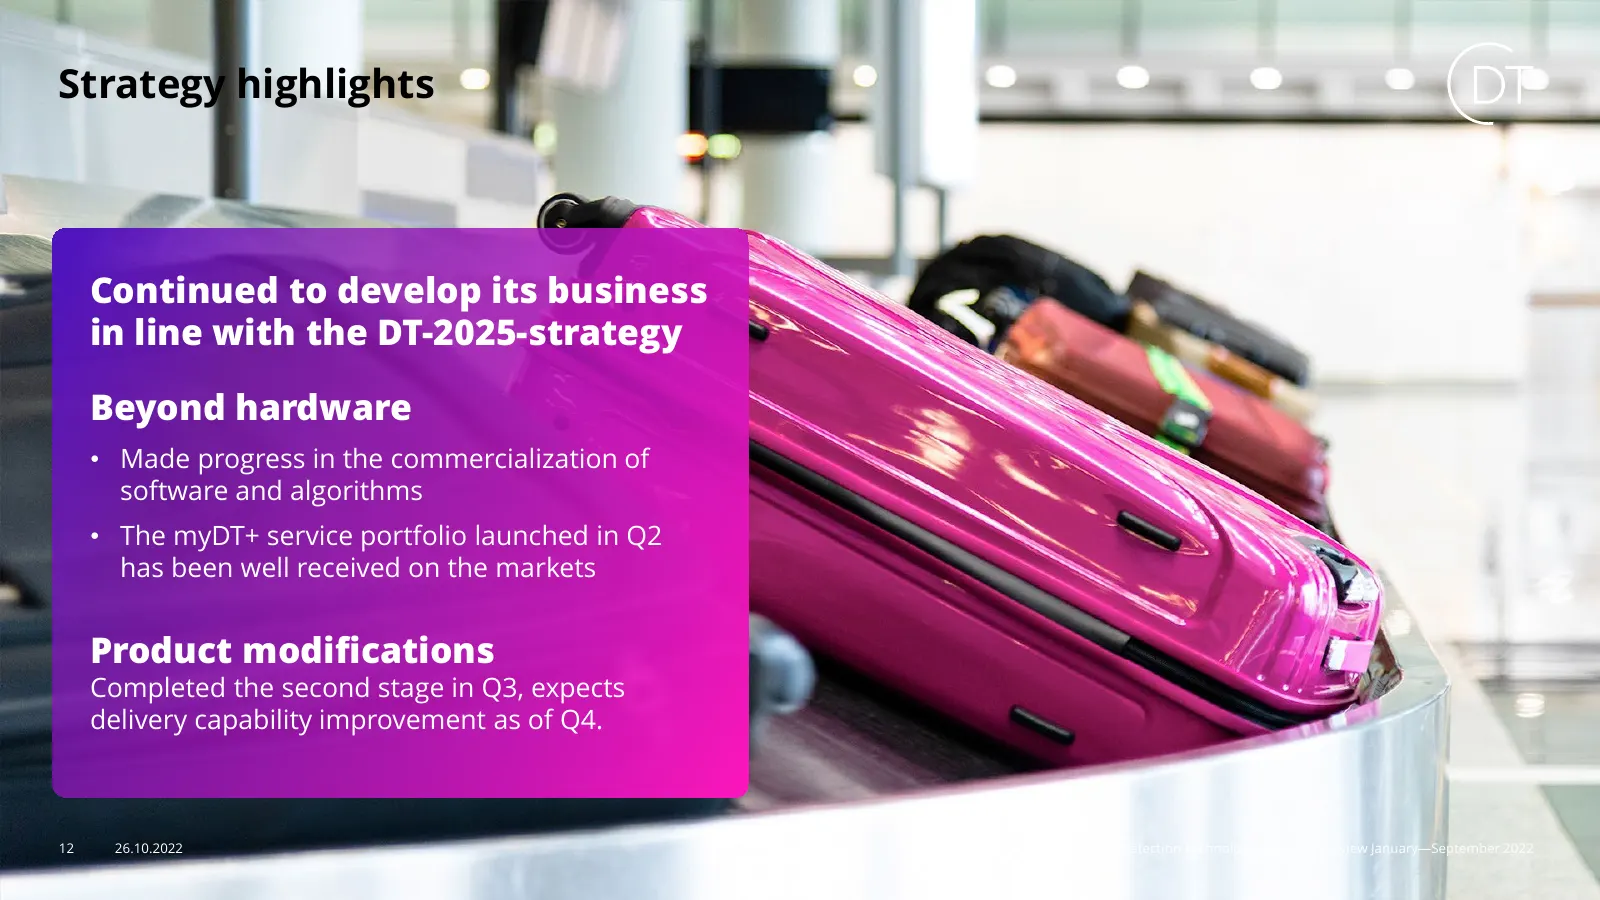
Strategy highlights Continued to develop its business in line with the DT-2025-strategy Beyond hardware • Made progress in the commercialization of software and algorithms • The myDT+ service portfolio launched in Q2 has been well received on the markets Product modifications Completed the second st
Slide 13: Sales expectation Q4 2022 and Q1 2023
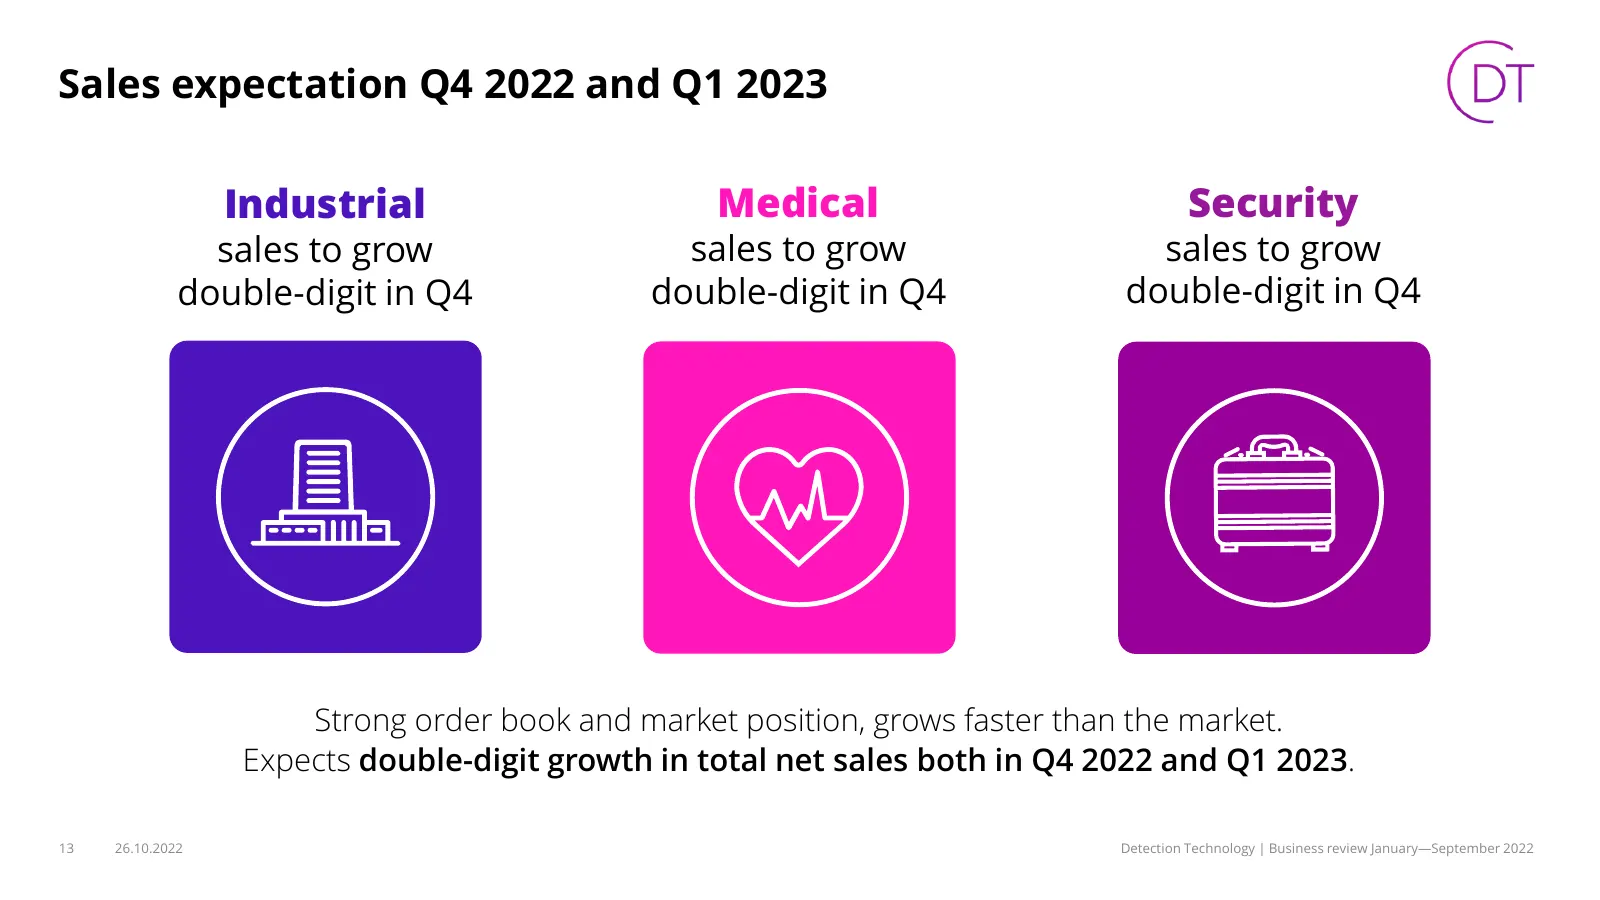
Sales expectation Q4 2022 and Q1 2023 Industrial Medical Security sales to grow sales to grow sales to grow double-digit in Q4 double-digit in Q4 double-digit in Q4 Strong order book and market position, grows faster than the market. Expects double-digit growth in total net sales both in Q4 2022 and
Slide 14: Business outlook
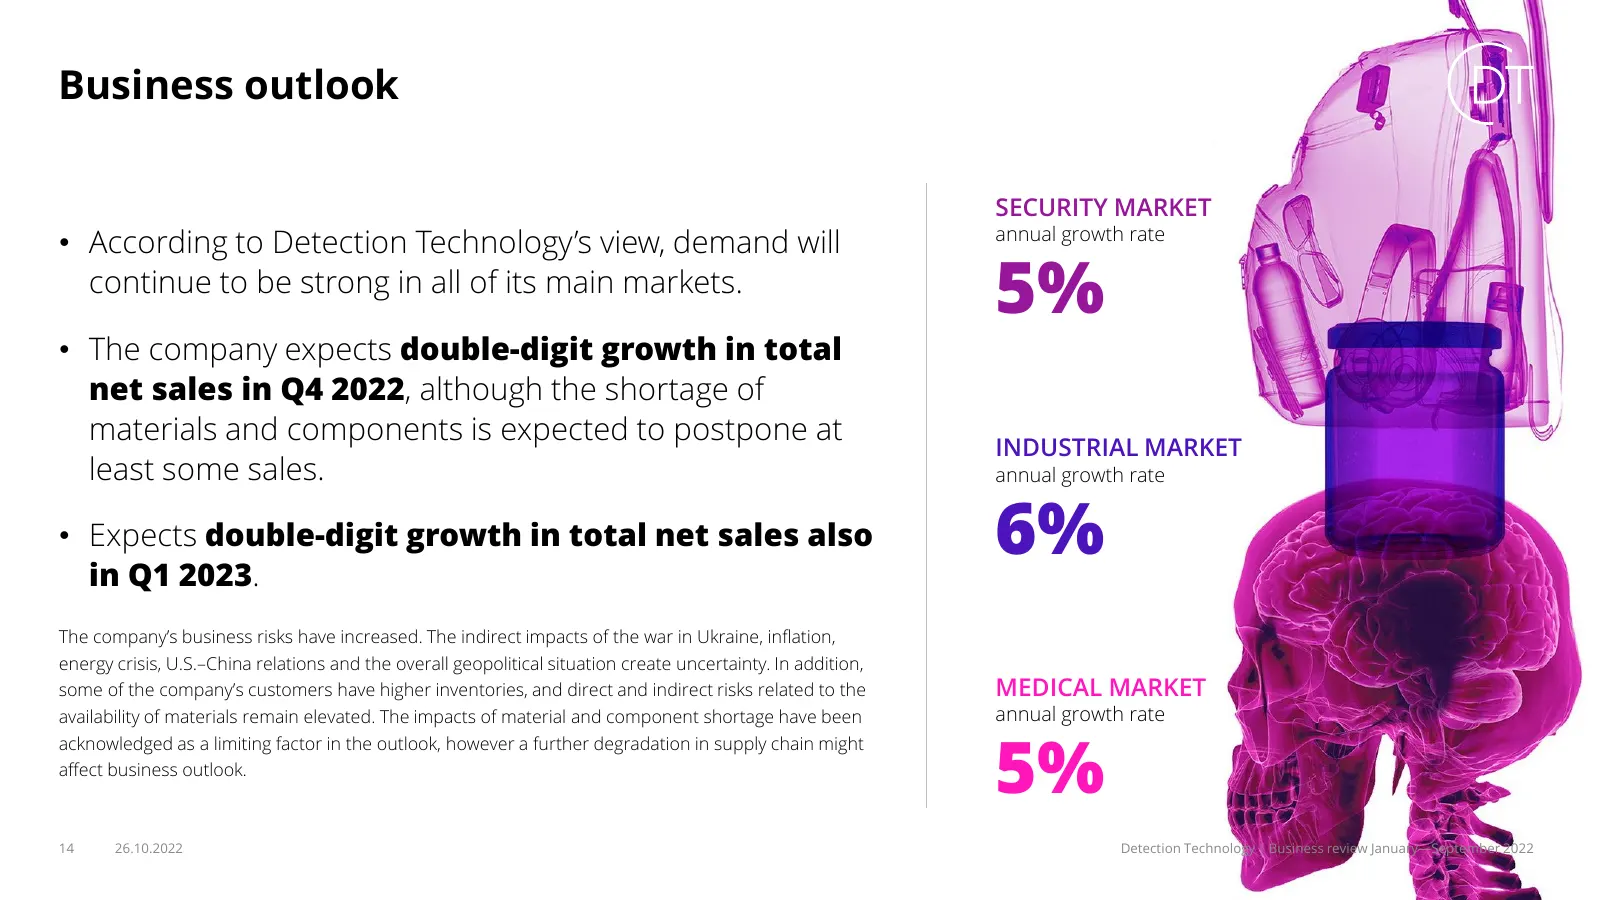
Business outlook SECURITY MARKET • According to Detection Technology’s view, demand will annual growth rate continue to be strong in all of its main markets. 5% • The company expects double-digit growth in total net sales in Q4 2022, although the shortage of materials and components is expected to p

Slide 15: Financial targets
FINANCIAL TARGETS MEDIUM TERM Annual MEDIUM TERM Operating ANNUAL Dividend or sales growth margin returned capital >10% ≥15% 30-60% 15 26.10.2022 Detection Technology | Business review January—September 2022

Slide 16: www.deetee.com
Detection Technology
Source: Internet Archive copy of deetee.com
More decks from Detection Technology Oy
 Q1 2026 Earnings Presentation15 slides · Apr 23, 2026
 Investor Day (November 2025)79 slides · Nov 18, 2025
 Q3 2025 Earnings Presentation17 slides · Oct 30, 2025
 Q1 2025 Earnings Presentation13 slides · Apr 24, 2025
 Q3 2024 Earnings Presentation17 slides · Oct 29, 2024
 Q1 2024 Earnings Presentation13 slides · Apr 25, 2024