Optomed Oyj Class A · OMXHEX:OPTOMED
Optomed Oyj Class A — Q3 2026 Earnings Presentation
16 slides from Optomed Oyj Class A's earnings presentation, Nov 6, 2026
Slide 1: Optomed Q3 2026
Optomed Q3 2026 6th November 2026 Juho Himberg, CEO Sakari Knuutti, CFO
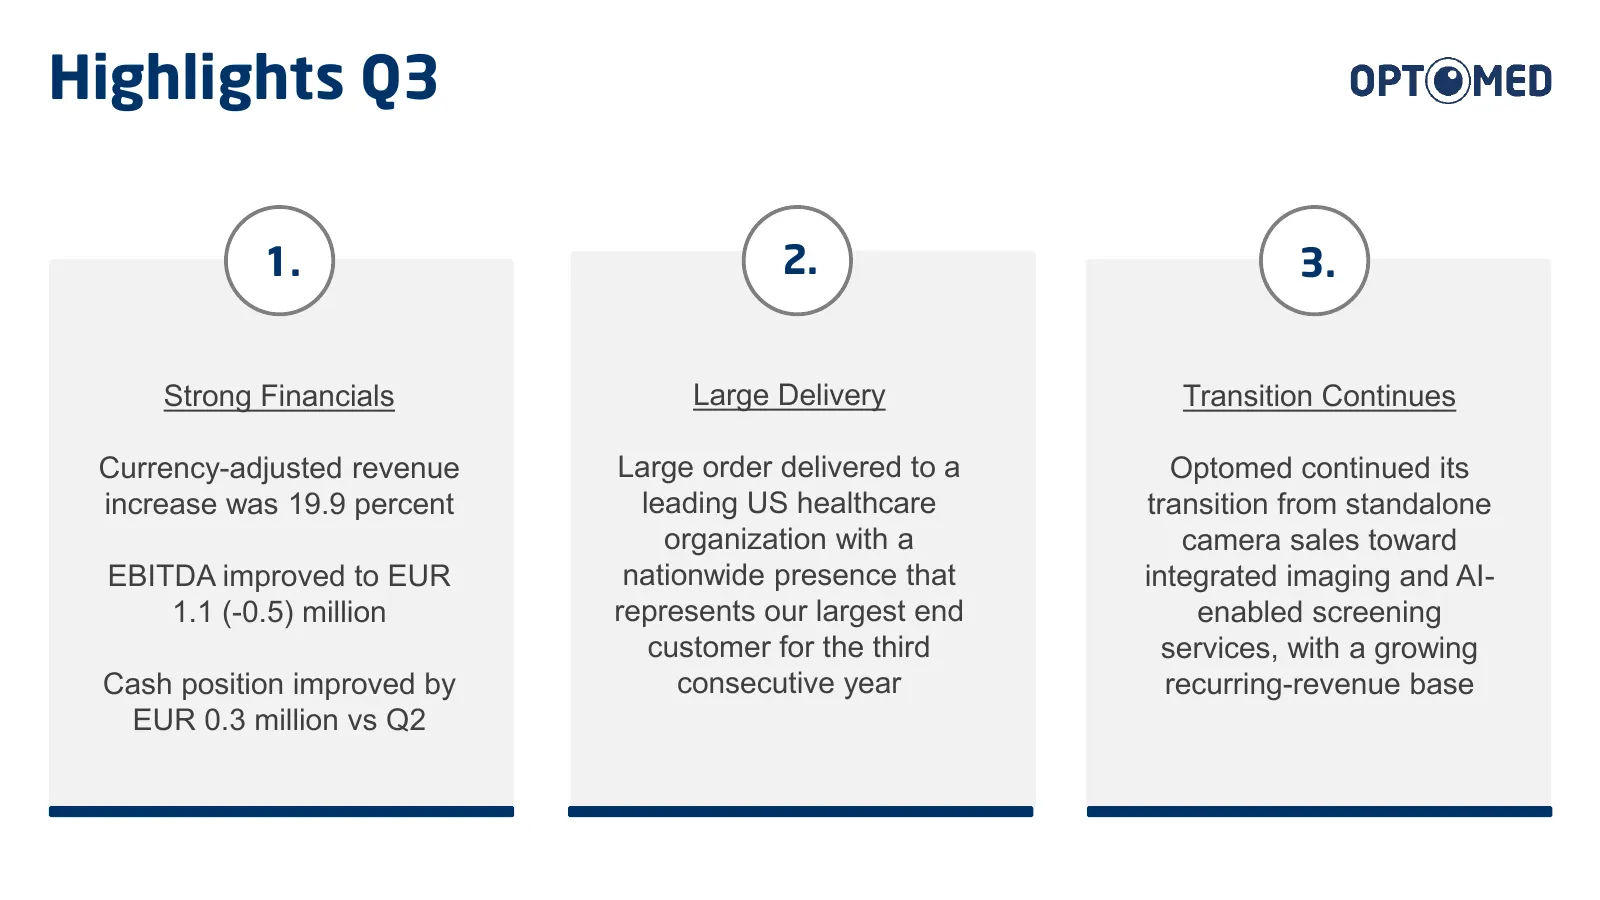
Slide 2: Highlights Q3
Highlights Q3 1. 2. 3. Strong Financials Large Delivery Transition Continues Currency-adjusted revenue Large order delivered to a Optomed continued its increase was 19.9 percent leading US healthcare transition from standalone organization with a camera sales toward EBITDA improved to EUR nationwide
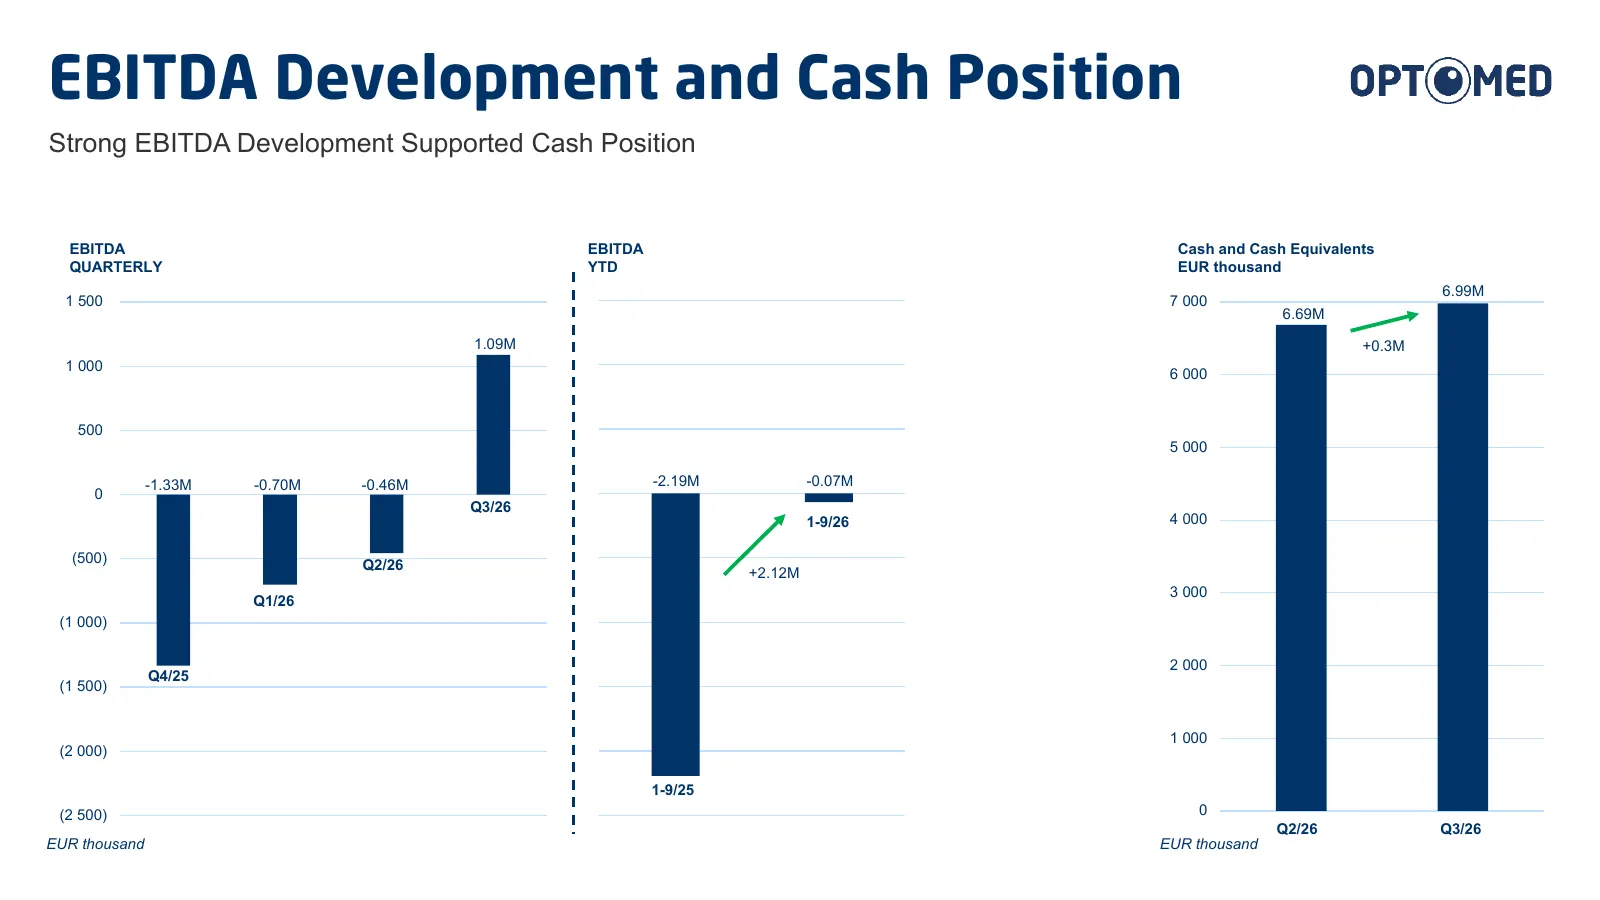
Slide 3: EBITDA Development and Cash Position
EBITDA Development and Cash Position Strong EBITDA Development Supported Cash Position EBITDA EBITDA Cash and Cash Equivalents QUARTERLY YTD EUR thousand 6.99M 1 500 7 000 6.69M 1.09M +0.3M 1 000 6 000 500 5 000 -1.33M -0.70M -0.46M -2.19M -0.07M 0 Q3/26 1-9/26 4 000 (500) Q2/26 +2.12M 3 000 Q1/26 (
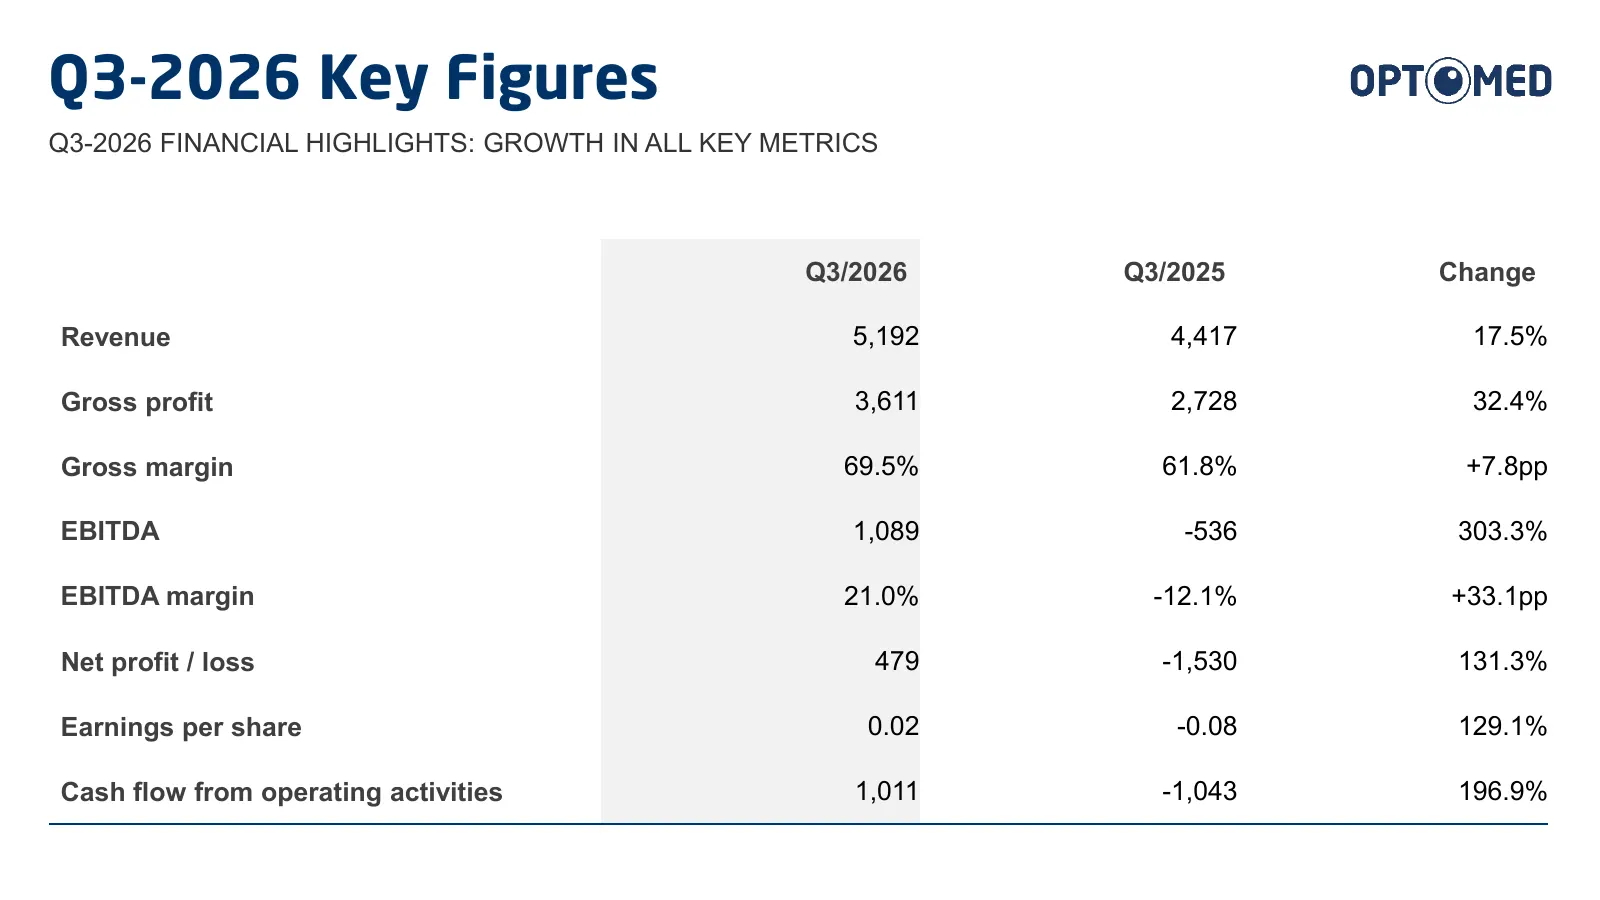
Slide 4: Q3-2026 Key Figures
Q3-2026 Key Figures Q3-2026 FINANCIAL HIGHLIGHTS: GROWTH IN ALL KEY METRICS Q3/2026 Q3/2025 Change Revenue 5,192 4,417 17.5% Gross profit 3,611 2,728 32.4% Gross margin 69.5% 61.8% +7.8pp EBITDA 1,089 -536 303.3% EBITDA margin 21.0% -12.1% +33.1pp Net profit / loss 479 -1,530 131.3% Earnings per sha
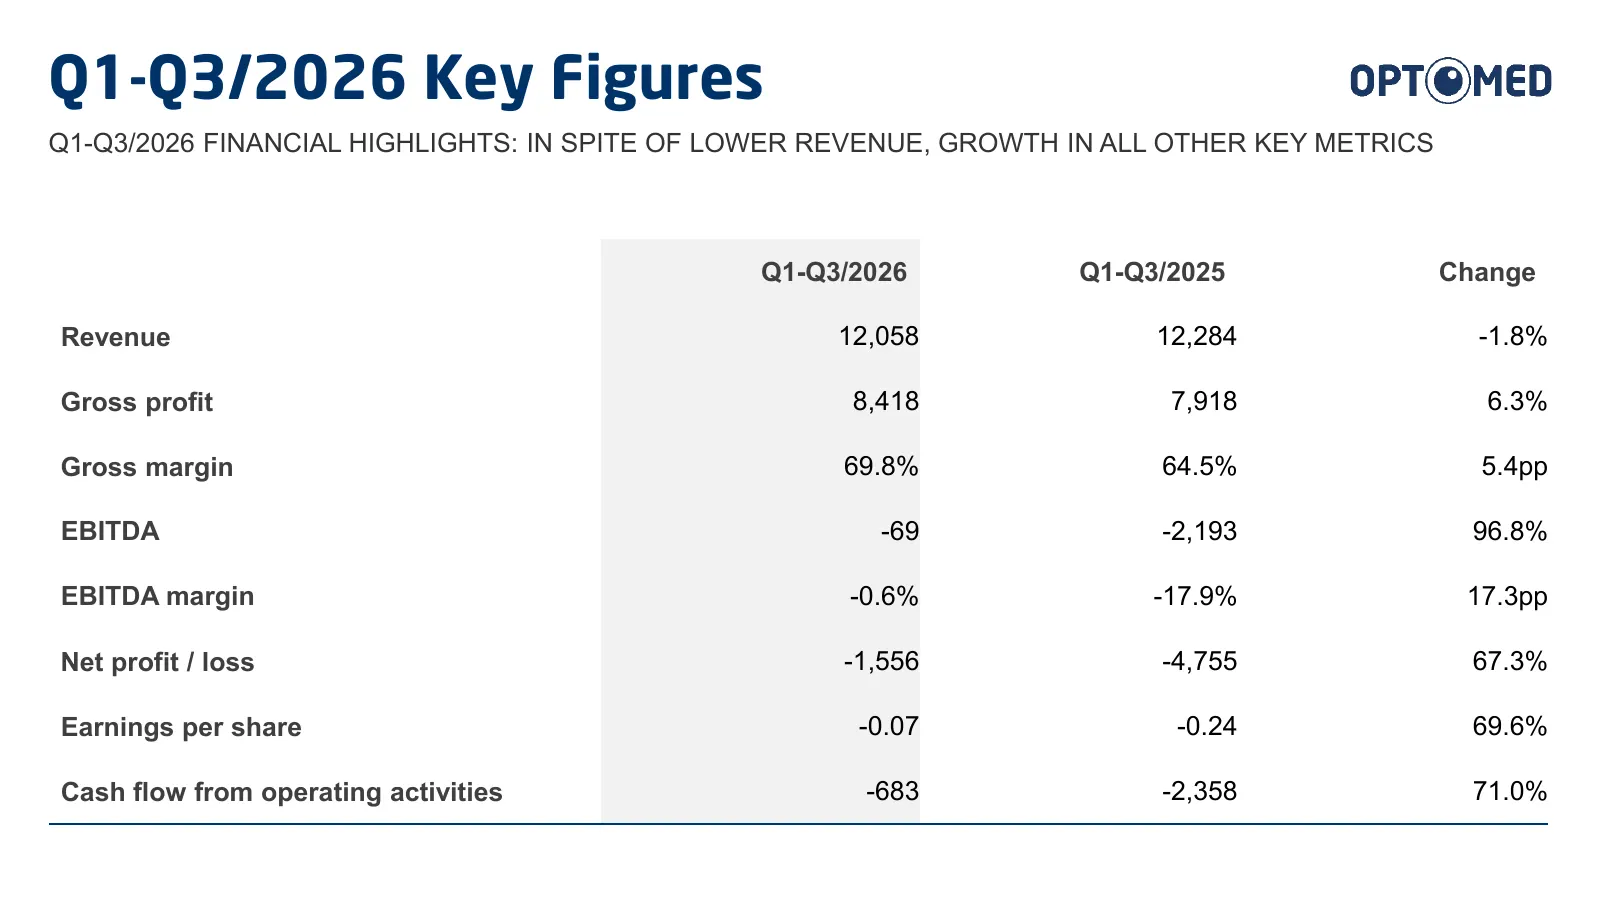
Slide 5: Q1-Q3/2026 Key Figures
Q1-Q3/2026 Key Figures Q1-Q3/2026 FINANCIAL HIGHLIGHTS: IN SPITE OF LOWER REVENUE, GROWTH IN ALL OTHER KEY METRICS Q1-Q3/2026 Q1-Q3/2025 Change Revenue 12,058 12,284 -1.8% Gross profit 8,418 7,918 6.3% Gross margin 69.8% 64.5% 5.4pp EBITDA -69 -2,193 96.8% EBITDA margin -0.6% -17.9% 17.3pp Net profi
Slide 6: Segment highlights
Segment highlights OPT@MED
Slide 7: Devices Segment Q3-2026
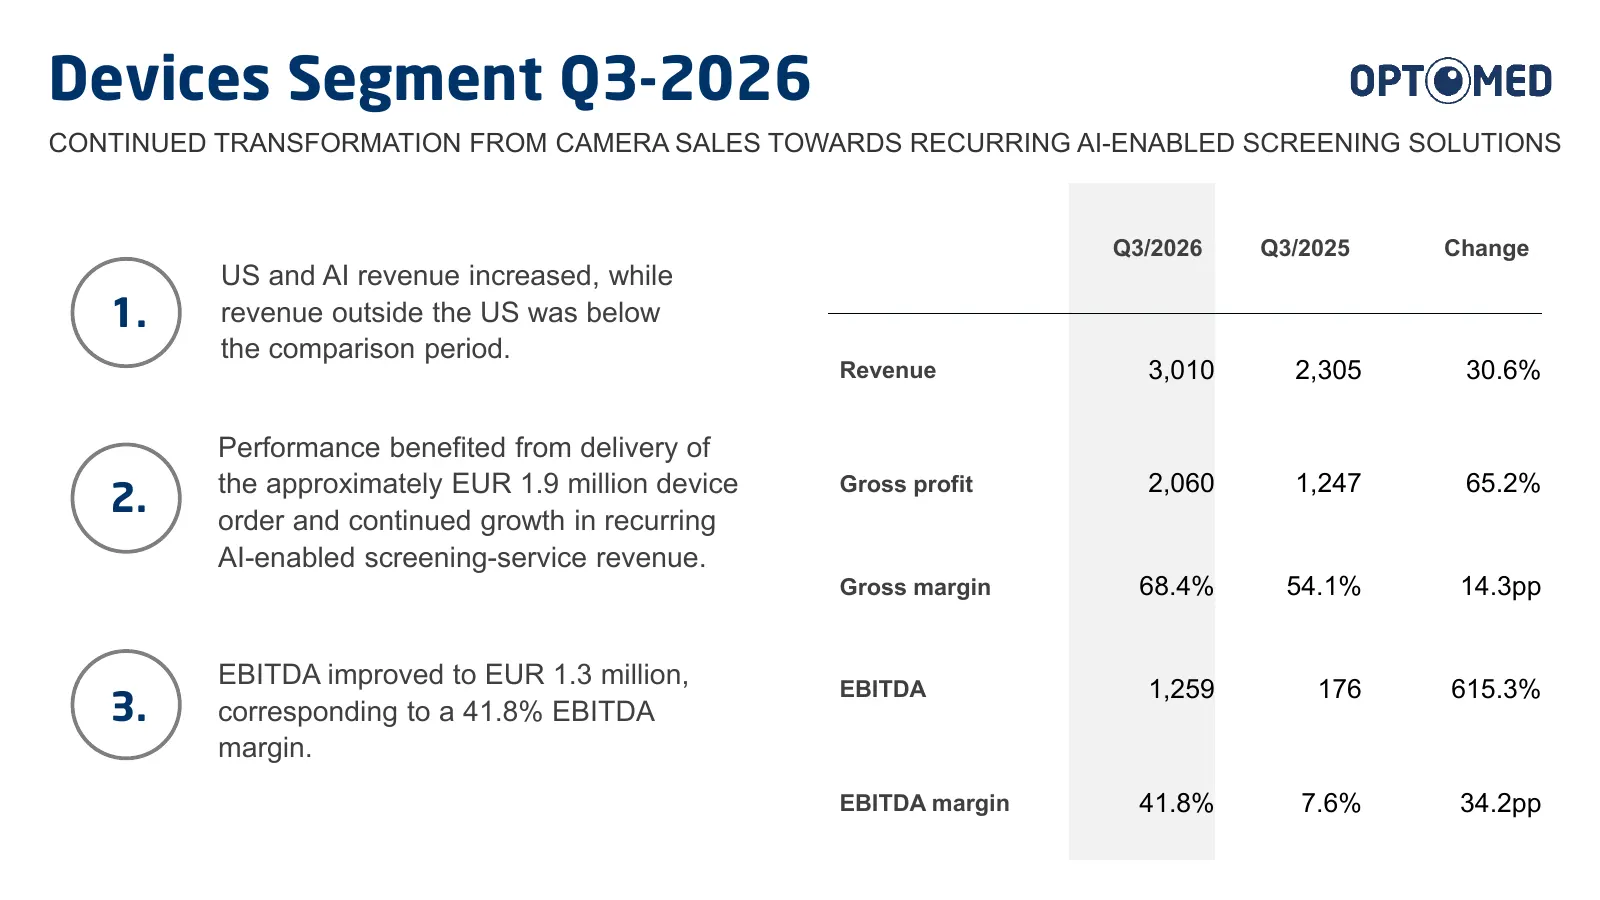
Devices Segment Q3-2026 CONTINUED TRANSFORMATION FROM CAMERA SALES TOWARDS RECURRING AI-ENABLED SCREENING SOLUTIONS Q3/2026 Q3/2025 Change US and AI revenue increased, while 1. revenue outside the US was below the comparison period. Revenue 3,010 2,305 30.6% Performance benefited from delivery of th
Slide 8: Software Segment Q3-2026
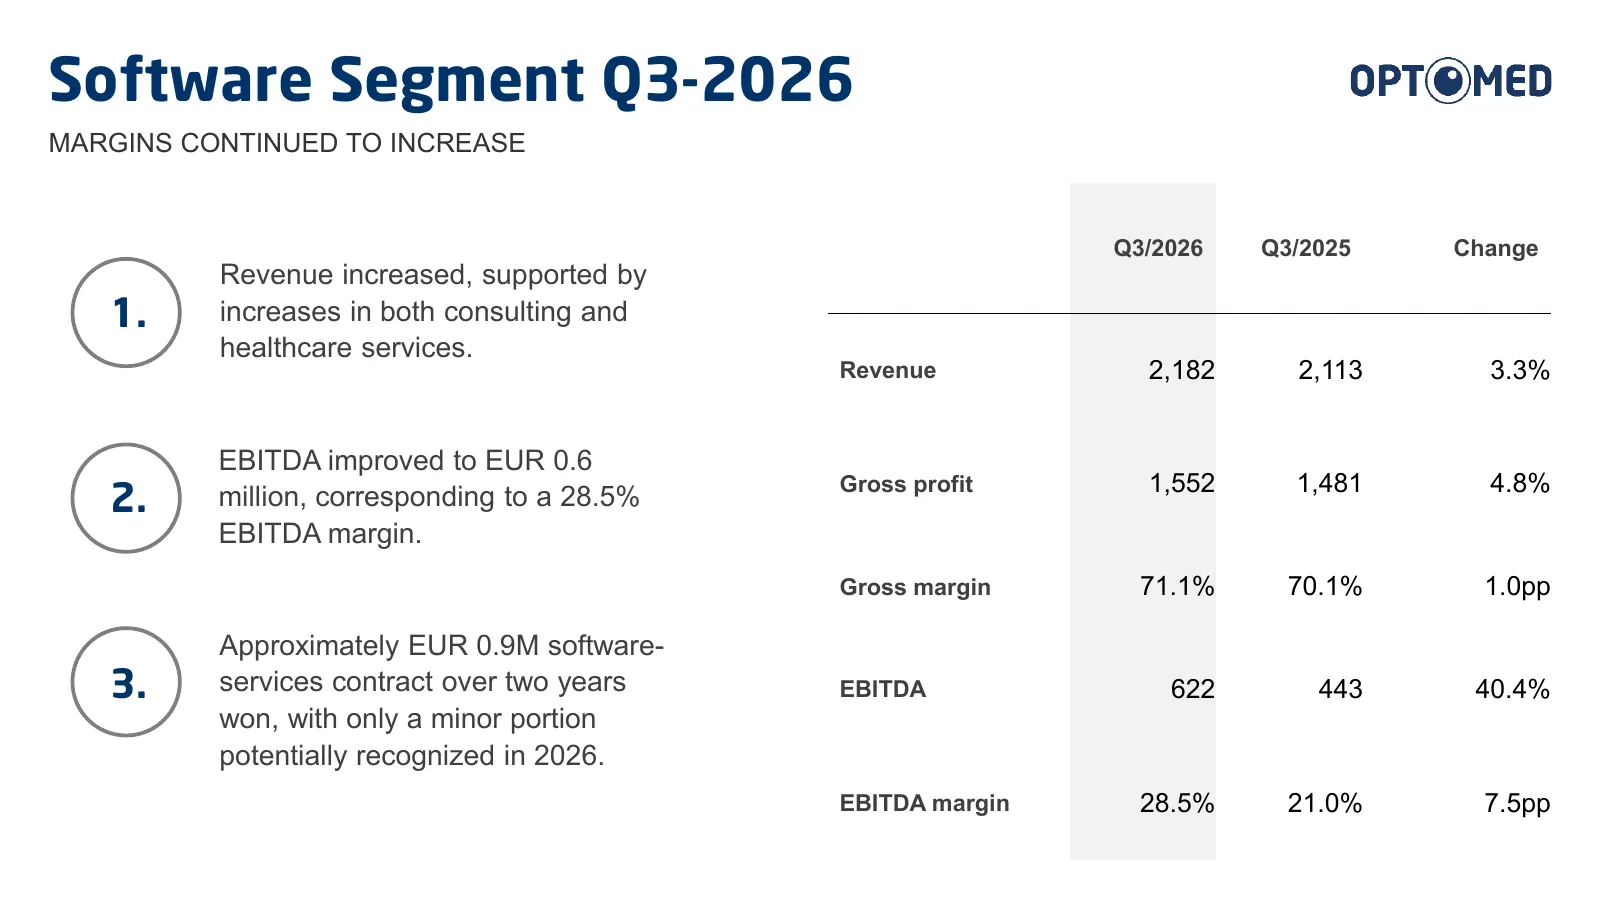
Software Segment Q3-2026 MARGINS CONTINUED TO INCREASE Q3/2026 Q3/2025 Change Revenue increased, supported by 1. increases in both consulting and healthcare services. Revenue 2,182 2,113 3.3% EBITDA improved to EUR 0.6 Gross profit 1,552 1,481 4.8% 2. million, corresponding to a 28.5% EBITDA margin.
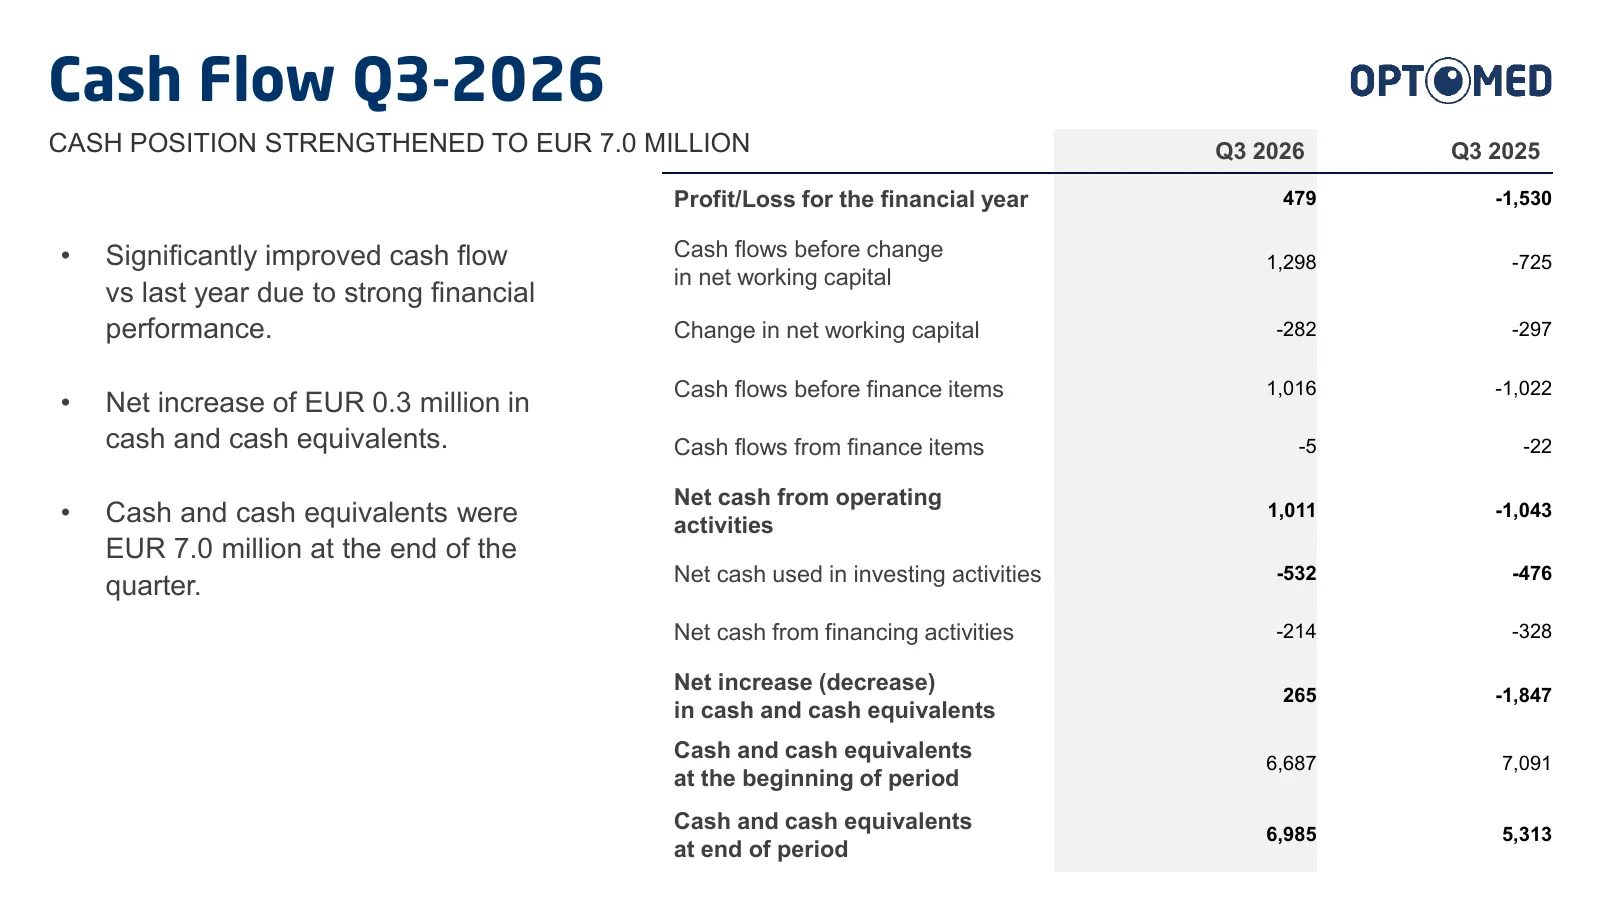
Slide 9: Cash Flow Q3-2026
Cash Flow Q3-2026 CASH POSITION STRENGTHENED TO EUR 7.0 MILLION Q3 2026 Q3 2025 Profit/Loss for the financial year 479 -1,530 • Significantly improved cash flow Cash flows before change 1,298 -725 in net working capital vs last year due to strong financial performance. Change in net working capital
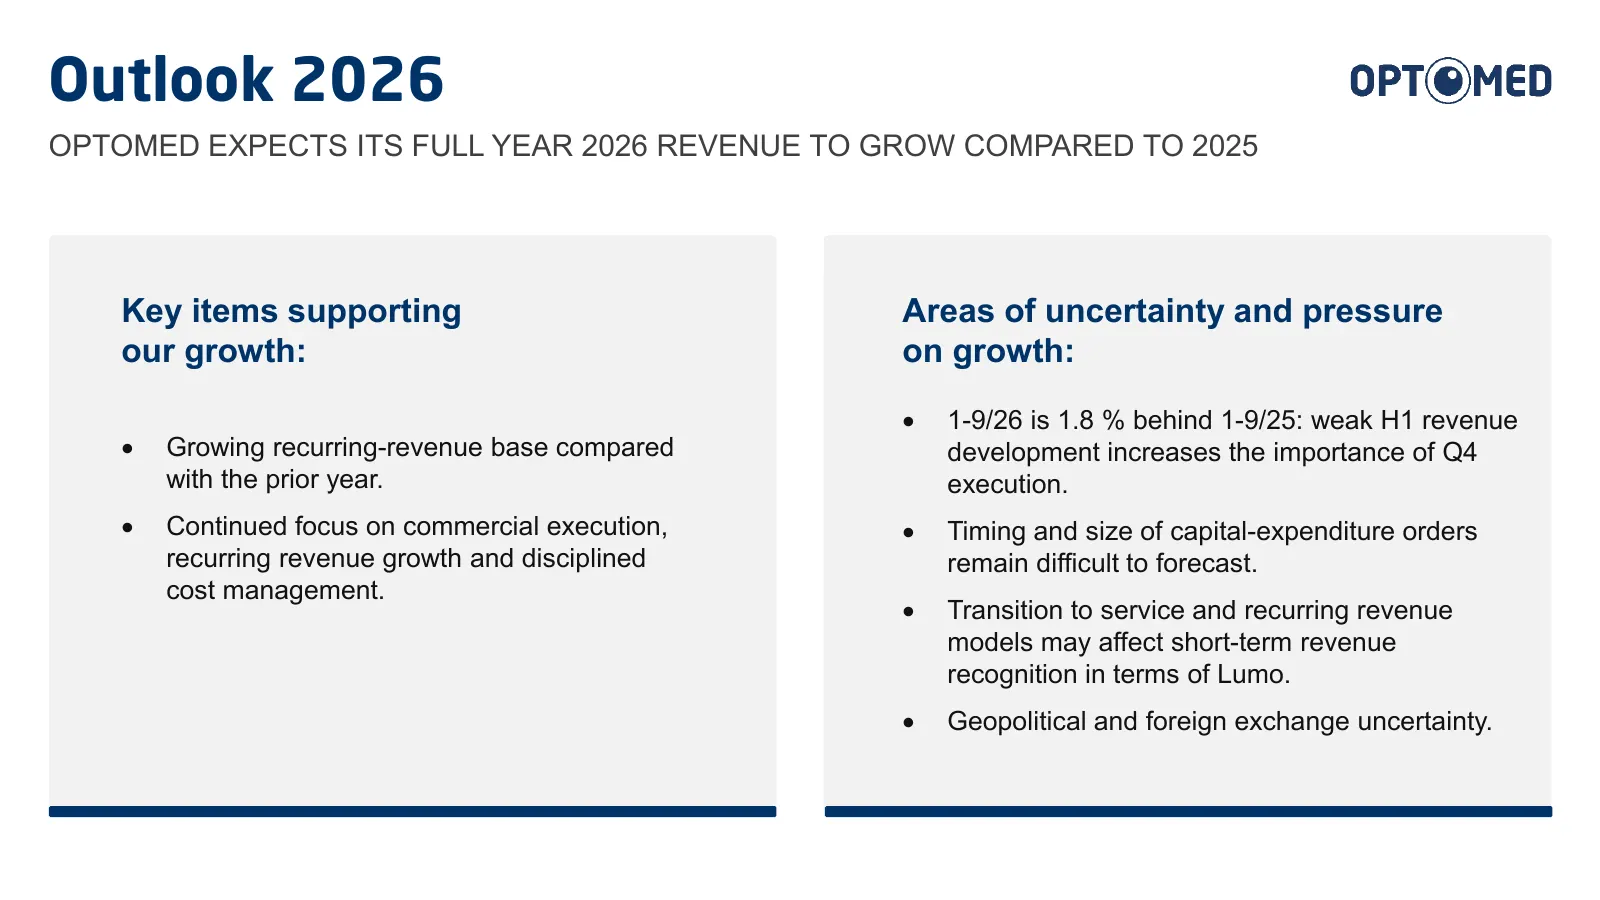
Slide 10: Outlook 2026
Outlook 2026 OPTOMED EXPECTS ITS FULL YEAR 2026 REVENUE TO GROW COMPARED TO 2025 Key items supporting Areas of uncertainty and pressure our growth: on growth: • 1-9/26 is 1.8 % behind 1-9/25: weak H1 revenue • Growing recurring-revenue base compared development increases the importance of Q4 with th
Slide 11: Q3-2026 in summary
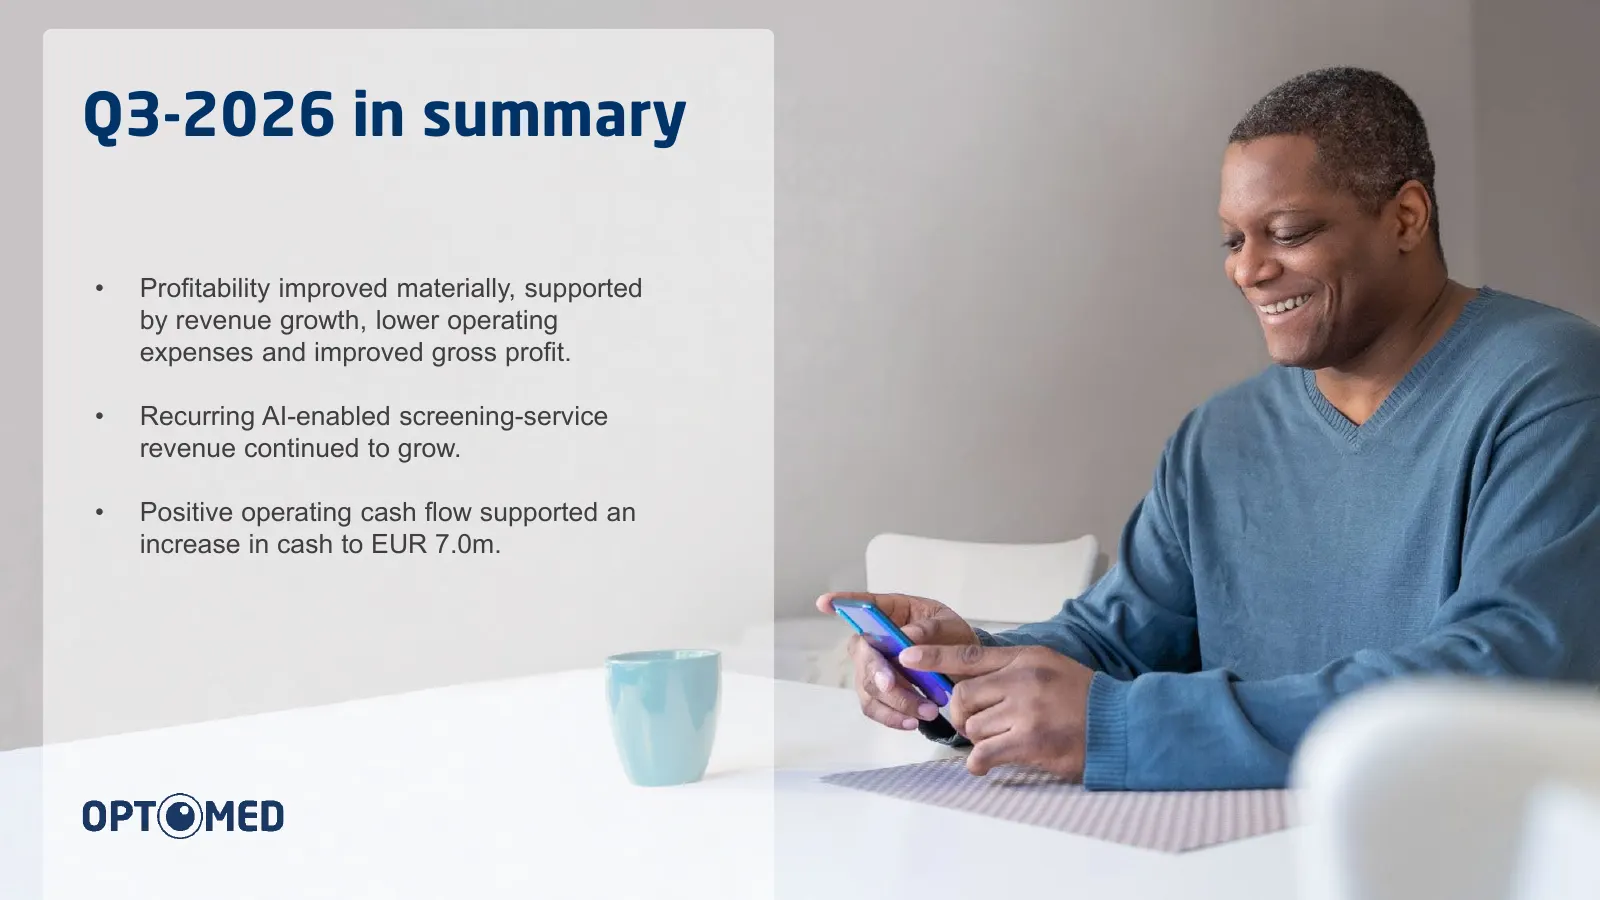
Q3-2026 in summary • Profitability improved materially, supported by revenue growth, lower operating expenses and improved gross profit. • Recurring AI-enabled screening-service revenue continued to grow. • Positive operating cash flow supported an increase in cash to EUR 7.0m.
Slide 12: Appendix
Appendix OPT@MED
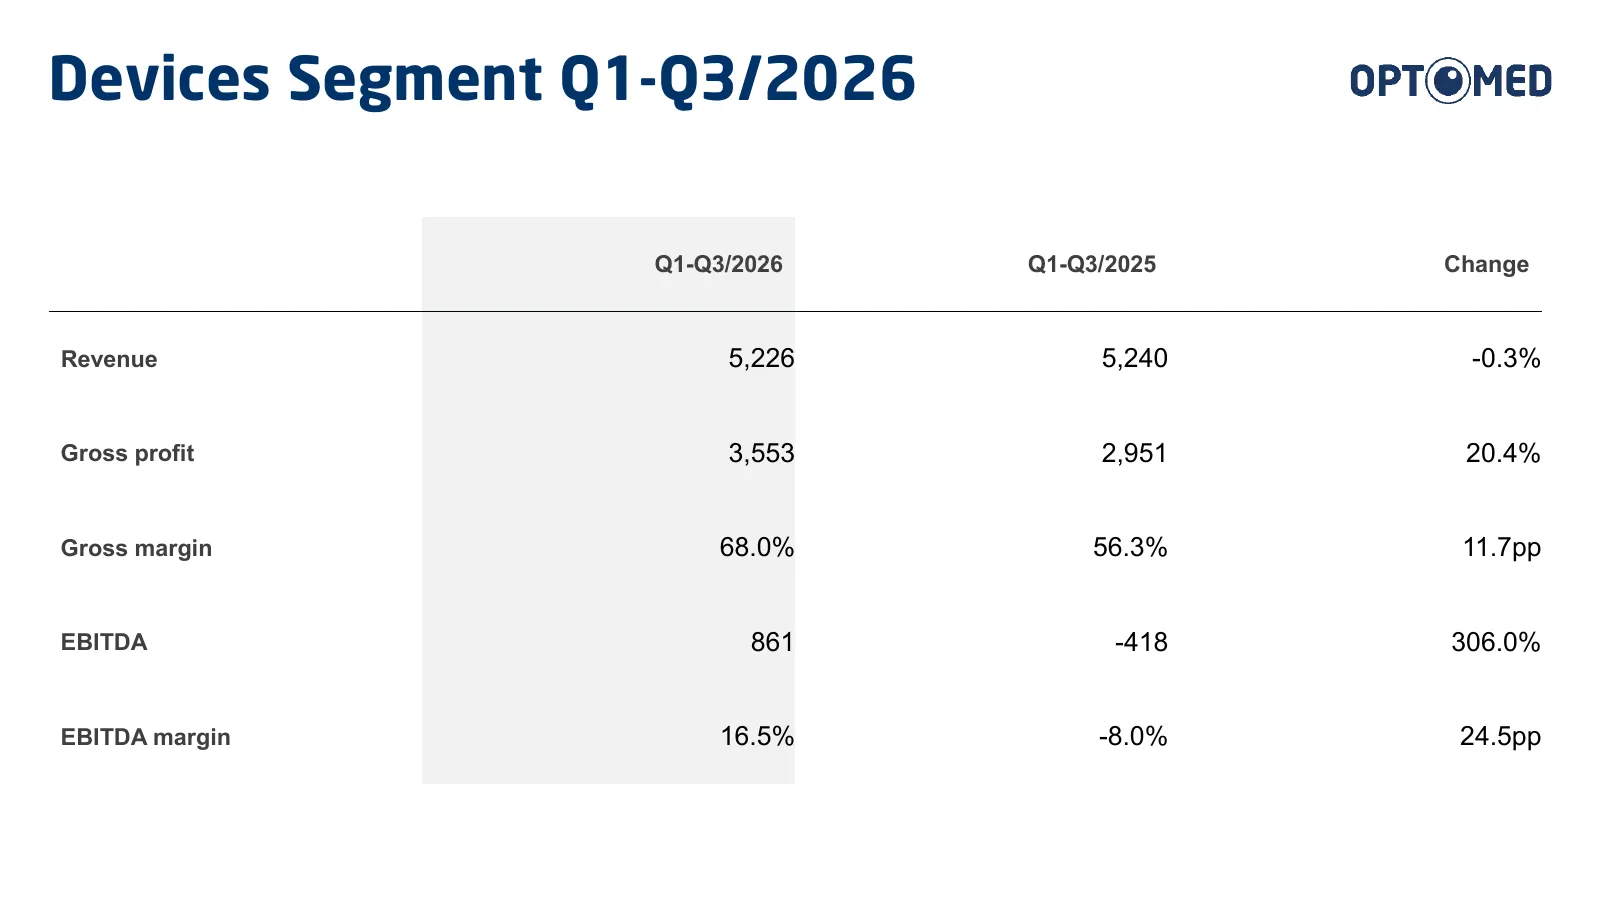
Slide 13: Devices Segment Q1-Q3/2026
Devices Segment Q1-Q3/2026 Q1-Q3/2026 Q1-Q3/2025 Change Revenue 5,226 5,240 -0.3% Gross profit 3,553 2,951 20.4% Gross margin 68.0% 56.3% 11.7pp EBITDA 861 -418 306.0% EBITDA margin 16.5% -8.0% 24.5pp
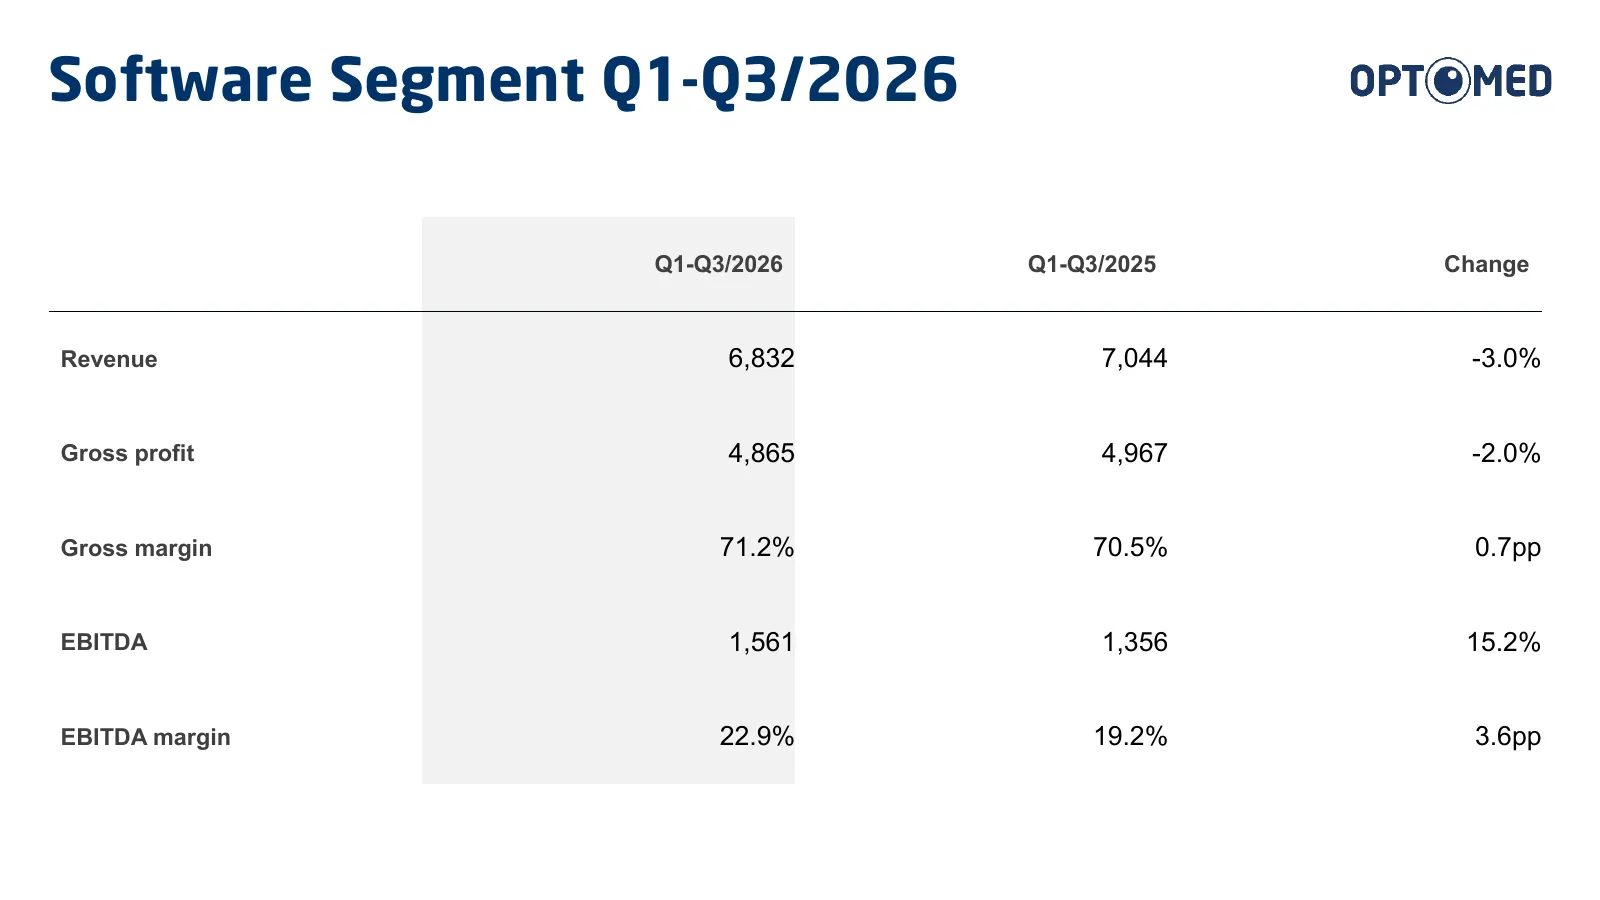
Slide 14: Software Segment Q1-Q3/2026
Software Segment Q1-Q3/2026 Q1-Q3/2026 Q1-Q3/2025 Change Revenue 6,832 7,044 -3.0% Gross profit 4,865 4,967 -2.0% Gross margin 71.2% 70.5% 0.7pp EBITDA 1,561 1,356 15.2% EBITDA margin 22.9% 19.2% 3.6pp
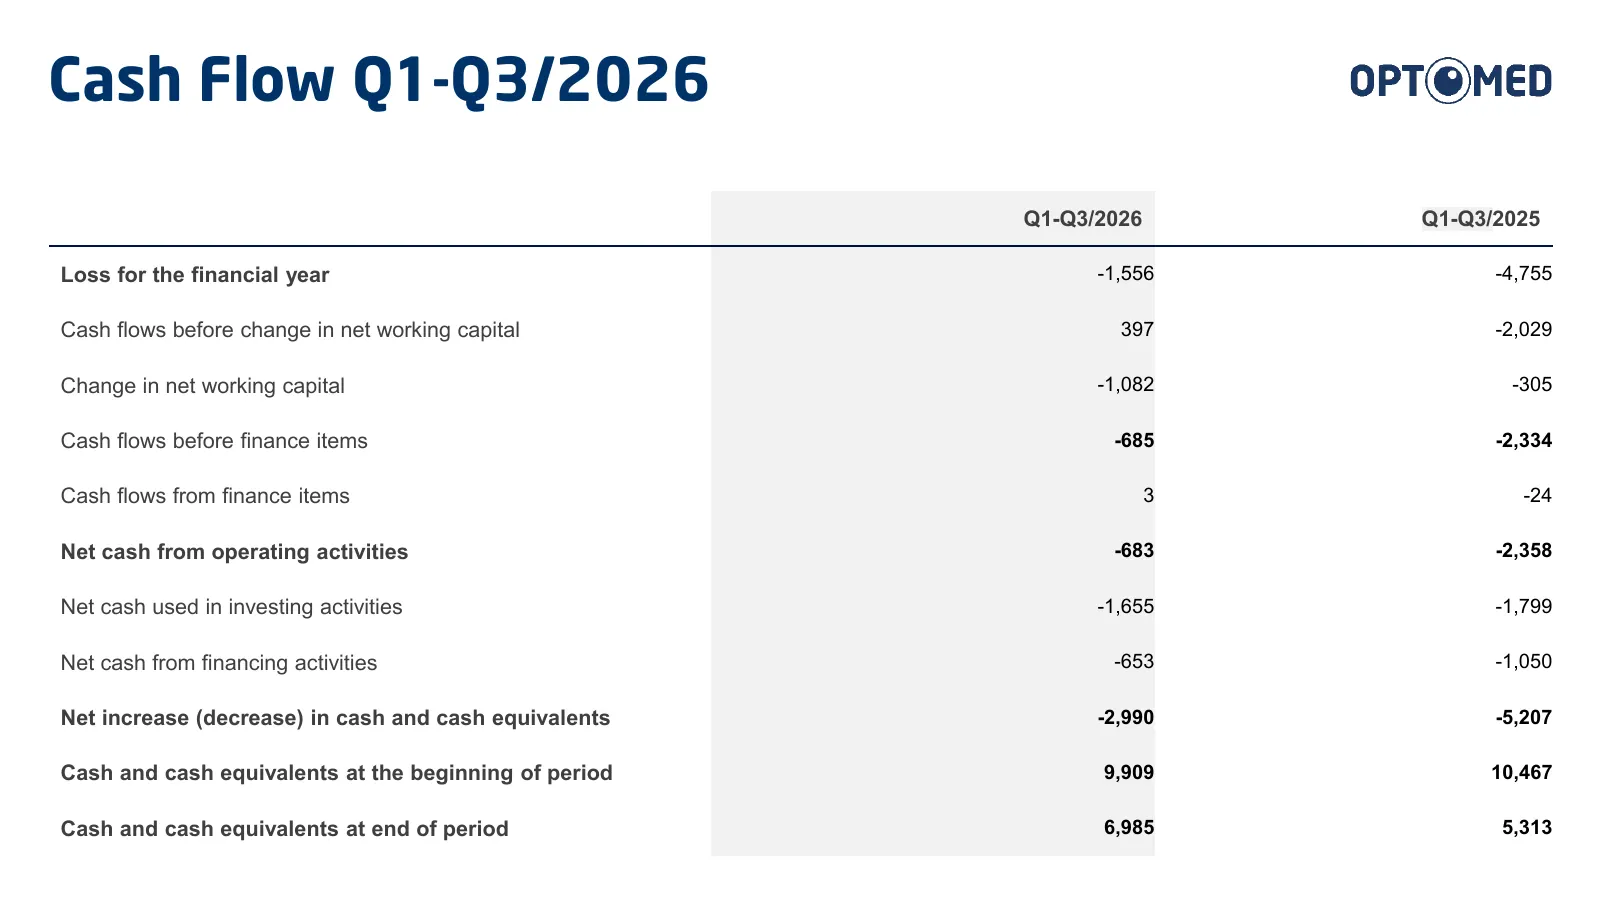
Slide 15: Cash Flow Q1-Q3/2026
Cash Flow Q1-Q3/2026 Q1-Q3/2026 Q1-Q3/2025 Loss for the financial year -1,556 -4,755 Cash flows before change in net working capital 397 -2,029 Change in net working capital -1,082 -305 Cash flows before finance items -685 -2,334 Cash flows from finance items 3 -24 Net cash from operating activities
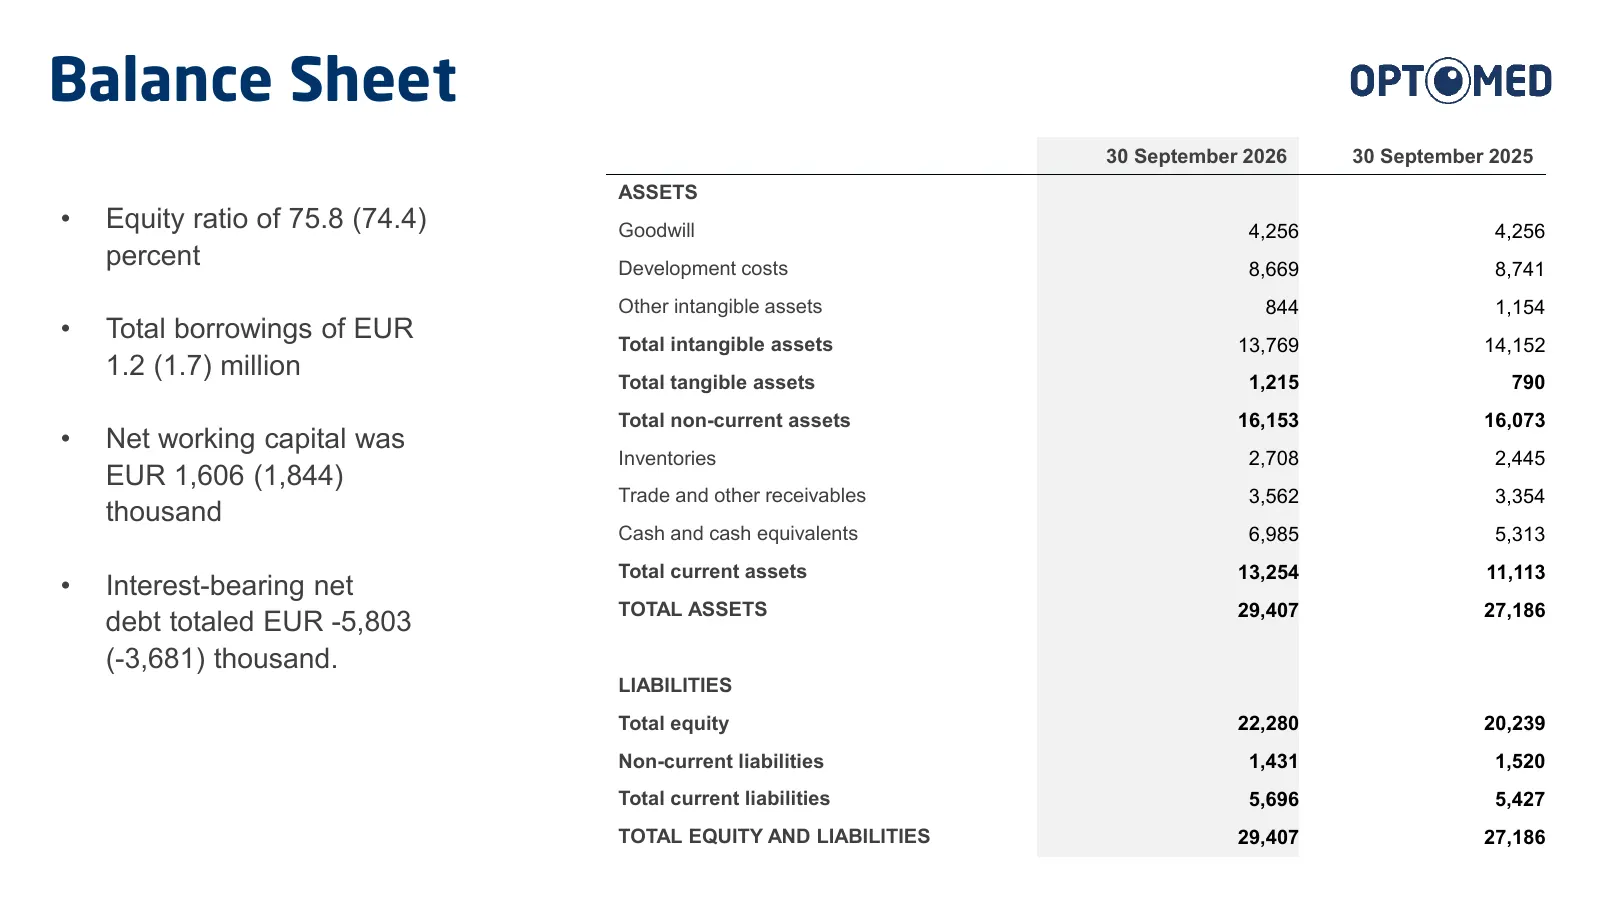
Slide 16: Balance Sheet
Balance Sheet 30 September 2026 30 September 2025 ASSETS • Equity ratio of 75.8 (74.4) Goodwill 4,256 4,256 percent Development costs 8,669 8,741 Other intangible assets 844 1,154 • Total borrowings of EUR Total intangible assets 13,769 14,152 1.2 (1.7) million Total tangible assets 1,215 790 Total
Source: company website
More decks from Optomed Oyj Class A
 Q2 2026 Earnings Presentation16 slides · Aug 14, 2026
 Q4 2025 Earnings Presentation16 slides · Feb 10, 2026
 Q3 2025 Earnings Presentation16 slides · Nov 6, 2025
 Q2 2025 Earnings Presentation16 slides · Aug 7, 2025
 Q1 2025 Earnings Presentation11 slides · May 6, 2025
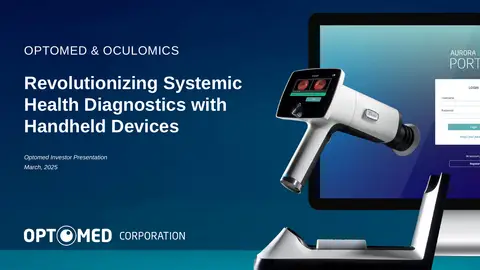 Investor Presentation (March 2025)12 slides · March 2025