Barratt Redrow plc · LSE:BTRW
Barratt Redrow — Barratt Developments — FY2012 Earnings Presentation
60 slides from Barratt Redrow's earnings presentation, Sep 12, 2012
Slide 1: Results presentation, full year ended 30 June 2012
Full Year 2012 1 Results presentation Full year ended 30 June 2012 12 September 2012
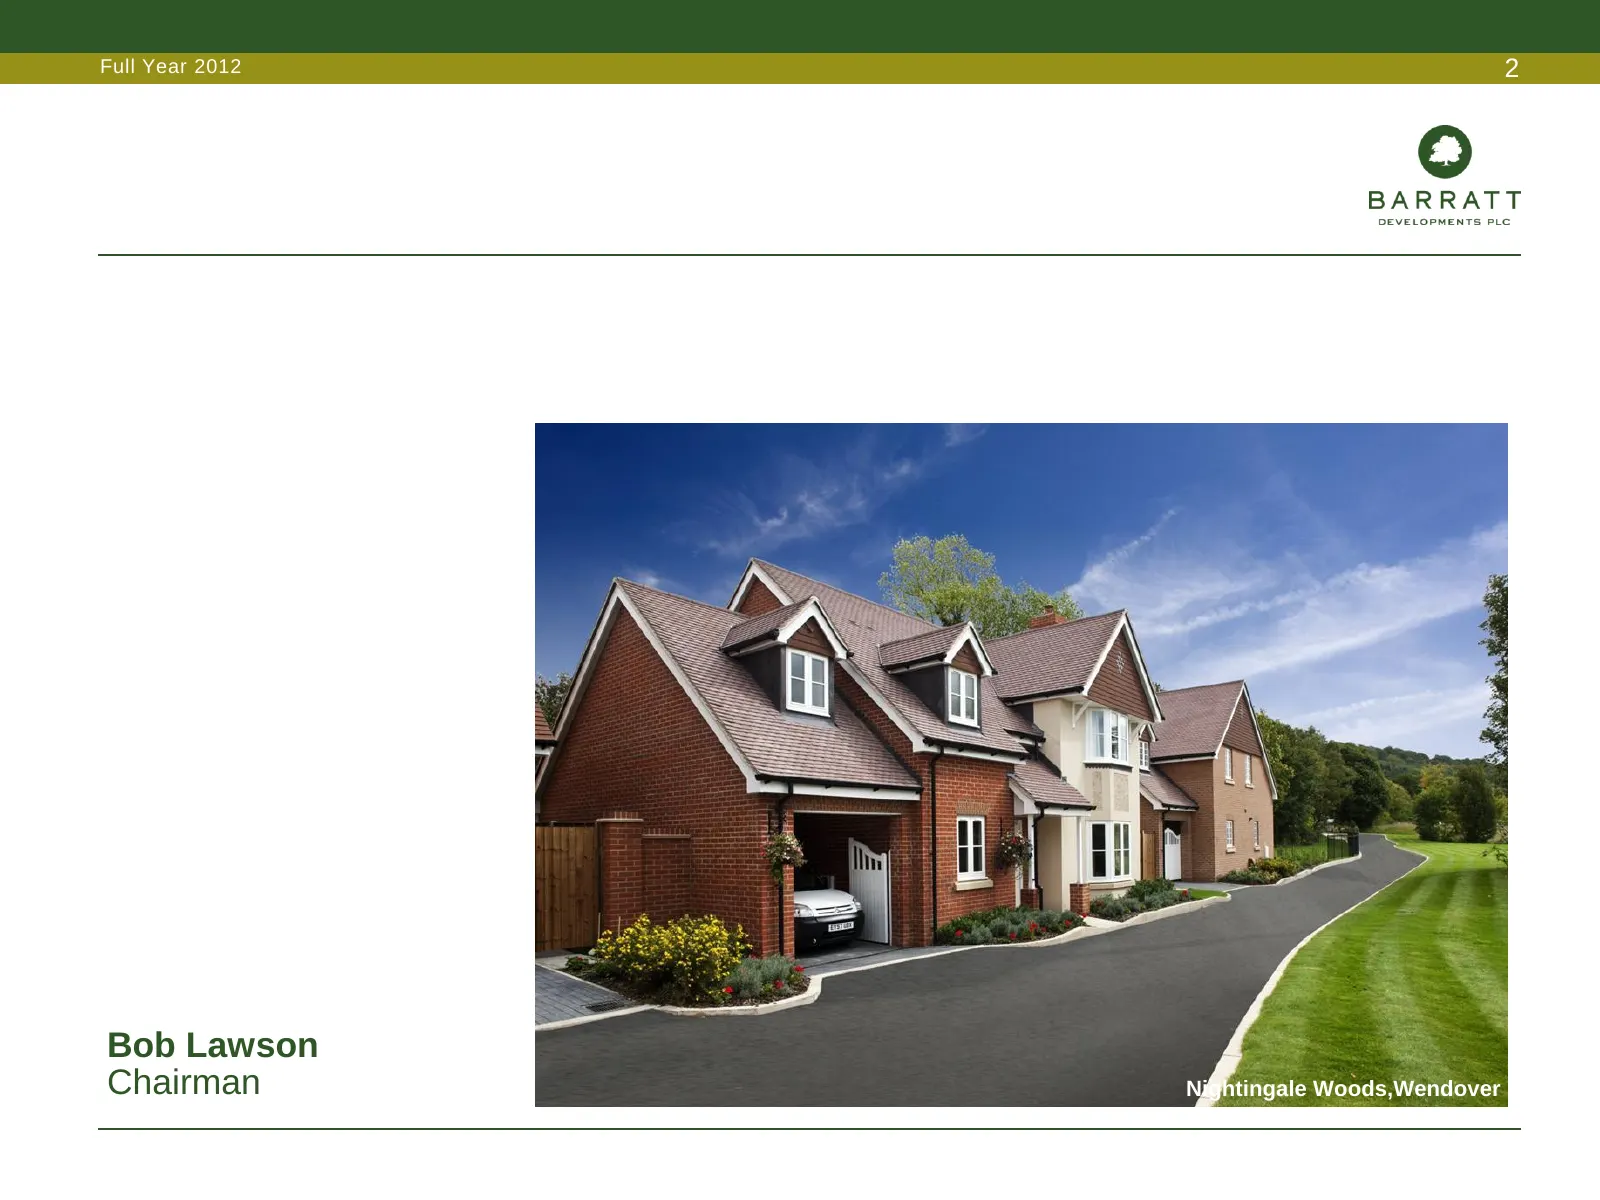
Slide 2: Bob Lawson, Chairman
Full Year 2012 2 Bob Lawson Chairman Nightingale Woods,Wendover
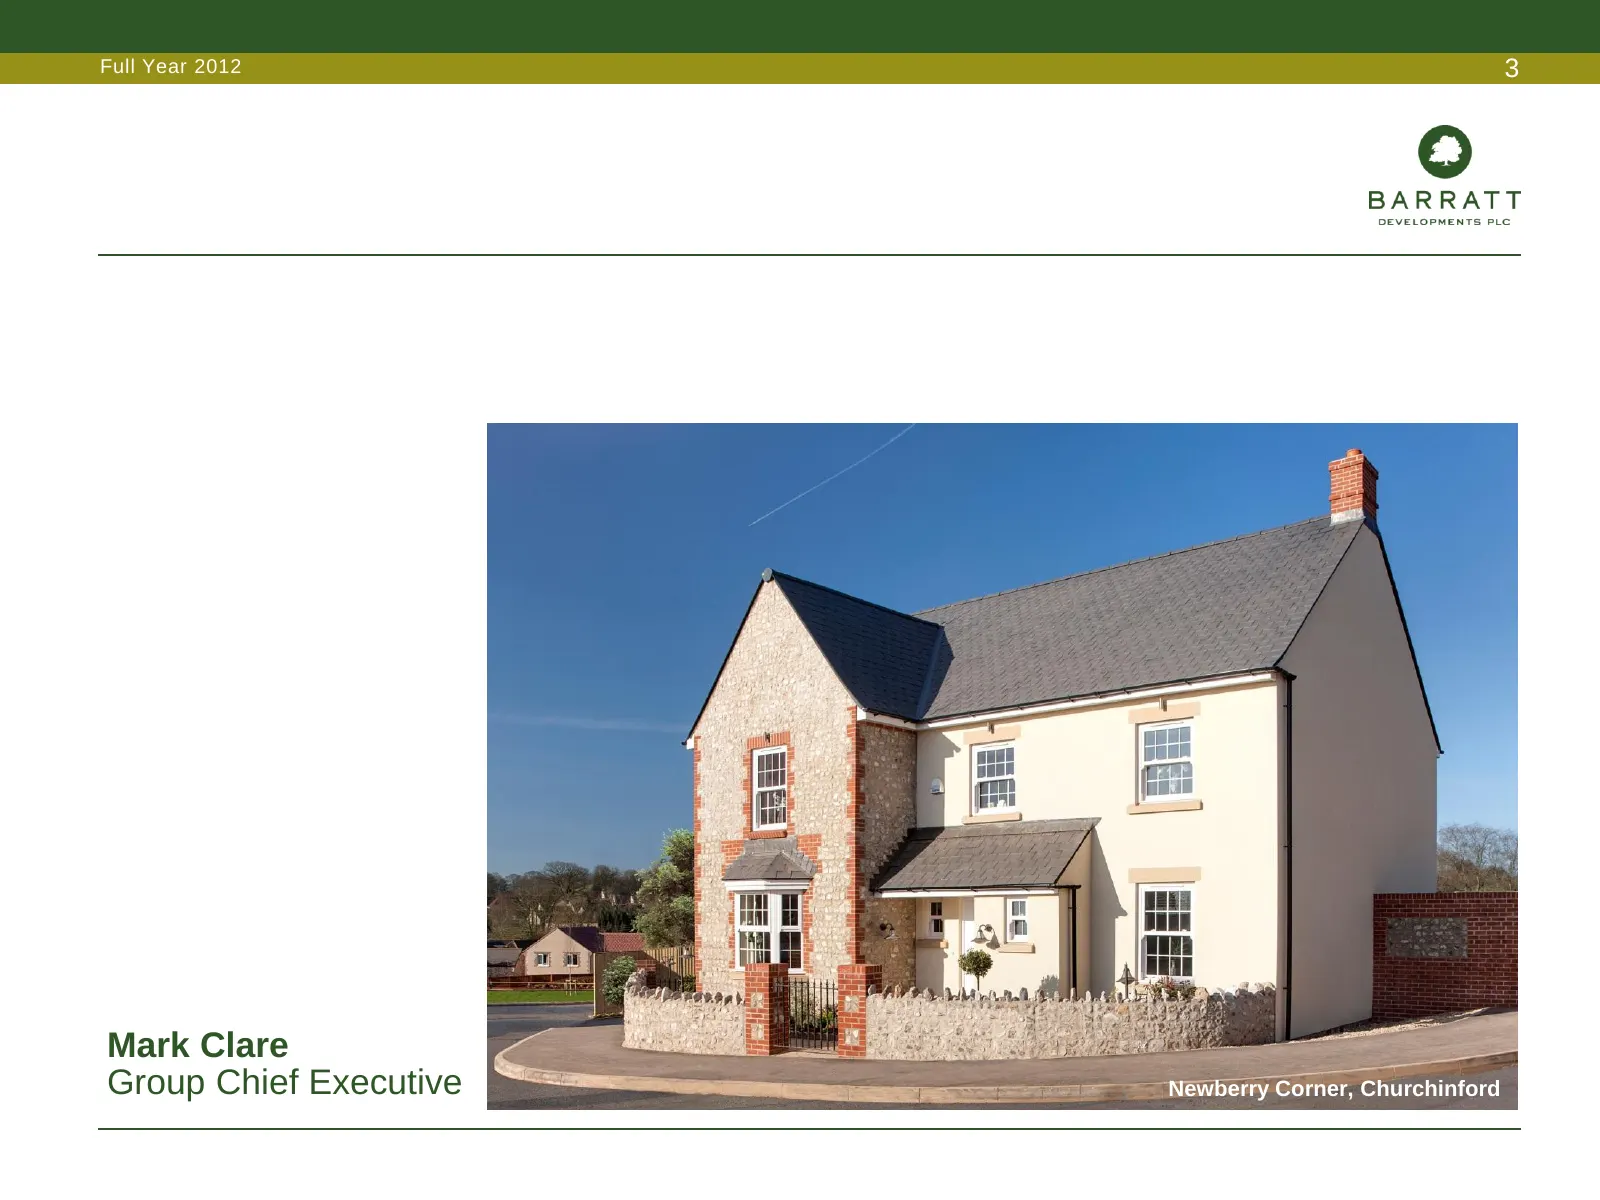
Slide 3: Mark Clare, Group Chief Executive
Full Year 2012 3 Mark Clare Group Chief Executive Newberry Corner, Churchinford
Slide 4: Overview
Full Year 2012 4 Overview • Key highlights • Market backdrop, lending & Government support • Key objectives • Sizing the business & land supply • Targeted funding structure & dividend policy • Current trading & outlook
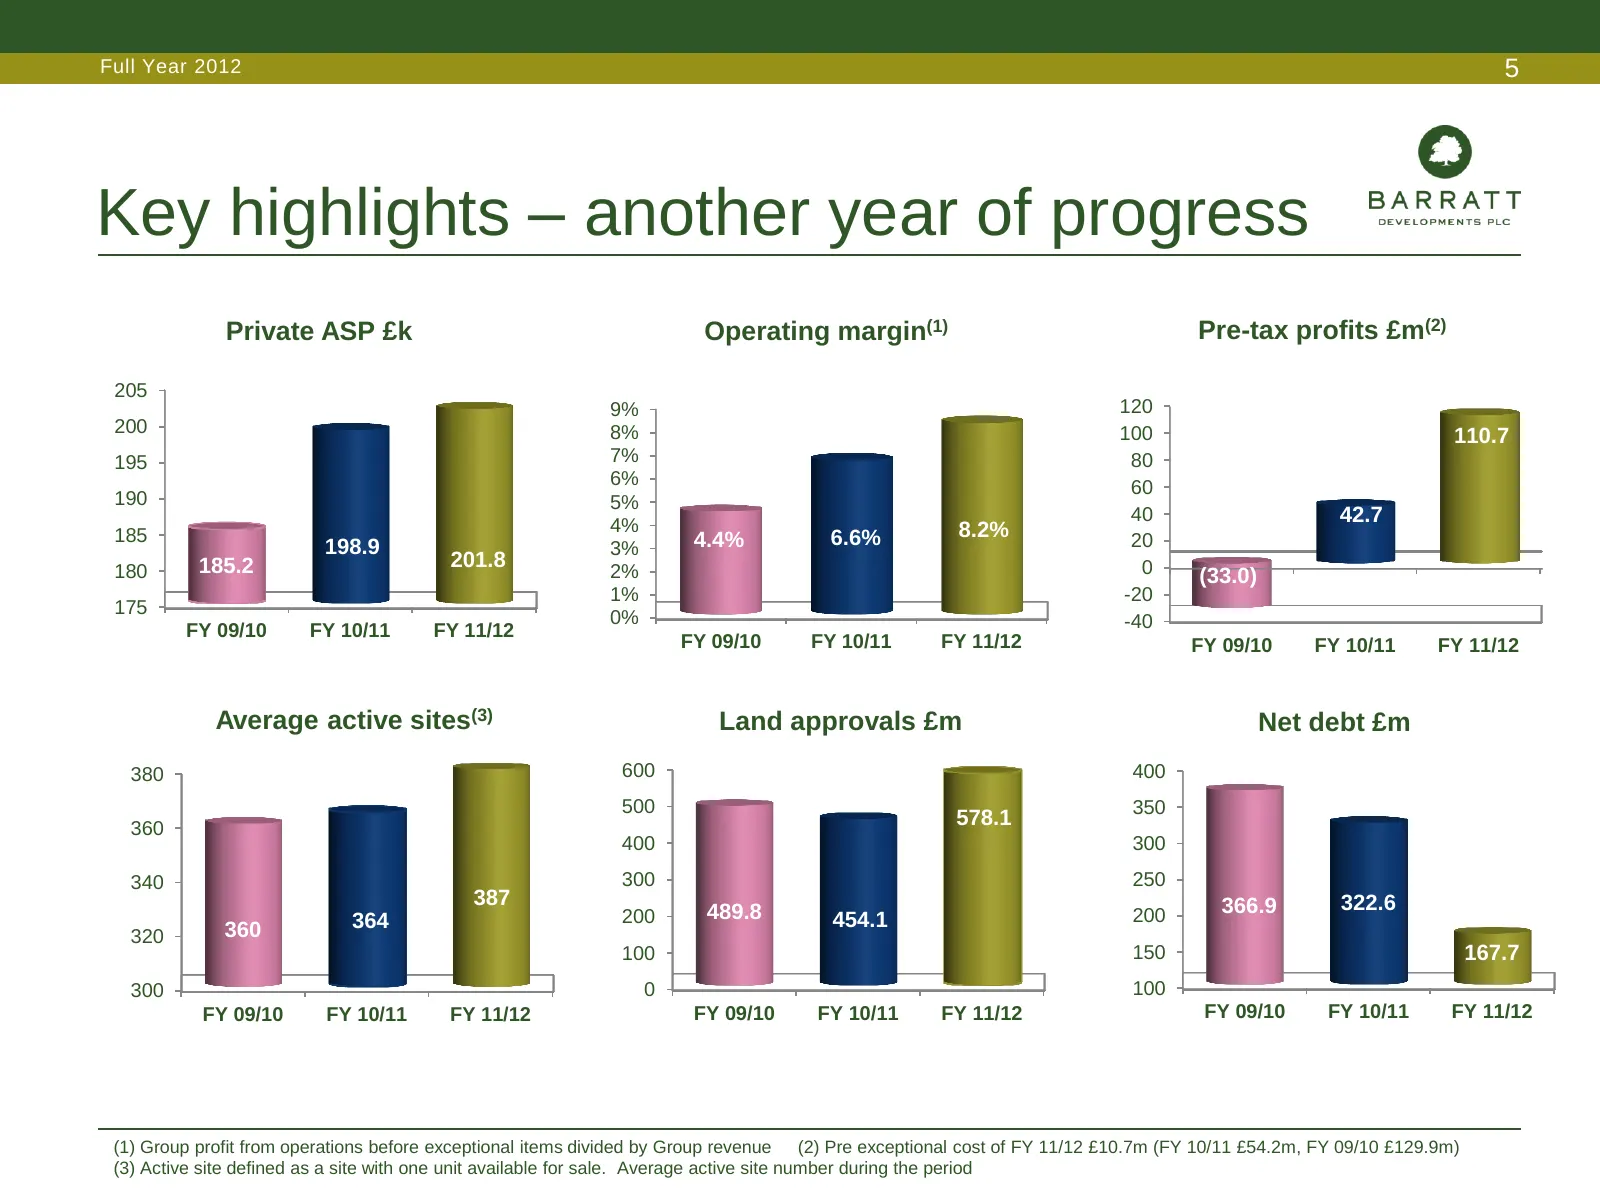
Slide 5: Key highlights – another year of progress
Full Year 2012 5 Key highlights – another year of progress Private ASP £k Operating margin(1) Pre-tax profits £m(2) 205 9% 120 200 8% 100 110.7 195 7% 80 6% 60 190 5% 4% 40 42.7 185 4.4% 6.6% 8.2% 20 198.9 3% 180 185.2 201.8 0 2% (33.0) 1% -20 175 0% -40 FY 09/10 FY 10/11 FY 11/12 FY 09/10 FY 10/11
Slide 6: Market backdrop
Full Year 2012 6 Market backdrop • Greater stability in market conditions • Strongest spring selling season for five years • Overall, underlying selling prices broadly stable – continued regional variation, with greater robustness in the South East and London • Some easing of mortgage availability –
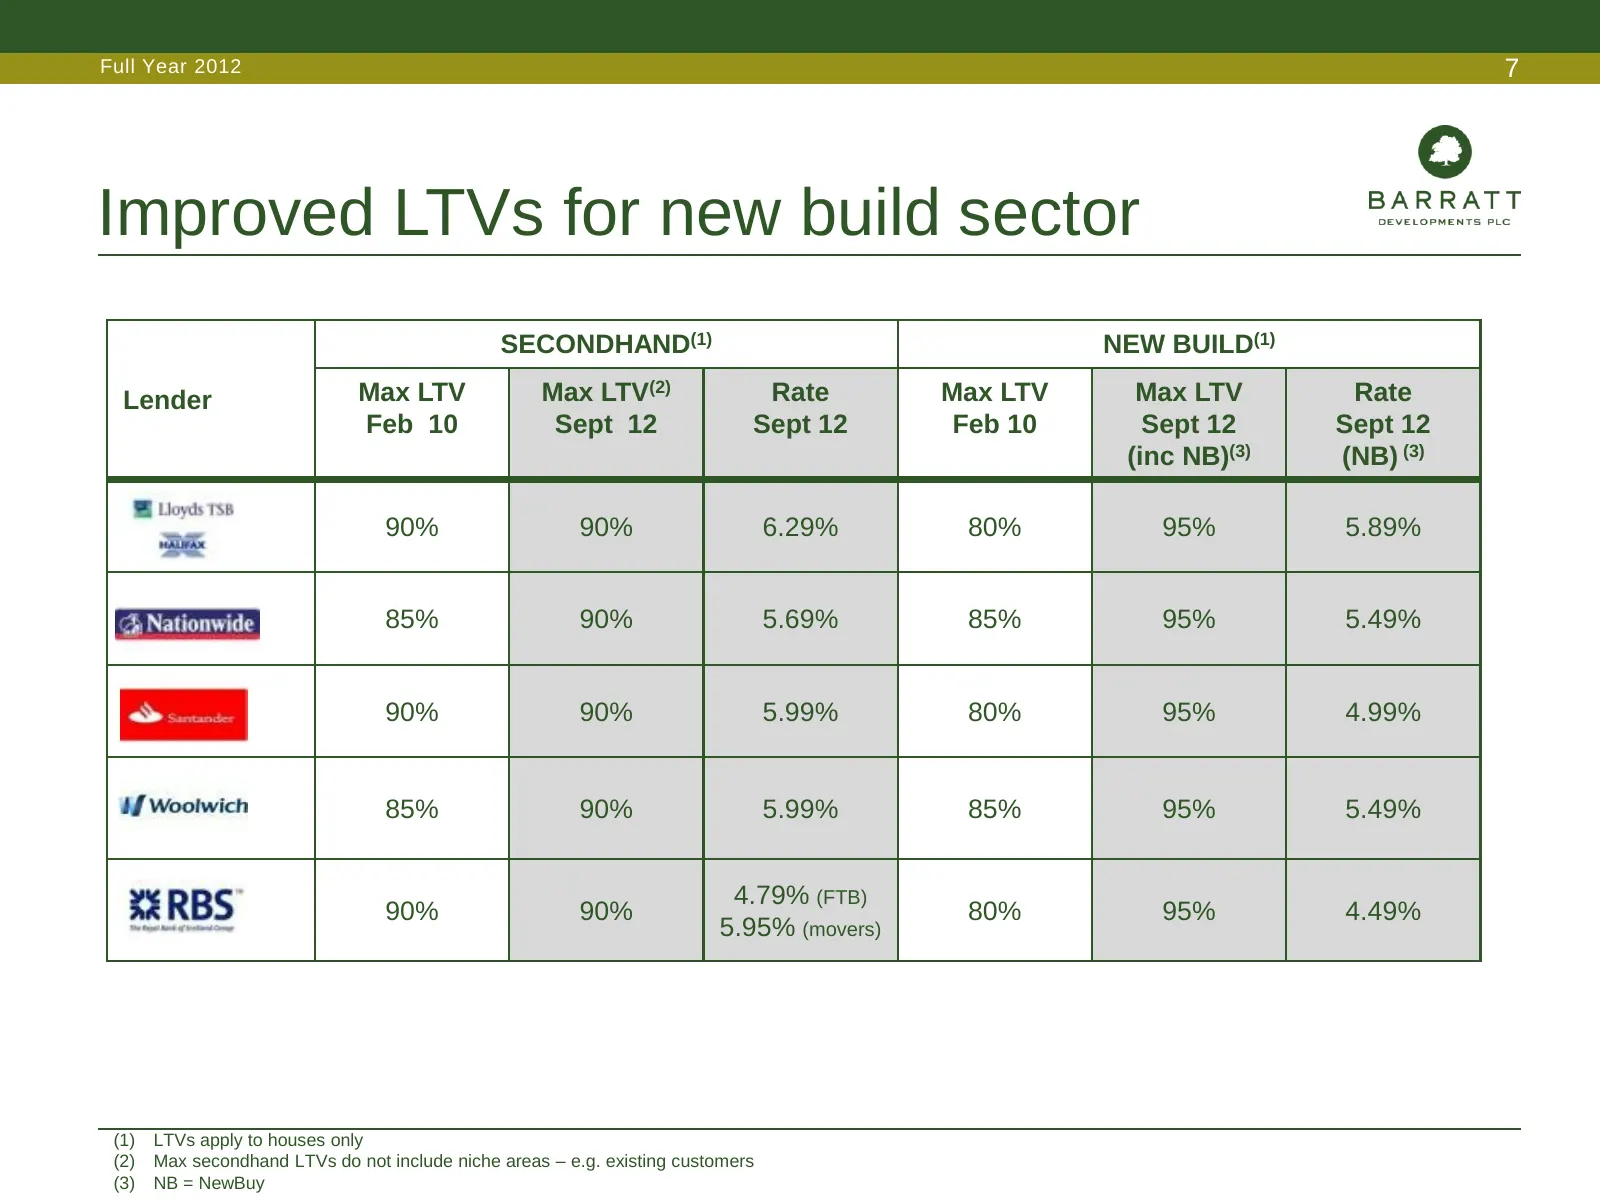
Slide 7: Improved LTVs for new build sector
Full Year 2012 7 Improved LTVs for new build sector SECONDHAND(1) NEW BUILD(1) Lender Max LTV Max LTV(2) Rate Max LTV Max LTV Rate Feb 10 Sept 12 Sept 12 Feb 10 Sept 12 Sept 12 (inc NB)(3) (NB) (3) 90% 90% 6.29% 80% 95% 5.89% 85% 90% 5.69% 85% 95% 5.49% 90% 90% 5.99% 80% 95% 4.99% 85% 90% 5.99% 85%
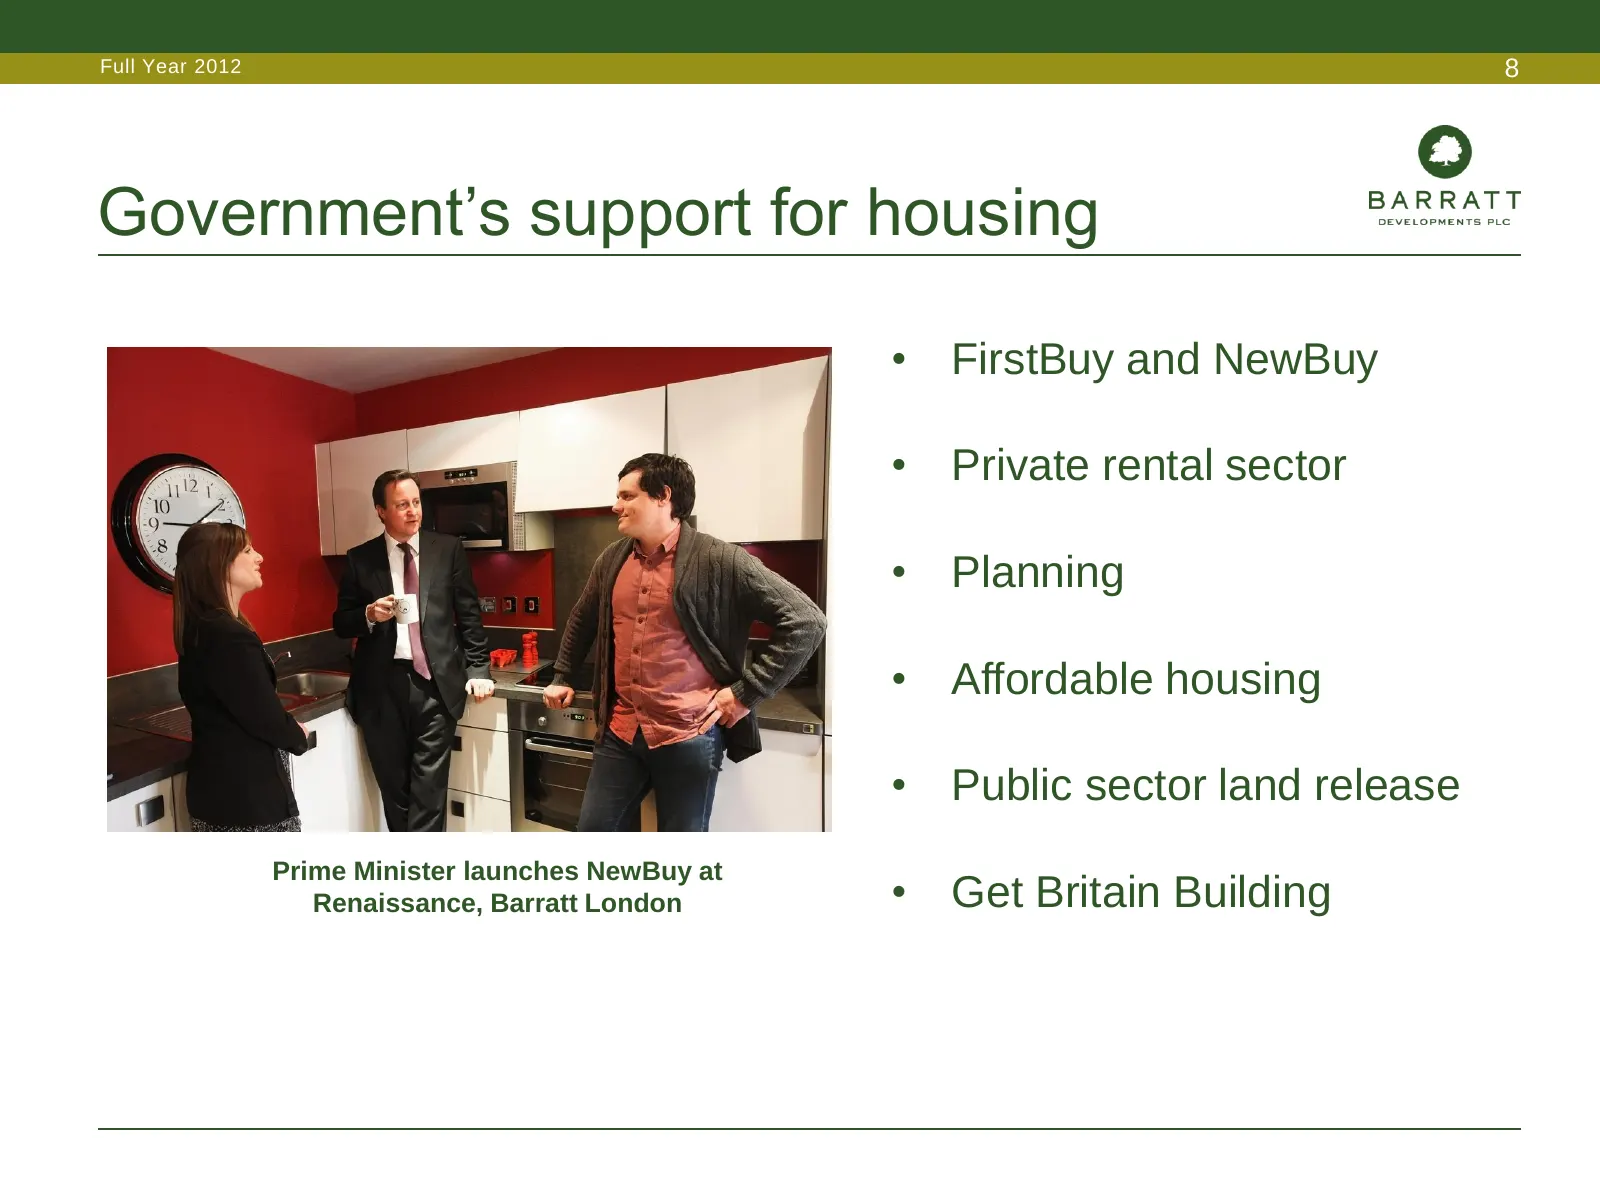
Slide 8: Government's support for housing
Full Year 2012 8 Government’s support for housing • FirstBuy and NewBuy • Private rental sector • Planning • Affordable housing • Public sector land release Prime Minister launches NewBuy at Renaissance, Barratt London • Get Britain Building
Slide 9: Key objectives
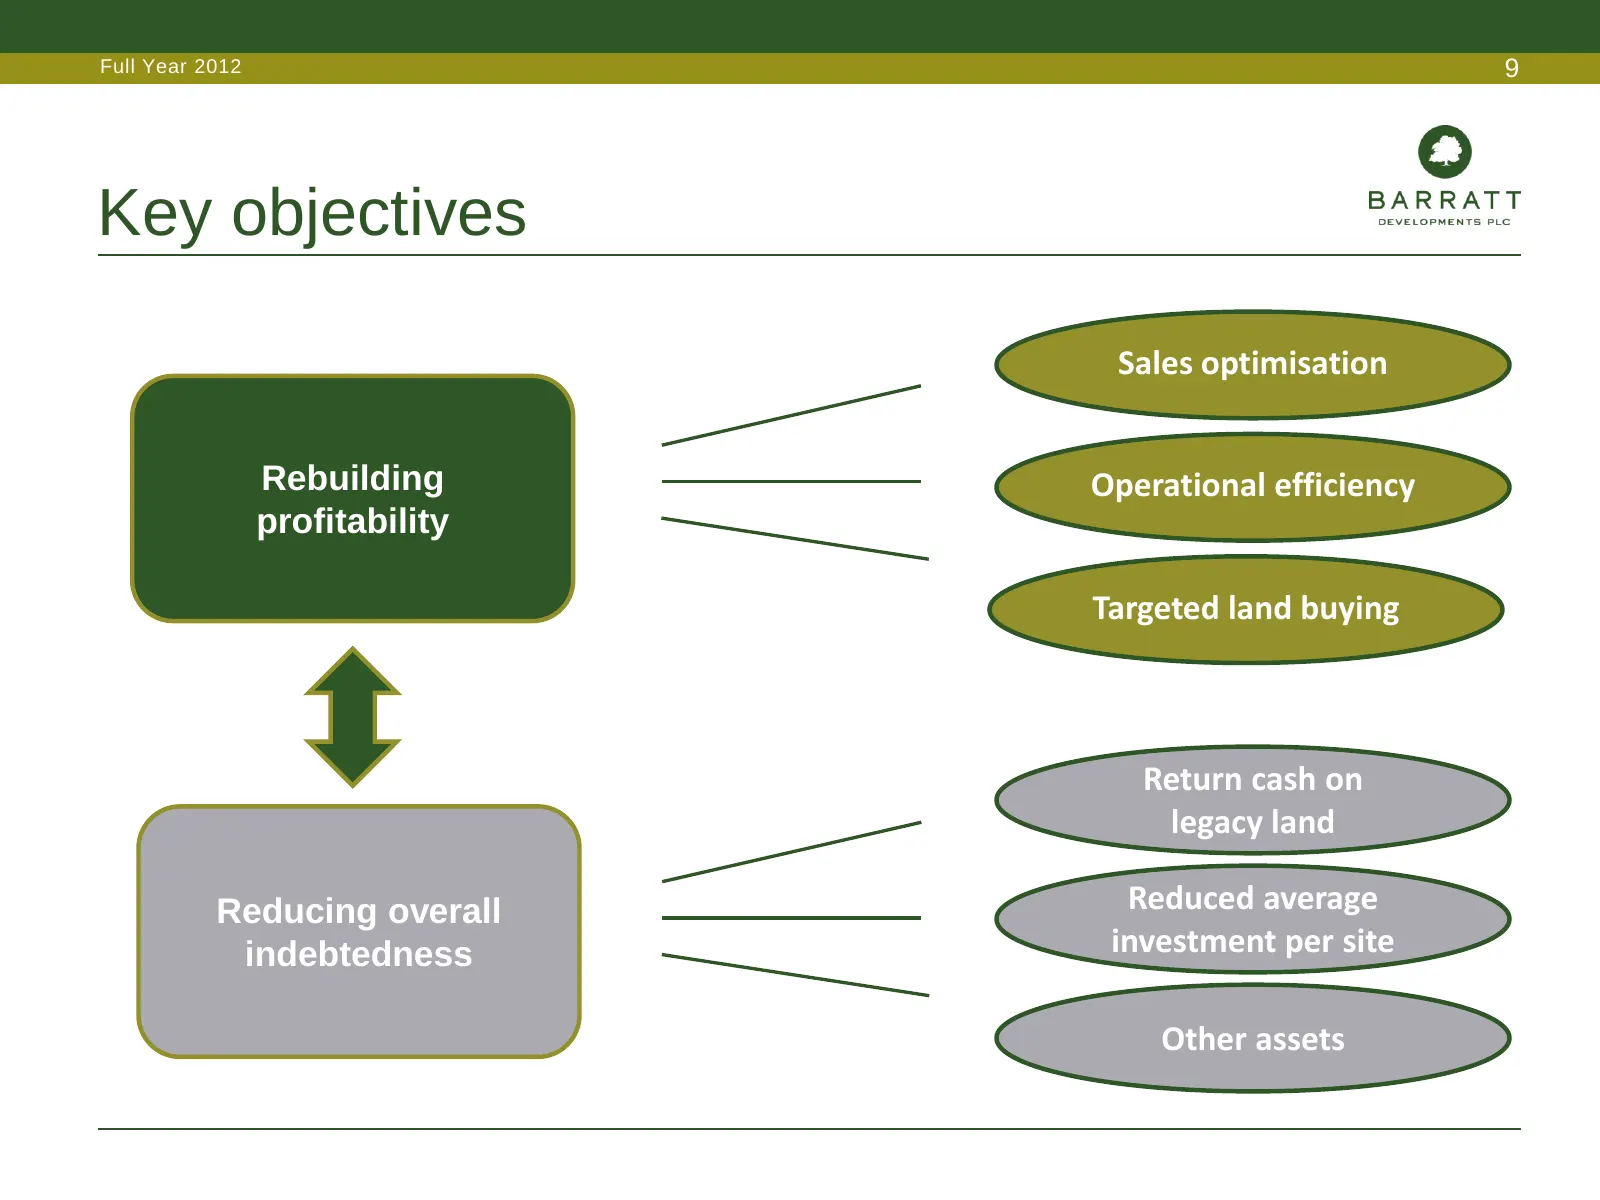
Full Year 2012 9 Key objectives Sales optimisation Rebuilding Operational efficiency profitability Targeted land buying Return cash on legacy land Reducing overall Reduced average indebtedness investment per site Other assets
Slide 10: Sales optimisation - sales & marketing
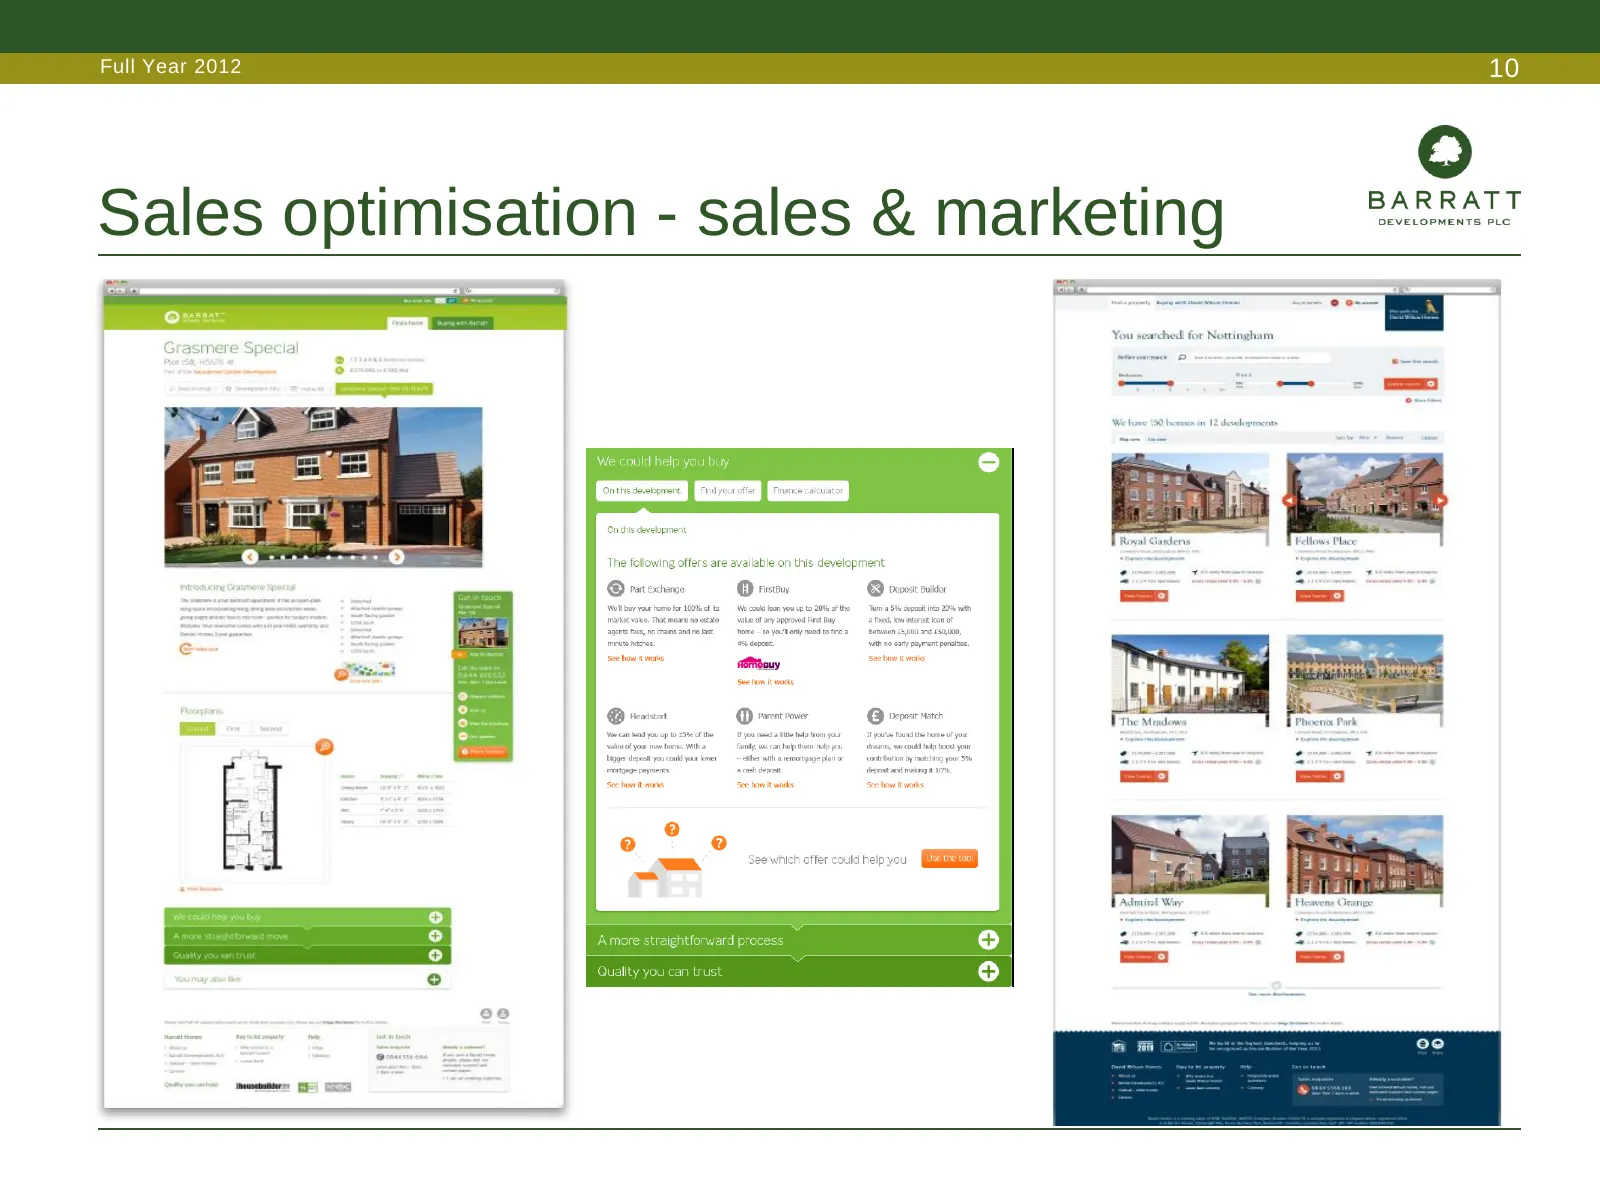
Full Year 2012 10 Sales optimisation - sales & marketing
Slide 11: Sales optimisation - sales & marketing
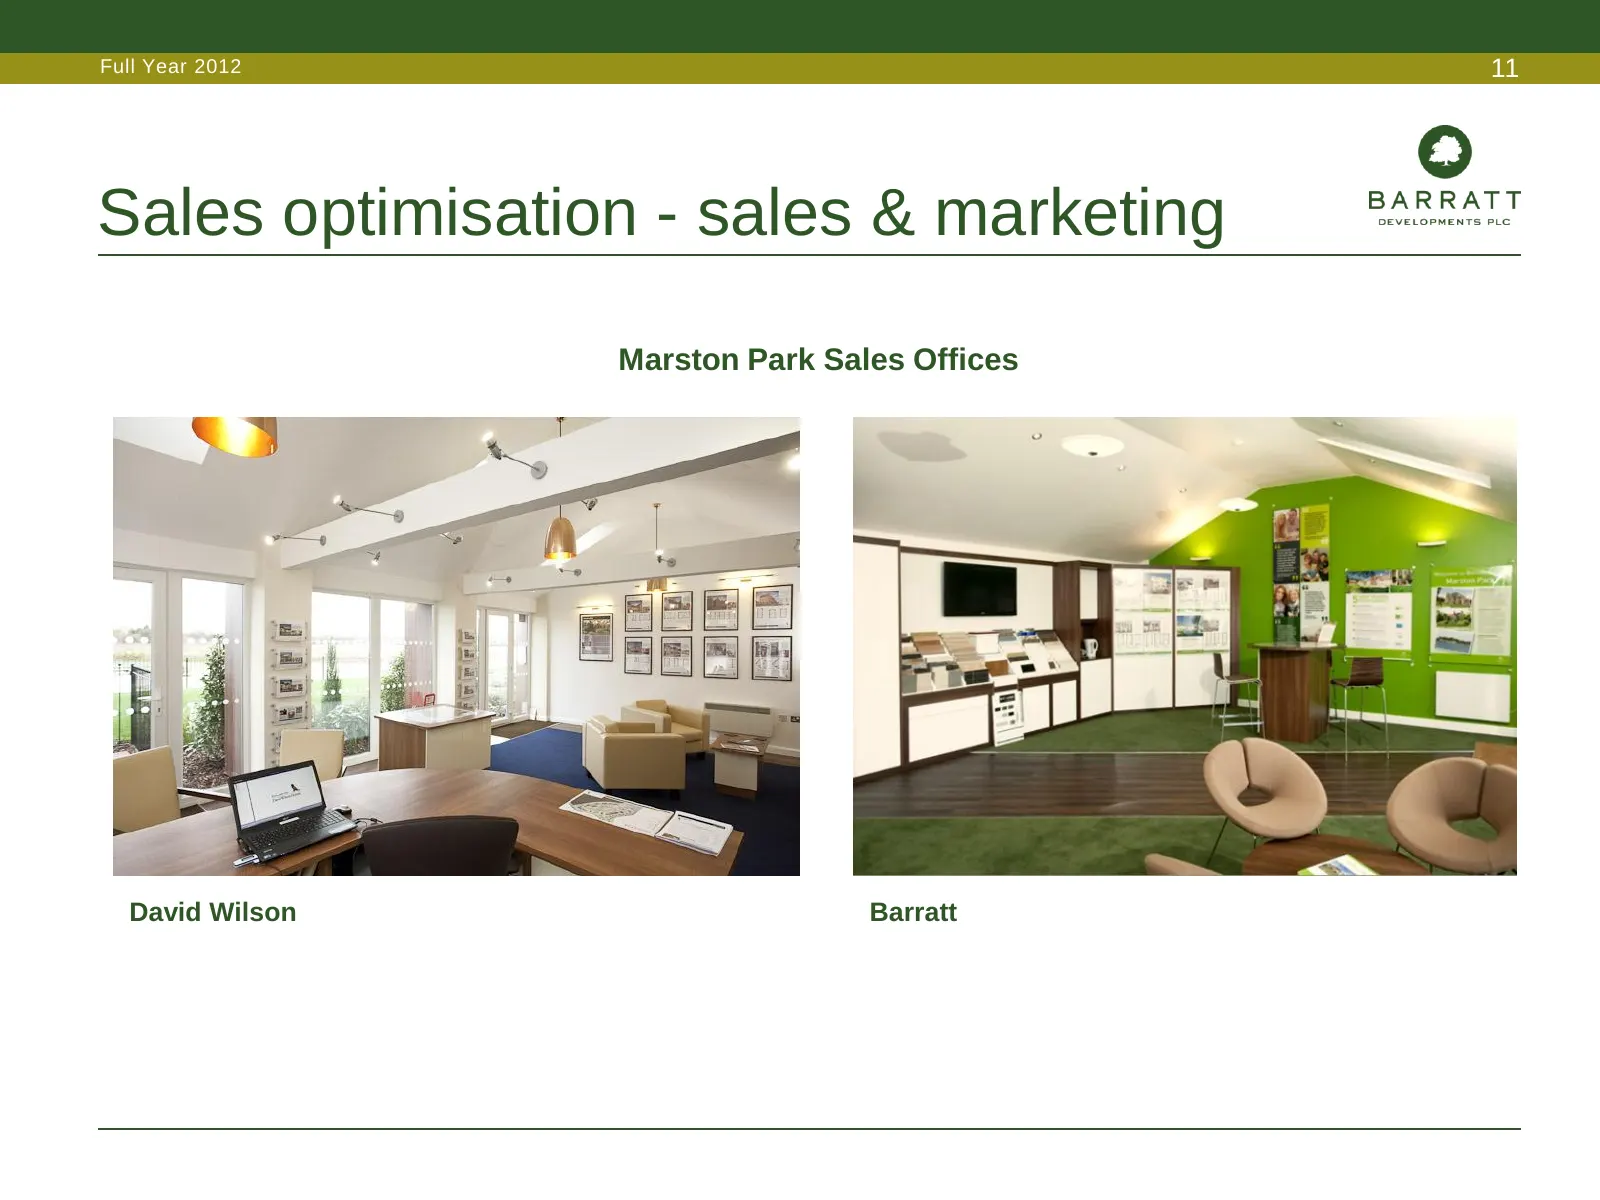
Full Year 2012 11 Sales optimisation - sales & marketing Marston Park Sales Offices David Wilson Barratt
Slide 12: Targeted land buying – delivery profile
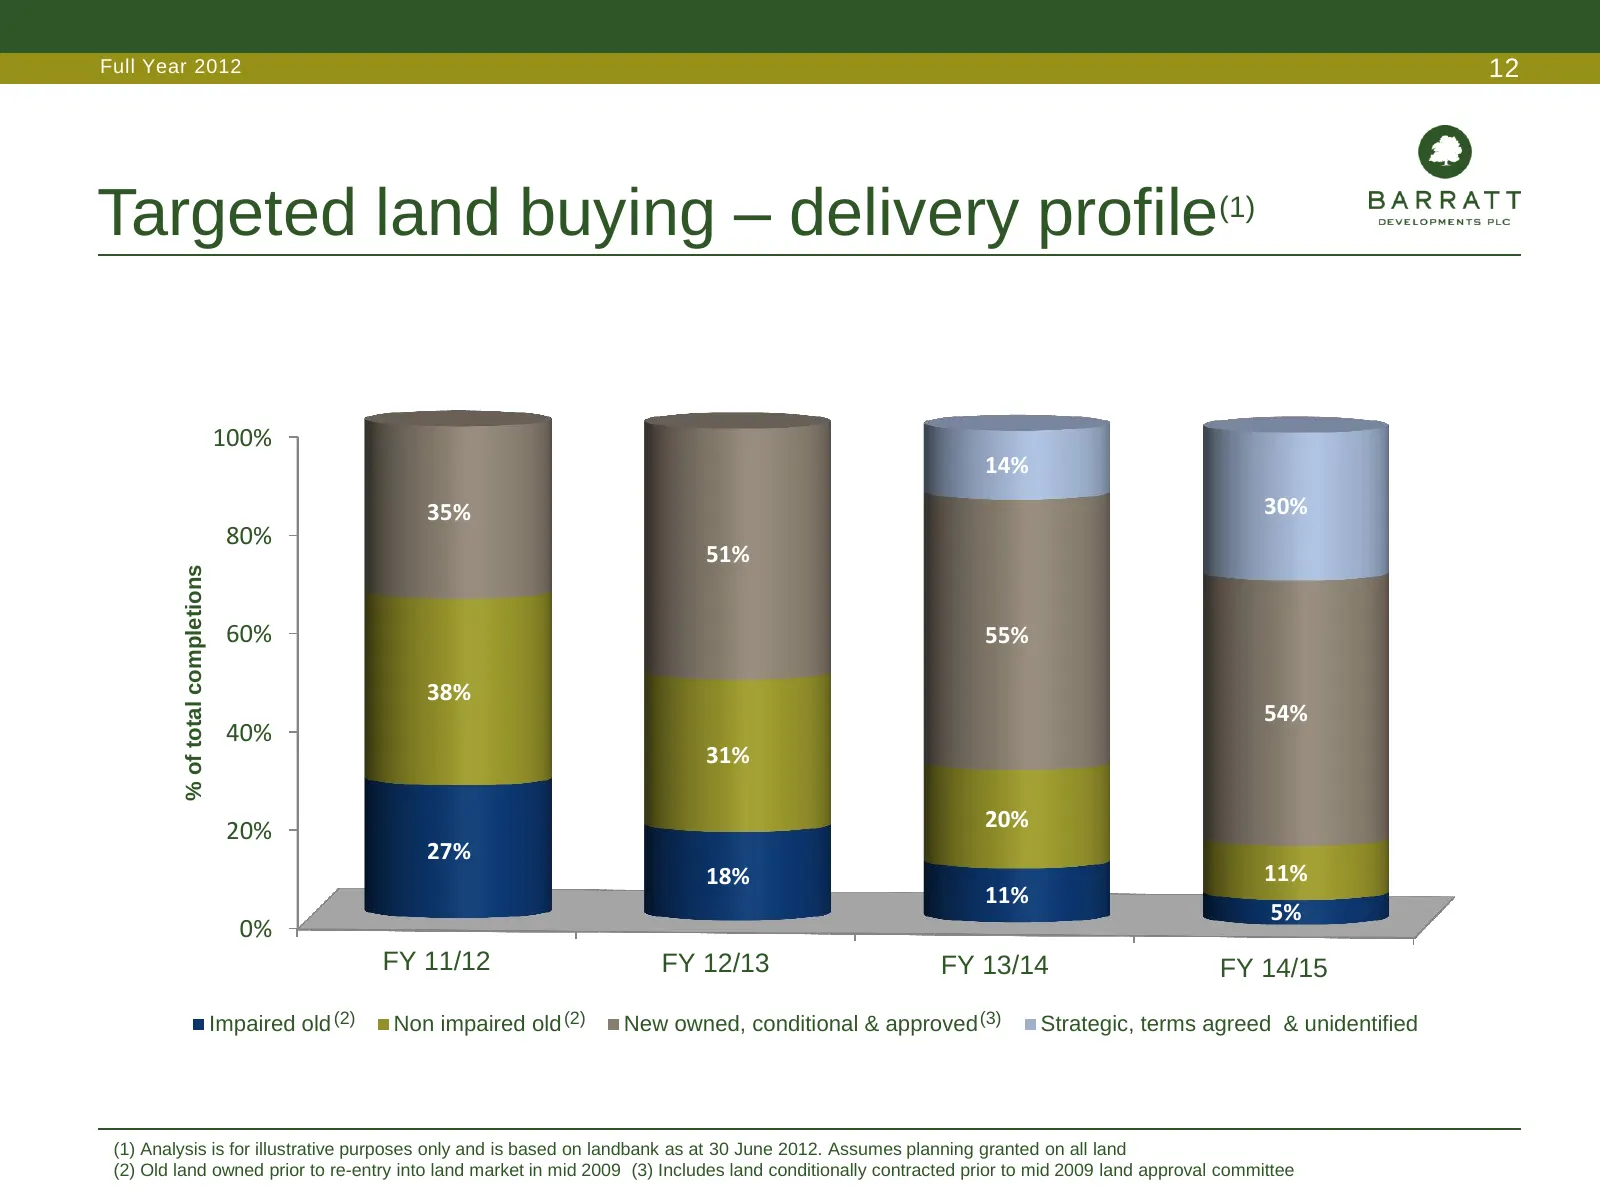
Full Year 2012 12 Targeted land buying – delivery profile(1) 100% 14% 35% 30% 80% 51% % of total completions 60% 55% 38% 54% 40% 31% 20% 20% 27% 18% 11% 11% 5% 0% FY 11/12 FY 12/13 FY 13/14 FY 14/15 Impaired old (2) Non impaired old (2) New owned, conditional & approved (3) Strategic, terms agreed &
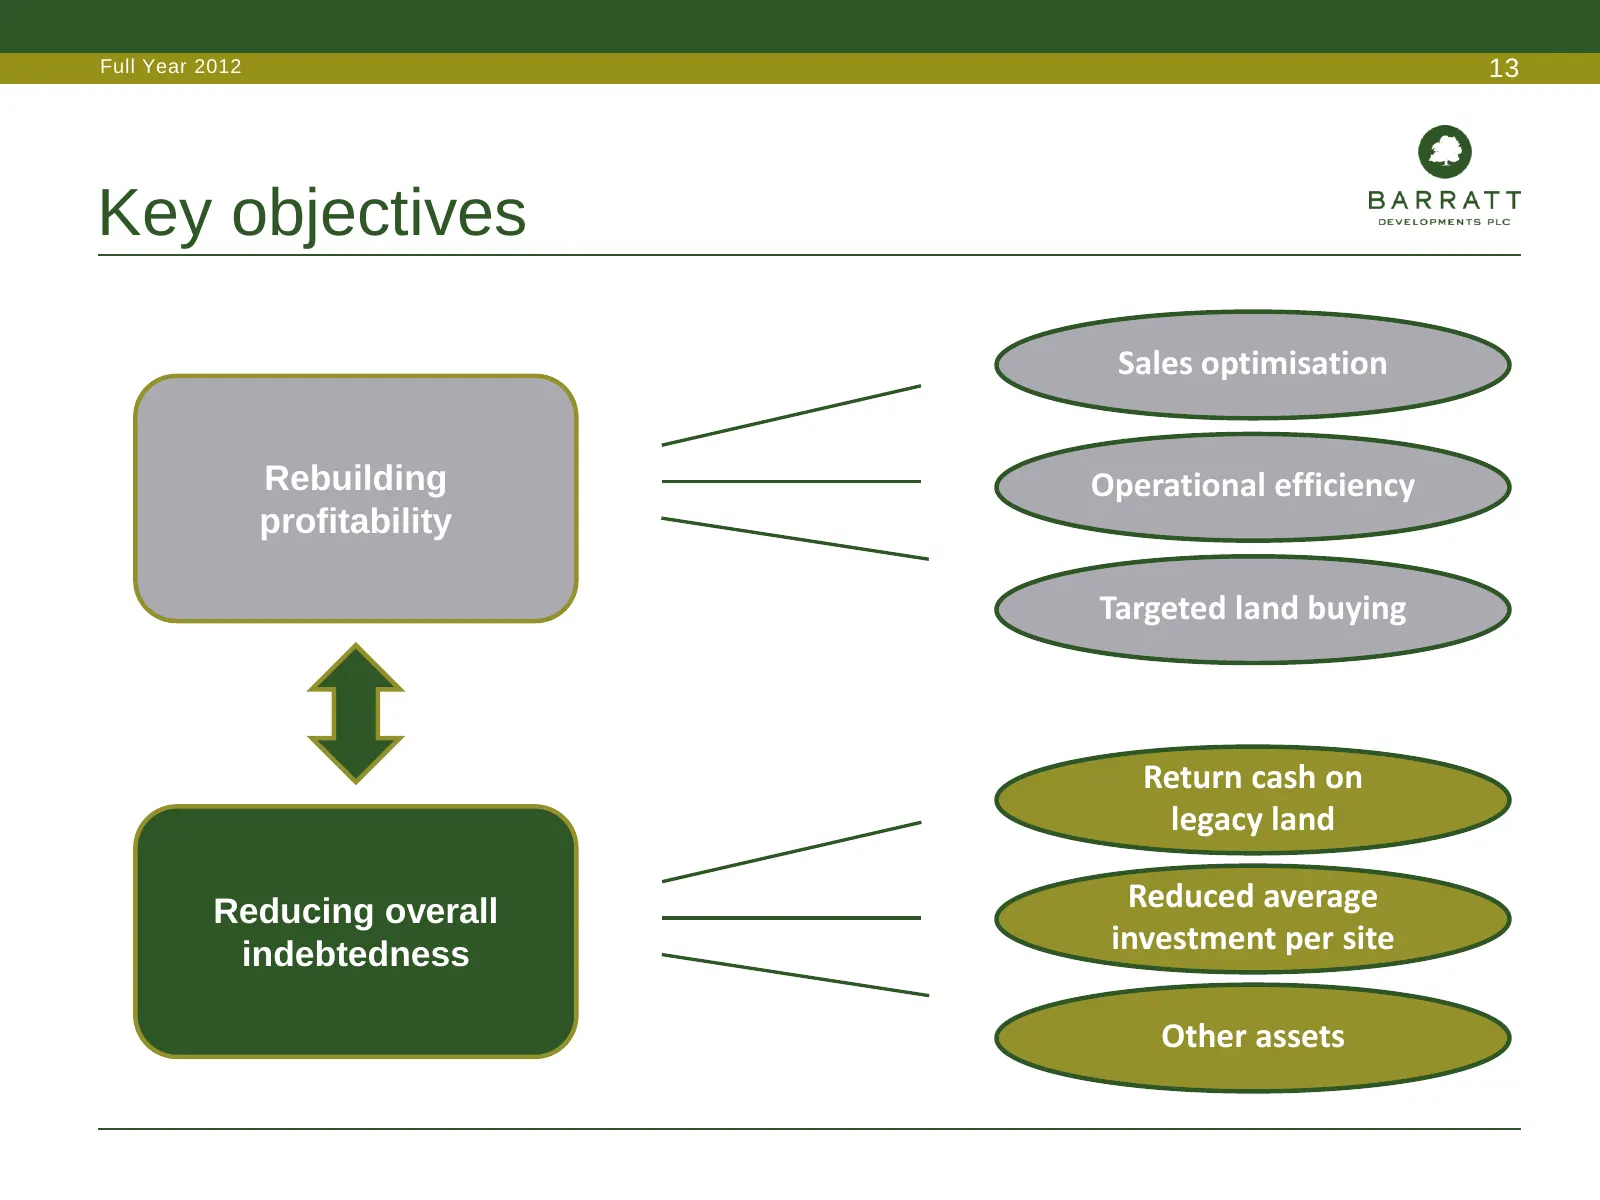
Slide 13: Key objectives
Full Year 2012 13 Key objectives Sales optimisation Rebuilding Operational efficiency profitability Targeted land buying Return cash on legacy land Reducing overall Reduced average indebtedness investment per site Other assets
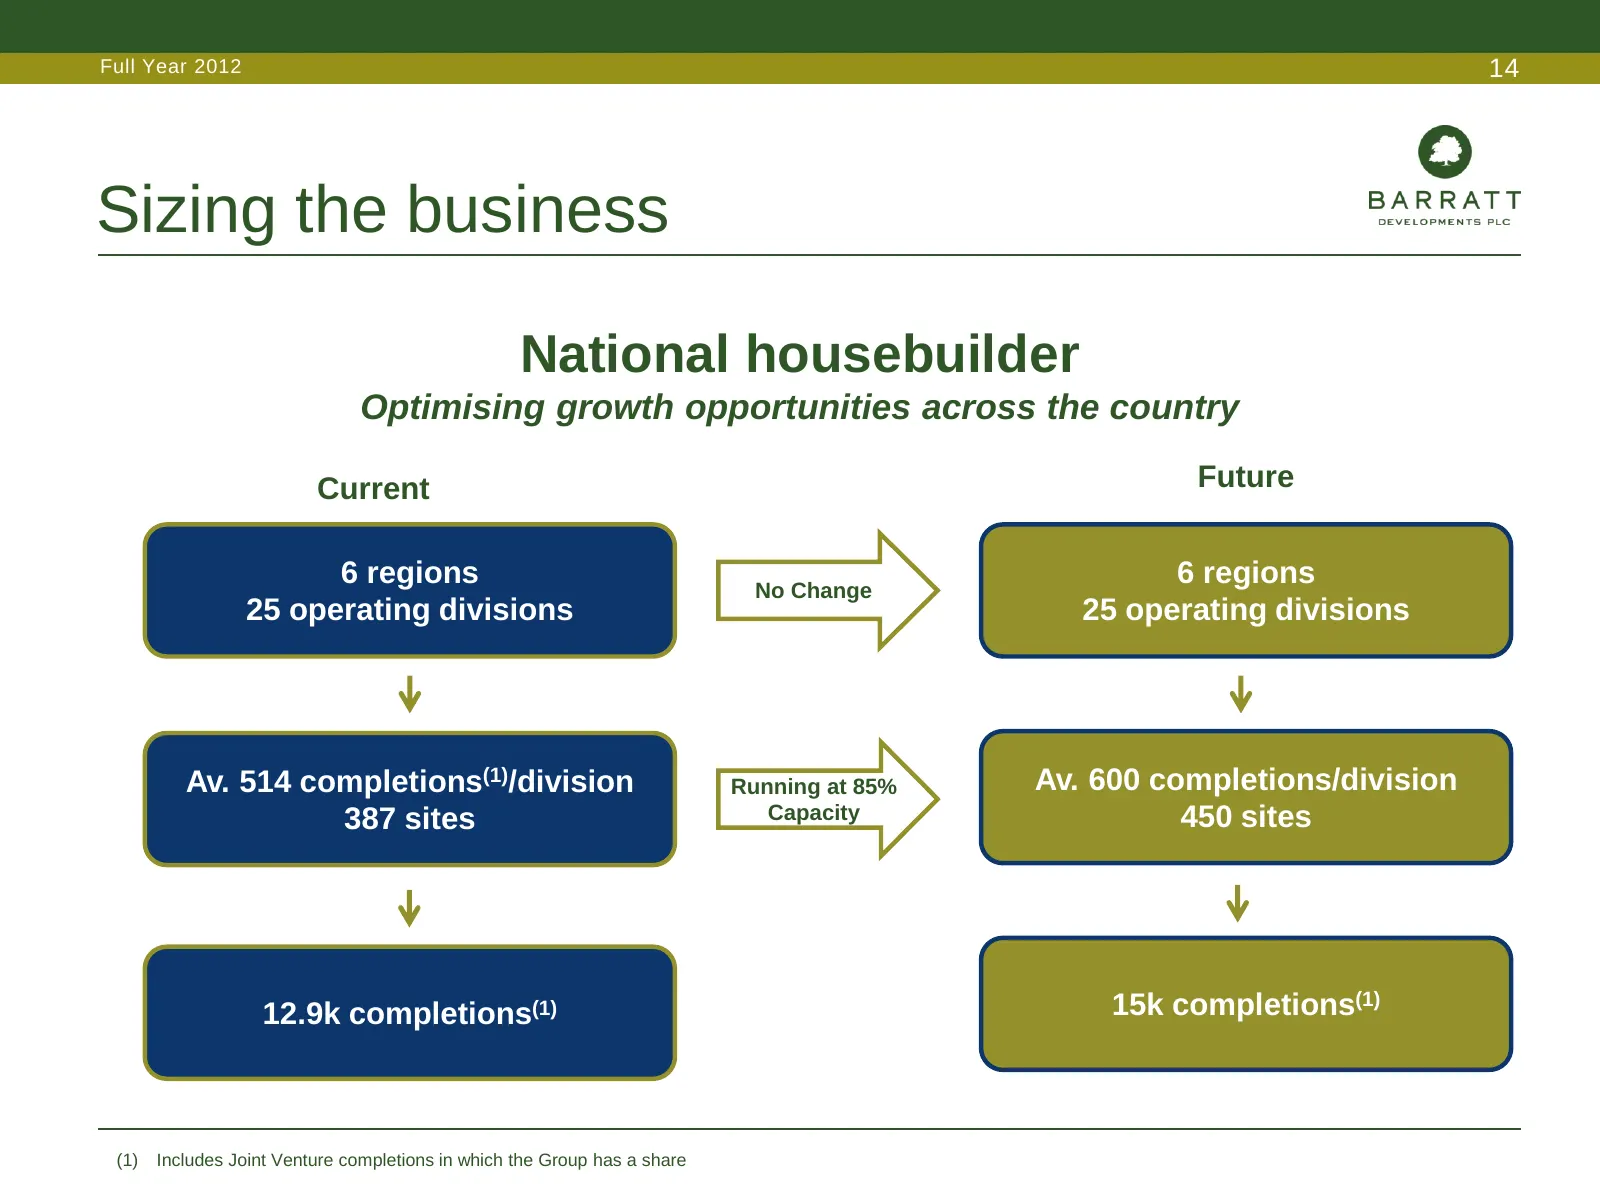
Slide 14: Sizing the business
Full Year 2012 14 Sizing the business National housebuilder Optimising growth opportunities across the country Current Future 6 regions No Change 6 regions 25 operating divisions 25 operating divisions Av. 514 completions(1)/division Running at 85% Av. 600 completions/division 387 sites Capacity 450
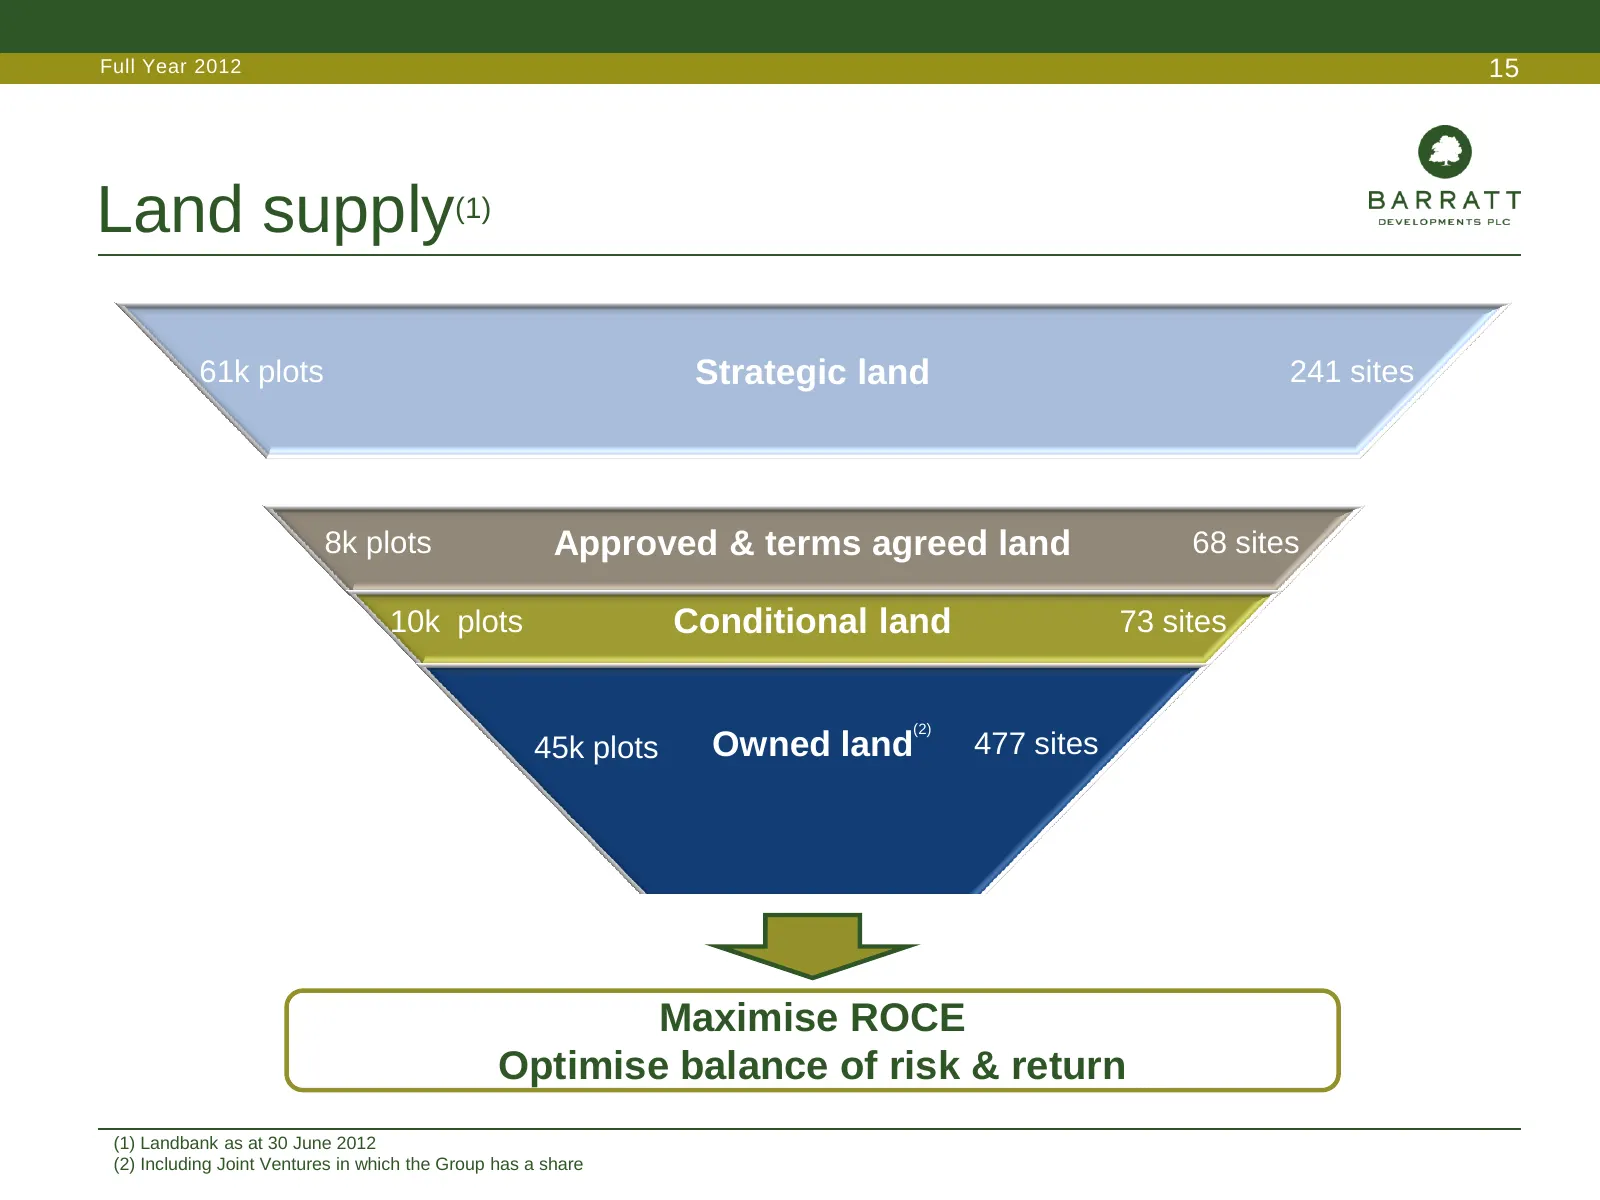
Slide 15: Land supply
Full Year 2012 15 Land supply(1) 61k plots Strategic land 241 sites 8k plots Approved & terms agreed land 68 sites 10k plots Conditional land 73 sites (2) 45k plots Owned land 477 sites Maximise ROCE Optimise balance of risk & return (1) Landbank as at 30 June 2012 (2) Including Joint Ventures in wh
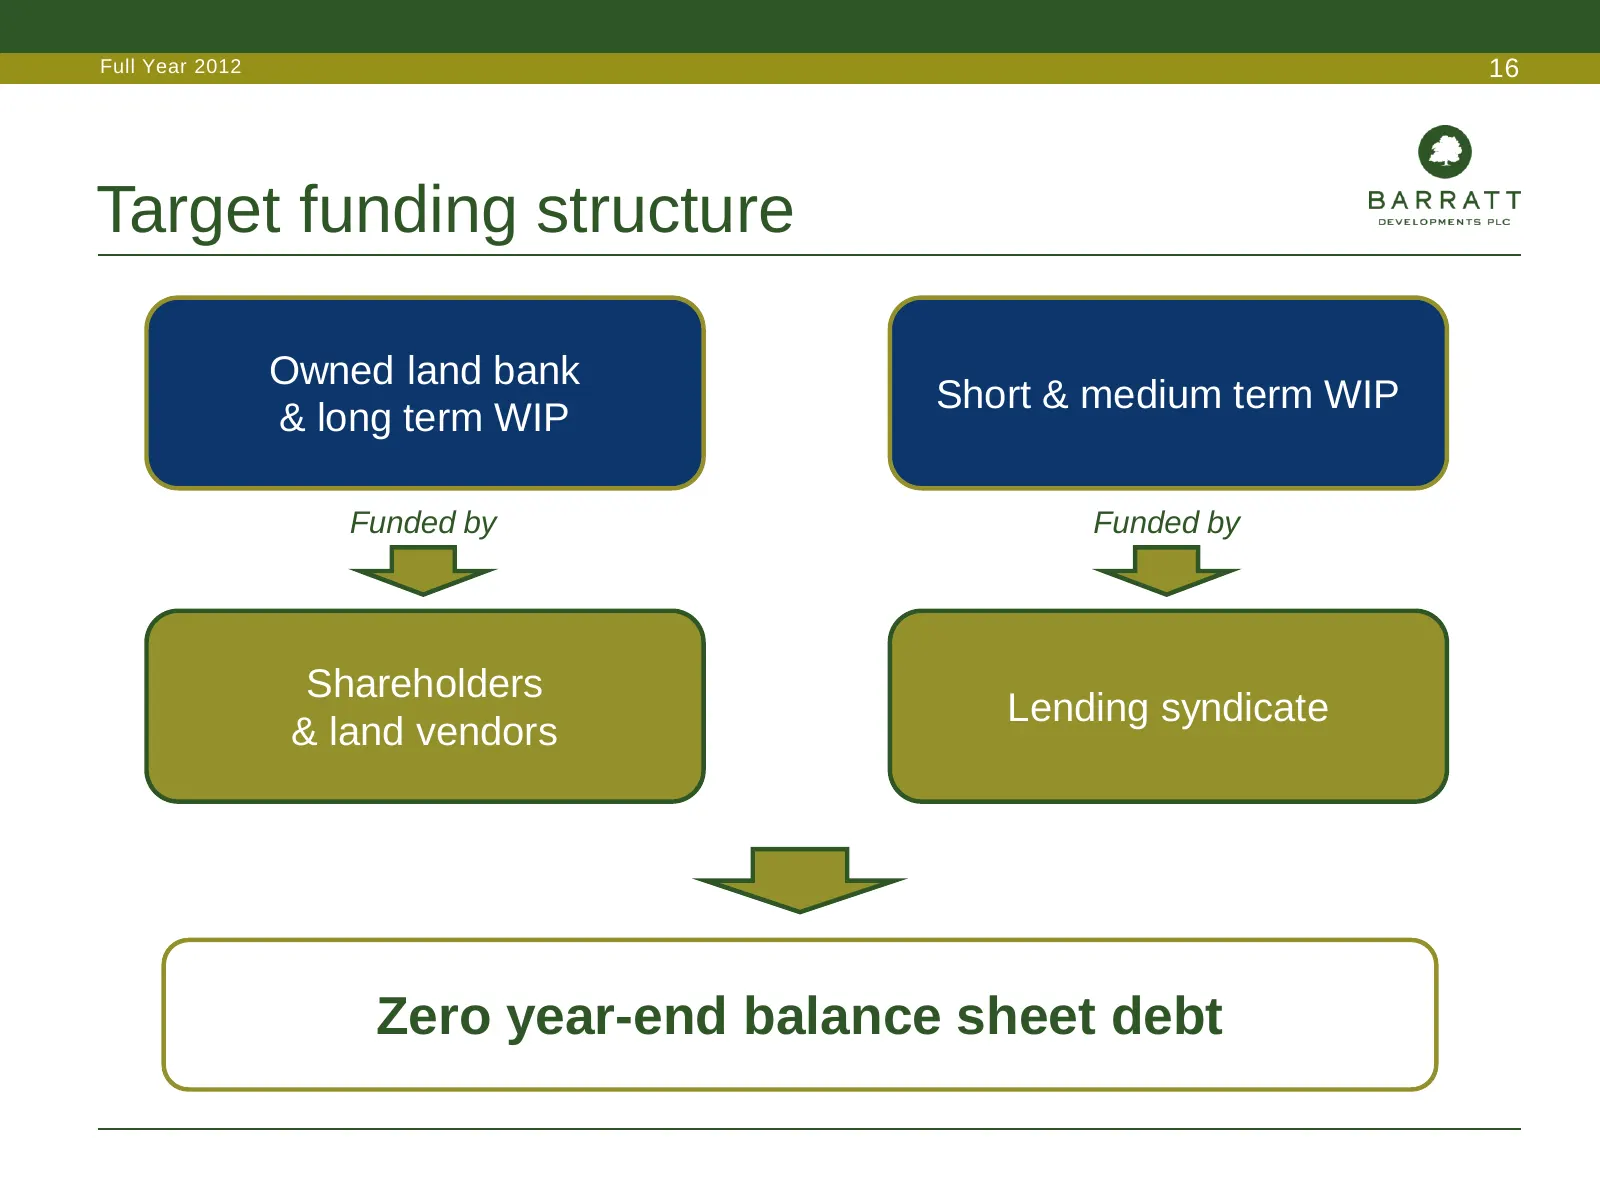
Slide 16: Target funding structure
Full Year 2012 16 Target funding structure Owned land bank Short & medium term WIP & long term WIP Funded by Funded by Shareholders Lending syndicate & land vendors Zero year-end balance sheet debt
Slide 17: Dividend policy
Full Year 2012 17 Dividend policy • Board recognises importance of both capital growth and dividend • Expect to propose final dividend payment for June 2013 – initially conservative cover – progressive policy with target of 3.0 times cover
Slide 18: Current trading
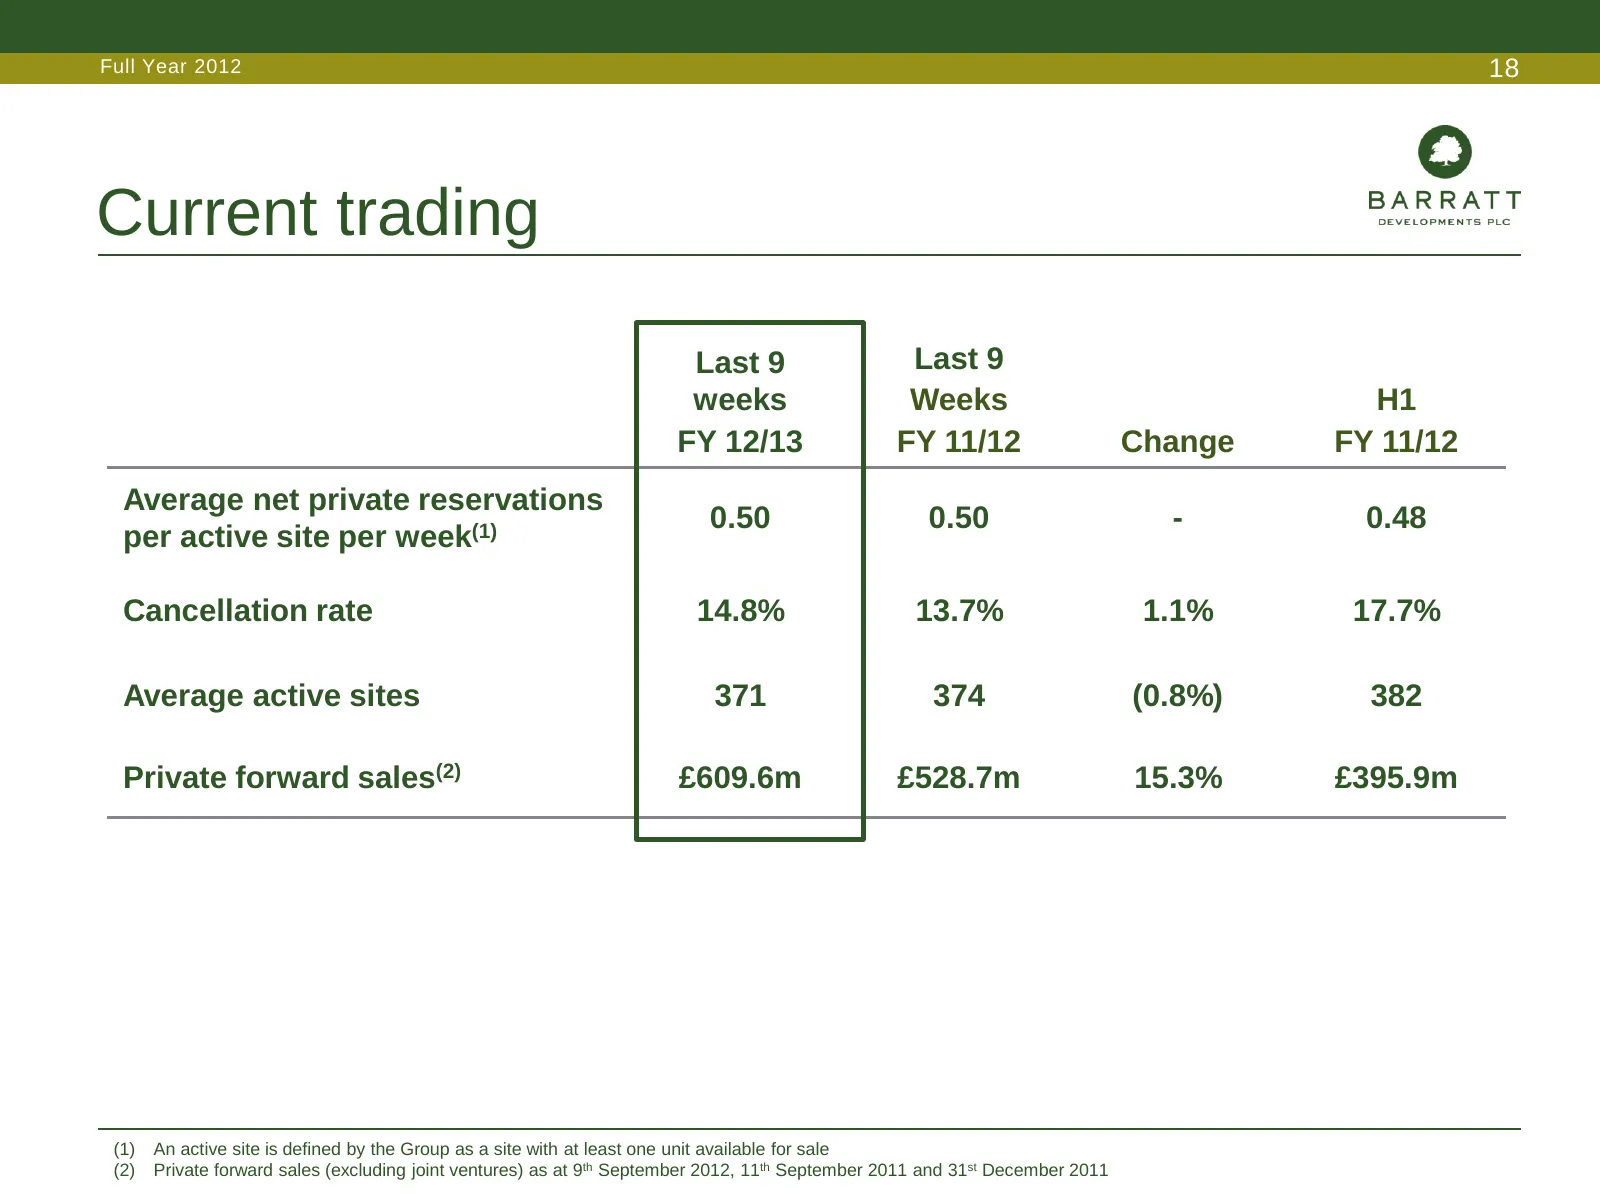
Full Year 2012 18 Current trading Last 9 Last 9 weeks Weeks H1 FY 12/13 FY 11/12 Change FY 11/12 Average net private reservations 0.50 0.50 - 0.48 per active site per week(1) Cancellation rate 14.8% 13.7% 1.1% 17.7% Average active sites 371 374 (0.8%) 382 Private forward sales(2) £609.6m £528.7m 15.
Slide 19: Outlook
Full Year 2012 19 Outlook • Stable market backdrop • Continued government support • Market fundamentals remain strong • More recently acquired land will continue to drive profitability and debt reduction
Slide 20: Steven Boyes, Group Chief Operating Officer
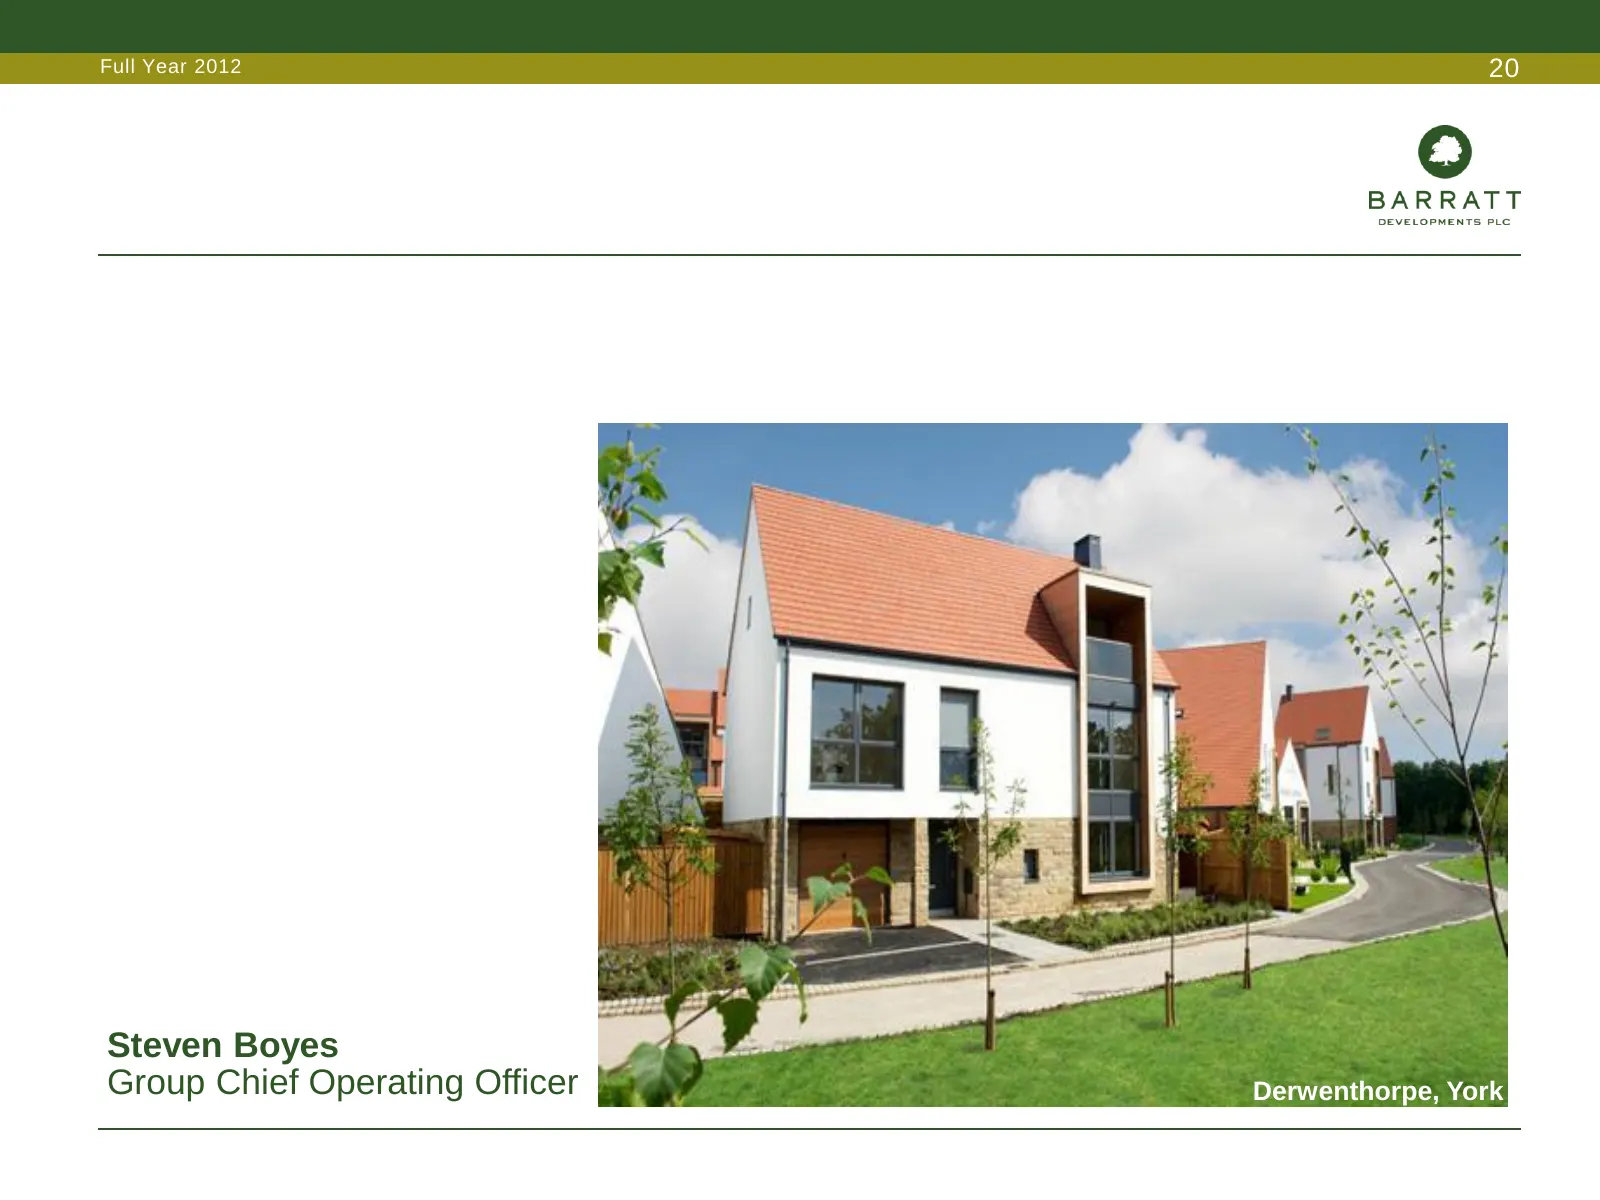
Full Year 2012 20 Steven Boyes Group Chief Operating Officer Derwenthorpe, York
Slide 21: Overview
Full Year 2012 21 Overview • Revenue drivers • Operating efficiency • Land supply
Slide 22: Revenue and completions by region
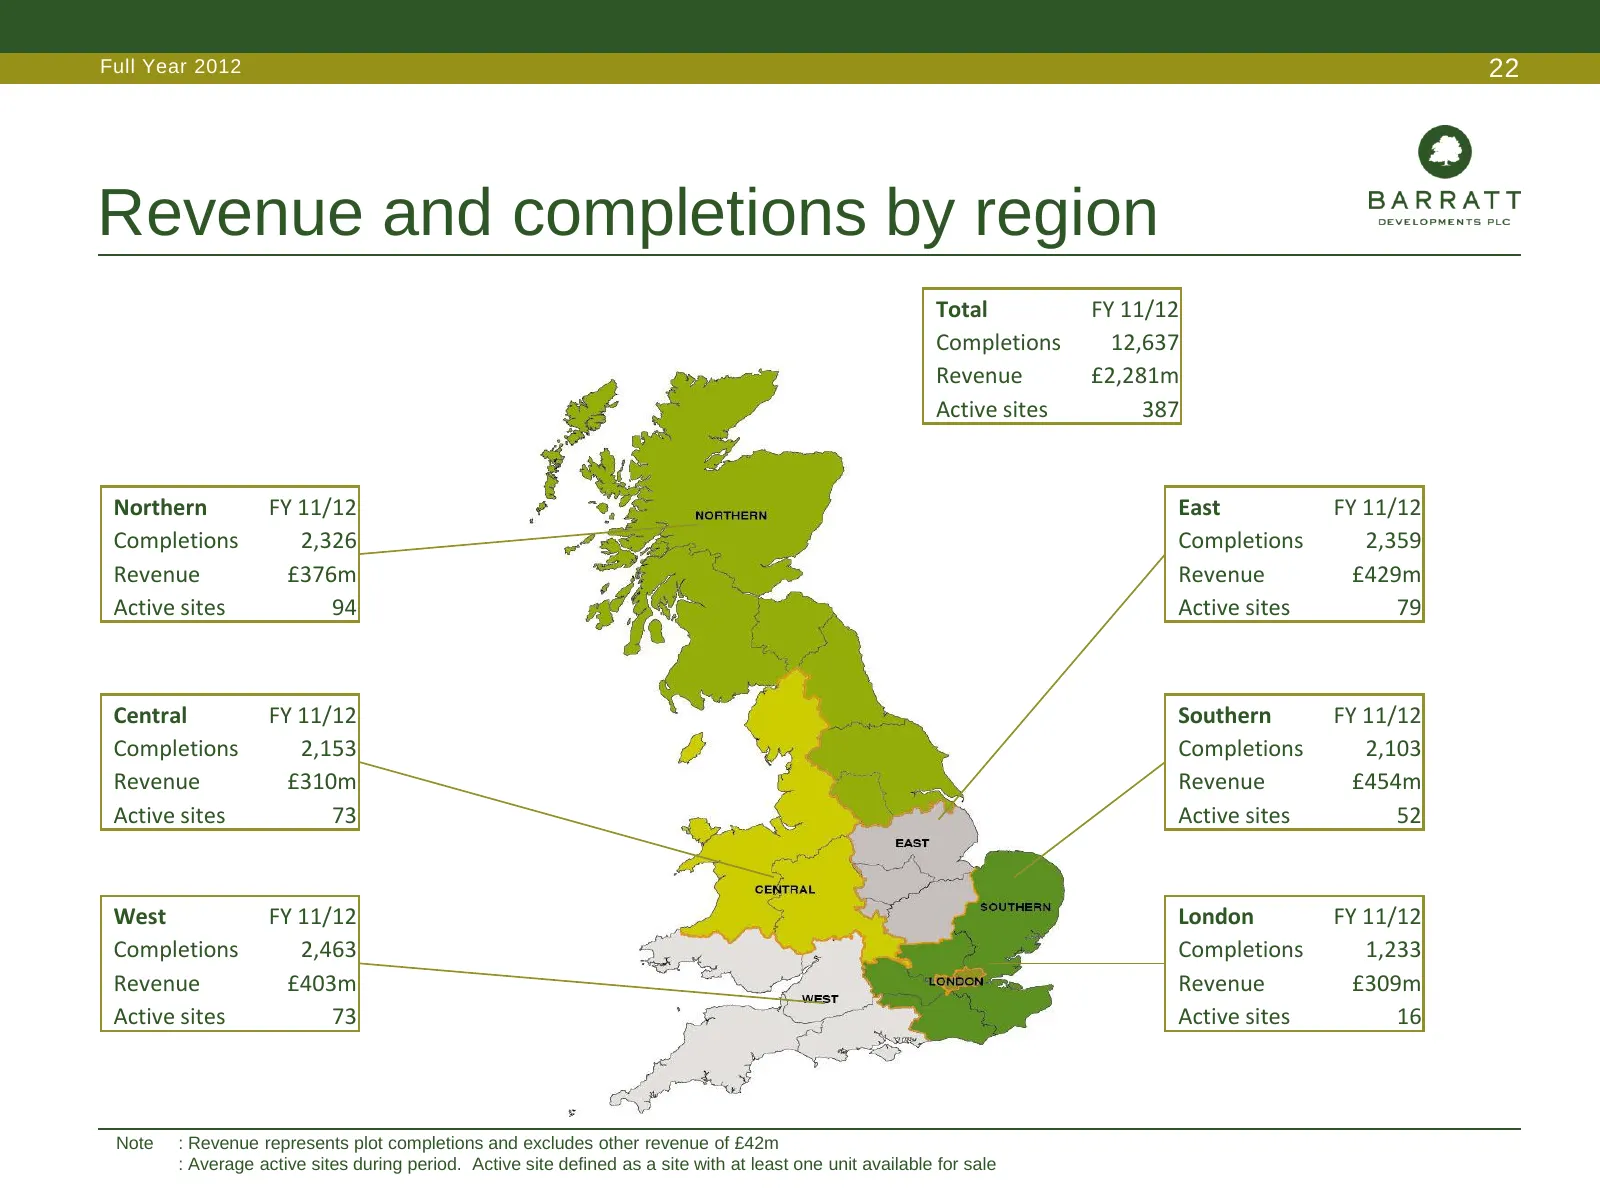
Full Year 2012 22 Revenue and completions by region Total FY 11/12 Completions 12,637 Revenue £2,281m Active sites 387 Northern FY 11/12 East FY 11/12 Completions 2,326 Completions 2,359 Revenue £376m Revenue £429m Active sites 94 Active sites 79 Central FY 11/12 Southern FY 11/12 Completions 2,153
Slide 23: Private sales rates
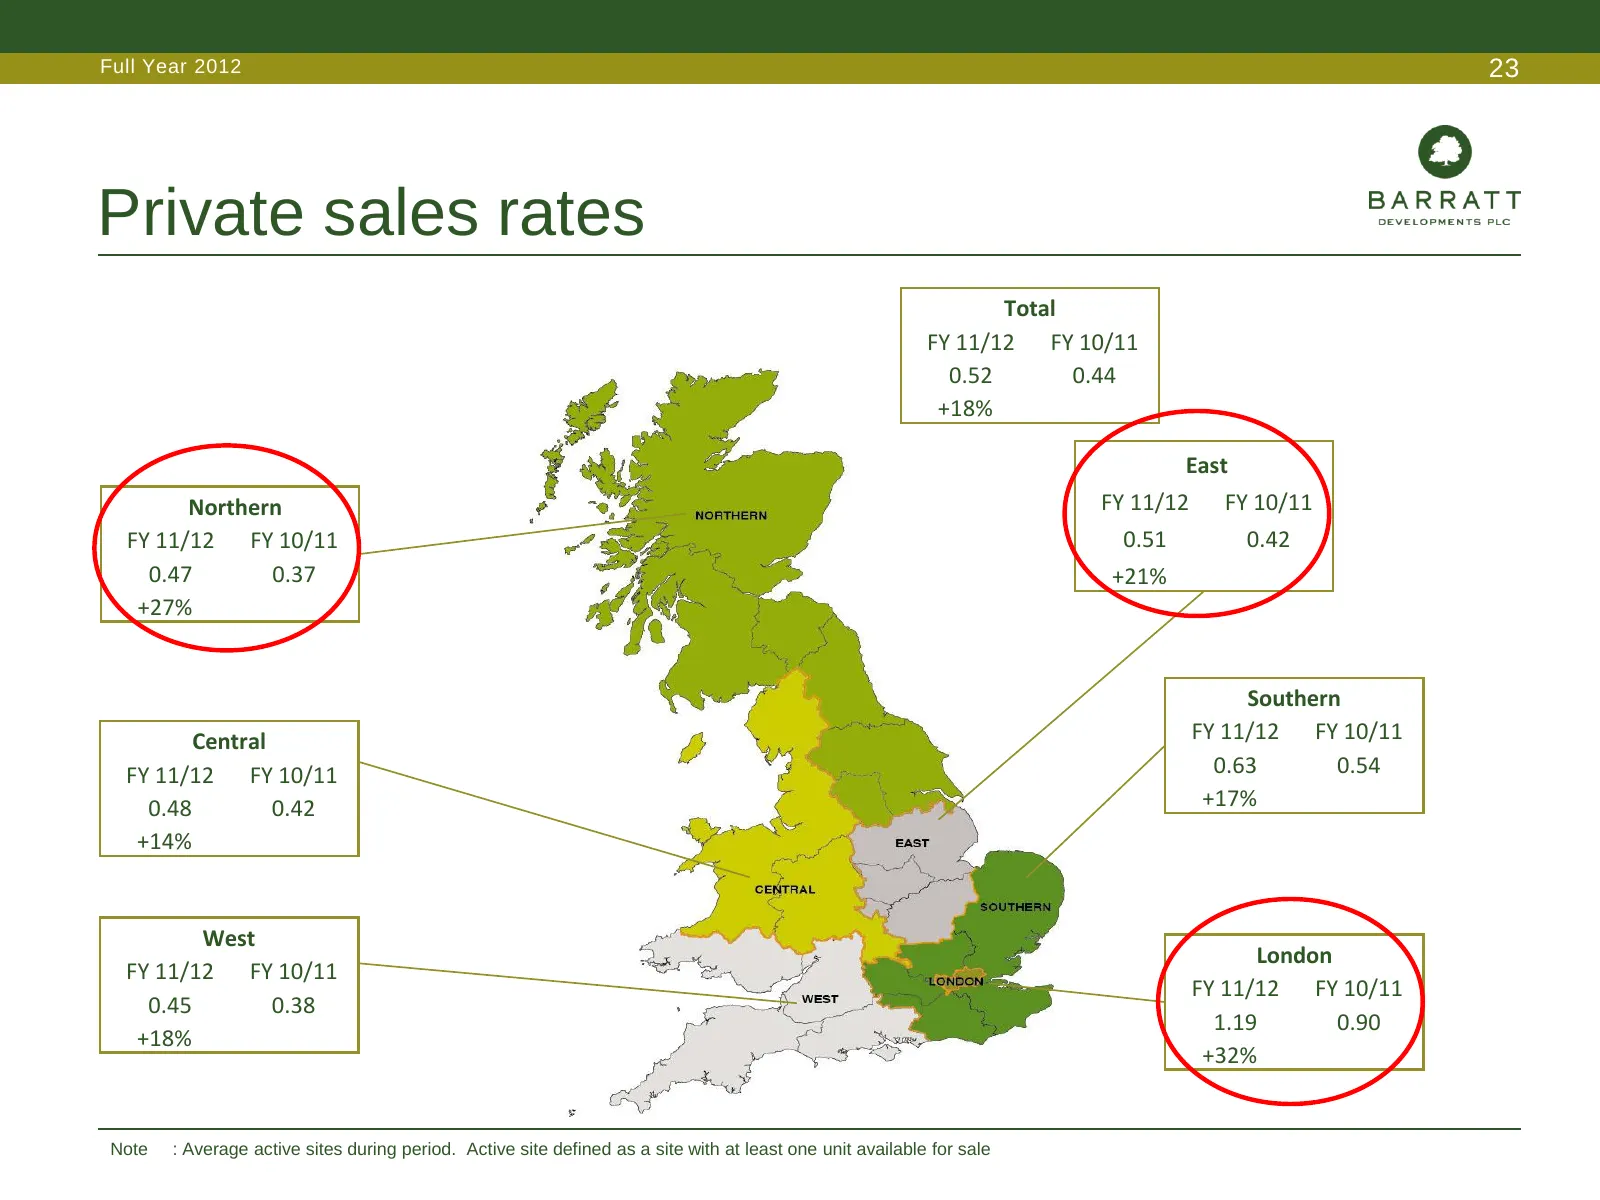
Full Year 2012 23 Private sales rates Total FY 11/12 FY 10/11 0.52 0.44 +18% East Northern FY 11/12 FY 10/11 FY 11/12 FY 10/11 0.51 0.42 0.47 0.37 +21% +27% Southern Central FY 11/12 FY 10/11 FY 11/12 FY 10/11 0.63 0.54 0.48 0.42 +17% +14% West London FY 11/12 FY 10/11 FY 11/12 FY 10/11 0.45 0.38 1.
Slide 24: Completions: Product mix
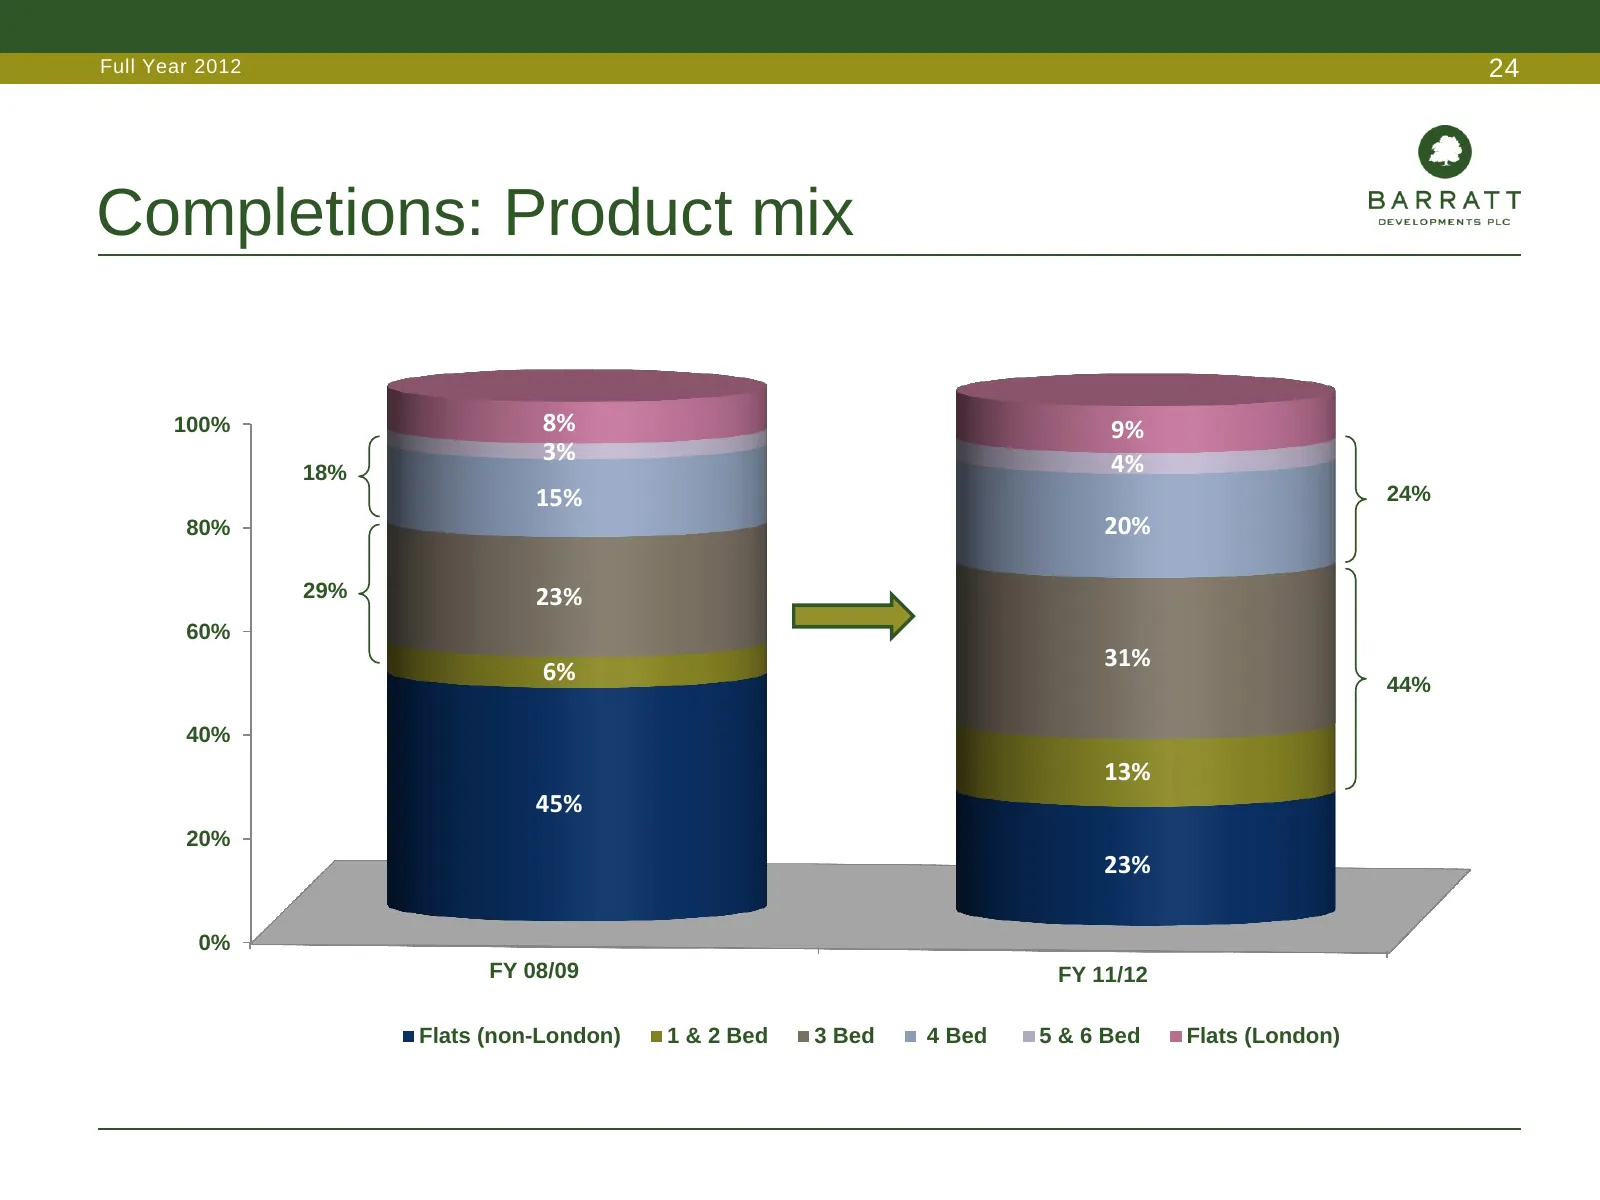
Full Year 2012 24 Completions: Product mix 100% 8% 9% 3% 4% 18% 15% 24% 80% 20% 29% 23% 60% 31% 6% 44% 40% 13% 45% 20% 23% 0% FY 08/09 FY 11/12 Flats (non-London) 1 & 2 Bed 3 Bed 4 Bed 5 & 6 Bed Flats (London)
Slide 25: Our brands
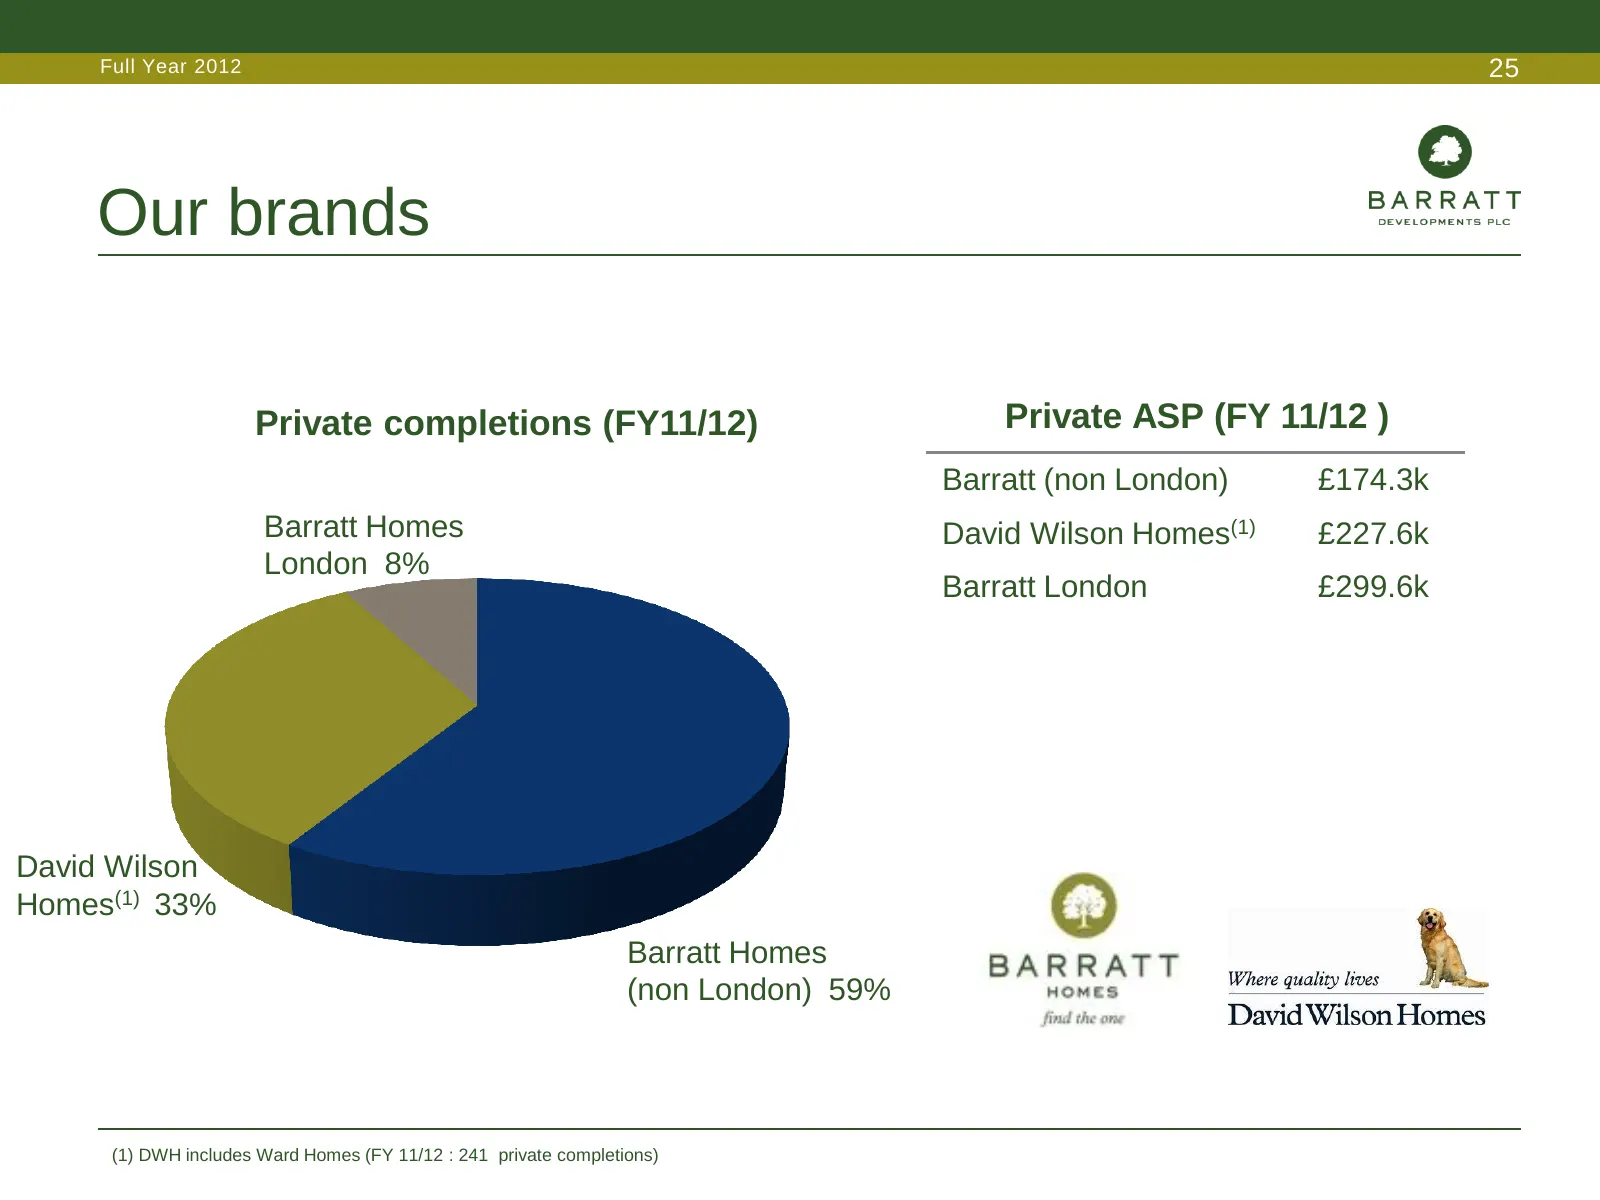
Full Year 2012 25 Our brands Private completions (FY11/12) Private ASP (FY 11/12 ) Barratt (non London) £174.3k Barratt Homes David Wilson Homes(1) £227.6k London 8% Barratt London £299.6k David Wilson Homes(1) 33% Barratt Homes (non London) 59% (1) DWH includes Ward Homes (FY 11/12 : 241 private co
Slide 26: Highest quality product
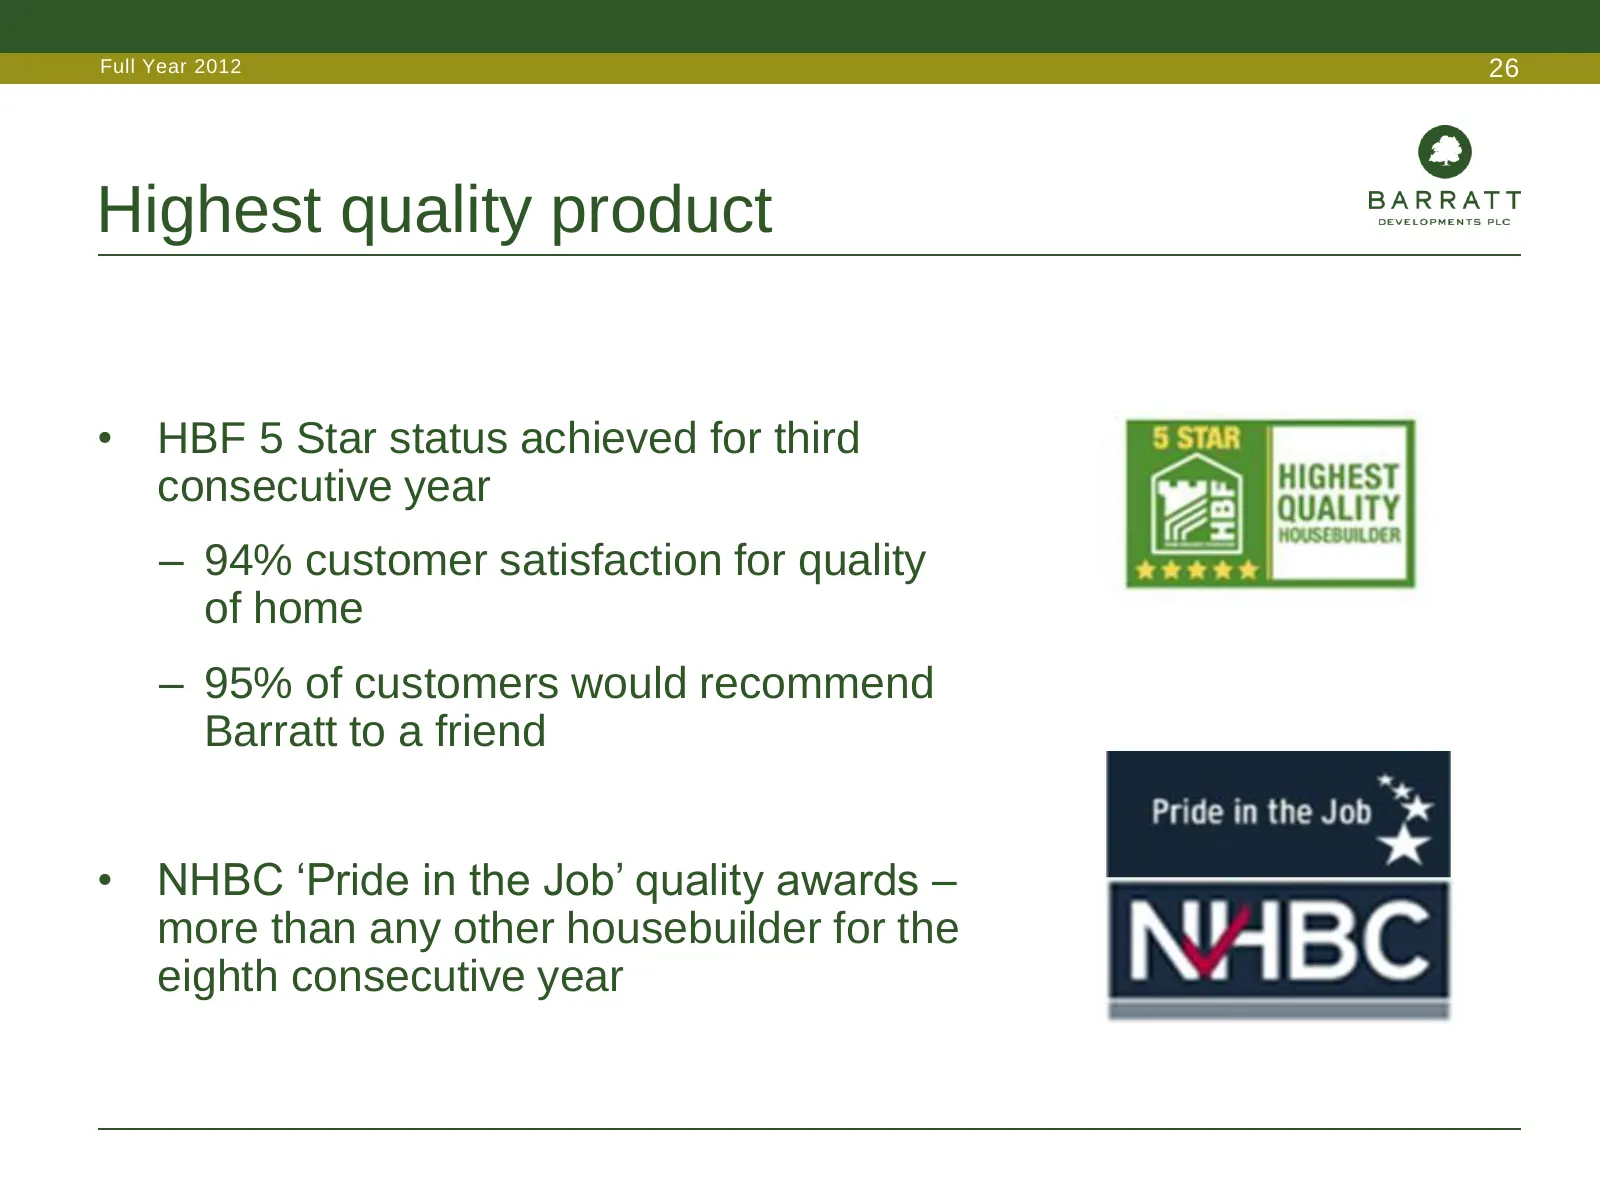
Full Year 2012 26 Highest quality product • HBF 5 Star status achieved for third consecutive year – 94% customer satisfaction for quality of home – 95% of customers would recommend Barratt to a friend • NHBC ‘Pride in the Job’ quality awards – more than any other housebuilder for the eighth consecut
Slide 27: Trends in private ASP
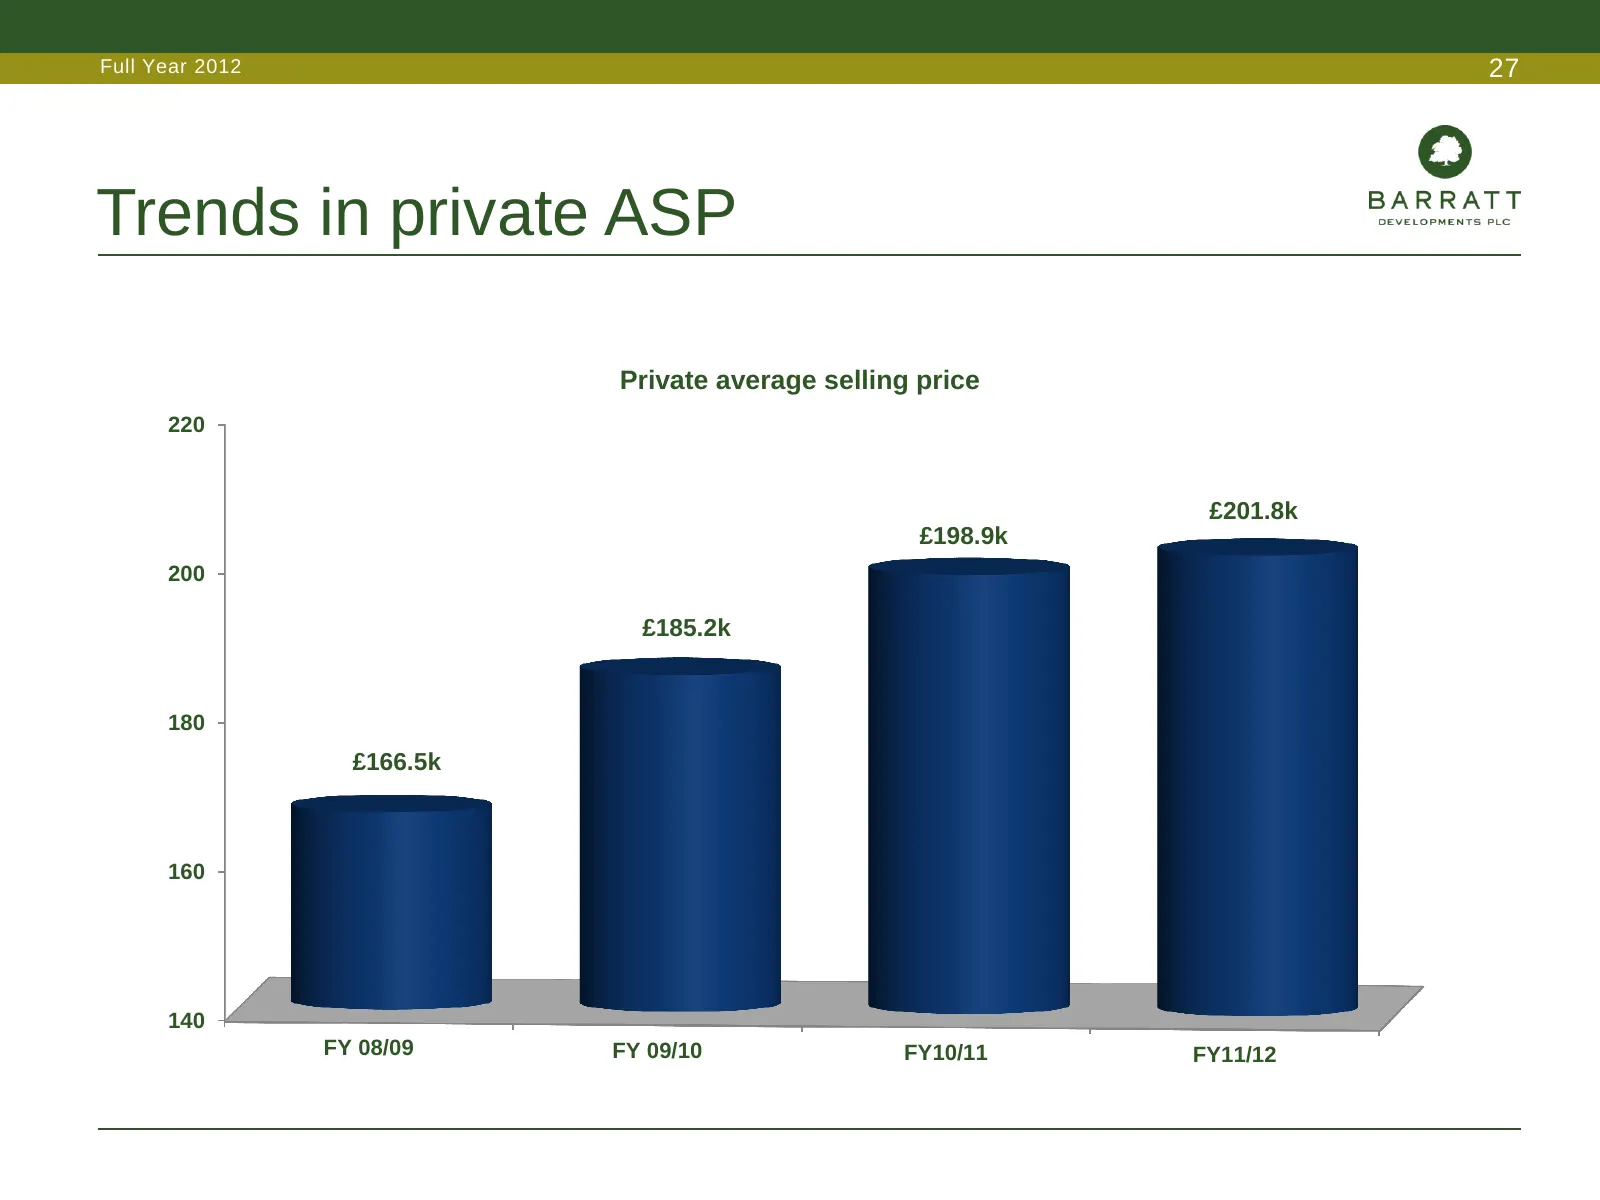
Full Year 2012 27 Trends in private ASP Private average selling price 220 £201.8k £198.9k 200 £185.2k 180 £166.5k 160 140 FY 08/09 FY 09/10 FY10/11 FY11/12
Slide 28: Operational efficiency - costs
Full Year 2012 28 Operational efficiency- costs • Further standardisation • Site reviews / replans • Maximising Group procurement capability • Code Level 3 and 4 costs Maximising efficiency across the Group
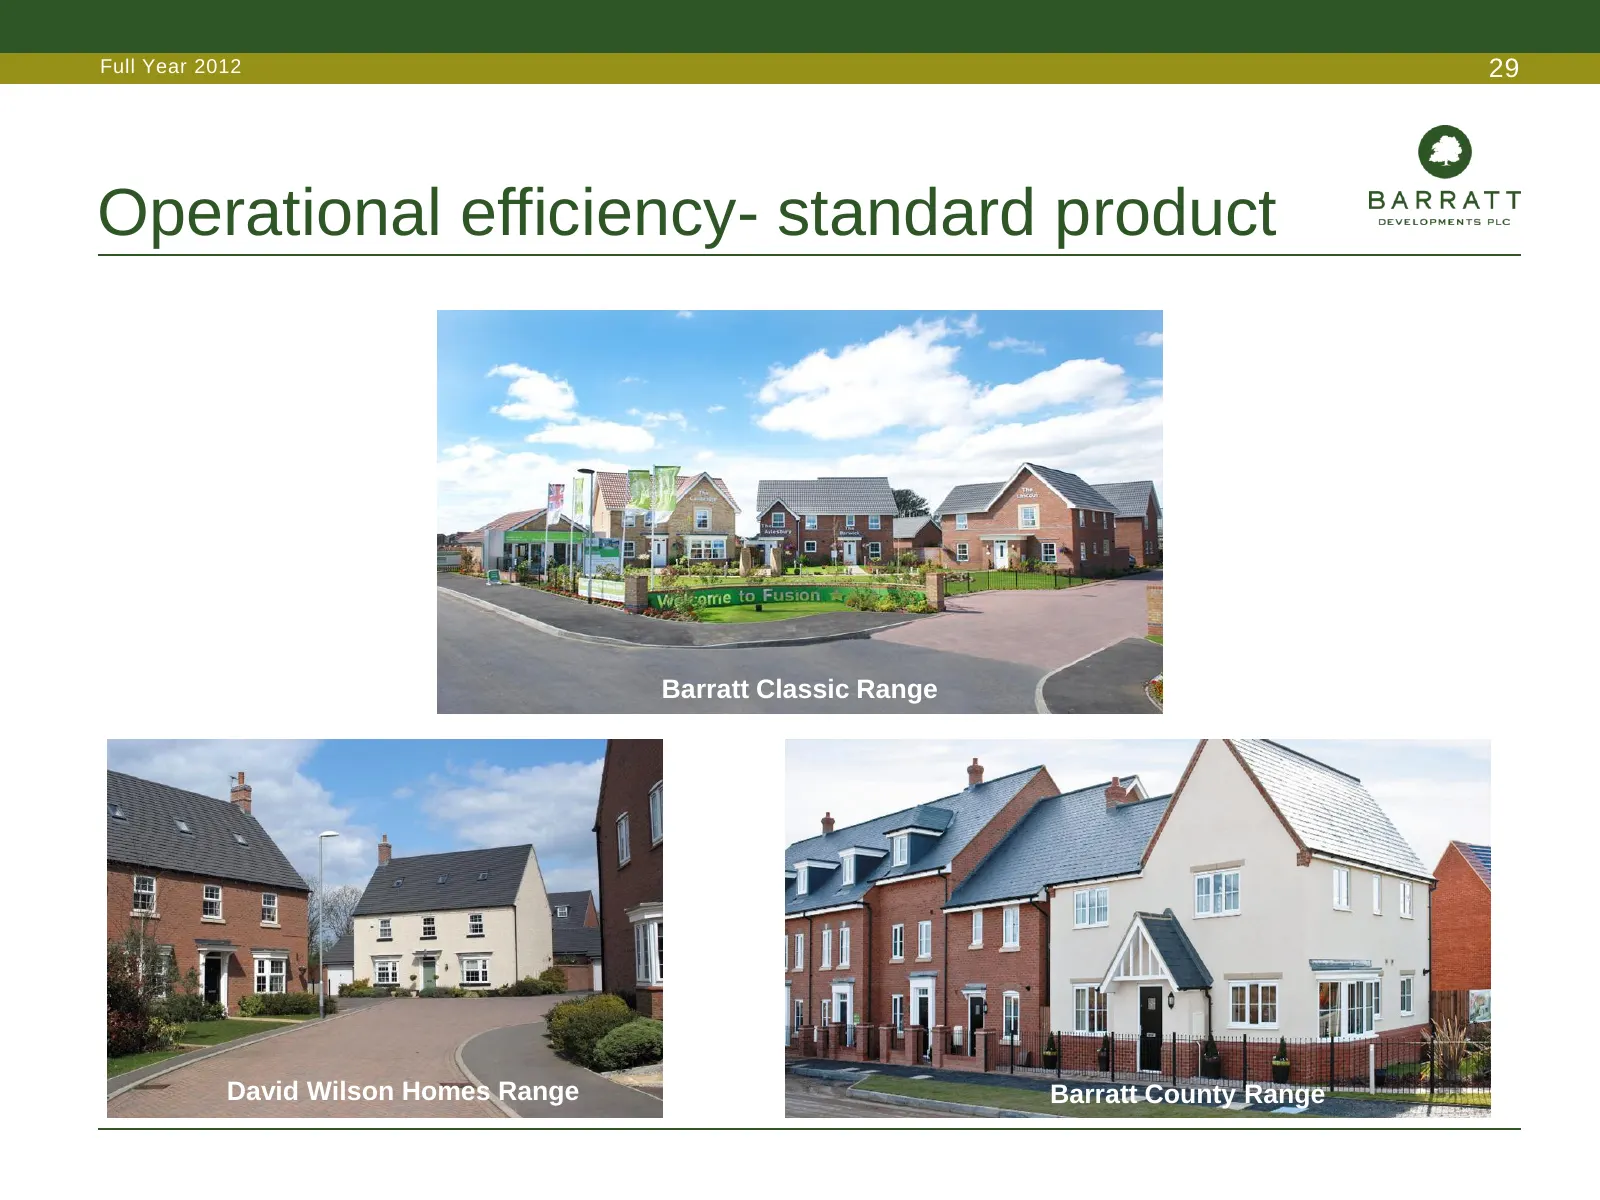
Slide 29: Operational efficiency - standard product
Full Year 2012 29 Operational efficiency- standard product Barratt Classic Range David Wilson Homes Range Barratt County Range
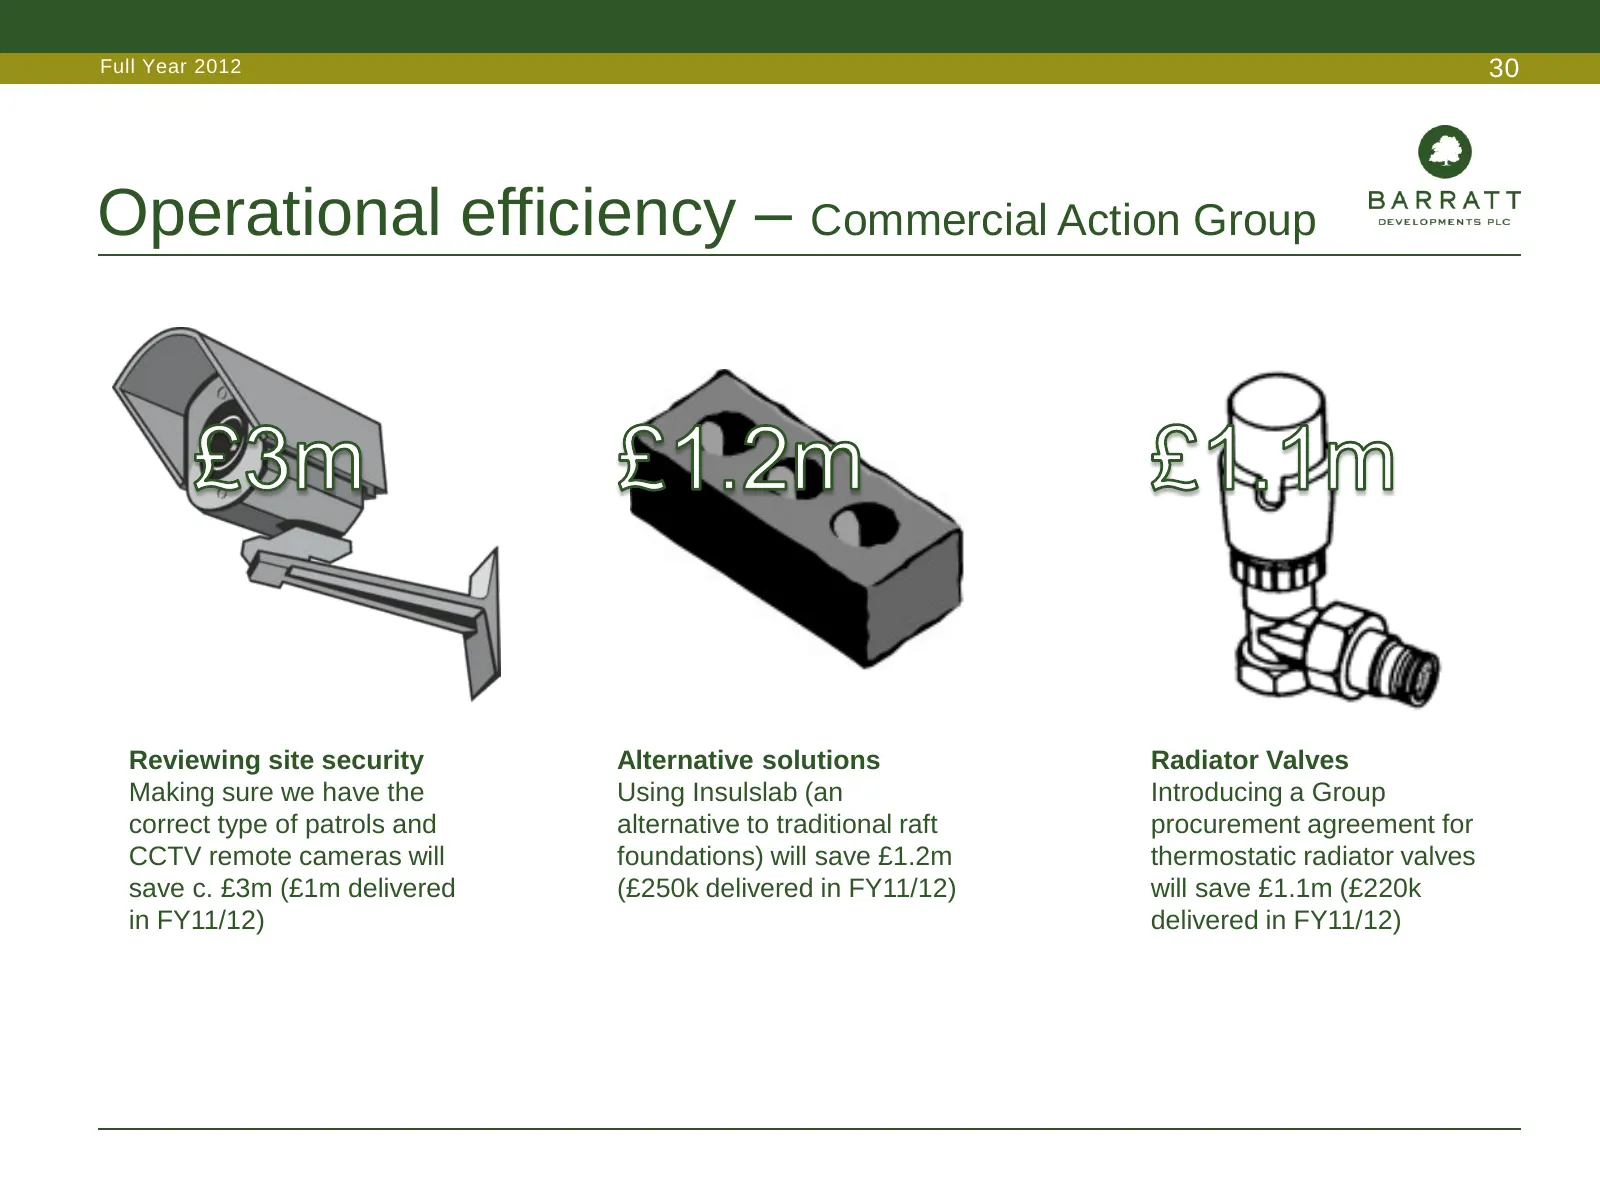
Slide 30: Operational efficiency – Commercial Action Group
Full Year 2012 30 Operational efficiency – Commercial Action Group Reviewing site security Alternative solutions Radiator Valves Making sure we have the Using Insulslab (an Introducing a Group correct type of patrols and alternative to traditional raft procurement agreement for CCTV remote cameras w
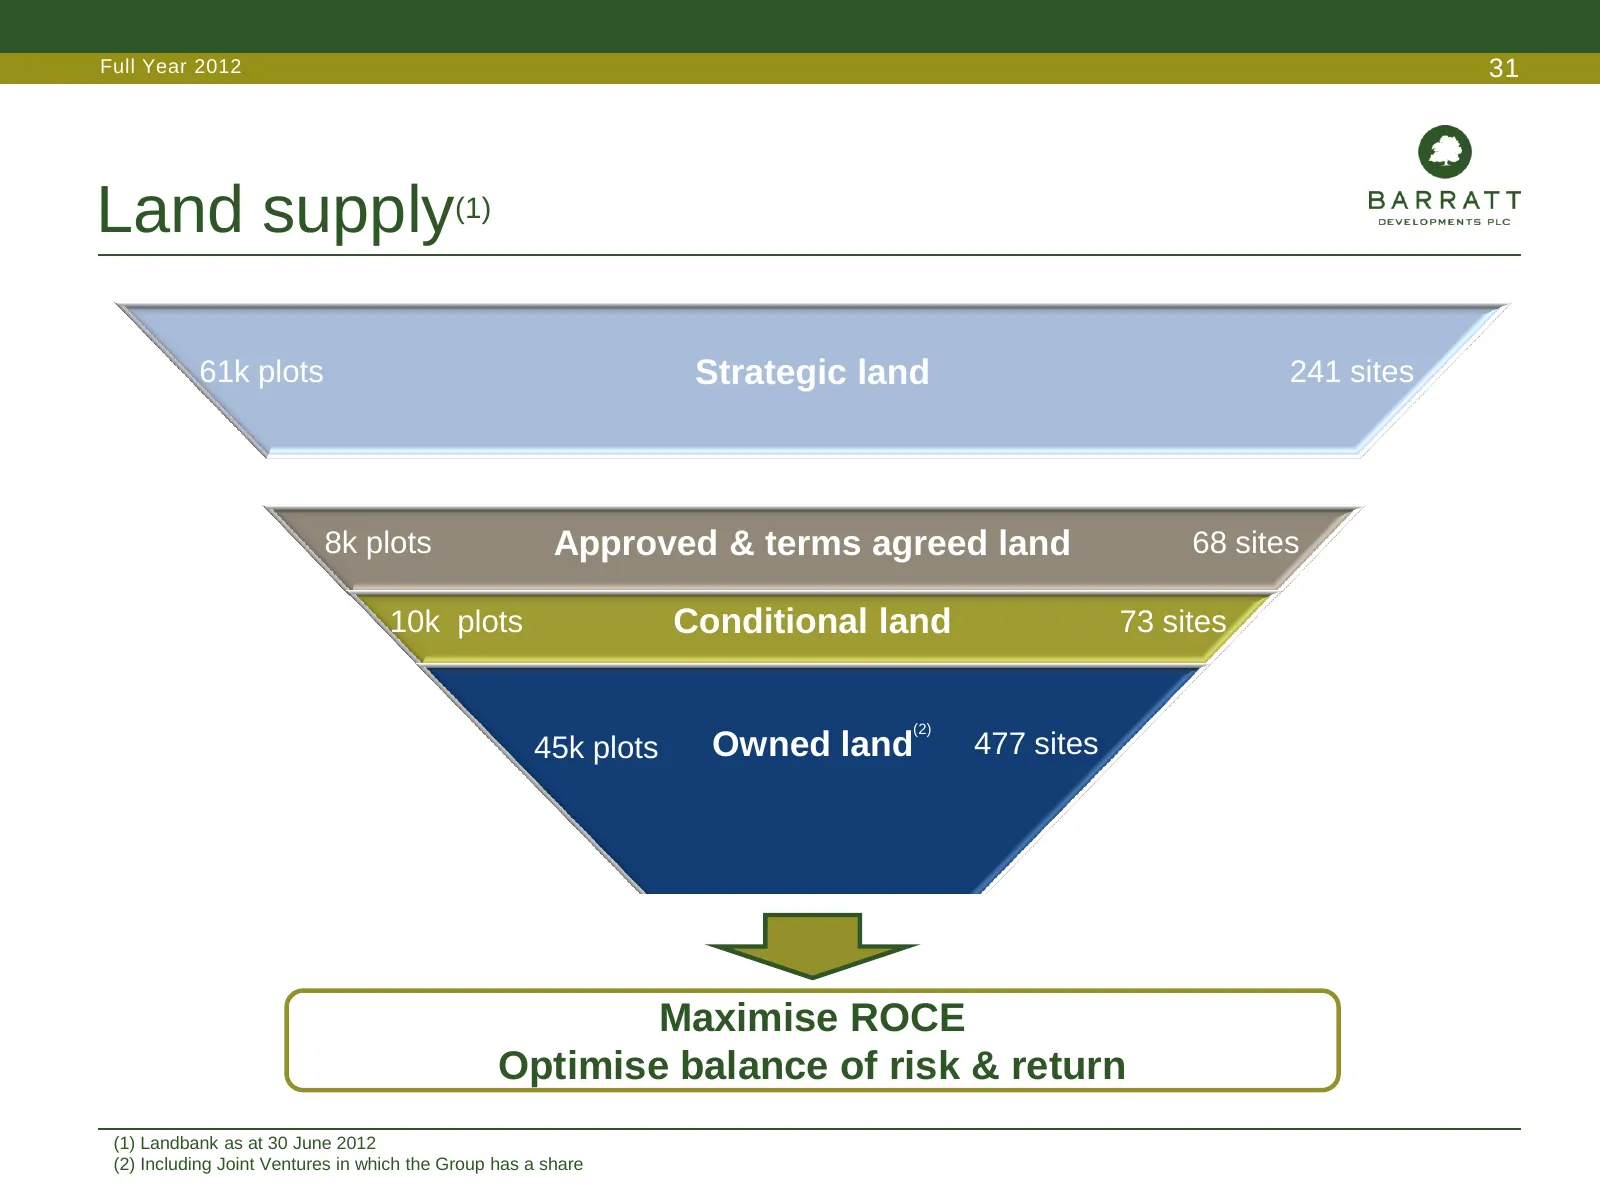
Slide 31: Land supply
Full Year 2012 31 Land supply(1) 61k plots Strategic land 241 sites 8k plots Approved & terms agreed land 68 sites 10k plots Conditional land 73 sites (2) 45k plots Owned land 477 sites Maximise ROCE Optimise balance of risk & return (1) Landbank as at 30 June 2012 (2) Including Joint Ventures in wh
Slide 32: Targeted land buying - criteria
Full Year 2012 32 Targeted land buying - criteria • Targeted areas • Subject to planning/consented • Regionally balanced portfolio • Minimum hurdle rates • Deferred terms – matching revenues and costs • Accessing public sector land • Optimising Joint Venture opportunities Maximise ROCE Optimise bala
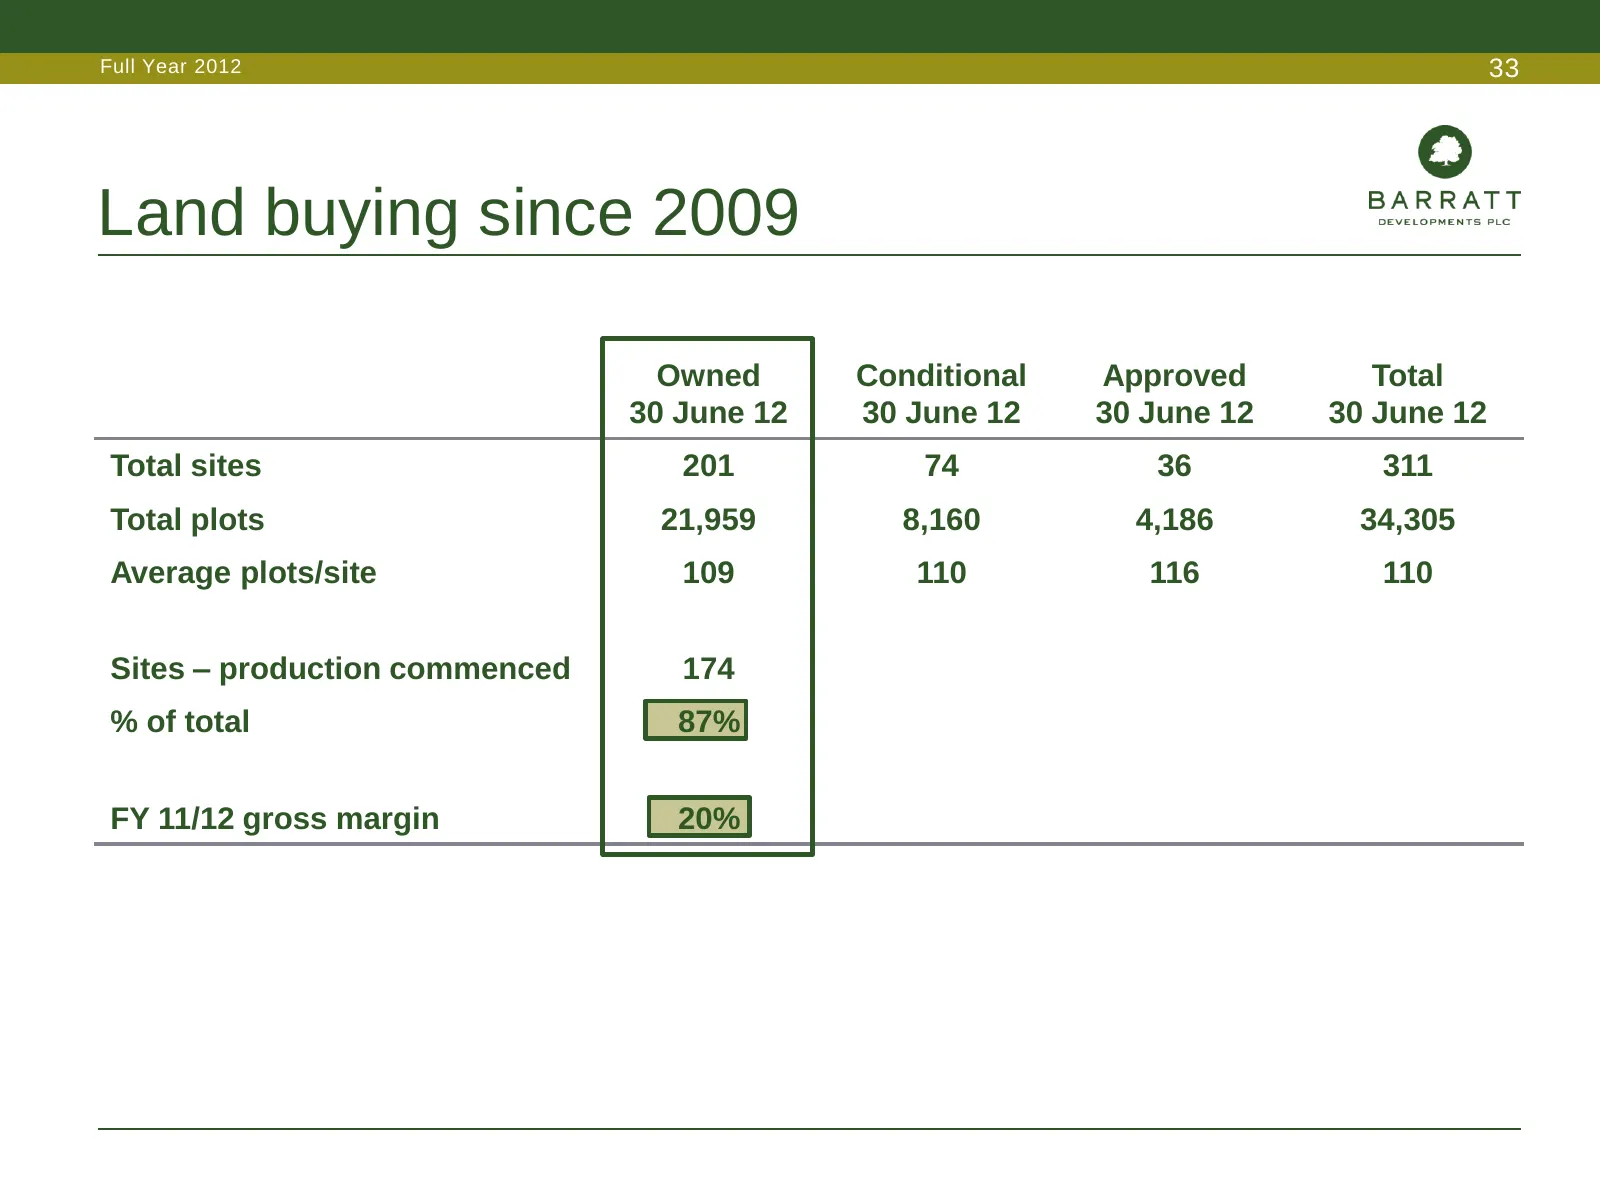
Slide 33: Land buying since 2009
Full Year 2012 33 Land buying since 2009 Owned Conditional Approved Total 30 June 12 30 June 12 30 June 12 30 June 12 Total sites 201 74 36 311 Total plots 21,959 8,160 4,186 34,305 Average plots/site 109 110 116 110 Sites – production commenced 174 % of total 87% FY 11/12 gross margin 20%
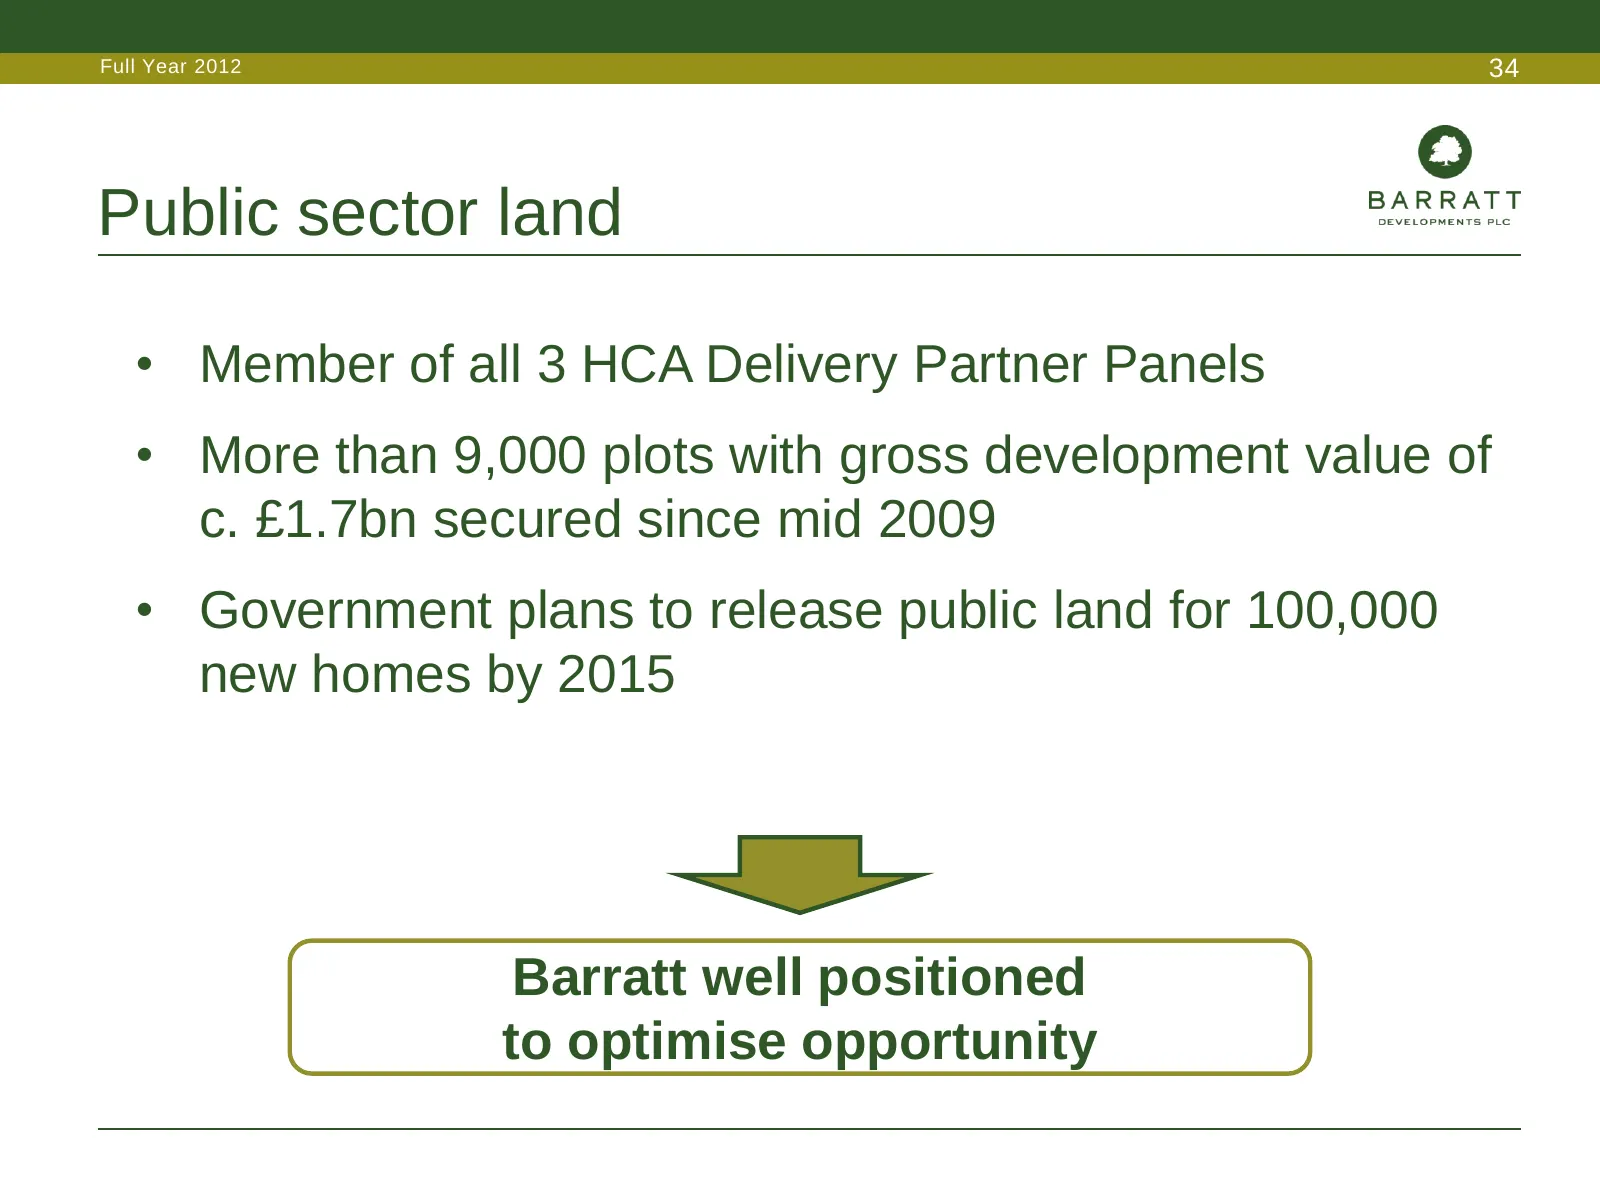
Slide 34: Public sector land
Full Year 2012 34 Public sector land • Member of all 3 HCA Delivery Partner Panels • More than 9,000 plots with gross development value of c. £1.7bn secured since mid 2009 • Government plans to release public land for 100,000 new homes by 2015 Barratt well positioned to optimise opportunity
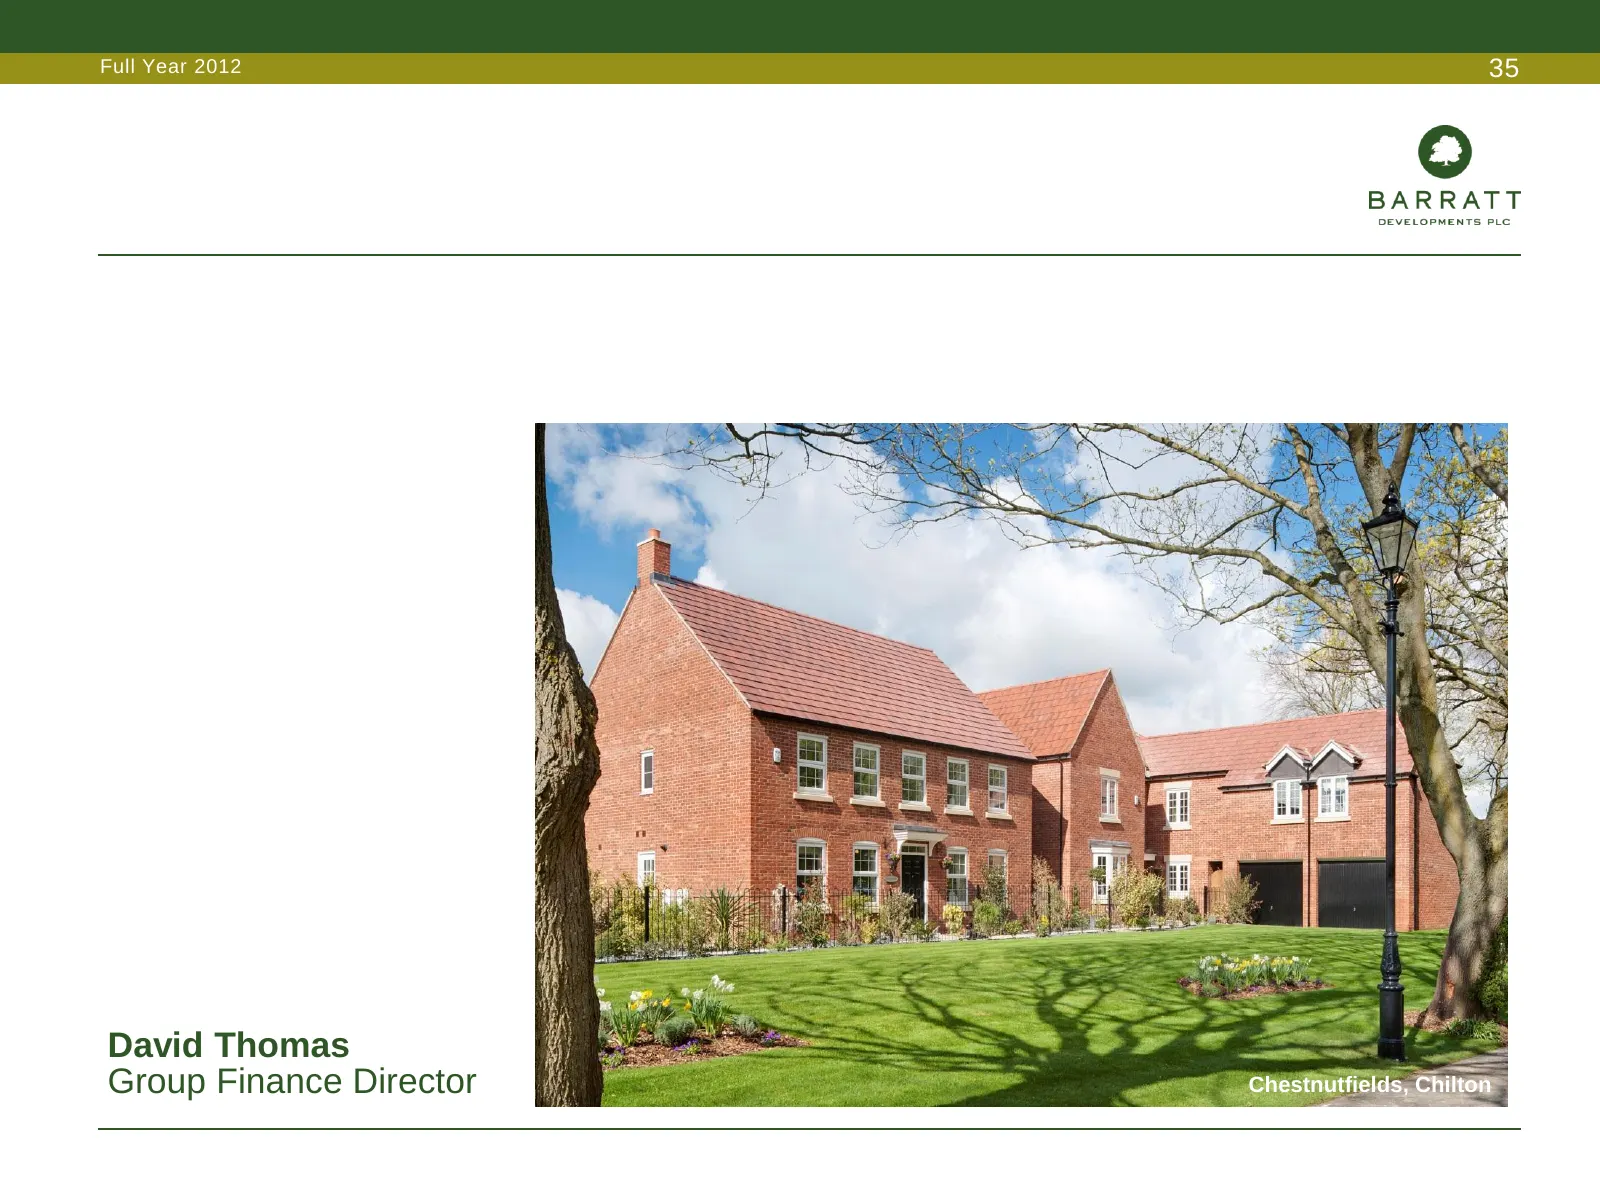
Slide 35: David Thomas, Group Finance Director
Full Year 2012 35 David Thomas Group Finance Director Chestnutfields, Chilton
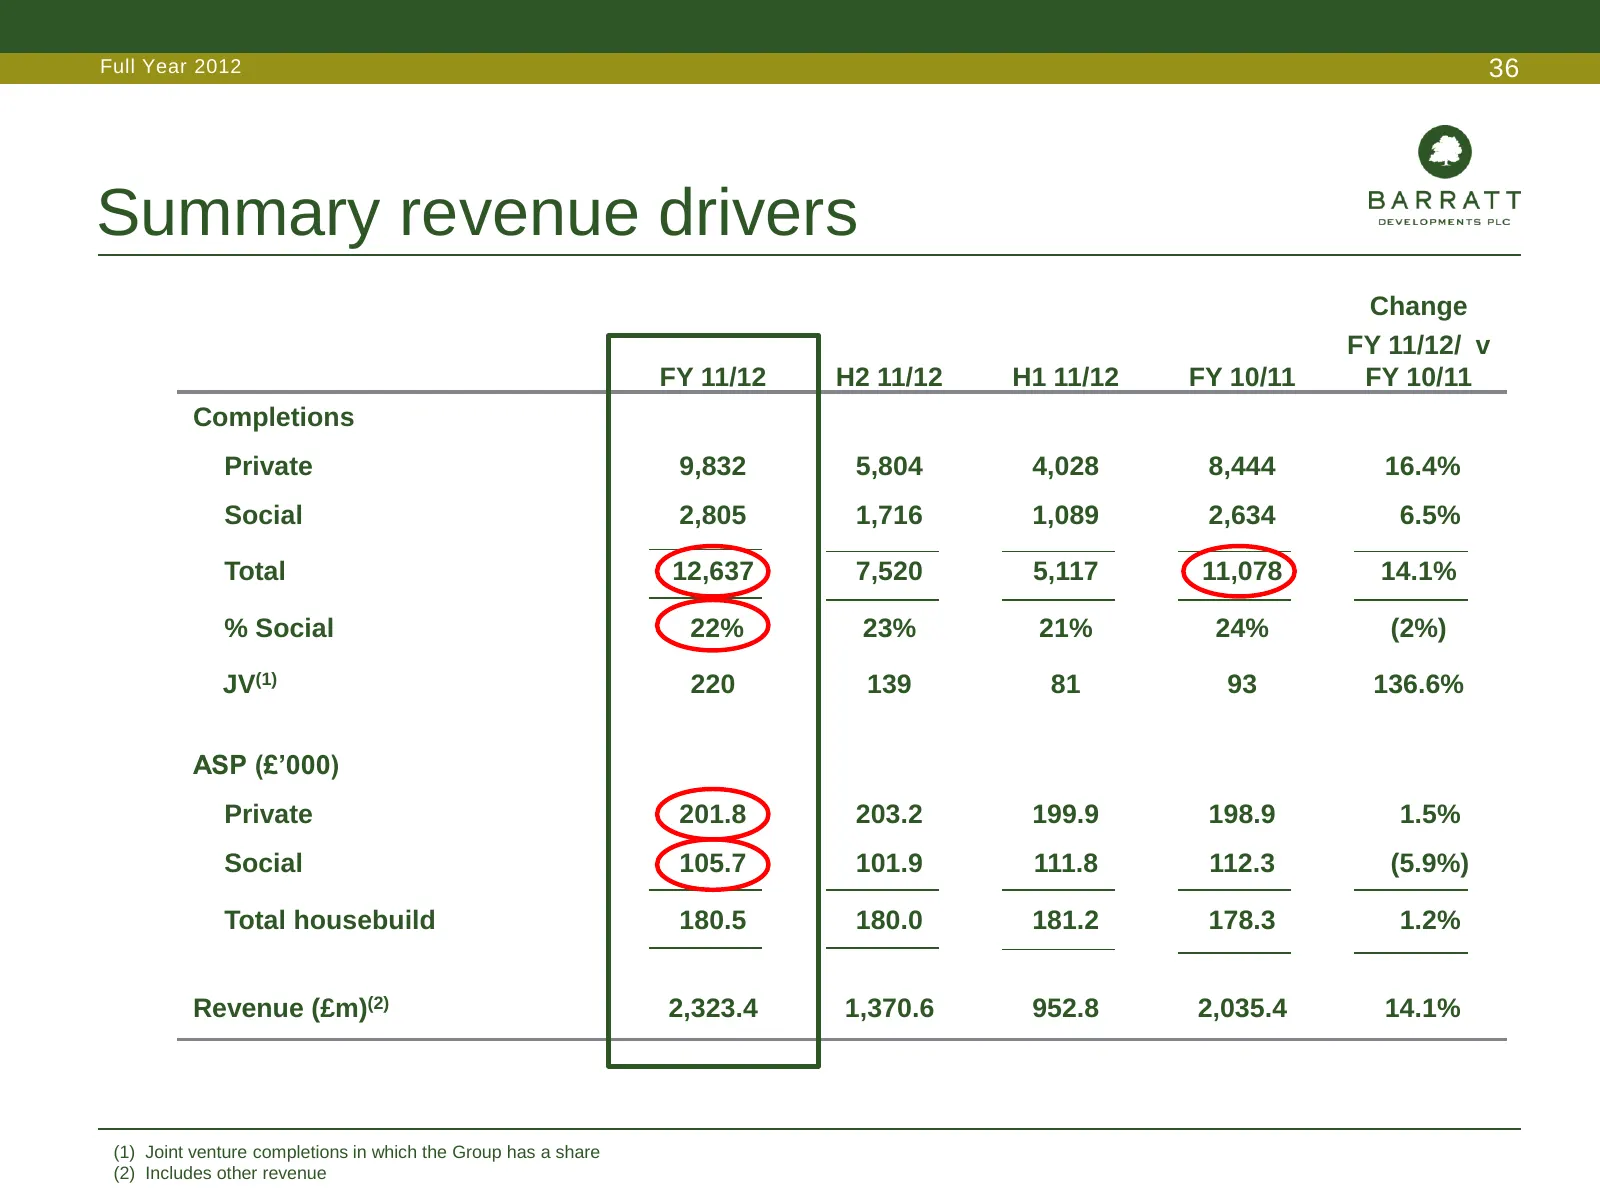
Slide 36: Summary revenue drivers
Full Year 2012 36 Summary revenue drivers Change FY 11/12/ v FY 11/12 H2 11/12 H1 11/12 FY 10/11 FY 10/11 Completions Private 9,832 5,804 4,028 8,444 16.4% Social 2,805 1,716 1,089 2,634 6.5% Total 12,637 7,520 5,117 11,078 14.1% % Social 22% 23% 21% 24% (2%) JV(1) 220 139 81 93 136.6% ASP (£’000) P
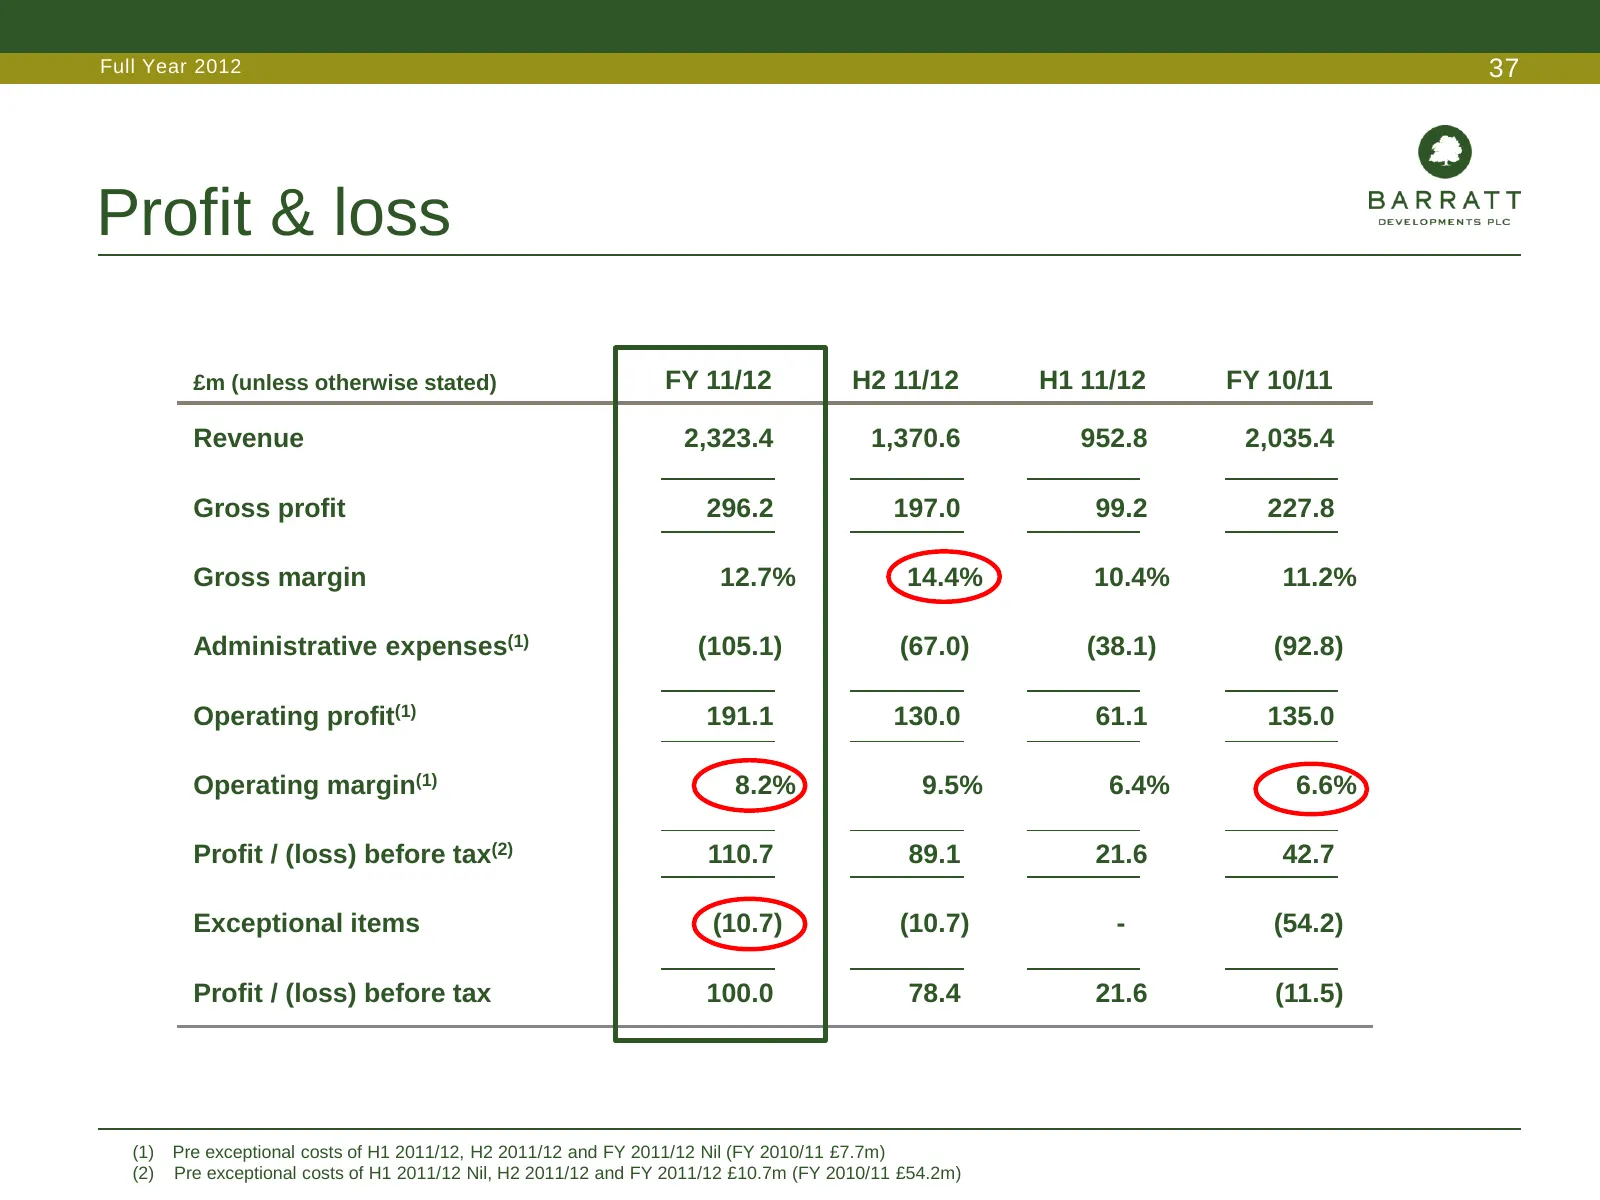
Slide 37: Profit & loss
Full Year 2012 37 Profit & loss £m (unless otherwise stated) FY 11/12 H2 11/12 H1 11/12 FY 10/11 Revenue 2,323.4 1,370.6 952.8 2,035.4 Gross profit 296.2 197.0 99.2 227.8 Gross margin 12.7% 14.4% 10.4% 11.2% Administrative expenses(1) (105.1) (67.0) (38.1) (92.8) Operating profit(1) 191.1 130.0 61.1
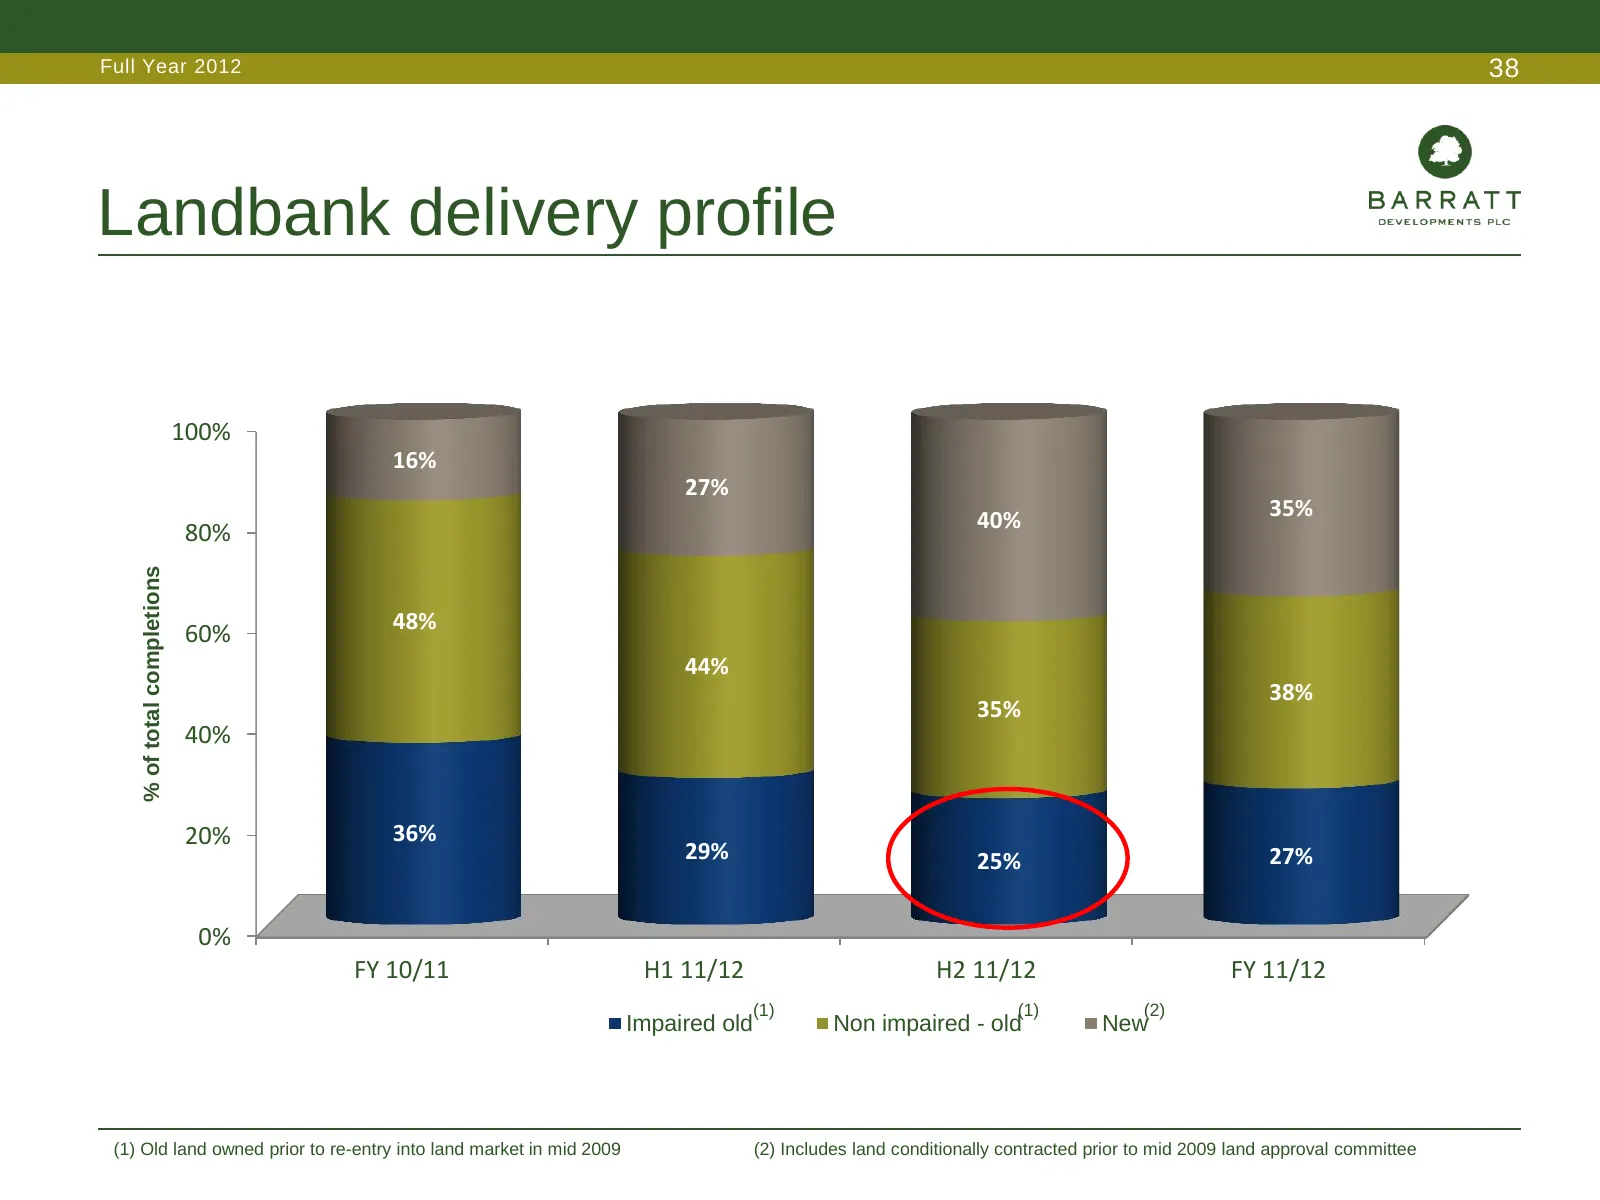
Slide 38: Landbank delivery profile
Full Year 2012 38 Landbank delivery profile 100% 16% 27% 35% 40% 80% % of total completions 48% 60% 44% 38% 35% 40% 20% 36% 29% 25% 27% 0% FY 10/11 H1 11/12 H2 11/12 FY 11/12 (1) (1) (2) Impaired old Non impaired - old New (1) Old land owned prior to re-entry into land market in mid 2009 (2) Include
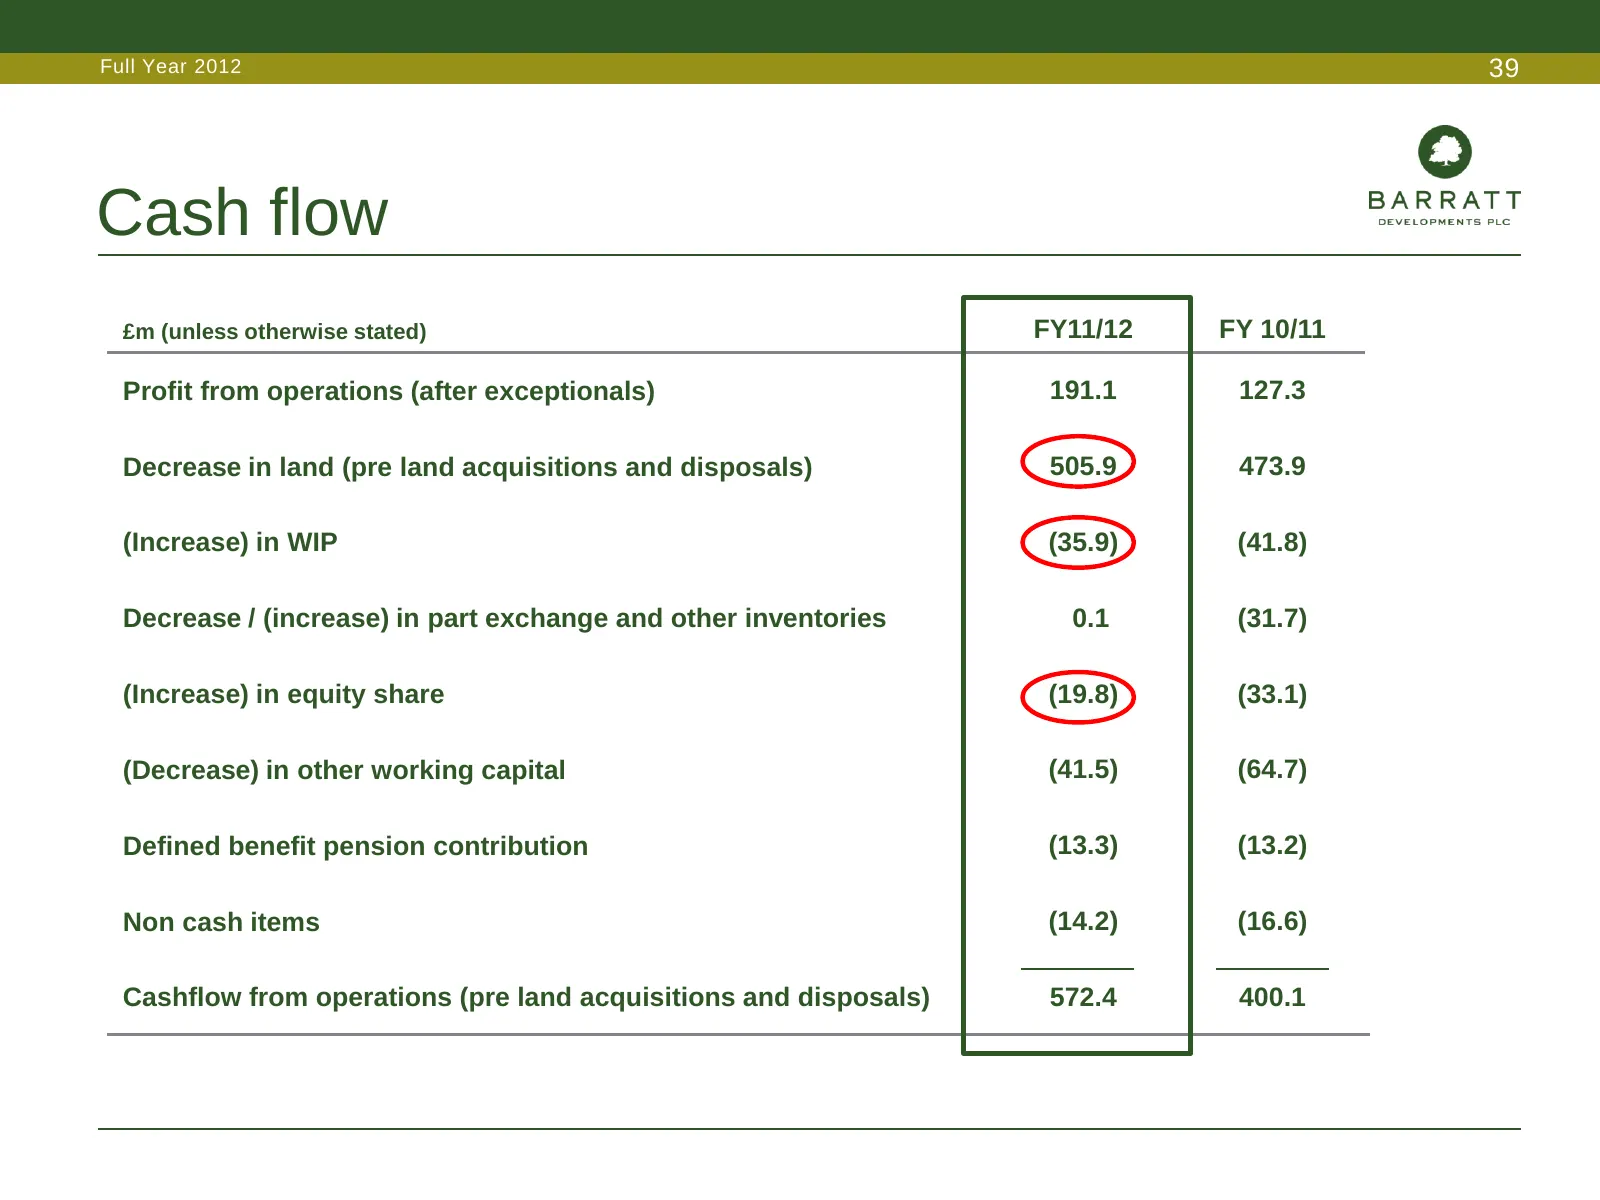
Slide 39: Cash flow
Full Year 2012 39 Cash flow £m (unless otherwise stated) FY11/12 FY 10/11 Profit from operations (after exceptionals) 191.1 127.3 Decrease in land (pre land acquisitions and disposals) 505.9 473.9 (Increase) in WIP (35.9) (41.8) Decrease / (increase) in part exchange and other inventories 0.1 (31.7)
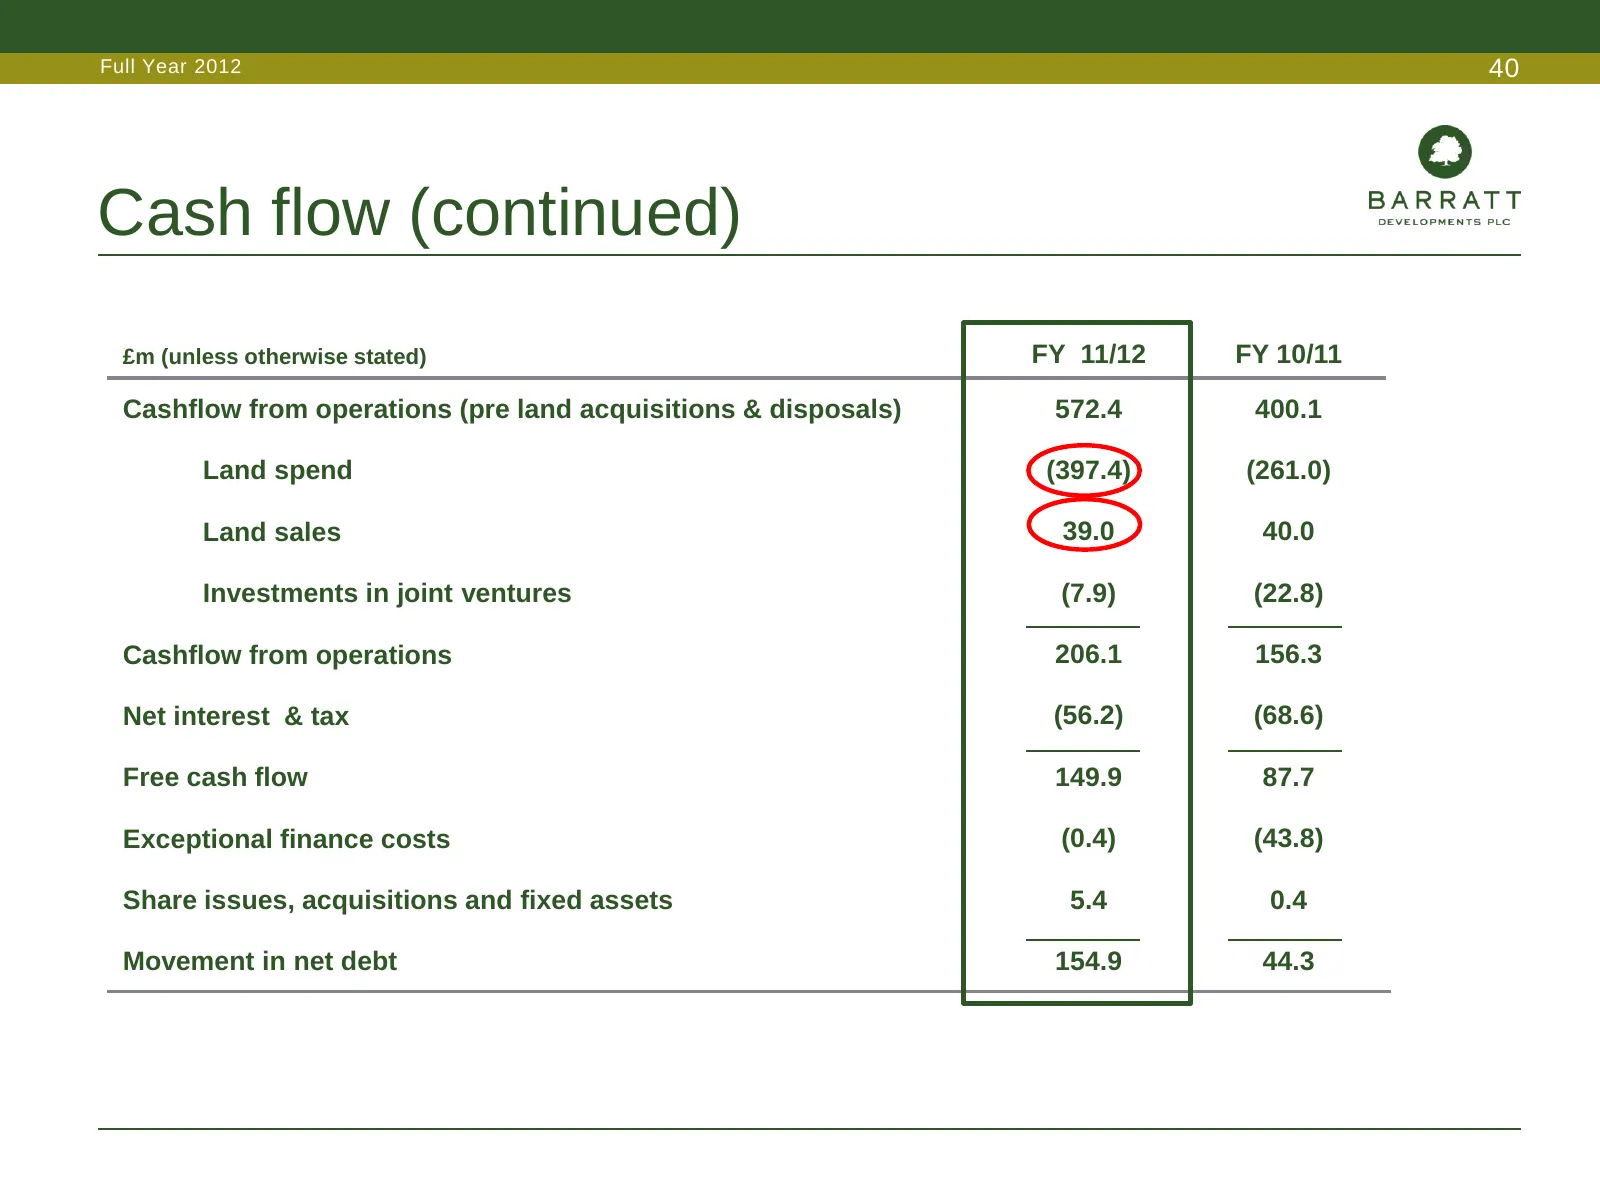
Slide 40: Cash flow (continued)
Full Year 2012 40 Cash flow (continued) £m (unless otherwise stated) FY 11/12 FY 10/11 Cashflow from operations (pre land acquisitions & disposals) 572.4 400.1 Land spend (397.4) (261.0) Land sales 39.0 40.0 Investments in joint ventures (7.9) (22.8) Cashflow from operations 206.1 156.3 Net interest
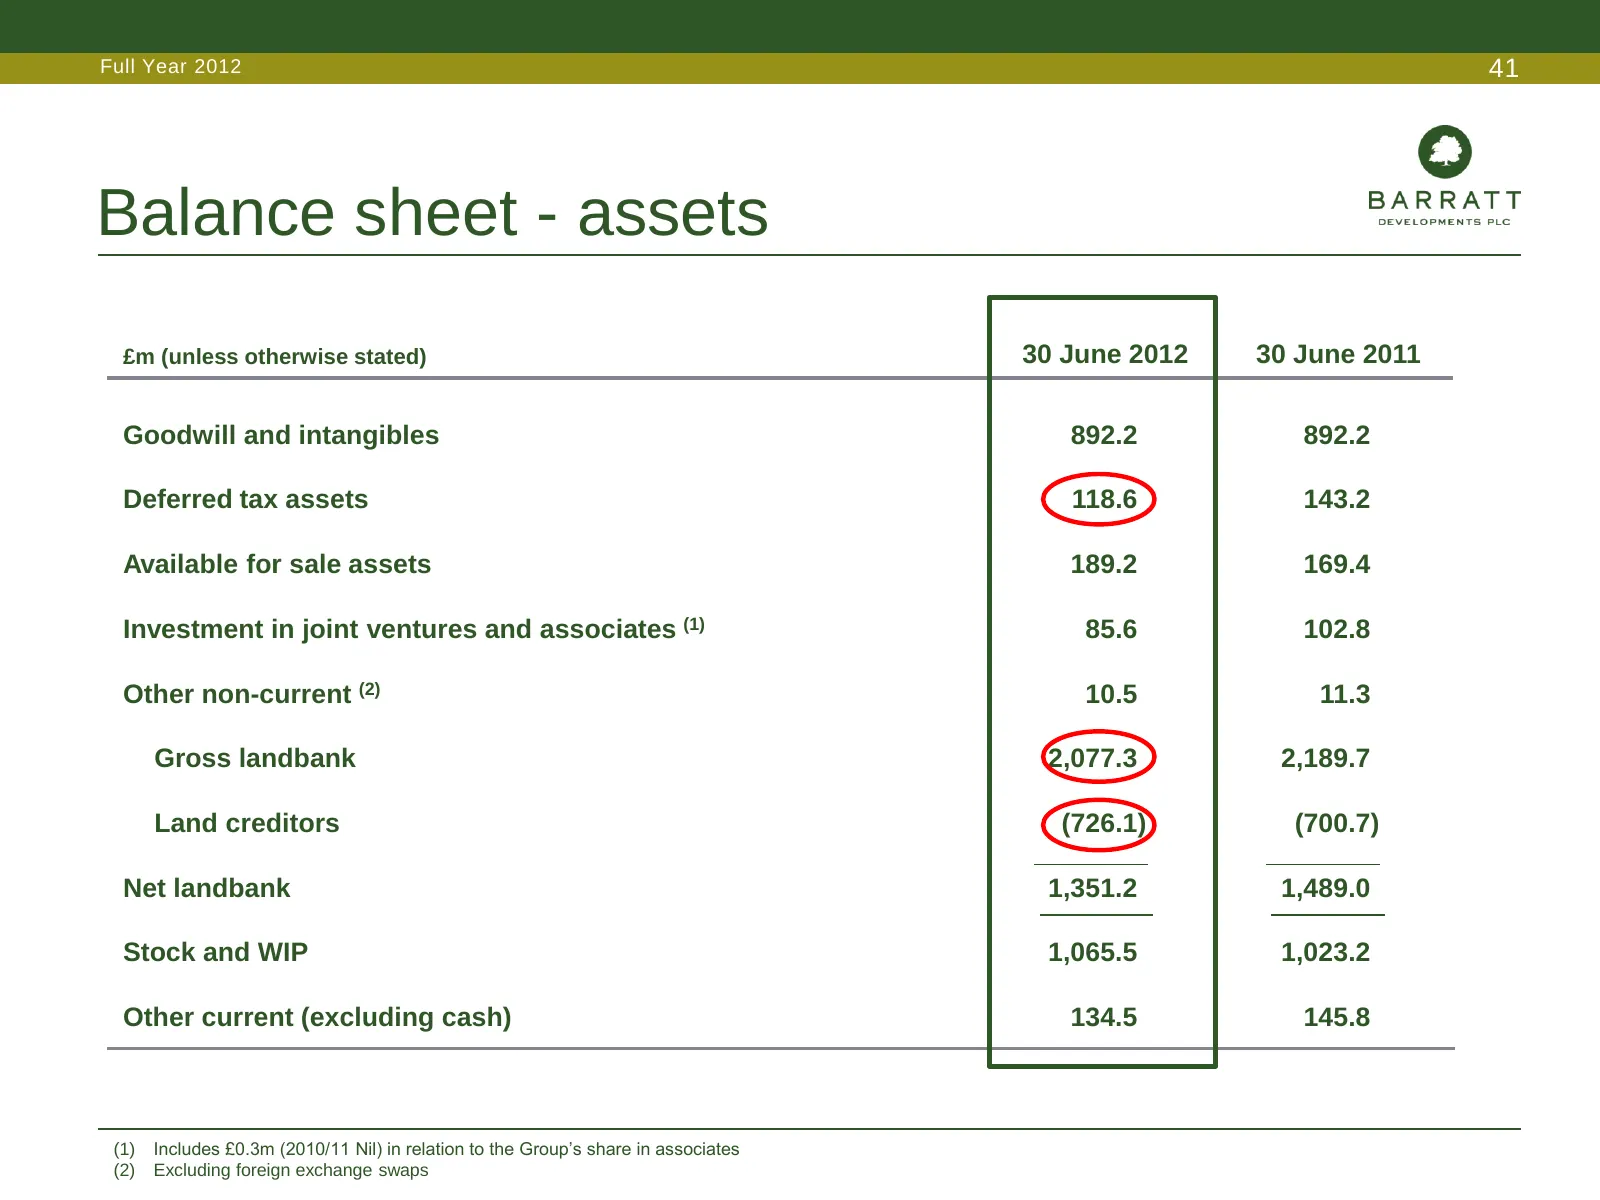
Slide 41: Balance sheet - assets
Full Year 2012 41 Balance sheet - assets £m (unless otherwise stated) 30 June 2012 30 June 2011 Goodwill and intangibles 892.2 892.2 Deferred tax assets 118.6 143.2 Available for sale assets 189.2 169.4 Investment in joint ventures and associates (1) 85.6 102.8 Other non-current (2) 10.5 11.3 Gross
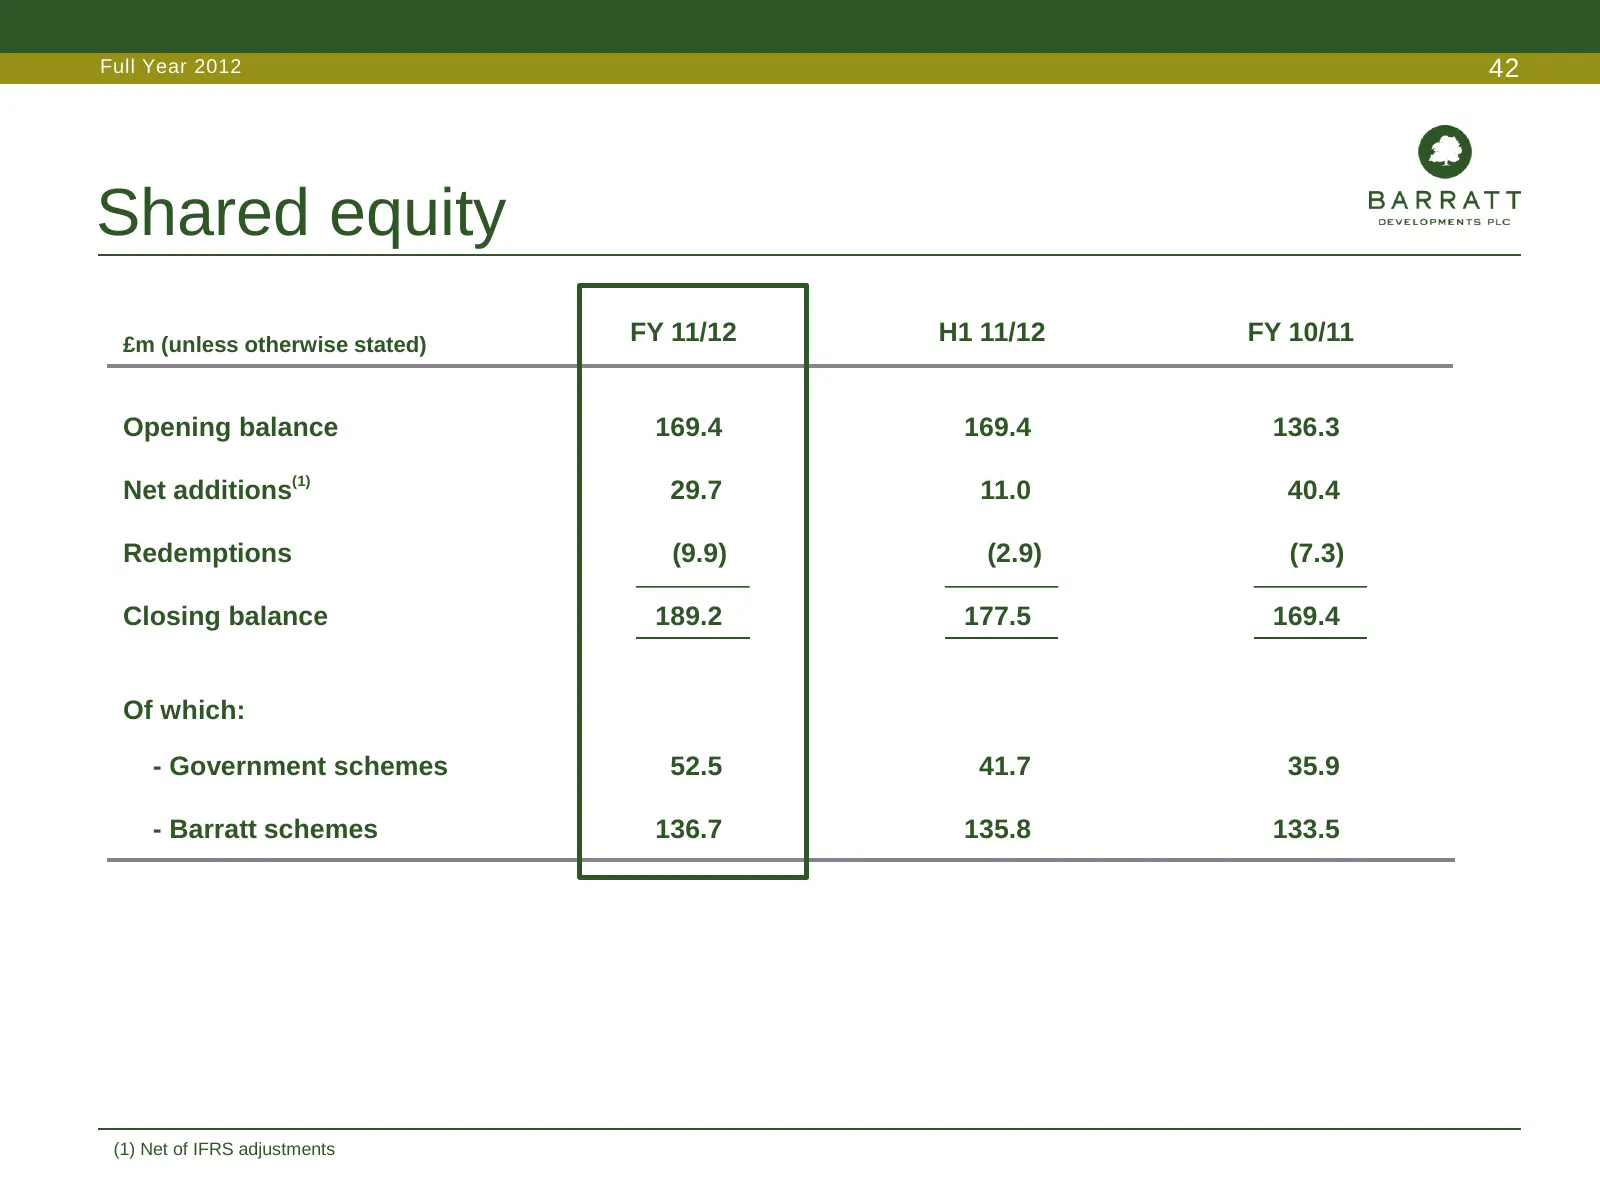
Slide 42: Shared equity
Full Year 2012 42 Shared equity £m (unless otherwise stated) FY 11/12 H1 11/12 FY 10/11 Opening balance 169.4 169.4 136.3 Net additions(1) 29.7 11.0 40.4 Redemptions (9.9) (2.9) (7.3) Closing balance 189.2 177.5 169.4 Of which: - Government schemes 52.5 41.7 35.9 - Barratt schemes 136.7 135.8 133.5
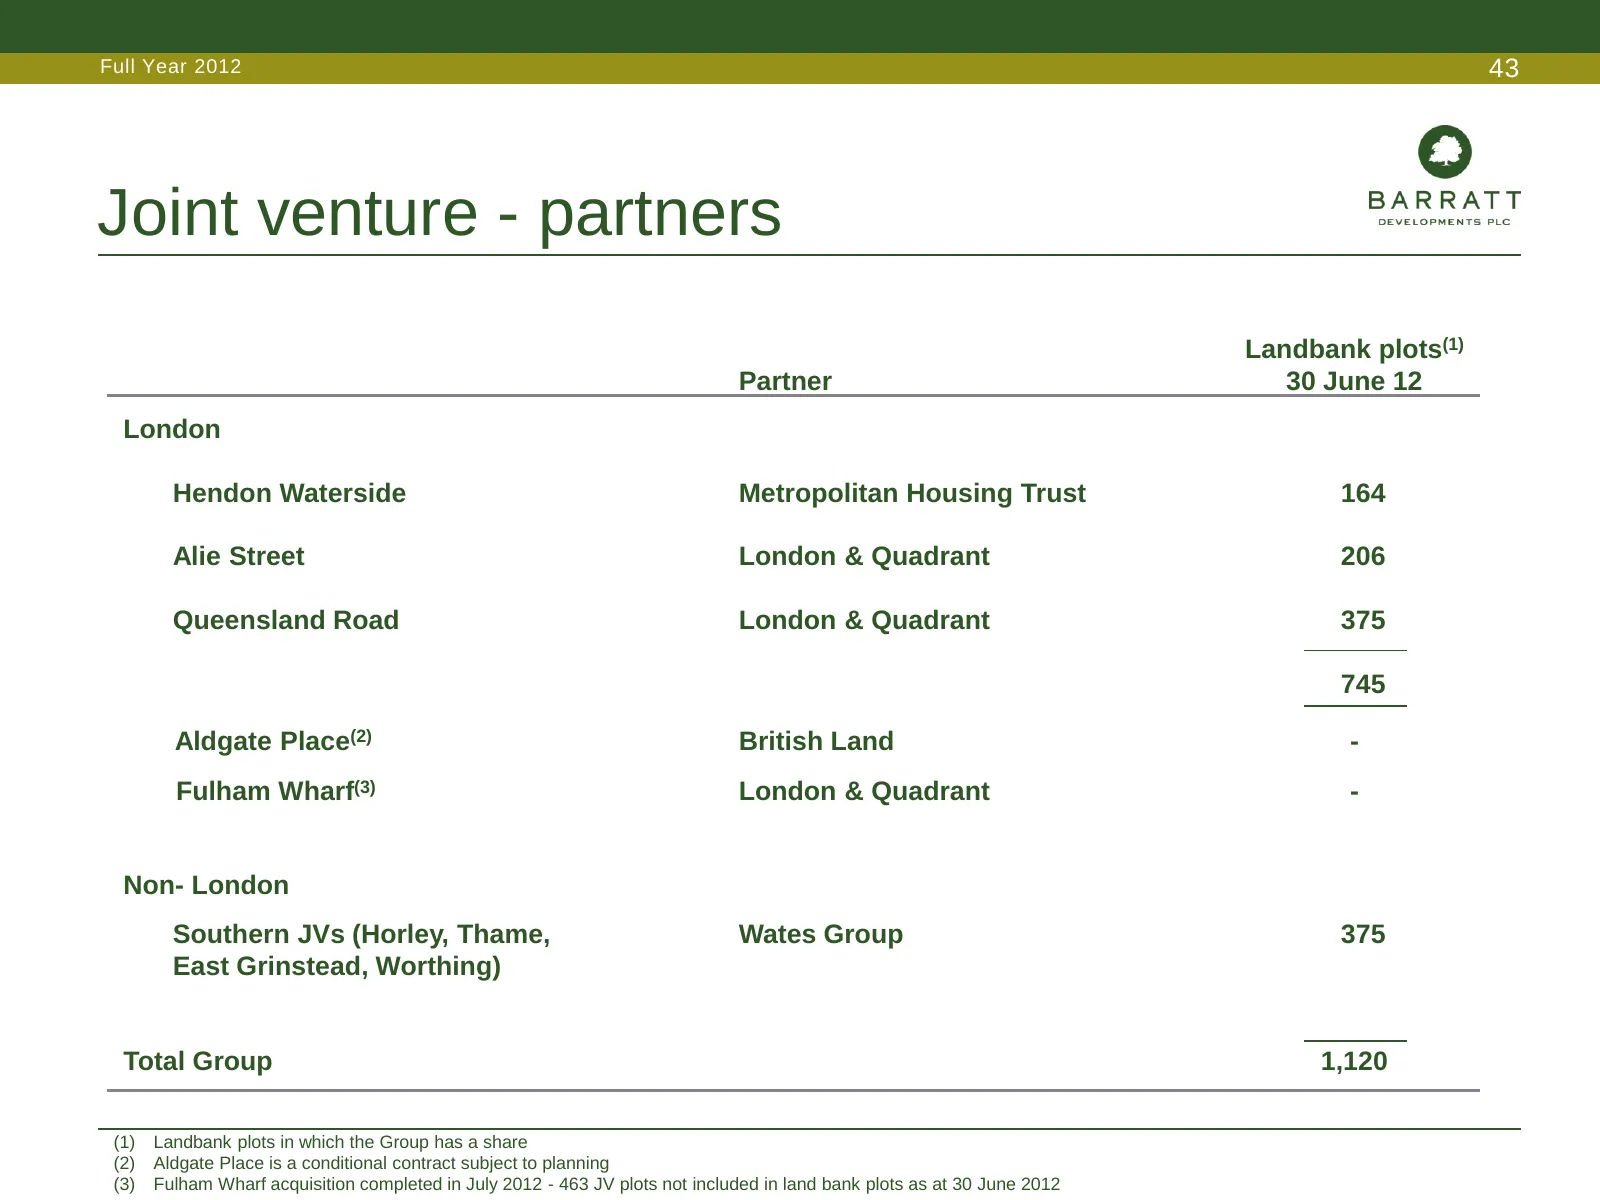
Slide 43: Joint venture - partners
Full Year 2012 43 Joint venture - partners Landbank plots(1) Partner 30 June 12 London Hendon Waterside Metropolitan Housing Trust 164 Alie Street London & Quadrant 206 Queensland Road London & Quadrant 375 745 Aldgate Place(2) British Land - Fulham Wharf(3) London & Quadrant - Non- London Southern
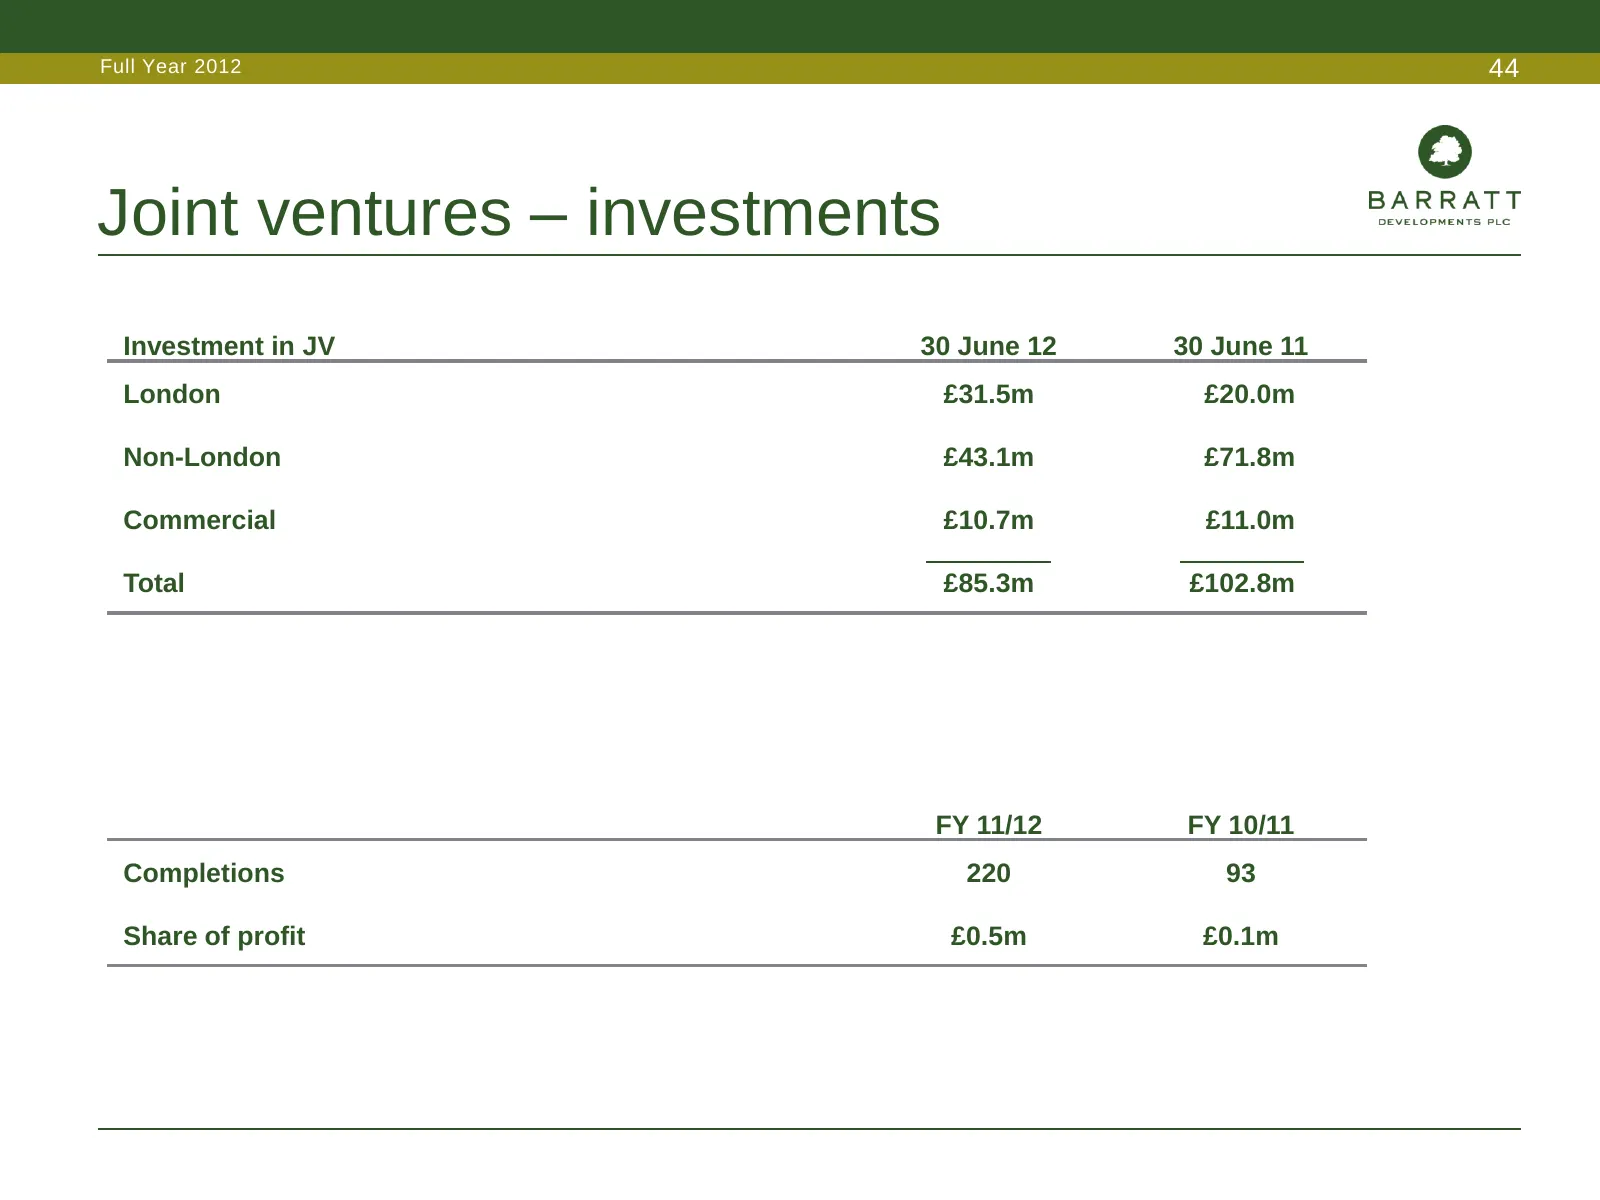
Slide 44: Joint ventures – investments
Full Year 2012 44 Joint ventures – investments Investment in JV 30 June 12 30 June 11 London £31.5m £20.0m Non-London £43.1m £71.8m Commercial £10.7m £11.0m Total £85.3m £102.8m FY 11/12 FY 10/11 Completions 220 93 Share of profit £0.5m £0.1m
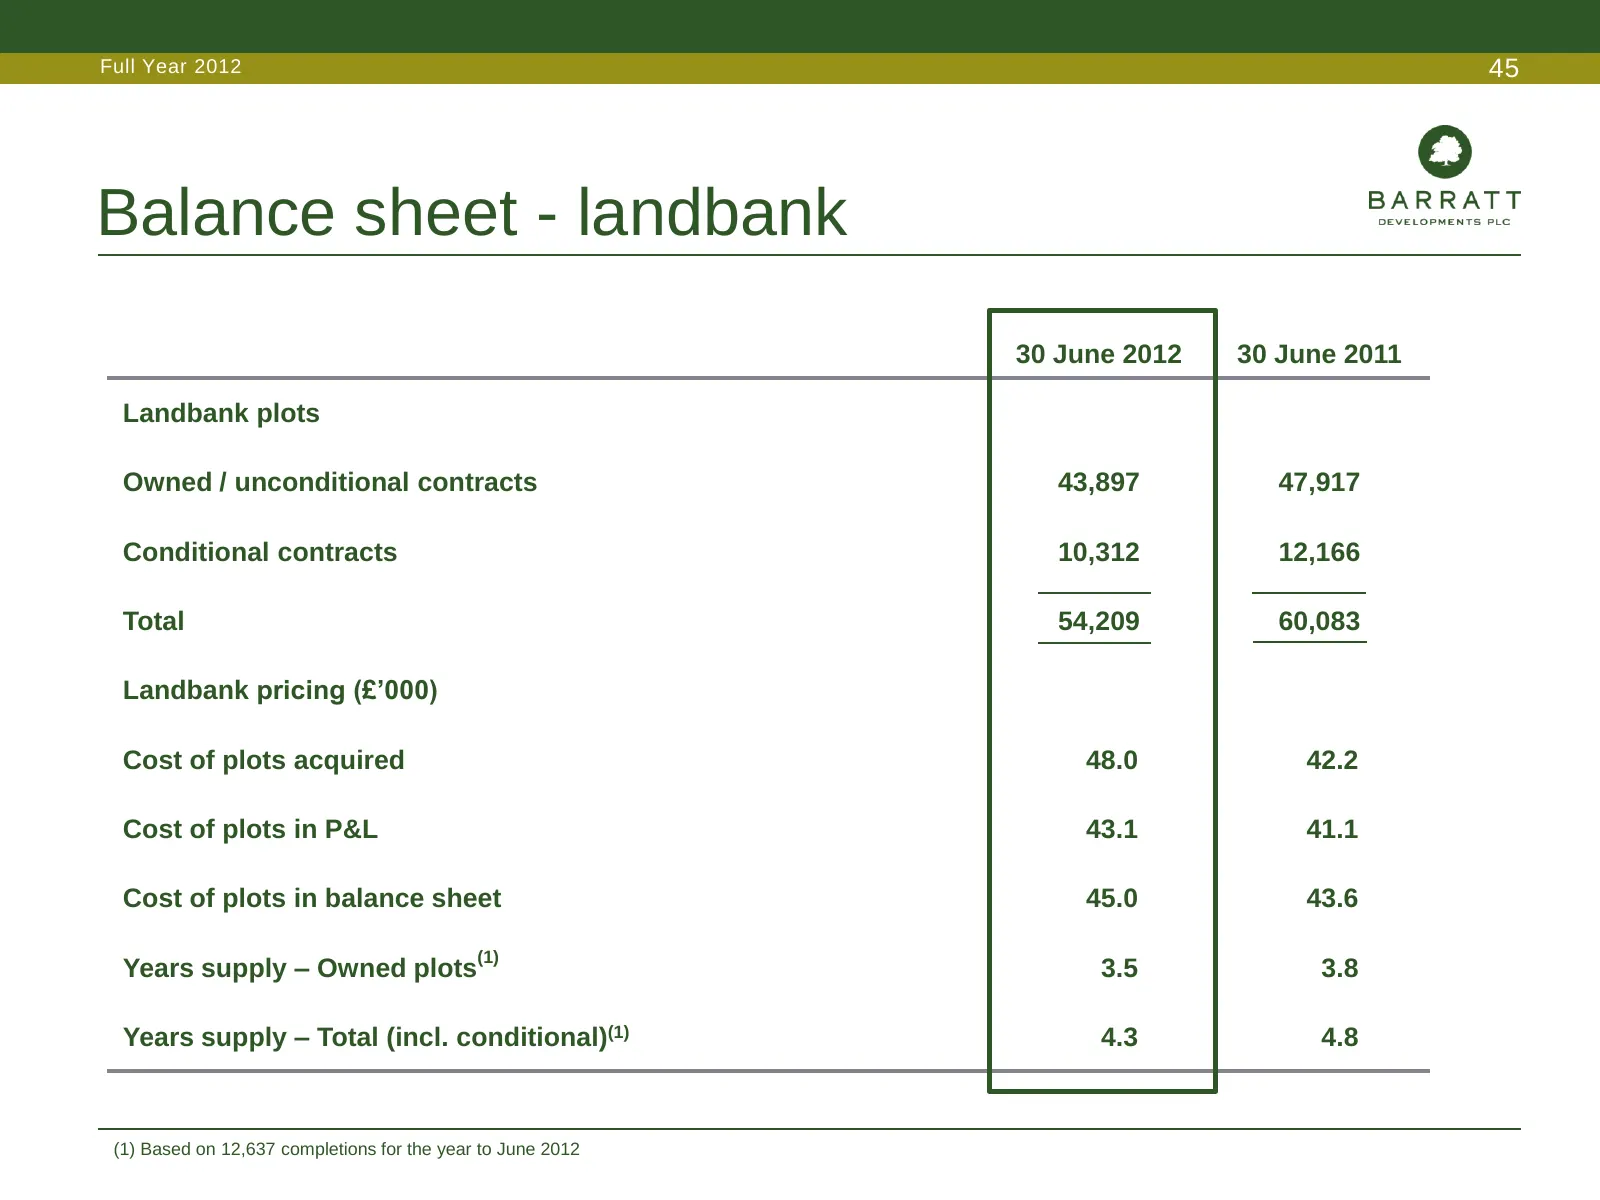
Slide 45: Balance sheet - landbank
Full Year 2012 45 Balance sheet - landbank 30 June 2012 30 June 2011 Landbank plots Owned / unconditional contracts 43,897 47,917 Conditional contracts 10,312 12,166 Total 54,209 60,083 Landbank pricing (£’000) Cost of plots acquired 48.0 42.2 Cost of plots in P&L 43.1 41.1 Cost of plots in balance
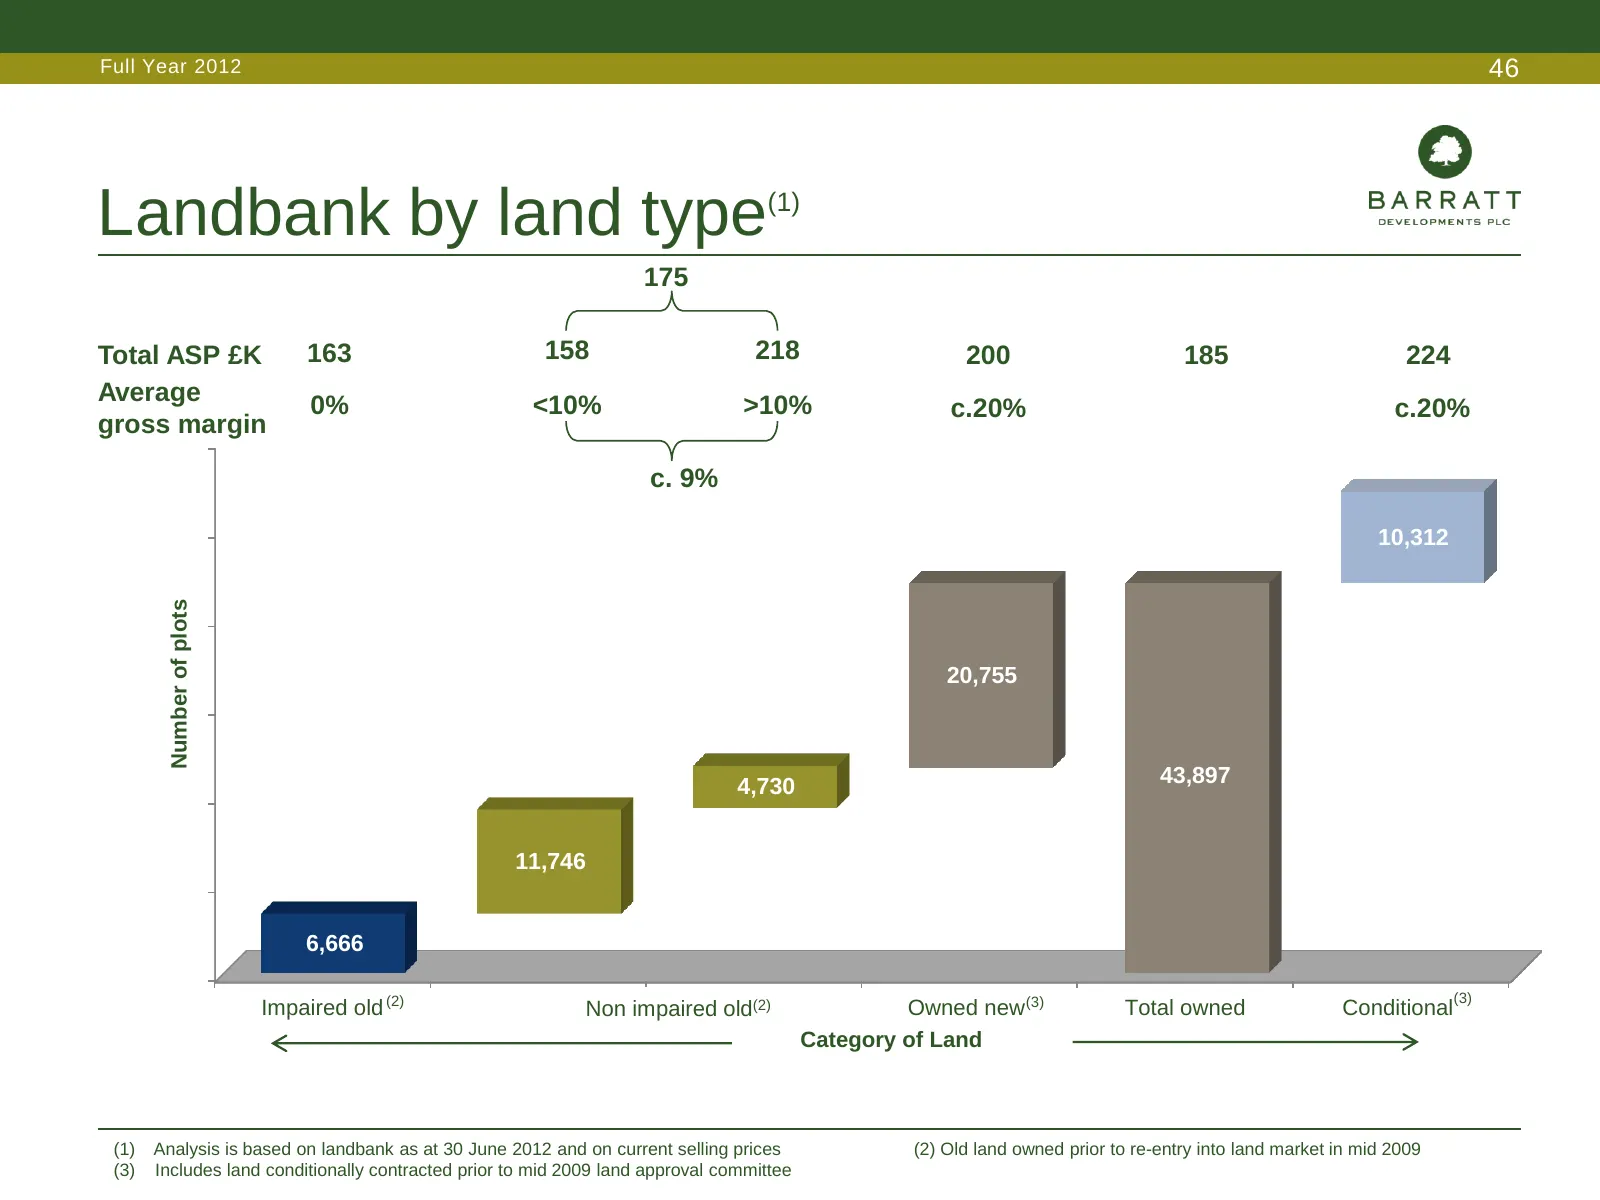
Slide 46: Landbank by land type
Full Year 2012 46 Landbank by land type (1) 175 Total ASP £K 163 158 218 200 185 224 Average 0% <10% >10% c.20% c.20% gross margin c. 9% 10,312 Number of plots 20,755 4,730 43,897 11,746 6,666 (3) Impaired old (2) Non-impairedNon old impaired old(2) Owned new (3) Total owned Conditional Category of
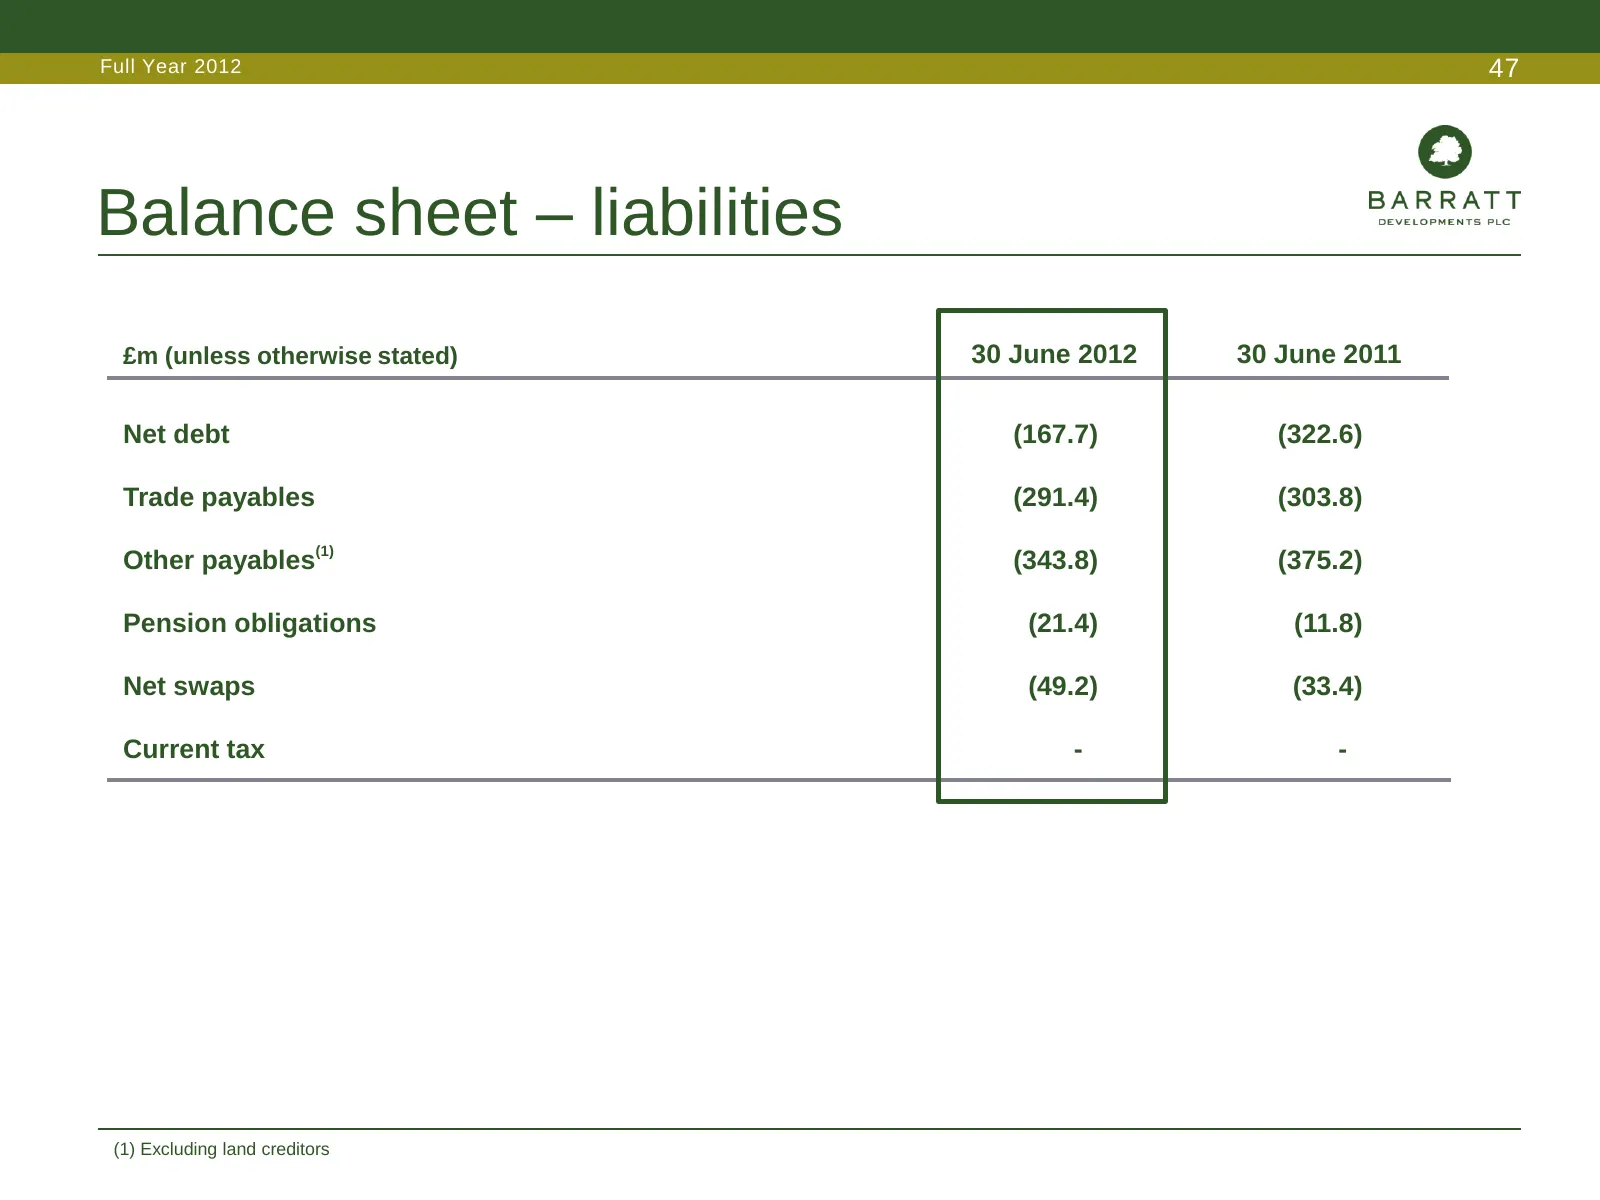
Slide 47: Balance sheet – liabilities
Full Year 2012 47 Balance sheet – liabilities £m (unless otherwise stated) 30 June 2012 30 June 2011 Net debt (167.7) (322.6) Trade payables (291.4) (303.8) Other payables(1) (343.8) (375.2) Pension obligations (21.4) (11.8) Net swaps (49.2) (33.4) Current tax - - (1) Excluding land creditors
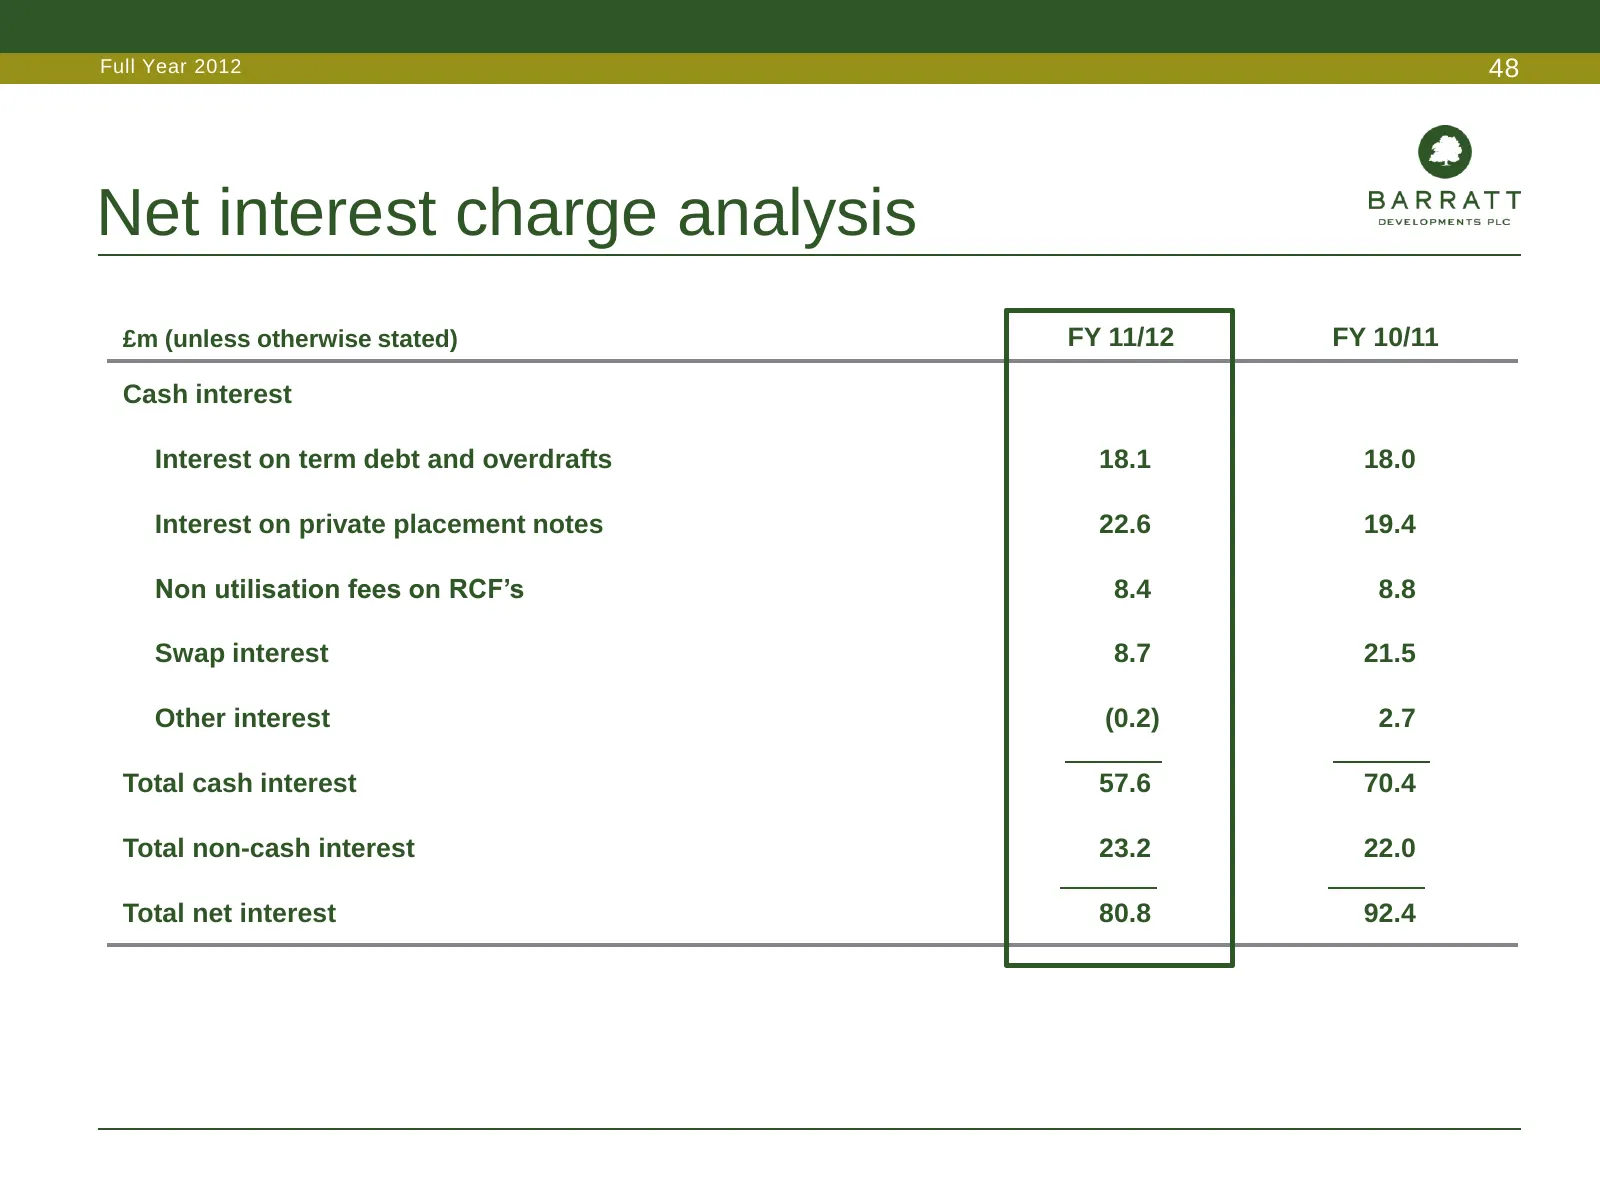
Slide 48: Net interest charge analysis
Full Year 2012 48 Net interest charge analysis £m (unless otherwise stated) FY 11/12 FY 10/11 Cash interest Interest on term debt and overdrafts 18.1 18.0 Interest on private placement notes 22.6 19.4 Non utilisation fees on RCF’s 8.4 8.8 Swap interest 8.7 21.5 Other interest (0.2) 2.7 Total cash in
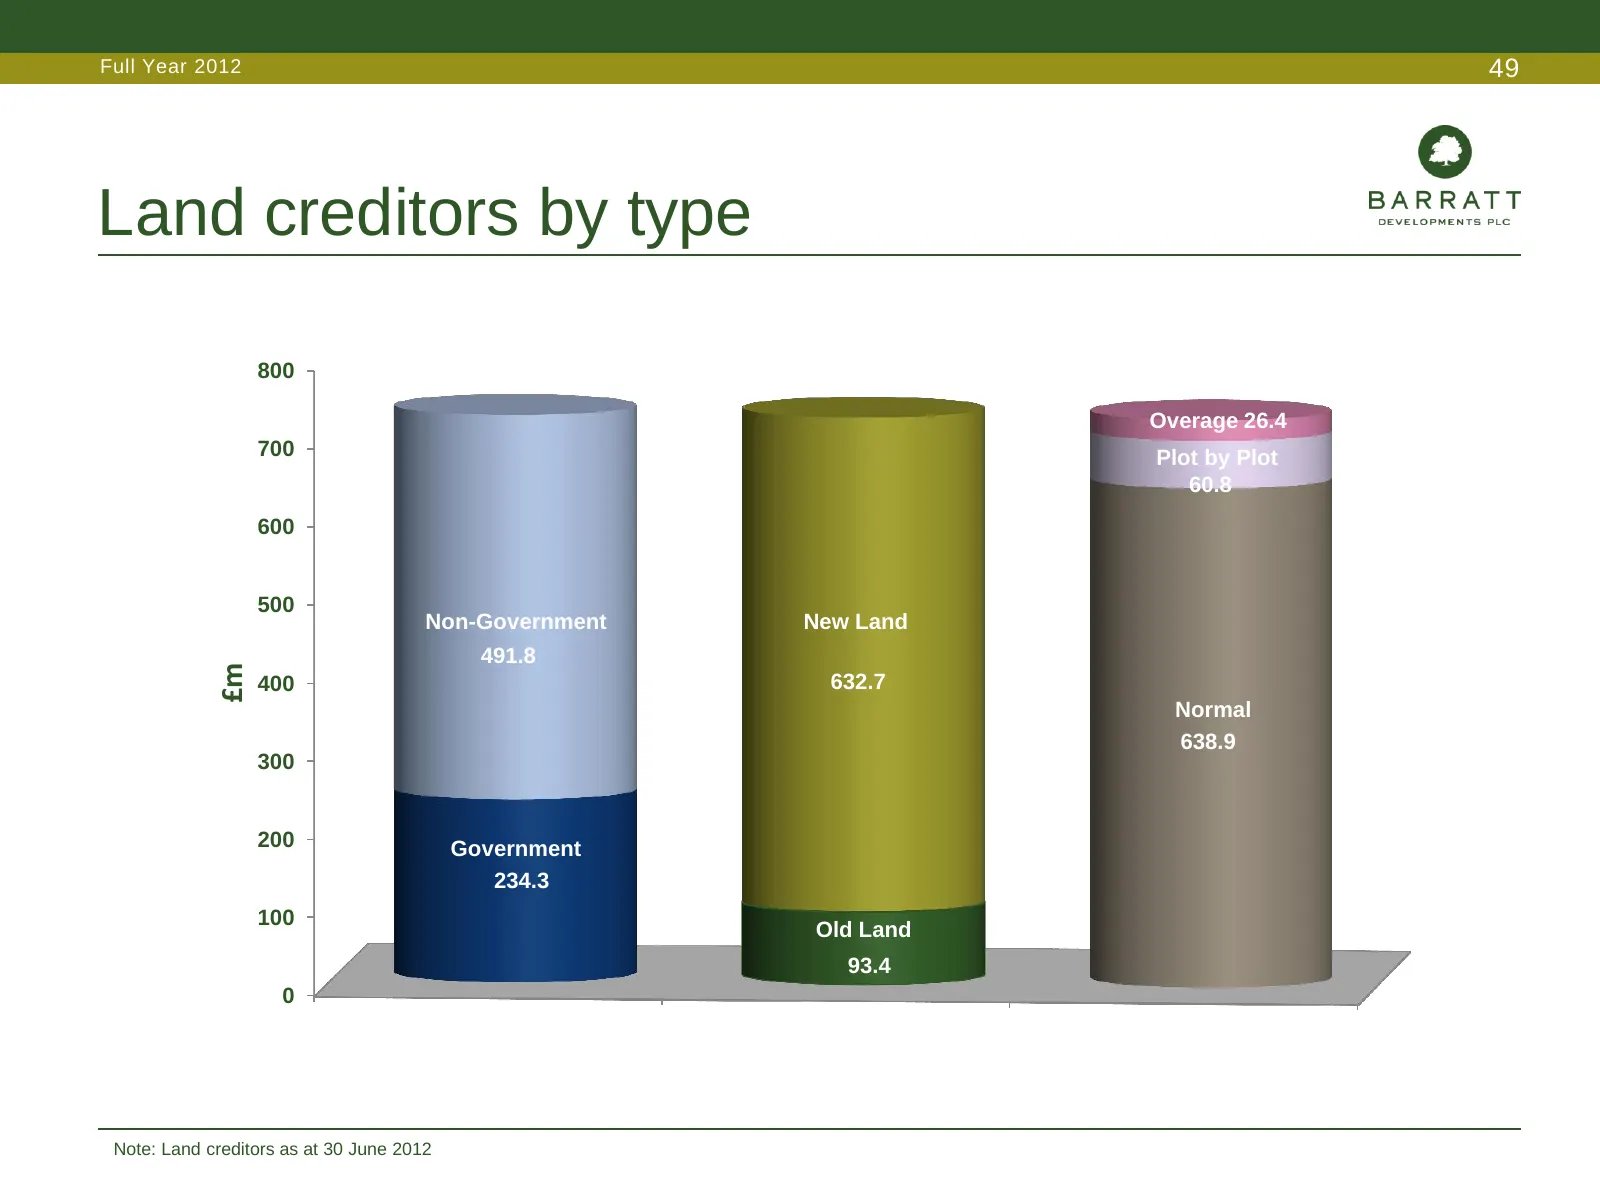
Slide 49: Land creditors by type
Full Year 2012 49 Land creditors by type 800 Overage 26.4 700 Plot by Plot 60.8 600 500 Non-Government New Land 491.8 £m 400 632.7 Normal 638.9 300 200 Government 234.3 100 Old Land 93.4 0 Note: Land creditors as at 30 June 2012
Slide 50: Guidance
Full Year 2012 50 Guidance • Volume growth • 50% of FY 12/13 completions expected from higher margin land • Administration cost of c. £110m • Net interest charge of c. £75m • FY13 cash land spend of c. £650m • Net debt as at 31 Dec 12 of c. £475m • Land creditors remain at similar levels
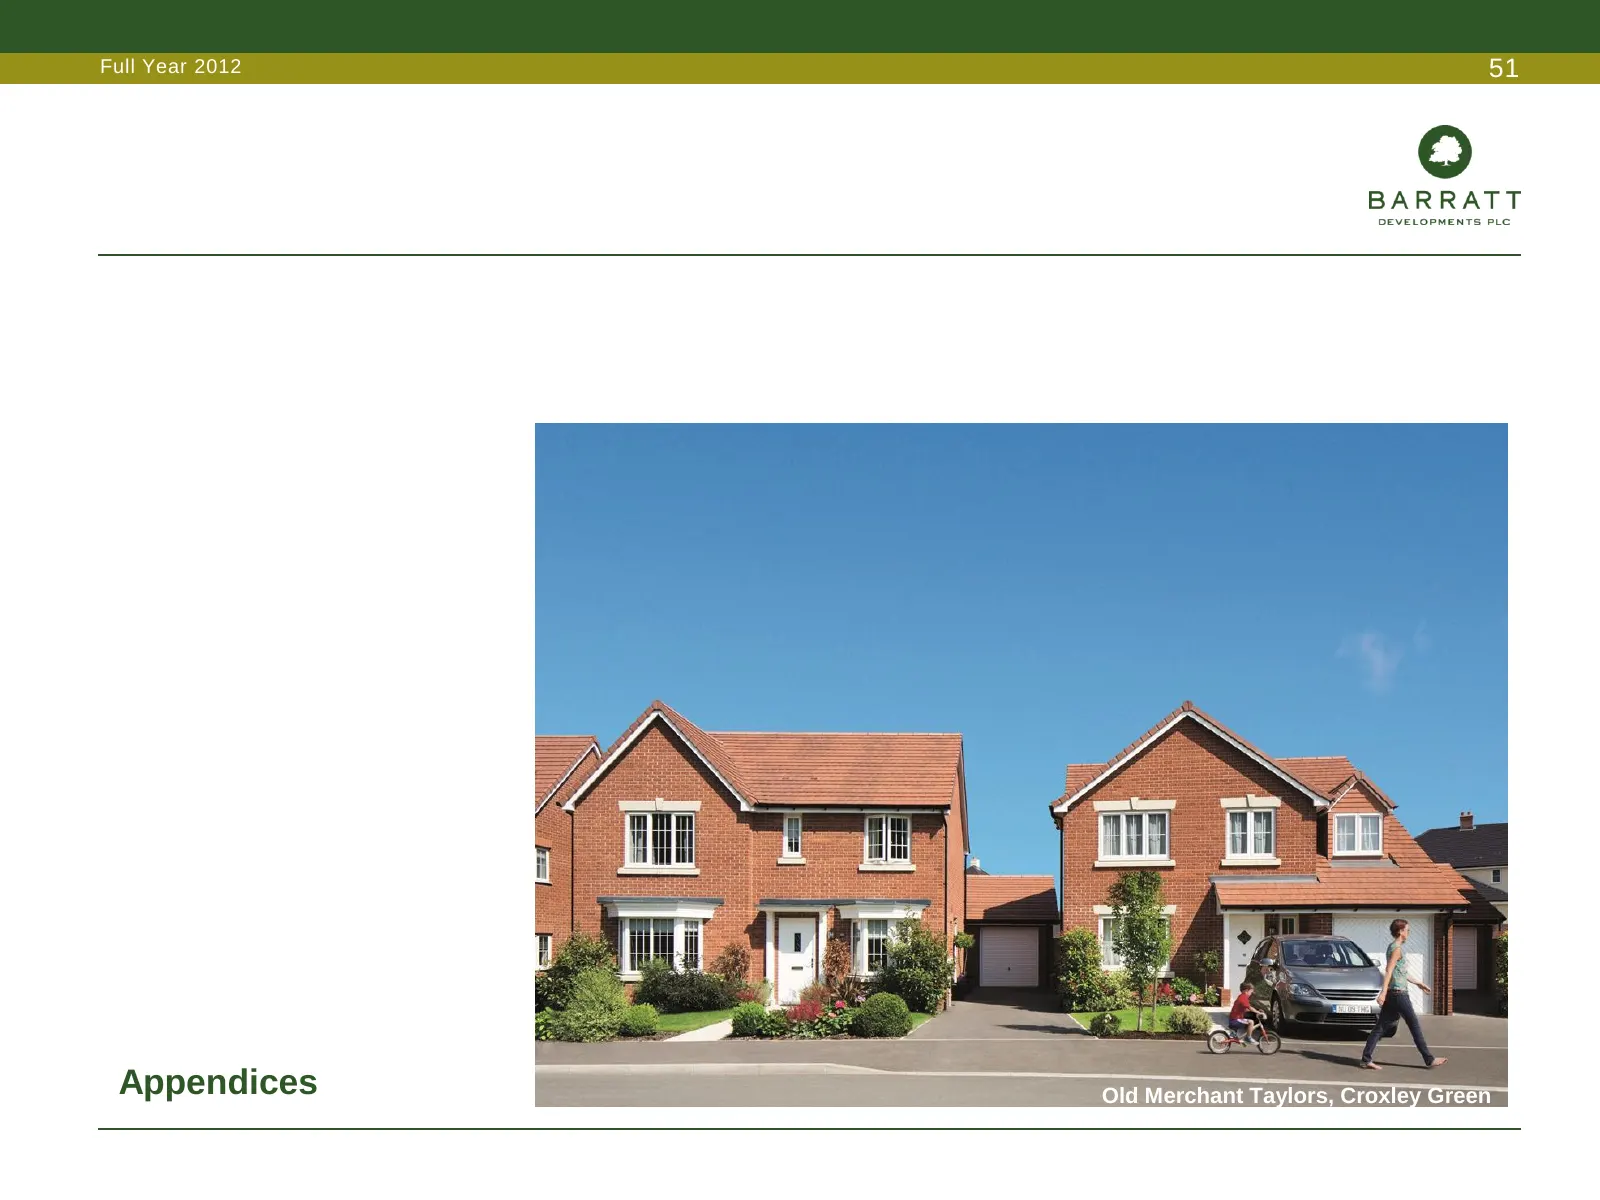
Slide 51: Appendices
Full Year 2012 51 Appendices Old Merchant Taylors, Croxley Green
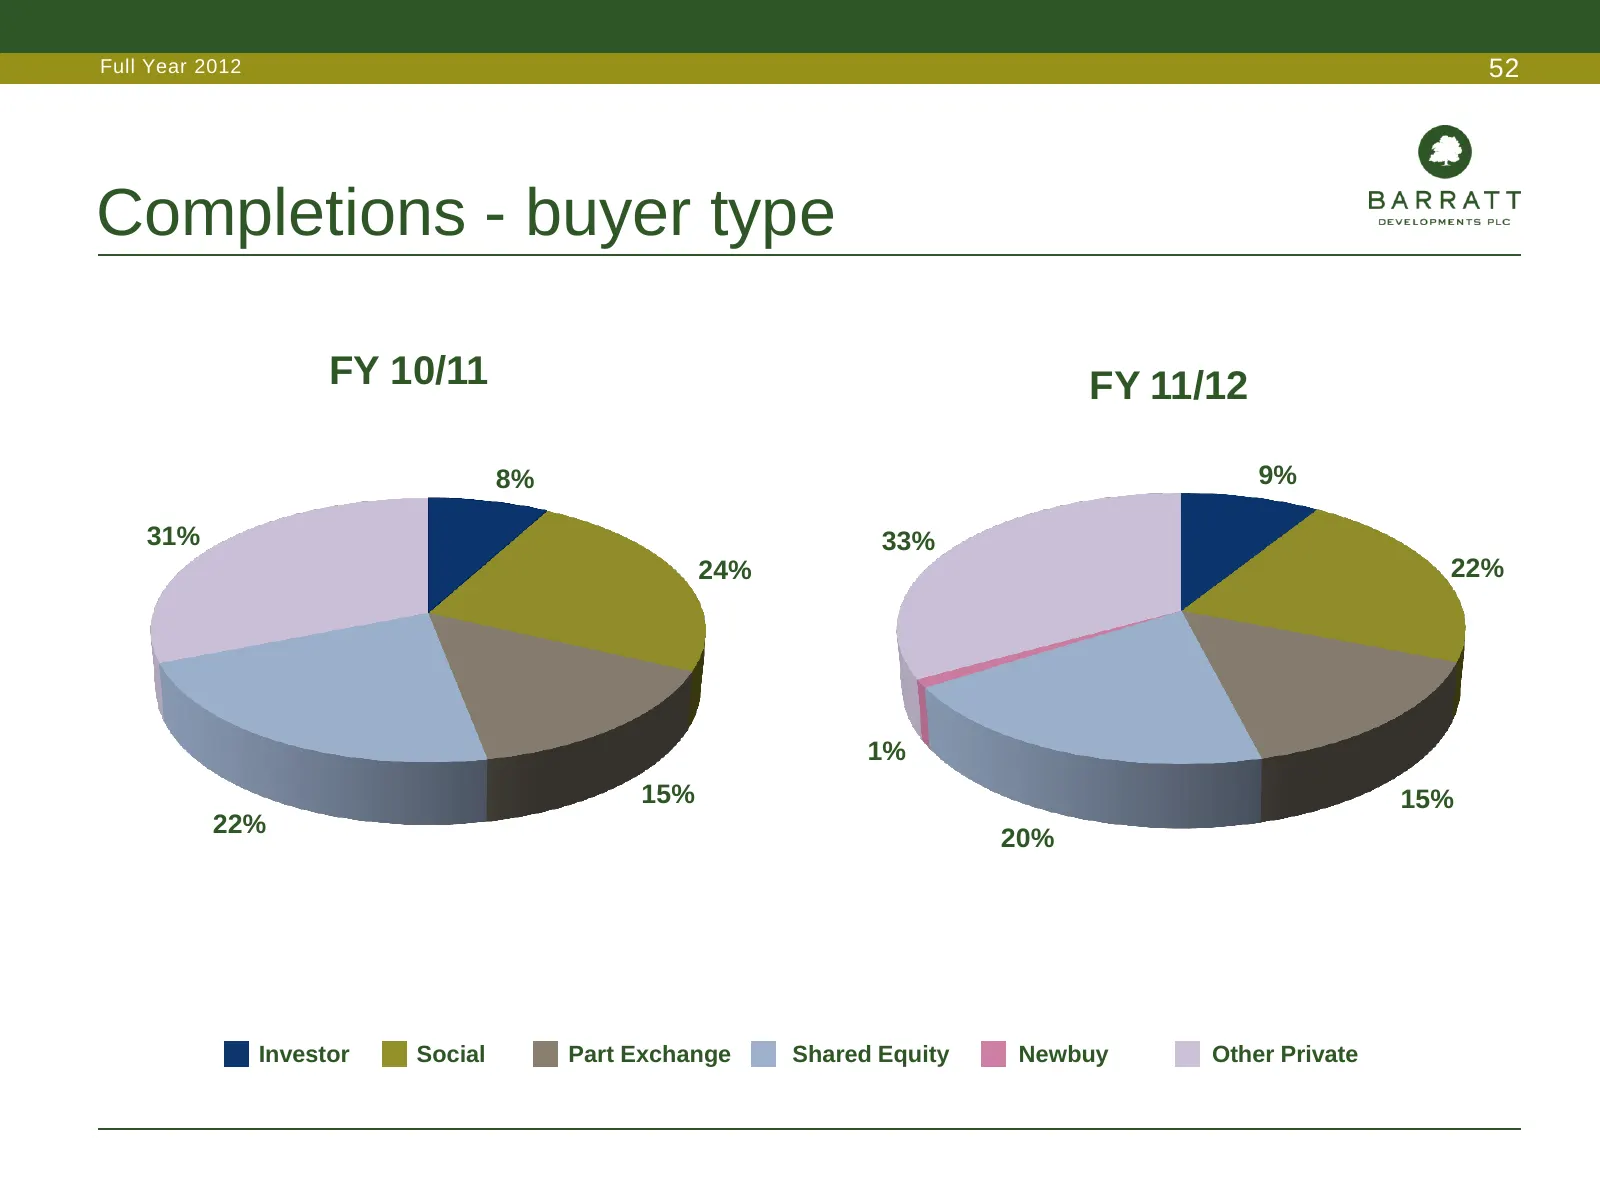
Slide 52: Completions - buyer type
Full Year 2012 52 Completions - buyer type FY 10/11 FY 11/12 8% 9% 31% 33% 24% 22% 1% 15% 15% 22% 20% Investor Social Part Exchange Shared Equity Newbuy Other Private
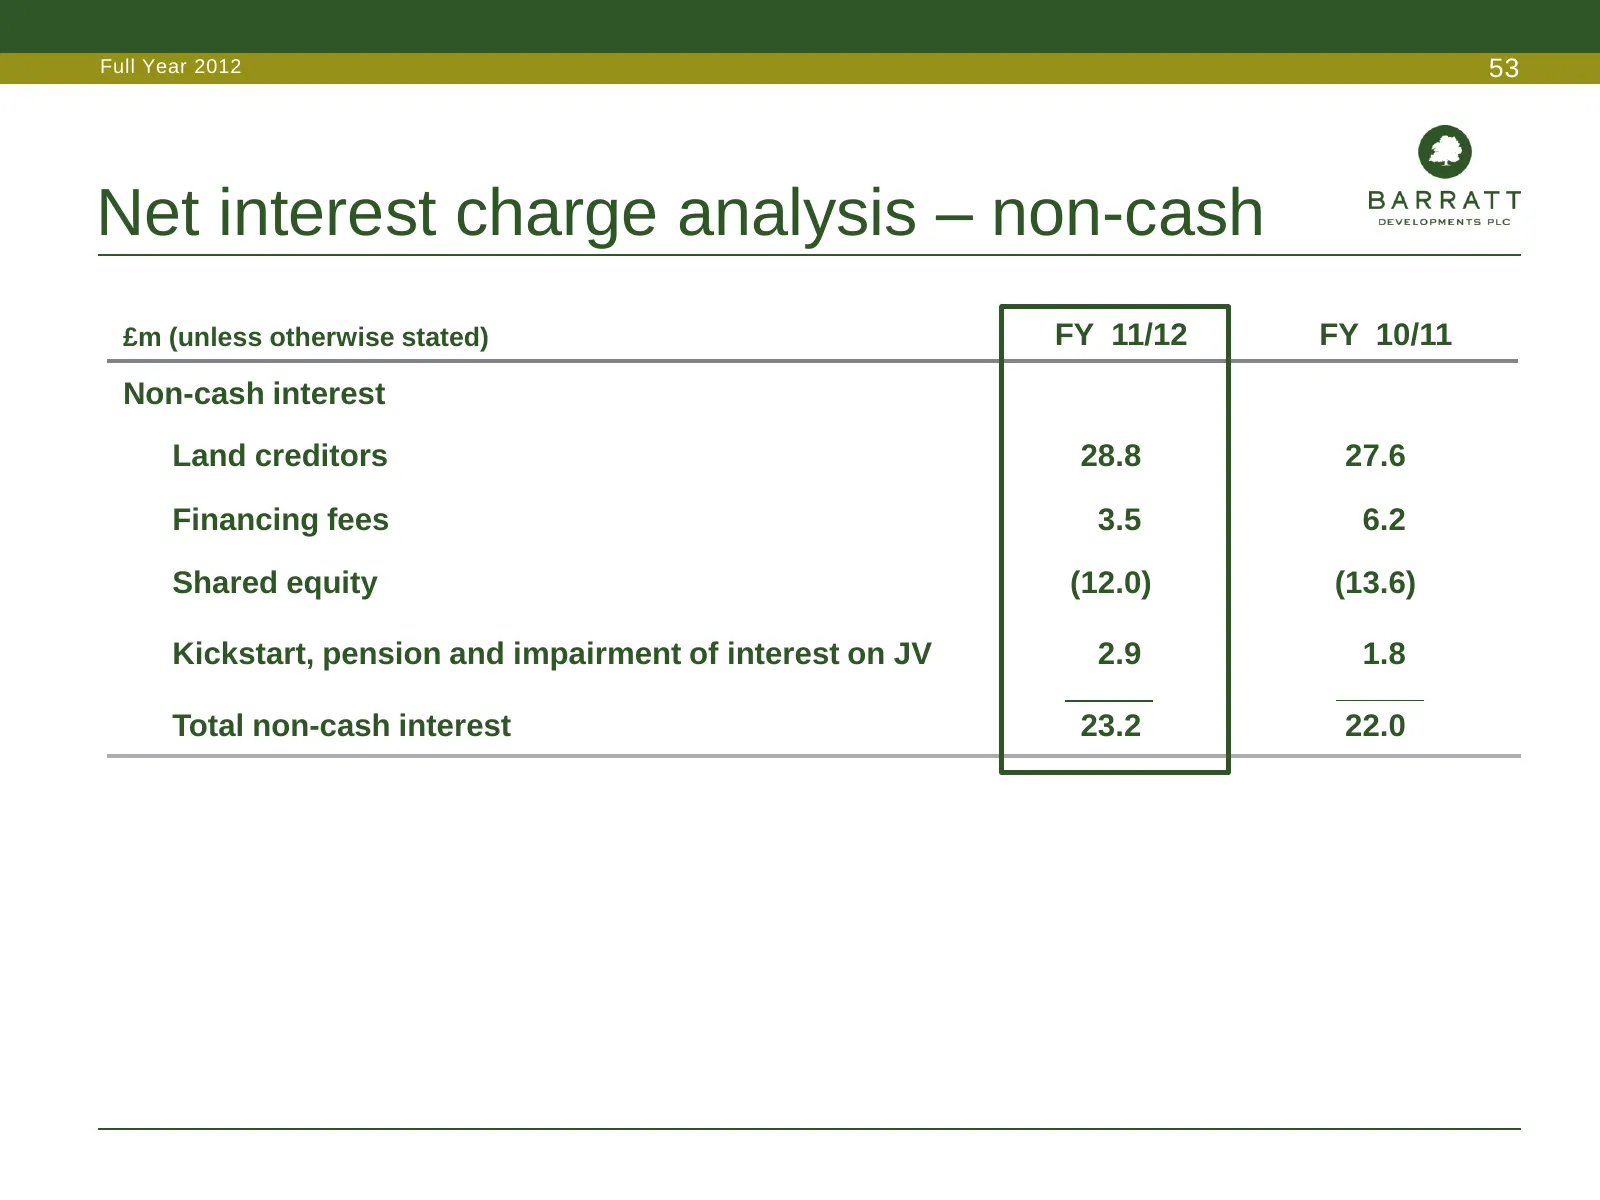
Slide 53: Net interest charge analysis – non-cash
Full Year 2012 53 Net interest charge analysis – non-cash £m (unless otherwise stated) FY 11/12 FY 10/11 Non-cash interest Land creditors 28.8 27.6 Financing fees 3.5 6.2 Shared equity (12.0) (13.6) Kickstart, pension and impairment of interest on JV 2.9 1.8 Total non-cash interest 23.2 22.0
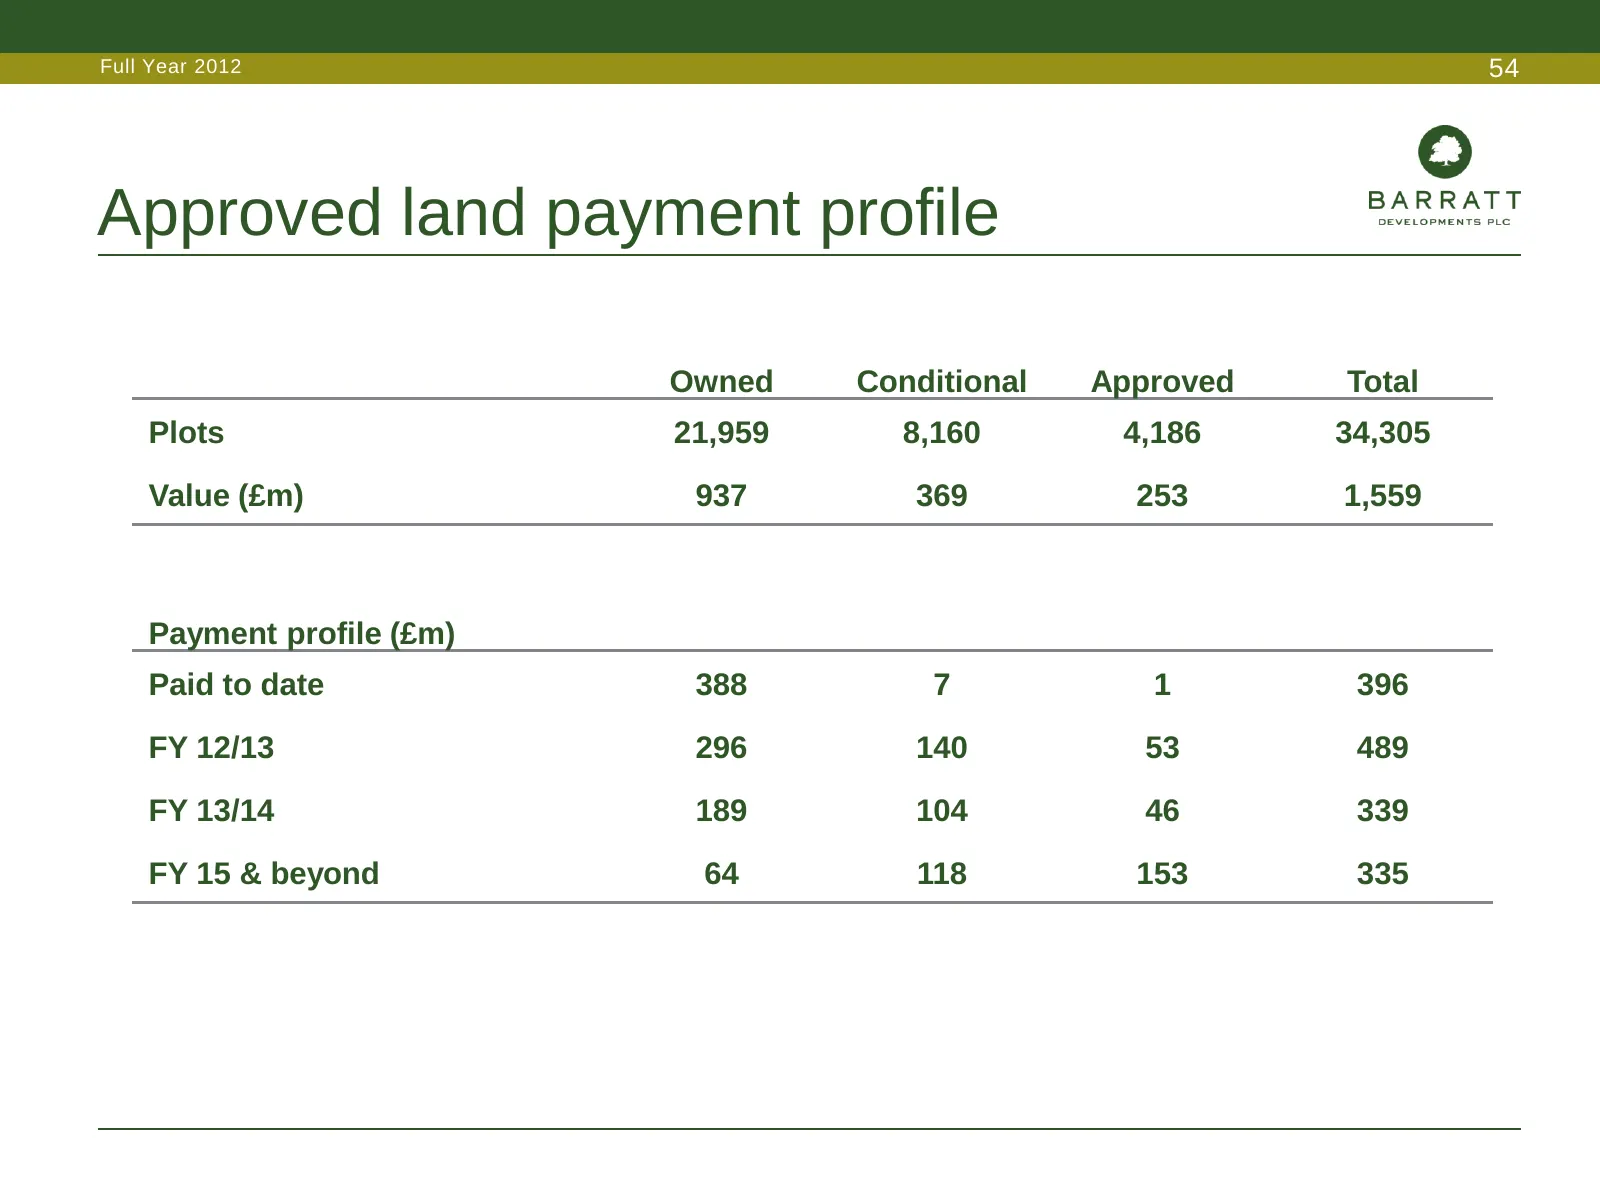
Slide 54: Approved land payment profile
Full Year 2012 54 Approved land payment profile Owned Conditional Approved Total Plots 21,959 8,160 4,186 34,305 Value (£m) 937 369 253 1,559 Payment profile (£m) Paid to date 388 7 1 396 FY 12/13 296 140 53 489 FY 13/14 189 104 46 339 FY 15 & beyond 64 118 153 335
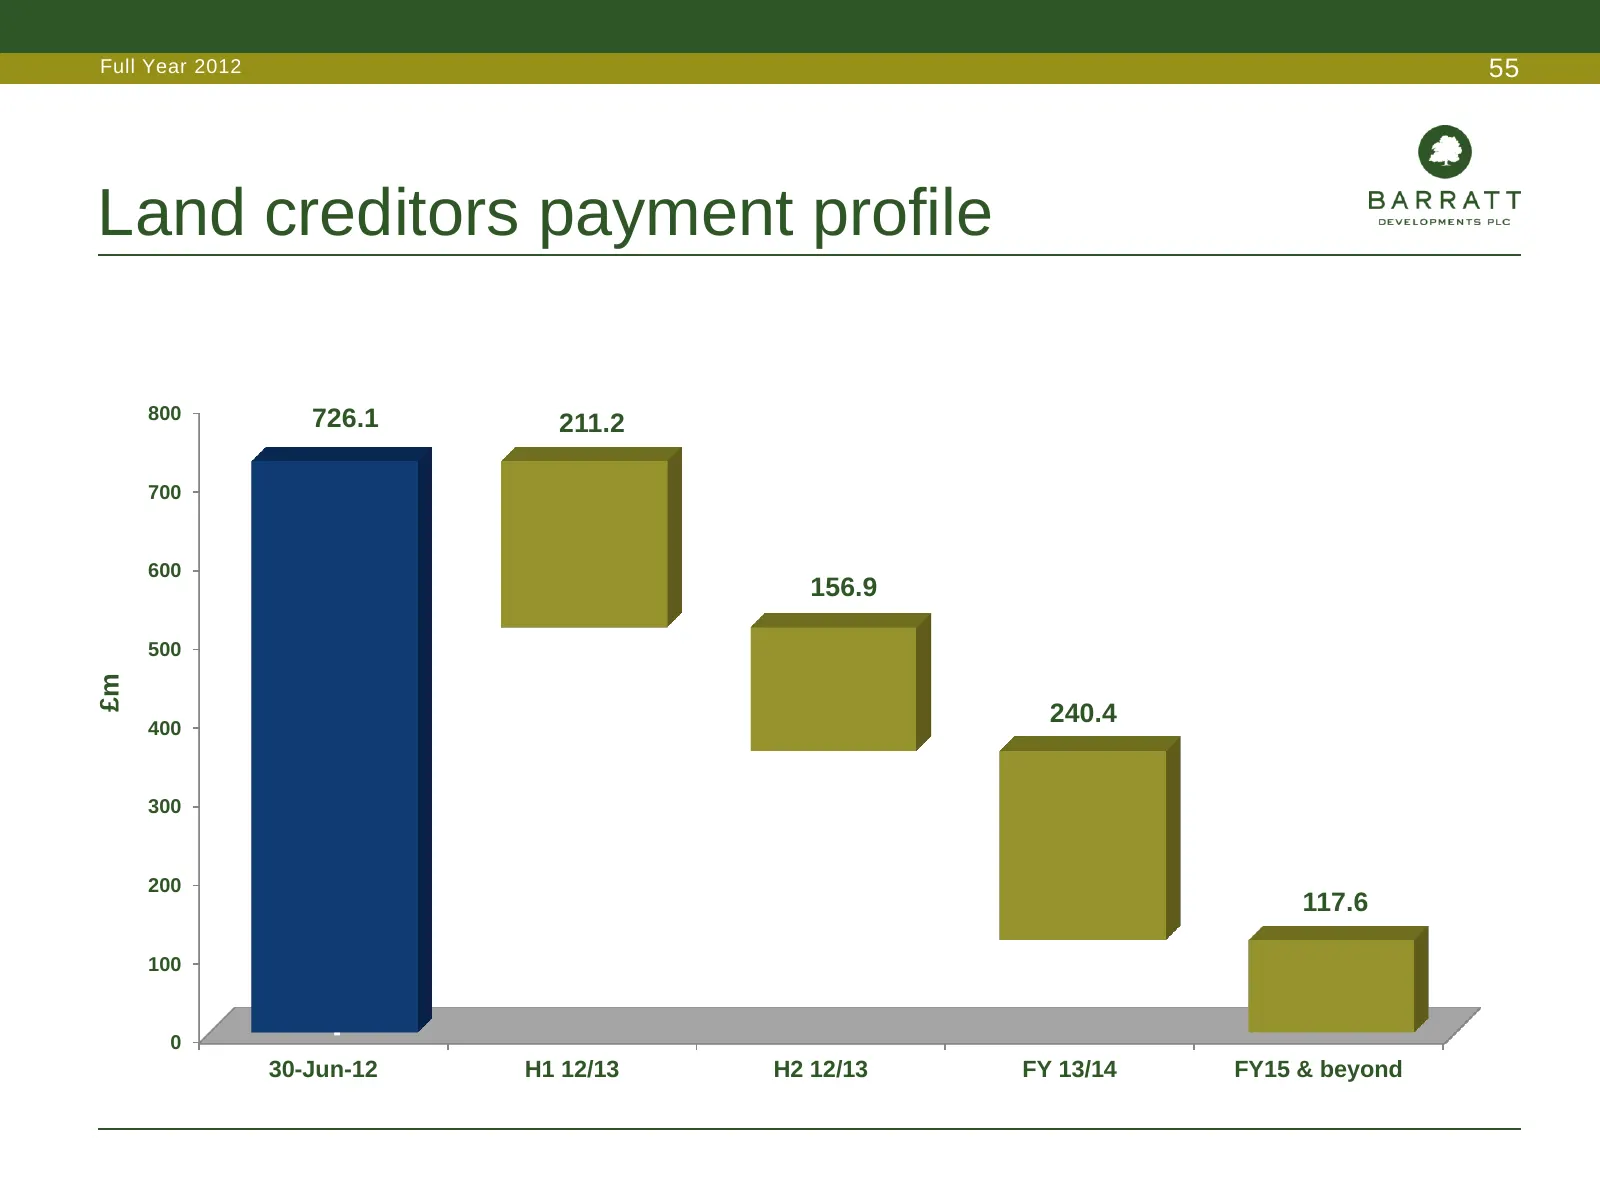
Slide 55: Land creditors payment profile
Full Year 2012 55 Land creditors payment profile 800 726.1 211.2 700 600 156.9 500 £m 400 240.4 300 200 117.6 100 0 - 30-Jun-12 H1 12/13 H2 12/13 FY 13/14 FY15 & beyond
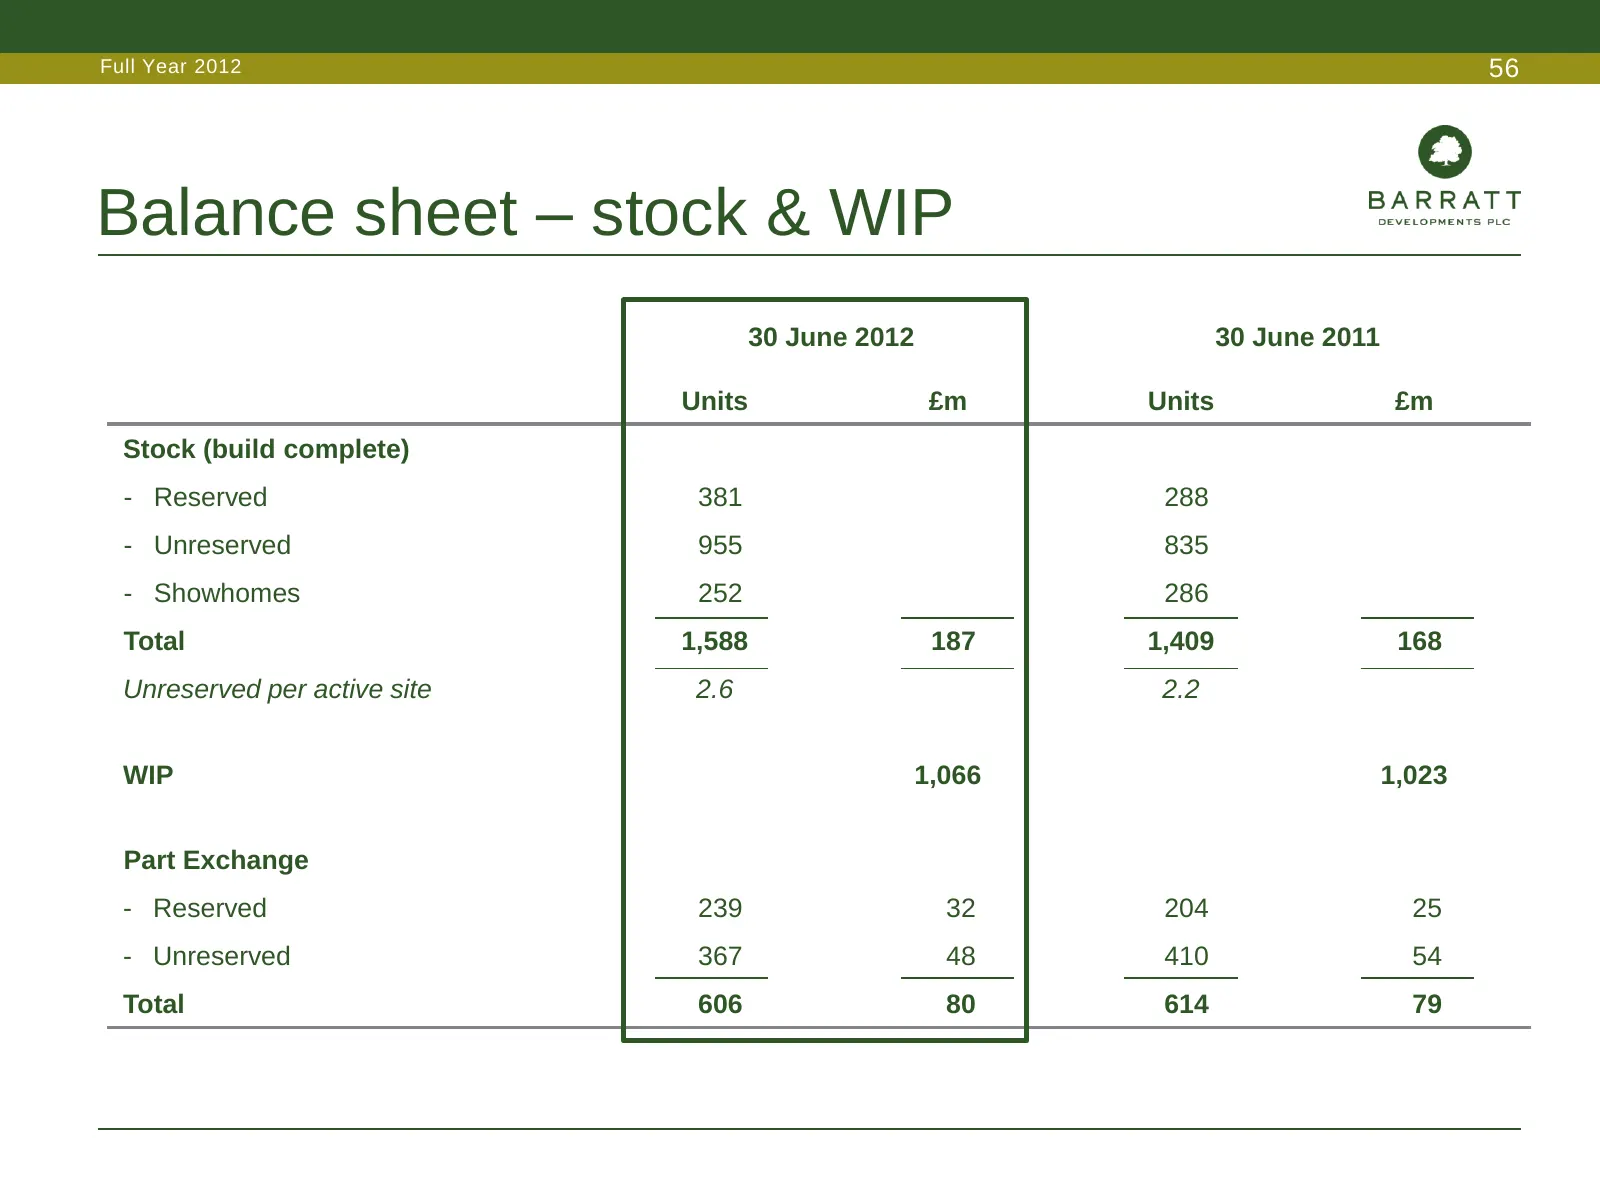
Slide 56: Balance sheet – stock & WIP
Full Year 2012 56 Balance sheet – stock & WIP 30 June 2012 30 June 2011 Units £m Units £m Stock (build complete) - Reserved 381 288 - Unreserved 955 835 - Showhomes 252 286 Total 1,588 187 1,409 168 Unreserved per active site 2.6 2.2 WIP 1,066 1,023 Part Exchange - Reserved 239 32 204 25 - Unreserve
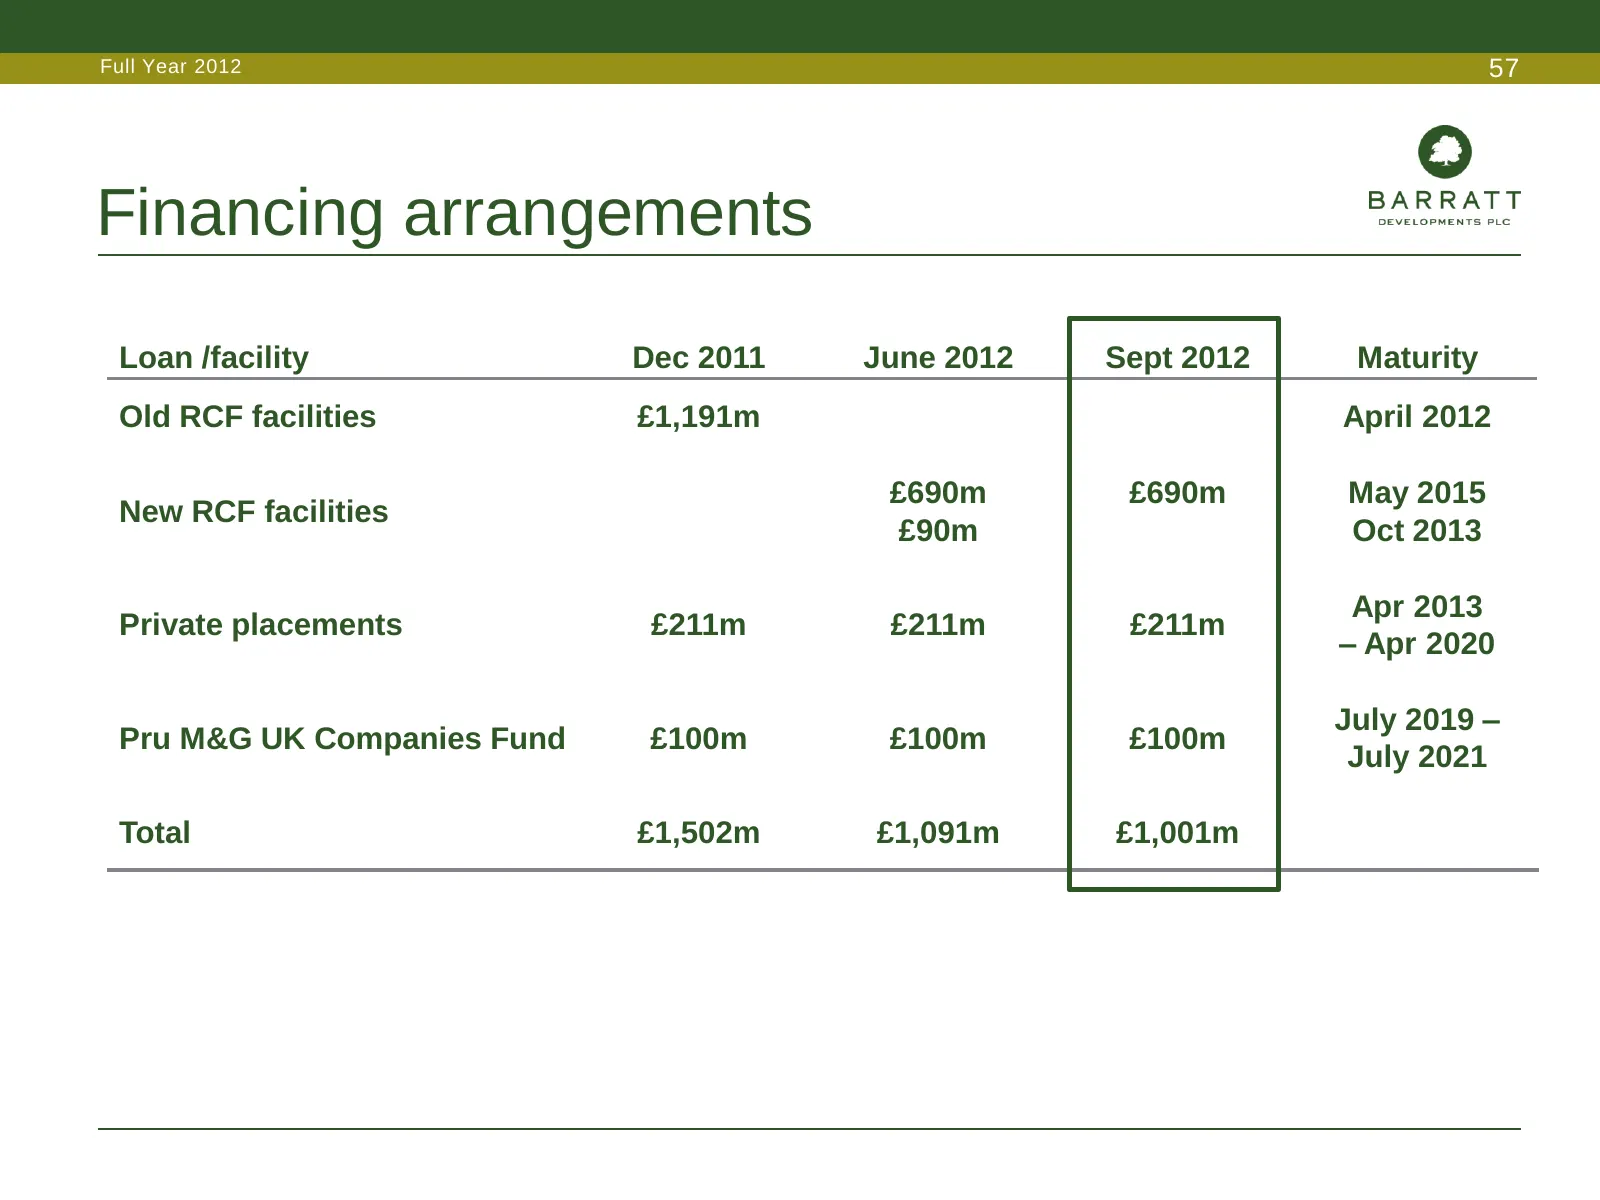
Slide 57: Financing arrangements
Full Year 2012 57 Financing arrangements Loan /facility Dec 2011 June 2012 Sept 2012 Maturity Old RCF facilities £1,191m April 2012 £690m £690m May 2015 New RCF facilities £90m Oct 2013 Apr 2013 Private placements £211m £211m £211m – Apr 2020 July 2019 – Pru M&G UK Companies Fund £100m £100m £100m J
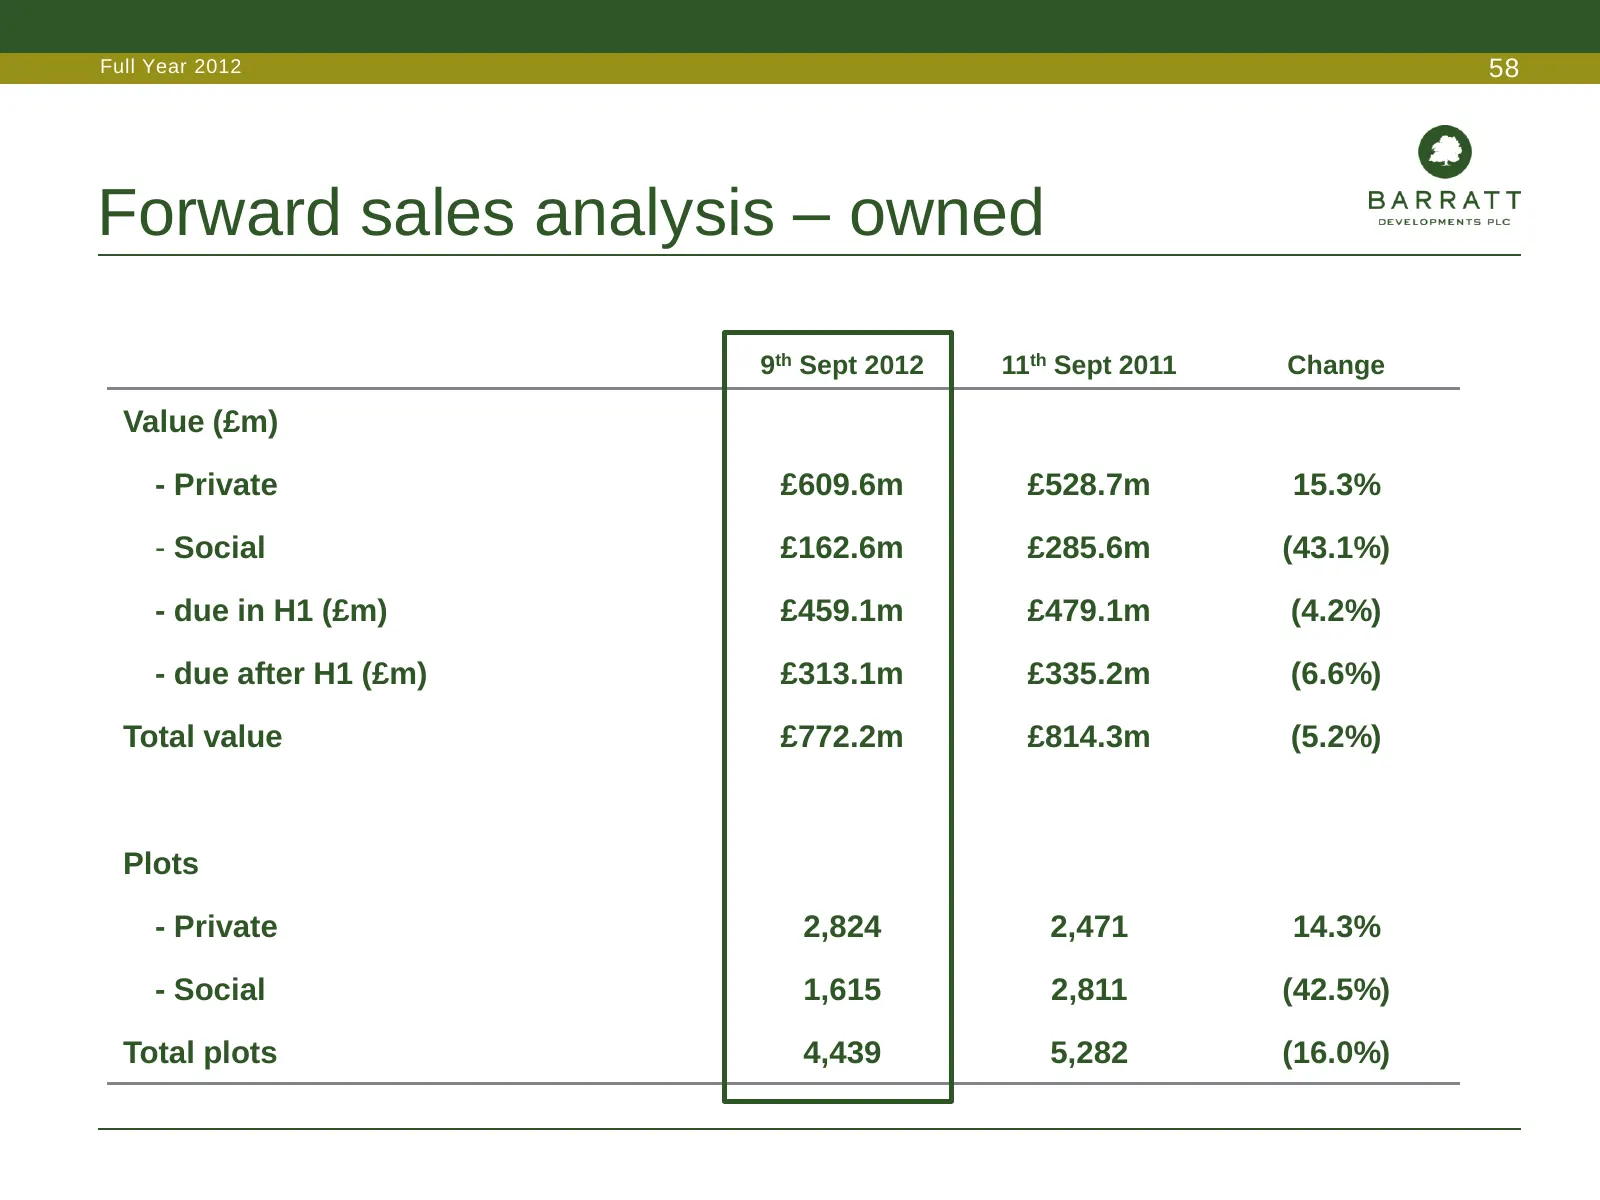
Slide 58: Forward sales analysis – owned
Full Year 2012 58 Forward sales analysis – owned 9th Sept 2012 11th Sept 2011 Change Value (£m) - Private £609.6m £528.7m 15.3% - Social £162.6m £285.6m (43.1%) - due in H1 (£m) £459.1m £479.1m (4.2%) - due after H1 (£m) £313.1m £335.2m (6.6%) Total value £772.2m £814.3m (5.2%) Plots - Private 2,824
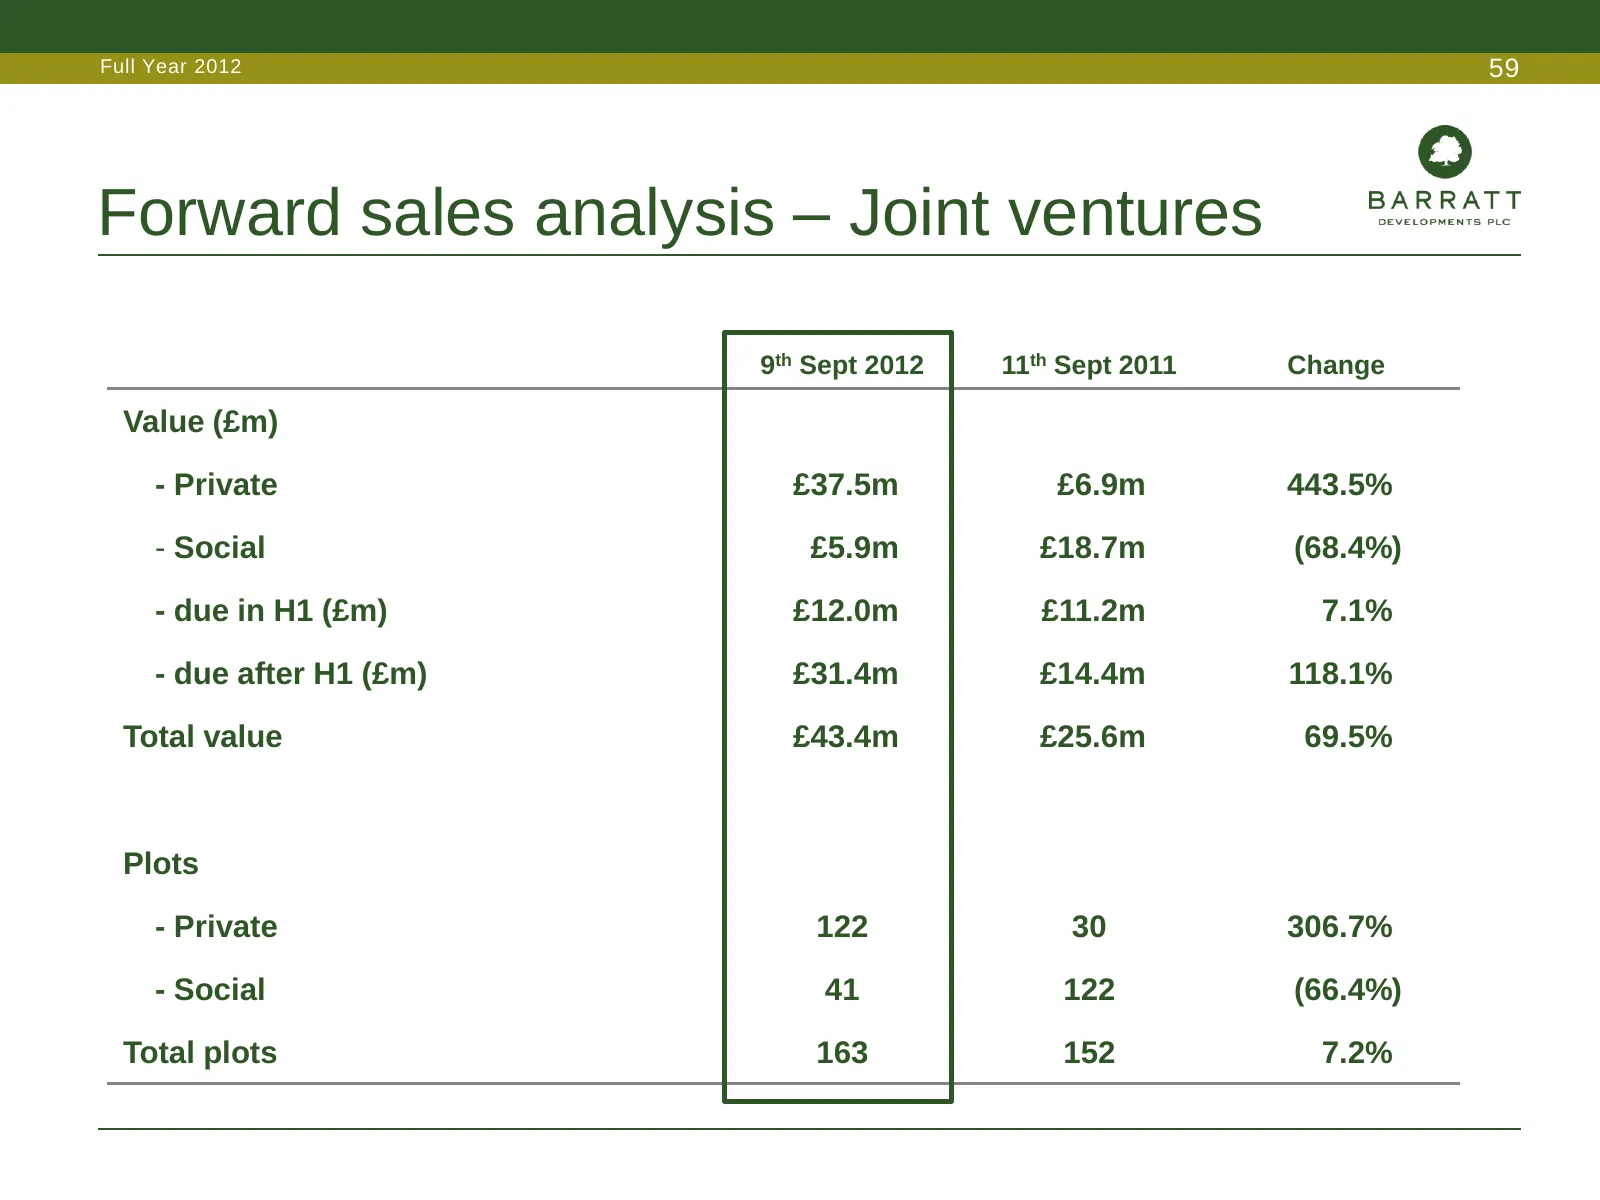
Slide 59: Forward sales analysis – Joint ventures
Full Year 2012 59 Forward sales analysis – Joint ventures 9th Sept 2012 11th Sept 2011 Change Value (£m) - Private £37.5m £6.9m 443.5% - Social £5.9m £18.7m (68.4%) - due in H1 (£m) £12.0m £11.2m 7.1% - due after H1 (£m) £31.4m £14.4m 118.1% Total value £43.4m £25.6m 69.5% Plots - Private 122 30 306
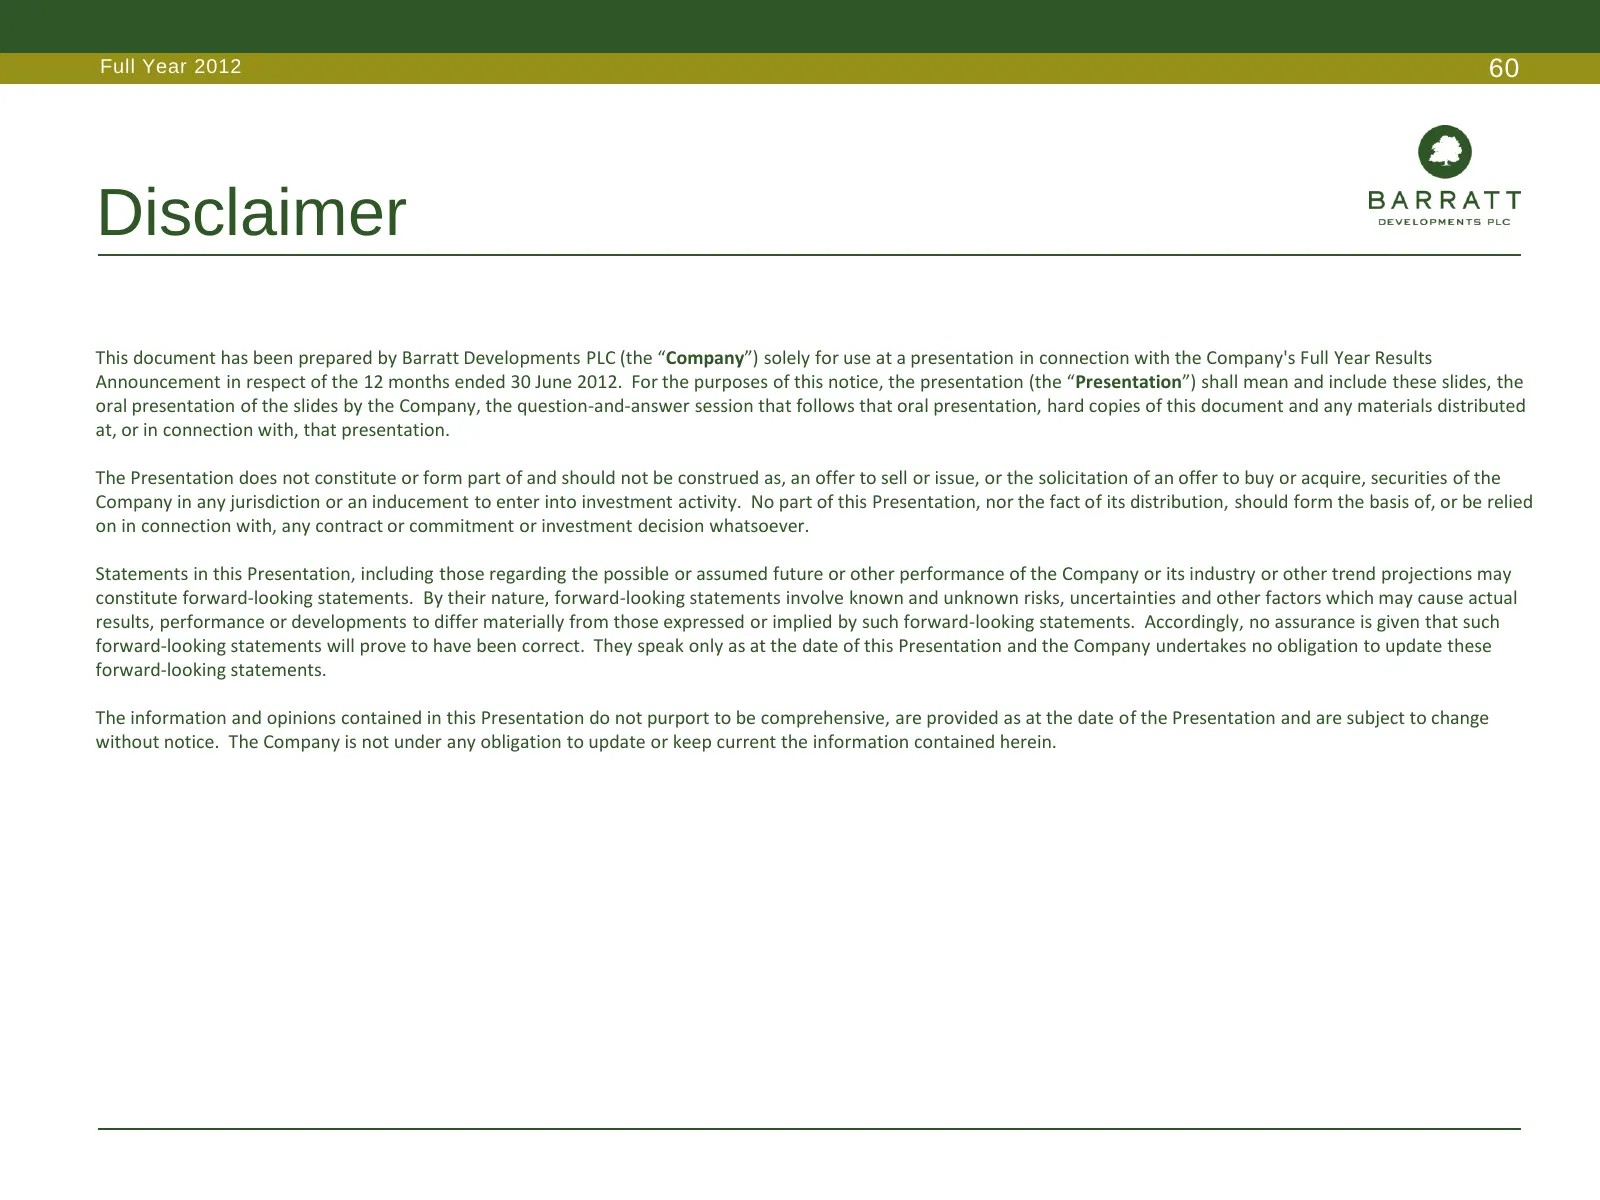
Slide 60: Disclaimer
Full Year 2012 60 Disclaimer This document has been prepared by Barratt Developments PLC (the “Company”) solely for use at a presentation in connection with the Company's Full Year Results Announcement in respect of the 12 months ended 30 June 2012. For the purposes of this notice, the presentation
Source: Internet Archive copy of barrattdevelopments.co.uk
More decks from Barratt Redrow plc
 FY2026 Earnings Presentation59 slides · Sep 16, 2026
 HY26 Earnings Presentation59 slides · Feb 11, 2026
 FY2025 Earnings Presentation60 slides · Sep 17, 2025
 Corporate Update (May 2025)30 slides · May 1, 2025
 Investor Day (February 2025)40 slides · Feb 12, 2025
 HY25 Earnings Presentation51 slides · Feb 12, 2025