The Phoenix Companies — Phoenix Companies — Q3 2011 Earnings Presentation
25 slides from The Phoenix Companies's earnings presentation, Nov 2, 2011

Slide 1: The Phoenix Companies, Inc. Investment Portfolio Supplement
As of September 30, 2011 The Phoenix Companies, Inc. Investment Portfolio Supplement

Slide 2: Important disclosures
Important disclosures This presentation may contain “forward-looking statements” within the meaning of the Private Securities Litigation Reform Act of 1995. We intend these forward-looking statements to be covered by the safe harbor provisions of the federal securities laws relating to forward-looki

Slide 3: Table of contents
Table of contents Summary Total Invested Assets Historical Portfolio Ratings Bond Portfolio Detail Exposure to Sensitive Countries Alternative Asset Detail Realized Credit Impairment Losses Unrealized Gains/Losses Structured Securities Portfolio Residential Mortgage-Backed Securities (RMBS) Commerci

Slide 4: Summary
Summary > General account investment portfolio is well diversified and liquid; managed by a team with a successful track record of investing over a variety of market cycles, following a disciplined monitoring process > 92% of bond investments are investment grade. Emphasis is on liquidity with 71% o
Slide 5: Portfolio comprised primarily of fixed income securities
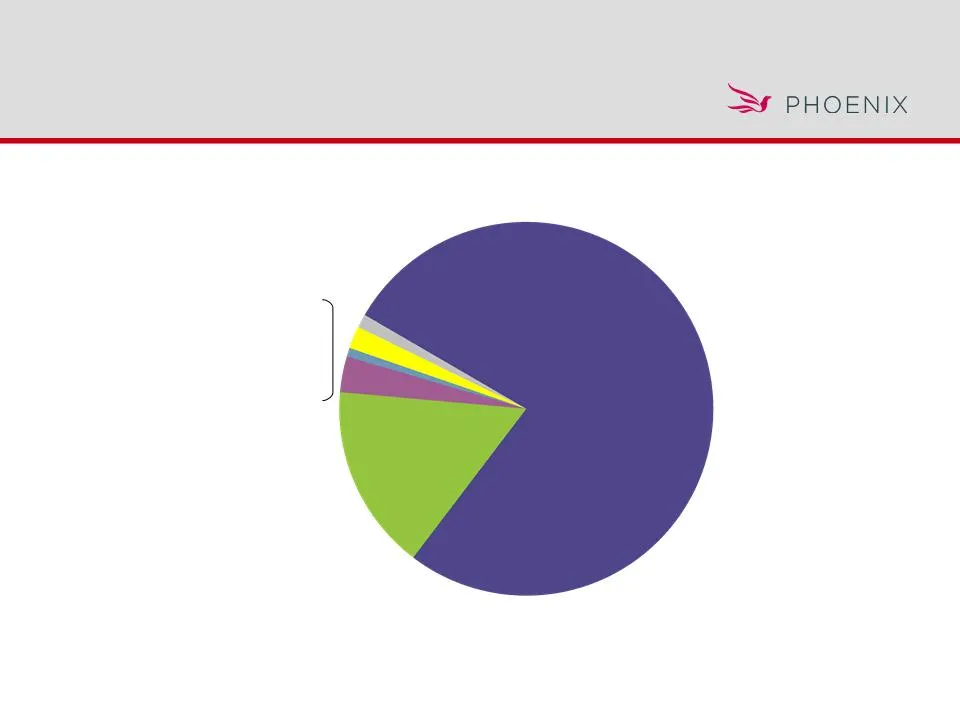
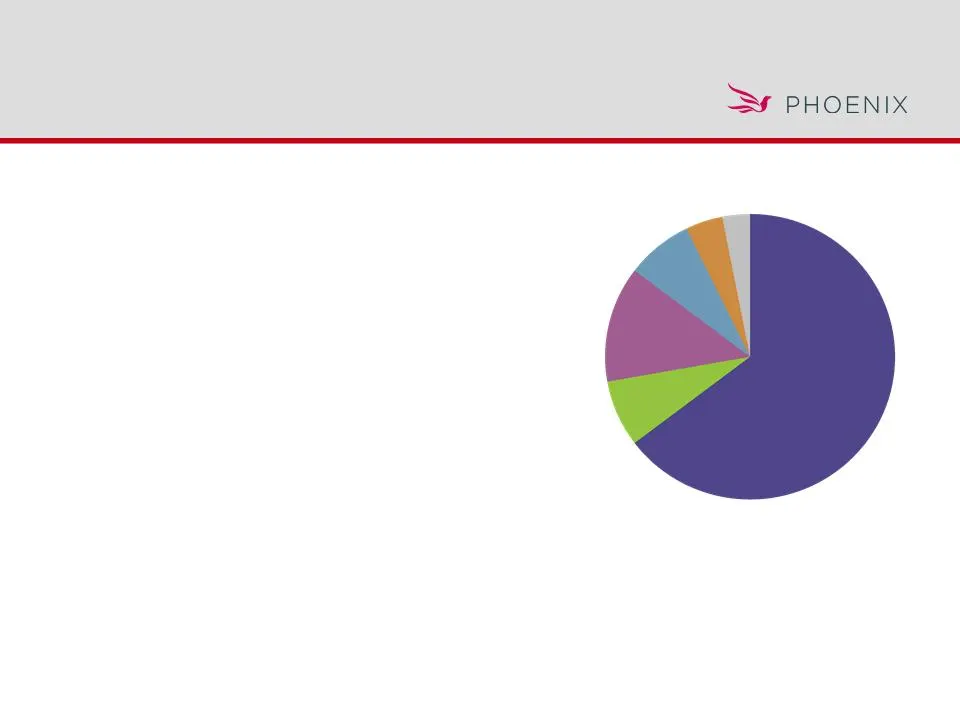
Portfolio comprised primarily of fixed income securities Bonds $11,676 77% Policy Loans $2,352 16% Cash & Cash Equivalents $149 1% Private Equity $232 2% Stock $48 0% Mezzanine Funds $182 1% Other Invested Assets $456 3% Total Invested Assets: $15.1 Billion Market value as of September 30, 2011
Slide 6: Portfolio quality improved
3Q10 4Q10 1Q11 2Q11 3Q11 Investment Grade Bonds 91.0% 91.3% 91.8% 91.5% 92.4% Below Investment Grade (BIG) Bonds 9.0 8.7 8.2 8.5 7.6 Percentage of BIG in NAIC 3 59.0 49.5 51.1 54.4 59.1 Percentage of BIG in NAIC 4-6 41.0 50.5 48.9 45.6 40.9 Corporate Investment Grade 91.1 91.2 91.9 91.6 92.3 Below I
Slide 7: Bond portfolio diversified by sector
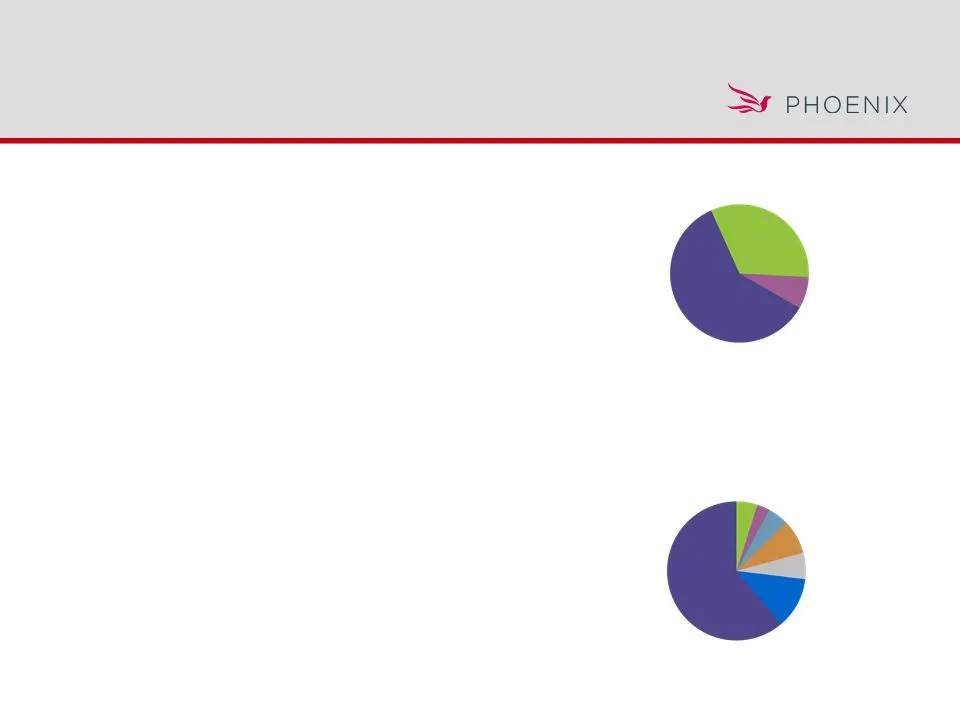
As of September 30, 2011 Market Value % of Total Industrials $2,656.7 22.8% Residential MBS 1 2,099.3 18.0 Foreign Corporates 1,675.0 14.3 Financials 1,546.2 13.2 Commercial MBS 1,165.2 10.0 U.S. Treasuries / Agencies 849.4 7.3 Utilities 589.9 5.0 Asset Backed Securities 535.5 4.6 CBO/CDO/CLO 2 223.

Slide 8: Top 10 debt securities
Issuer Market Value % of AFS Debt Securities Issuer Rating Bank of America Corp $54.4 0.5% Baa1/A Wells Fargo 42.9 0.4 A2/AA- General Electric 42.4 0.4 Aa2/AA+ Berkshire Hathaway Inc. 42.1 0.4 Aa2/AA+ Riverside Health System 39.3 0.3 Aa3/AA- AT&T Corporation 39.2 0.3 A2/A- Walgreens 36.3 0.3 A2/A Ci

Slide 9: Exposure to sensitive countries
Country Financial Institution Exposure All Other Exposure Total Exposure % of AFS Debt Securities Spain $11.8 $50.1 $61.9 0.5% Ireland 5.0 43.3 48.3 0.4 Italy - 17.2 17.2 0.2 Portugal - 15.0 15.0 0.1 Greece - - - - Total $16.8 $125.6 $142.4 1.2% Exposure to sensitive countries Market value as of Sep

Slide 10: Alternative asset returns
9/30/2011 Asset Balance 3Q11 Net Investment Income Private Equity $231.8 $1.2 Mezzanine Funds 182.3 4.7 Infrastructure Funds 38.7 0.8 Hedge Fund of Funds 29.9 (0.3) Leveraged Lease 26.4 0.2 Mortgage & Real Estate Funds 16.0 (0.5) Direct Equity 22.9 0.2 Other Alternative Assets 38.5 (1.2) $586.5 $5.1

Slide 11: Credit impairments
3Q10 4Q10 1Q11 2Q11 3Q11 YTD Sept 2010 YTD Sept 2011 Prime RMBS - $1.6 - $0.6 $0.8 $2.6 $1.4 Alt-A RMBS 0.4 2.5 1.0 0.2 0.4 7.5 1.6 Subprime RMBS - 1.5 0.3 1.9 0.9 0.1 3.1 CLO/CDO 3.6 3.5 - - 1.2 12.5 1.2 CMBS 2.9 1.7 - - 2.5 4.9 2.5 Corporate 3.2 - 4.4 0.2 2.6 6.9 7.2 Other ABS/MBS 1.7 - - 0.1 - 3.
Slide 12: Portfolio in a gain position
12/31/10 Unrealized 9/30/11 Unrealized 9/30/11 Invested Assets RMBS Prime $(21.2) $(8.8) $511.1 Subprime/Alt-A (58.5) (66.0) 487.2 CDO/CLO 1 (47.9) (47.7) 223.4 CMBS 24.5 23.8 1,165.2 Financial (25.2) (14.3) 1,546.2 All Other High Yield 0.9 (6.8) 507.9 All Other 2 393.5 632.5 7,235.3 Total $266.1 $5
Slide 13: High quality structured securities portfolio
As of September 30, 2011 Market Value % of Total Residential MBS $1,880.3 46.7% Commercial MBS 1,165.2 29.0 Other ABS 270.4 6.7 CBO/CDO/CLO 1 223.4 5.6 Home Equity 219.0 5.4 Auto Loans 158.7 3.9 Aircraft Equipment Trust 63.2 1.6 Manufactured Housing 43.2 1.1 Total $4,023.4 High quality structured se

Slide 14: High quality, diversified RMBS portfolio
Rating Book Value Market Value % General Account NAIC 1 NAIC 2 NAIC 3 NAIC 4 NAIC 5 NAIC 6 Agency $1,020.6 $1,101.1 7.3% 100.0% - - - - - Prime 519.9 511.1 3.4 78.5 16.0% 5.3% - - 0.2% Alt-A 350.2 310.8 2.1 77.2 4.9 6.9 1.0% - - Subprime 203.0 176.3 1.2 82.6 3.5 6.2 6.0 1.5% 0.3 Total $2,093.7 $2,09
Slide 15: High quality, seasoned non-agency prime RMBS holdings
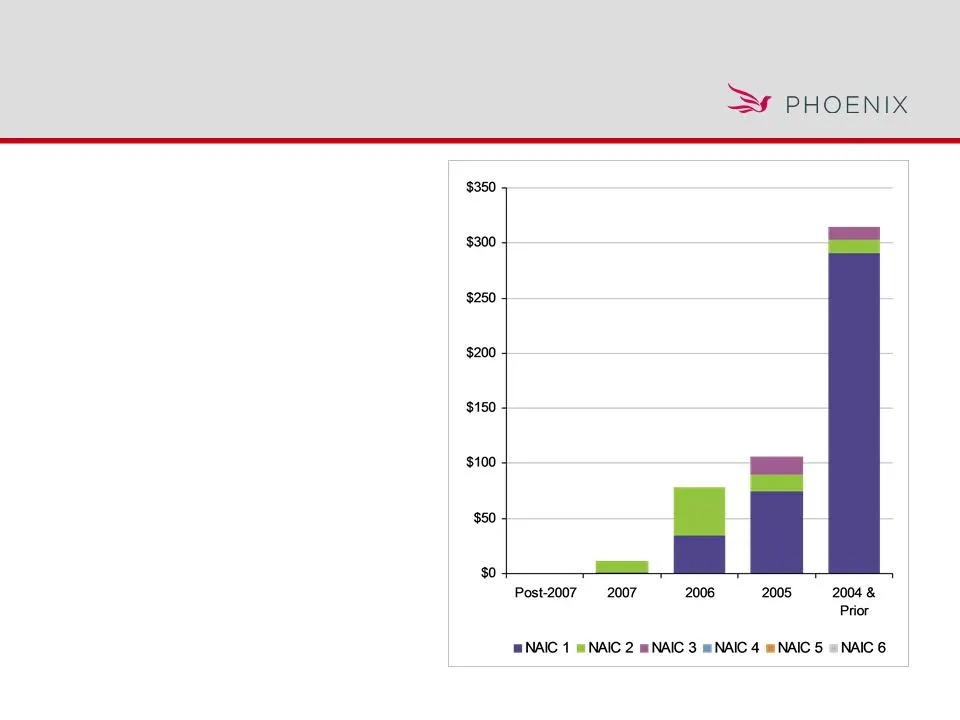
High quality, seasoned non-agency prime RMBS holdings > $511.1 million market value > 78% NAIC 1 rated > 82% 2005 and prior origination > 94% fixed rate vs. 47% for the market > Phoenix 60+ day delinquent 8.2% vs. 13.5% for the prime RMBS market As of September 30, 2011 Source: JPM MBS Research

Slide 16: Well constructed non-agency prime RMBS portfolio
Well constructed non-agency prime RMBS portfolio As of September 30, 2011 Source: JP Morgan MBS Research - September 2011, Bloomberg Market Phoenix Weighted average credit enhancement 3.6% 9.9% Weighted average 60+ day delinquent loan 13.53% 8.2% Phoenix prime portfolio loss coverage: using 40% loss
Slide 17: Seasoned non-agency Alt-A RMBS holdings
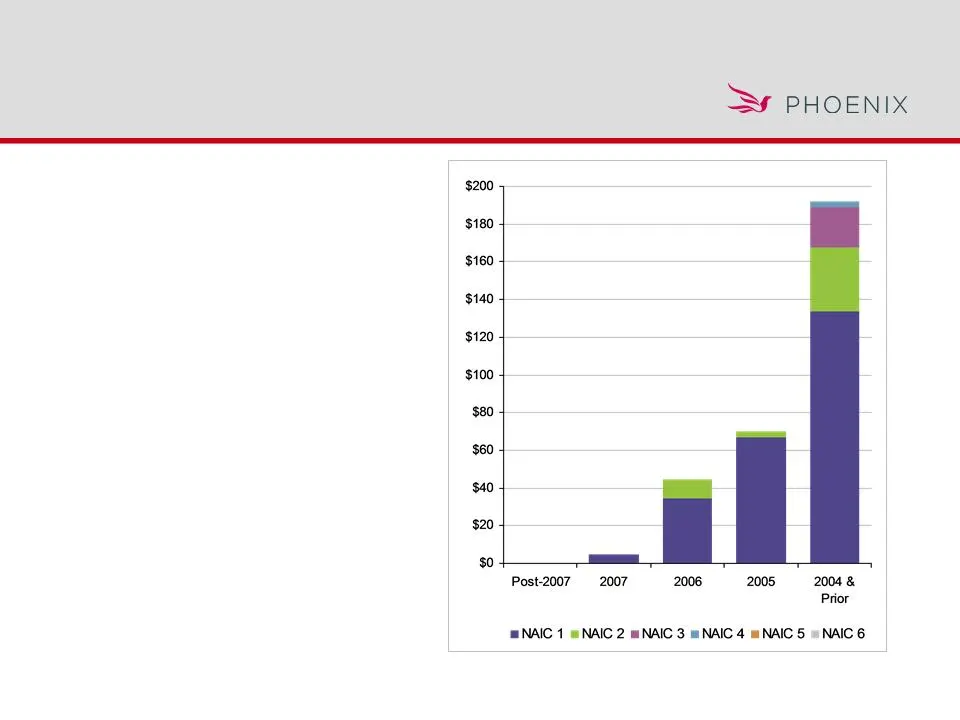
Seasoned non-agency Alt-A RMBS holdings > $310.8 million market value > 77% NAIC 1 rated > 84% 2005 and prior originations > 100% fixed rate collateral vs. 34% for market > Phoenix 60+ day delinquent 14.9% vs. 27.2% for Alt-A market Market value as of September 30, 2011 Source: JPM MBS Research
Slide 18: Highly rated, seasoned CMBS portfolio
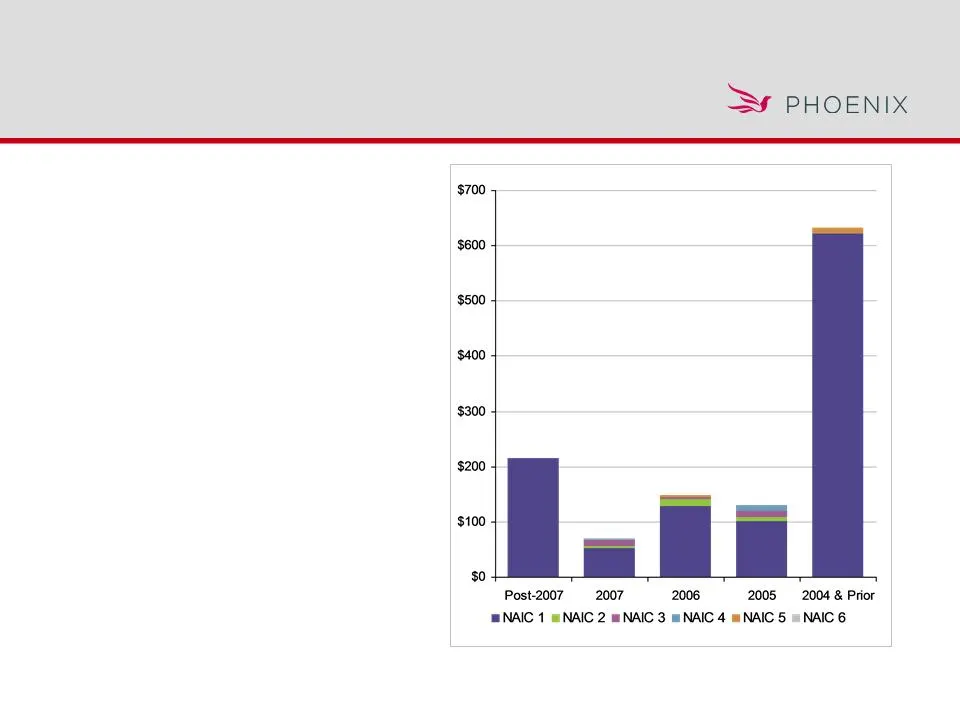
Highly rated, seasoned CMBS portfolio > $1.2 billion in market value > $126.2 million or 10.5% Government guaranteed > 93.4% rated NAIC 1 and 4.7% rated NAIC 3 and below > 63.7% 2005 and prior origination > Only 3.0% in CMBS CDO’s Market value as of September 30, 2011 Percentages based on market val

Slide 19: Well constructed CMBS portfolio
Market 1 Phoenix Weighted average credit enhancement 27% 28% Weighted average credit enhancement (U.S. Treasury defeasance adjusted) 28% 32% Interest Only (I/O) loans 69% 36% Weighted average coupon 5.72% 6.15% Weighted average loan age 70 months 82 months 60+ Delinquency Rate 8.3% 5.3% Well constru

Slide 20: Diversified CDO holdings
Collateral Book Value Market Value % General Account NAIC 1 NAIC 2 NAIC 3 NAIC 4 NAIC 5 NAIC 6 Bank Loans $215.5 $184.2 1.2% 25.7% 24.3% 26.2% 4.2% 5.0% 14.7% Inv Grade Debt 4.0 3.3 - - 100.0 - - - - CMBS 51.6 35.9 0.3 41.5 18.7 13.0 - 26.8 - Total $271.1 $223.4 1.5% 27.8% 24.5% 23.7% 3.4% 8.4% 12.1

Slide 21: Appendix
Appendix
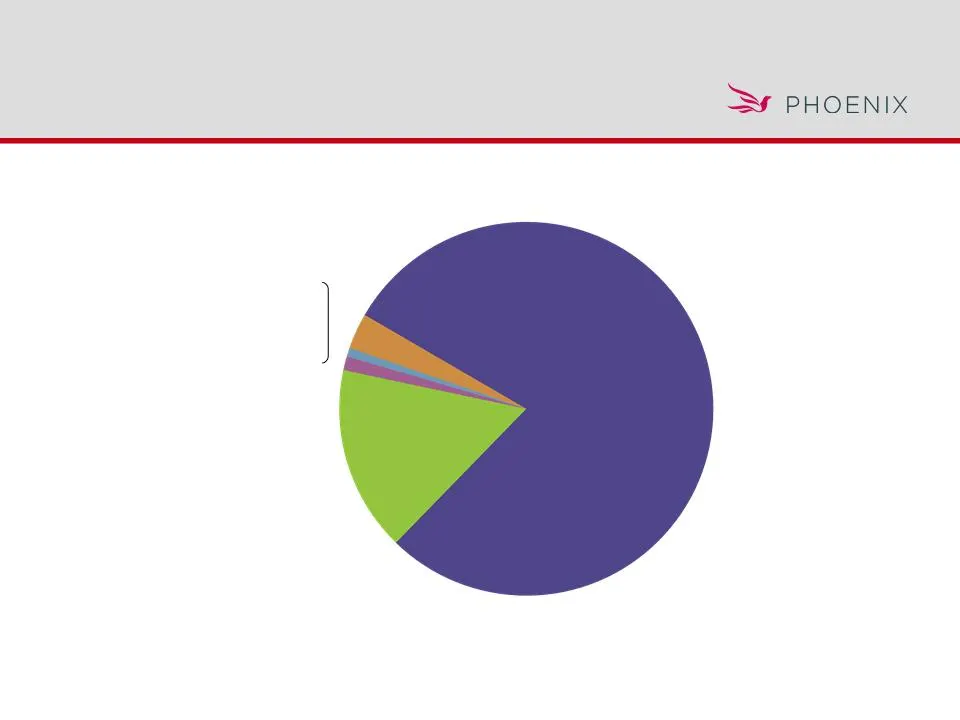
Slide 22: PLIC Closed Block investments primarily fixed income
PLIC Closed Block investments primarily fixed income Bonds $6,396 79% Policy Loans $1,289 16% Cash & Cash Equivalents $14 0% Private Equity $222 3% Stock $19 0% Mezzanine Funds $83 1% Other Invested Assets $61 1% Invested Assets: $8.1 Billion Market value as of September 30, 2011
Slide 23: PLIC Closed Block portfolio high quality
3Q10 4Q10 1Q11 2Q11 3Q11 Investment Grade Bonds 92.6% 92.9% 93.1% 92.9% 93.3% Below Investment Grade (BIG) Bonds 7.4 7.1 6.9 7.1 6.7 Percentage of BIG in NAIC 3 67.3 59.4 59.8 62.1 64.3 Percentage of BIG in NAIC 4-6 32.7 40.6 40.2 37.9 35.7 Public Bonds 66.5 67.0 67.3 66.5 65.6 Private Bonds 33.5 33
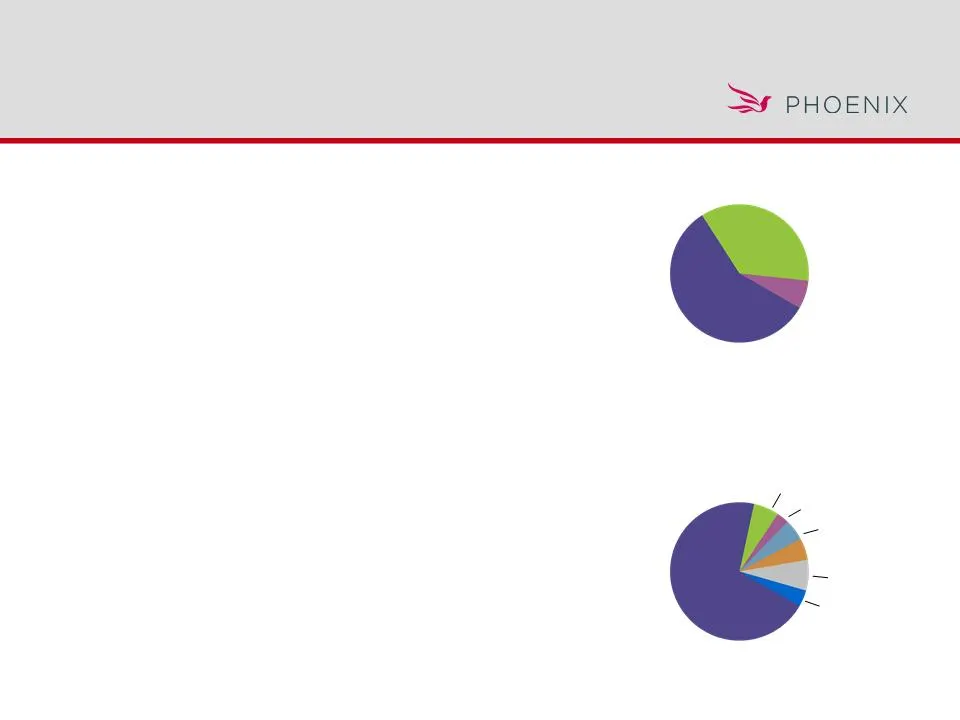
Slide 24: PLIC Closed Block portfolio diversified
Phoenix Closed Block Bond Portfolio As of September 30, 2011 Market Value % of Total Industrials 1,741.5 27.2% Foreign Corporates 1,013.5 15.8 Financials 916.2 14.3 Residential MBS 1 906.2 14.2 Commercial MBS 624.9 9.8 U.S. Treasuries / Agencies 392.5 6.1 Utilities 372.5 5.8 Municipals 131.5 2.1 Ass

Slide 25
Source: SEC EDGAR · 8-K filed Nov 2, 2011
More decks from The Phoenix Companies Inc
 Q1 2016 Earnings Presentation17 slides · May 10, 2016
 Q4 2015 Earnings Presentation19 slides · Mar 15, 2016
 Q3 2015 Earnings Presentation18 slides · Nov 9, 2015
 Merger or Acquisition (September 2015)8 slides · Sep 29, 2015
 FY2014 Earnings Presentation26 slides · Mar 31, 2015
 Q1 2012 Earnings Presentation25 slides · May 4, 2012