Flutter Entertainment plc · NYSE:FLUT
Flutter Entertainment — Paddy Power — FY2007 Earnings Presentation
31 slides from Flutter Entertainment's earnings presentation, 2008

Slide 1: Who says you can't make money being short?
= | | im |. WHO SAYS YOU CAN’T MAKE MONEY BEING SHORT? paddypowertrader.com FINANCIAL SPREAD BETTING
Slide 2: Introduction
Introduction Introduction Financial Performance Operational Review Development and Strategy Page 1
Slide 3: Highlights
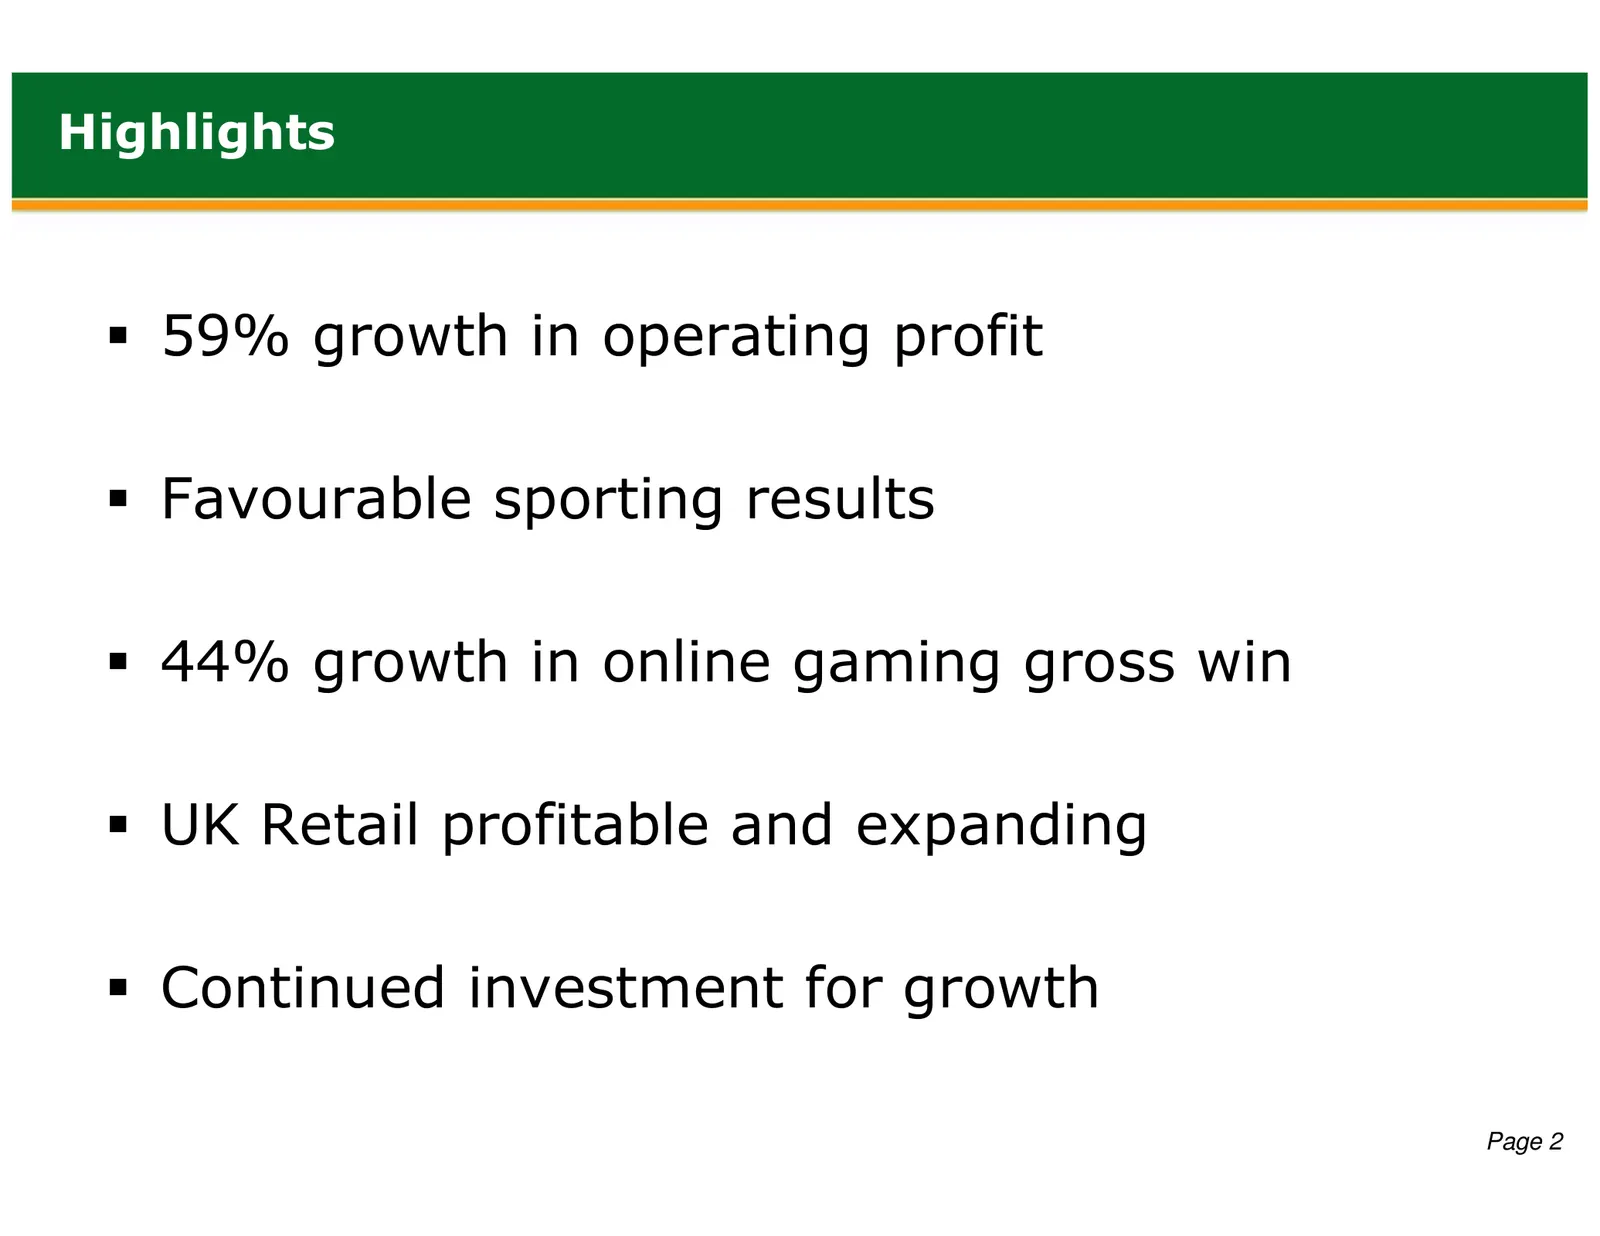
Highlights 59% growth in operating profit Favourable sporting results 44% growth in online gaming gross win UK Retail profitable and expanding Continued investment for growth Page 2
Slide 4: Financial Performance
Financial Performance Introduction Financial Performance Operational Review Development and Strategy Page 3
Slide 5: Financial Highlights
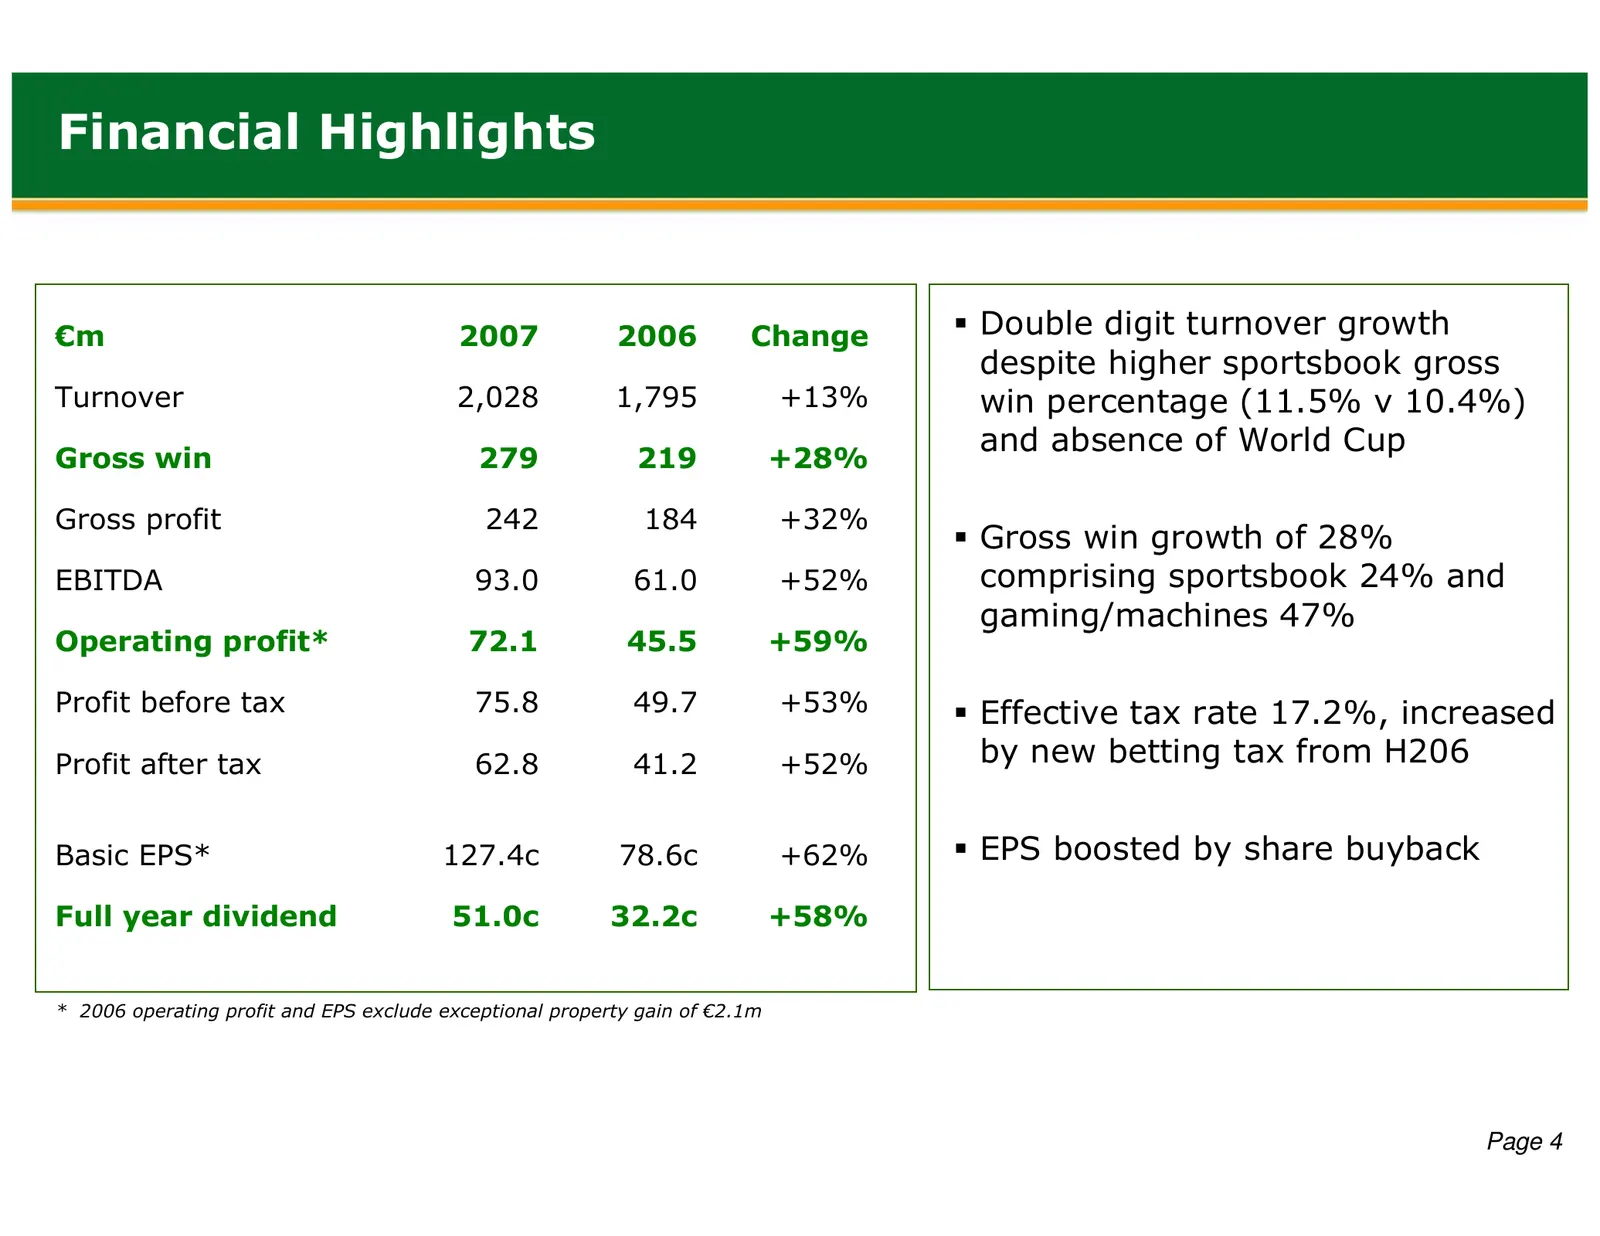
Financial Highlights €m 2007 2006 Change Double digit turnover growth despite higher sportsbook gross Turnover 2,028 1,795 +13% win percentage (11.5% v 10.4%) and absence of World Cup Gross win 279 219 +28% Gross profit 242 184 +32% Gross win growth of 28% EBITDA 93.0 61.0 +52% comprising sportsbook
Slide 6: Gross Win to Gross Profit
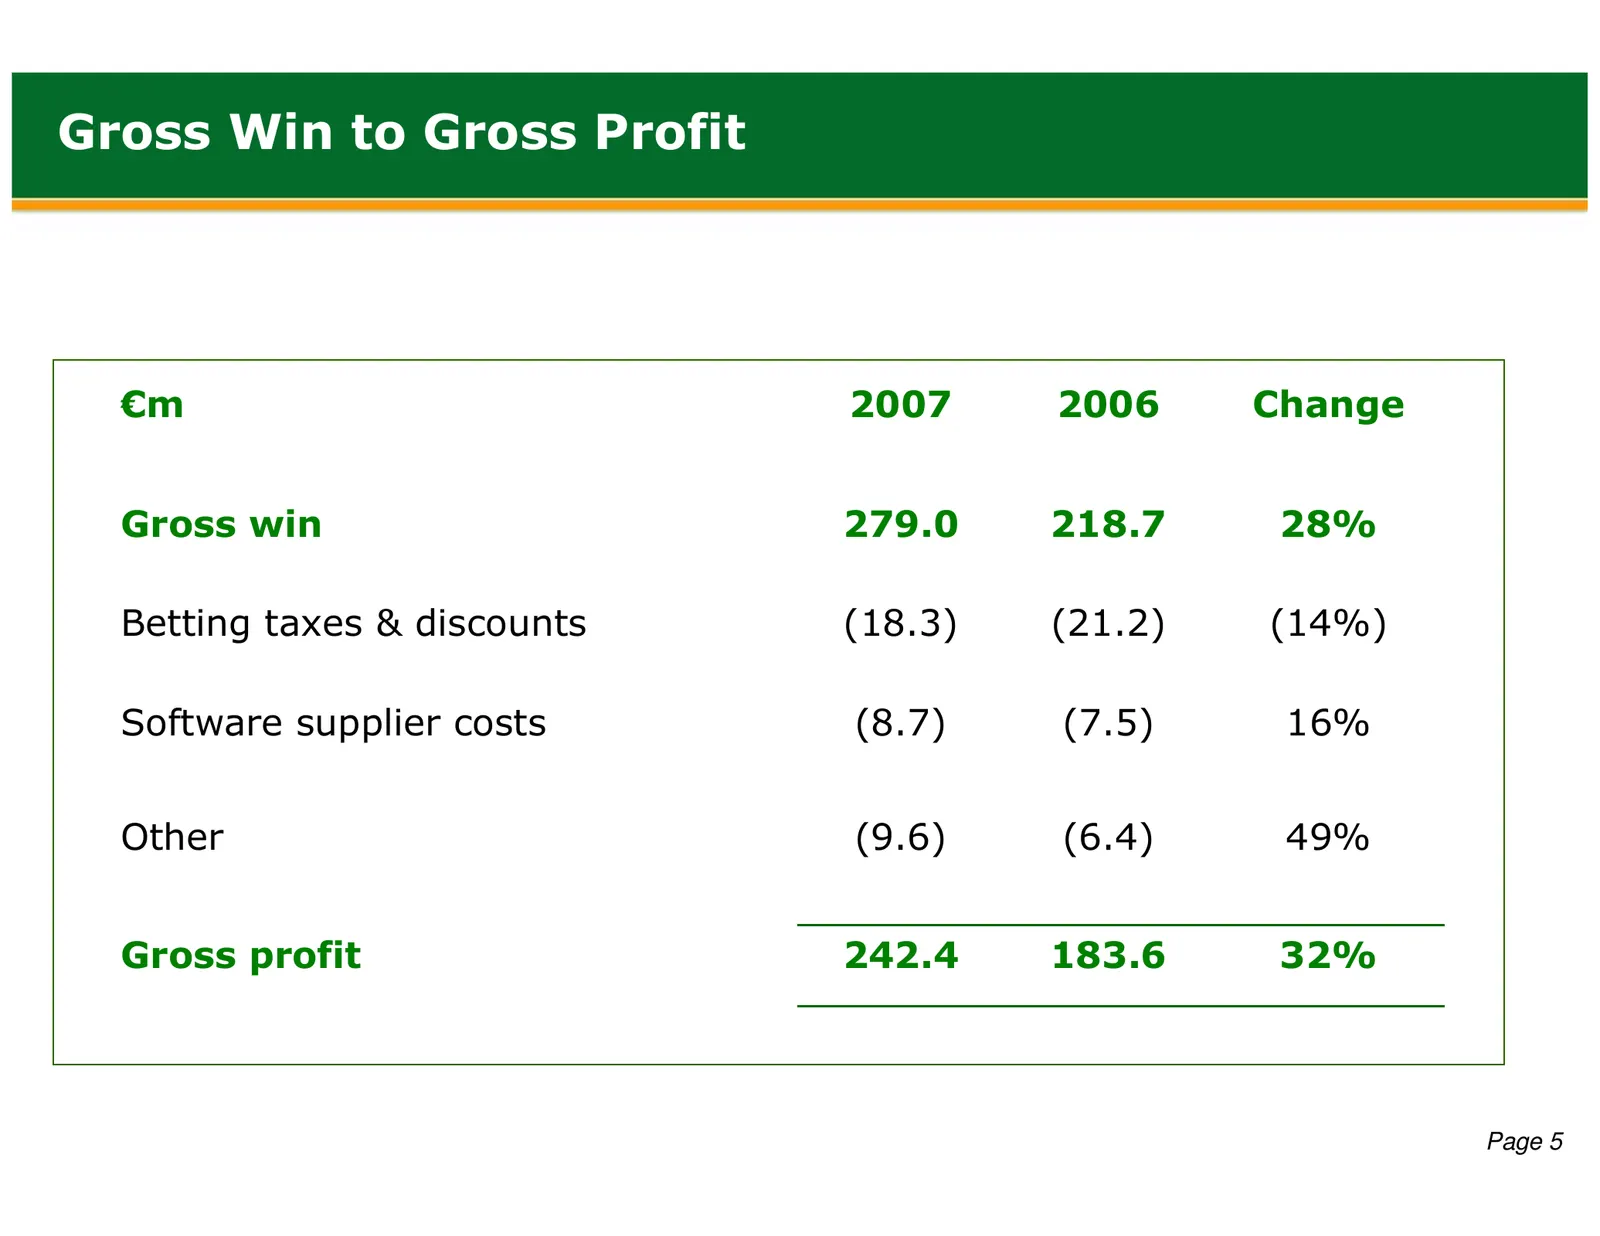
Gross Win to Gross Profit €m 2007 2006 Change Gross win 279.0 218.7 28% Betting taxes & discounts (18.3) (21.2) (14%) Software supplier costs (8.7) (7.5) 16% Other (9.6) (6.4) 49% Gross profit 242.4 183.6 32% Page 5
Slide 7: Operating Cost Growth
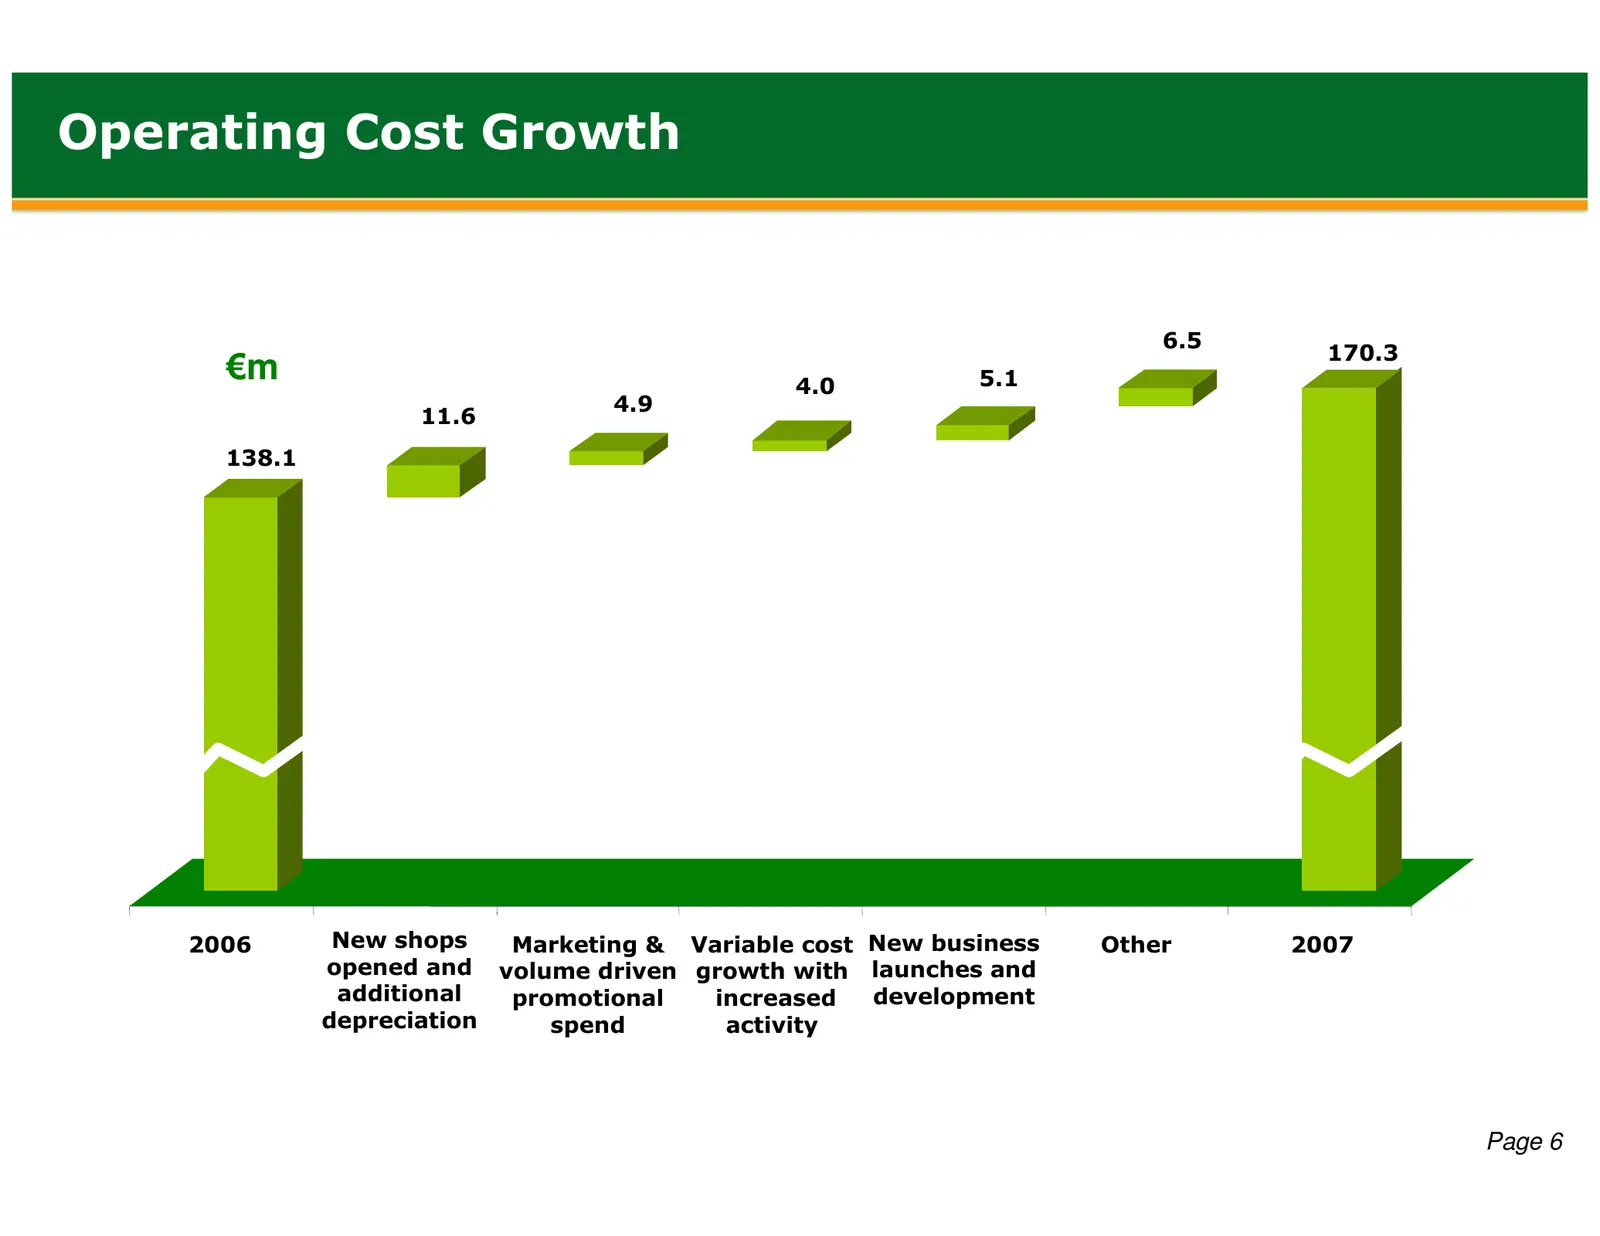
Operating Cost Growth 6.5 170.3 €m 4.0 5.1 4.9 11.6 138.1 2006 New shops Marketing & Variable cost New business Other 2007 opened and volume driven growth with launches and additional promotional increased development depreciation spend activity Page 6
Slide 8: Cash Flow
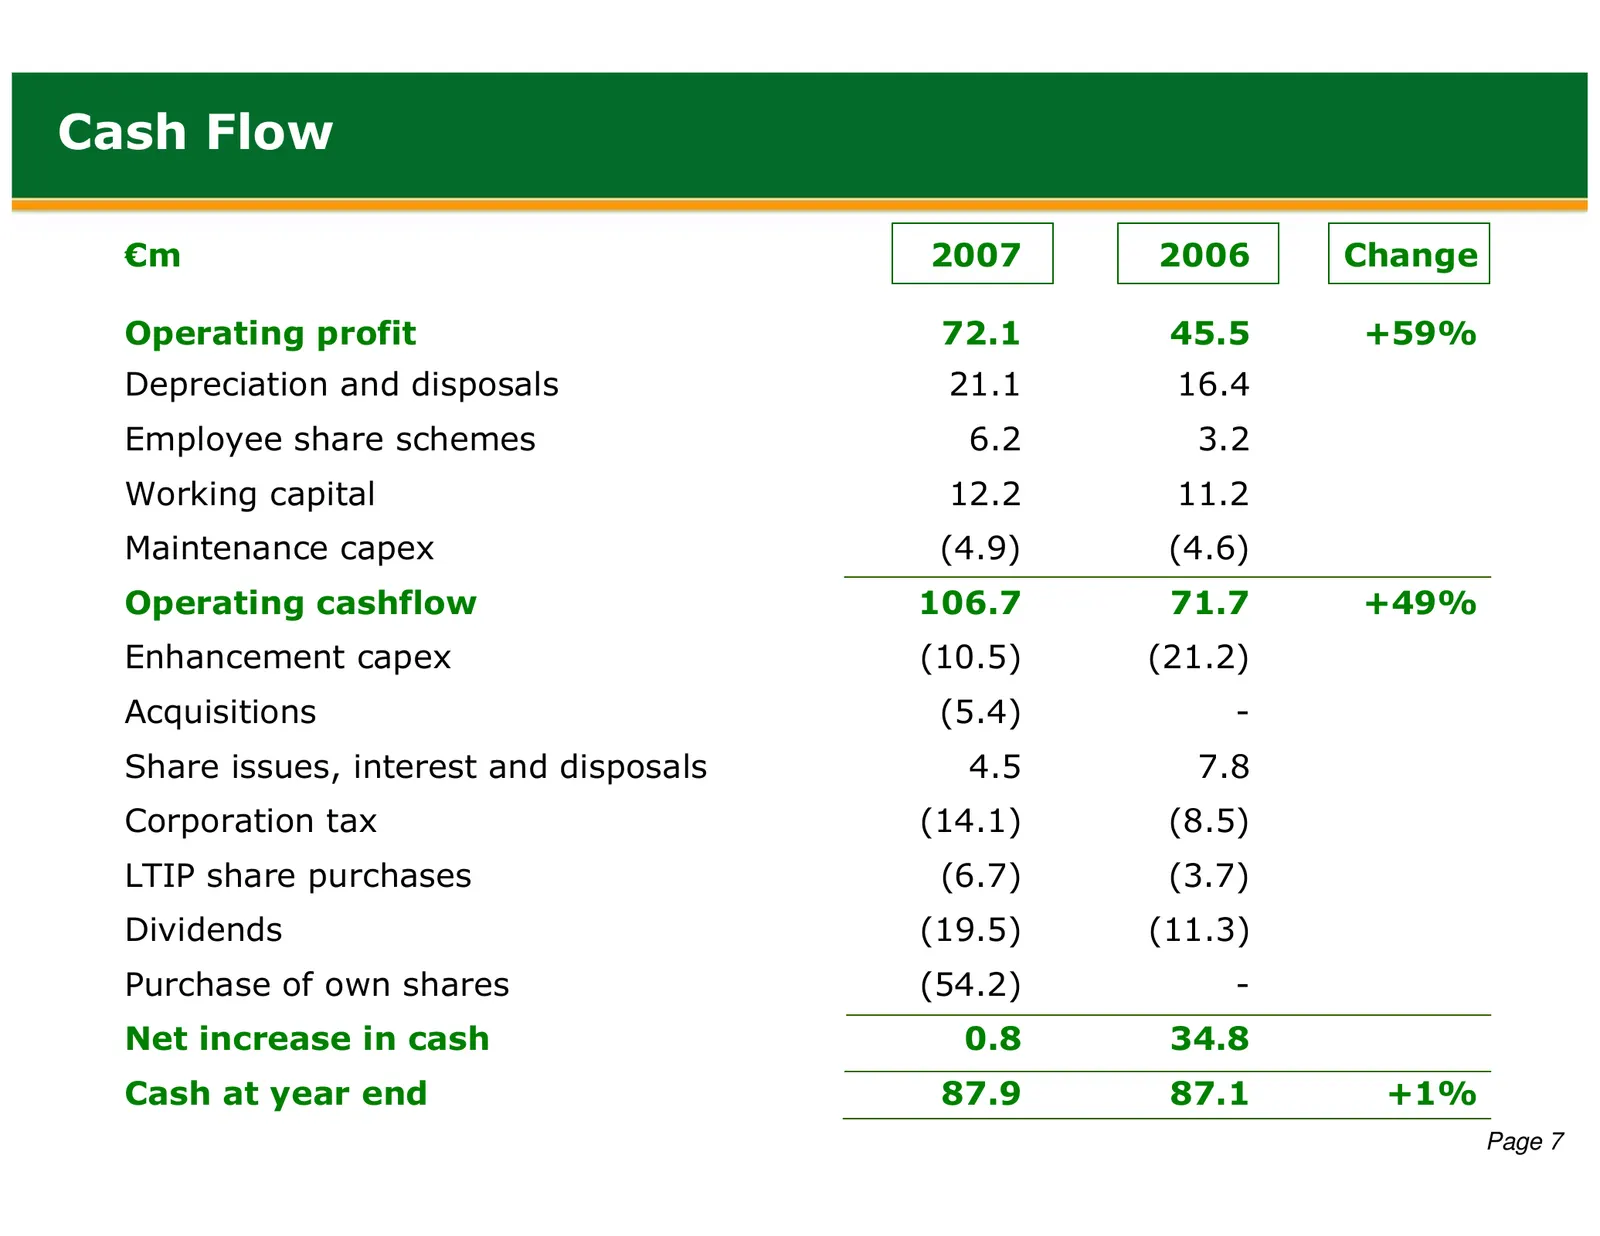
Cash Flow €m 2007 2006 Change Operating profit 72.1 45.5 +59% Depreciation and disposals 21.1 16.4 Employee share schemes 6.2 3.2 Working capital 12.2 11.2 Maintenance capex (4.9) (4.6) Operating cashflow 106.7 71.7 +49% Enhancement capex (10.5) (21.2) Acquisitions (5.4) - Share issues, interest and
Slide 9: Capital Expenditure
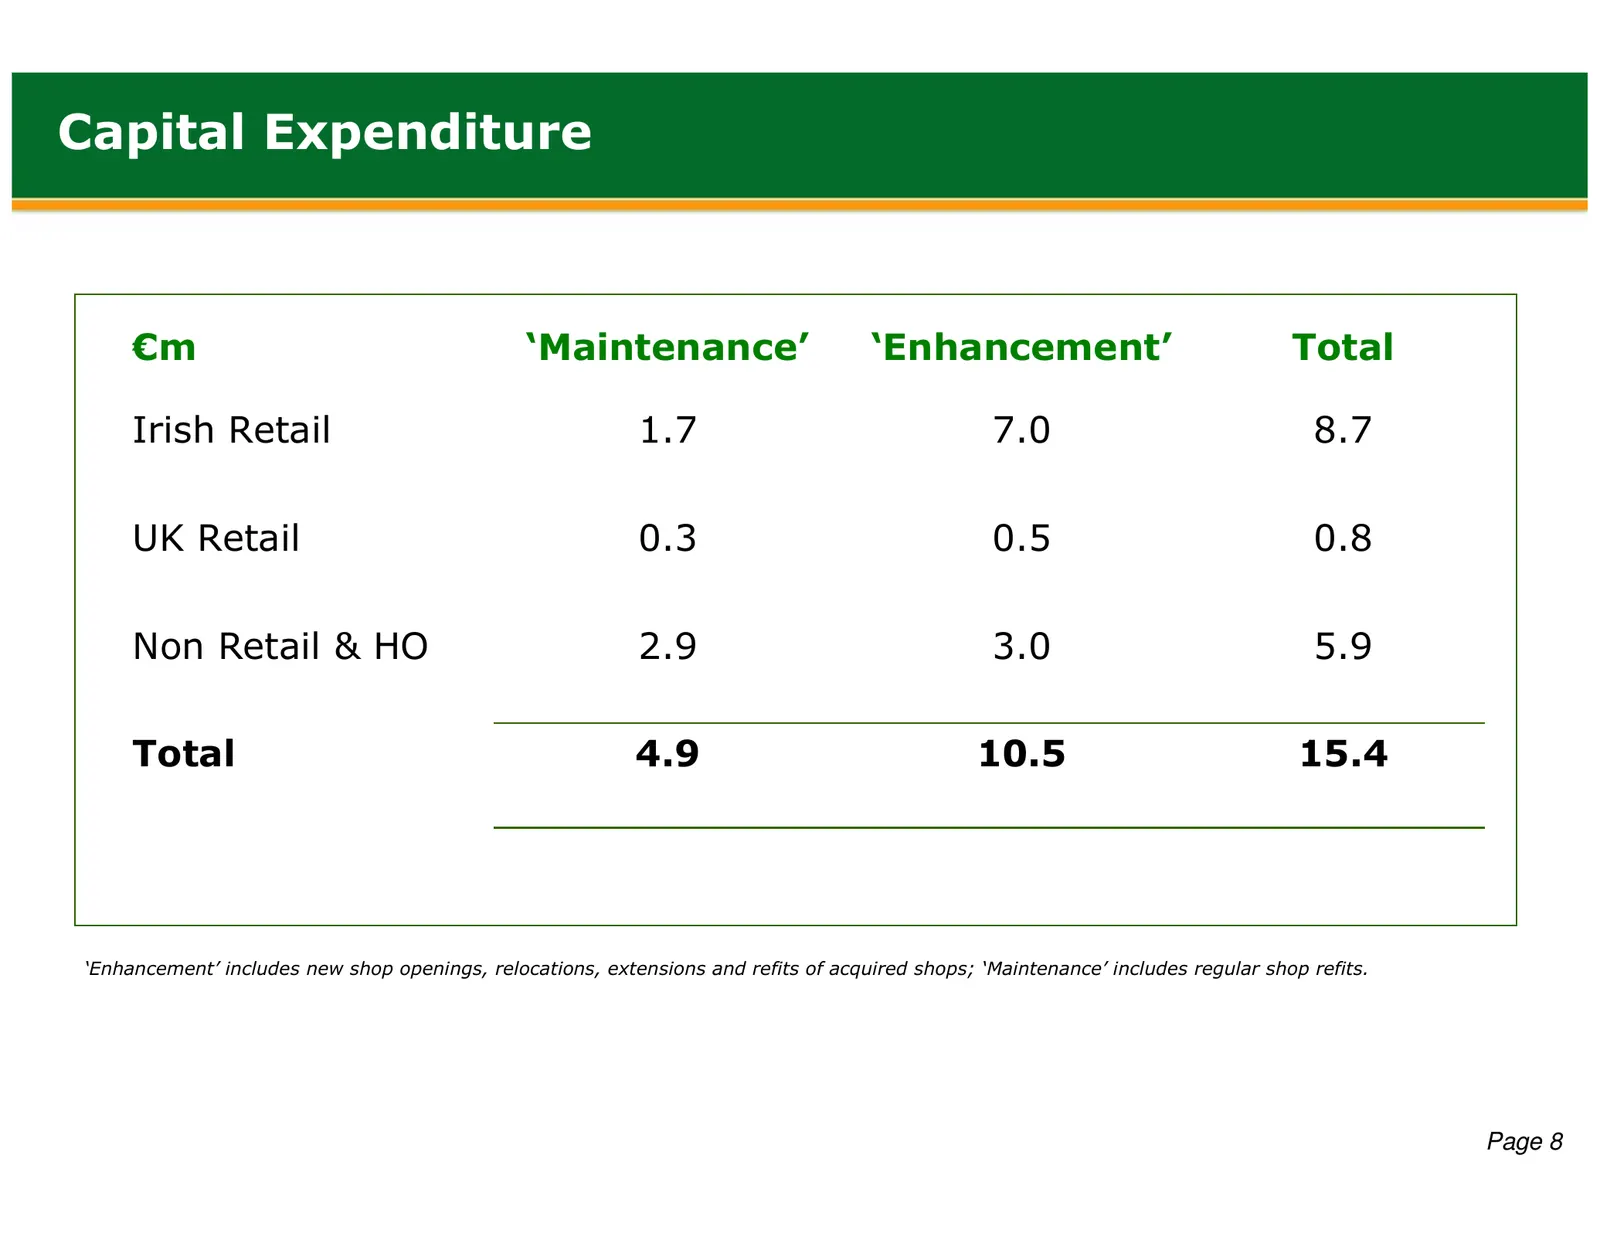
Capital Expenditure €m ‘Maintenance’ ‘Enhancement’ Total Irish Retail 1.7 7.0 8.7 UK Retail 0.3 0.5 0.8 Non Retail & HO 2.9 3.0 5.9 Total 4.9 10.5 15.4 ‘Enhancement’ includes new shop openings, relocations, extensions and refits of acquired shops; ‘Maintenance’ includes regular shop refits. Page 8
Slide 10: Cash Returns to Shareholders
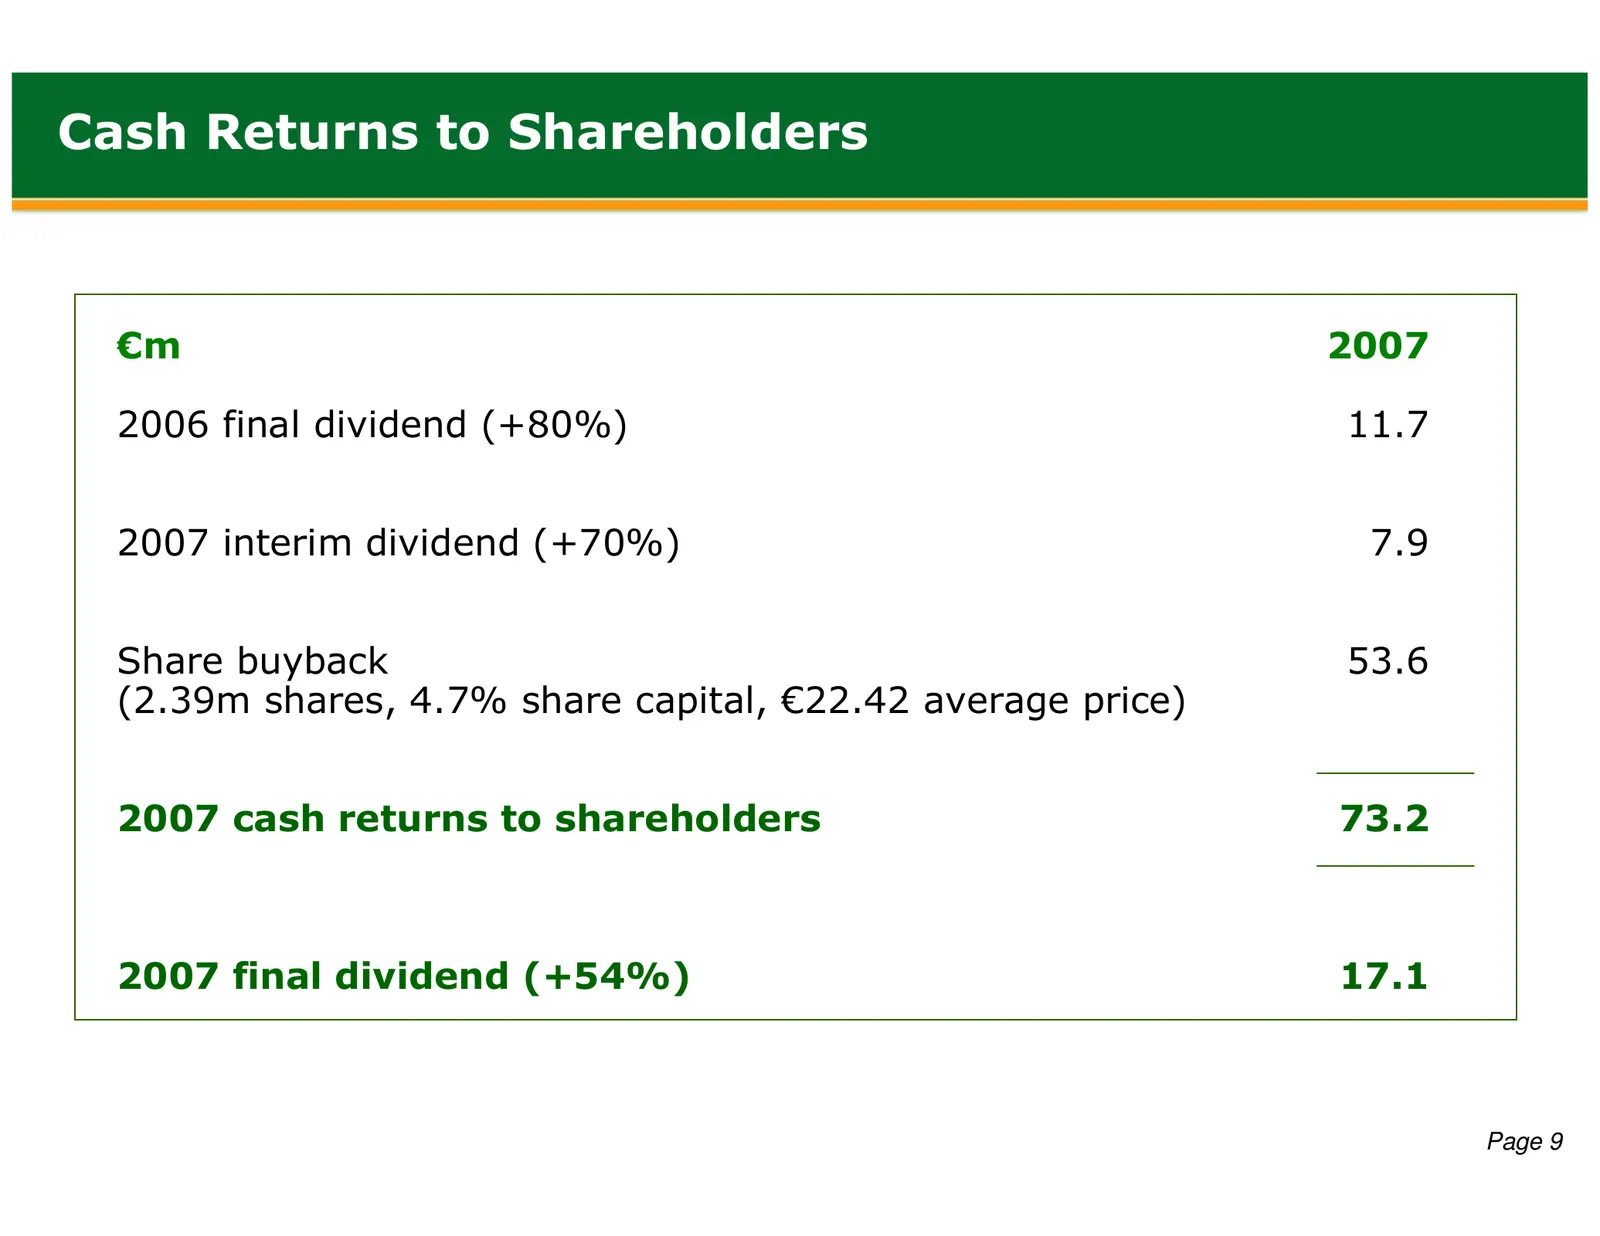
Cash Returns to Shareholders €m 2007 2006 final dividend (+80%) 11.7 2007 interim dividend (+70%) 7.9 Share buyback 53.6 (2.39m shares, 4.7% share capital, €22.42 average price) 2007 cash returns to shareholders 73.2 2007 final dividend (+54%) 17.1 Page 9
Slide 11: Operational Review
Operational Review Introduction Financial Performance Operational Review Development and Strategy Page 10
Slide 12: Divisional Summary
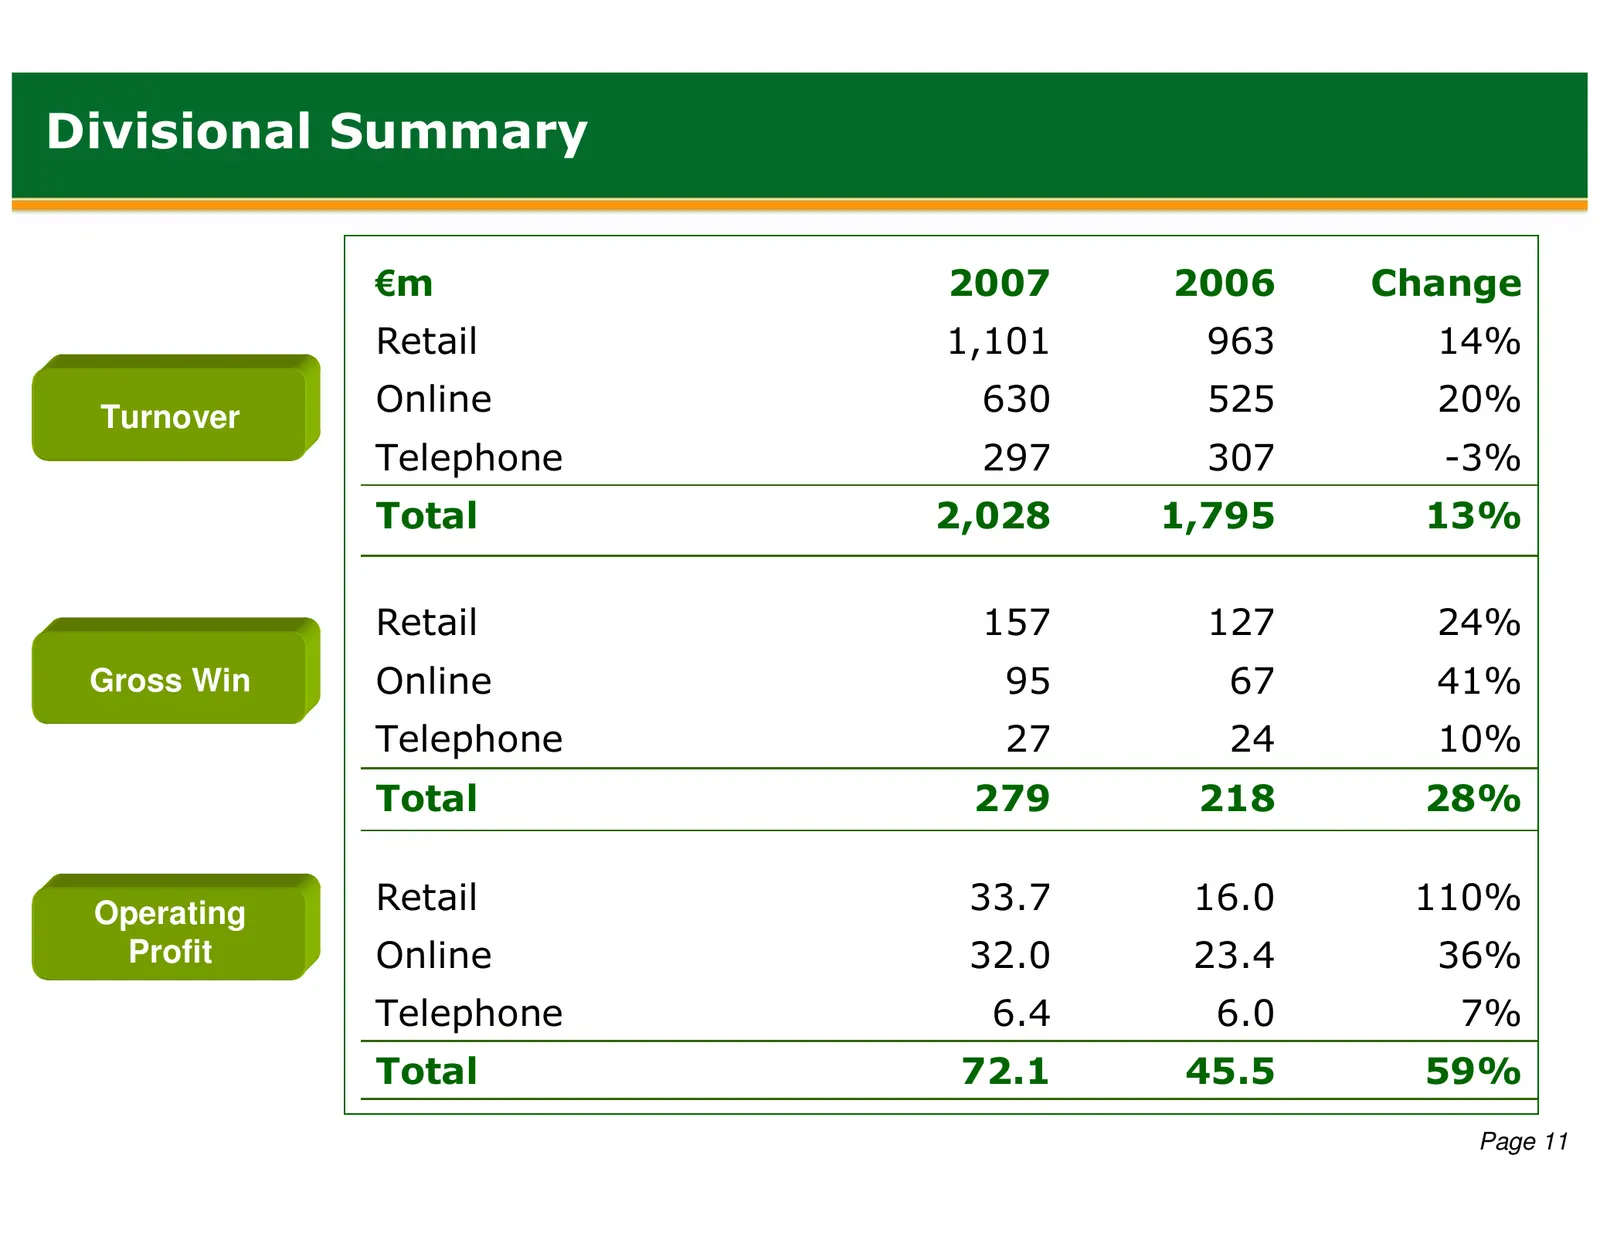
Divisional Summary €m 2007 2006 Change Retail 1,101 963 14% Turnover Online 630 525 20% Telephone 297 307 -3% Total 2,028 1,795 13% Retail 157 127 24% Gross Win Online 95 67 41% Telephone 27 24 10% Total 279 218 28% Operating Retail 33.7 16.0 110% Profit Online 32.0 23.4 36% Telephone 6.4 6.0 7% Tot
Slide 13: Sportsbook Gross Win Percentages
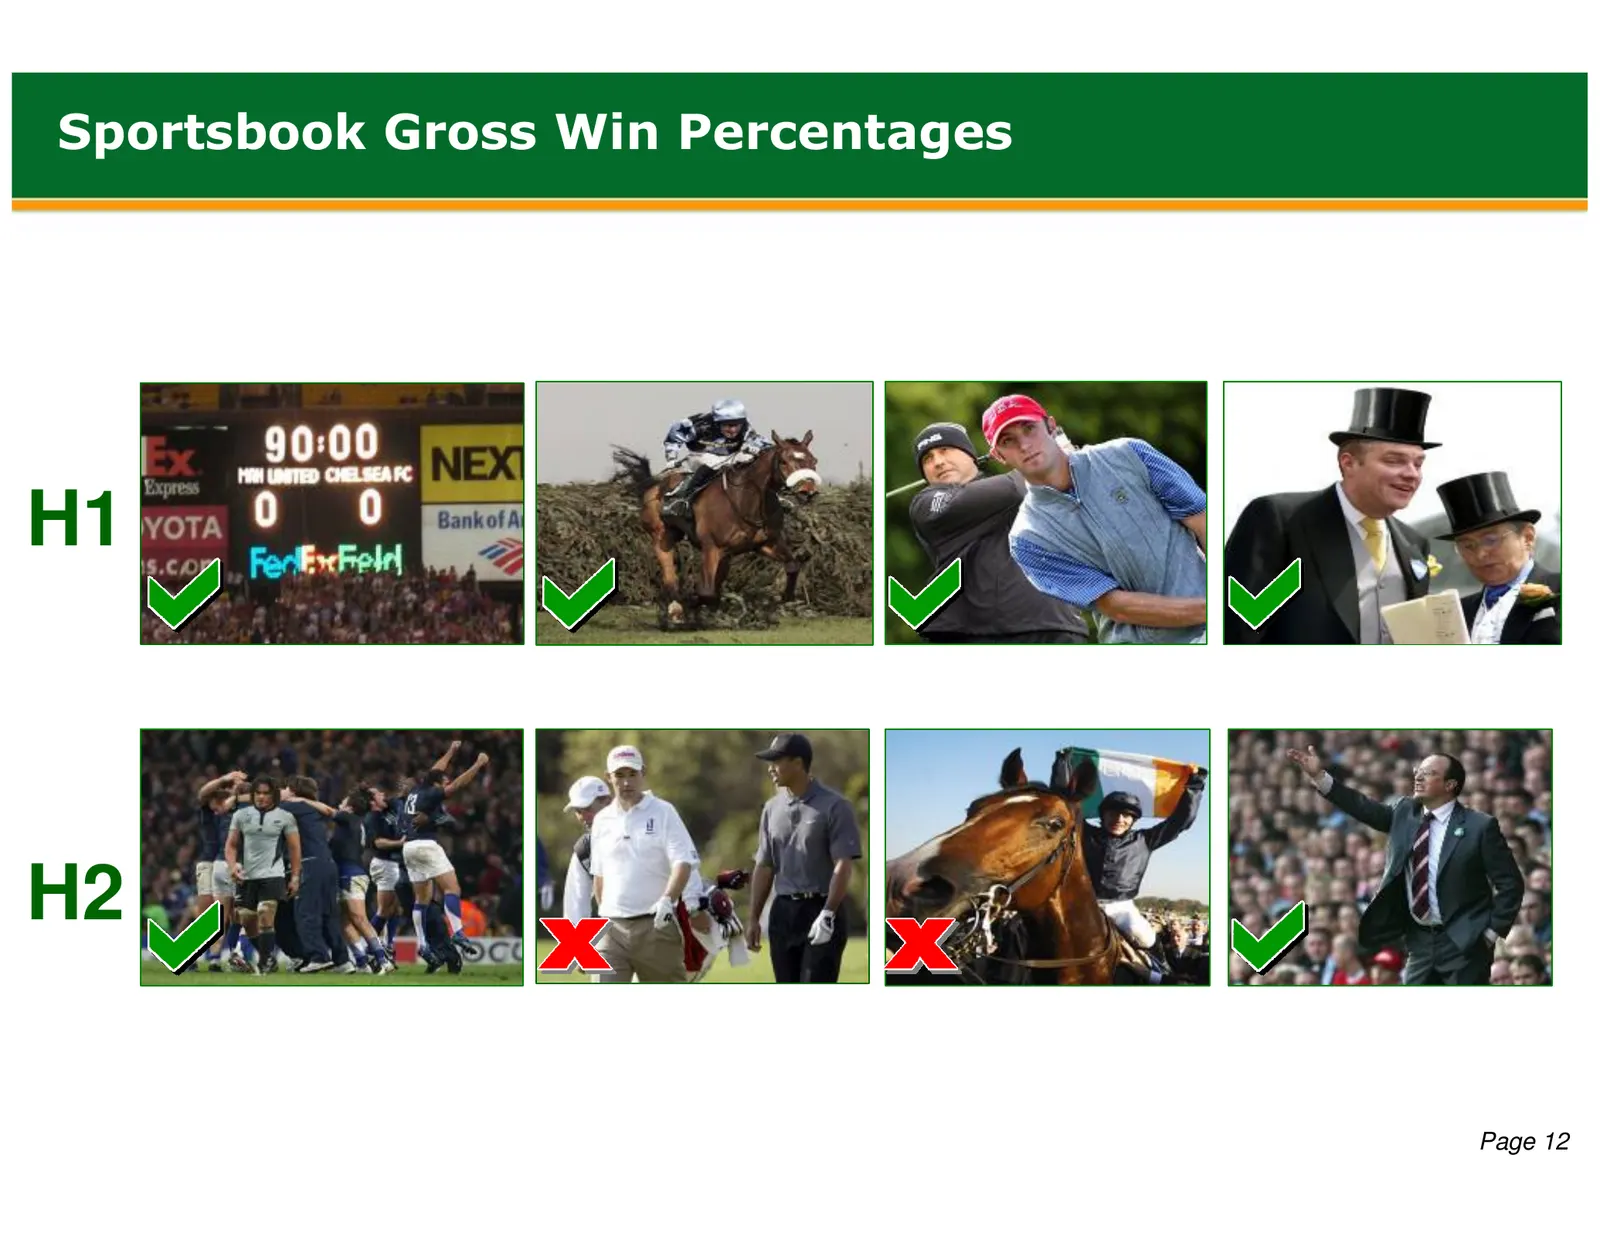
Sportsbook Gross Win Percentages H1 H2 Page 12
Slide 14: Irish Retail
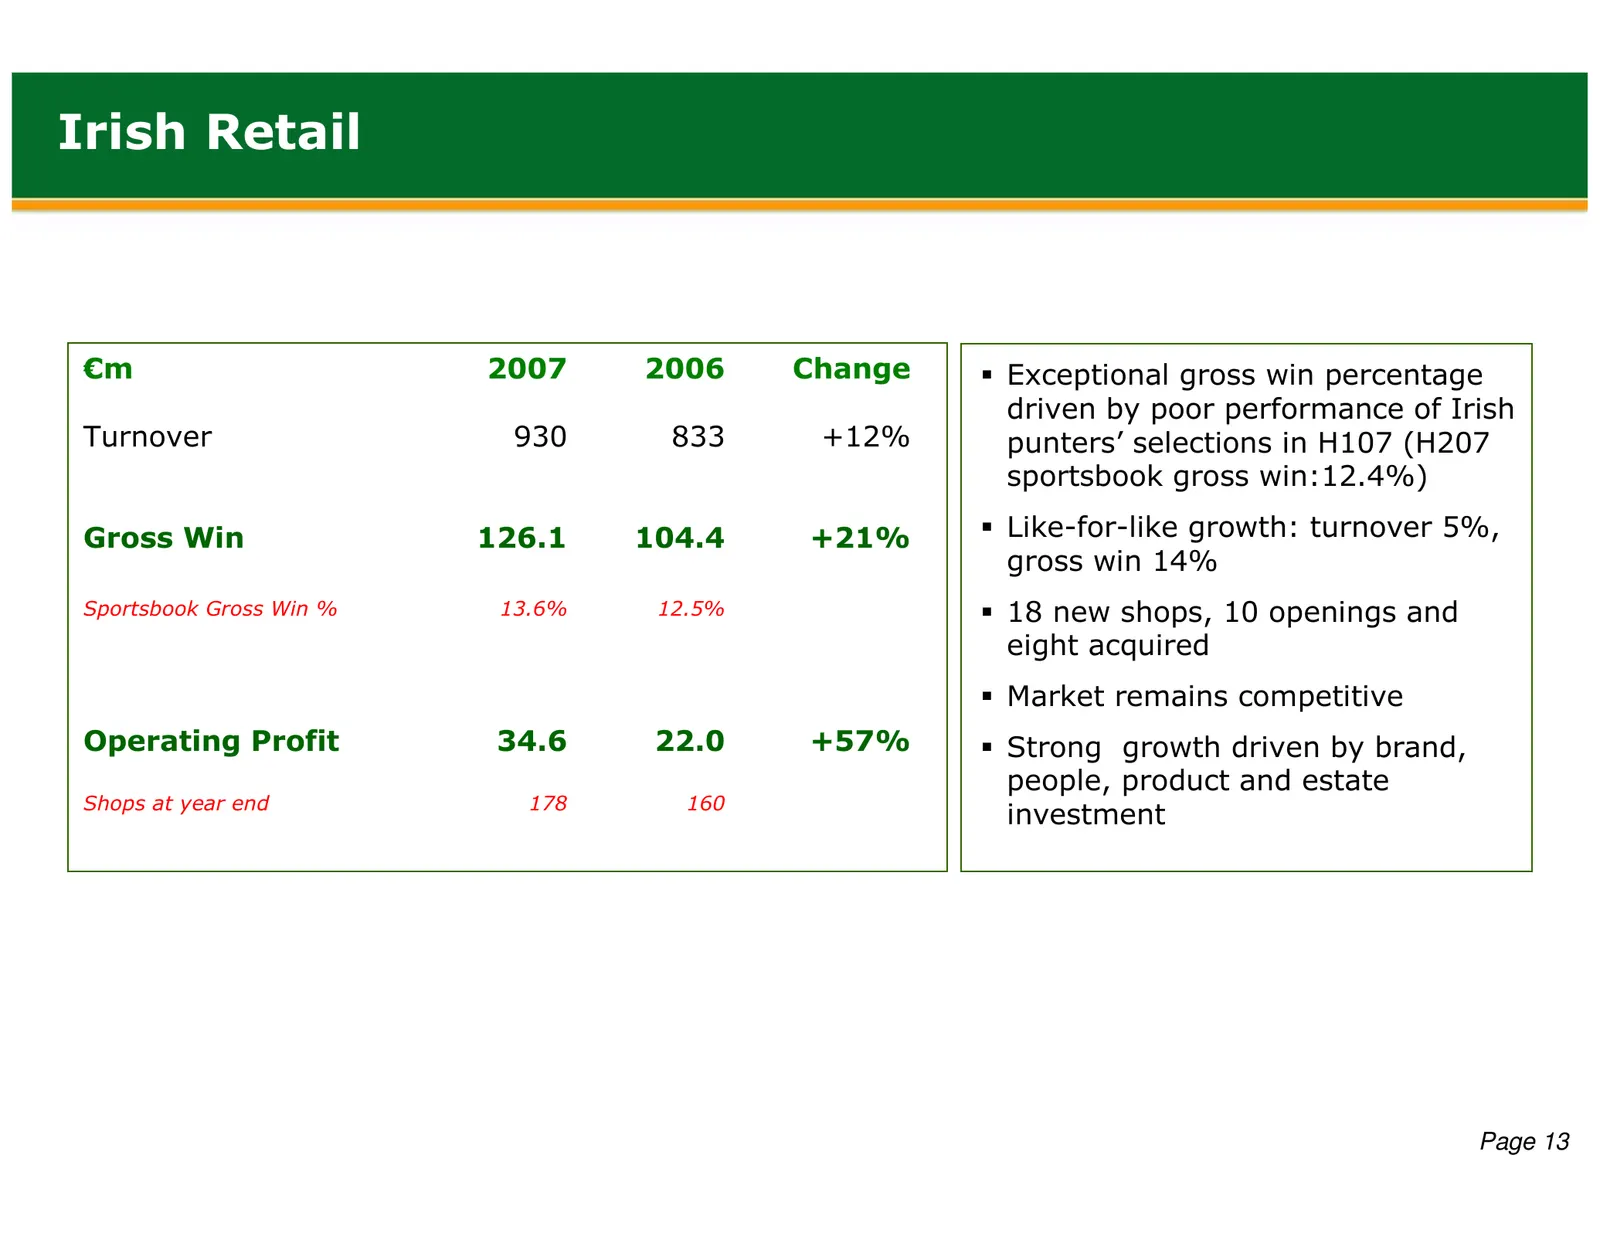
Irish Retail €m 2007 2006 Change Exceptional gross win percentage driven by poor performance of Irish Turnover 930 833 +12% punters’ selections in H107 (H207 sportsbook gross win:12.4%) Gross Win 126.1 104.4 +21% Like-for-like growth: turnover 5%, gross win 14% Sportsbook Gross Win % 13.6% 12.5% 18
Slide 15: UK Retail
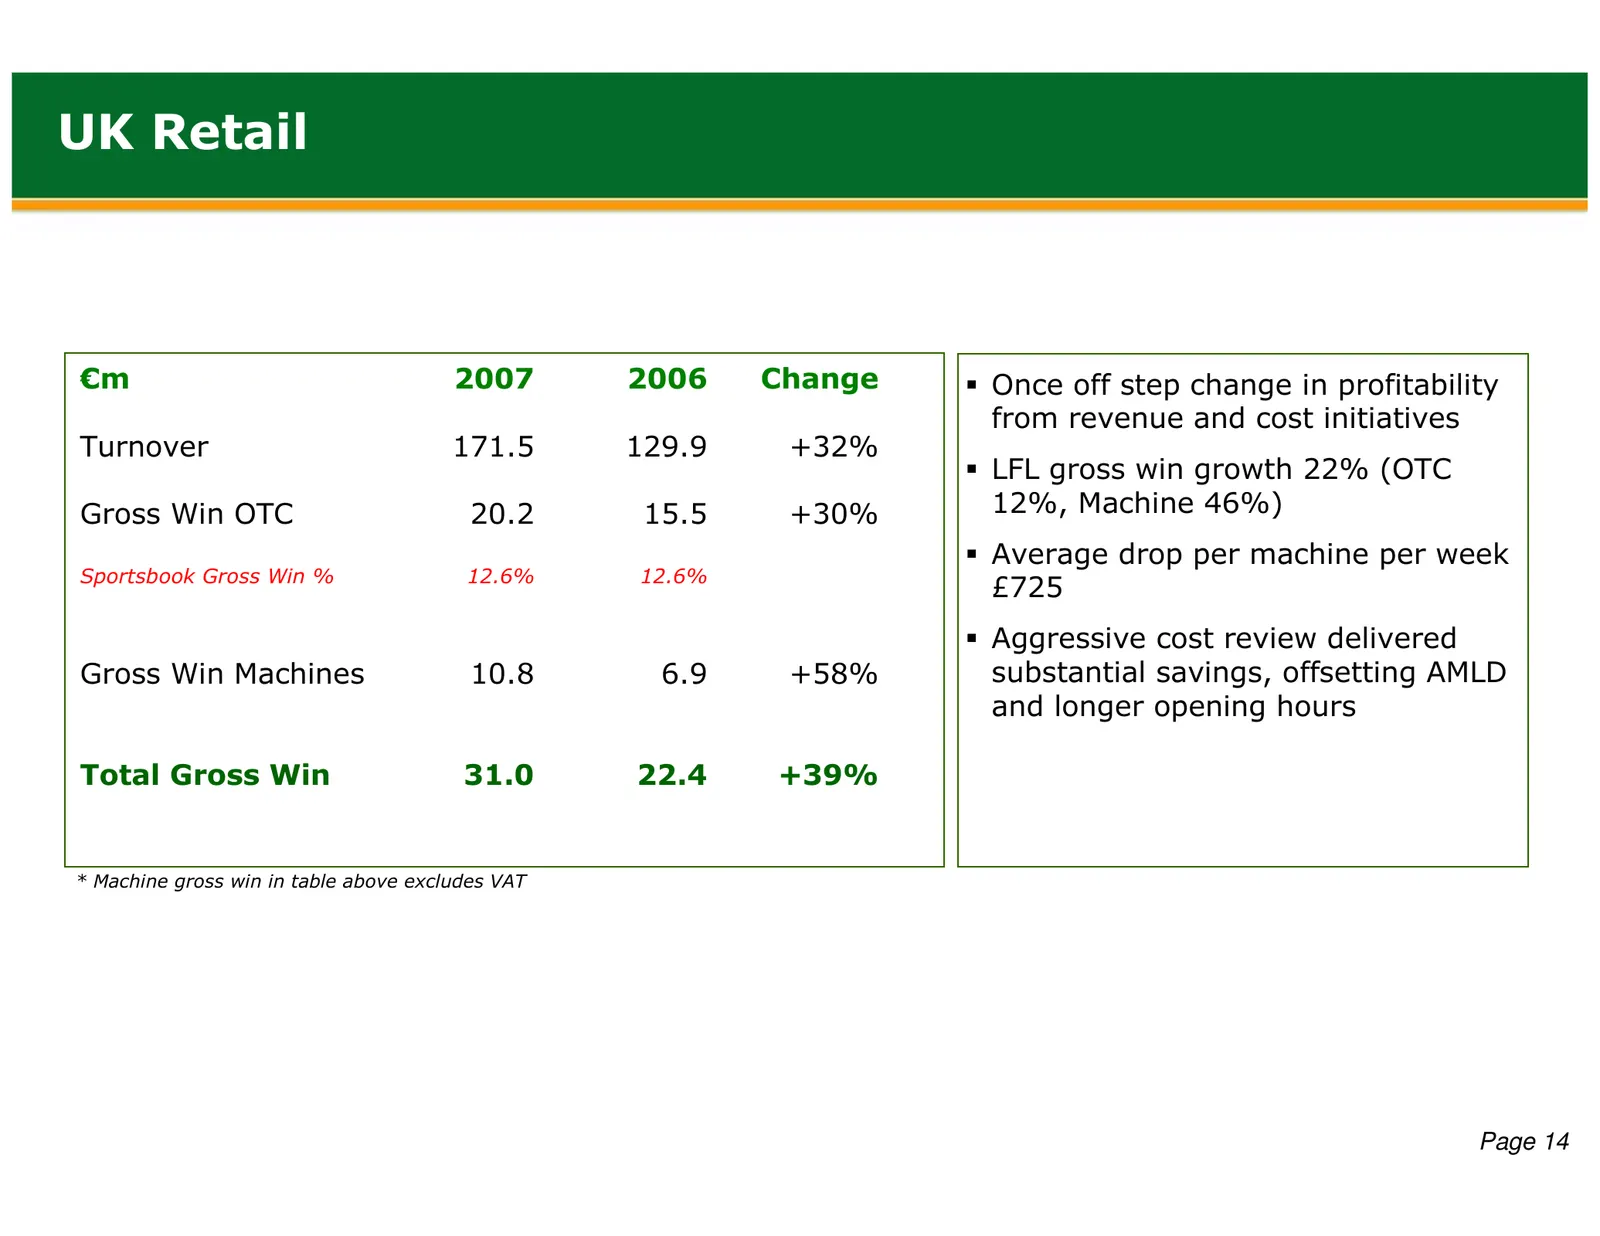
UK Retail €m 2007 2006 Change Once off step change in profitability from revenue and cost initiatives Turnover 171.5 129.9 +32% LFL gross win growth 22% (OTC Gross Win OTC 20.2 15.5 +30% 12%, Machine 46%) Average drop per machine per week Sportsbook Gross Win % 12.6% 12.6% £725 Aggressive cost revie
Slide 16: UK Retail
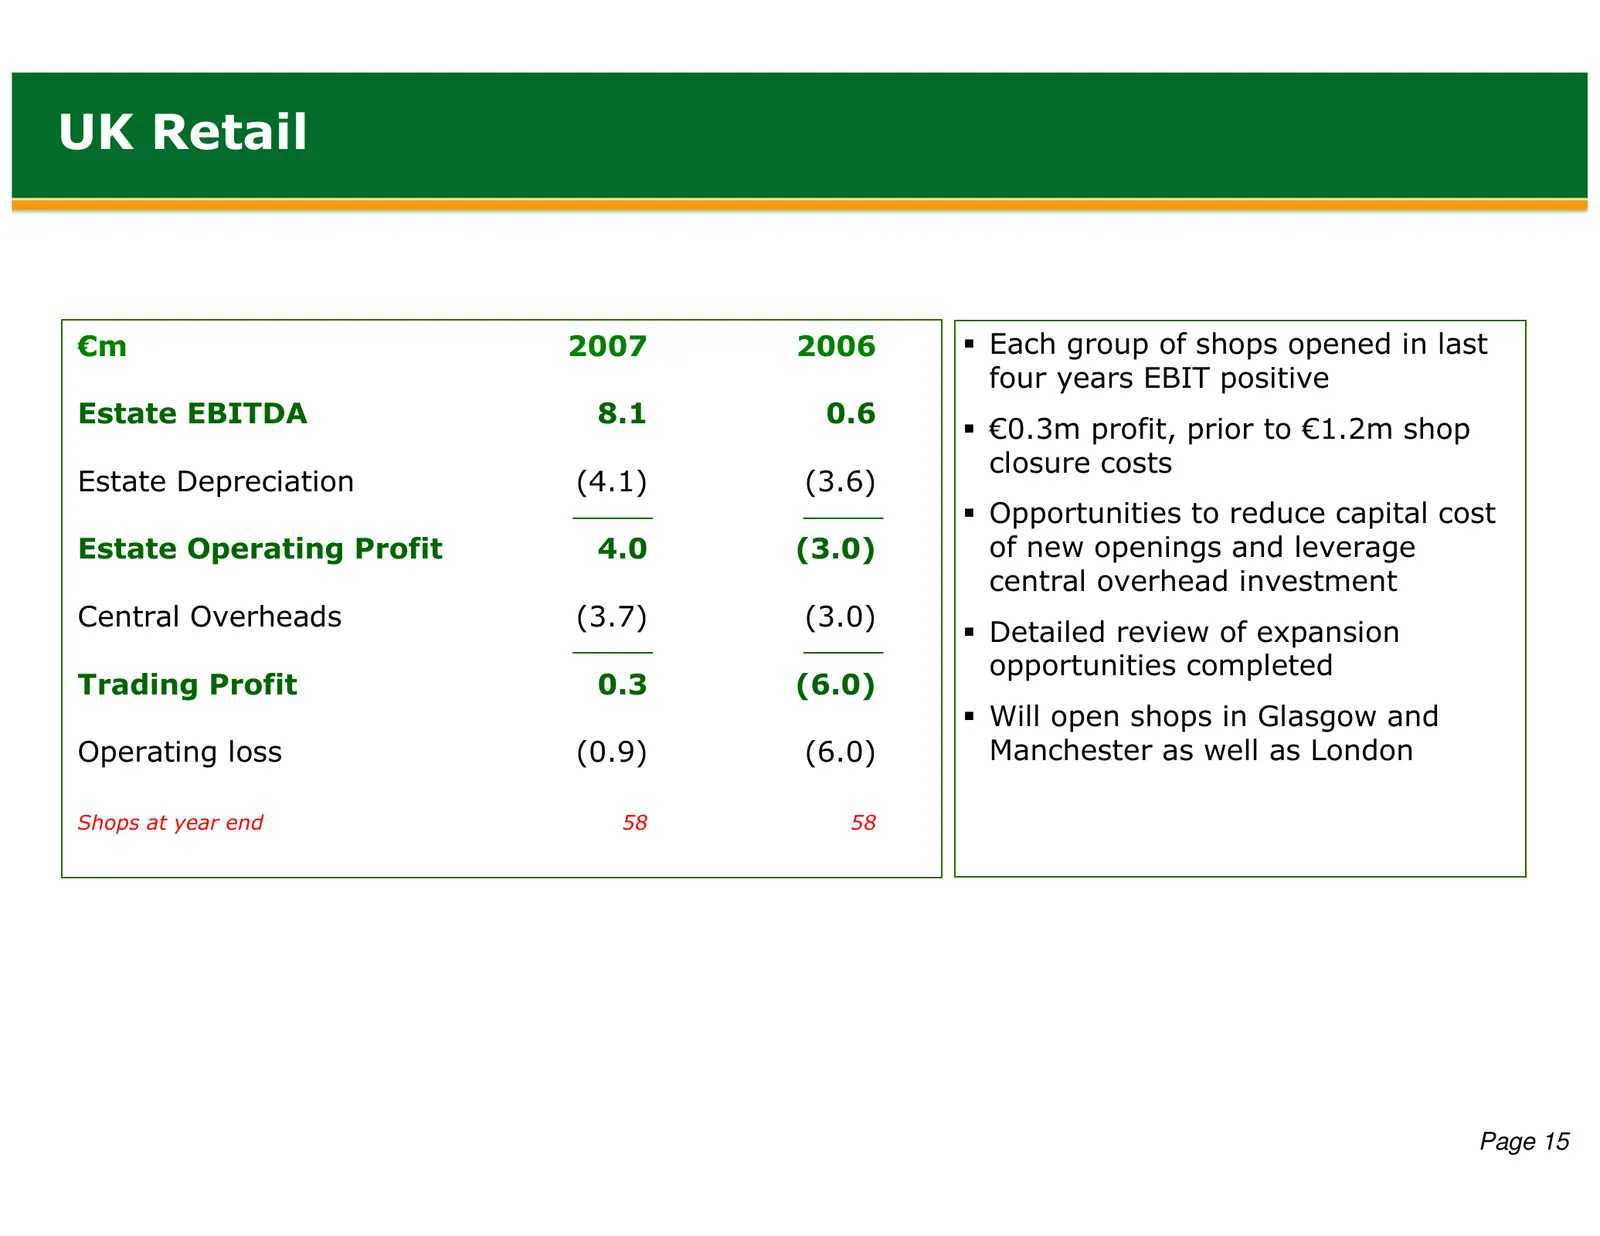
UK Retail €m 2007 2006 Each group of shops opened in last four years EBIT positive Estate EBITDA 8.1 0.6 €0.3m profit, prior to €1.2m shop closure costs Estate Depreciation (4.1) (3.6) Opportunities to reduce capital cost Estate Operating Profit 4.0 (3.0) of new openings and leverage central overhea
Slide 17: Online
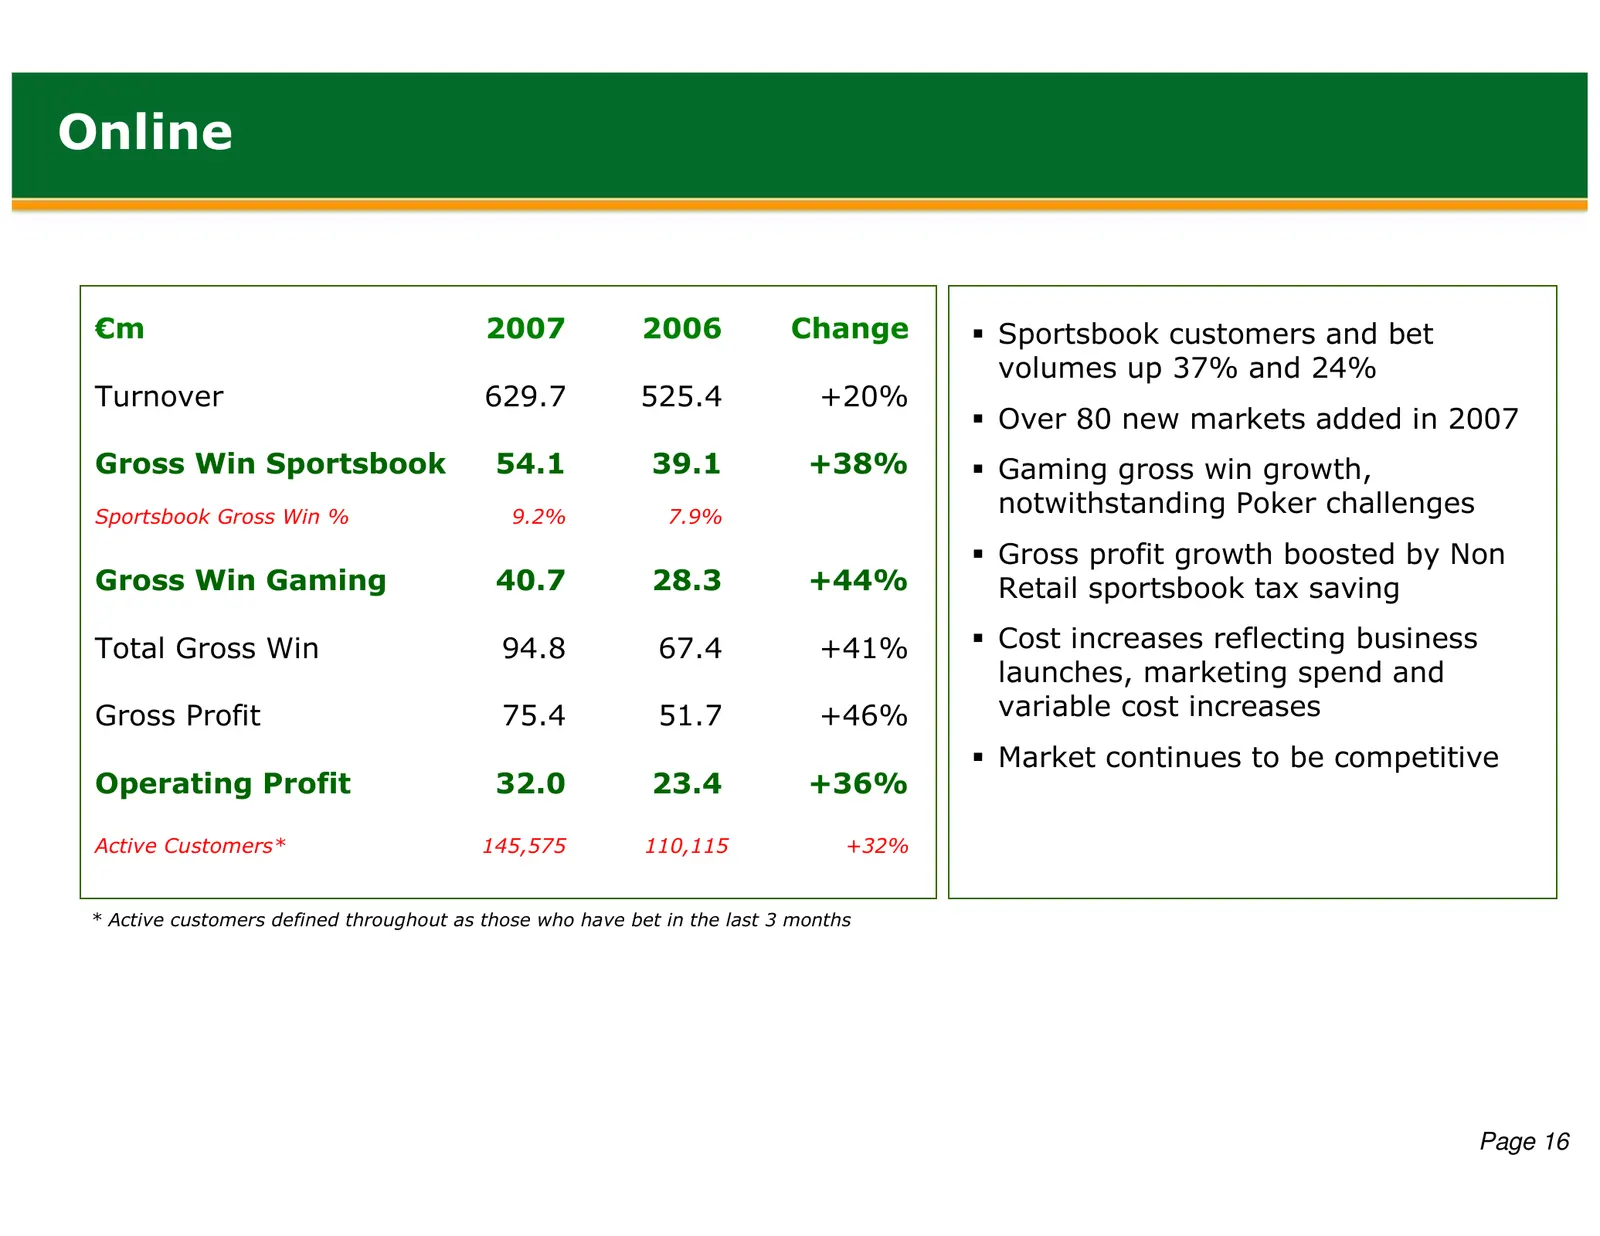
Online €m 2007 2006 Change Sportsbook customers and bet volumes up 37% and 24% Turnover 629.7 525.4 +20% Over 80 new markets added in 2007 Gross Win Sportsbook 54.1 39.1 +38% Gaming gross win growth, Sportsbook Gross Win % 9.2% 7.9% notwithstanding Poker challenges Gross profit growth boosted by Non
Slide 18: Telephone
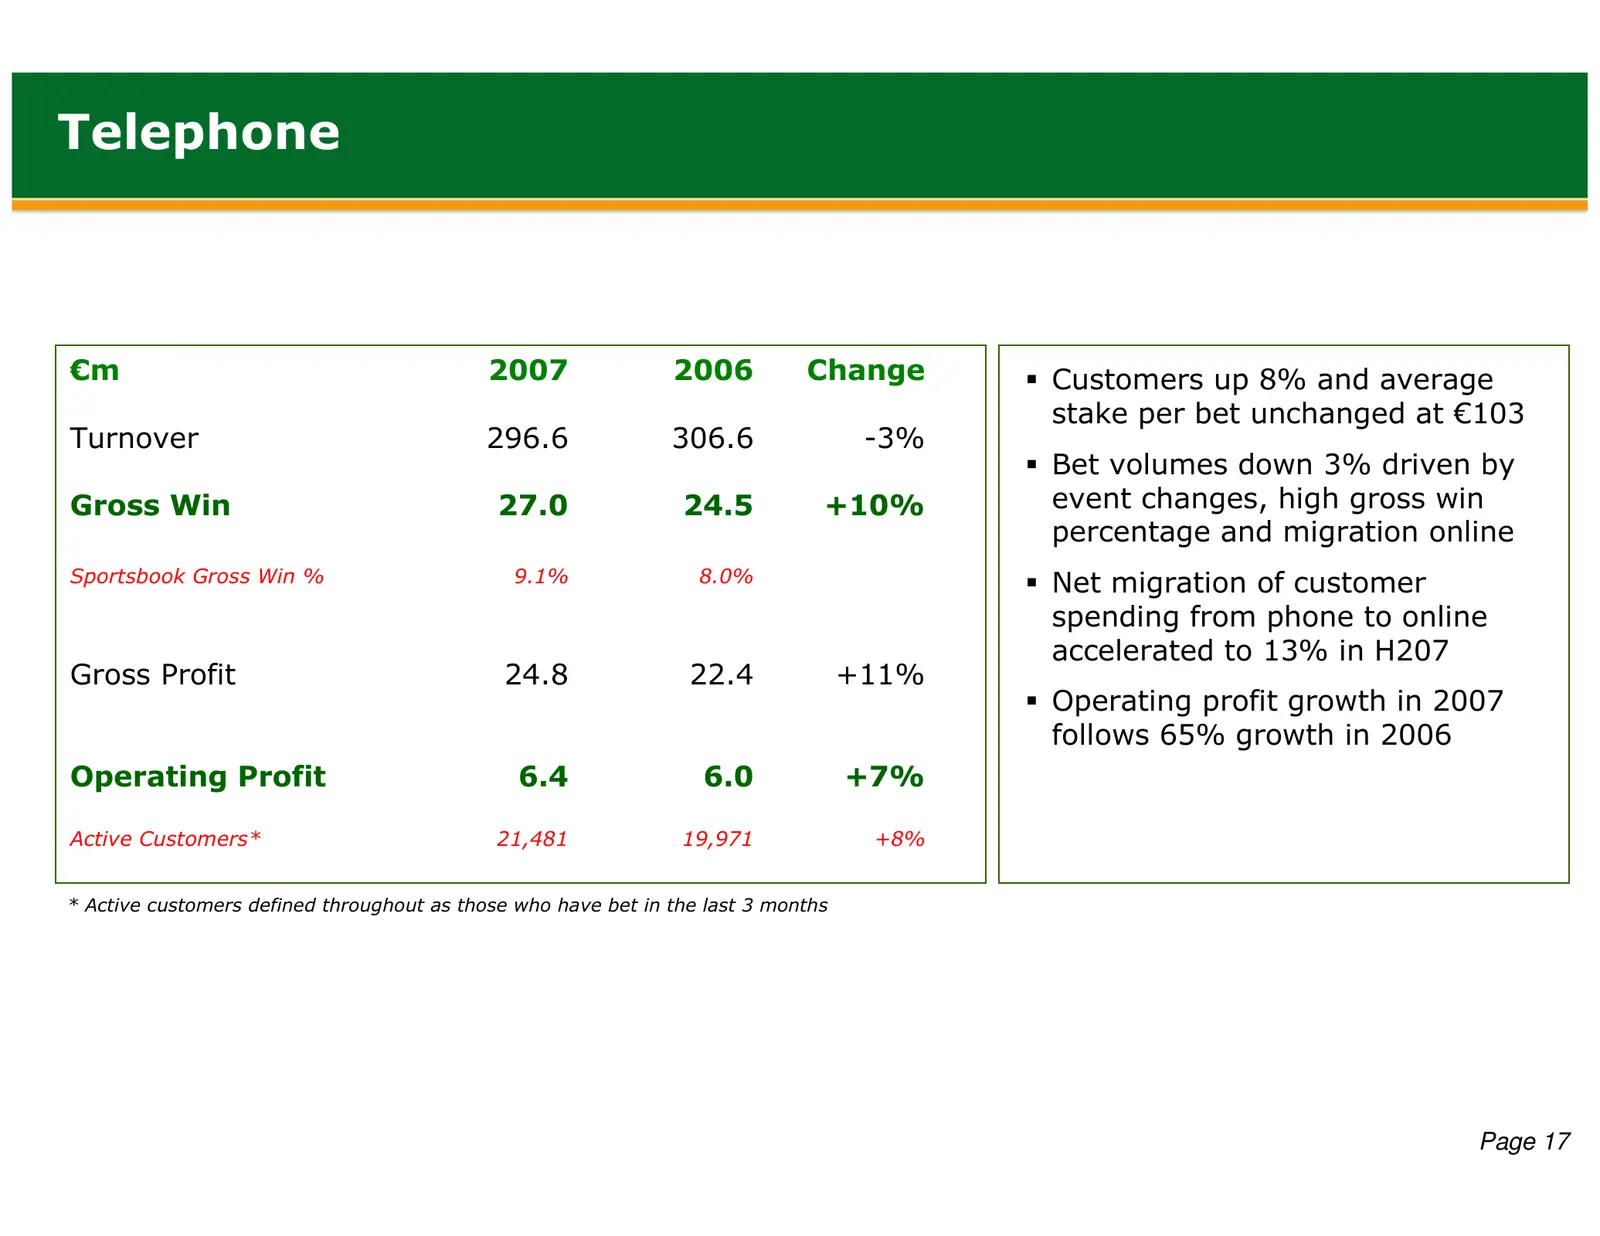
Telephone €m 2007 2006 Change Customers up 8% and average stake per bet unchanged at €103 Turnover 296.6 306.6 -3% Bet volumes down 3% driven by Gross Win 27.0 24.5 +10% event changes, high gross win percentage and migration online Sportsbook Gross Win % 9.1% 8.0% Net migration of customer spending
Slide 19: Development and Strategy
Development and Strategy Introduction Financial Performance Operational Review Development and Strategy Page 18
Slide 20: The Two Sides to Paddy Power
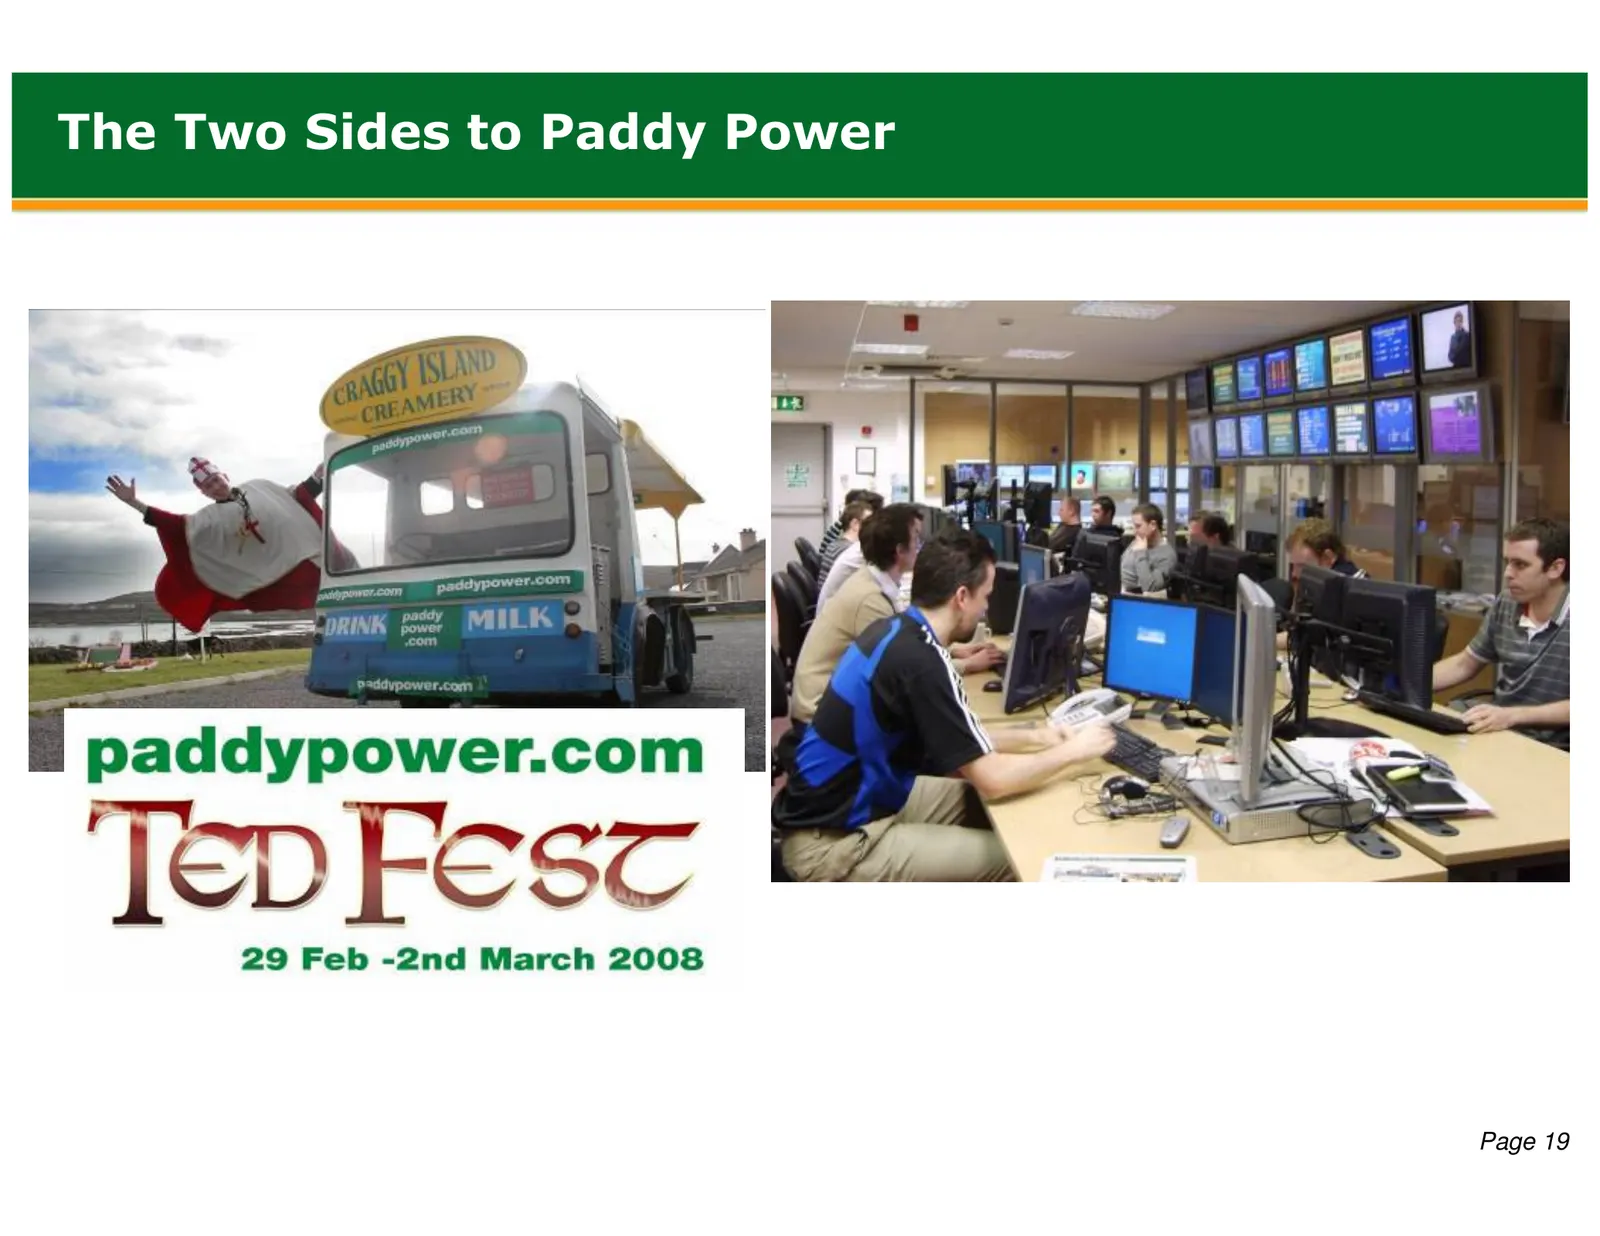
The Two Sides to Paddy Power Page 19
Slide 21: Brand: Fun and Friendly
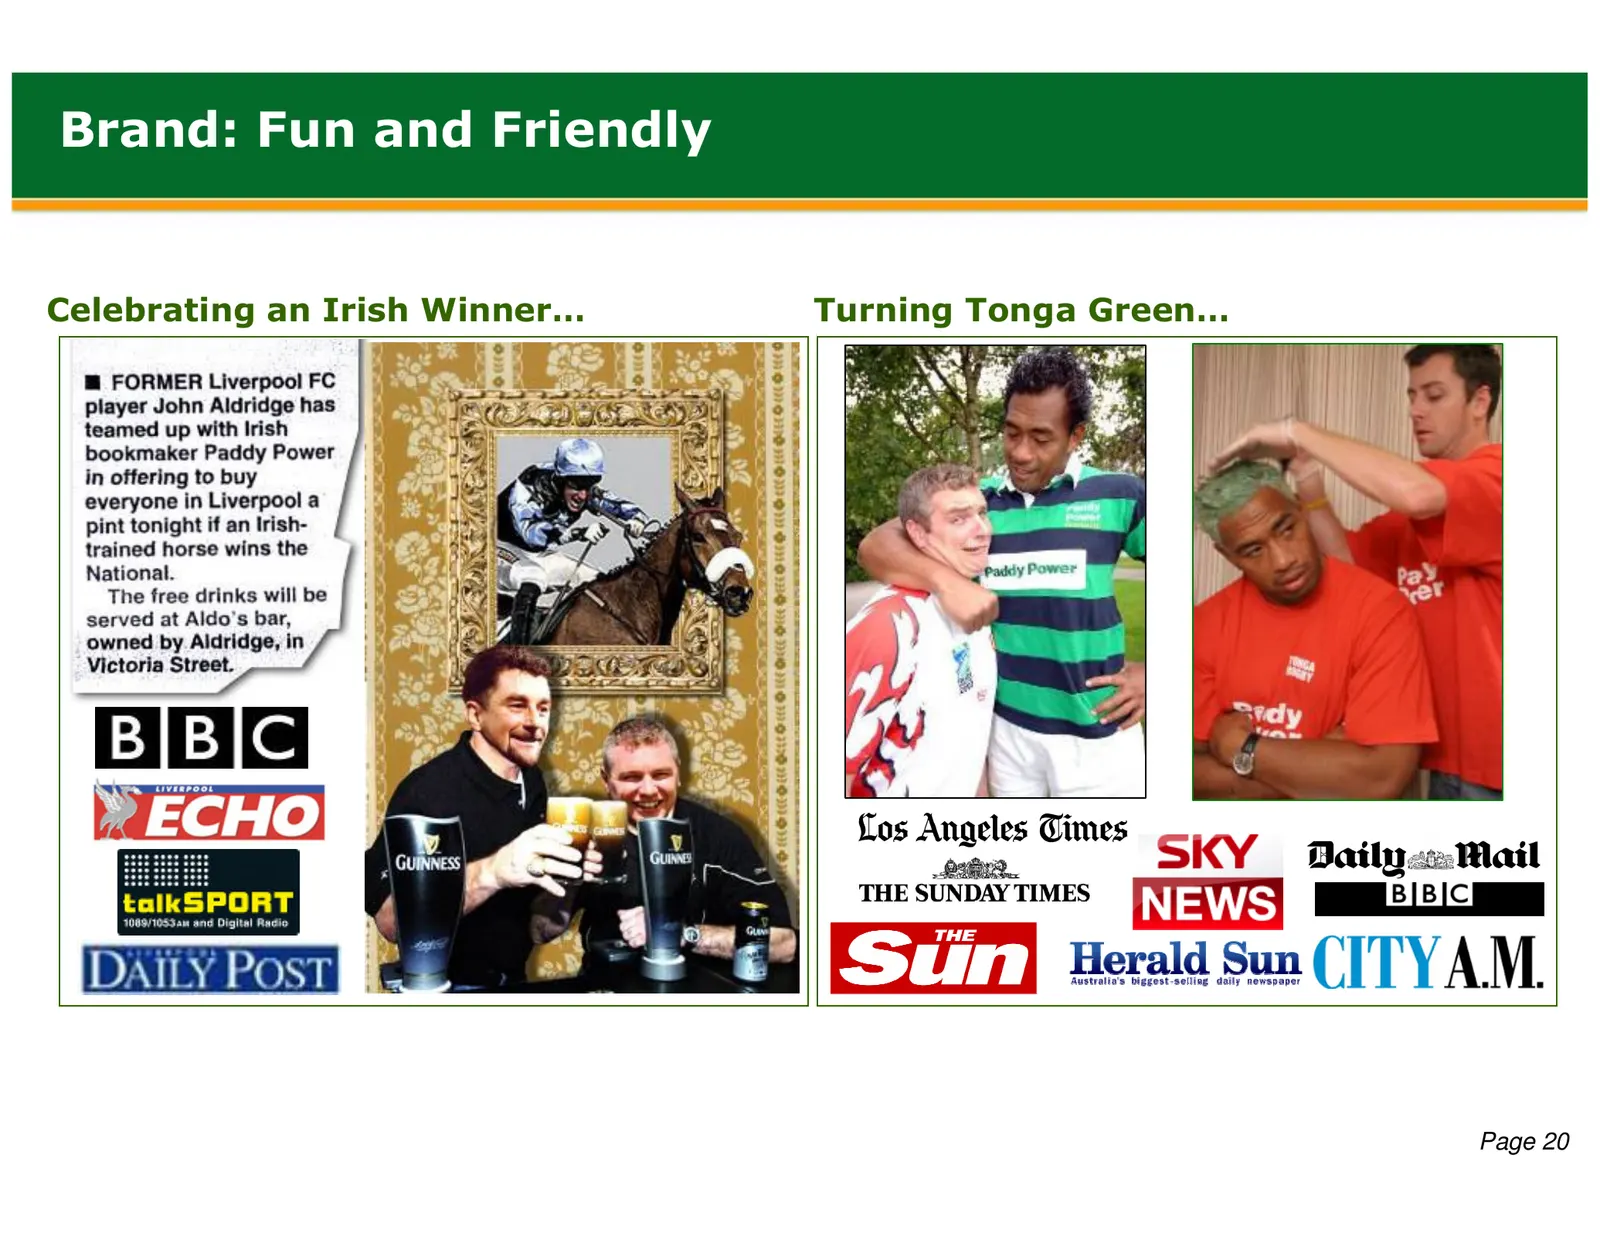
Brand: Fun and Friendly Celebrating an Irish Winner… Turning Tonga Green… Page 20
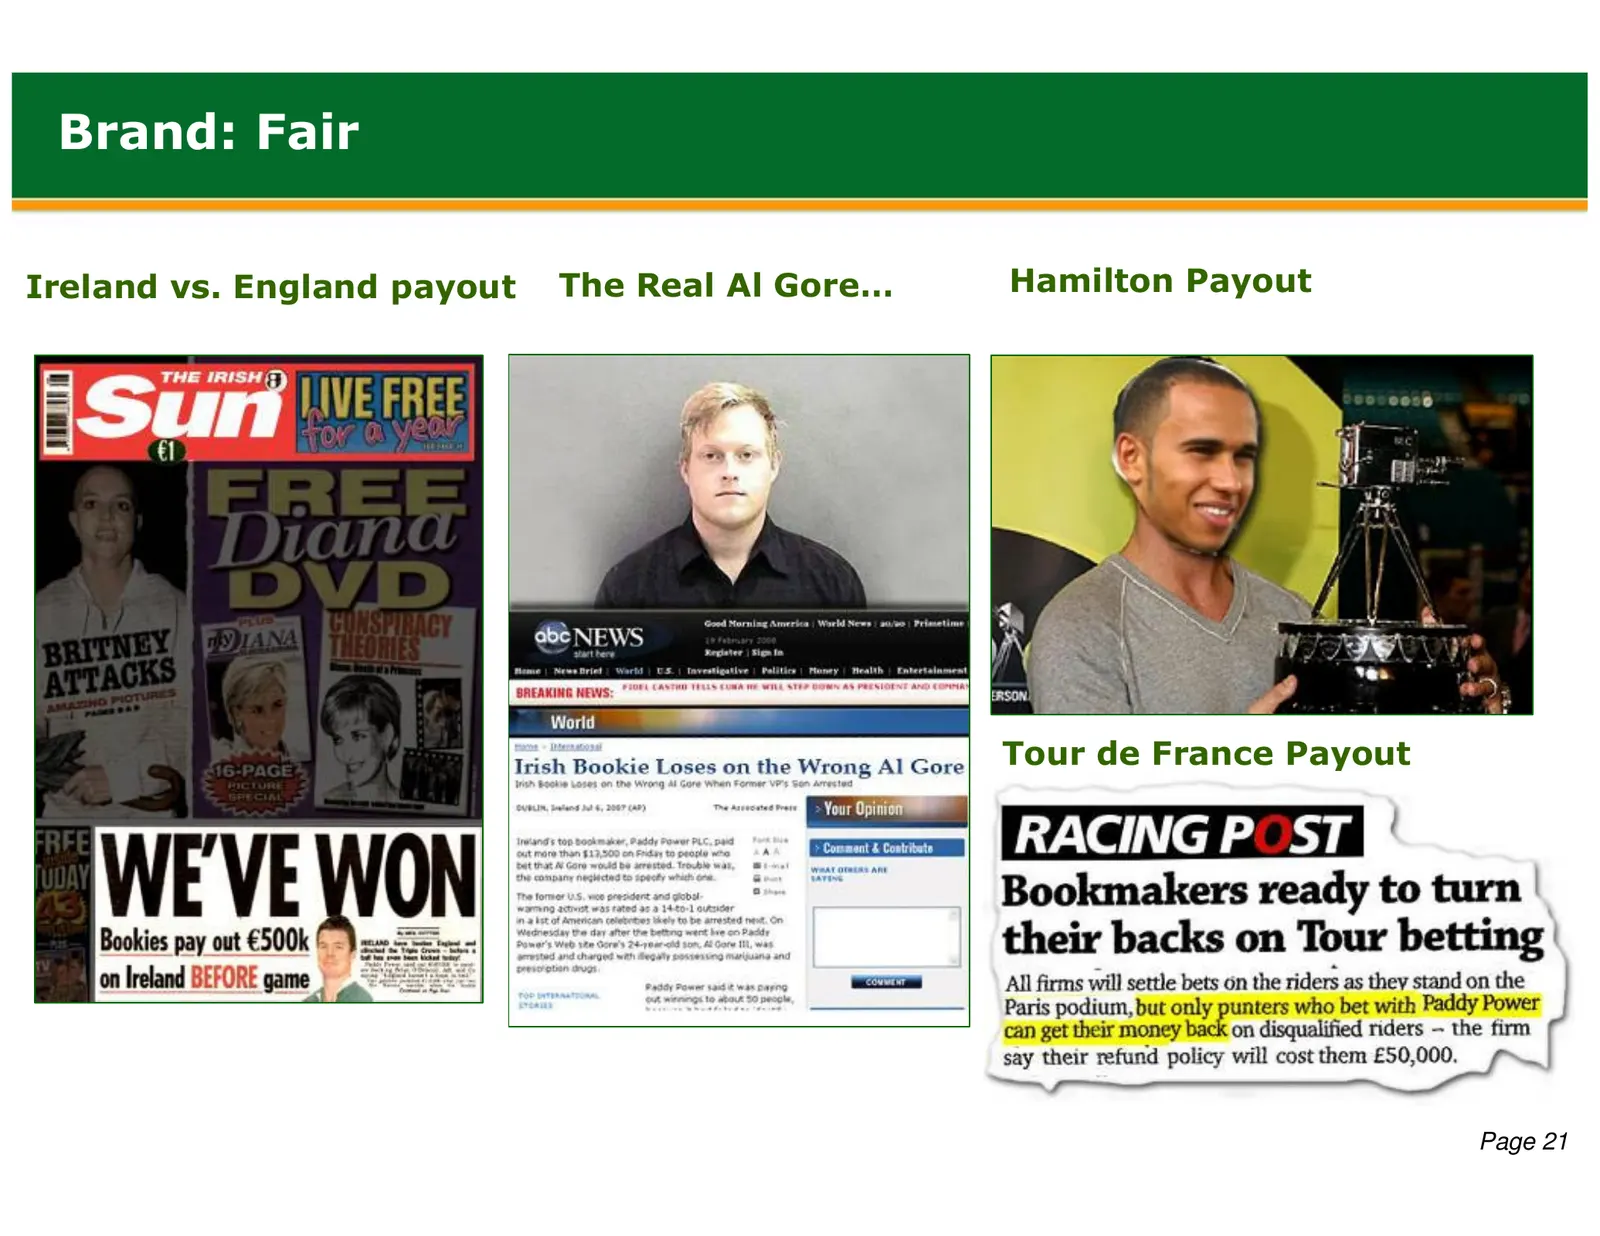
Slide 22: Brand: Fair
Brand: Fair Ireland vs. England payout The Real Al Gore… Hamilton Payout Tour de France Payout Page 21
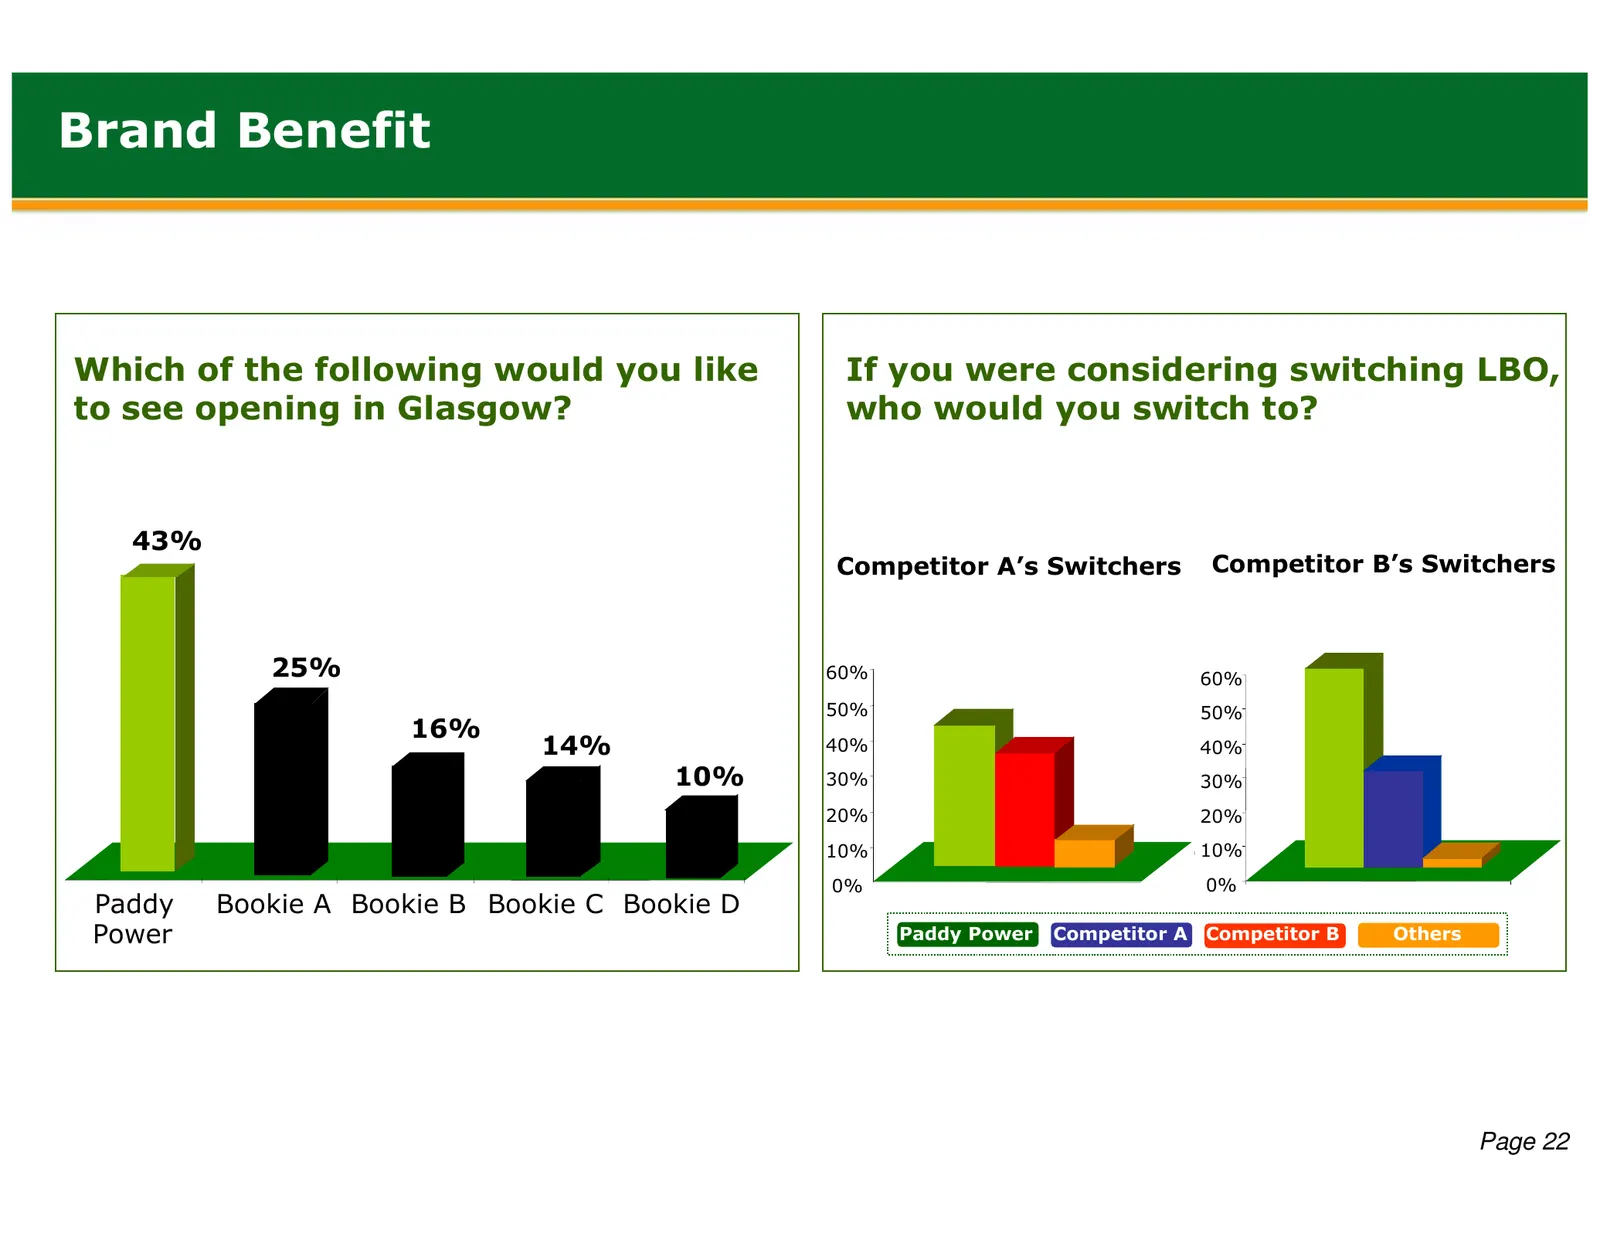
Slide 23: Brand Benefit
Brand Benefit Which of the following would you like If you were considering switching LBO, to see opening in Glasgow? who would you switch to? 43% Competitor A’s Switchers Competitor B’s Switchers 25% 60% 60% 50% 50% 16% 14% 40% 40% 10% 30% 30% 20% 20% 10% 10% 0% 0% Paddy Bookie A Bookie B Bookie C
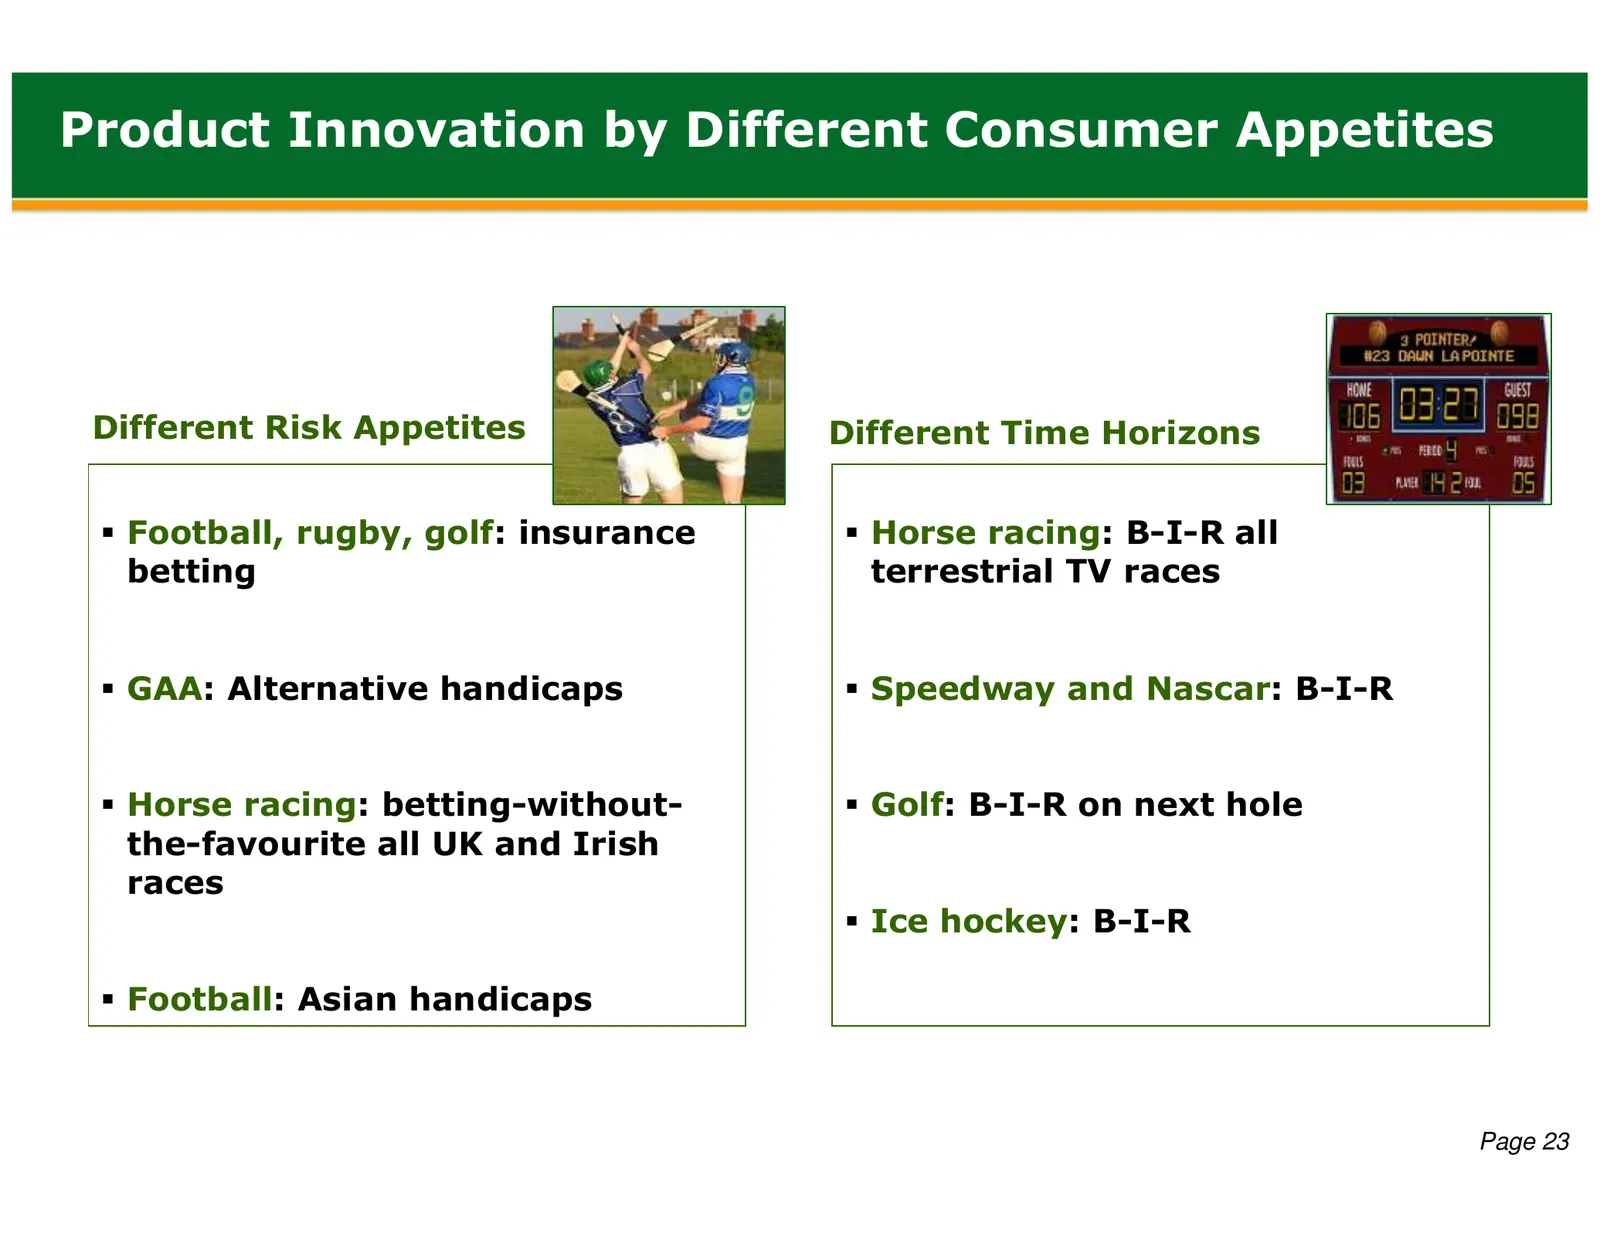
Slide 24: Product Innovation by Different Consumer Appetites
Product Innovation by Different Consumer Appetites Different Risk Appetites Different Time Horizons Football, rugby, golf: insurance Horse racing: B-I-R all betting terrestrial TV races GAA: Alternative handicaps Speedway and Nascar: B-I-R Horse racing: betting-without- Golf: B-I-R on next hole the-
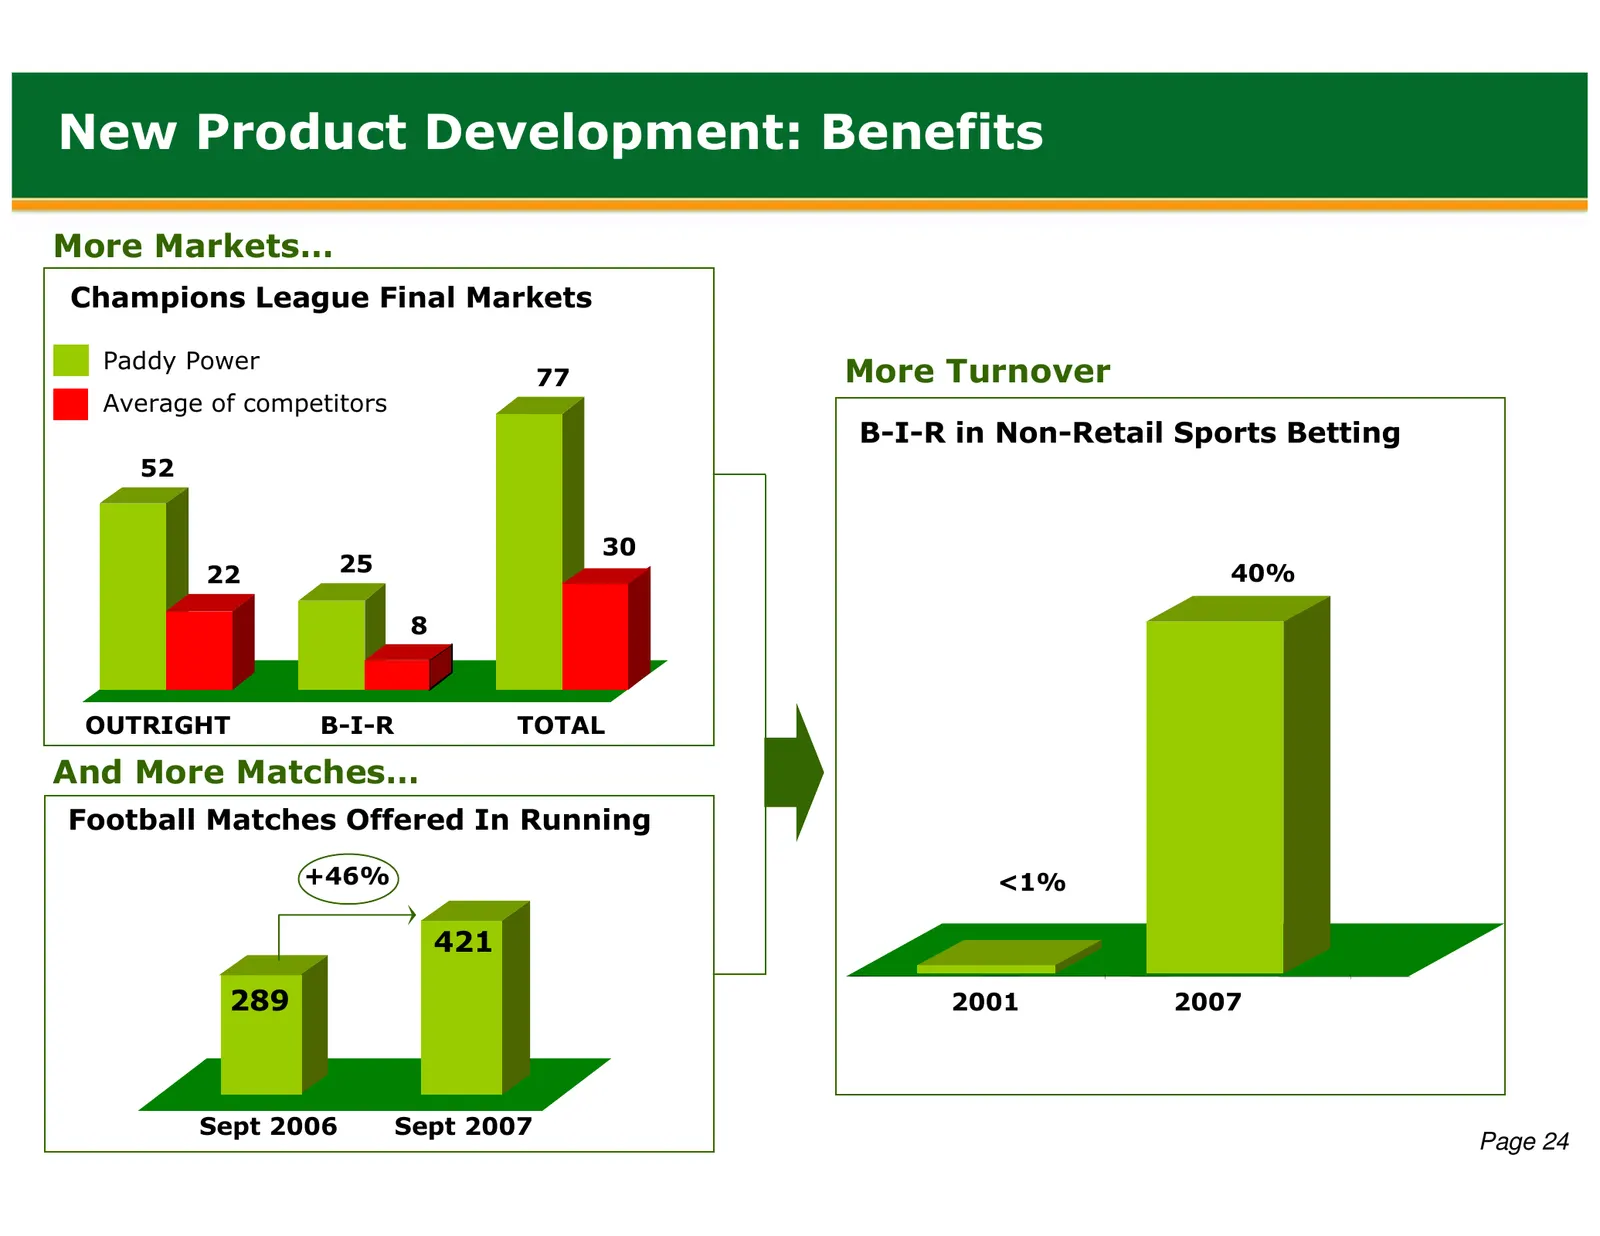
Slide 25: New Product Development: Benefits
New Product Development: Benefits More Markets… Champions League Final Markets Paddy Power 77 More Turnover Average of competitors B-I-R in Non-Retail Sports Betting 52 30 22 25 40% 8 OUTRIGHT B-I-R TOTAL And More Matches… Football Matches Offered In Running +46% <1% 421 289 2001 2007 Sept 2006 Sept
Slide 26: New Business Development
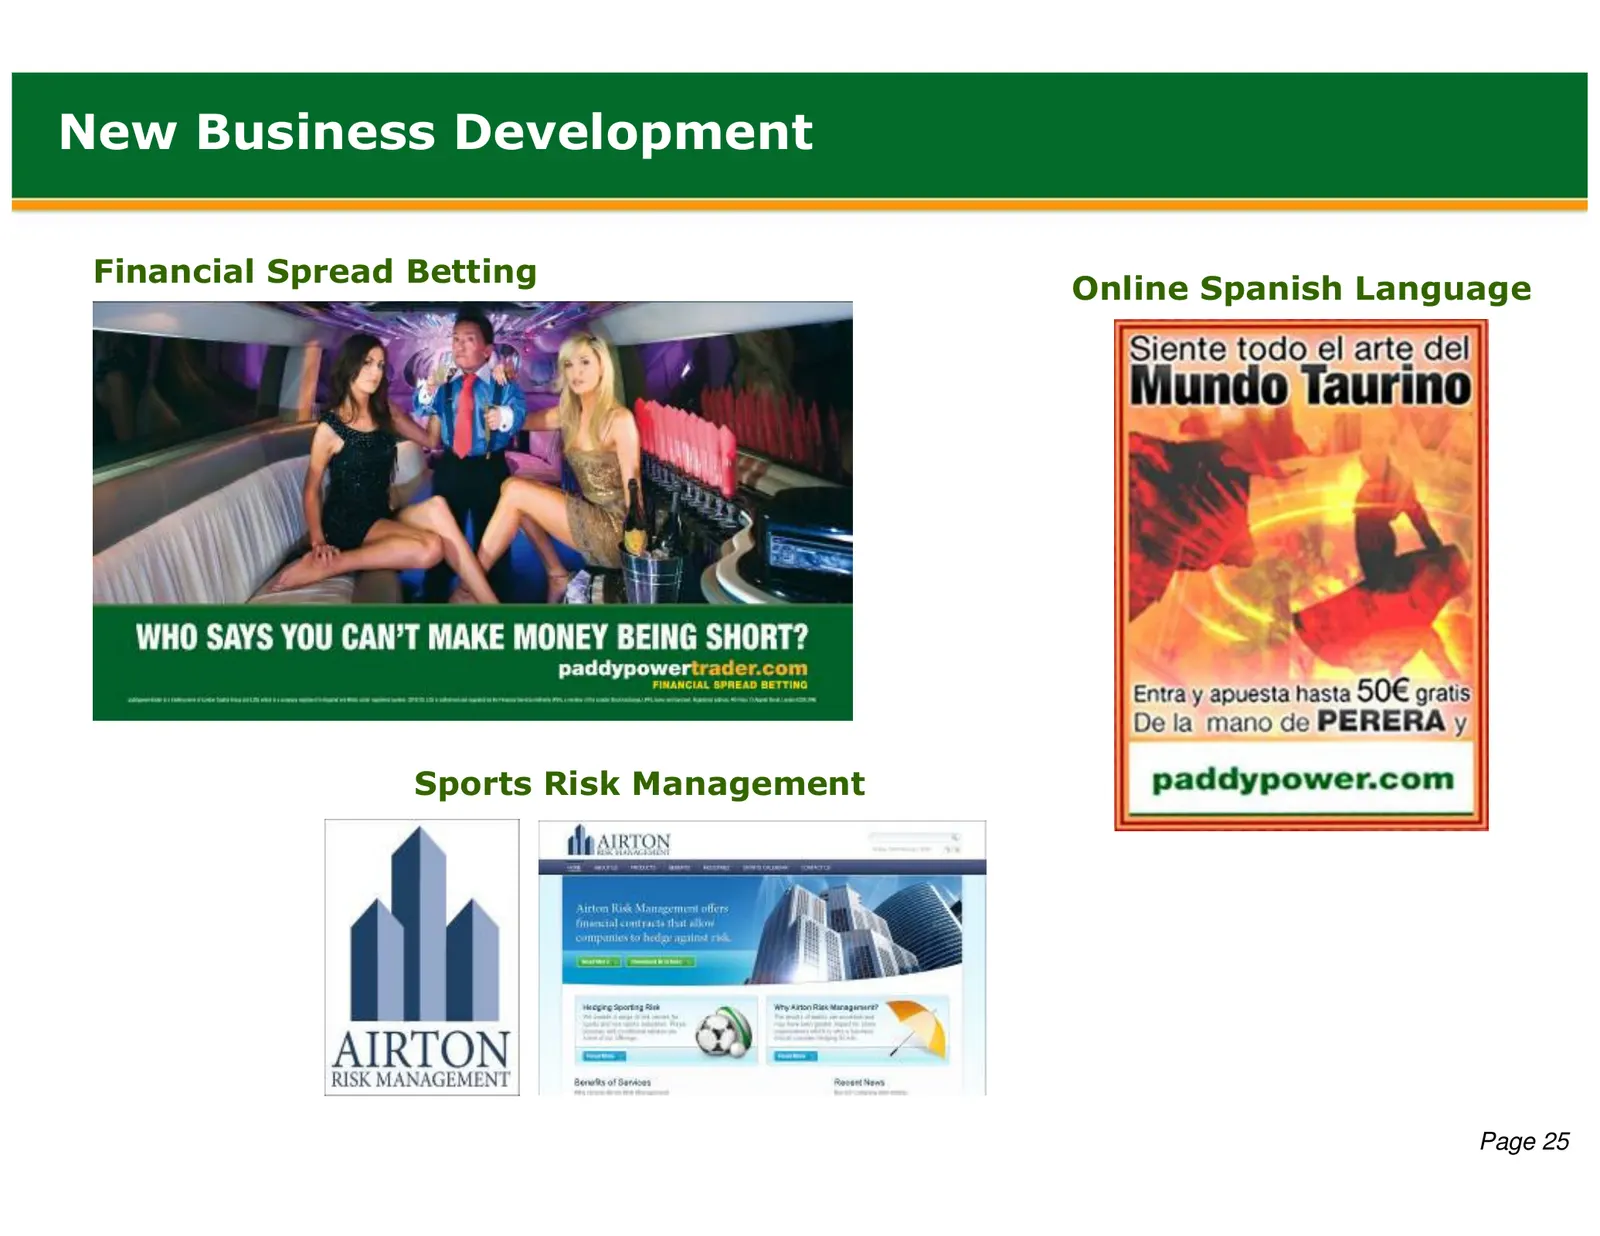
New Business Development Financial Spread Betting Online Spanish Language Sports Risk Management Page 25
Slide 27: Delivering Strong Growth
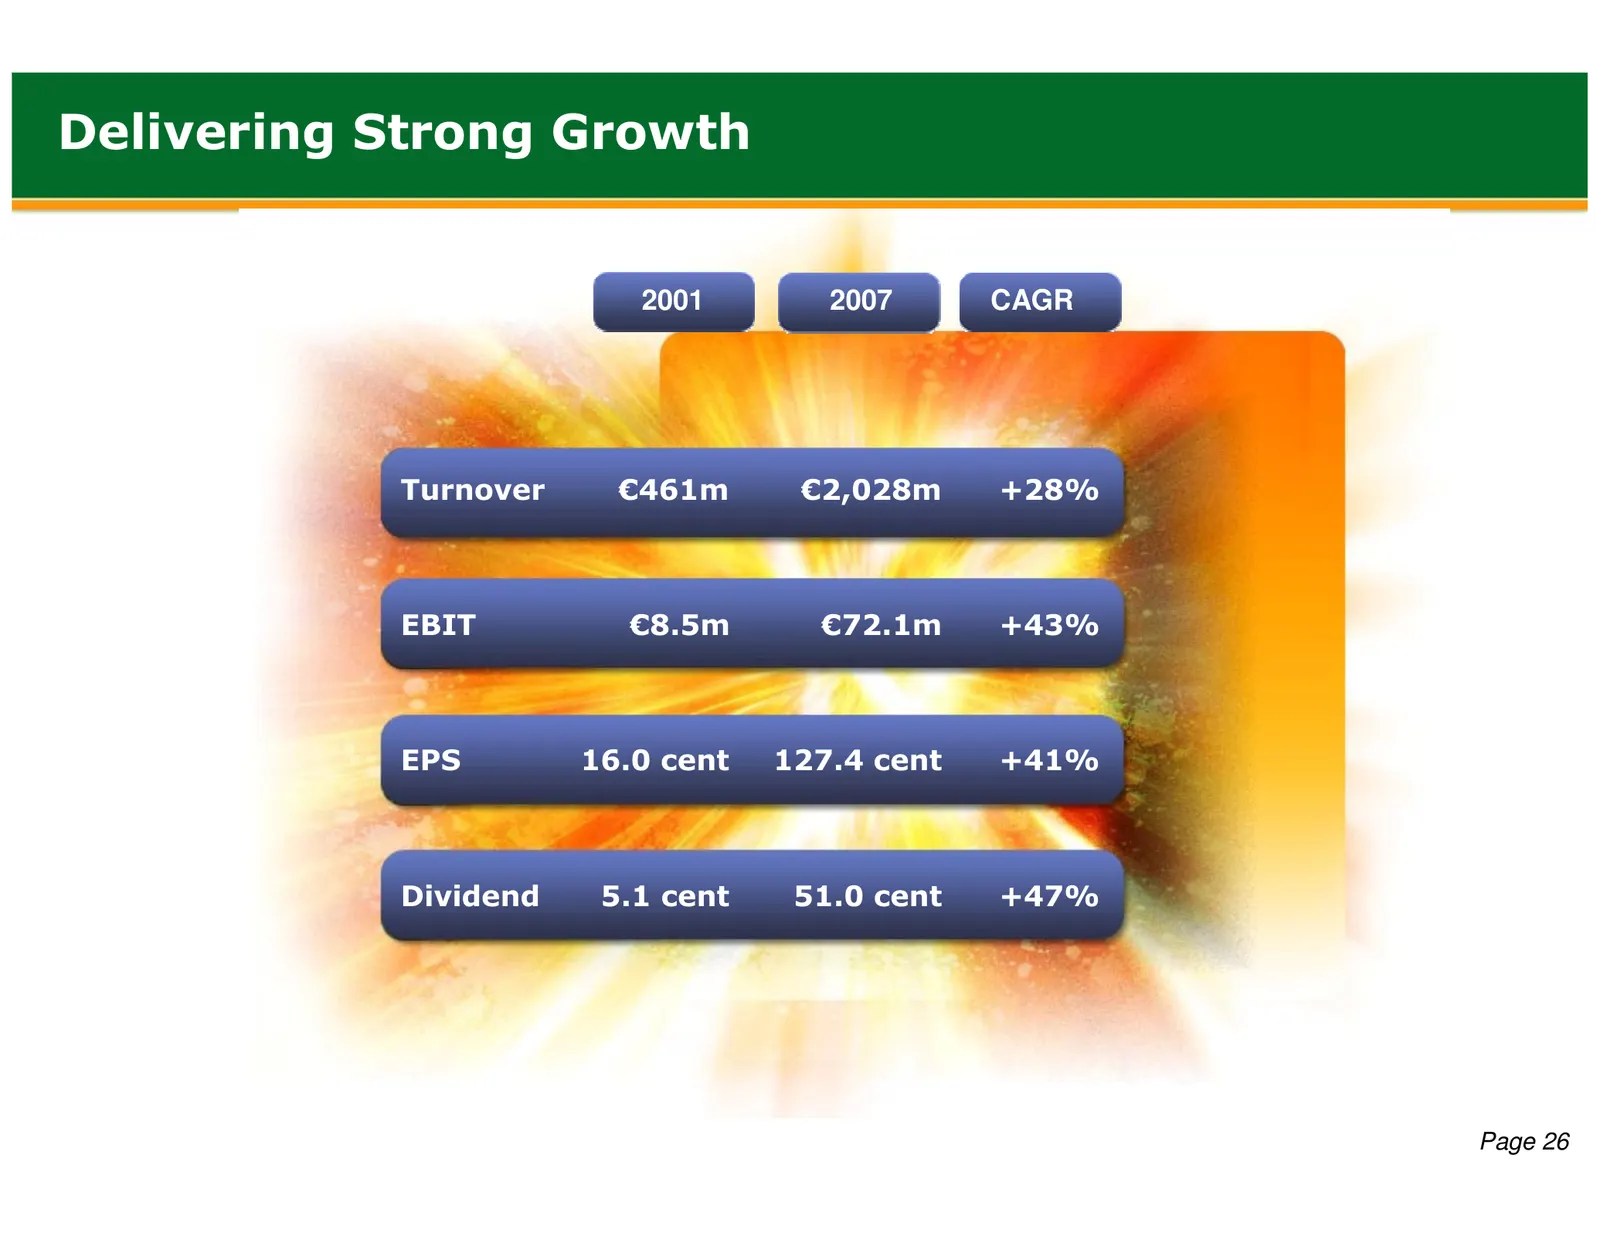
Delivering Strong Growth 2001 2007 CAGR Turnover €461m €2,028m +28% EBIT €8.5m €72.1m +43% EPS 16.0 cent 127.4 cent +41% Dividend 5.1 cent 51.0 cent +47% Page 26
Slide 28: New Business Development
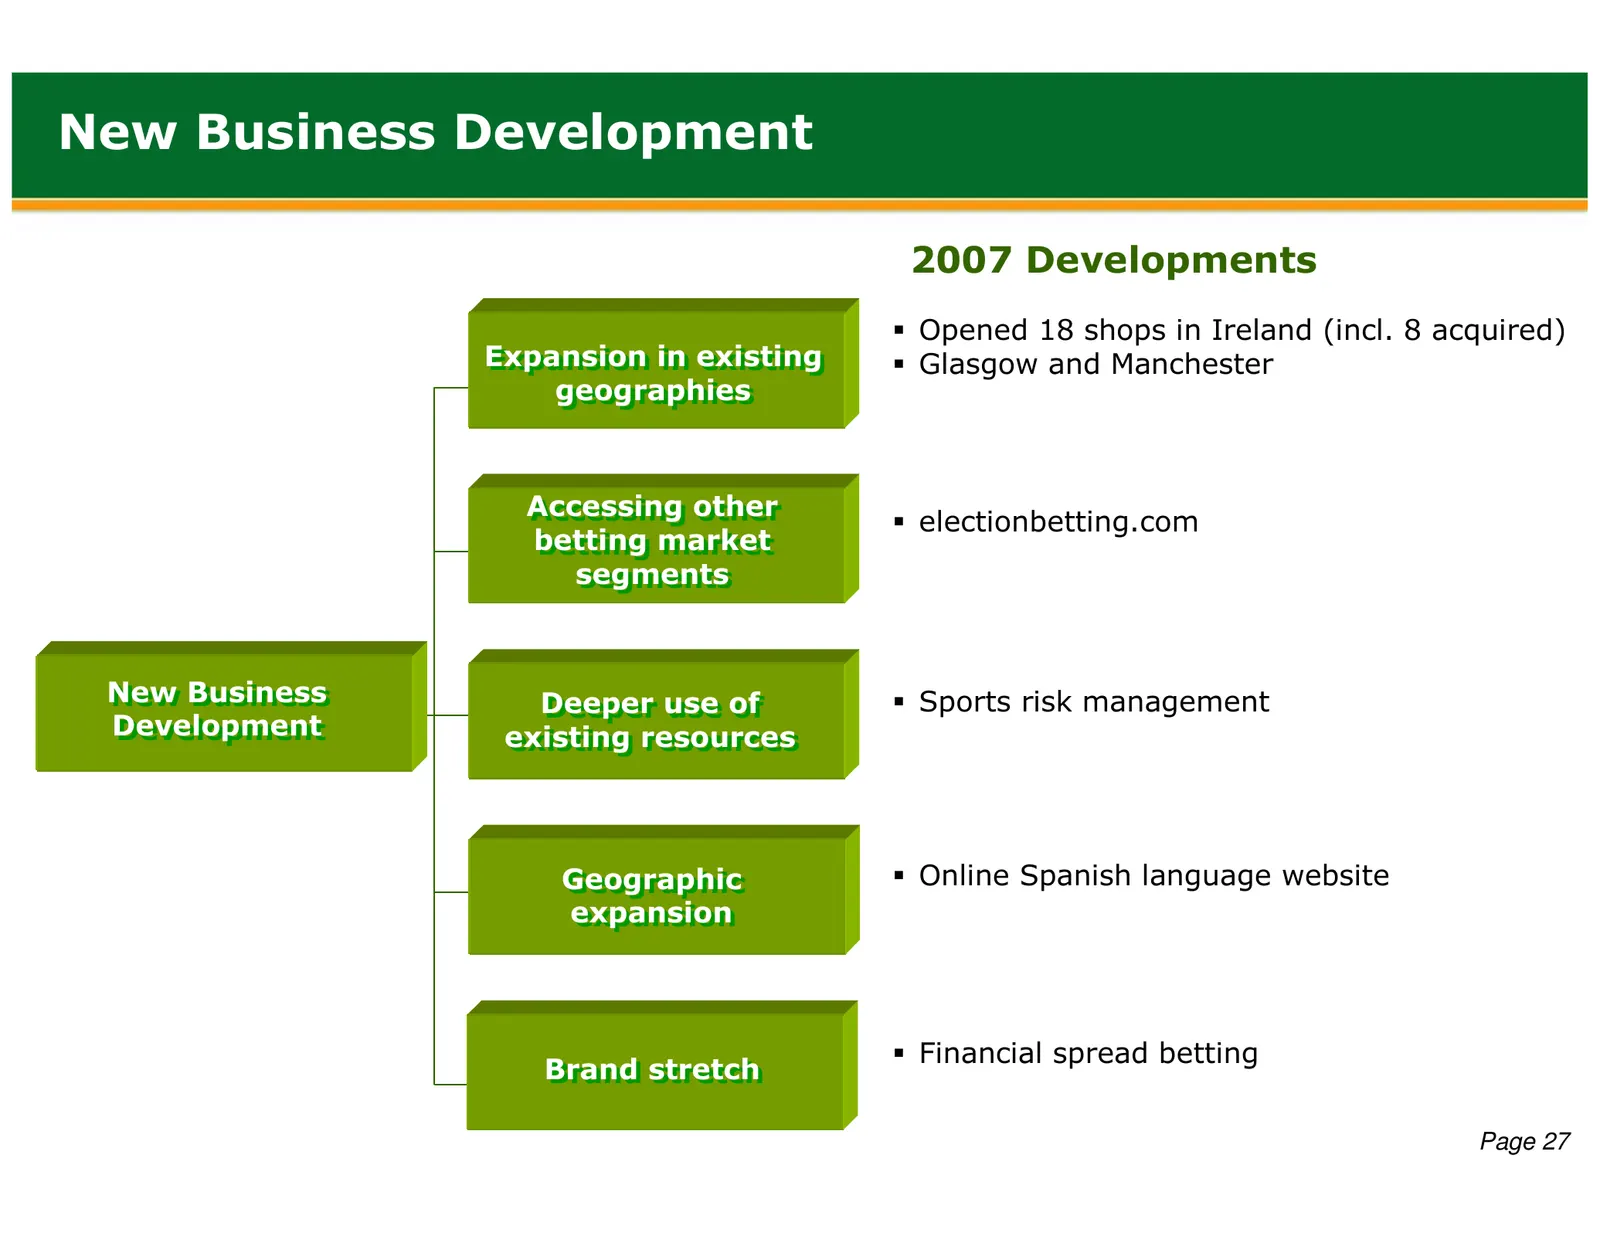
New Business Development 2007 Developments Opened 18 shops in Ireland (incl. 8 acquired) Expansion Expansion in in existing existing Glasgow and Manchester geographies geographies Accessing Accessing other other electionbetting.com betting betting market market segments segments New New Business Bus

Slide 29: electionbetting.com
electionbetting.com Page 28
Slide 30: Outlook
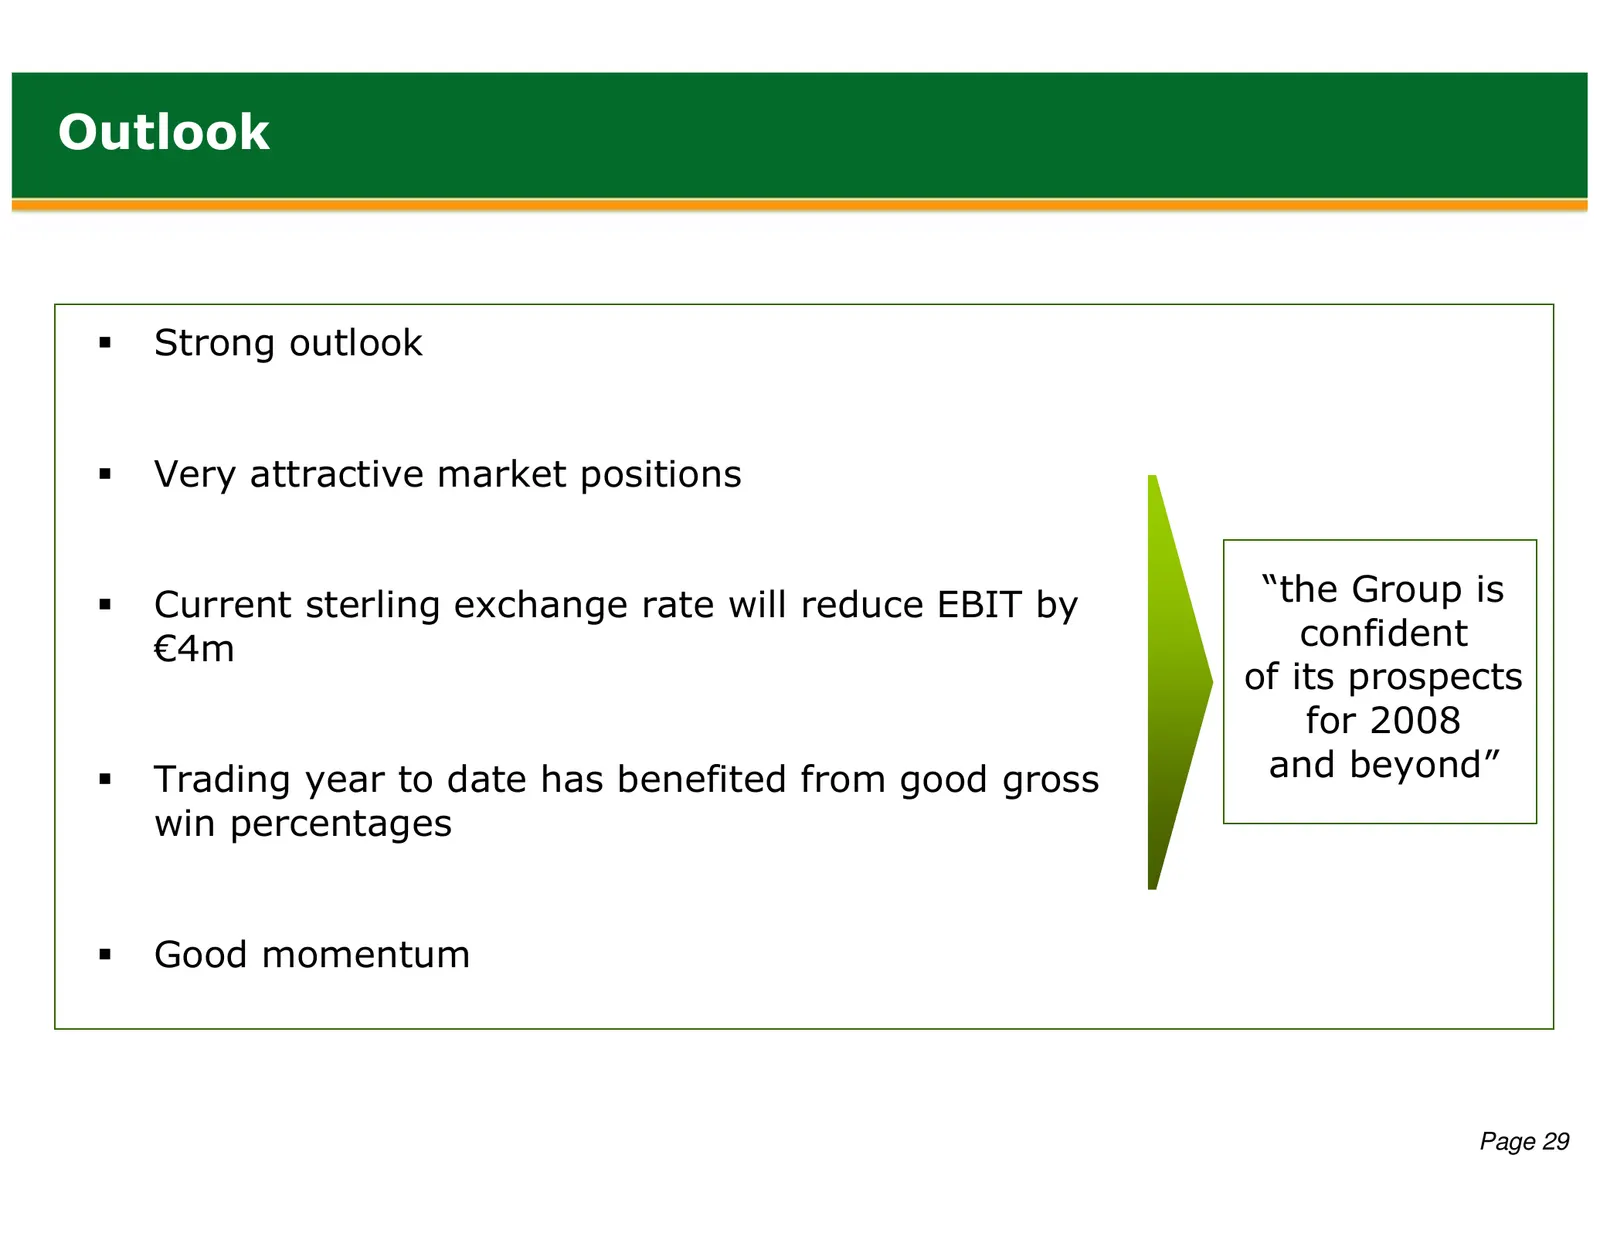
Outlook Strong outlook Very attractive market positions Current sterling exchange rate will reduce EBIT by “the Group is €4m confident of its prospects for 2008 Trading year to date has benefited from good gross and beyond” win percentages Good momentum Page 29
Slide 31: Coming soon....
Coming soon…. Page 30
Source: Internet Archive copy of flutter.com
More decks from Flutter Entertainment plc
 Q3 2026 Earnings Presentation15 slides · Nov 4, 2026
 Q2 2026 Earnings Presentation14 slides · Aug 5, 2026
 Investor Day (September 2024)152 slides · Sep 25, 2024
 Q2 2024 Earnings Presentation20 slides · Aug 13, 2024
 Q1 2024 Earnings Presentation20 slides · May 14, 2024
 FY2023 Earnings Presentation36 slides · Mar 26, 2024