Cloud Peak Energy — BMO Capital Markets 24th Global Metals & Mining Conference (February 2015)
40 slides from Cloud Peak Energy's conference presentation, Feb 24, 2015
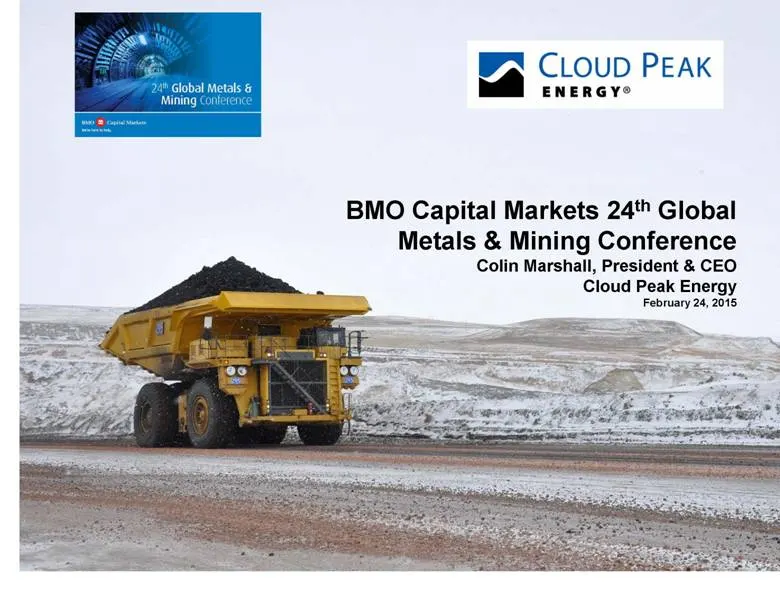
Slide 1: BMO Capital Markets 24th Global Metals & Mining Conference
BMO Capital Markets 24th Global Metals & Mining Conference Colin Marshall, President & CEO Cloud Peak Energy February 24, 2015
Slide 2: Cautionary Note Regarding Forward-Looking Statements
1 Cautionary Note Regarding Forward-Looking Statements This presentation contains “forward-looking statements” within the meaning of the safe harbor provisions of Section 27A of the Securities Act of 1933 and Section 21E of the Securities Exchange Act of 1934. Forward-looking statements are not stat
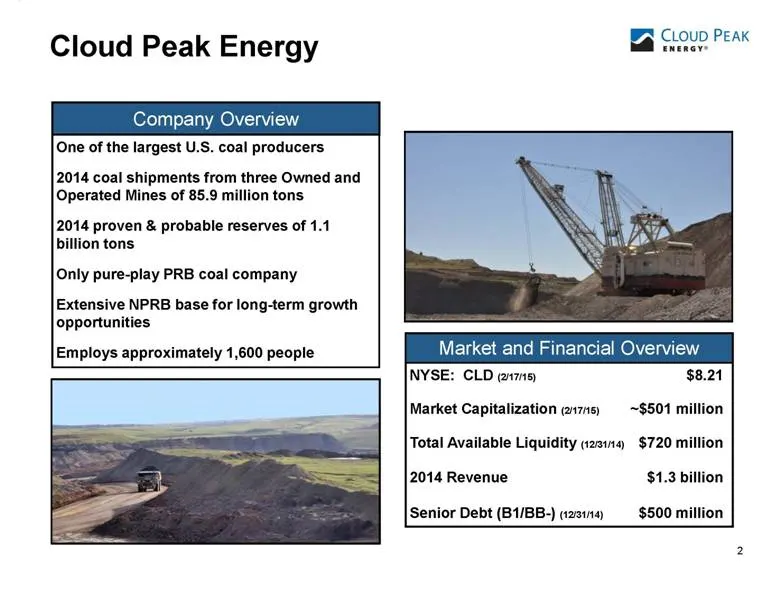
Slide 3: Cloud Peak Energy Company Overview
2 2 2 Cloud Peak Energy One of the largest U.S. coal producers 2014 coal shipments from three Owned and Operated Mines of 85.9 million tons 2014 proven & probable reserves of 1.1 billion tons Only pure-play PRB coal company Extensive NPRB base for long-term growth opportunities Employs approximately
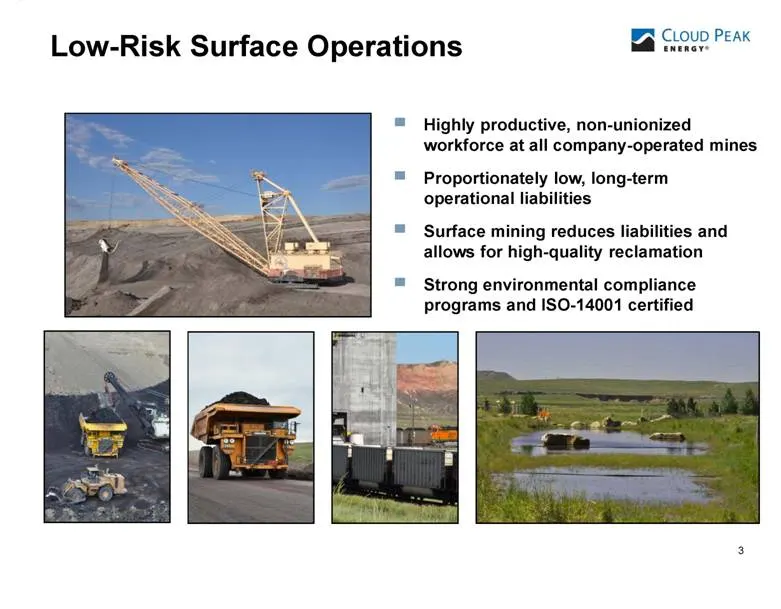
Slide 4: Low-Risk Surface Operations
3 Low-Risk Surface Operations Highly productive, non-unionized workforce at all company-operated mines Proportionately low, long-term operational liabilities Surface mining reduces liabilities and allows for high-quality reclamation Strong environmental compliance programs and ISO-14001 certified
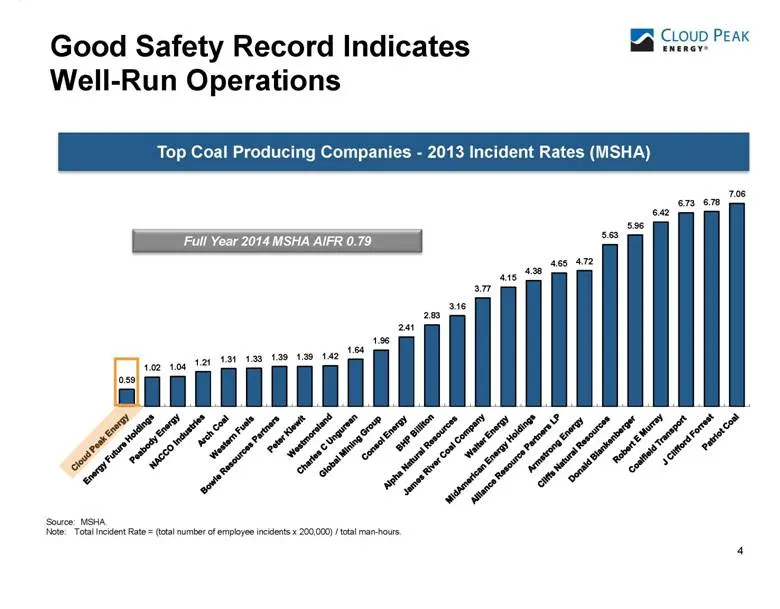
Slide 5: Good Safety Record Indicates Well-Run Operations
4 4 4 4 Top Coal Producing Companies - 2013 Incident Rates (MSHA) Source: MSHA. Note: Total Incident Rate = (total number of employee incidents x 200,000) / total man-hours. Good Safety Record Indicates Well-Run Operations
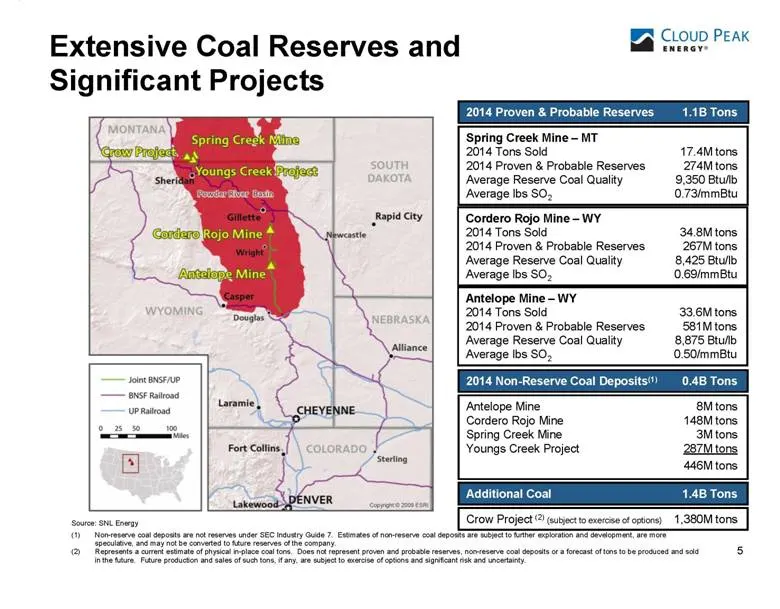
Slide 6: Extensive Coal Reserves and Significant Projects
Extensive Coal Reserves and Significant Projects 5 Spring Creek Mine – MT 2014 Tons Sold 17.4M tons 2014 Proven & Probable Reserves 274M tons Average Reserve Coal Quality 9,350 Btu/lb Average lbs SO2 0.73/mmBtu Cordero Rojo Mine – WY 2014 Tons Sold 34.8M tons 2014 Proven & Probable Reserves 267M ton
Slide 7: Continued Execution of Consistent Business Strategy
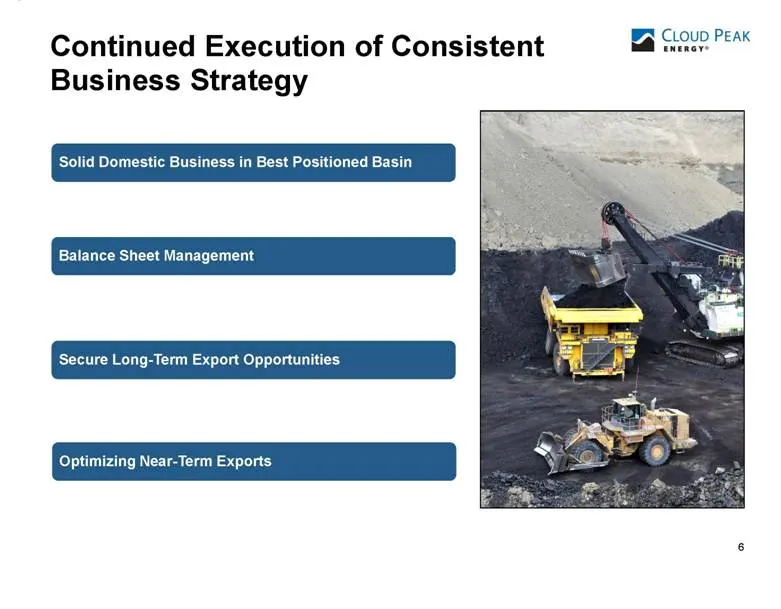
6 Continued Execution of Consistent Business Strategy Solid Domestic Business in Best Positioned Basin Balance Sheet Management Secure Long-Term Export Opportunities Optimizing Near-Term Exports
Slide 8: Domestic Strategy
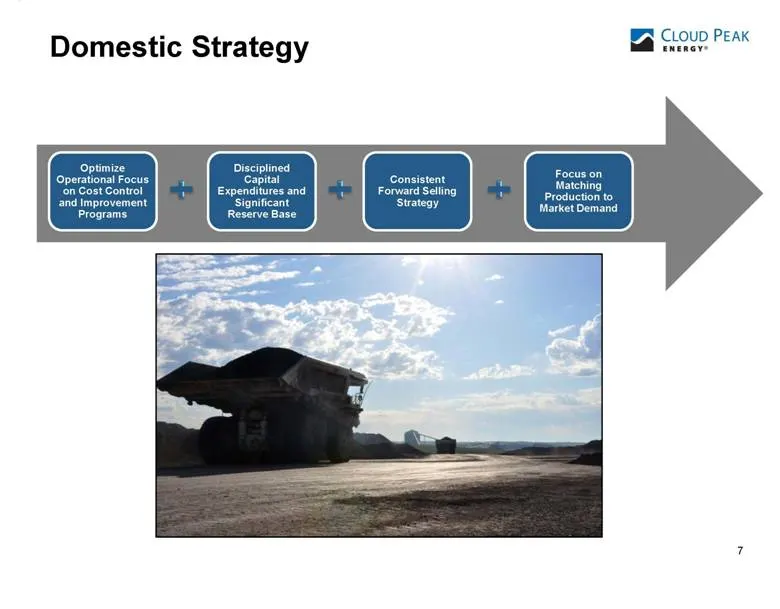
7 Domestic Strategy Consistent Forward Selling Strategy Focus on Matching Production to Market Demand Optimize Operational Focus on Cost Control and Improvement Programs Disciplined Capital Expenditures and Significant Reserve Base
Slide 9: High Quality Customer Base
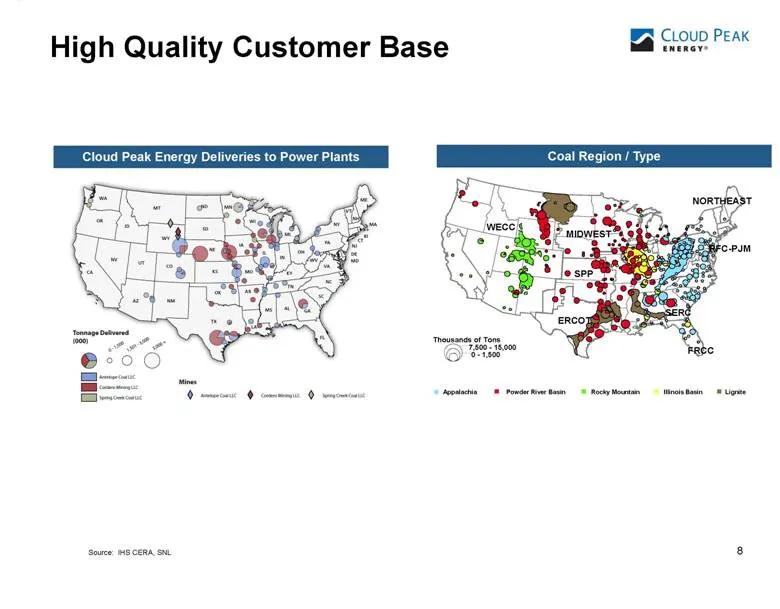
8 High Quality Customer Base Thousands of Tons 7,500 - 15,000 0 - 1,500 Powder River Basin Illinois Basin Rocky Mountain Lignite WECC MIDWEST SPP ERCOT SERC NORTHEAST RFC-PJM FRCC Source: IHS CERA, SNL Coal Region / Type Cloud Peak Energy Deliveries to Power Plants
Slide 10: PRB – Forecast Growing Share of Smaller Pie
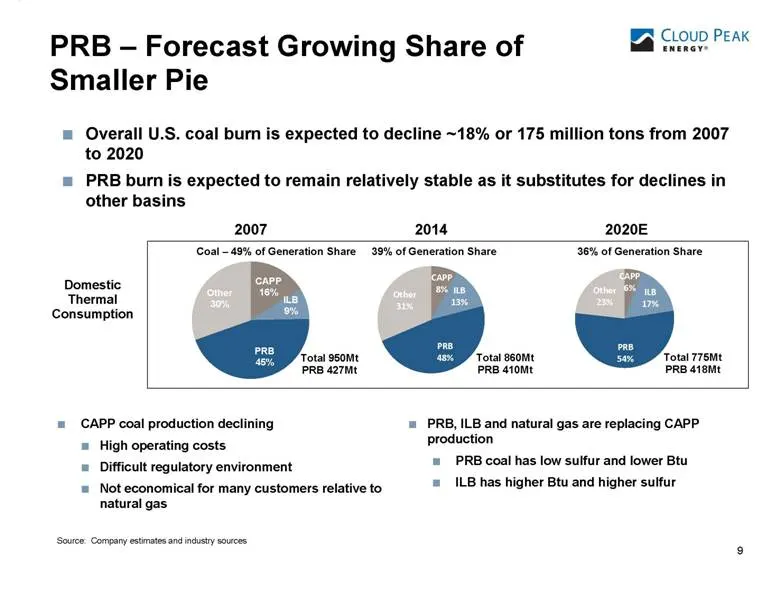
9 PRB – Forecast Growing Share of Smaller Pie CAPP coal production declining High operating costs Difficult regulatory environment Not economical for many customers relative to natural gas Source: Company estimates and industry sources PRB, ILB and natural gas are replacing CAPP production PRB coal
Slide 11: Challenging External Environment
10 10 10 (1) Low natural gas prices Uneven rail performance Excessive regulations CSAPR impact is unclear Utilities responding to MATS Uncertainty around Clean Power Plan Challenging External Environment
Slide 12: Responding to Market Conditions
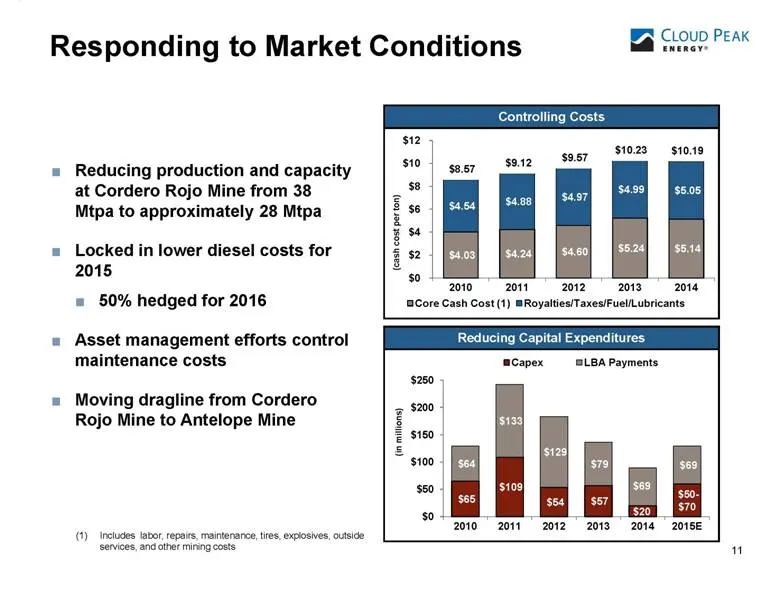
Responding to Market Conditions 11 Reducing production and capacity at Cordero Rojo Mine from 38 Mtpa to approximately 28 Mtpa Locked in lower diesel costs for 2015 50% hedged for 2016 Asset management efforts control maintenance costs Moving dragline from Cordero Rojo Mine to Antelope Mine Reducing
Slide 13: Continued Forward Sales Strategy
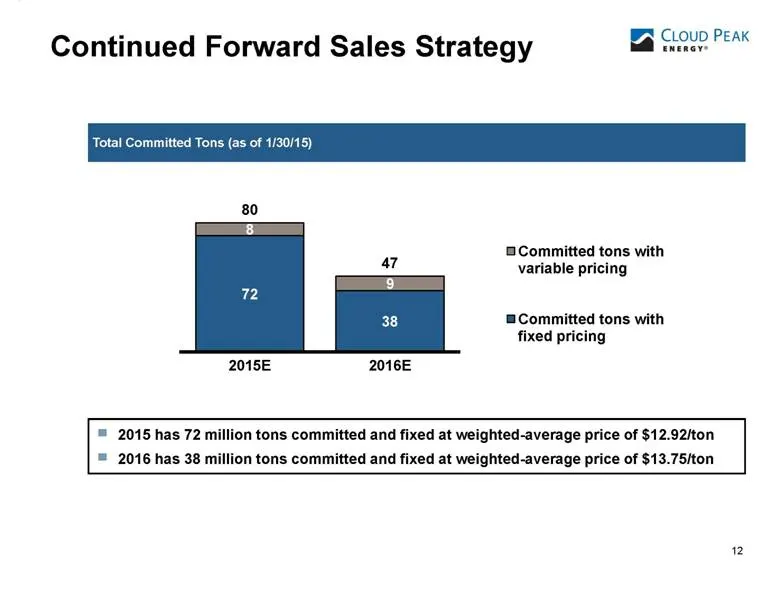
12 Continued Forward Sales Strategy 2015 has 72 million tons committed and fixed at weighted-average price of $12.92/ton 2016 has 38 million tons committed and fixed at weighted-average price of $13.75/ton Total Committed Tons (as of 1/30/15) (tons in millions)
Slide 14: Active Balance Sheet Controls
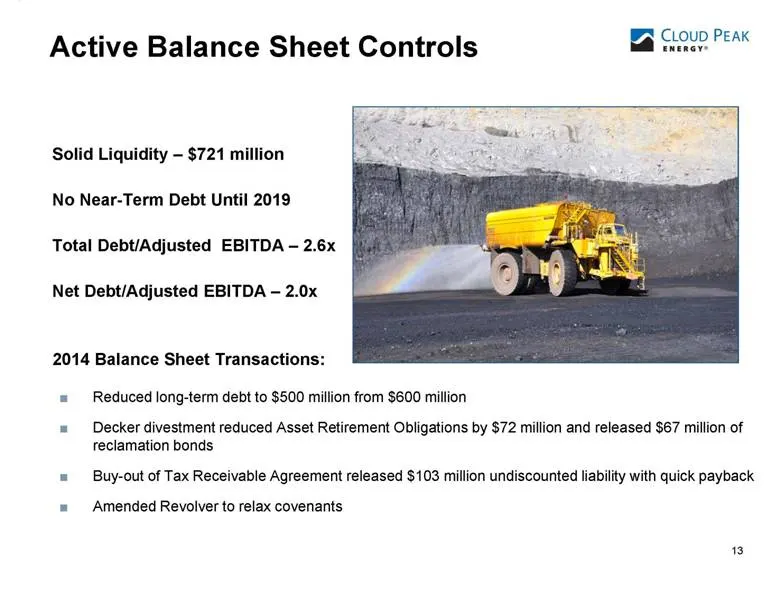
13 Active Balance Sheet Controls 2014 Balance Sheet Transactions: Reduced long-term debt to $500 million from $600 million Decker divestment reduced Asset Retirement Obligations by $72 million and released $67 million of reclamation bonds Buy-out of Tax Receivable Agreement released $103 million und
Slide 15: Export Strategy
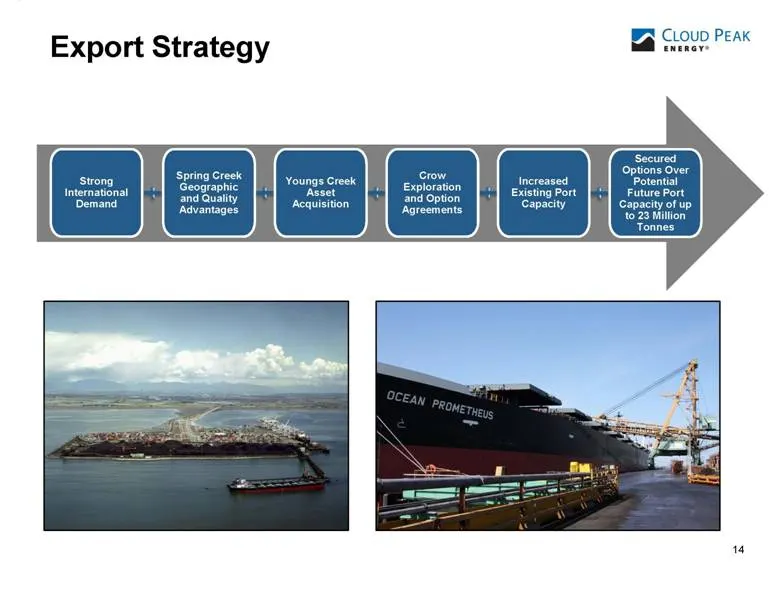
14 Export Strategy Strong International Demand Spring Creek Geographic and Quality Advantages Youngs Creek Asset Acquisition Crow Exploration and Option Agreements Increased Existing Port Capacity Secured Options Over Potential Future Port Capacity of up to 23 Million Tonnes
Slide 16: Increasing International Demand Requires PRB Exports
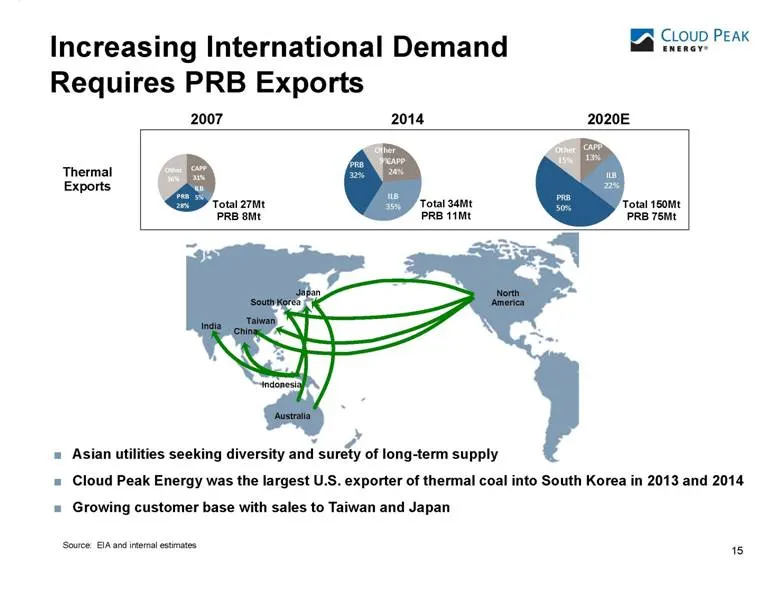
15 Increasing International Demand Requires PRB Exports China Japan South Korea Taiwan India Australia Indonesia Asian utilities seeking diversity and surety of long-term supply Cloud Peak Energy was the largest U.S. exporter of thermal coal into South Korea in 2013 and 2014 Growing customer base wi
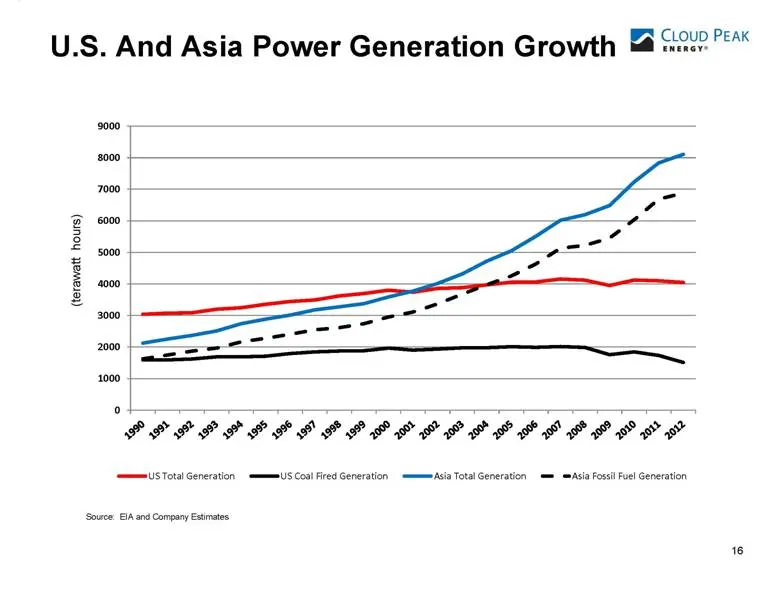
Slide 17: U.S. And Asia Power Generation Growth
U.S. And Asia Power Generation Growth 16 Source: EIA and Company Estimates
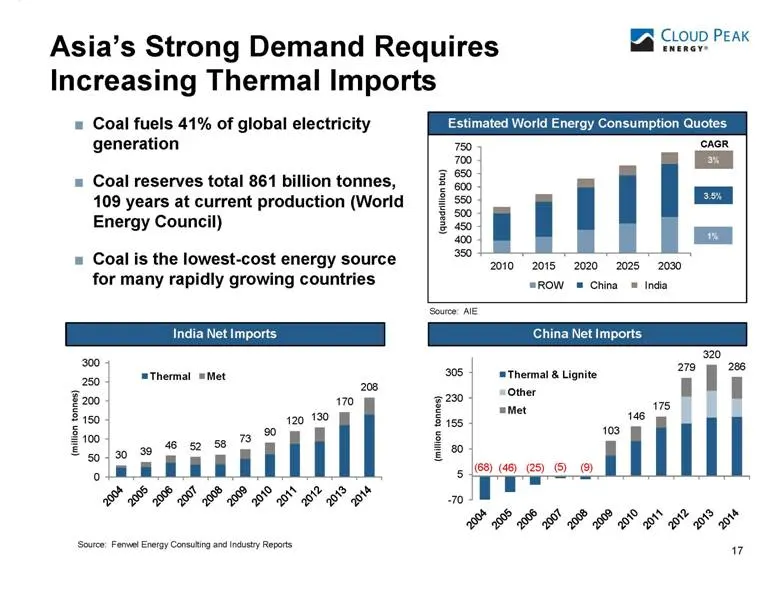
Slide 18: Asia's Strong Demand Requires Increasing Thermal Imports
Asia’s Strong Demand Requires Increasing Thermal Imports 17 China Net Imports Coal fuels 41% of global electricity generation Coal reserves total 861 billion tonnes, 109 years at current production (World Energy Council) Coal is the lowest-cost energy source for many rapidly growing countries Source
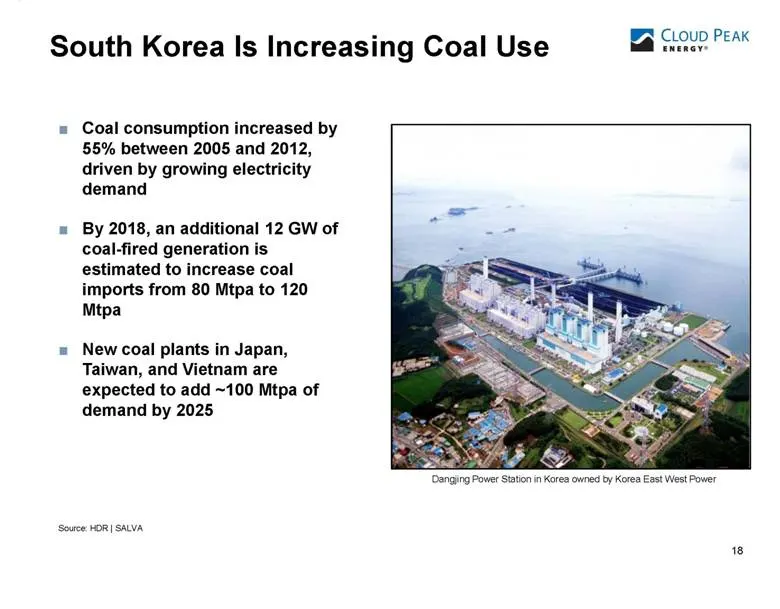
Slide 19: South Korea Is Increasing Coal Use
18 South Korea Is Increasing Coal Use Coal consumption increased by 55% between 2005 and 2012, driven by growing electricity demand By 2018, an additional 12 GW of coal-fired generation is estimated to increase coal imports from 80 Mtpa to 120 Mtpa New coal plants in Japan, Taiwan, and Vietnam are e
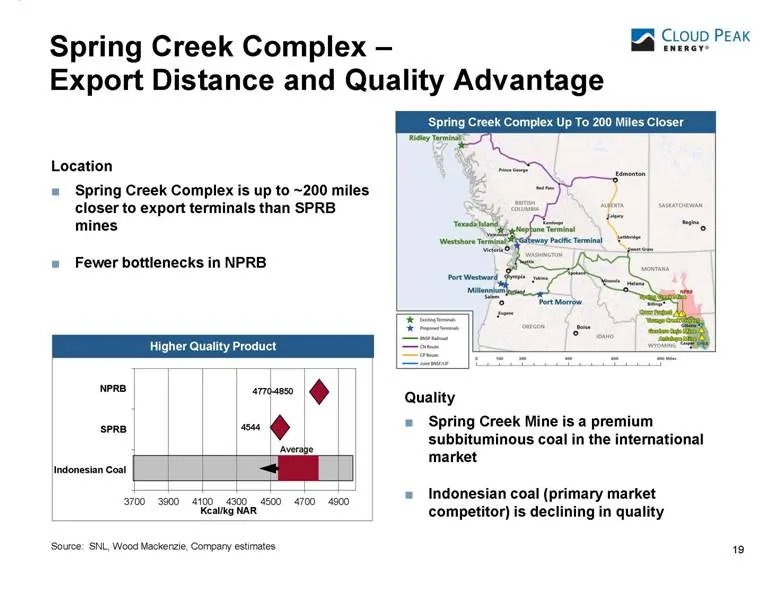
Slide 20: Spring Creek Complex – Export Distance and Quality Advantage
Spring Creek Complex – Export Distance and Quality Advantage 19 19 4770-4850 4544 Average Source: SNL, Wood Mackenzie, Company estimates Higher Quality Product Spring Creek Complex Up To 200 Miles Closer Location Spring Creek Complex is up to ~200 miles closer to export terminals than SPRB mines Few
Slide 21: Spring Creek Complex – Potential Development Options
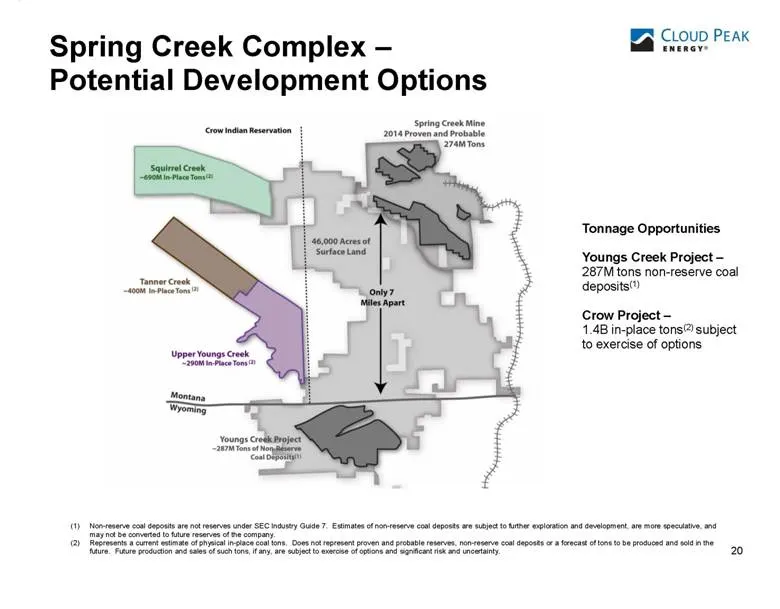
20 Spring Creek Complex – Potential Development Options (1) Non-reserve coal deposits are not reserves under SEC Industry Guide 7. Estimates of non-reserve coal deposits are subject to further exploration and development, are more speculative, and may not be converted to future reserves of the compa
Slide 22: Cloud Peak Energy Terminal Position
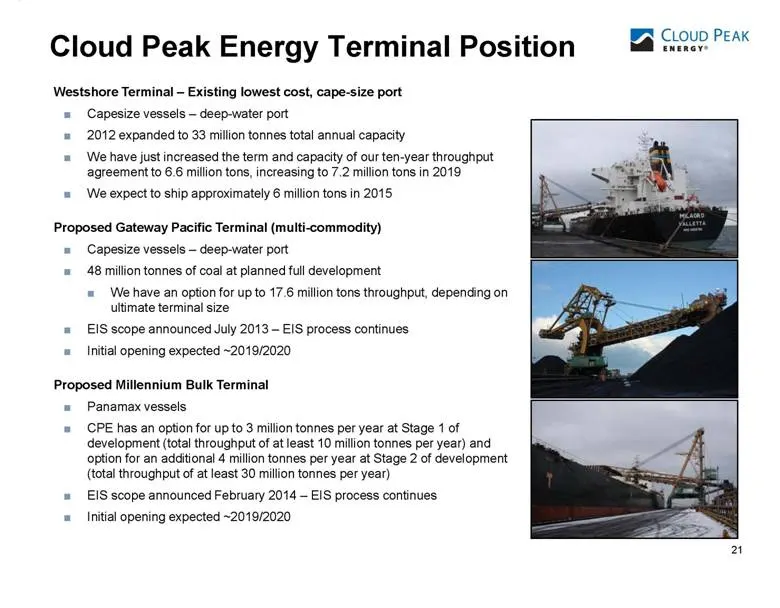
21 Cloud Peak Energy Terminal Position 21 21 Westshore Terminal – Existing lowest cost, cape-size port Capesize vessels – deep-water port 2012 expanded to 33 million tonnes total annual capacity We have just increased the term and capacity of our ten-year throughput agreement to 6.6 million tons, in
Slide 23: Improving "Pro-Coal" Environment
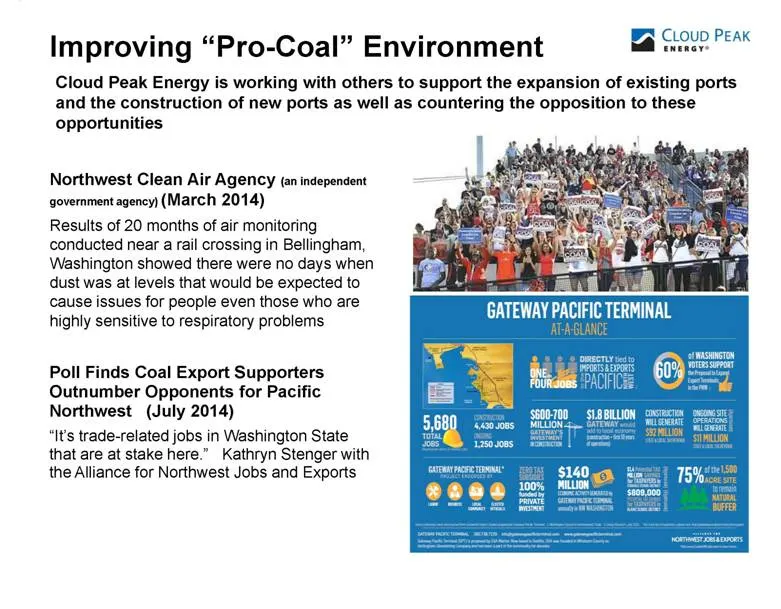
22 Improving “Pro-Coal” Environment 22 22 Northwest Clean Air Agency (an independent government agency) (March 2014) Results of 20 months of air monitoring conducted near a rail crossing in Bellingham, Washington showed there were no days when dust was at levels that would be expected to cause issue
Slide 24: Commodity Pricing Environment Is Cyclical
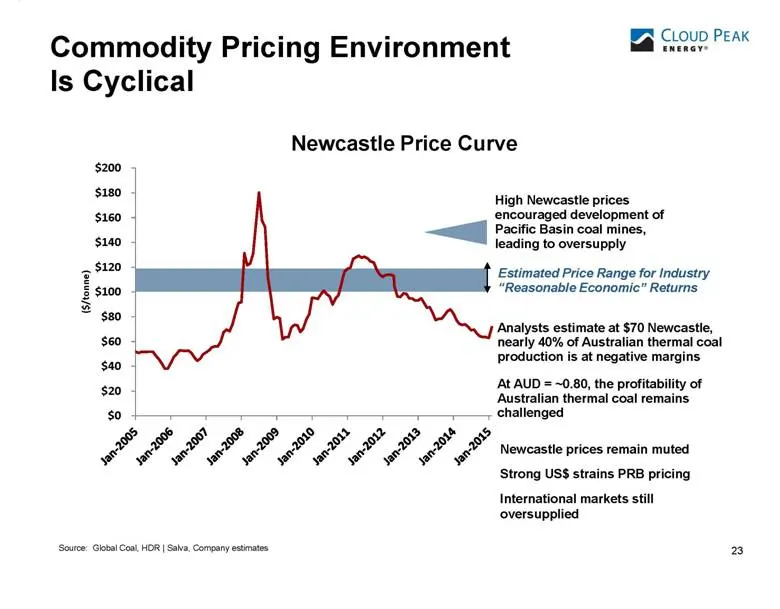
23 Source: Global Coal, HDR | Salva, Company estimates Estimated Price Range for Industry “Reasonable Economic” Returns Analysts estimate at $70 Newcastle, nearly 40% of Australian thermal coal production is at negative margins At AUD = ~0.80, the profitability of Australian thermal coal remains cha

Slide 25: Appendix
CLOUD PEAK Appendix
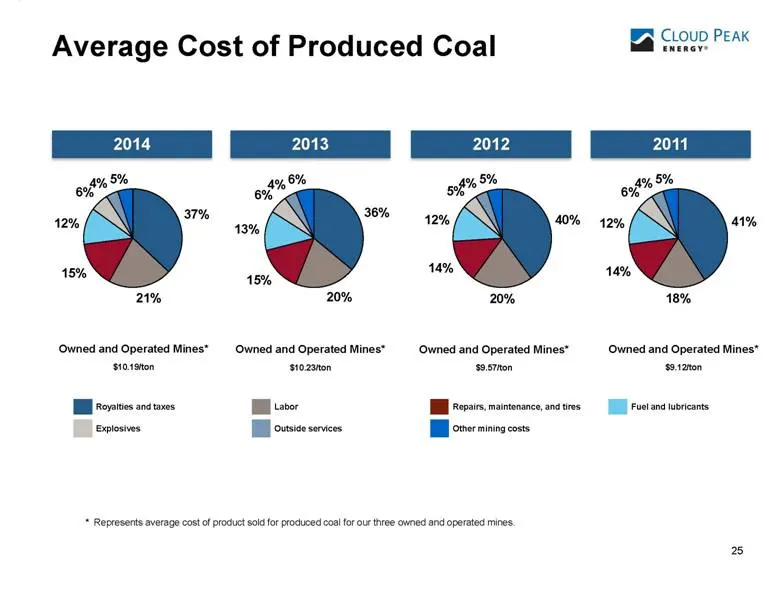
Slide 26: Average Cost of Produced Coal
25 Average Cost of Produced Coal * Represents average cost of product sold for produced coal for our three owned and operated mines. Owned and Operated Mines* $10.23/ton Owned and Operated Mines* $9.57/ton 2012 2013 2011 Owned and Operated Mines* $9.12/ton 2014 Owned and Operated Mines* $10.19/ton R
Slide 27: Operating Segments
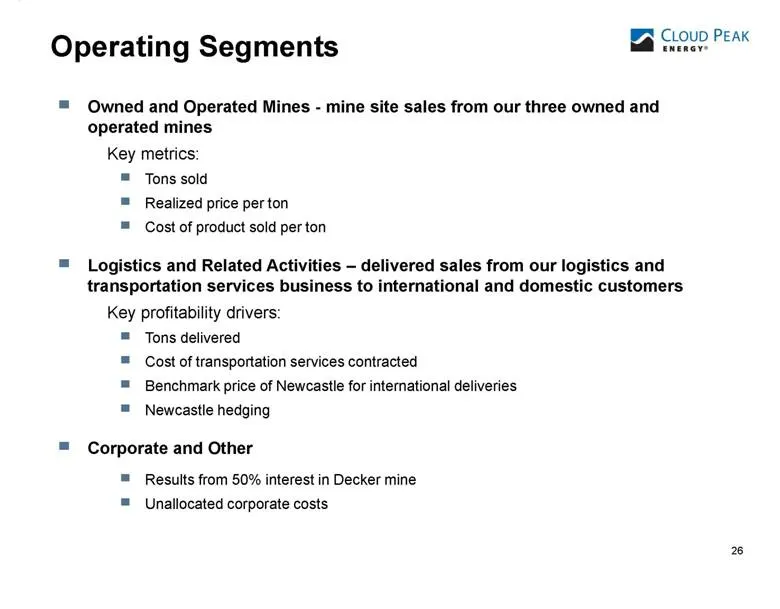
Operating Segments 26 Owned and Operated Mines - mine site sales from our three owned and operated mines Key metrics: Tons sold Realized price per ton Cost of product sold per ton Logistics and Related Activities – delivered sales from our logistics and transportation services business to internatio
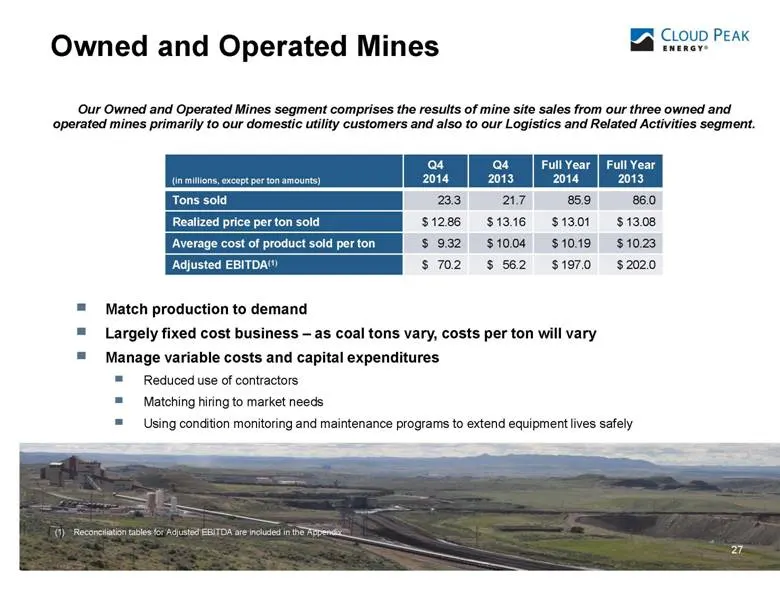
Slide 28: Owned and Operated Mines
Owned and Operated Mines 27 Our Owned and Operated Mines segment comprises the results of mine site sales from our three owned and operated mines primarily to our domestic utility customers and also to our Logistics and Related Activities segment. Match production to demand Largely fixed cost busine
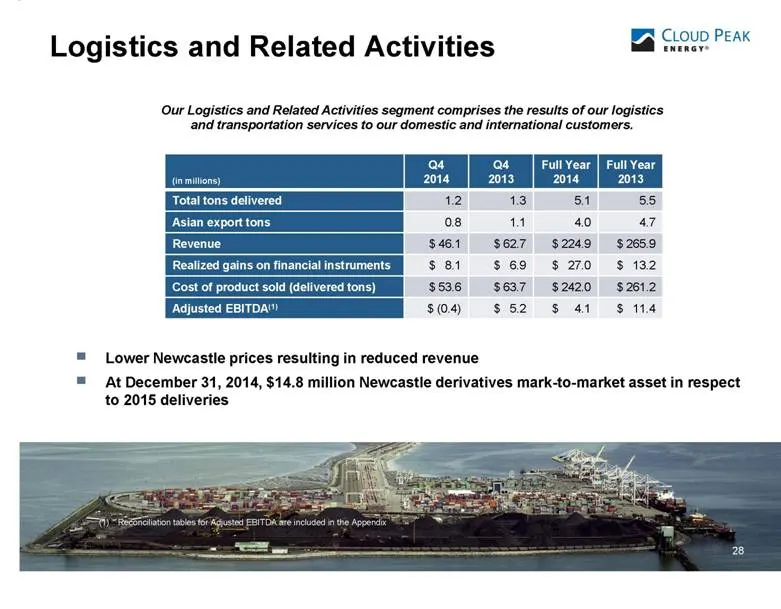
Slide 29: Logistics and Related Activities
Logistics and Related Activities 28 Our Logistics and Related Activities segment comprises the results of our logistics and transportation services to our domestic and international customers. Lower Newcastle prices resulting in reduced revenue At December 31, 2014, $14.8 million Newcastle derivativ
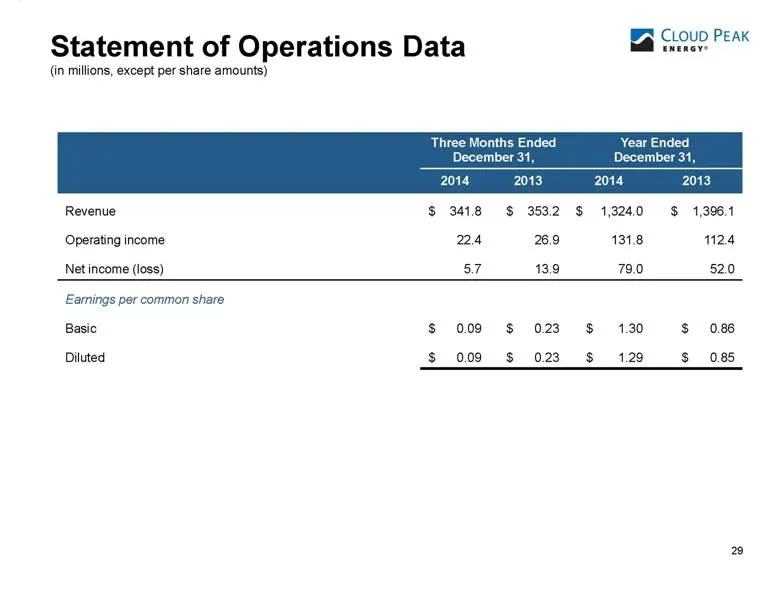
Slide 30: Statement of Operations Data
29 Statement of Operations Data (in millions, except per share amounts) Three Months Ended December 31, Year Ended December 31, 2014 2013 2014 2013 Revenue $ 341.8 $ 353.2 $ 1,324.0 $ 1,396.1 Operating income 22.4 26.9 131.8 112.4 Net income (loss) 5.7 13.9 79.0 52.0 Earnings per common share Basic
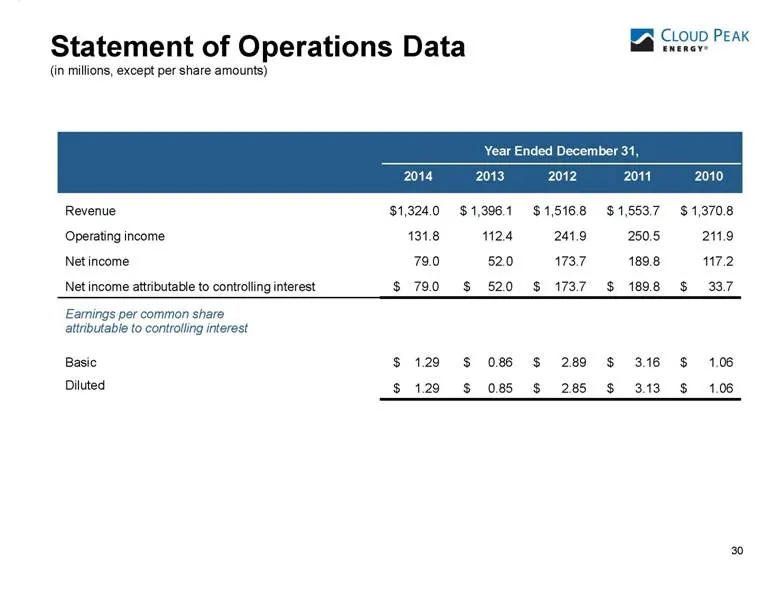
Slide 31: Statement of Operations Data
30 Statement of Operations Data (in millions, except per share amounts) Revenue $1,324.0 $ 1,396.1 $ 1,516.8 $ 1,553.7 $ 1,370.8 Operating income 131.8 112.4 241.9 250.5 211.9 Net income 79.0 52.0 173.7 189.8 117.2 Net income attributable to controlling interest $ 79.0 $ 52.0 $ 173.7 $ 189.8 $ 33.7
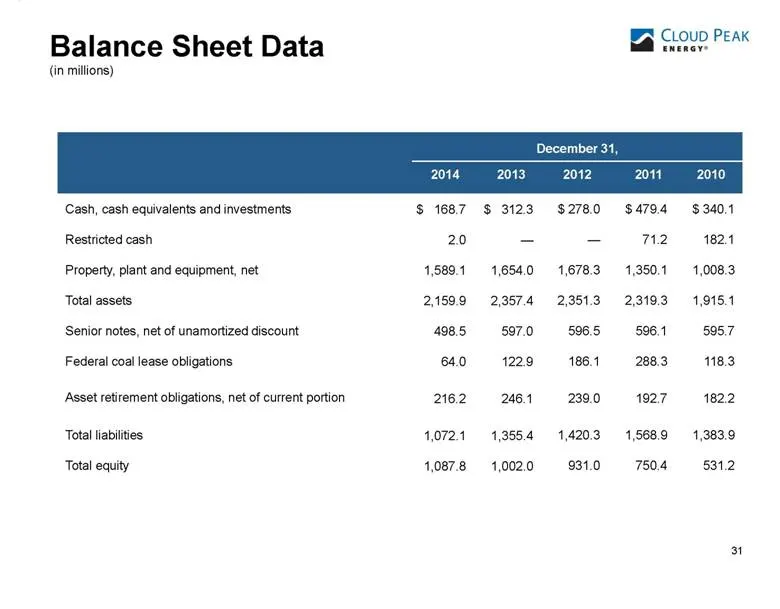
Slide 32: Balance Sheet Data
31 Balance Sheet Data (in millions) Cash, cash equivalents and investments $ 168.7 $ 312.3 $ 278.0 $ 479.4 $ 340.1 Restricted cash 2.0 — — 71.2 182.1 Property, plant and equipment, net 1,589.1 1,654.0 1,678.3 1,350.1 1,008.3 Total assets 2,159.9 2,357.4 2,351.3 2,319.3 1,915.1 Senior notes, net of u
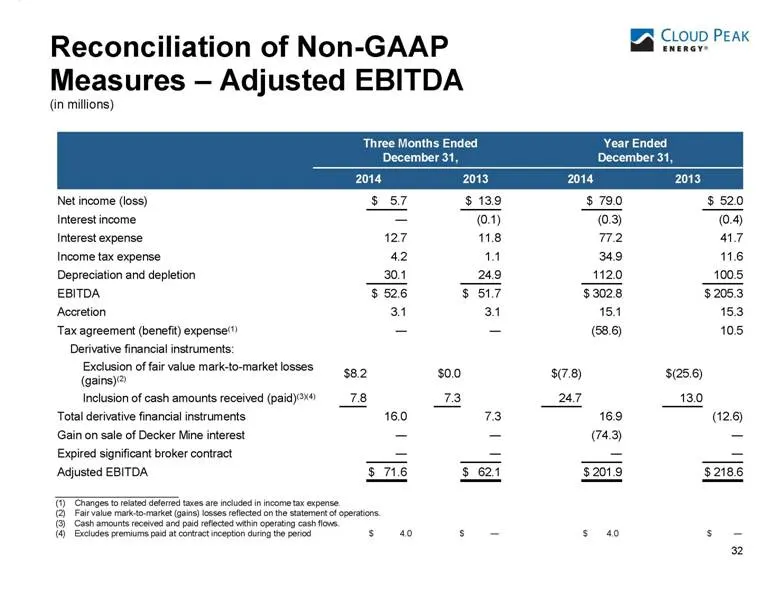
Slide 33: Reconciliation of Non-GAAP Measures – Adjusted EBITDA
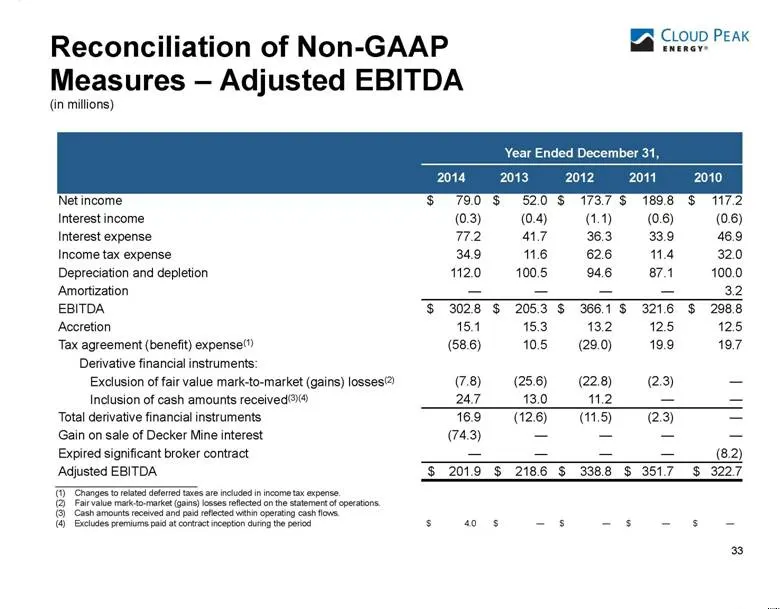
32 Reconciliation of Non-GAAP Measures – Adjusted EBITDA (in millions) __________________________ (1) Changes to related deferred taxes are included in income tax expense. (2) Fair value mark-to-market (gains) losses reflected on the statement of operations. Cash amounts received and paid reflected
Slide 34: Reconciliation of Non-GAAP Measures – Adjusted EBITDA
33 Reconciliation of Non-GAAP Measures – Adjusted EBITDA (in millions) Year Ended December 31, 2014 2013 2012 2011 2010 Net income $ 79.0 $ 52.0 $ 173.7 $ 189.8 $ 117.2 Interest income (0.3) (0.4) (1.1) (0.6) (0.6) Interest expense 77.2 41.7 36.3 33.9 46.9 Income tax expense 34.9 11.6 62.6 11.4 32.0
Slide 35: Reconciliation of Non-GAAP Measures – Adjusted EPS
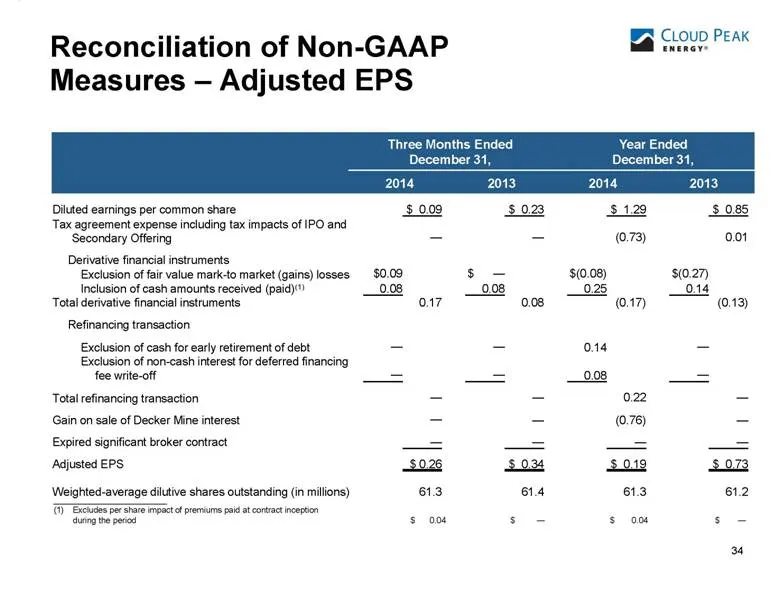
Three Months Ended December 31, Year Ended December 31, 2014 2013 2014 2013 34 Reconciliation of Non-GAAP Measures – Adjusted EPS Diluted earnings per common share $ 0.09 $ 0.23 $ 1.29 $ 0.85 Tax agreement expense including tax impacts of IPO and Secondary Offering — — (0.73) 0.01 Derivative financi
Slide 36: Reconciliation of Non-GAAP Measures – Adjusted EPS
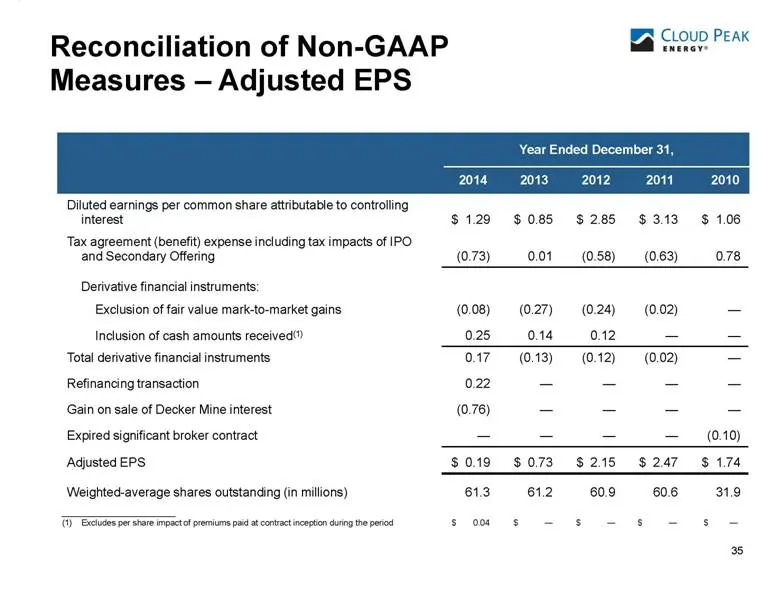
35 Diluted earnings per common share attributable to controlling interest $ 1.29 $ 0.85 $ 2.85 $ 3.13 $ 1.06 Tax agreement (benefit) expense including tax impacts of IPO and Secondary Offering (0.73) 0.01 (0.58) (0.63) 0.78 Derivative financial instruments: Exclusion of fair value mark-to-market gai
Slide 37: Adjusted EBITDA by Segment
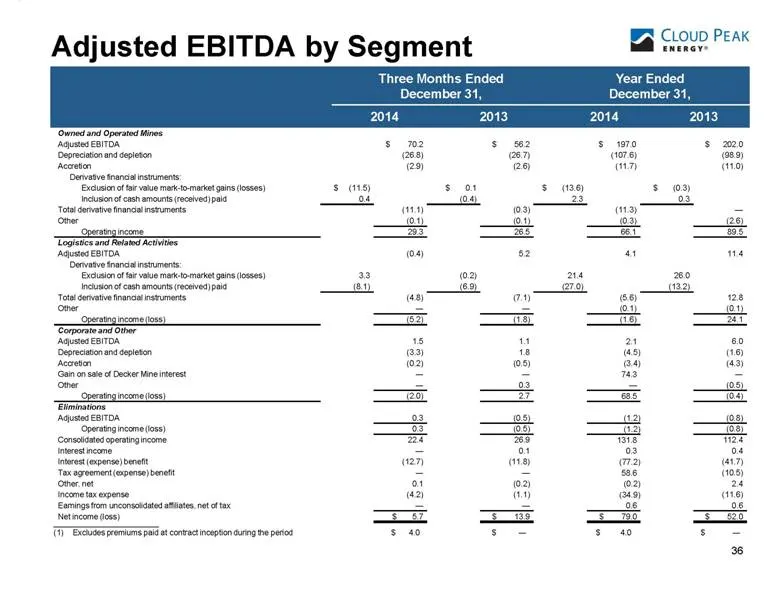
Adjusted EBITDA by Segment Three Months Ended December 31, Year Ended December 31, 2014 2013 2014 2013 Owned and Operated Mines Adjusted EBITDA $ 70.2 $ 56.2 $ 197.0 $ 202.0 Depreciation and depletion (26.8) (26.7) (107.6) (98.9) Accretion (2.9) (2.6) (11.7) (11.0) Derivative financial instruments:
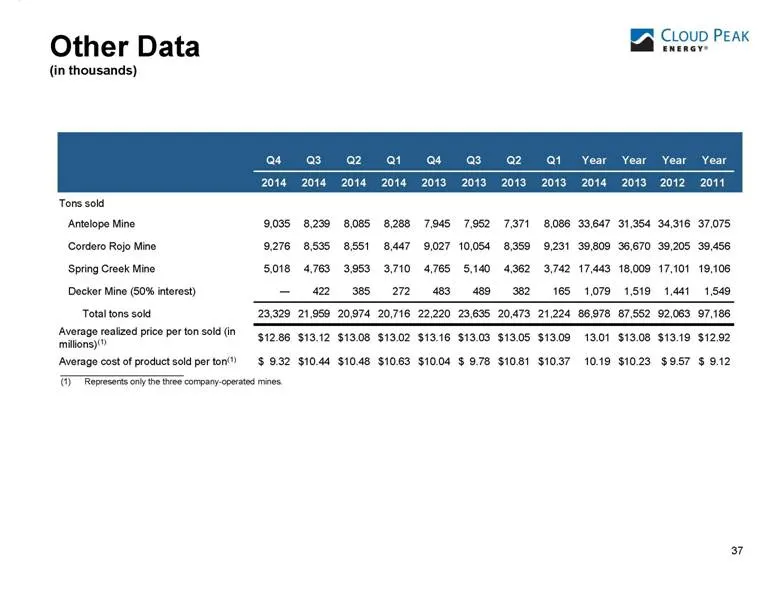
Slide 38: Quarterly Tons Sold and Pricing by Mine
37 __________________________ (1) Represents only the three company-operated mines. Q4 Q3 Q2 Q1 Q4 Q3 Q2 Q1 Year Year Year Year 2014 2014 2014 2014 2013 2013 2013 2013 2014 2013 2012 2011 Tons sold Antelope Mine 9,035 8,239 8,085 8,288 7,945 7,952 7,371 8,086 33,647 31,354 34,316 37,075 Cordero Rojo
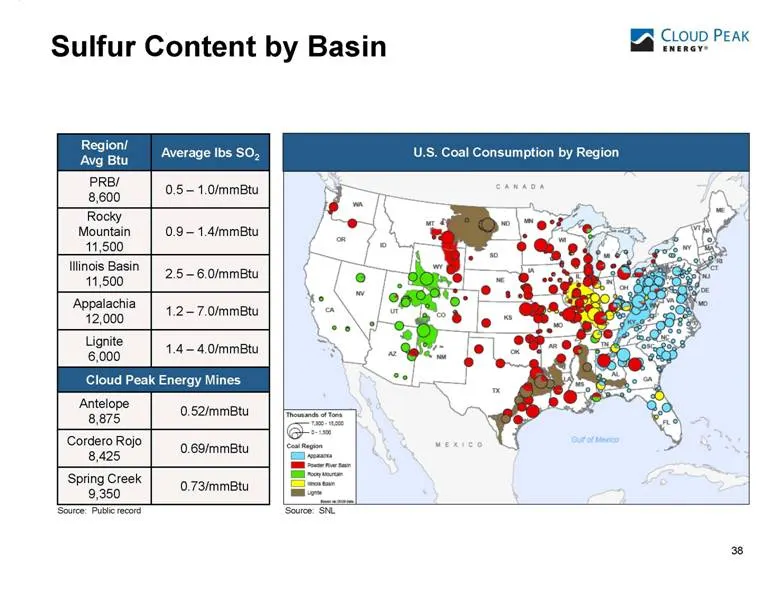
Slide 39: Sulfur Content by Basin
38 38 38 Sulfur Content by Basin 38 Source: SNL U.S. Coal Consumption by Region Region/ Avg Btu Average lbs SO2 PRB/ 8,600 0.5 – 1.0/mmBtu Rocky Mountain 11,500 0.9 – 1.4/mmBtu Illinois Basin 11,500 2.5 – 6.0/mmBtu Appalachia 12,000 1.2 – 7.0/mmBtu Lignite 6,000 1.4 – 4.0/mmBtu Cloud Peak Energy Min
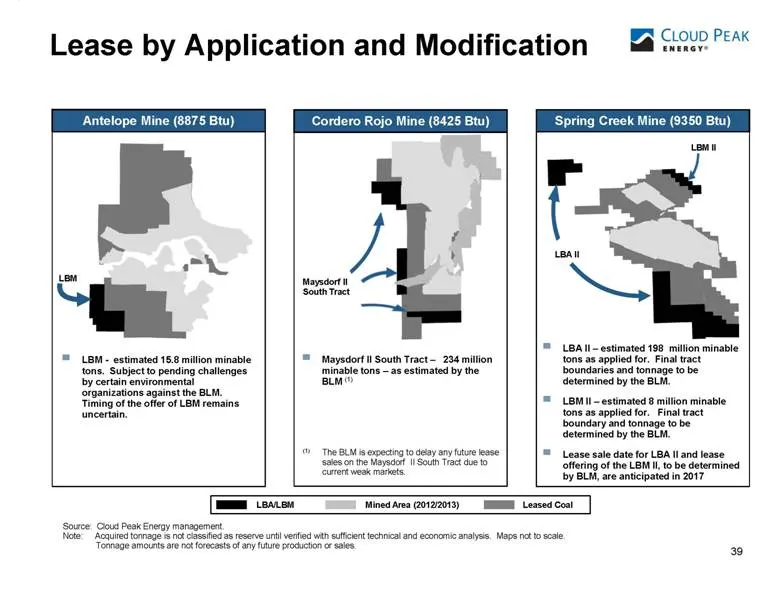
Slide 40: Lease by Application and Modification
39 Lease by Application and Modification Source: Cloud Peak Energy management. Note: Acquired tonnage is not classified as reserve until verified with sufficient technical and economic analysis. Maps not to scale. Tonnage amounts are not forecasts of any future production or sales. LBA/LBM Mined Are
Source: SEC EDGAR · 8-K filed Feb 24, 2015
More decks from Cloud Peak Energy Inc
 Investor Presentation (May 2019)56 slides · May 10, 2019
 Q3 2018 Earnings Presentation41 slides · Oct 30, 2018
 Shareholder Meeting (May 2018)21 slides · May 9, 2018
 FY2017 Earnings Presentation41 slides · Feb 23, 2018
 Investor Presentation (November 2017)39 slides · Nov 7, 2017
 Investor Presentation (August 2017)40 slides · Aug 7, 2017