Legacy Reserves LP — Legacy Reserves L P — Wachovia Equity Conference 2007
23 slides from Legacy Reserves LP's conference presentation, Jun 27, 2007
Slide 1: Wachovia Equity Conference June 27, 2007
Wachovia Equity Conference June 27, 2007 Legacy Reserves LP
Slide 2: Forward-Looking Statements
Forward-Looking Statements Statements made by representatives of Legacy Reserves LP (the “Partnership”) during the course of this presentation that are not historical facts are forward-looking statements. These statements are based on certain assumptions made by the Partnership based on management’s
Slide 3: Legacy Overview
Legacy Overview Legacy Reserves LP
Slide 4: Legacy History
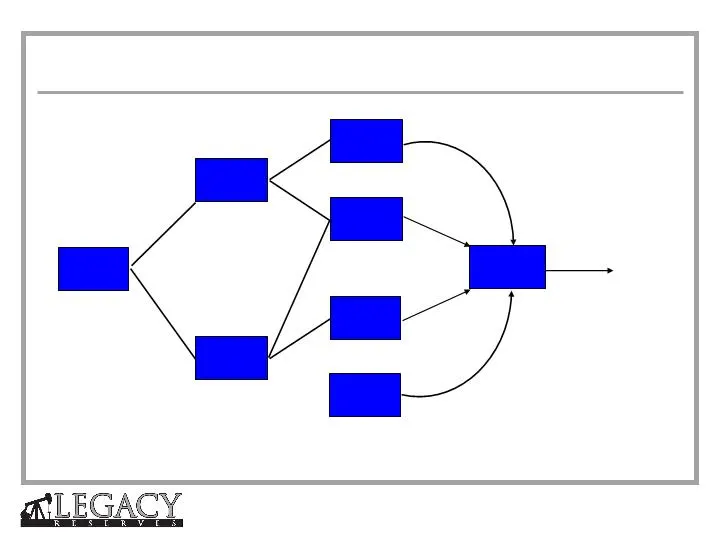
Other Related Entities Brothers Production Company Brothers Moriah Brothers MBN Moriah Legacy Dale Brown & Jack McGraw form Partnership Cary & Dale Brown form Moriah Formation Transaction Through Private Placement 1981 1991 2005 March 2006 January 2007 IPO Kyle McGraw & Cary Brown Assume Management
Slide 5: Legacy Management Team
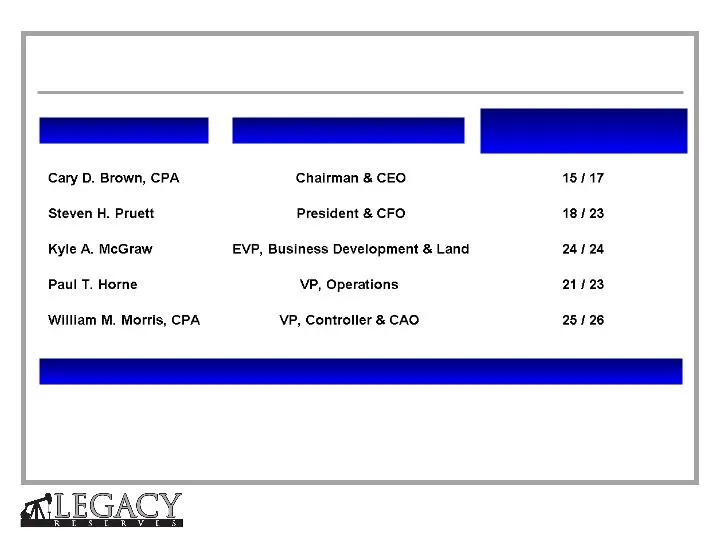
Name Title Years of Experience Permian / Total Oil & Gas Independent Board Members S. Wil VanLoh, Jr. Managing Partner Quantum Energy Partners William D. Sullivan Former EVP Anadarko Petroleum G. Larry Lawrence Former Controller Pure Resources Kyle D. Vann Former CEO Entergy - Koch, LP Legacy Manage
Slide 6: Asset Overview
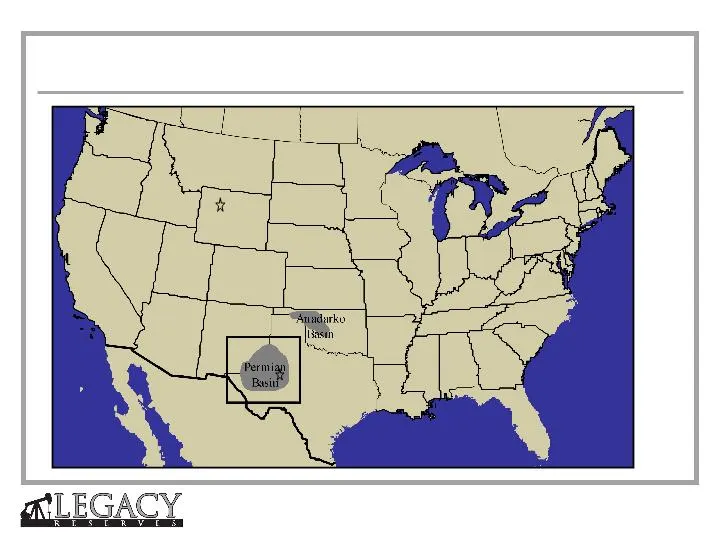
Cody, WY Asset Overview
Slide 7: Asset Overview
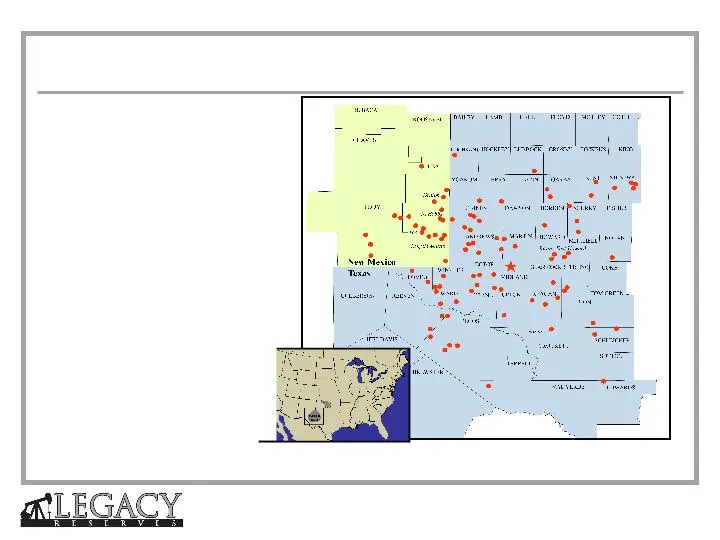
(1) Taken from reserve reports prepared by LaRoche Petroleum Consultants, Ltd. as of 12/31/06 for Legacy Reserves LP plus proved reserves from 2007 acquisitions from internal reserve reports: Binger (4.1 MMBoe), TSF/Ameristate (1.4 MMBoe), and Slaughter/Rocker A (1.0 MMBoe). (2) 1 st quarter 2007 pr
Slide 8: Stable Platform
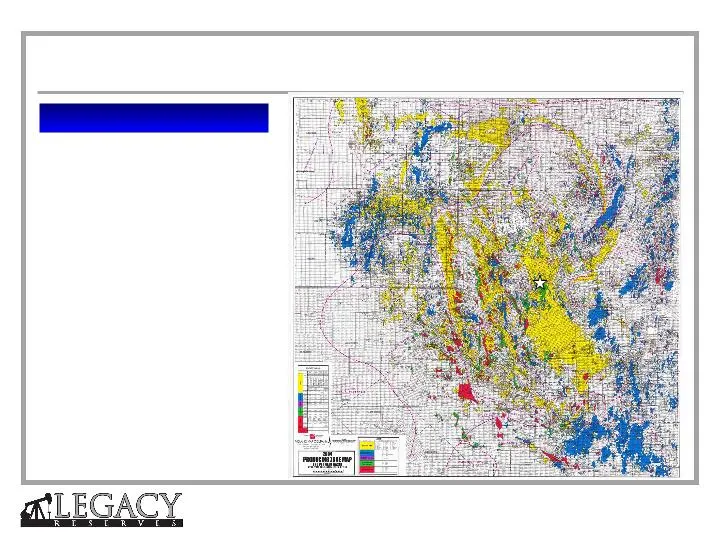
Stable Platform (1) Source: http://www.utpb.edu Map Source: Midland Map Company. Why the Permian Basin? • Over 24 BBbls produced since 1921 • Represents 20% of lower 48 states and 68% of Texas oil production (1) • Multiple producing formations • Established infrastructure and ample take-away capacit
Slide 9: Consolidation Opportunities in the Permian Basin
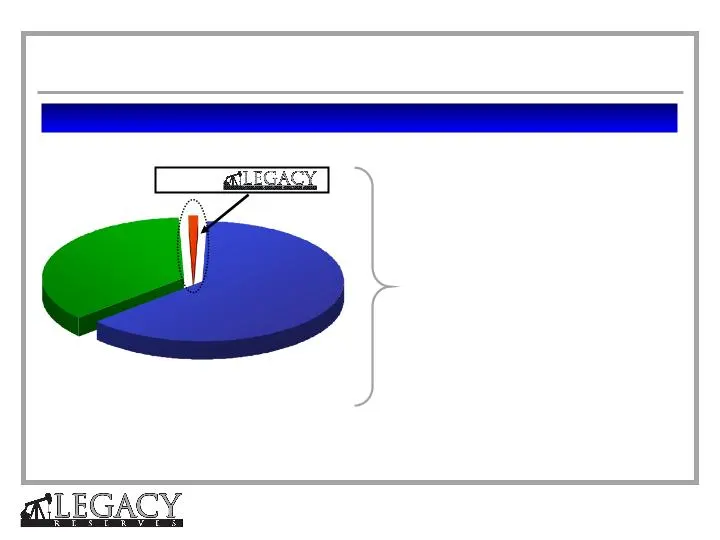
Top 5 Operators 1,700+ Operators Permian Basin Ownership Profile (1) 0.3% (1) Ownership based on production. Permian Basin includes Texas Railroad Commission Districts 7C, 8, 8A and Lea and Eddy County, New Mexico. Permian Basin data as of July 31, 2005; Legacy production data as of September 30, 20
Slide 10: Multi-Billion Dollar Acquisition Market
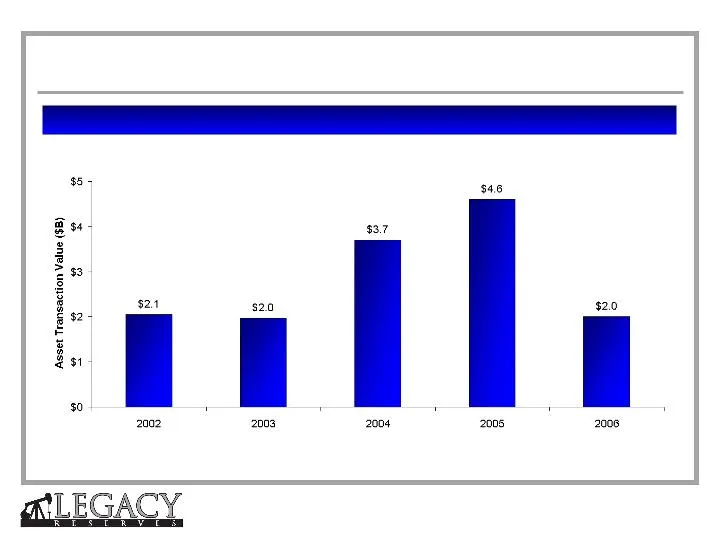
Multi-Billion Dollar Acquisition Market Note: Per John S. Herold, Inc’s 2007 Global Upstream M&A Review (from publicly available data). Mid-Continent includes the Permian Basin, excludes corporate transactions. Active Acquisition Market
Slide 11: Acquisition Track Record
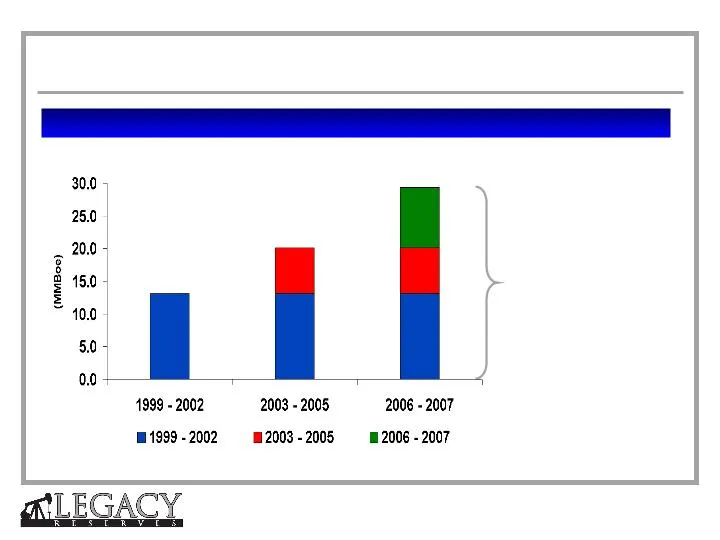
7.0 13.1 7.0 13.1 9.2 Acquired Reserves (1999 - 2007) Aggregate cost of $227 million at an average cost of $7.75 per Boe 13.1 20.1 29.3 Acquisition Track Record
Slide 12: 2007 Acquisition Summary
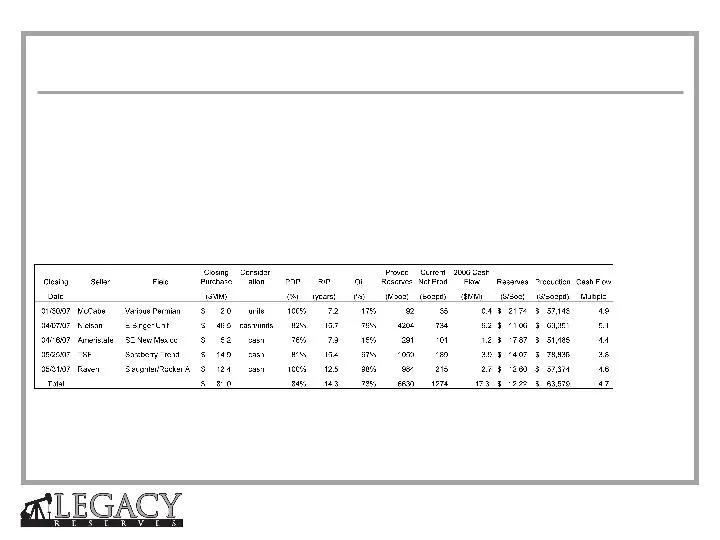
5 negotiated transactions averaging: • $12.22 per Boe of proved reserves • 84% PDP, 14.3 year R/P • $63,579 per Boepd • 4.7 times 2006 cash flow 2007 Acquisition Summary
Slide 13: Financial Summary
Financial Summary Legacy Reserves LP
Slide 14: Ownership
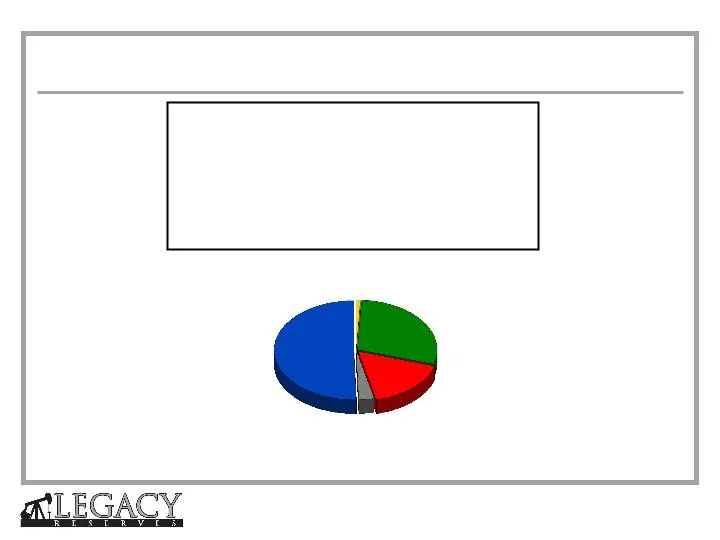
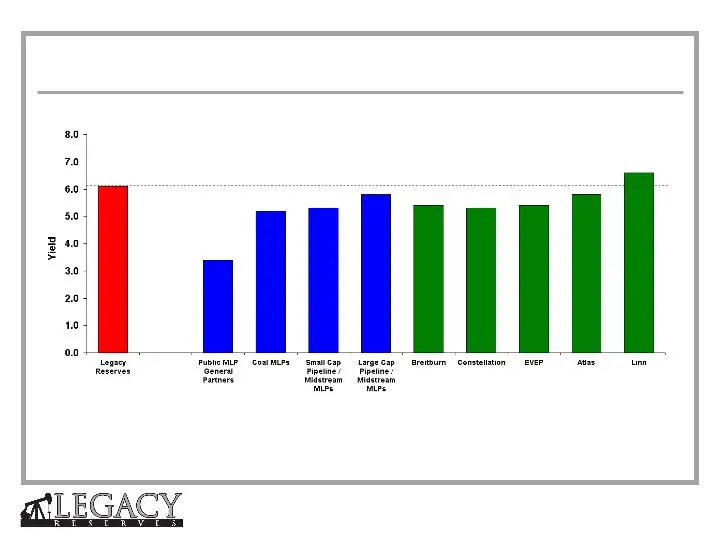
GP Interest <0.1% New Unitholders 29% 144A & Reg D Unitholders 17% Sellers of Assets to Legacy 3% Founding Investors, Directors and Management 51% Ticker: LGCY Exchange: NASDAQ Unit Price (6/14/07): $26.96 per unit Quarterly Distribution: $0.41 per unit Yield: 6.1% Market Capitalization: $703 millio
Slide 15: Legacy Balance Sheet
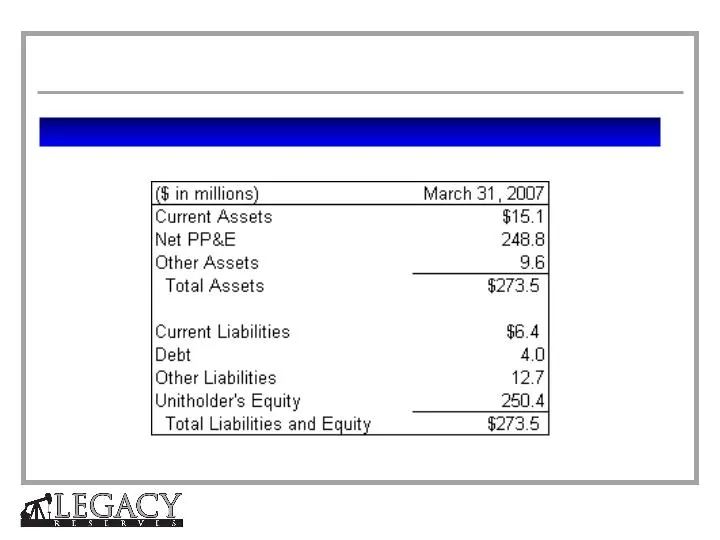
Summary Balance Sheet Legacy Balance Sheet
Slide 16: Summary Financial Information
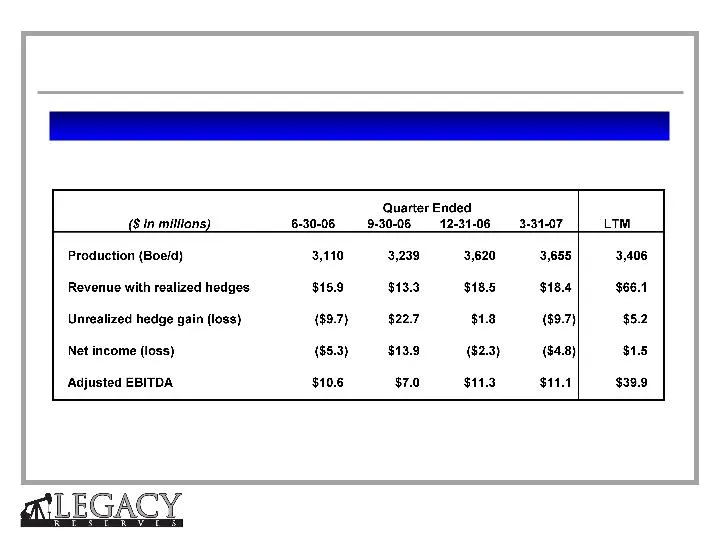
Financial and Operating Data - Latest Twelve Months Note: Adjusted EBITDA for the quarter ended 9-30-06 unfavorably impacted by $4.0 million swap termination payment for 2007-2008 oil swaps. Summary Financial Information
Slide 17: Commodity Price Hedging Summary
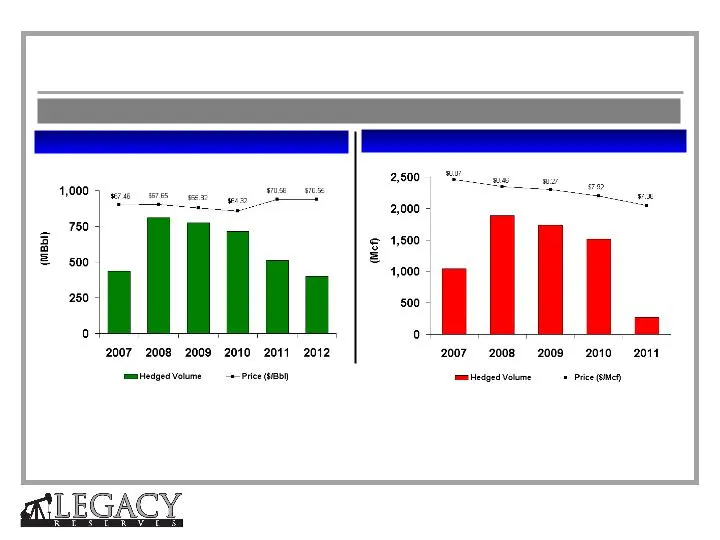
Oil (1) Natural Gas (1) Over 70% of forecasted production hedged for 2007 and over 60% hedged through 2010. (1) All hedges are floating for fixed price swaps. Swap volumes and prices starting April 1, 2007 through December 31, 2012. Waha-NYMEX basis swaps in place on Henry Hub gas swaps. Natural gas
Slide 18: Legacy's Performance
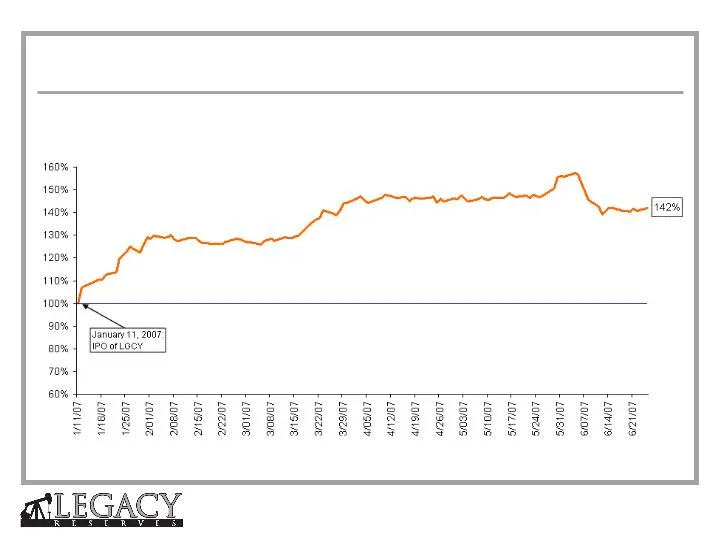
Legacy’s Performance Since the IPO, Legacy’s unit price has increased by 42%.
Slide 19: Distribution Yield
Note: Legacy Reserves data as of 6/13/07. Other MLP Market data from Wachovia Capital Markets Equity Research Department as of 6/8/2007. Large Cap Pipeline / Midstream MLPs Index: Market Cap > $1.4 B. Includes Buckeye, Boardwalk, Enbridge, Energy Transfer, Enterprise, Kinder Morgan, Magellan, Oneok,
Slide 20: Significant Advantages of MLP without IDR
Significant Advantages of MLP without IDR • Lower cost of capital than traditional MLP structure – Unit distribution growth not burdened by IDRs to the GP – Cost of equity equals market yield • Simple and fair alignment of interests among all investors – Investors share equally in all cash flows – W
Slide 21: Legacy Summary
Legacy Summary • Only MLP focused on the oil-weighted Permian Basin • Experienced management team with significant equity ownership • Tax advantaged yield • Significant organic and external growth opportunities • Long-lived, diversified multi-pay properties • Demonstrated reserve replacement capabil
Slide 22: Adjusted EBITDA Reconciliation
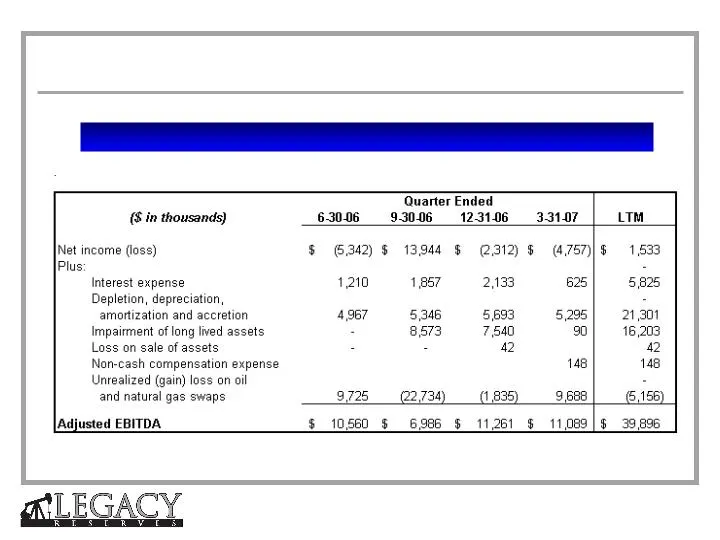
Adjusted EBITDA Reconciliation This presentation, the financial tables and other supplemental information, including the reconciliations of certain non-generally accepted accounting principles ("non-GAAP") measures to their nearest comparable generally accepted accounting principles ("GAAP") measure
Slide 23: Reconciliation of Net Income to Adjusted EBITDA
Reconciliation of Net Income to Adjusted EBITDA Note: Adjusted EBITDA is a non-GAAP financial measure. Adjusted EBITDA Reconciliation
Source: SEC EDGAR · 8-K filed Jun 27, 2007
More decks from Legacy Reserves LP
 Investor Presentation (June 2019)9 slides · Jun 14, 2019
 Enercom Oil & Gas Conference 201818 slides · Aug 22, 2018
 Q2 2018 Earnings Presentation19 slides · Aug 2, 2018
 IPAA OGIS New York April 201812 slides · Apr 9, 2018
 Merger or Acquisition (March 2018)9 slides · Mar 26, 2018
 Executive Oil Conference 200919 slides · Apr 14, 2009