AssetMark Financial Holdings Inc
AssetMark Financial — Investor Presentation (December 2019)
30 slides from AssetMark Financial's investor presentation, Dec 5, 2019
Slide 1: Investor Presentation Winter 2019
Investor Presentation Winter 2019 Exhibit 99.1
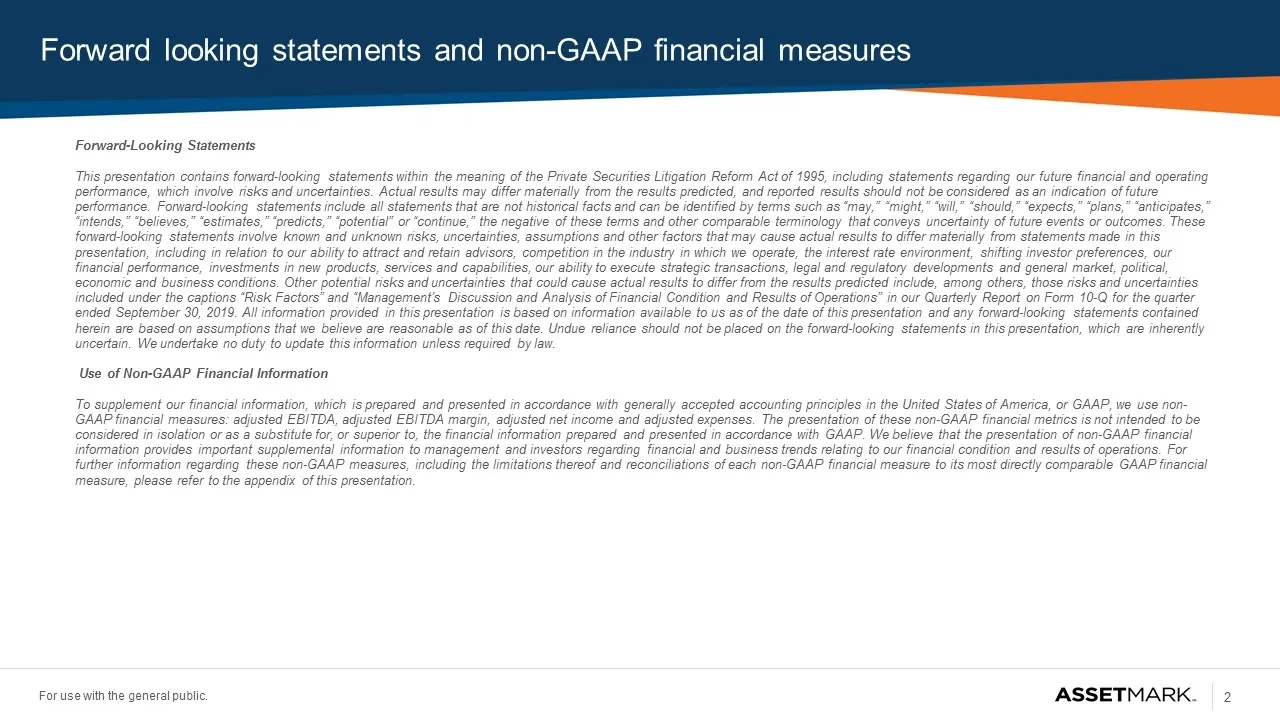
Slide 2: Forward looking statements and non-GAAP financial measures
Forward looking statements and non-GAAP financial measures Forward-Looking Statements This presentation contains forward-looking statements within the meaning of the Private Securities Litigation Reform Act of 1995, including statements regarding our future financial and operating performance, which
Slide 3: Contents
Contents Opportunity Highlights Market Overview Company Overview Financial Overview Appendix
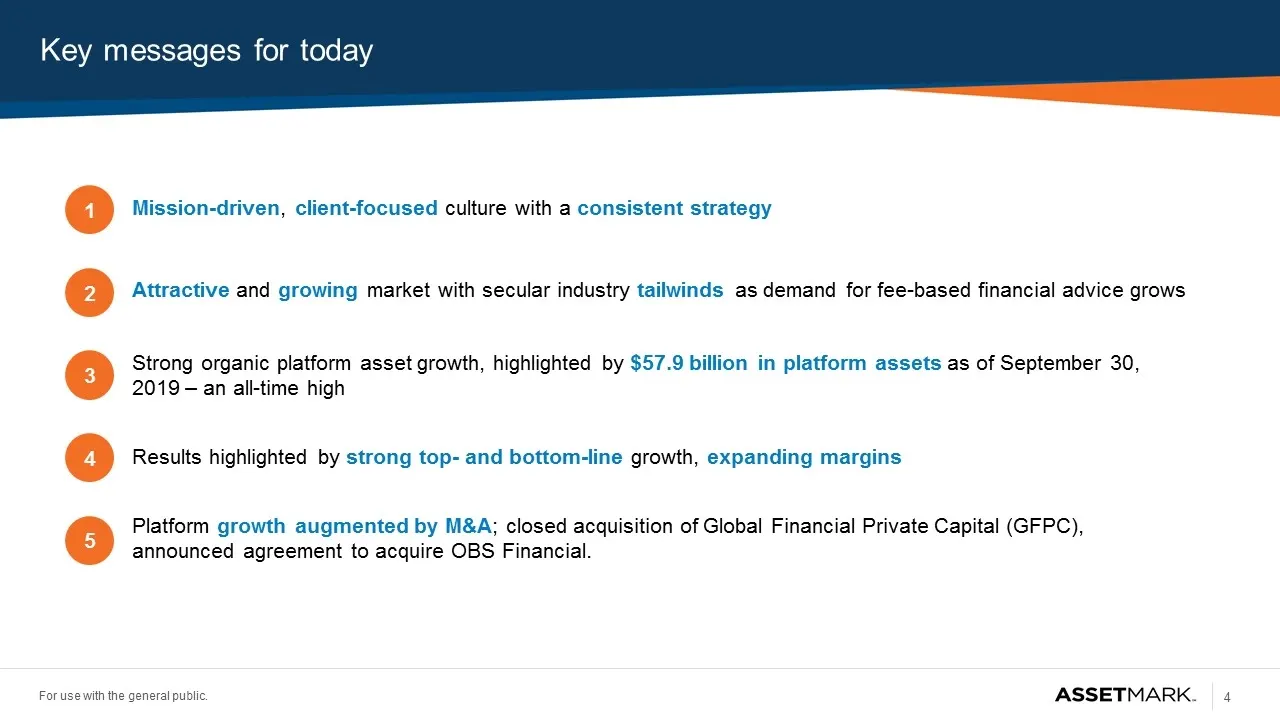
Slide 4: Key messages for today
Key messages for today 1 2 Mission-driven, client-focused culture with a consistent strategy 3 4 Attractive and growing market with secular industry tailwinds as demand for fee-based financial advice grows 5 Strong organic platform asset growth, highlighted by $57.9 billion in platform assets as of
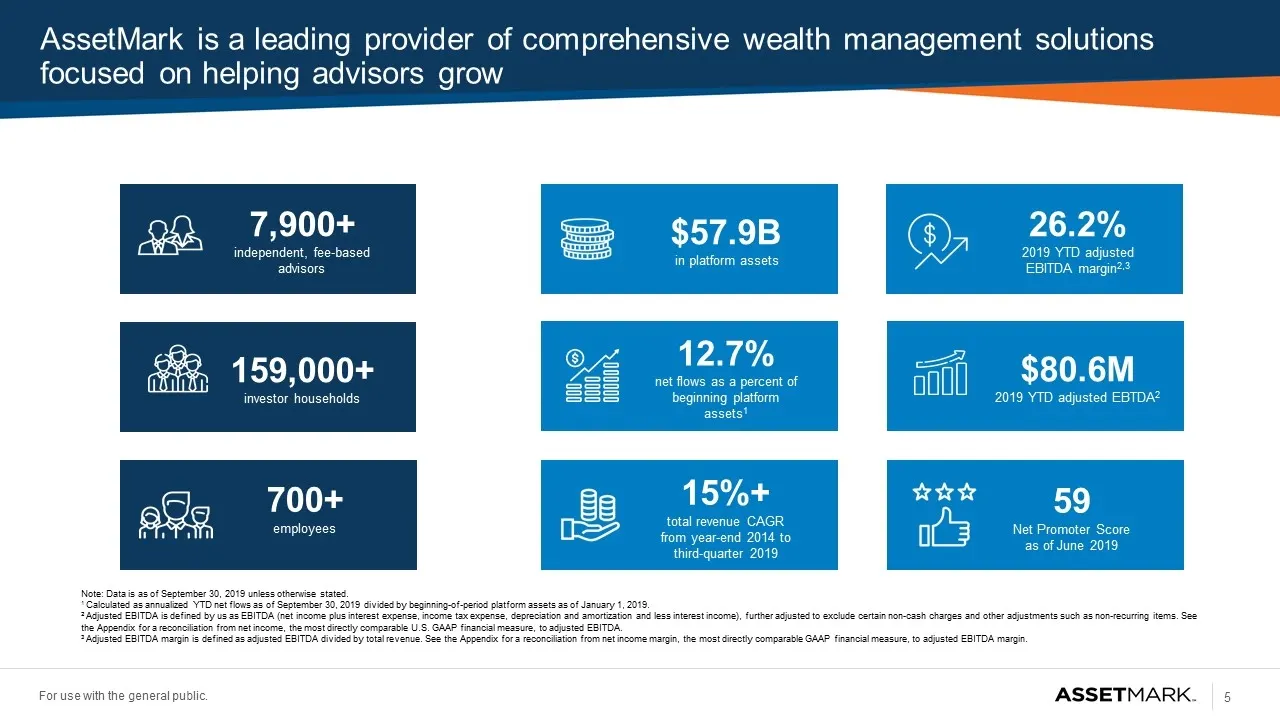
Slide 5: AssetMark is a leading provider of comprehensive wealth management solutions
AssetMark is a leading provider of comprehensive wealth management solutions focused on helping advisors grow Note: Data is as of September 30, 2019 unless otherwise stated. 1 Calculated as annualized YTD net flows as of September 30, 2019 divided by beginning-of-period platform assets as of January
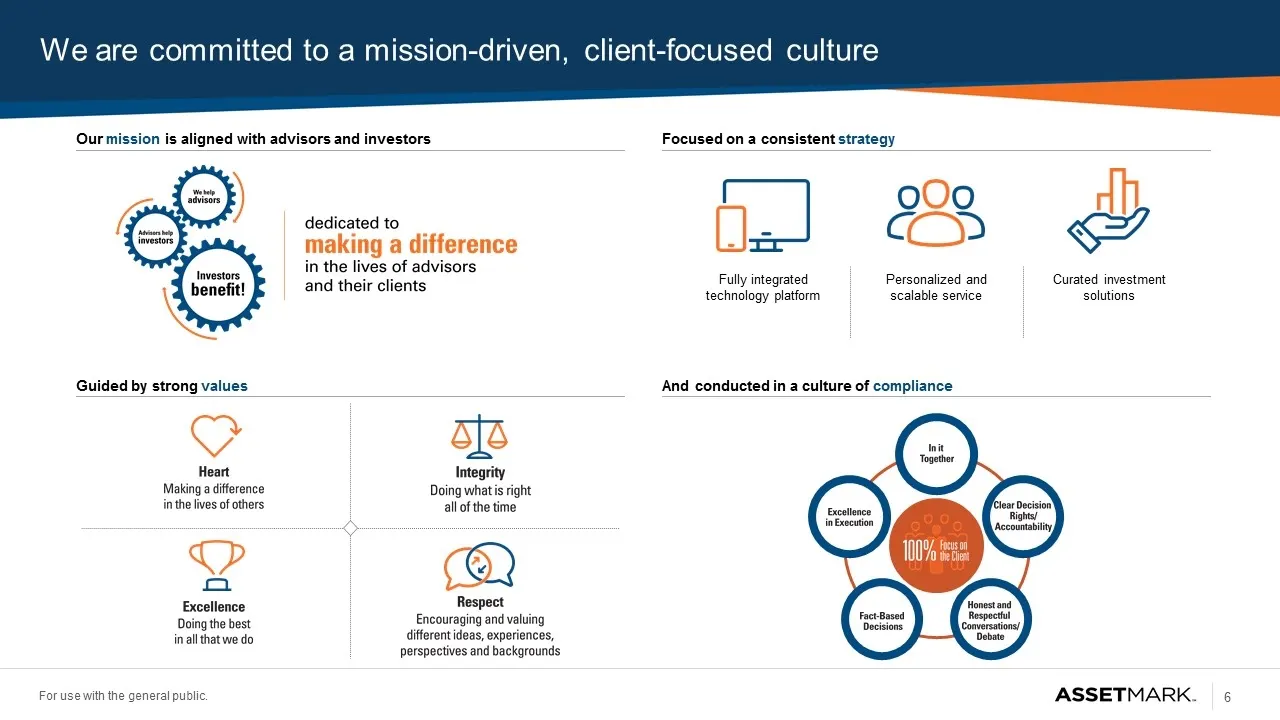
Slide 6: We are committed to a mission-driven, client-focused culture
We are committed to a mission-driven, client-focused culture Our mission is aligned with advisors and investors Focused on a consistent strategy Guided by strong values And conducted in a culture of compliance Fully integrated technology platform Personalized and scalable service Curated investment
Slide 7: Contents
Opportunity Highlights Market Overview Company Overview Financial Overview Appendix Contents
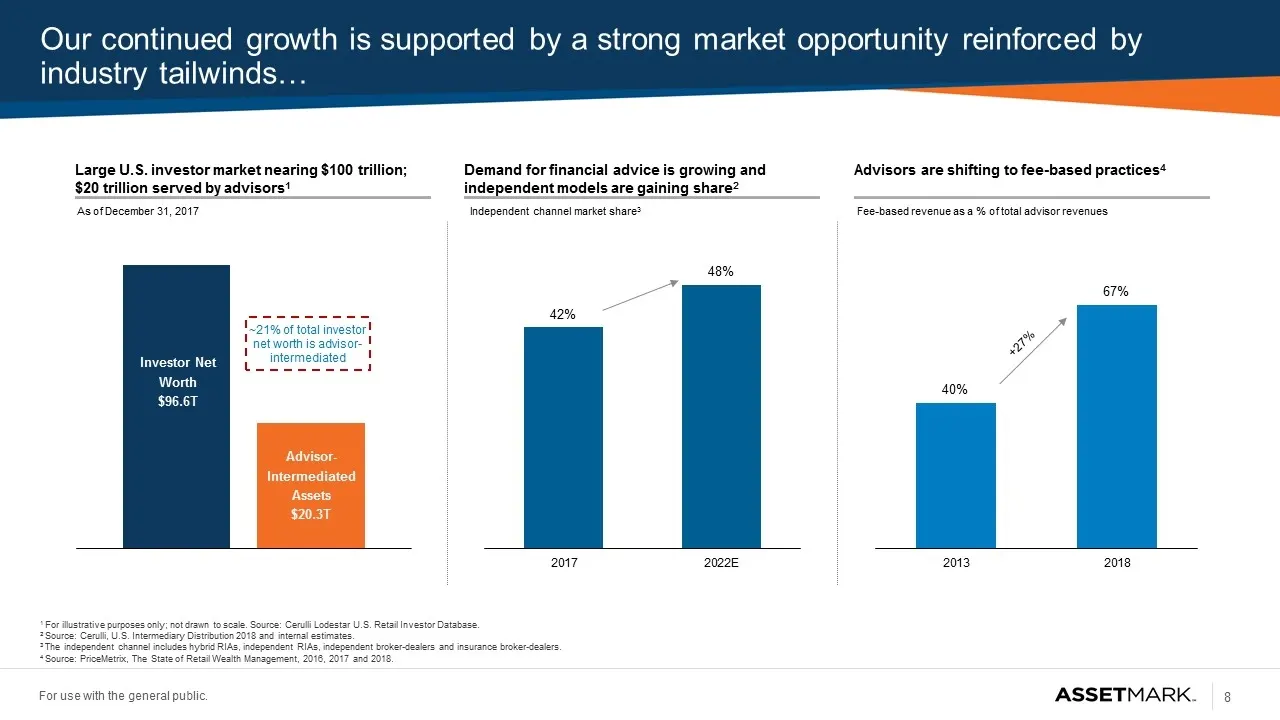
Slide 8: Our continued growth is supported by a strong market opportunity
Our continued growth is supported by a strong market opportunity reinforced by industry tailwinds… Large U.S. investor market nearing $100 trillion; $20 trillion served by advisors1 Demand for financial advice is growing and independent models are gaining share2 Advisors are shifting to fee-based pr
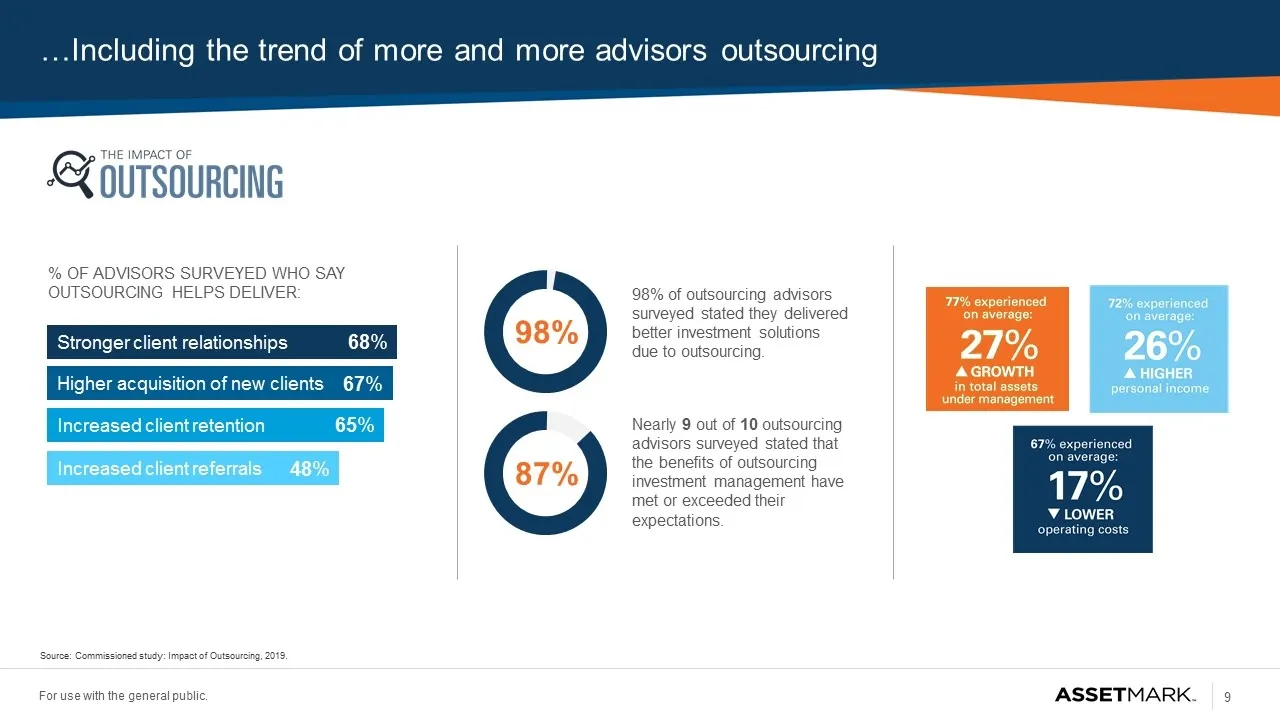
Slide 9: Including the trend of more and more advisors outsourcing
…Including the trend of more and more advisors outsourcing Source: Commissioned study: Impact of Outsourcing, 2019. Stronger client relationships Higher acquisition of new clients Increased client retention Increased client referrals 48% 65% 67% 68% 98% 87% 98% of outsourcing advisors surveyed state
Slide 10: Contents
Contents Opportunity Highlights Market Overview Company Overview Financial Overview Appendix
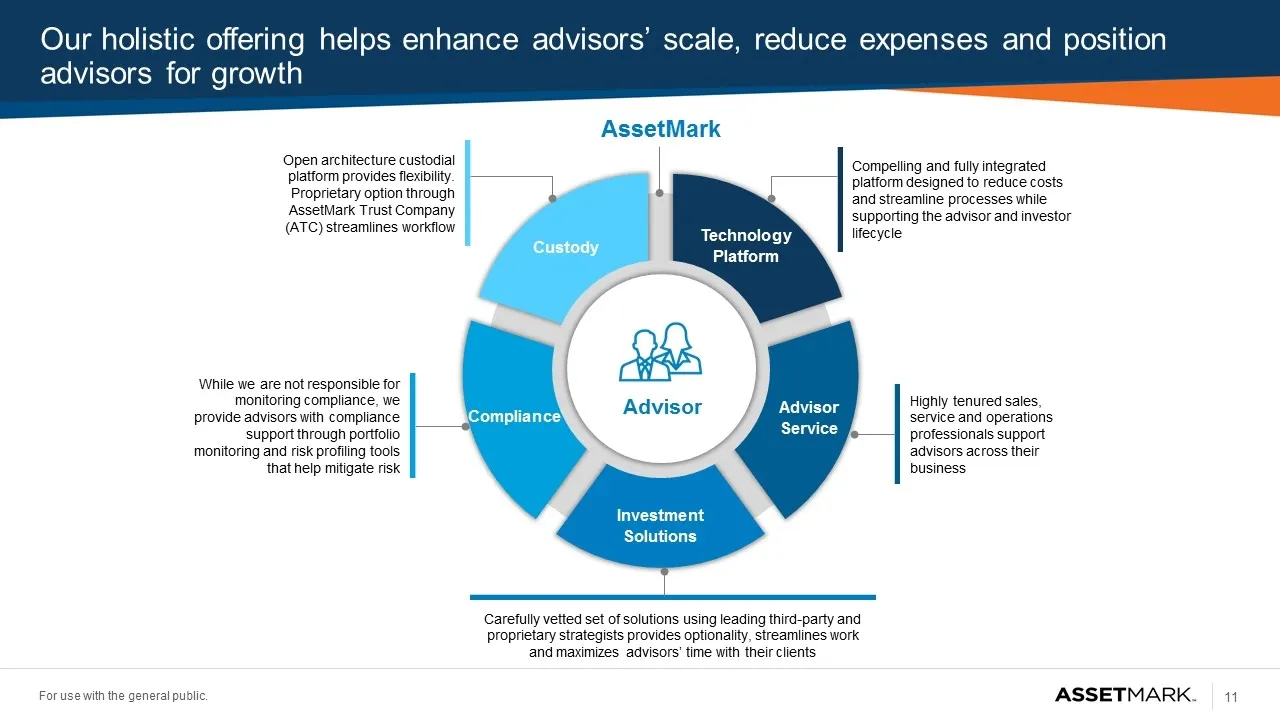
Slide 11: Our holistic offering helps enhance advisors' scale, reduce expenses and position for growth
Our holistic offering helps enhance advisors’ scale, reduce expenses and position advisors for growth AssetMark Compelling and fully integrated platform designed to reduce costs and streamline processes while supporting the advisor and investor lifecycle Technology Platform Advisor Service Investmen
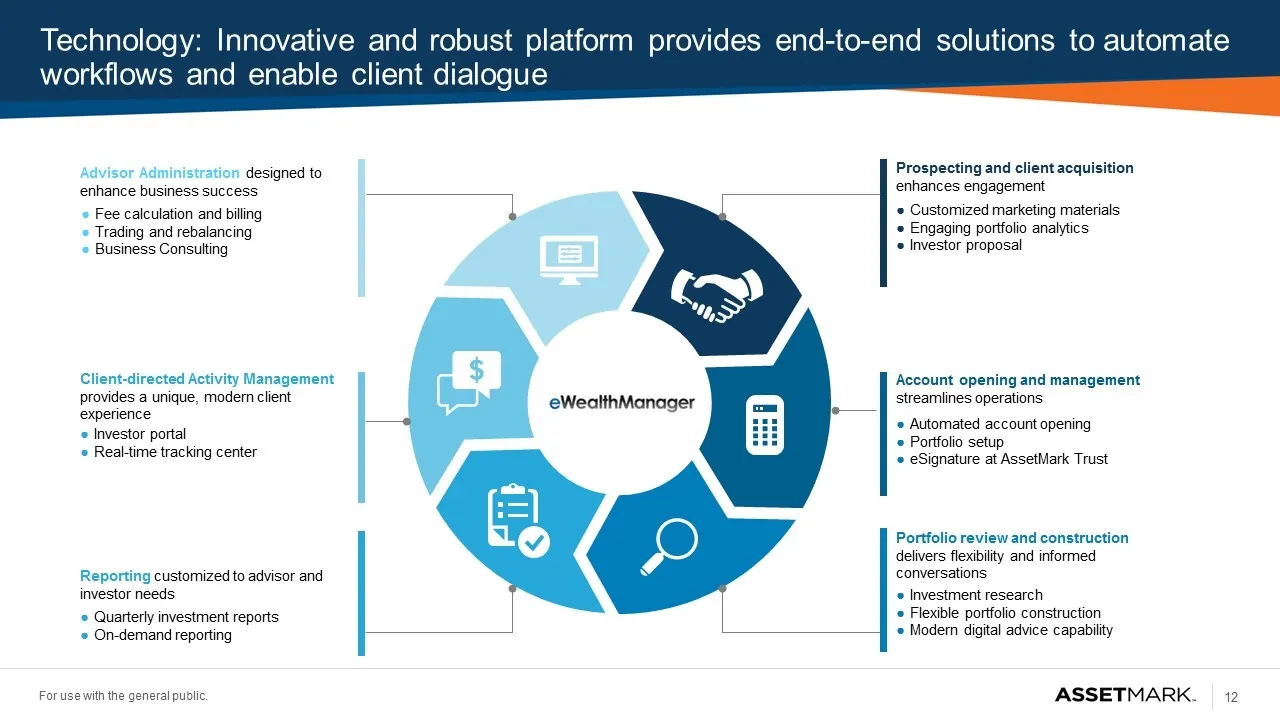
Slide 12: Technology: Innovative and robust platform provides end-to-end solutions
Technology: Innovative and robust platform provides end-to-end solutions to automate workflows and enable client dialogue Reporting customized to advisor and investor needs Quarterly investment reports On-demand reporting Client-directed Activity Management provides a unique, modern client experienc
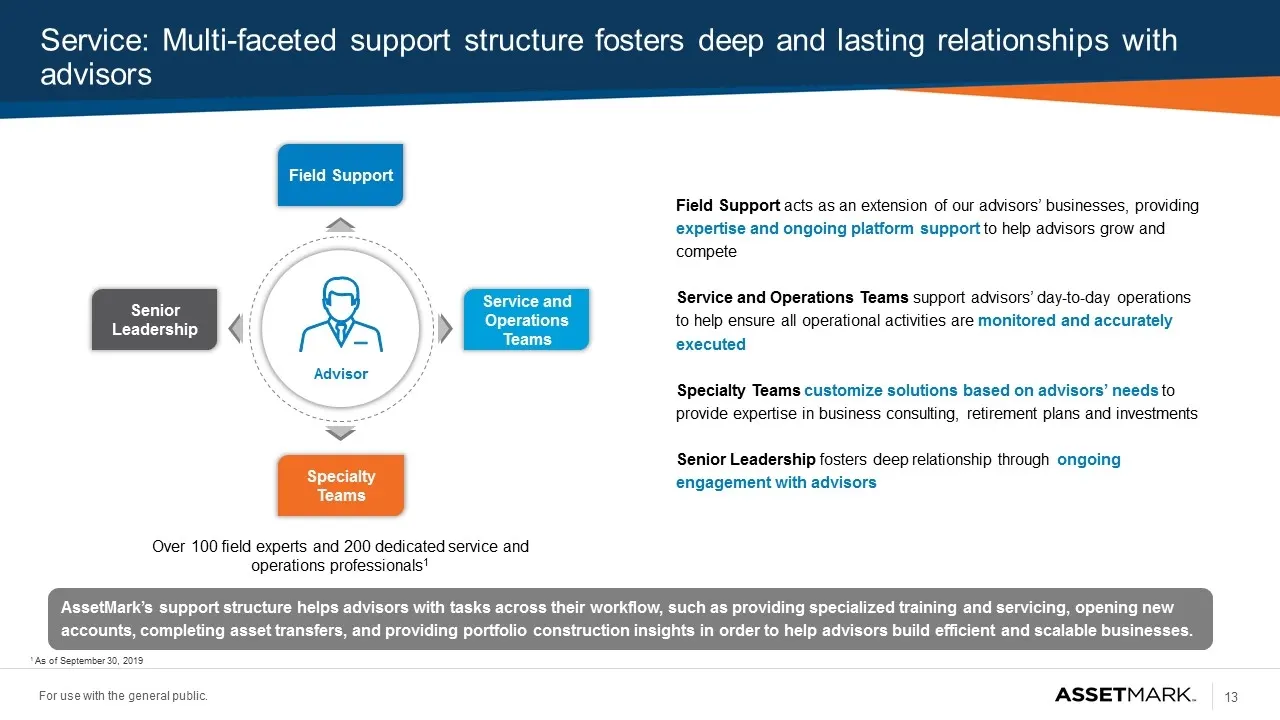
Slide 13: Field Support acts as an extension of our advisors' businesses
Field Support acts as an extension of our advisors’ businesses, providing expertise and ongoing platform support to help advisors grow and compete Service and Operations Teams support advisors’ day-to-day operations to help ensure all operational activities are monitored and accurately executed Spec
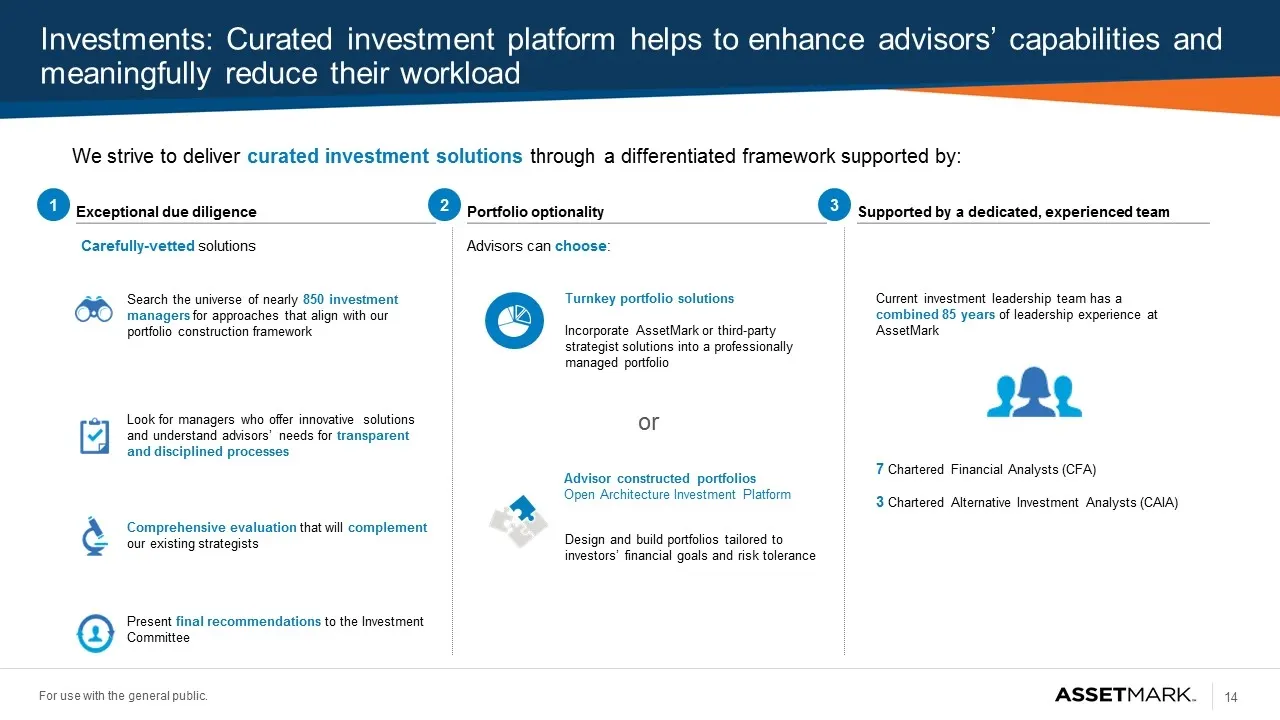
Slide 14: Investments: Curated investment platform helps to enhance advisors' capabilities
Investments: Curated investment platform helps to enhance advisors’ capabilities and meaningfully reduce their workload Exceptional due diligence Portfolio optionality Supported by a dedicated, experienced team Carefully-vetted solutions Current investment leadership team has a combined 85 years of
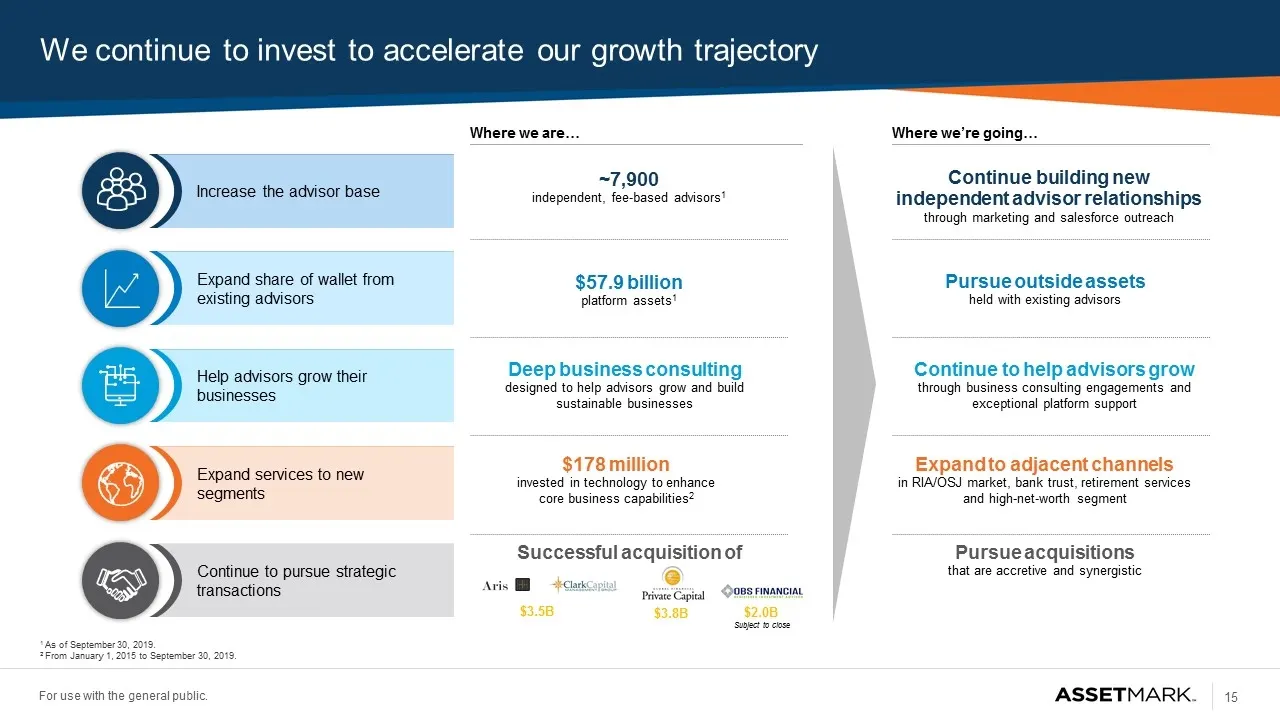
Slide 15: We continue to invest to accelerate our growth trajectory
We continue to invest to accelerate our growth trajectory 1 As of September 30, 2019. 2 From January 1, 2015 to September 30, 2019. Expand services to new segments Help advisors grow their businesses Expand share of wallet from existing advisors Increase the advisor base Where we are… Where we’re go
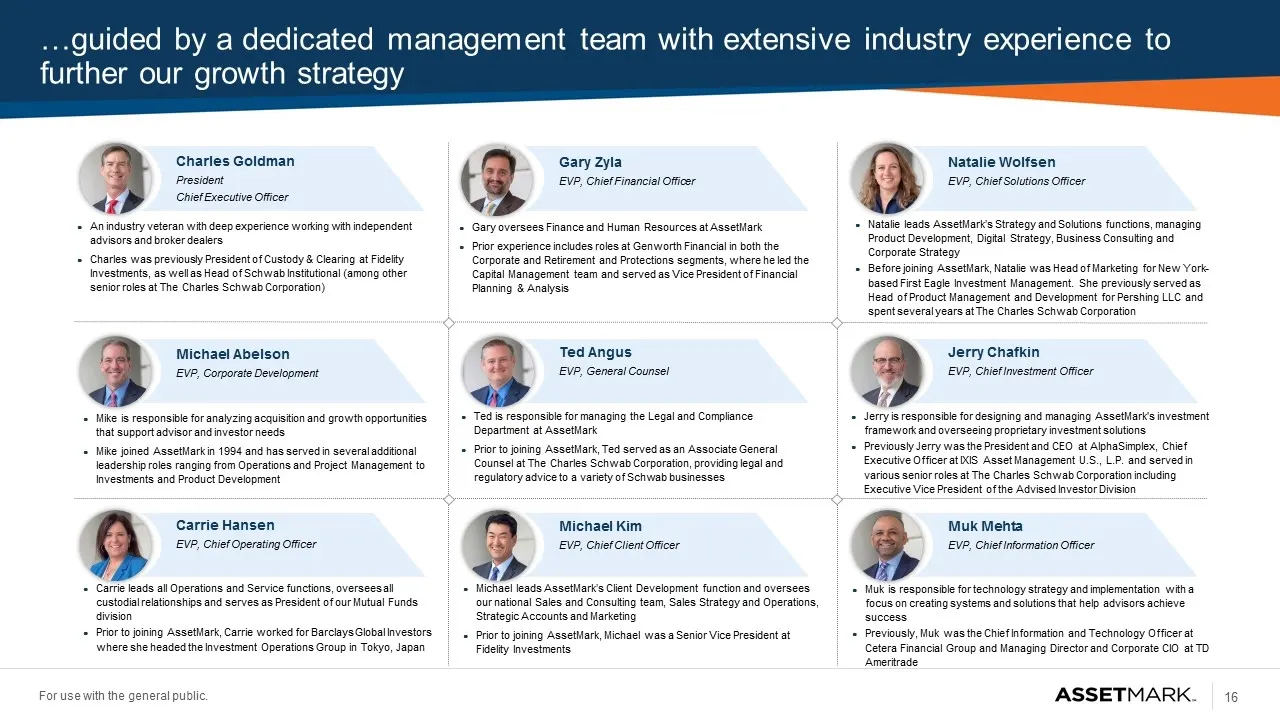
Slide 16: Guided by a dedicated management team with extensive industry experience
…guided by a dedicated management team with extensive industry experience to further our growth strategy An industry veteran with deep experience working with independent advisors and broker dealers Charles was previously President of Custody & Clearing at Fidelity Investments, as well as Head of Sc
Slide 17: Our focus for 2020
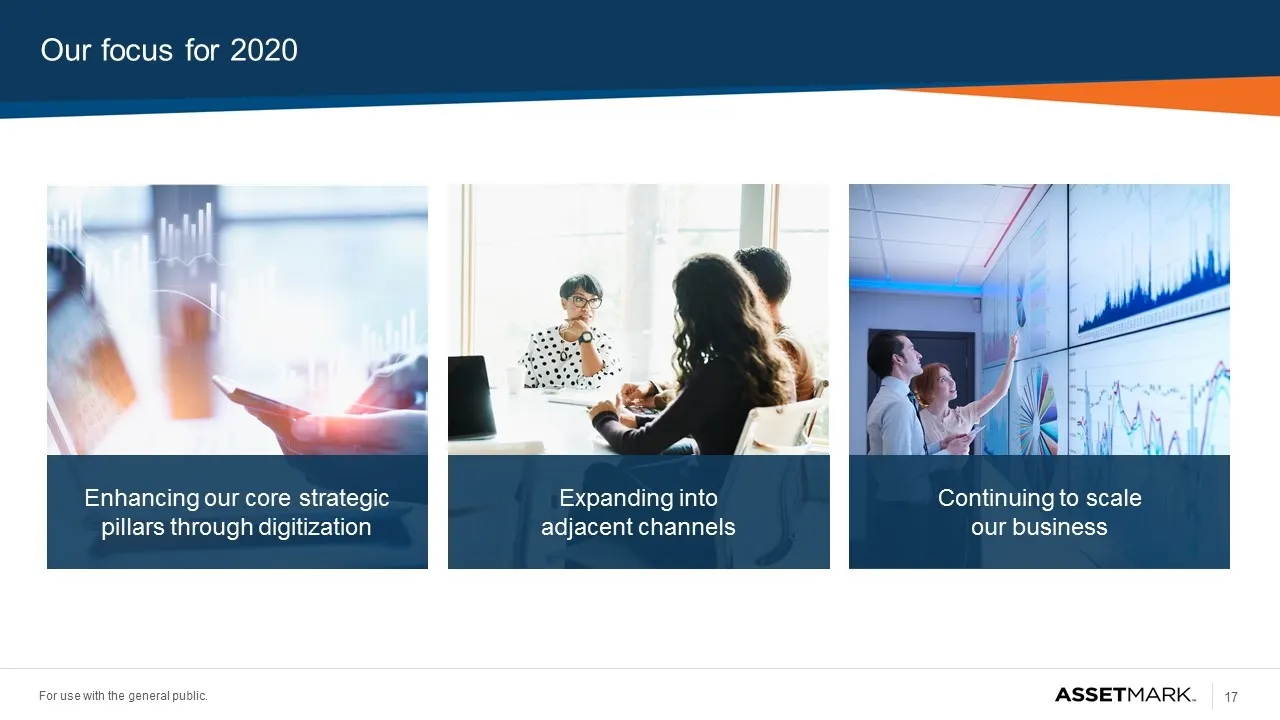
Our focus for 2020 Expanding into adjacent channels Enhancing our core strategic pillars through digitization Continuing to scale our business
Slide 18: Contents
Contents Opportunity Highlights Market Overview Company Overview Financial Overview Appendix
Slide 19: We have experienced strong platform asset growth over the past five years
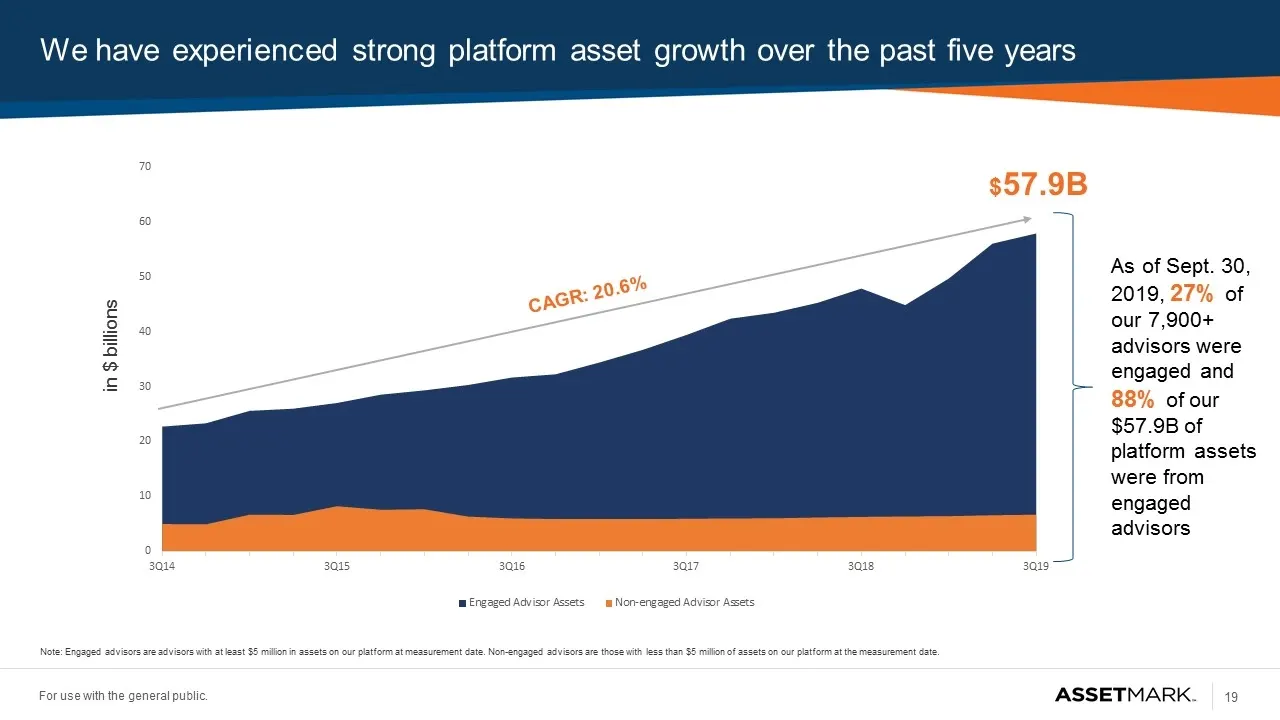
We have experienced strong platform asset growth over the past five years $57.9B CAGR: 20.6% in $ billions Note: Engaged advisors are advisors with at least $5 million in assets on our platform at measurement date. Non-engaged advisors are those with less than $5 million of assets on our platform at
Slide 20: Platform assets – 3Q19 and 2019 YTD
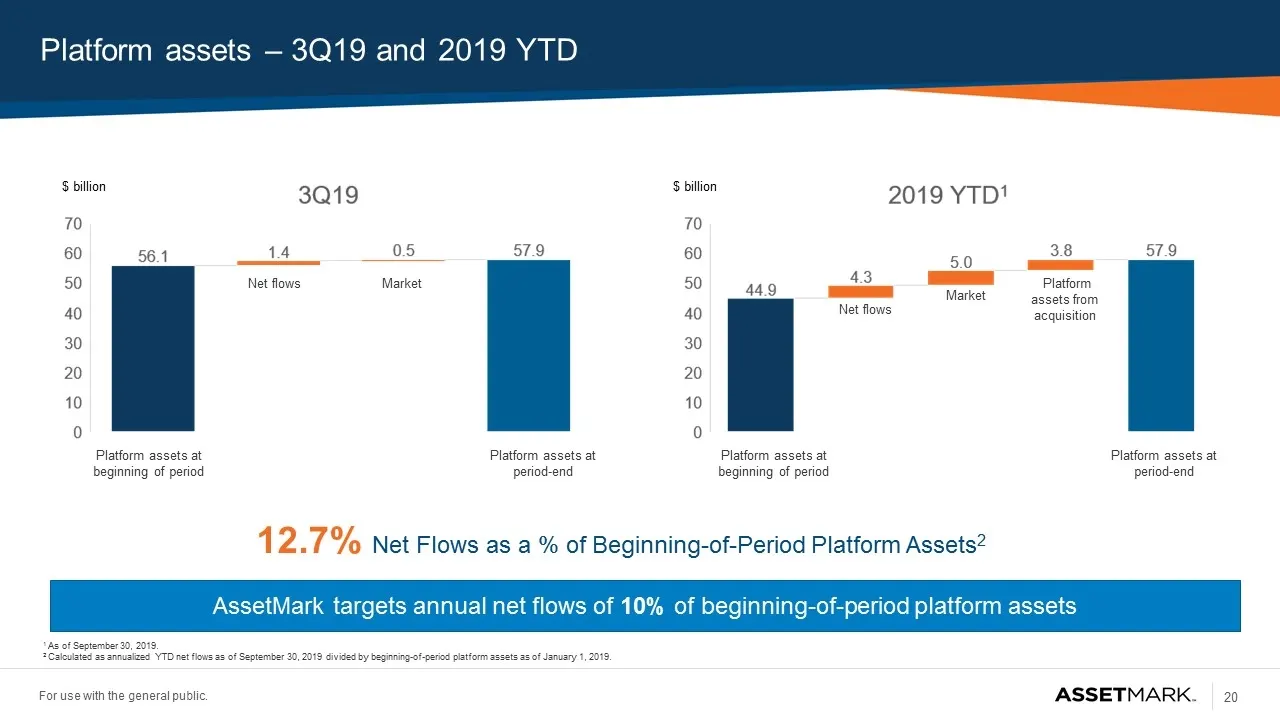
Platform assets – 3Q19 and 2019 YTD $ billion 12.7% Net Flows as a % of Beginning-of-Period Platform Assets2 $ billion Platform assets at beginning of period Net flows Market Platform assets at period-end Platform assets at beginning of period Net flows Market Platform assets from acquisition Platfo
Slide 21: Third quarter results highlighted by strong top and bottom line growth
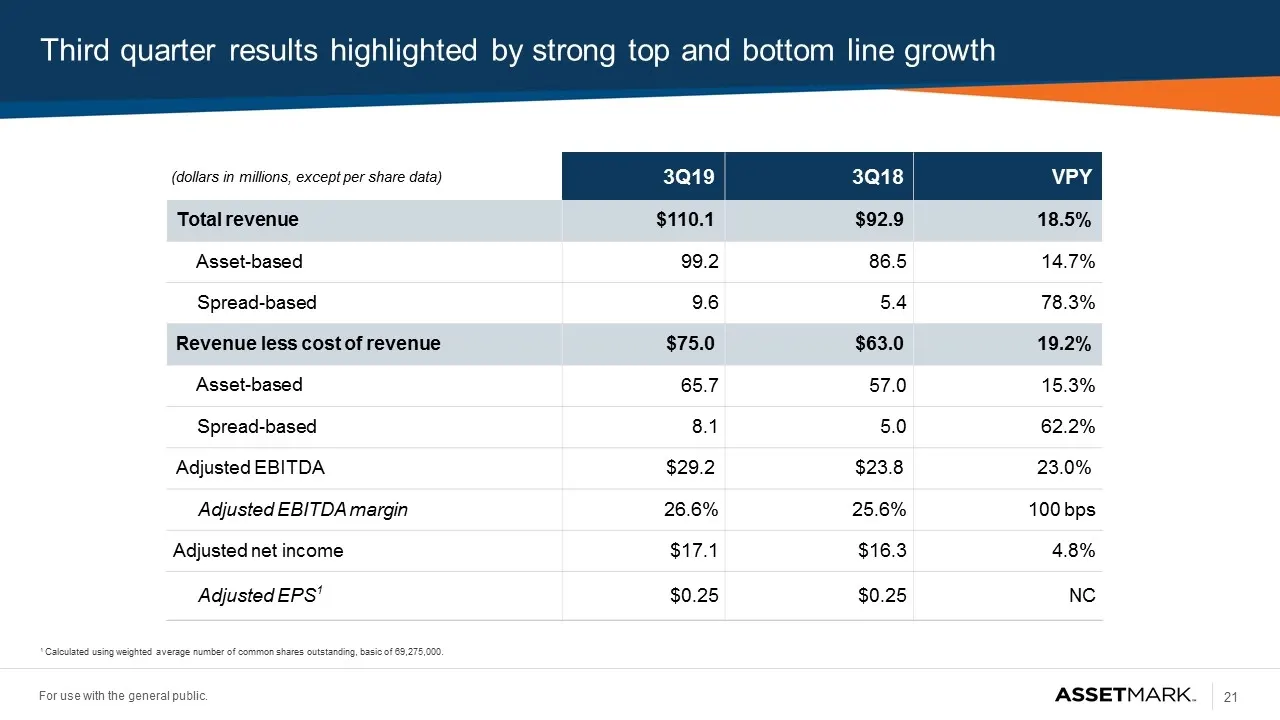
Third quarter results highlighted by strong top and bottom line growth (dollars in millions, except per share data) 3Q19 3Q18 VPY Total revenue $110.1 $92.9 18.5% Asset-based 99.2 86.5 14.7% Spread-based 9.6 5.4 78.3% Revenue less cost of revenue $75.0 $63.0 19.2% Asset-based 65.7 57.0 15.3% Spread-
Slide 22: 2020 expectations
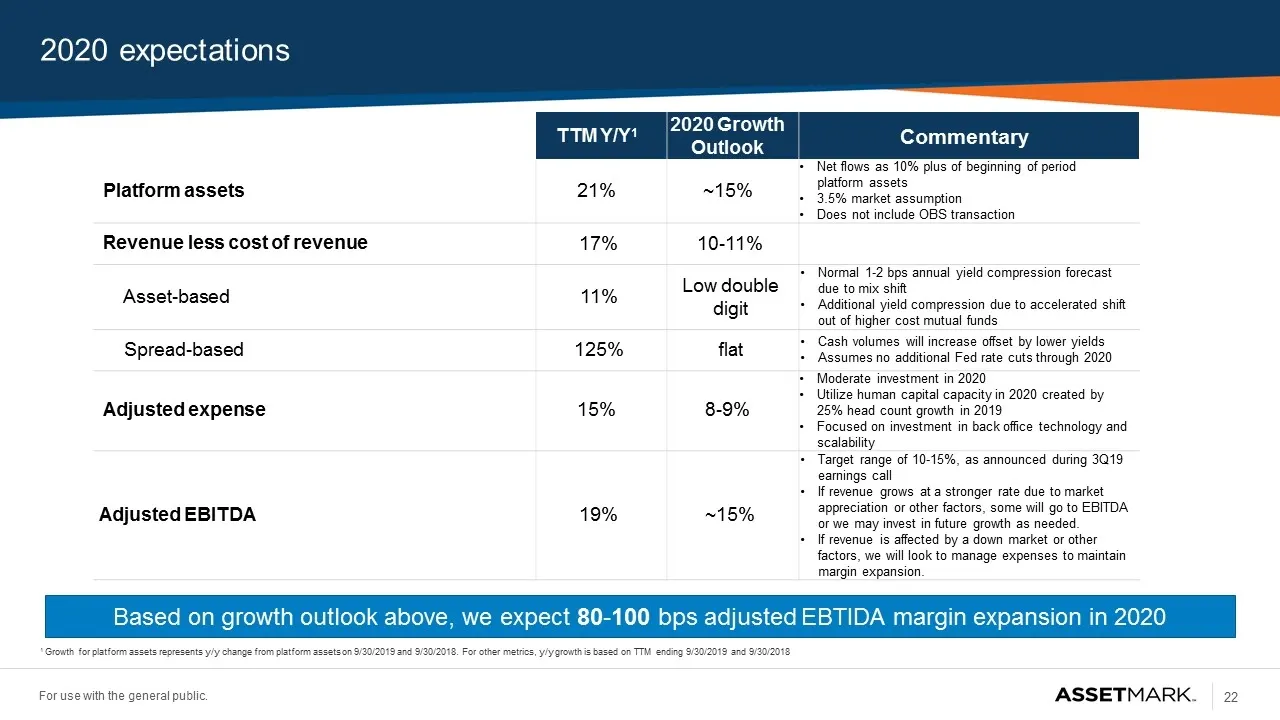
2020 expectations TTM Y/Y1 2020 Growth Outlook Commentary Platform assets 21% ~15% Net flows as 10% plus of beginning of period platform assets 3.5% market assumption Does not include OBS transaction Revenue less cost of revenue 17% 10-11% Asset-based 11% Low double digit Normal 1-2 bps annual yield
Slide 23: In April, AssetMark closed its acquisition of Global Financial Private Capital (GFPC)
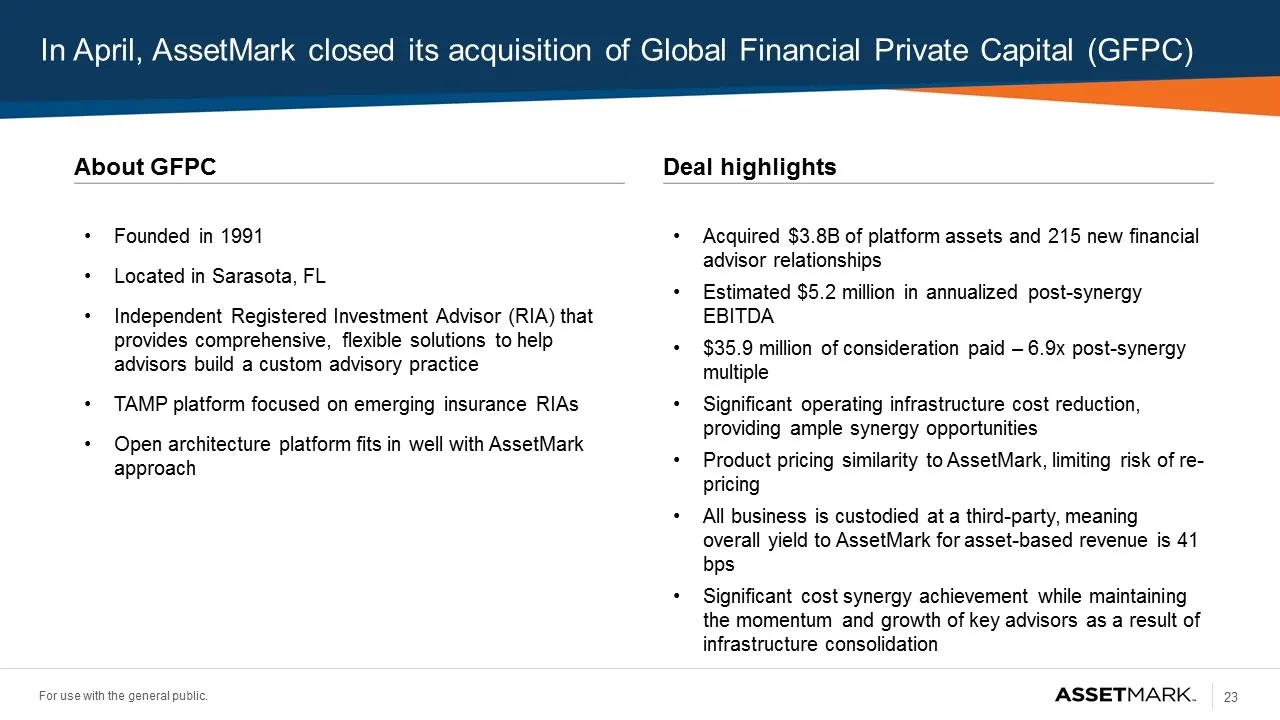
In April, AssetMark closed its acquisition of Global Financial Private Capital (GFPC) About GFPC Deal highlights Acquired $3.8B of platform assets and 215 new financial advisor relationships Estimated $5.2 million in annualized post-synergy EBITDA $35.9 million of consideration paid – 6.9x post-syne
Slide 24: In September, AssetMark announced its planned acquisition of OBS Financial
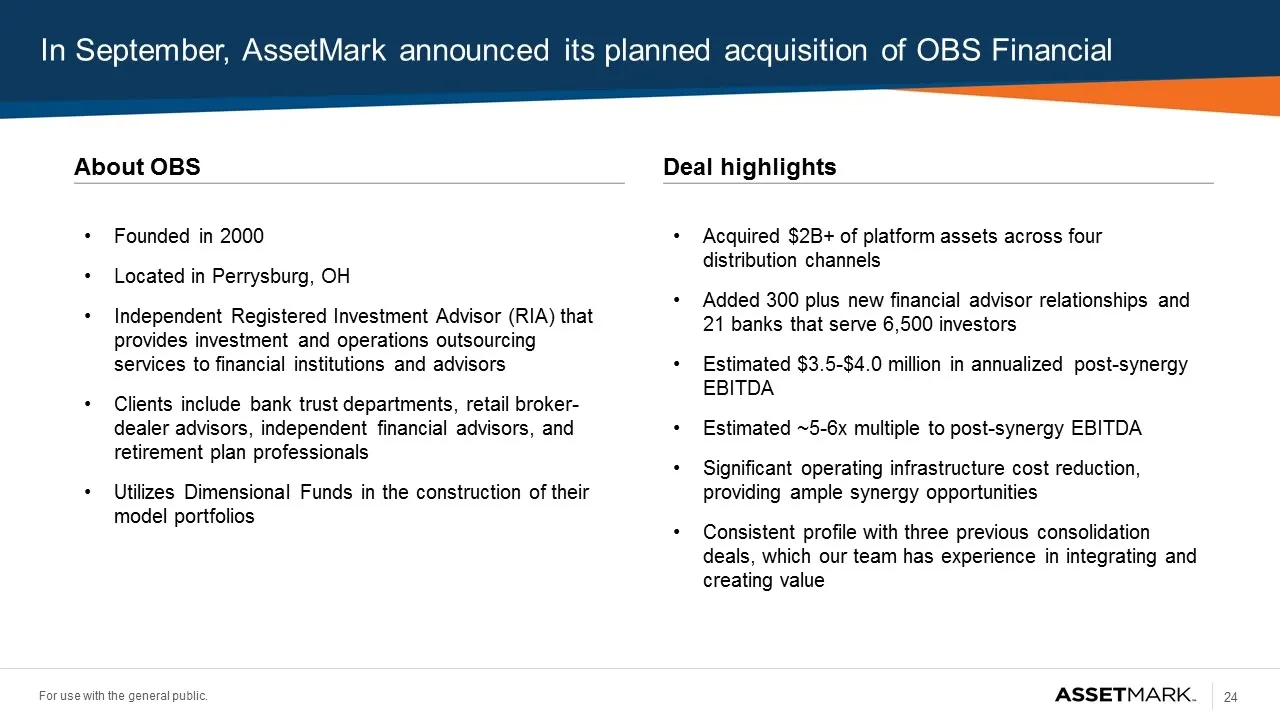
In September, AssetMark announced its planned acquisition of OBS Financial About OBS Deal highlights Acquired $2B+ of platform assets across four distribution channels Added 300 plus new financial advisor relationships and 21 banks that serve 6,500 investors Estimated $3.5-$4.0 million in annualized
Slide 25: Contents
Contents Opportunity Highlights Market Overview Company Overview Financial Overview Appendix
Slide 26: Adjusted expense reconciliation
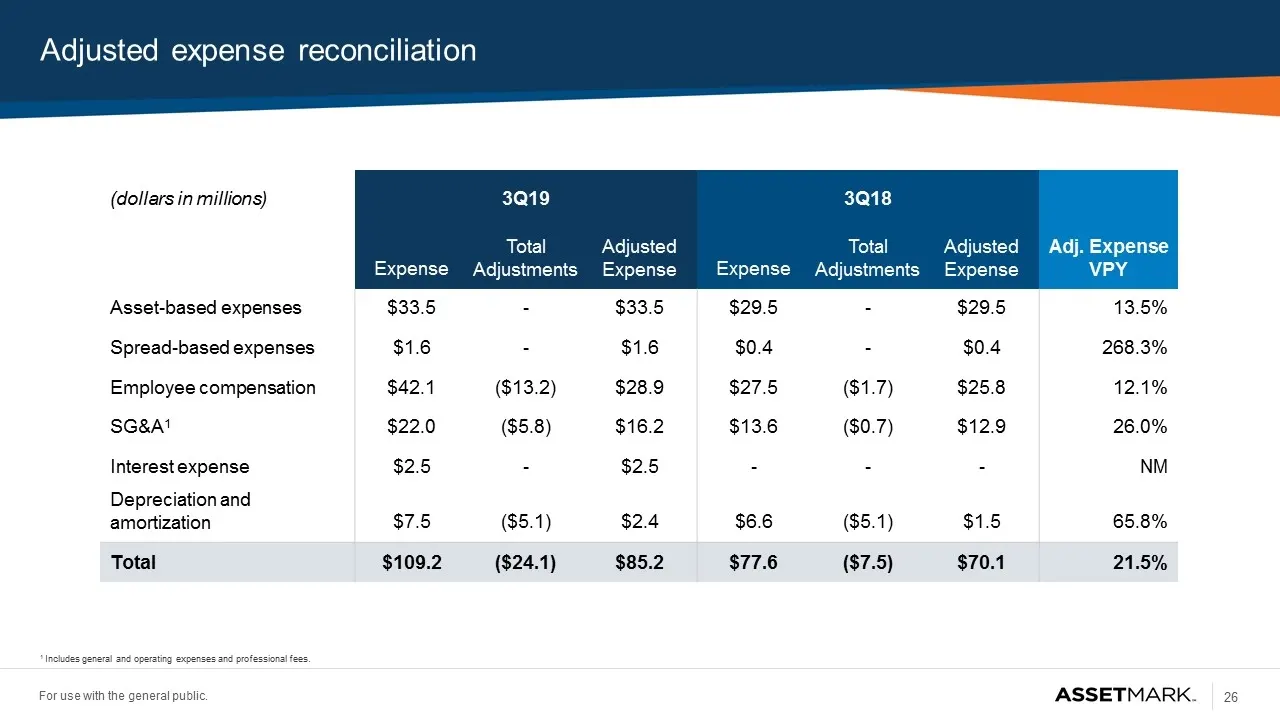
Adjusted expense reconciliation (dollars in millions) 3Q19 3Q18 Adj. Expense VPY Expense Total Adjustments Adjusted Expense Expense Total Adjustments Adjusted Expense Asset-based expenses $33.5 - $33.5 $29.5 - $29.5 13.5% Spread-based expenses $1.6 - $1.6 $0.4 - $0.4 268.3% Employee compensation $42
Slide 27: 3Q19 net yield calculation
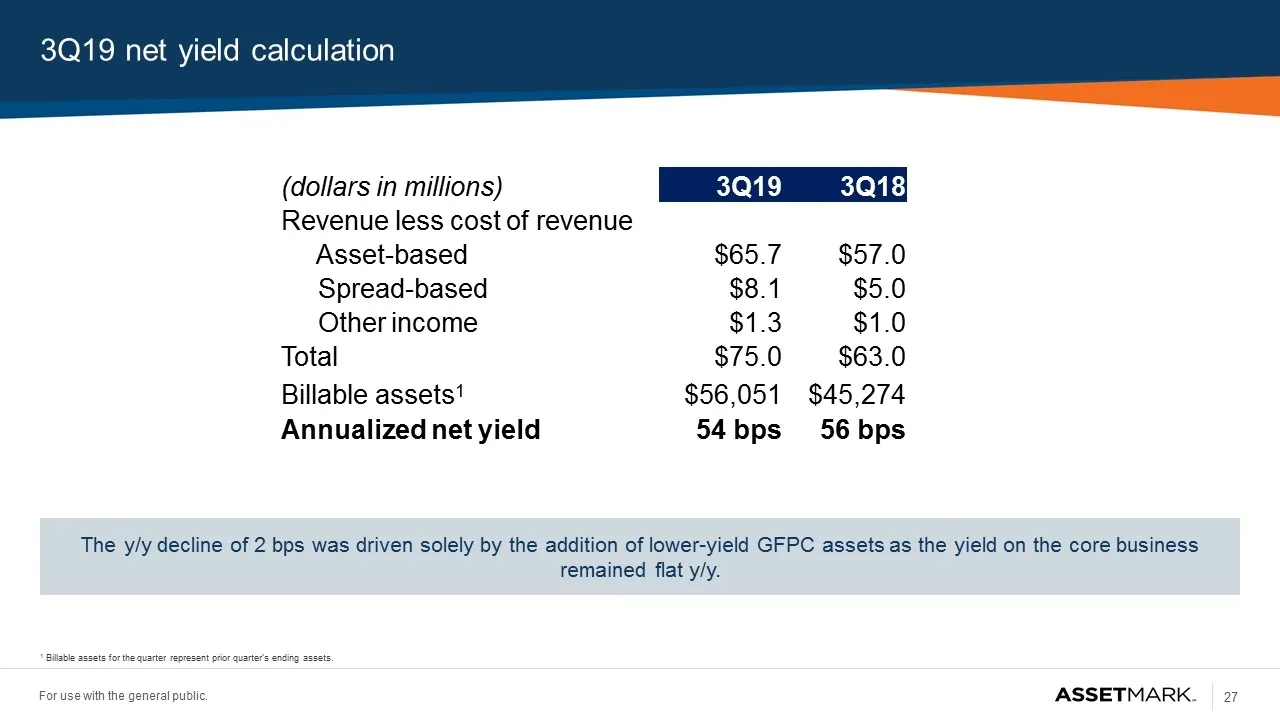
3Q19 net yield calculation The y/y decline of 2 bps was driven solely by the addition of lower-yield GFPC assets as the yield on the core business remained flat y/y. 1 Billable assets for the quarter represent prior quarter’s ending assets. (dollars in millions) 3Q19 3Q18 Revenue less cost of revenu
Slide 28: Adjusted EBITDA reconciliation – nine months ended September 30, 2019
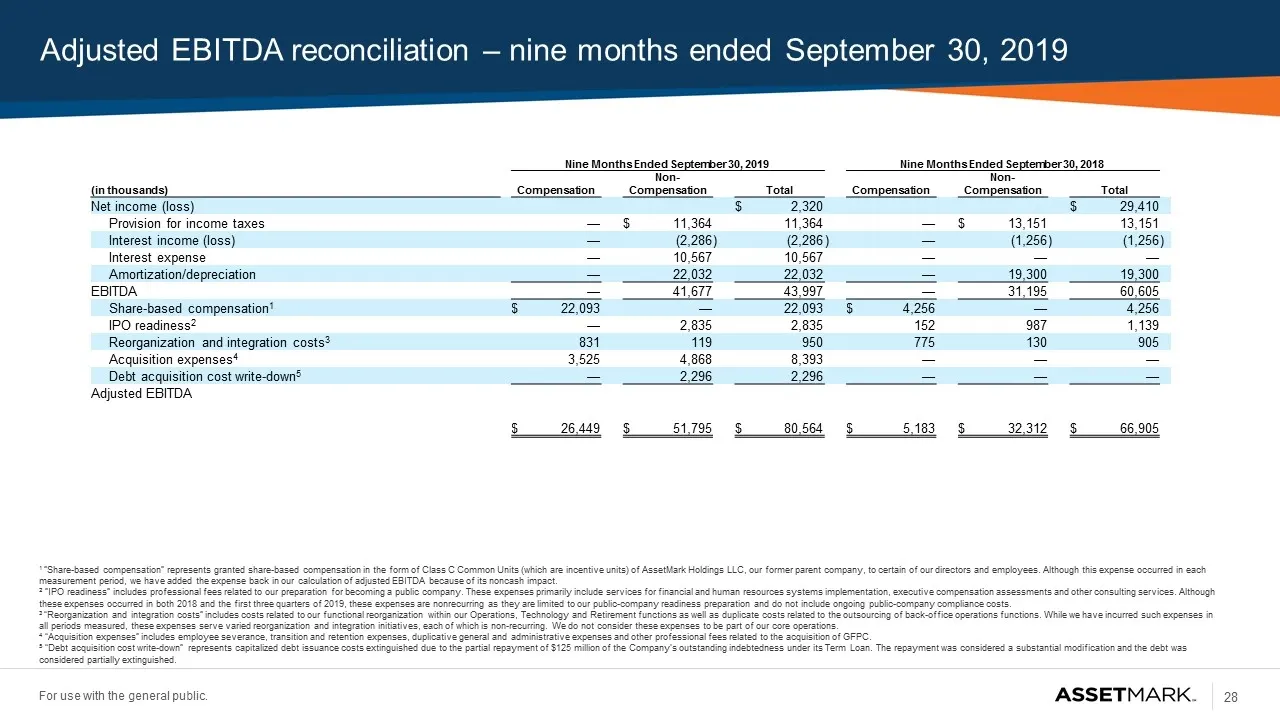
Adjusted EBITDA reconciliation – nine months ended September 30, 2019 Nine Months Ended September 30, 2019 Nine Months Ended September 30, 2018 (in thousands) Compensation Non-Compensation Total Compensation Non-Compensation Total Net income (loss) $ 2,320 $ 29,410 Provision for income taxes — $ 11,
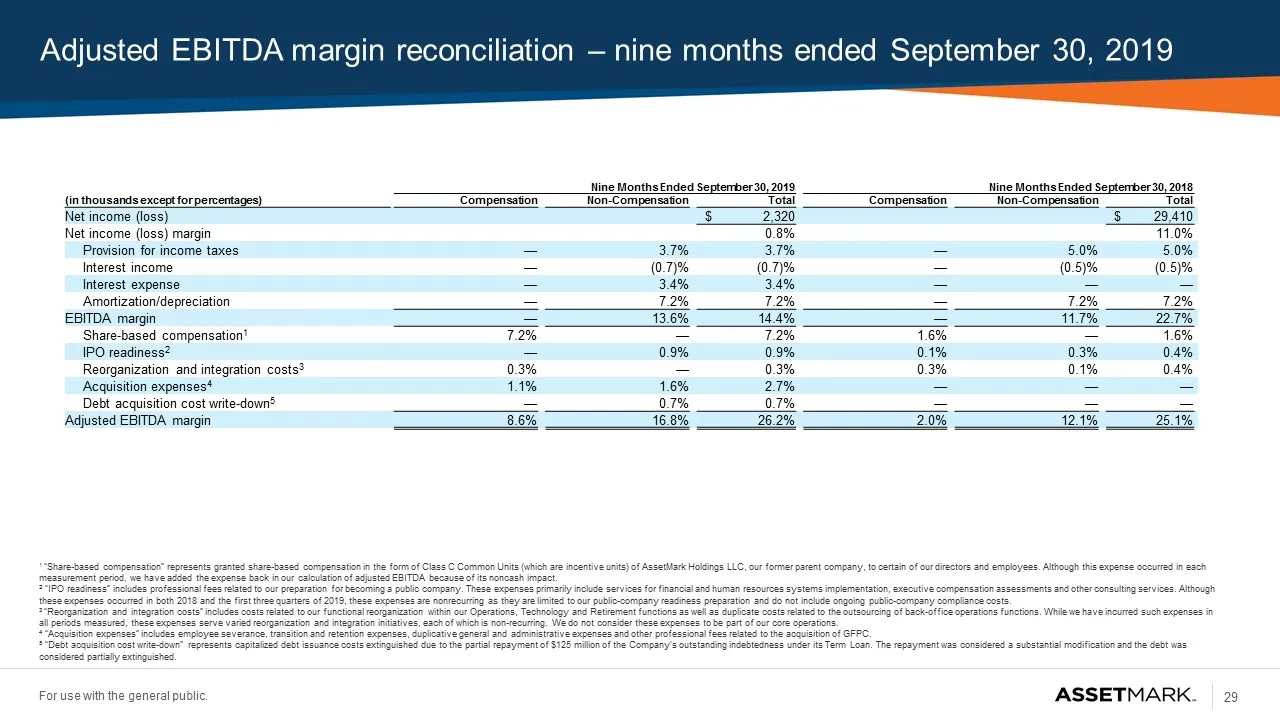
Slide 29: Adjusted EBITDA margin reconciliation – nine months ended September 30, 2019
Adjusted EBITDA margin reconciliation – nine months ended September 30, 2019 Nine Months Ended September 30, 2019 Nine Months Ended September 30, 2018 (in thousands except for percentages) Compensation Non-Compensation Total Compensation Non-Compensation Total Net income (loss) $ 2,320 $ 29,410 Net
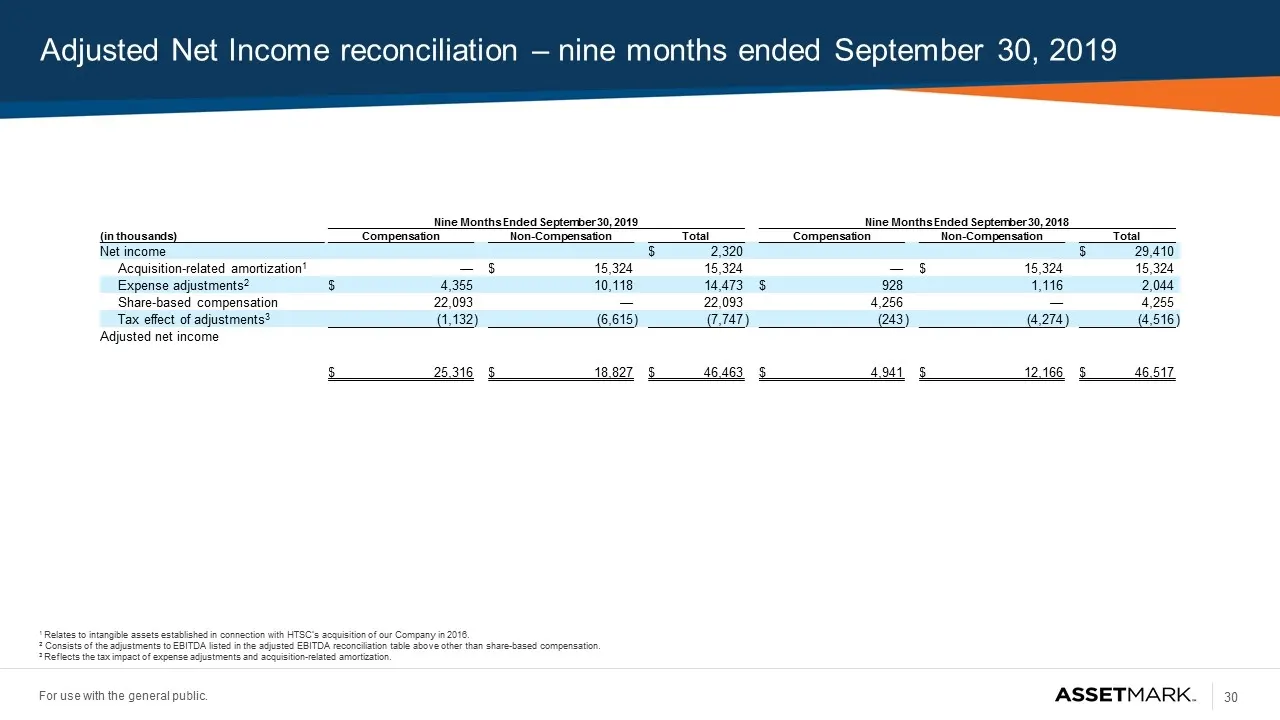
Slide 30: Adjusted Net Income reconciliation – nine months ended September 30, 2019
Adjusted Net Income reconciliation – nine months ended September 30, 2019 Nine Months Ended September 30, 2019 Nine Months Ended September 30, 2018 (in thousands) Compensation Non-Compensation Total Compensation Non-Compensation Total Net income $ 2,320 $ 29,410 Acquisition-related amortization1 — $
Source: SEC EDGAR · 8-K filed Dec 5, 2019
More decks from AssetMark Financial Holdings Inc
 Conference Presentation (April 2026)18 slides · April 2026
 EA Webinar (April 2026)15 slides · April 2026
 AssetMark GOLDFORUM 202626 slides · March 2026
 Investor Presentation (March 2026)26 slides · March 2026
 AssetMark Platinum Summit 20247 slides · 2024
 Investor Presentation (December 2023)31 slides · Dec 1, 2023