MITIE Group PLC · LSE:MTO
MITIE — FY2013 Earnings Presentation
58 slides from MITIE's earnings presentation, May 20, 2013
Slide 1: Full year results presentation
MITIE Group PLC The strategic outsourcing company Excellent progress through a focus on markets that offer organic growth, long-term contracts and improved margins Full year results presentation 20 May 2013

Slide 2: Ruby McGregor-Smith CBE, Chief Executive
Ruby McGregor-Smith CBE Chief Executive MITIE Group PLC 2
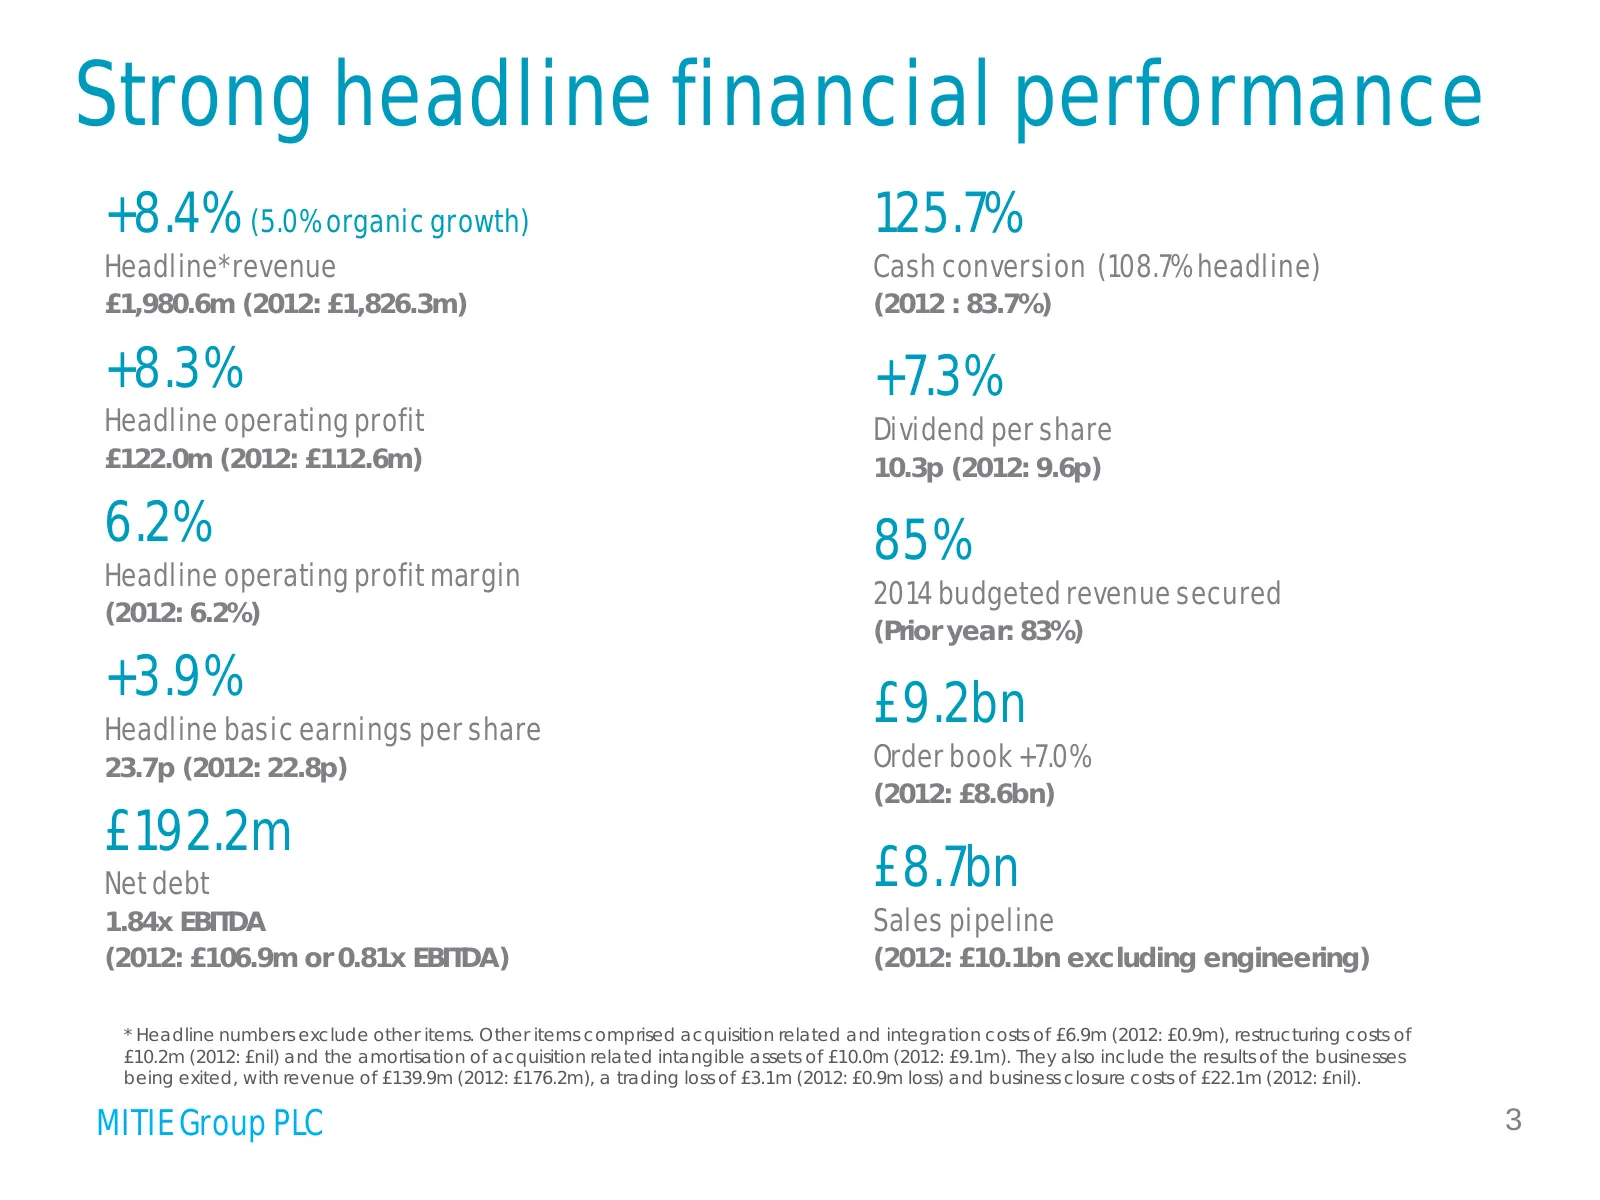
Slide 3: Strong headline financial performance
Strong headline financial performance +8.4% (5.0% organic growth) 125.7% Headline* revenue Cash conversion (108.7% headline) £1,980.6m (2012: £1,826.3m) (2012 : 83.7%) +8.3% +7.3% Headline operating profit Dividend per share £122.0m (2012: £112.6m) 10.3p (2012: 9.6p) 6.2% 85% Headline operating prof
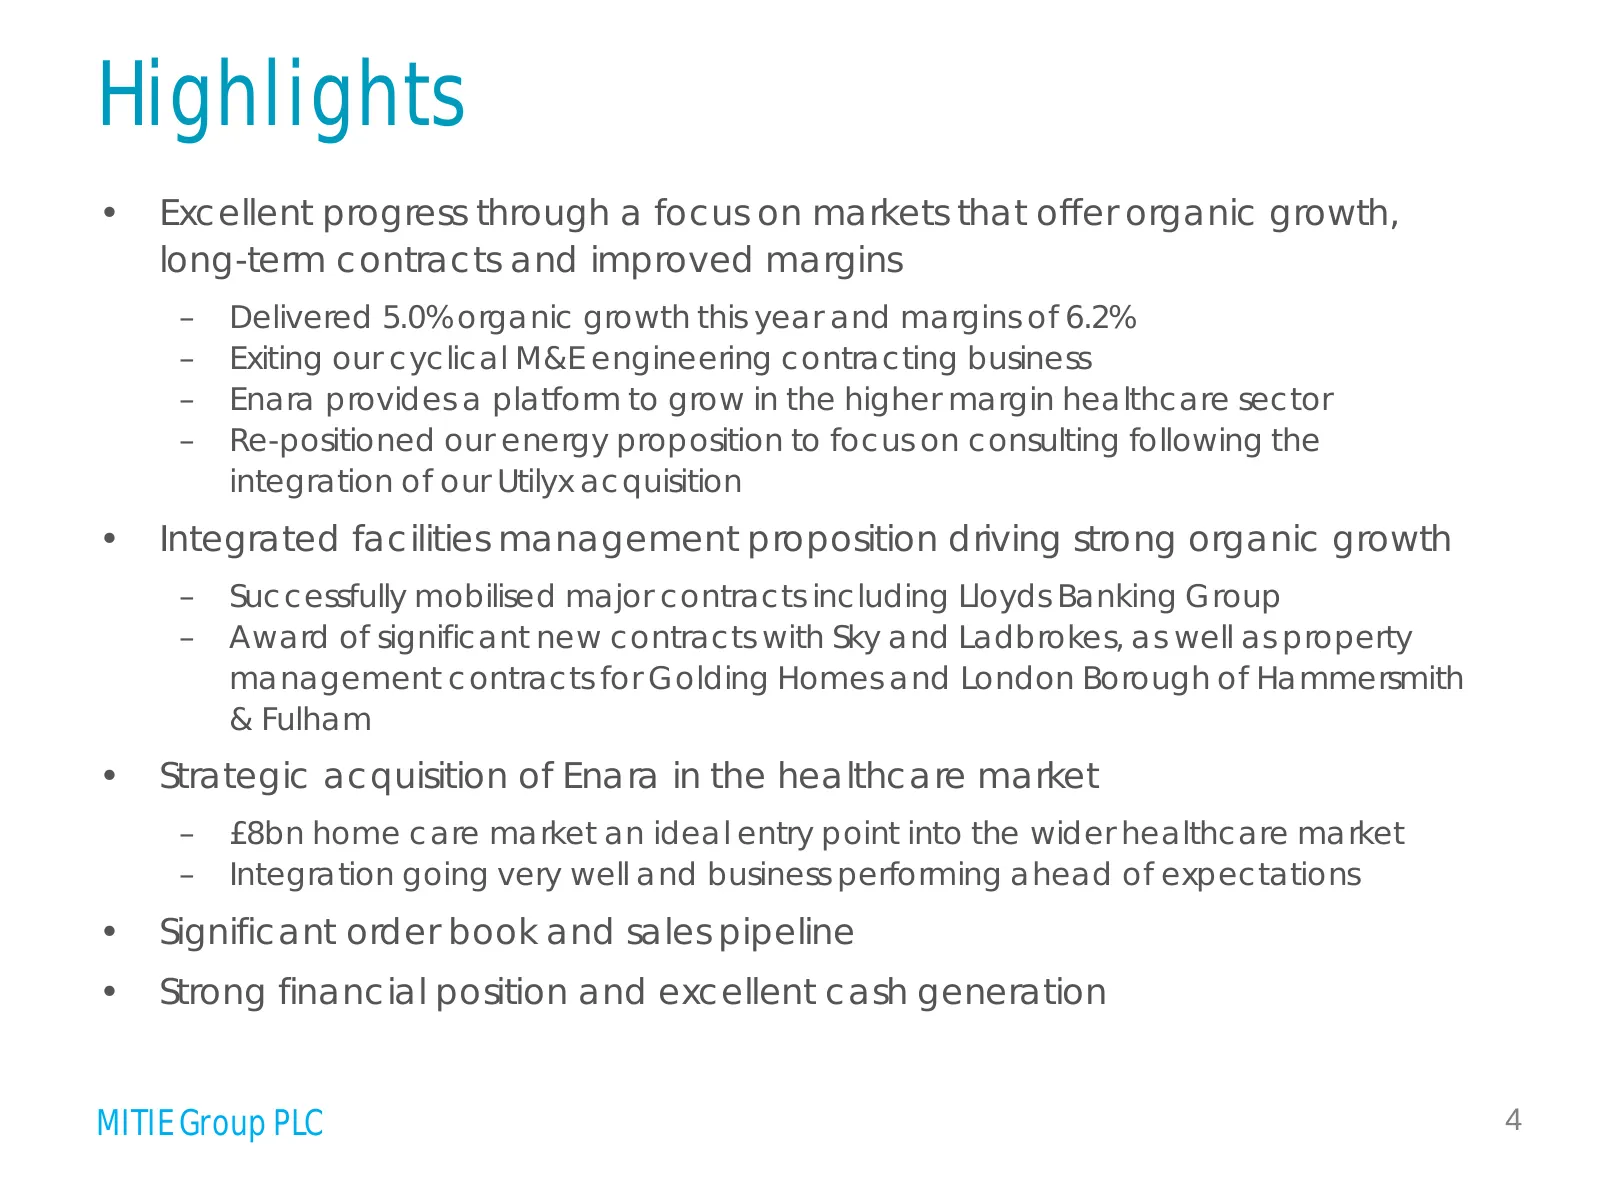
Slide 4: Highlights
Highlights • Excellent progress through a focus on markets that offer organic growth, long-term contracts and improved margins – Delivered 5.0% organic growth this year and margins of 6.2% – Exiting our cyclical M&E engineering contracting business – Enara provides a platform to grow in the higher m
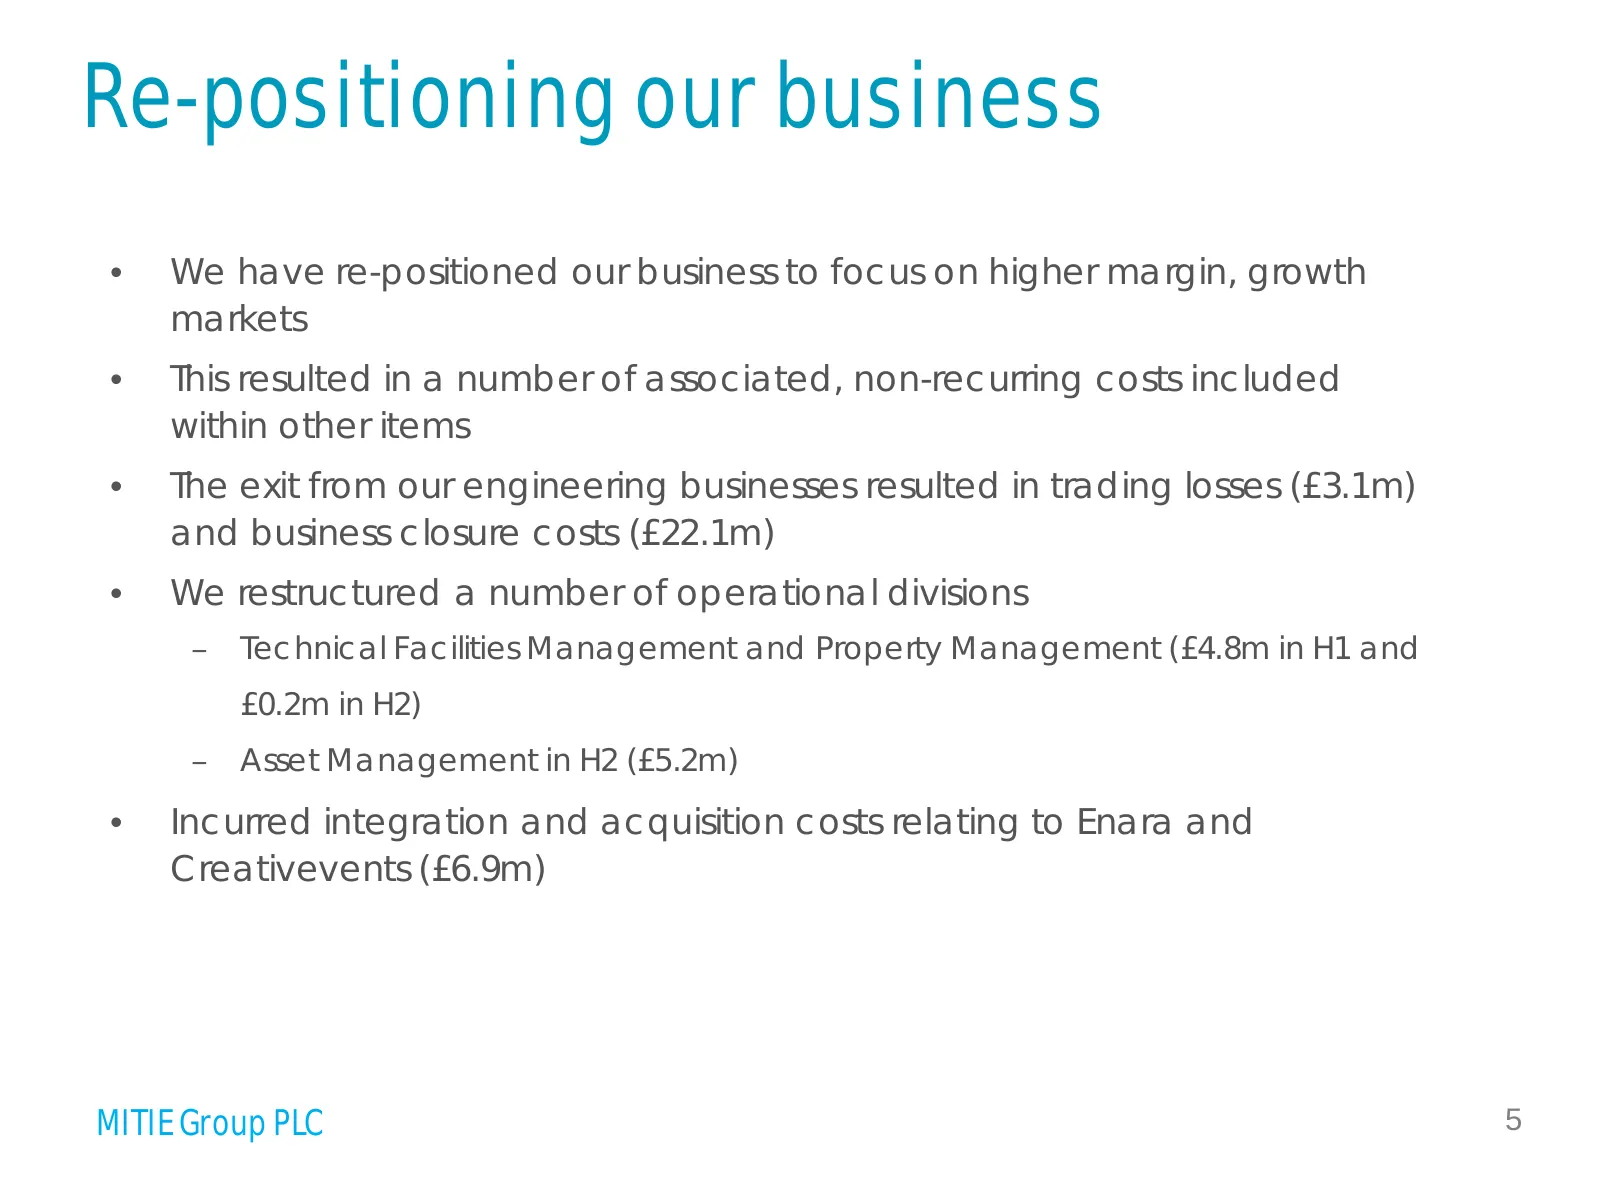
Slide 5: Re-positioning our business
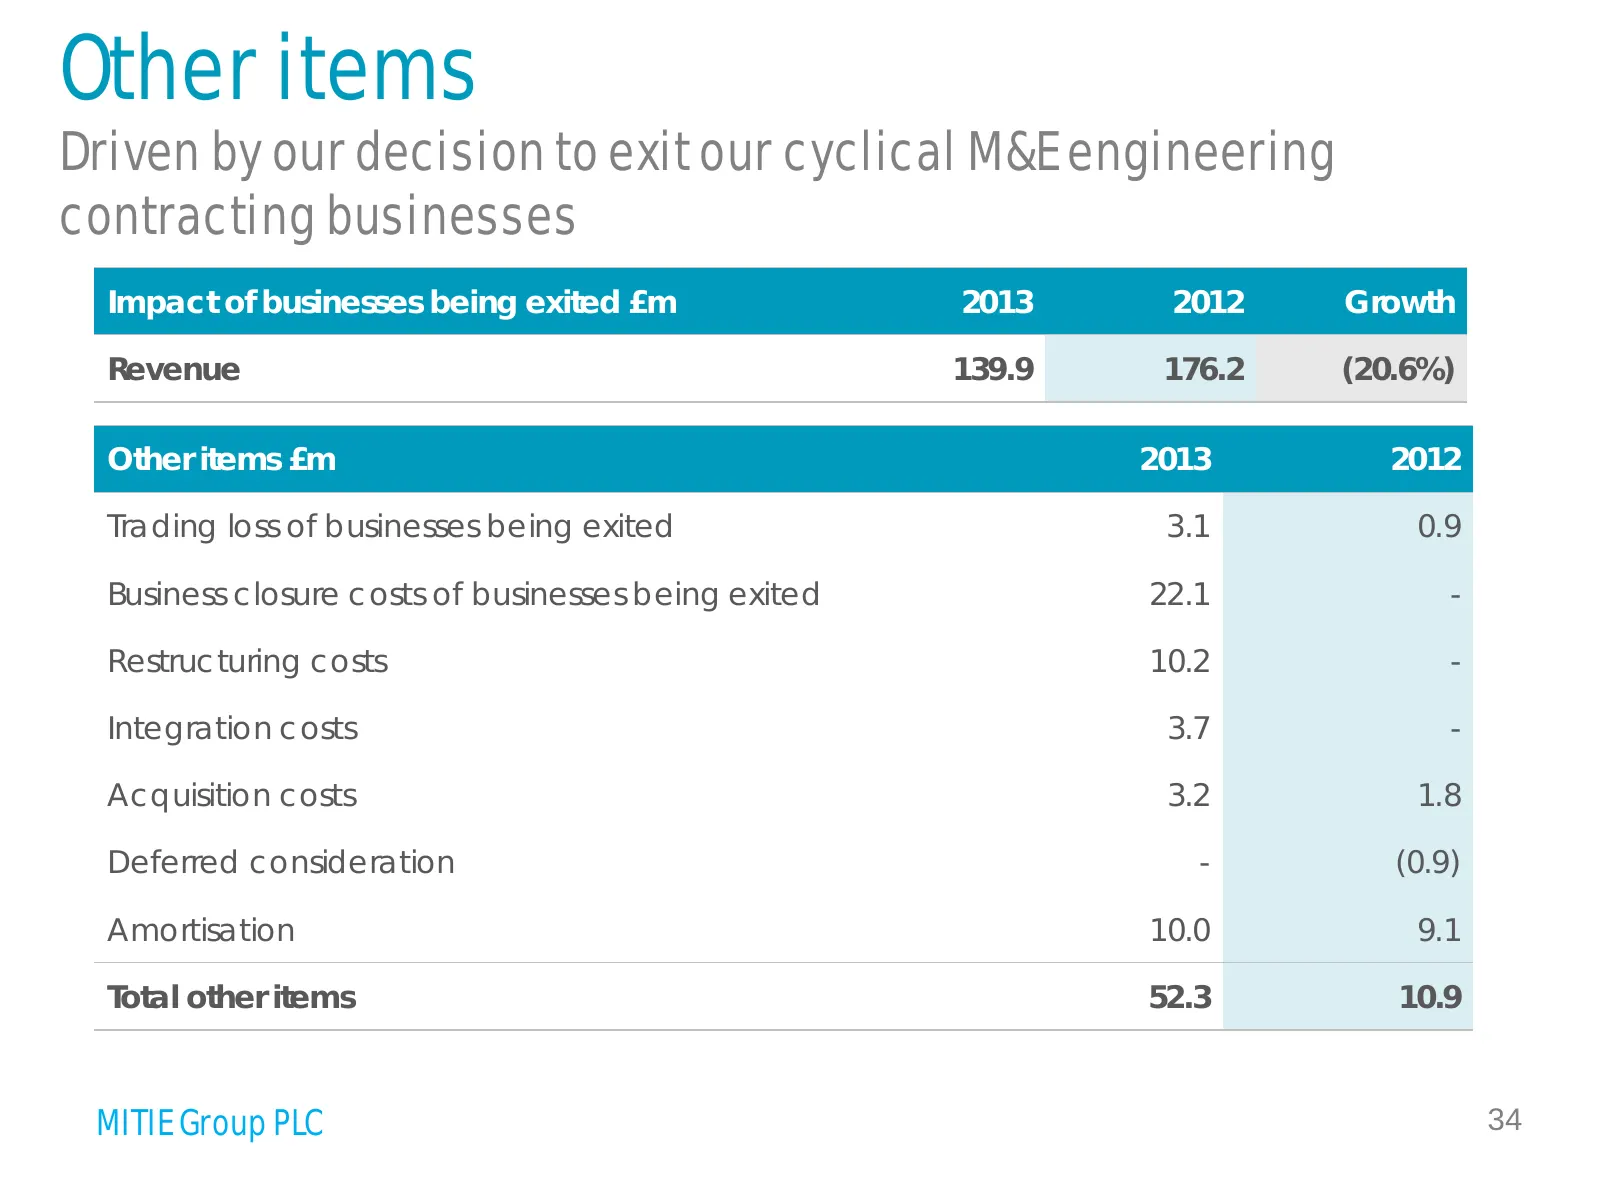
Re-positioning our business • We have re-positioned our business to focus on higher margin, growth markets • This resulted in a number of associated, non-recurring costs included within other items • The exit from our engineering businesses resulted in trading losses (£3.1m) and business closure cos
Slide 6: Exiting our M&E electrical engineering contracting businesses
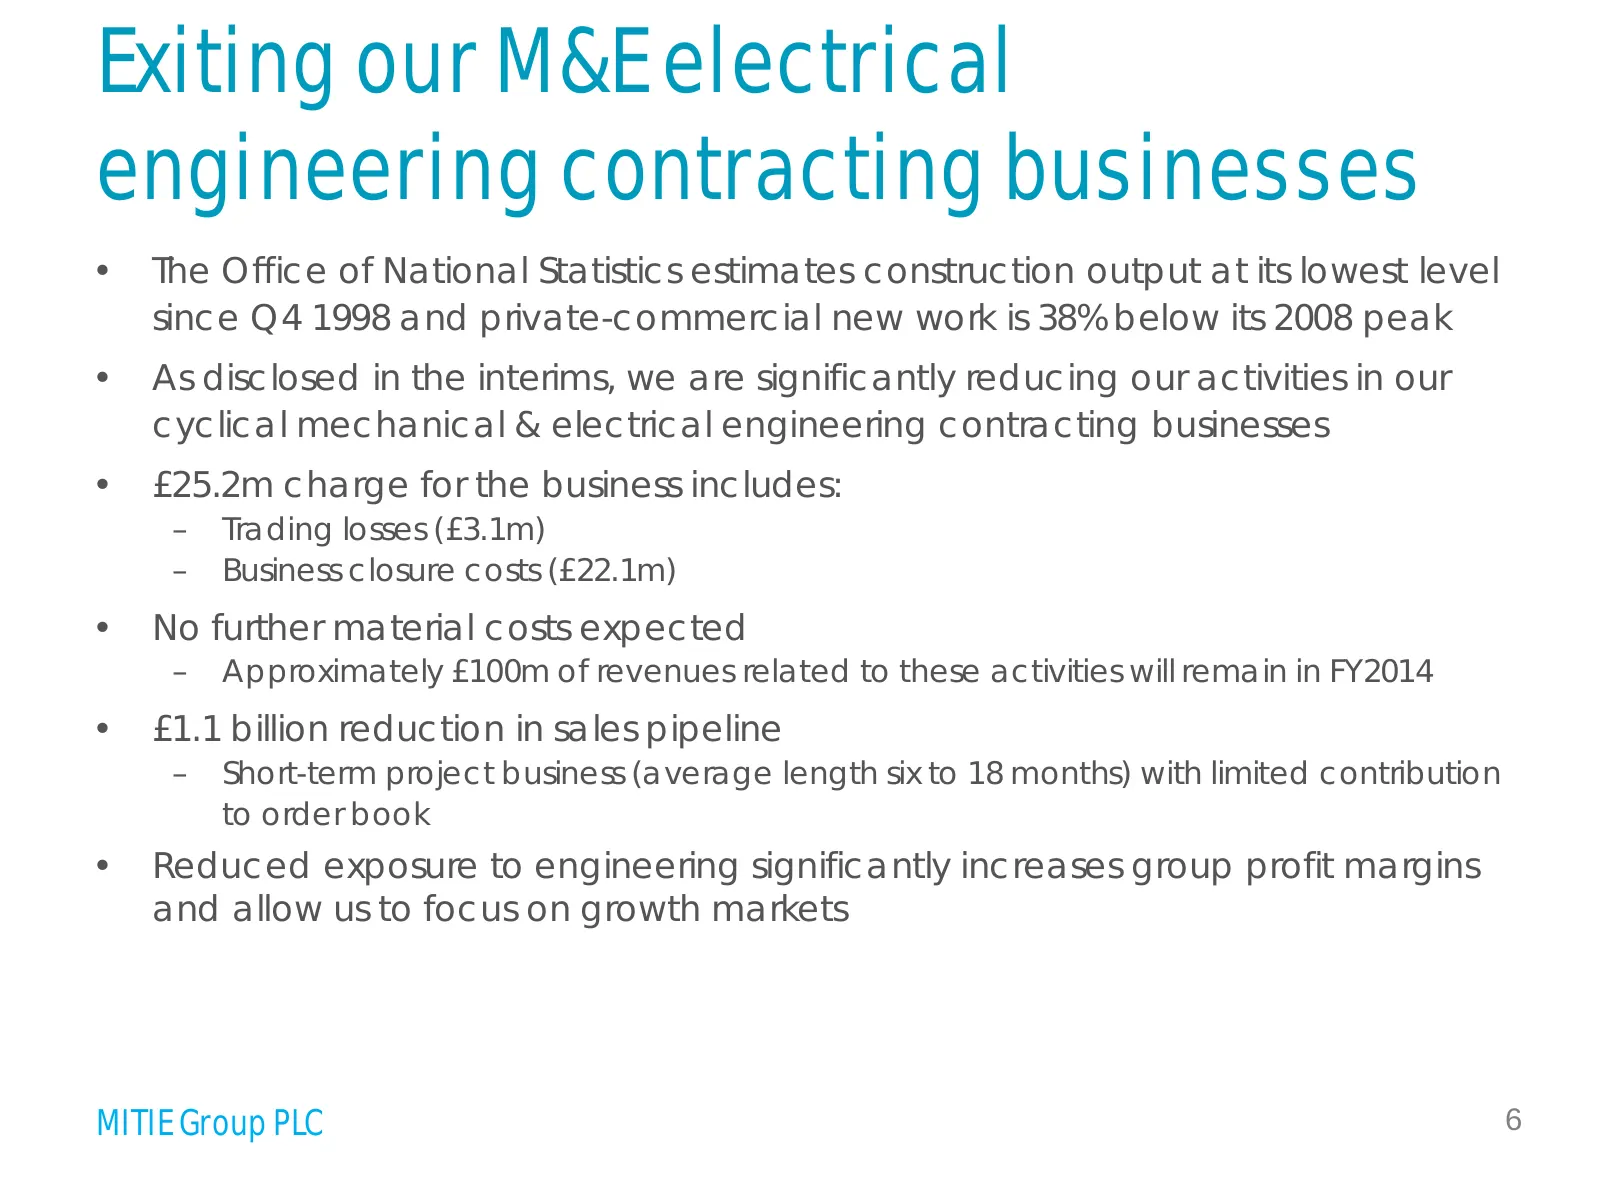
Exiting our M&E electrical engineering contracting businesses • The Office of National Statistics estimates construction output at its lowest level since Q4 1998 and private-commercial new work is 38% below its 2008 peak • As disclosed in the interims, we are significantly reducing our activities in
Slide 7: UK construction market has contracted
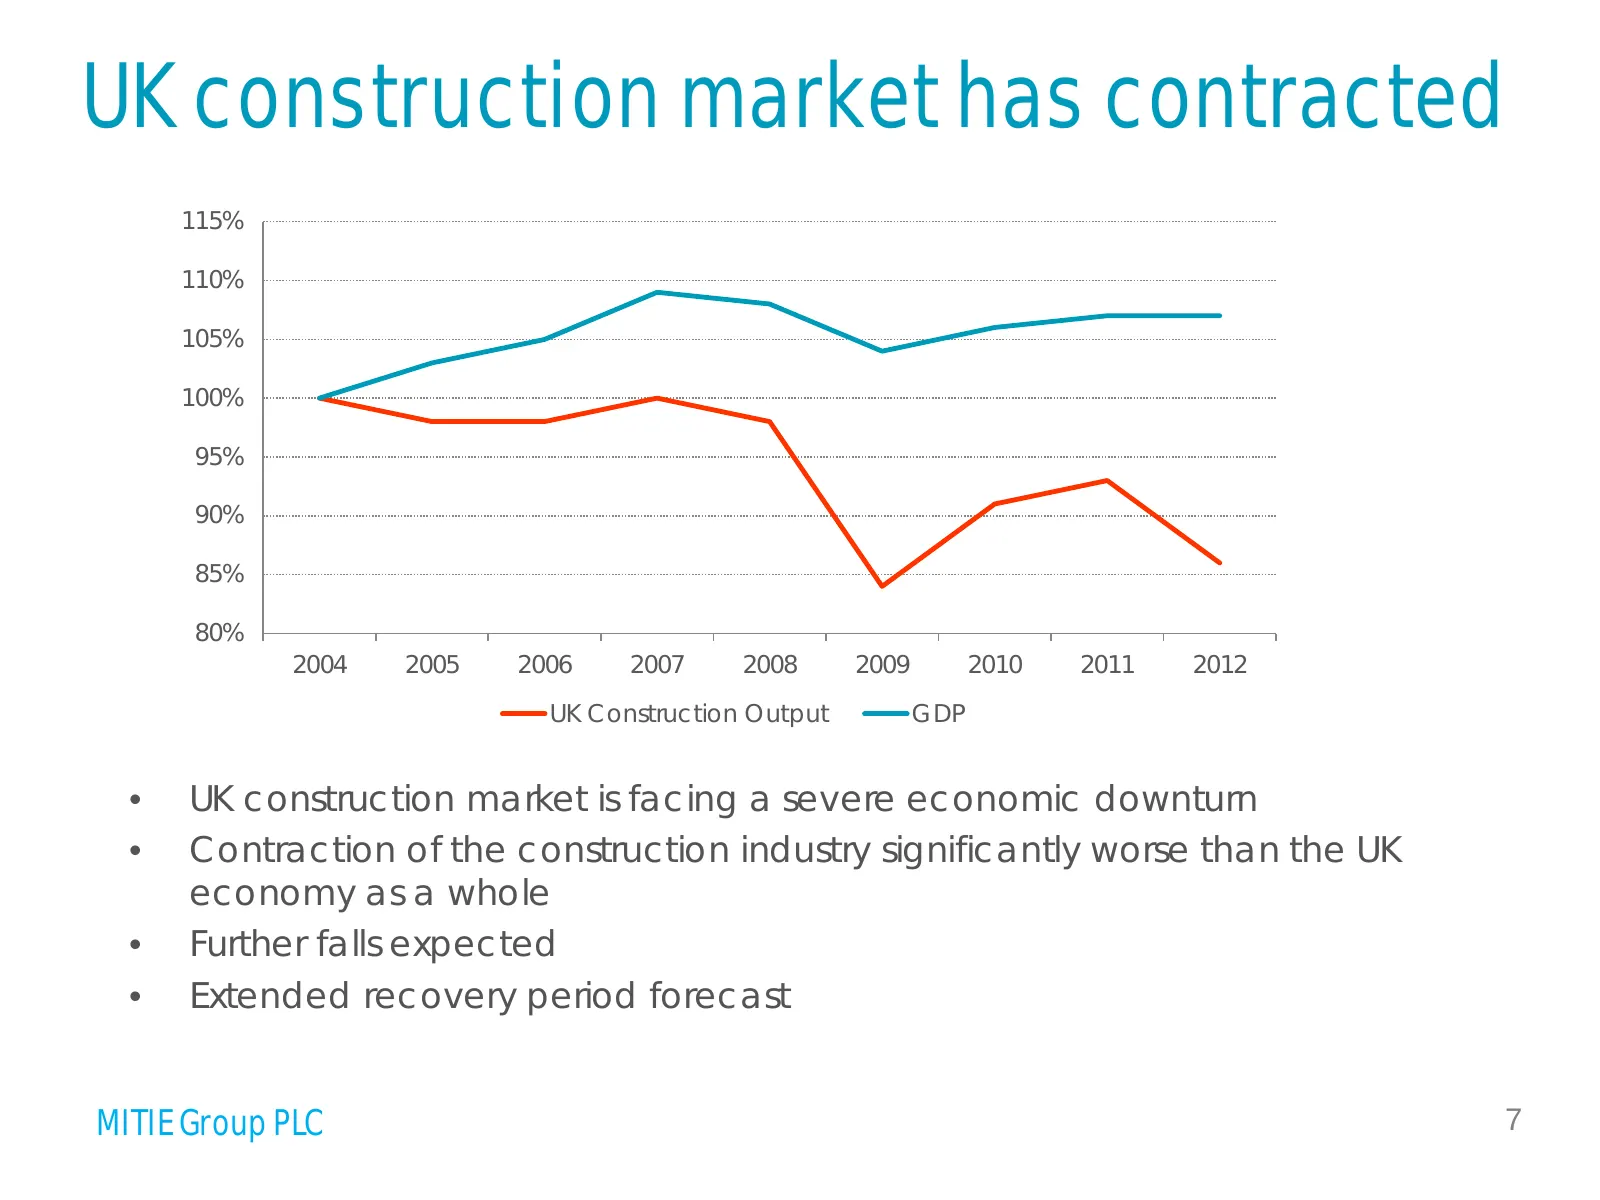
UK construction market has contracted 115% 110% 105% 100% 95% 90% 85% 80% 2004 2005 2006 2007 2008 2009 2010 2011 2012 UK Construction Output GDP • UK construction market is facing a severe economic downturn • Contraction of the construction industry significantly worse than the UK economy as a whol
Slide 8: Reduced contribution of engineering
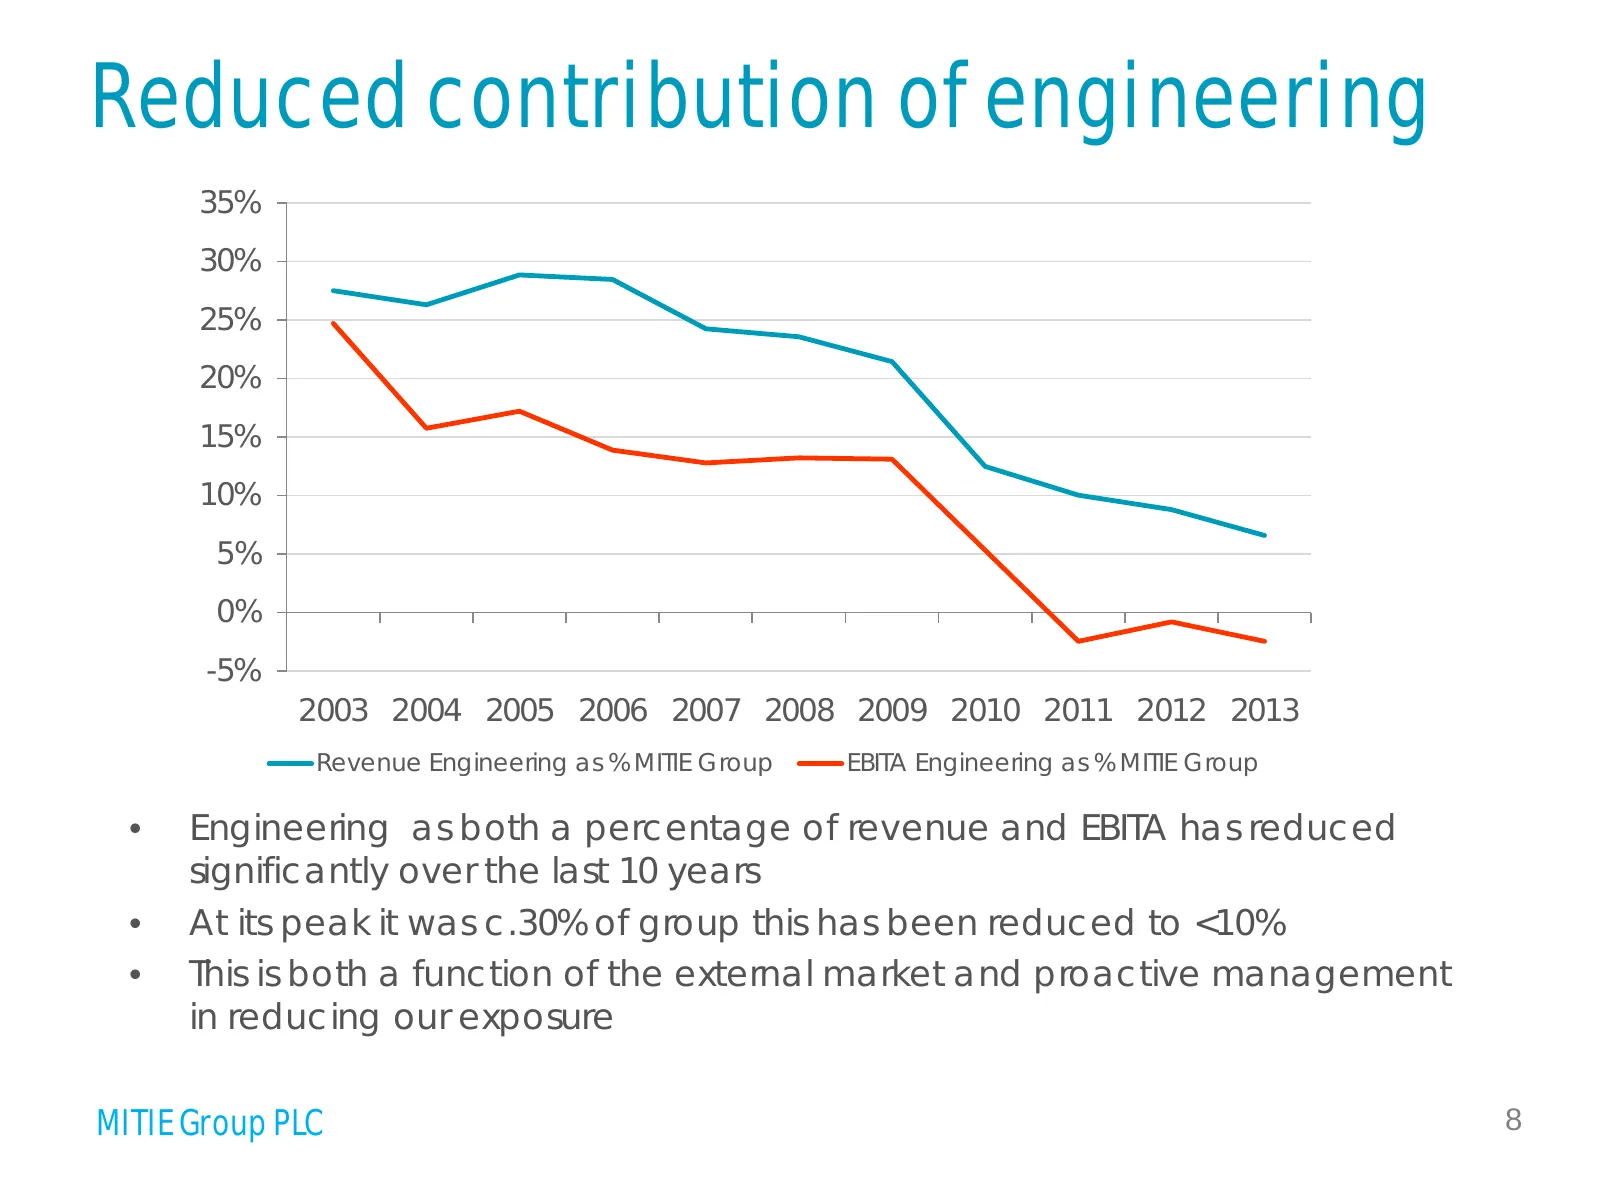
Reduced contribution of engineering 35% 30% 25% 20% 15% 10% 5% 0% -5% 2003 2004 2005 2006 2007 2008 2009 2010 2011 2012 2013 Revenue Engineering as % MITIE Group EBITA Engineering as % MITIE Group • Engineering as both a percentage of revenue and EBITA has reduced significantly over the last 10 year
Slide 9: Engineering dilutes group margins
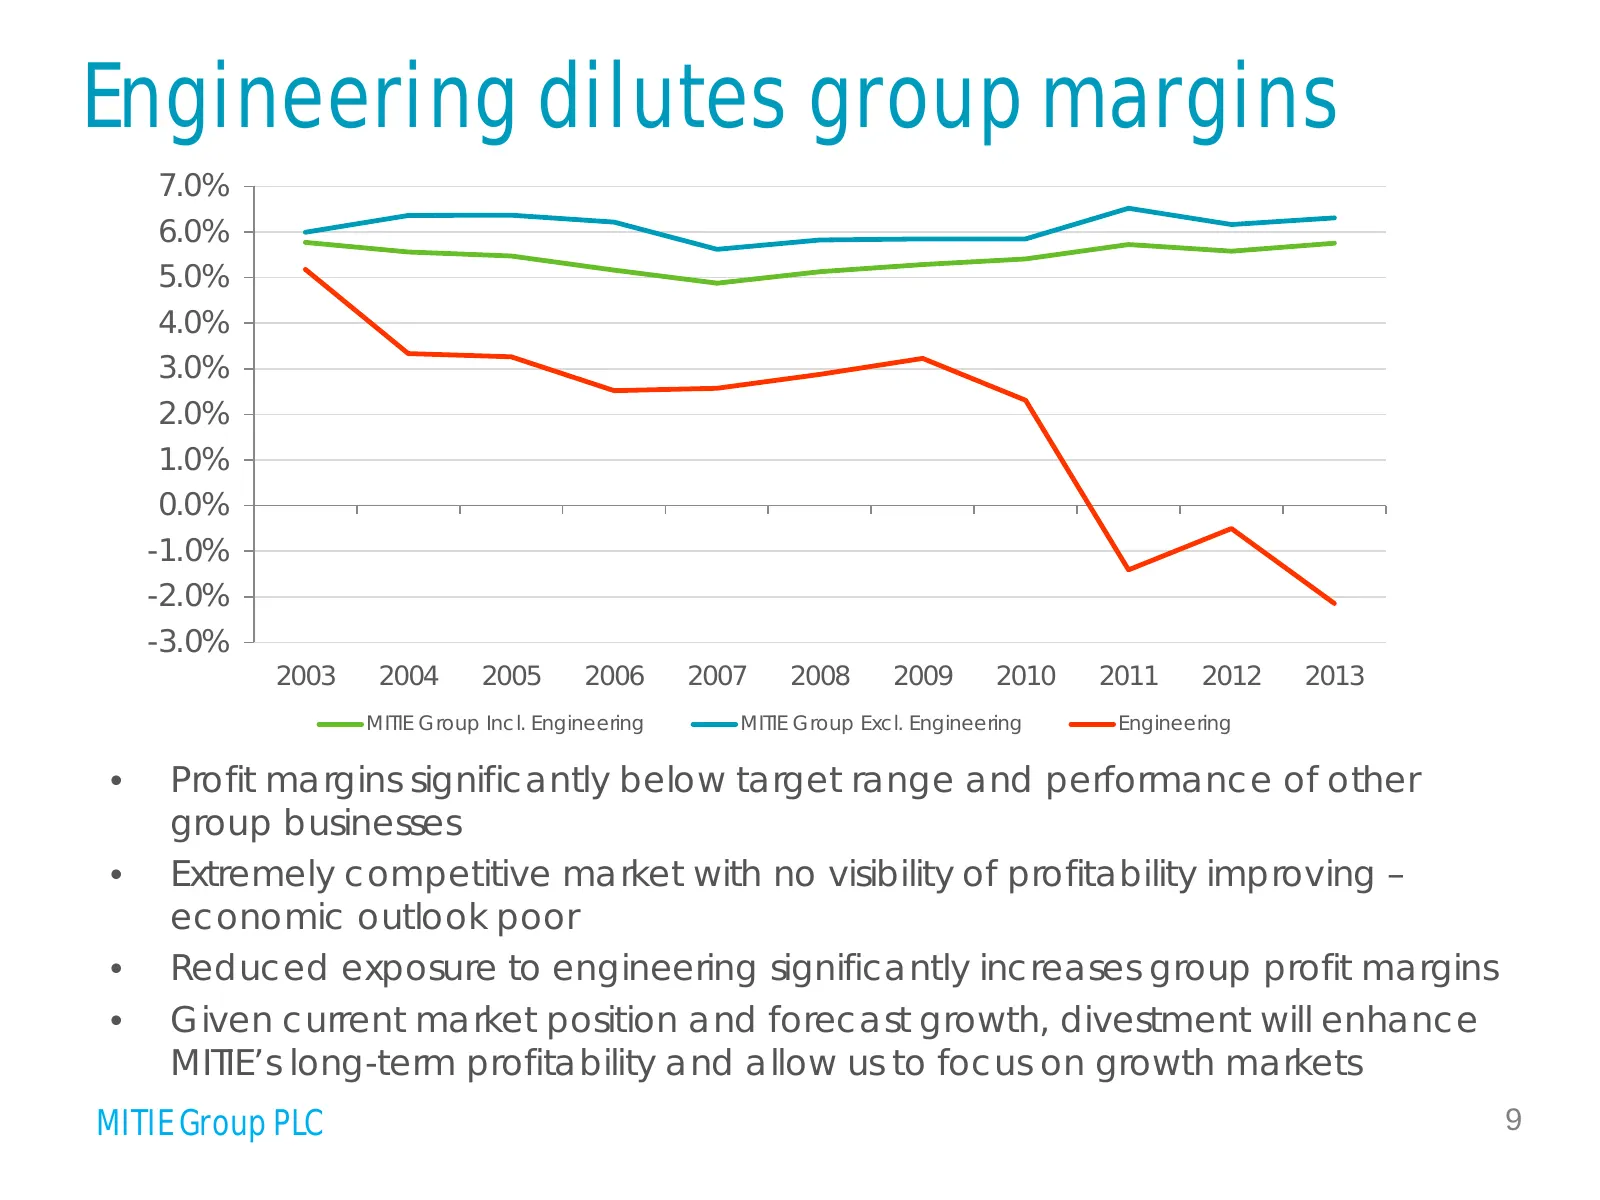
Engineering dilutes group margins 7.0% 6.0% 5.0% 4.0% 3.0% 2.0% 1.0% 0.0% -1.0% -2.0% -3.0% 2003 2004 2005 2006 2007 2008 2009 2010 2011 2012 2013 MITIE Group Incl. Engineering MITIE Group Excl. Engineering Engineering • Profit margins significantly below target range and performance of other group
Slide 10: Our new shape – focused on higher margin, growth markets
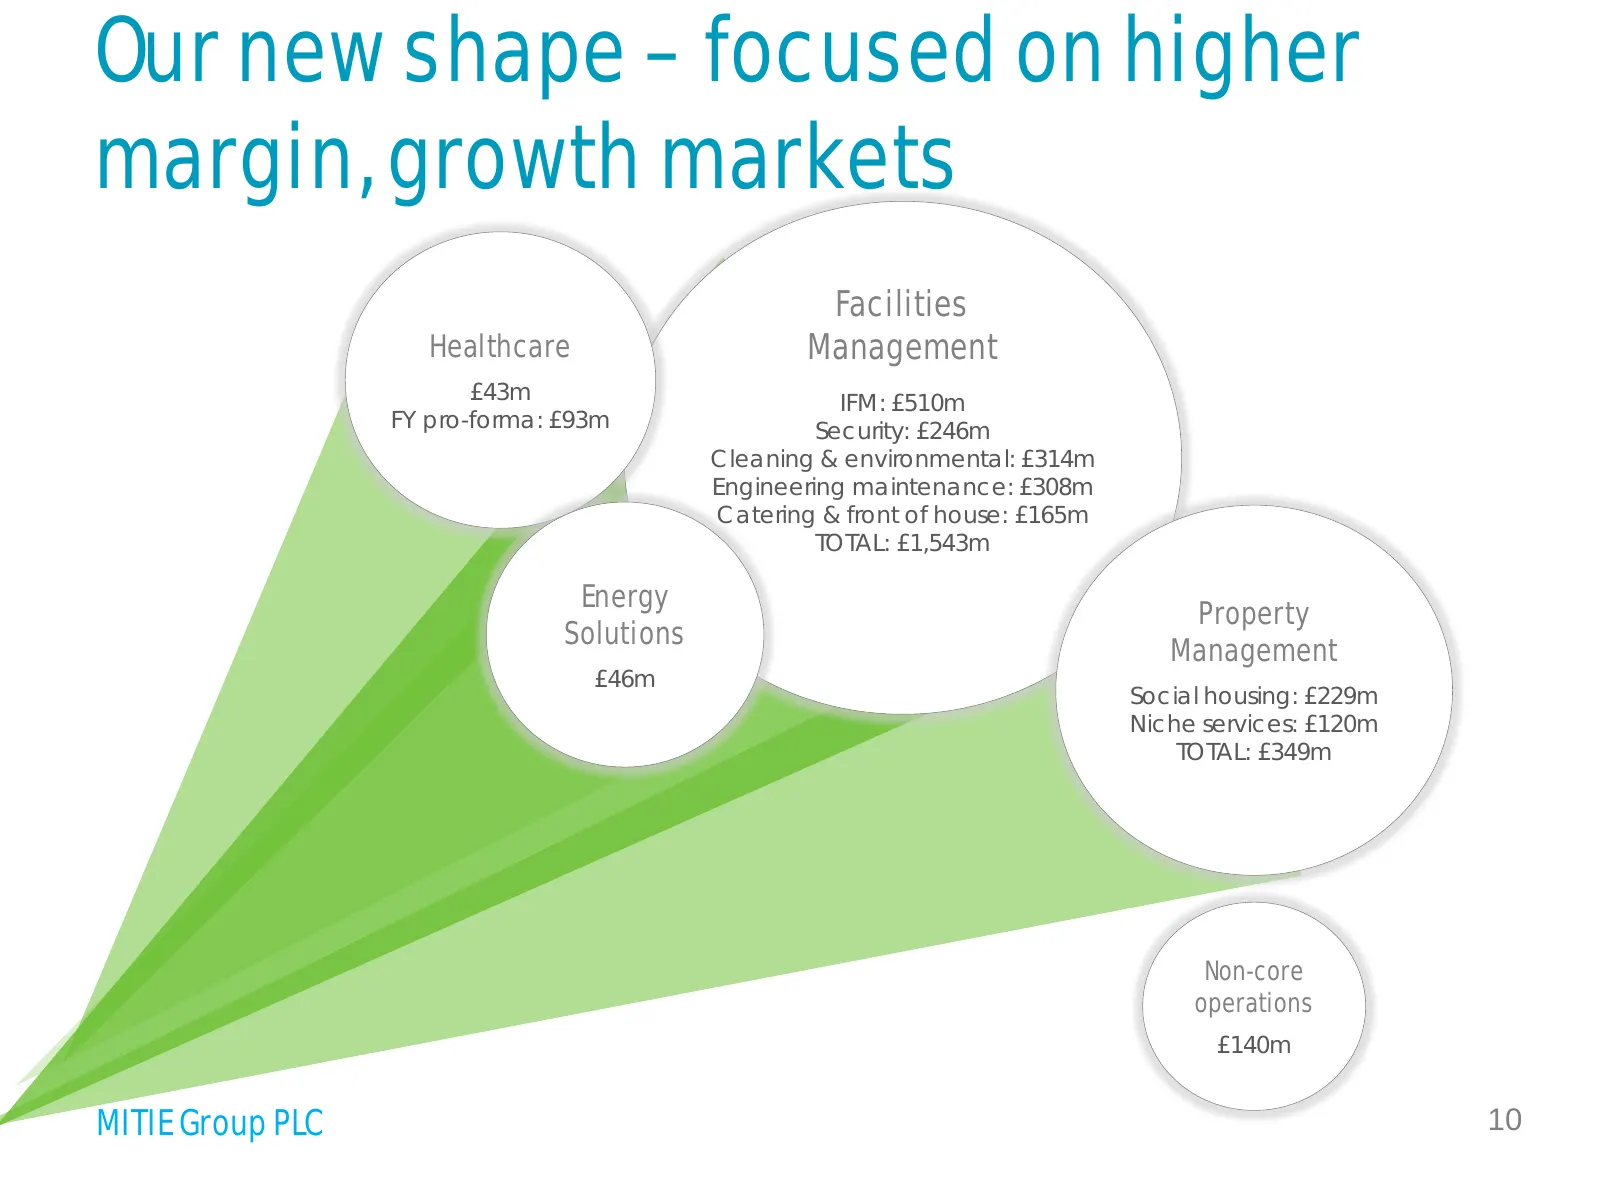
Our new shape – focused on higher margin, growth markets Facilities Healthcare Management £43m IFM: £510m FY pro-forma: £93m Security: £246m Cleaning & environmental: £314m Engineering maintenance: £308m Catering & front of house: £165m TOTAL: £1,543m Energy Property Solutions Management £46m Social
Slide 11: Evolution of FM outsourcing continues to fuel organic growth
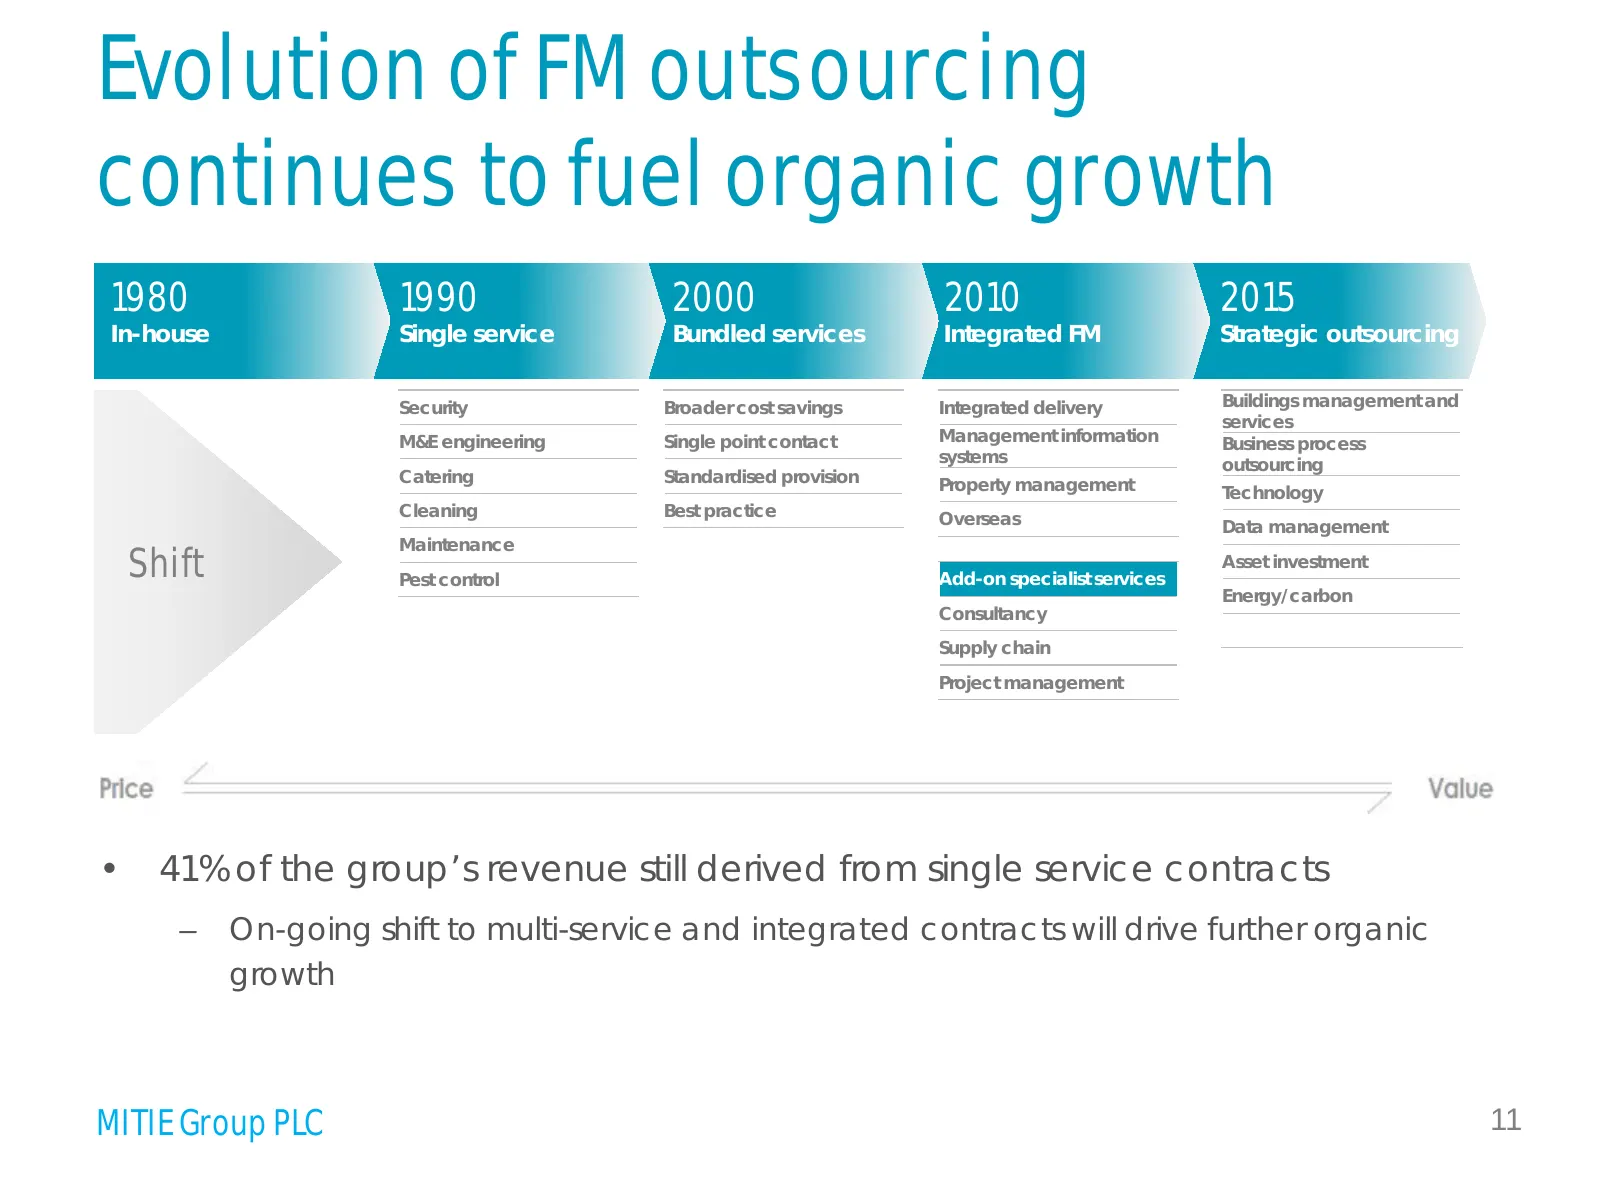
Evolution of FM outsourcing continues to fuel organic growth 1980 1990 2000 2010 2015 In-house Single service Bundled services Integrated FM Strategic outsourcing Security Broader cost savings Integrated delivery Buildings management and services M&E engineering Single point contact Management infor
Slide 12: FM growth predominantly private sector
FM growth predominantly private sector • Private sector continues to offer more opportunities in IFM – Private (77%) /public (23%) total FM revenues – Manufacturing, financial services, retail and technology/communications sectors • Lloyds Banking Group – Successfully mobilised from 1 August 2012 –
Slide 13: Select international FM opportunities
Select international FM opportunities • 3% of revenues international • Continue to partner on selective overseas work and assess acquisition opportunities in appropriate territories • Appointed preferred provider for an international beverage company – IFM contract at 37 sites across the UK, Belgium
Slide 14: Public sector FM markets stable
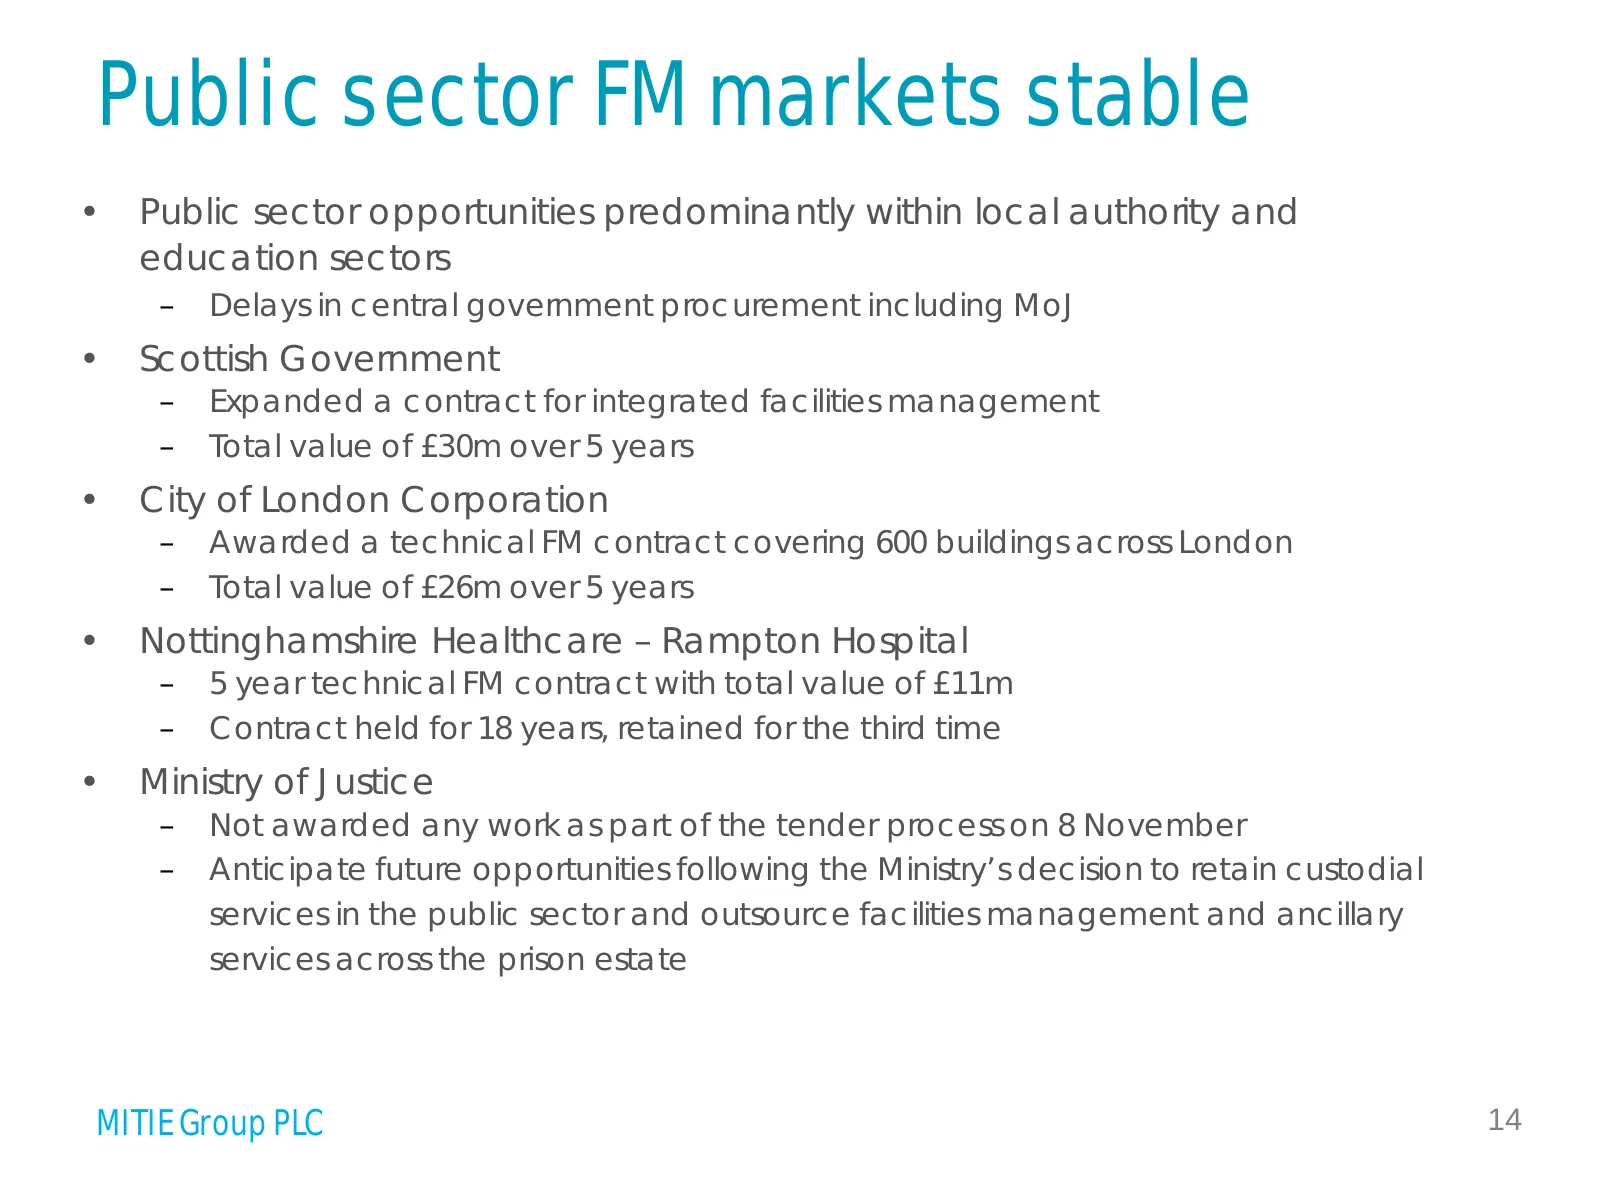
Public sector FM markets stable • Public sector opportunities predominantly within local authority and education sectors – Delays in central government procurement including MoJ • Scottish Government – Expanded a contract for integrated facilities management – Total value of £30m over 5 years • City
Slide 15: Property Management
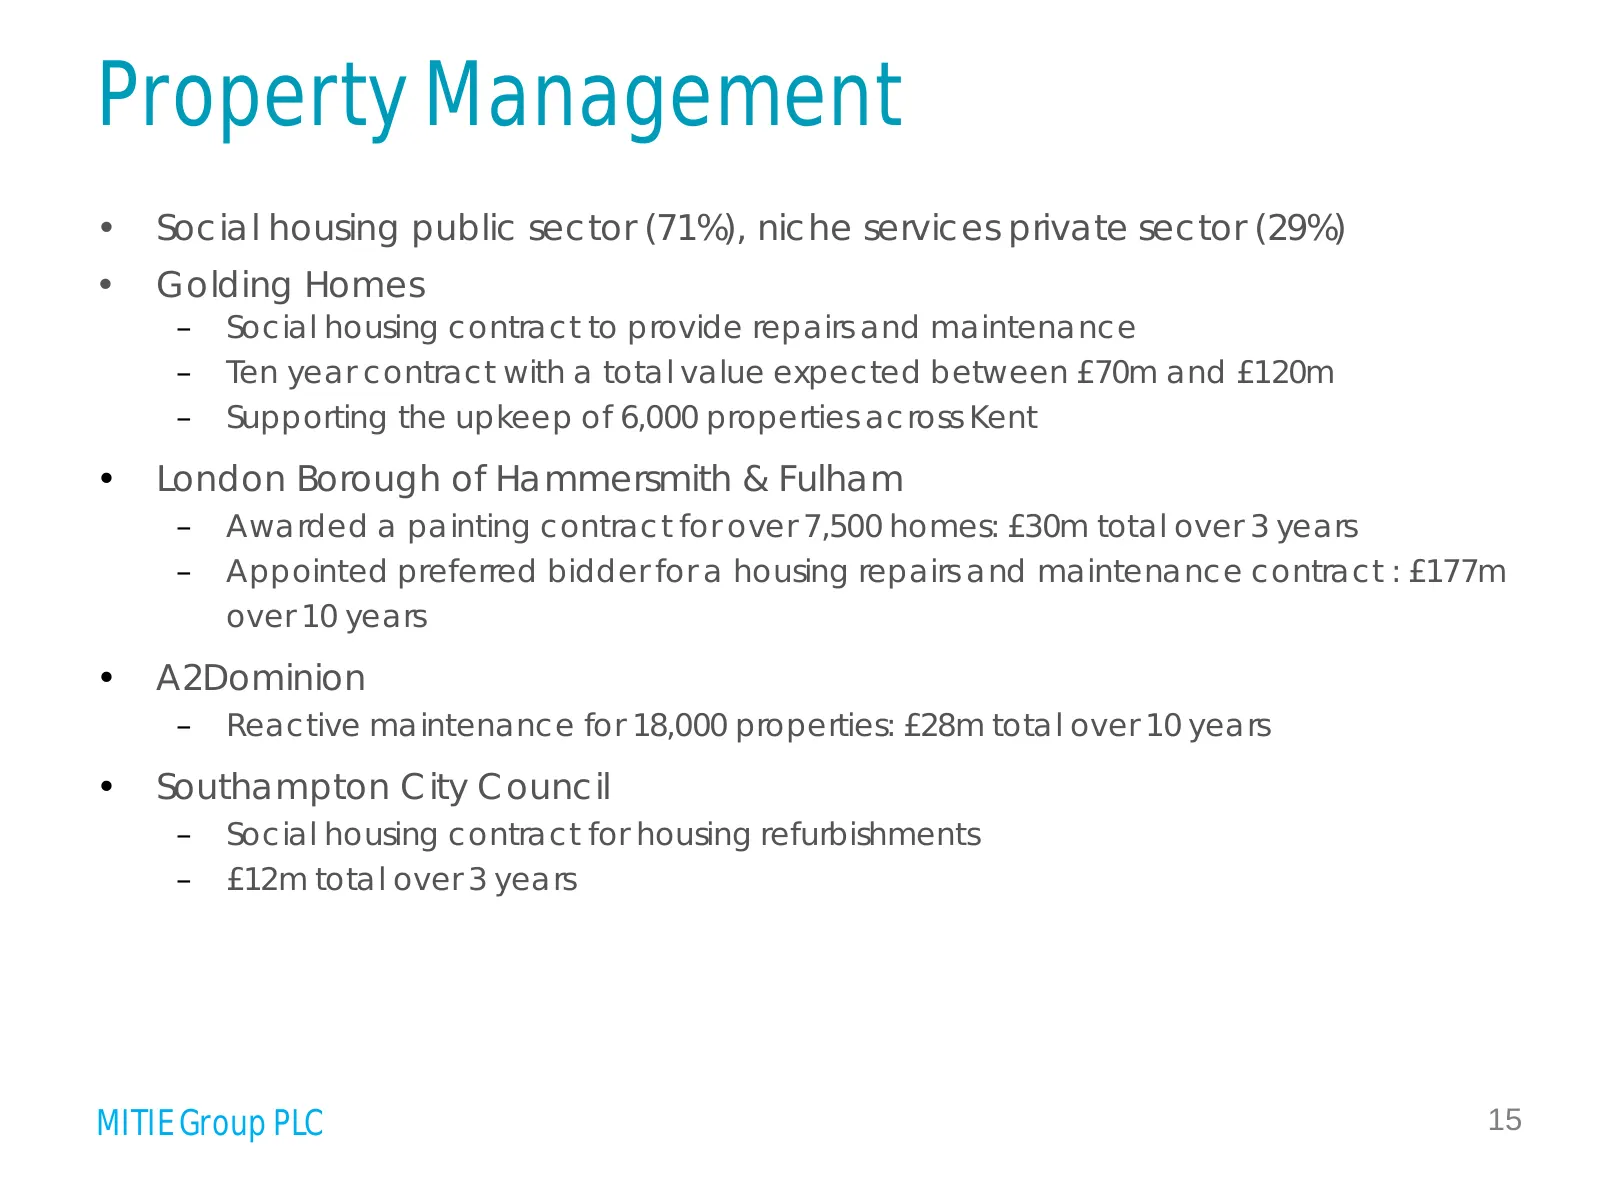
Property Management • Social housing public sector (71%), niche services private sector (29%) • Golding Homes – Social housing contract to provide repairs and maintenance – Ten year contract with a total value expected between £70m and £120m – Supporting the upkeep of 6,000 properties across Kent •
Slide 16: Strategic entry into healthcare market
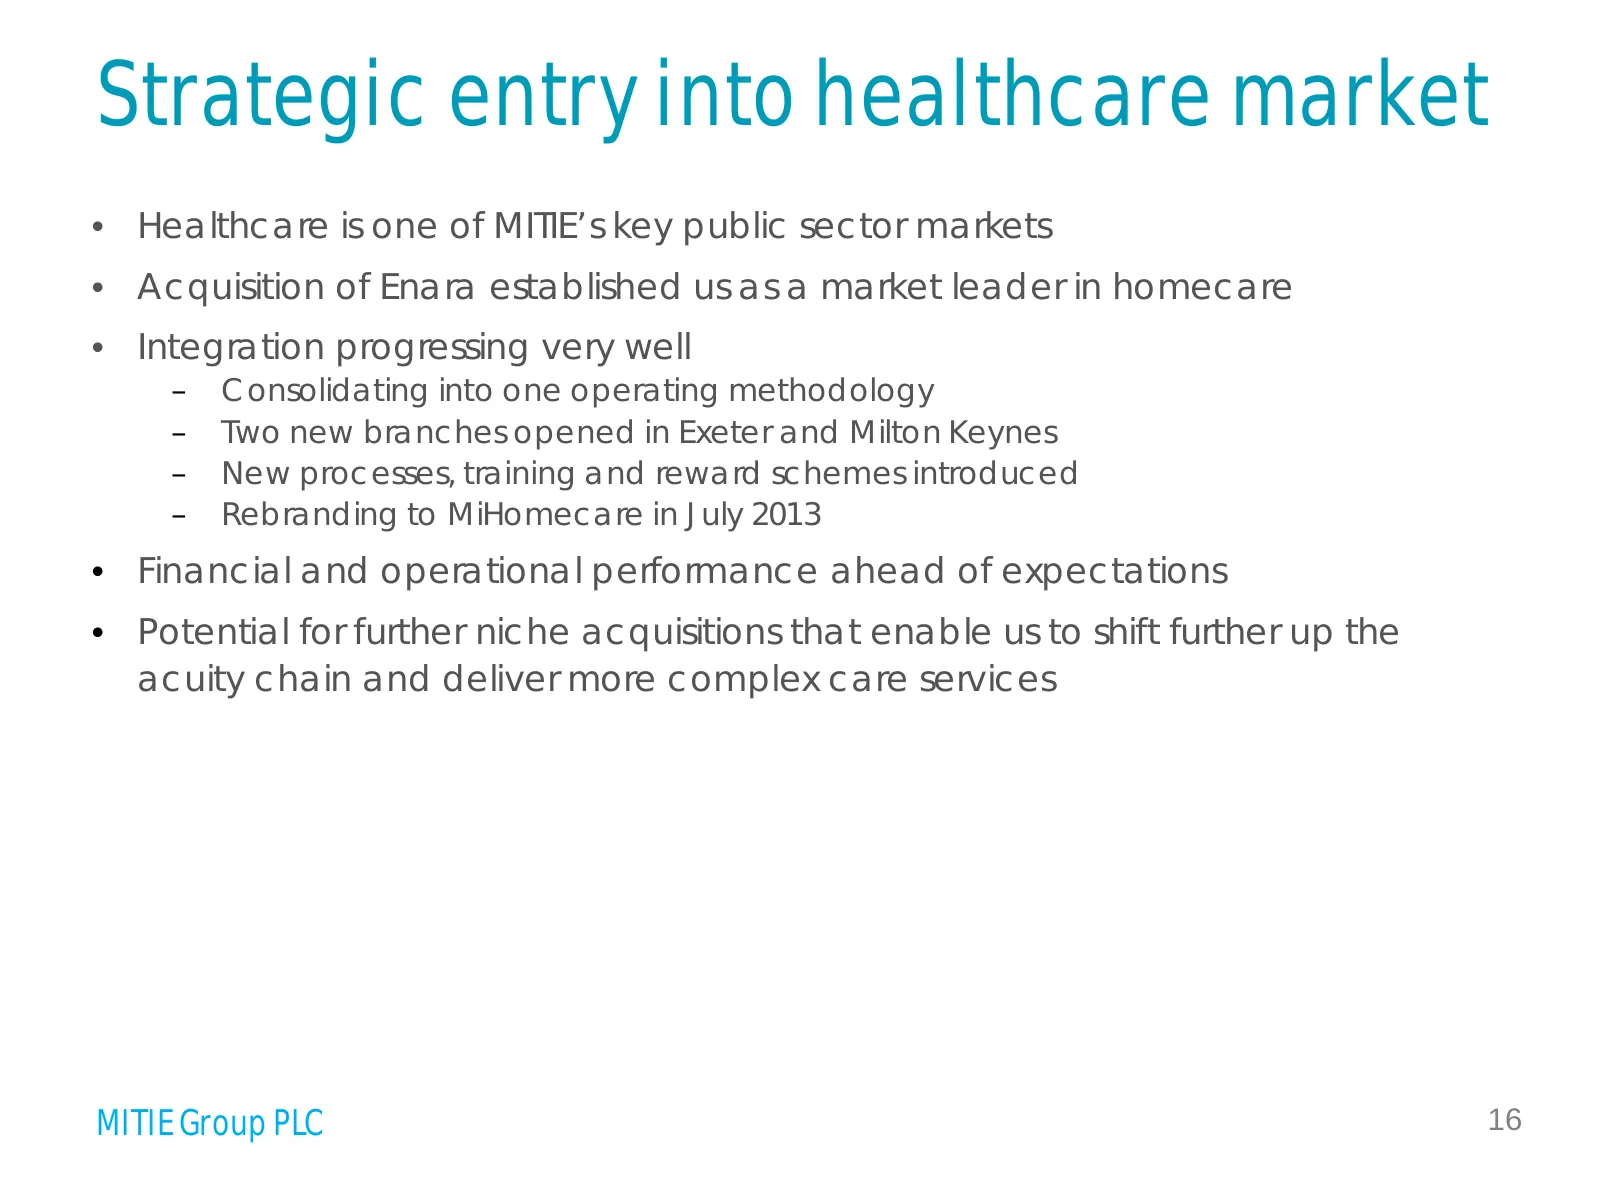
Strategic entry into healthcare market • Healthcare is one of MITIE’s key public sector markets • Acquisition of Enara established us as a market leader in homecare • Integration progressing very well – Consolidating into one operating methodology – Two new branches opened in Exeter and Milton Keyne
Slide 17: Enara is a market leader in homecare
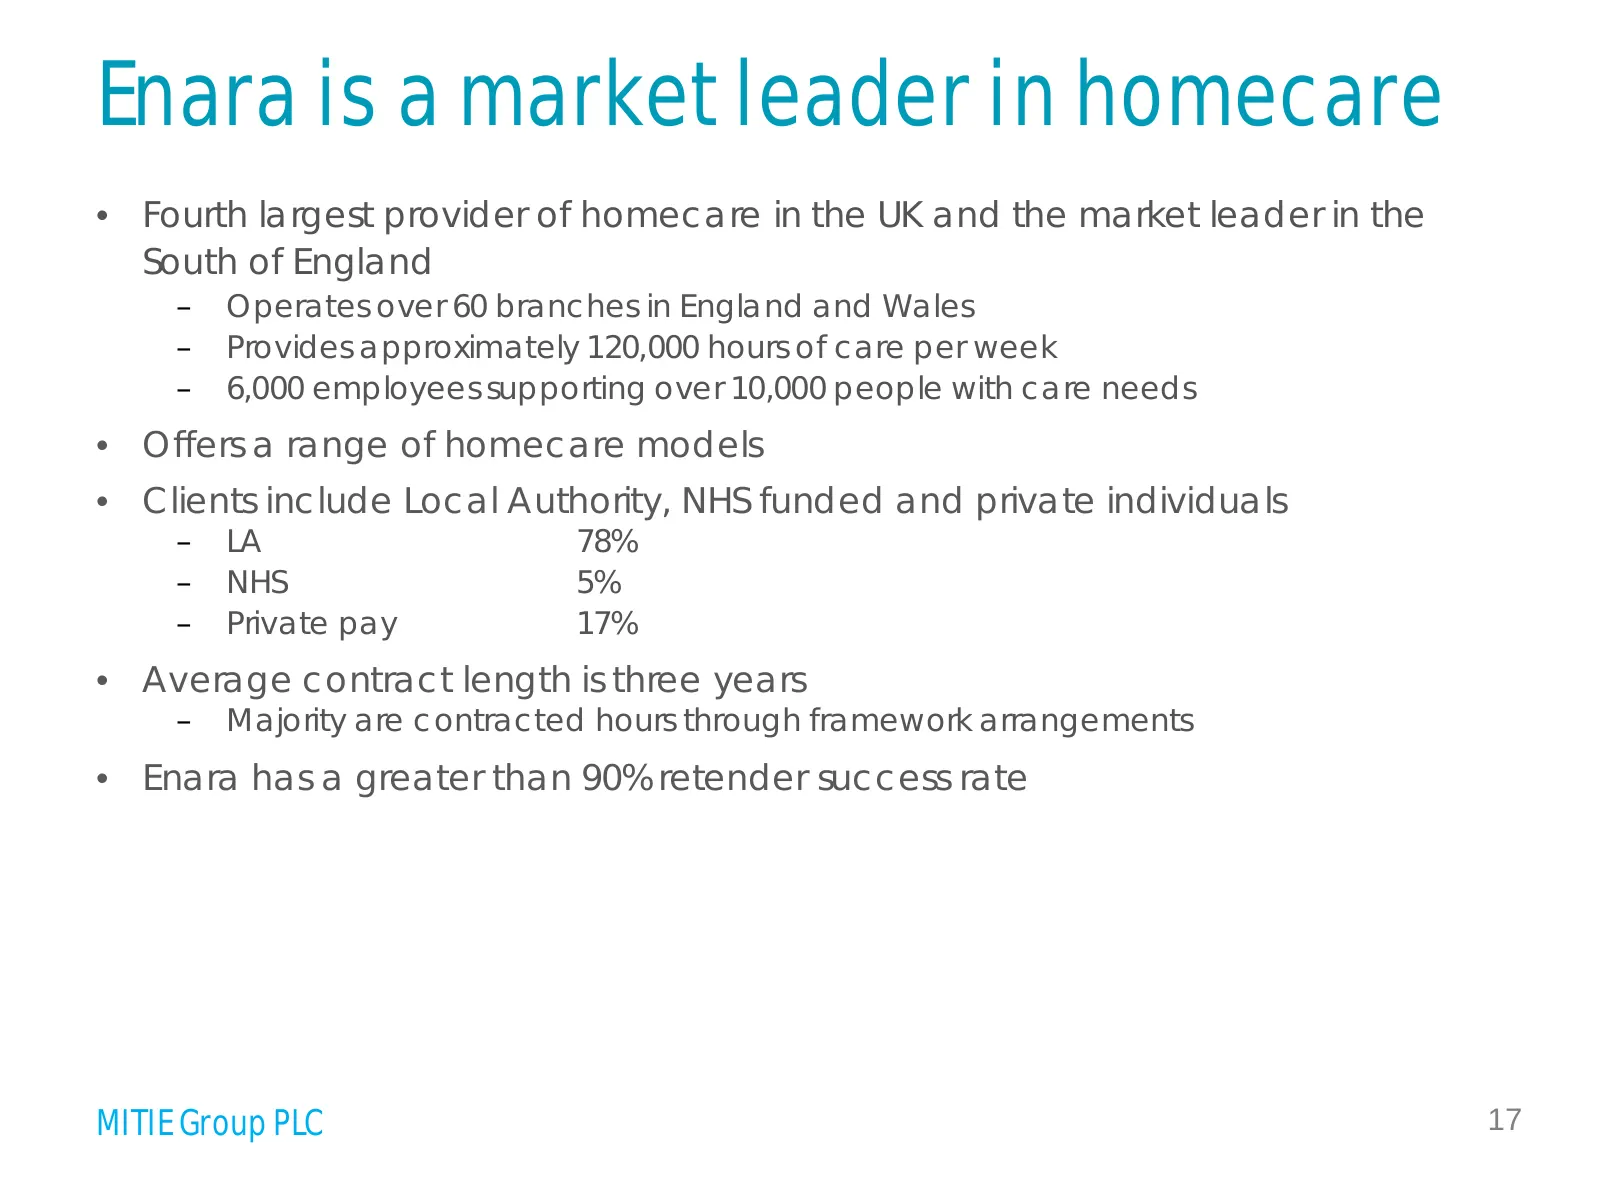
Enara is a market leader in homecare • Fourth largest provider of homecare in the UK and the market leader in the South of England – Operates over 60 branches in England and Wales – Provides approximately 120,000 hours of care per week – 6,000 employees supporting over 10,000 people with care needs
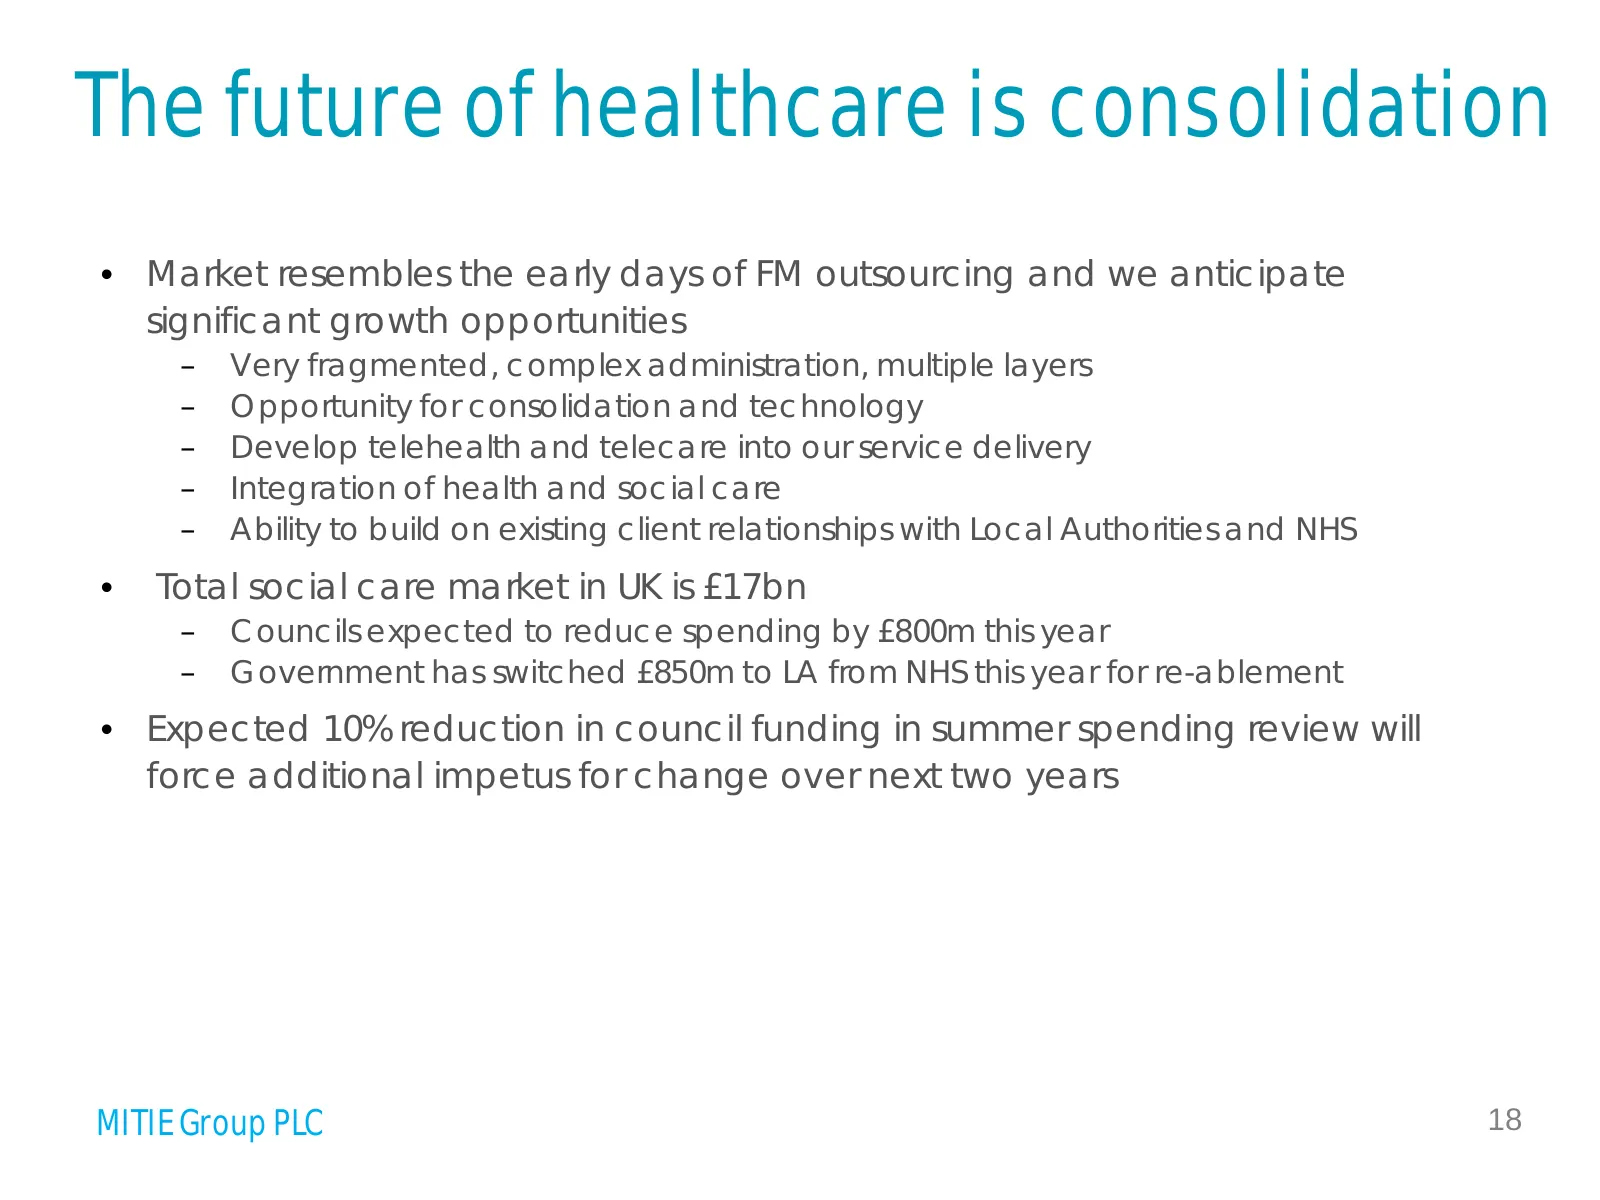
Slide 18: The future of healthcare is consolidation
The future of healthcare is consolidation • Market resembles the early days of FM outsourcing and we anticipate significant growth opportunities – Very fragmented, complex administration, multiple layers – Opportunity for consolidation and technology – Develop telehealth and telecare into our servic
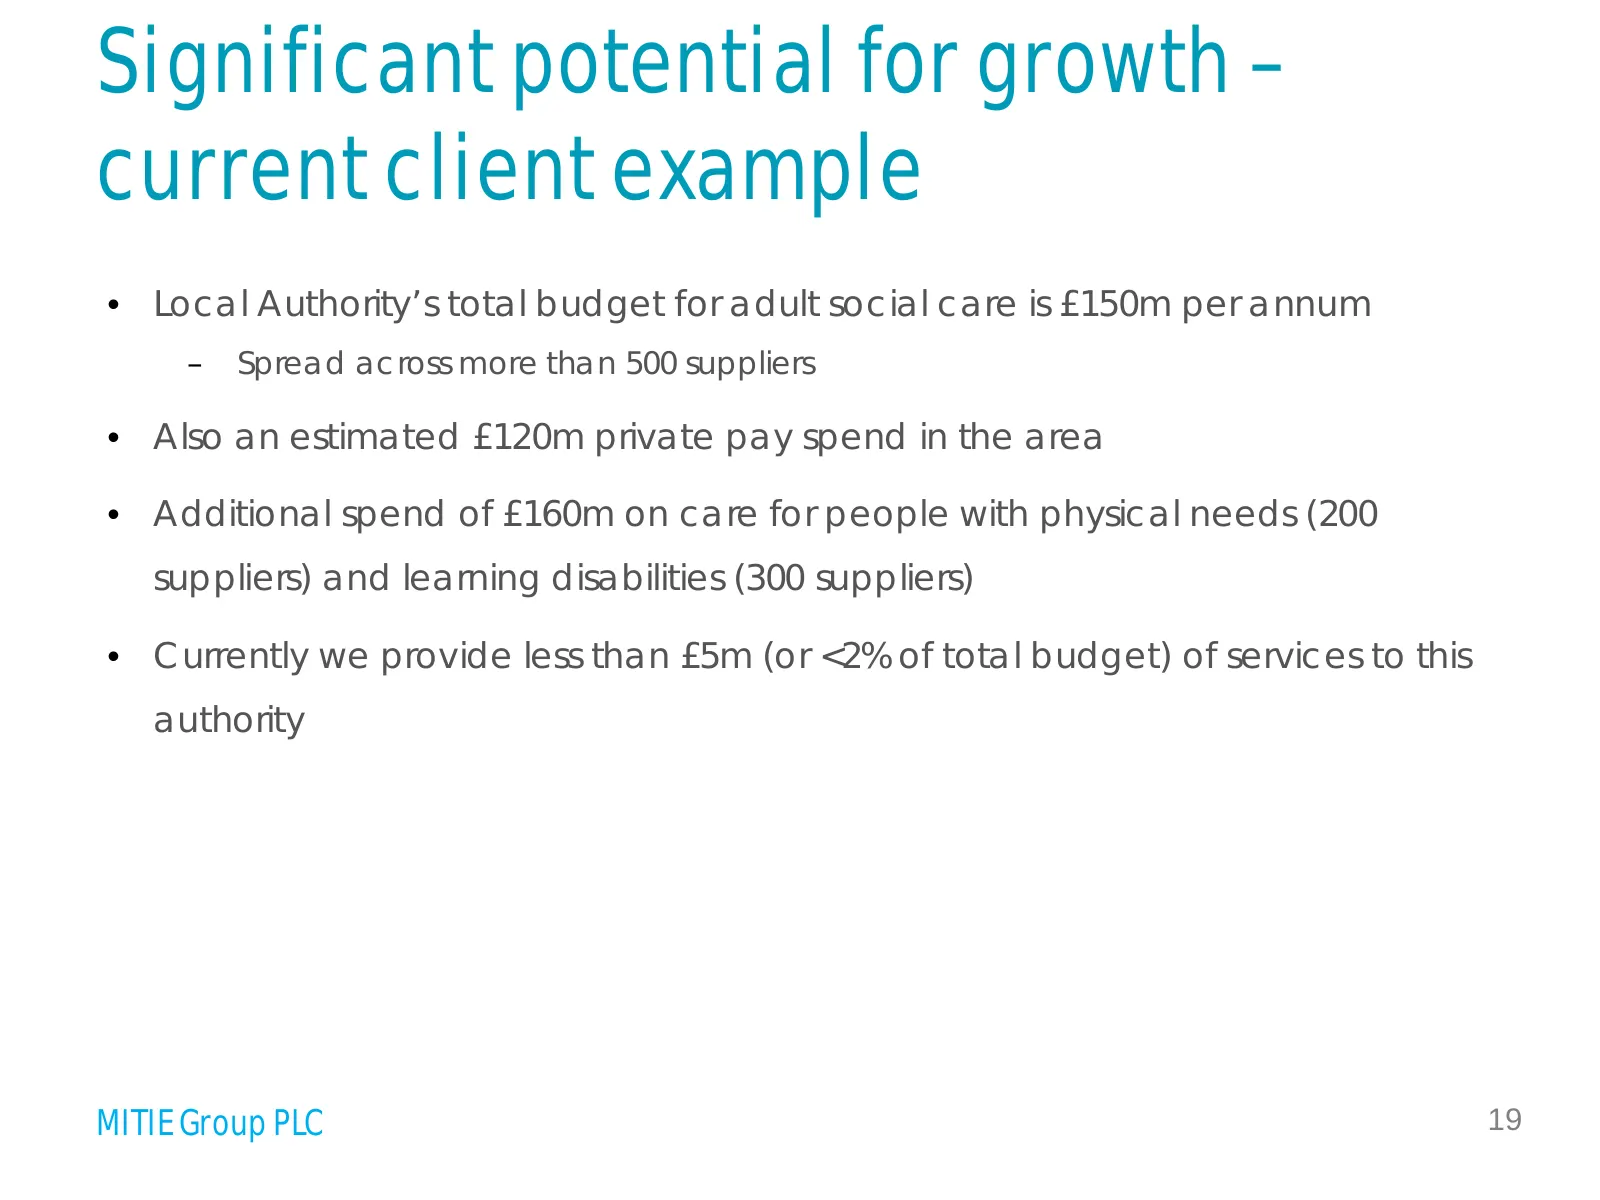
Slide 19: Significant potential for growth – current client example
Significant potential for growth – current client example • Local Authority’s total budget for adult social care is £150m per annum – Spread across more than 500 suppliers • Also an estimated £120m private pay spend in the area • Additional spend of £160m on care for people with physical needs (200
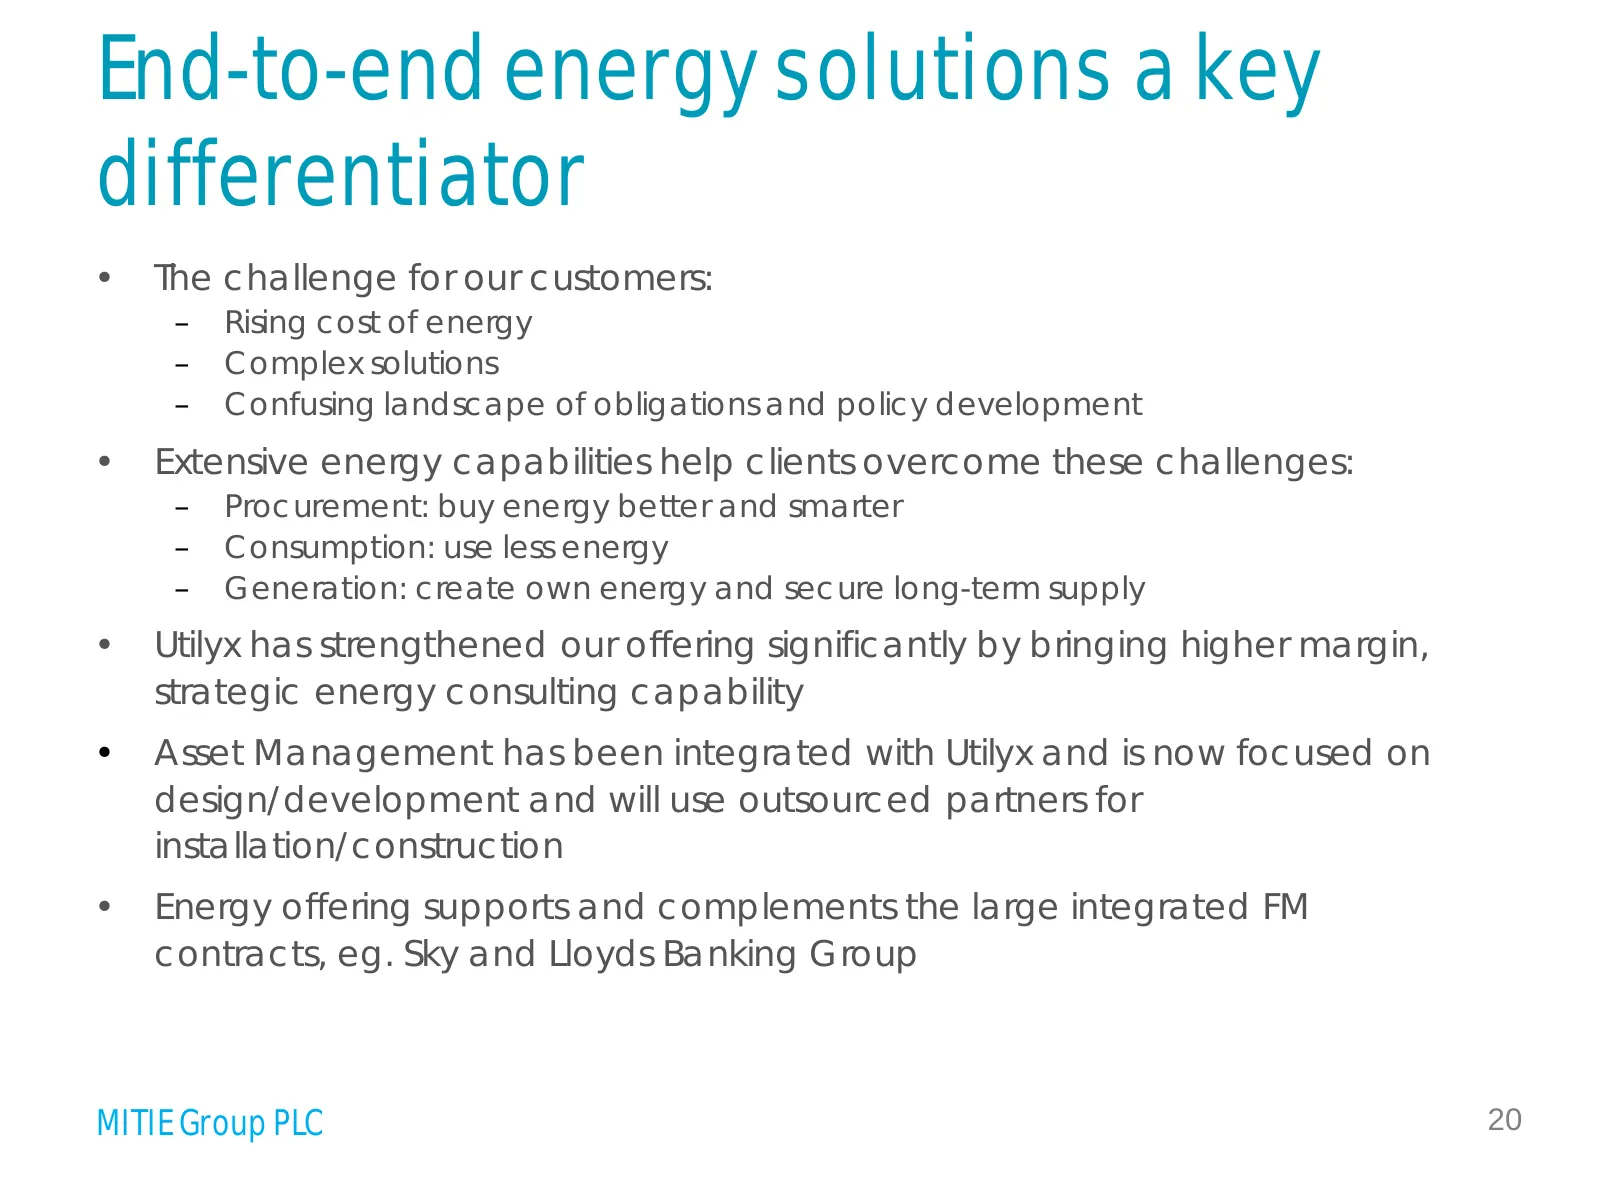
Slide 20: End-to-end energy solutions a key differentiator
End-to-end energy solutions a key differentiator • The challenge for our customers: – Rising cost of energy – Complex solutions – Confusing landscape of obligations and policy development • Extensive energy capabilities help clients overcome these challenges: – Procurement: buy energy better and sma
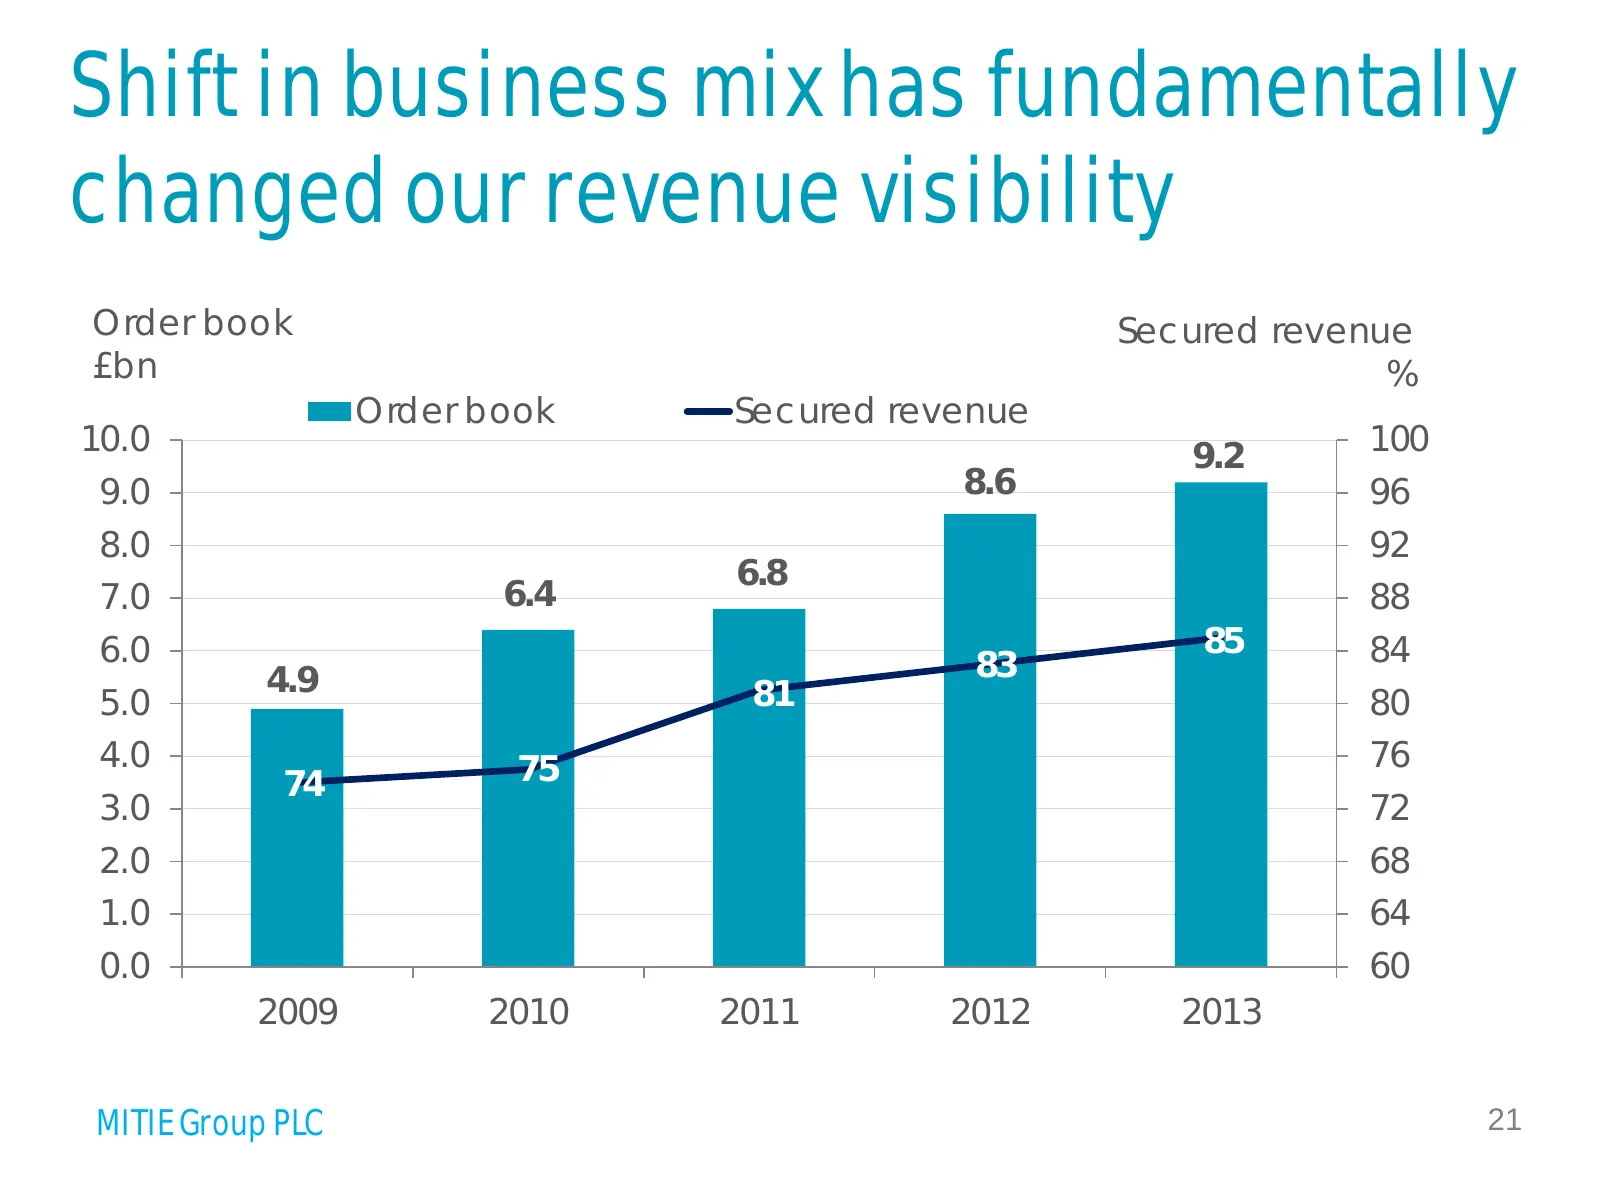
Slide 21: Shift in business mix has changed our revenue visibility
Shift in business mix has fundamentally changed our revenue visibility Order book Secured revenue £bn % Order book Secured revenue 10.0 9.2 100 9.0 8.6 96 8.0 92 6.8 7.0 6.4 88 6.0 85 84 4.9 83 5.0 81 80 4.0 75 76 74 3.0 72 2.0 68 1.0 64 0.0 60 2009 2010 2011 2012 2013 MITIE Group PLC 21
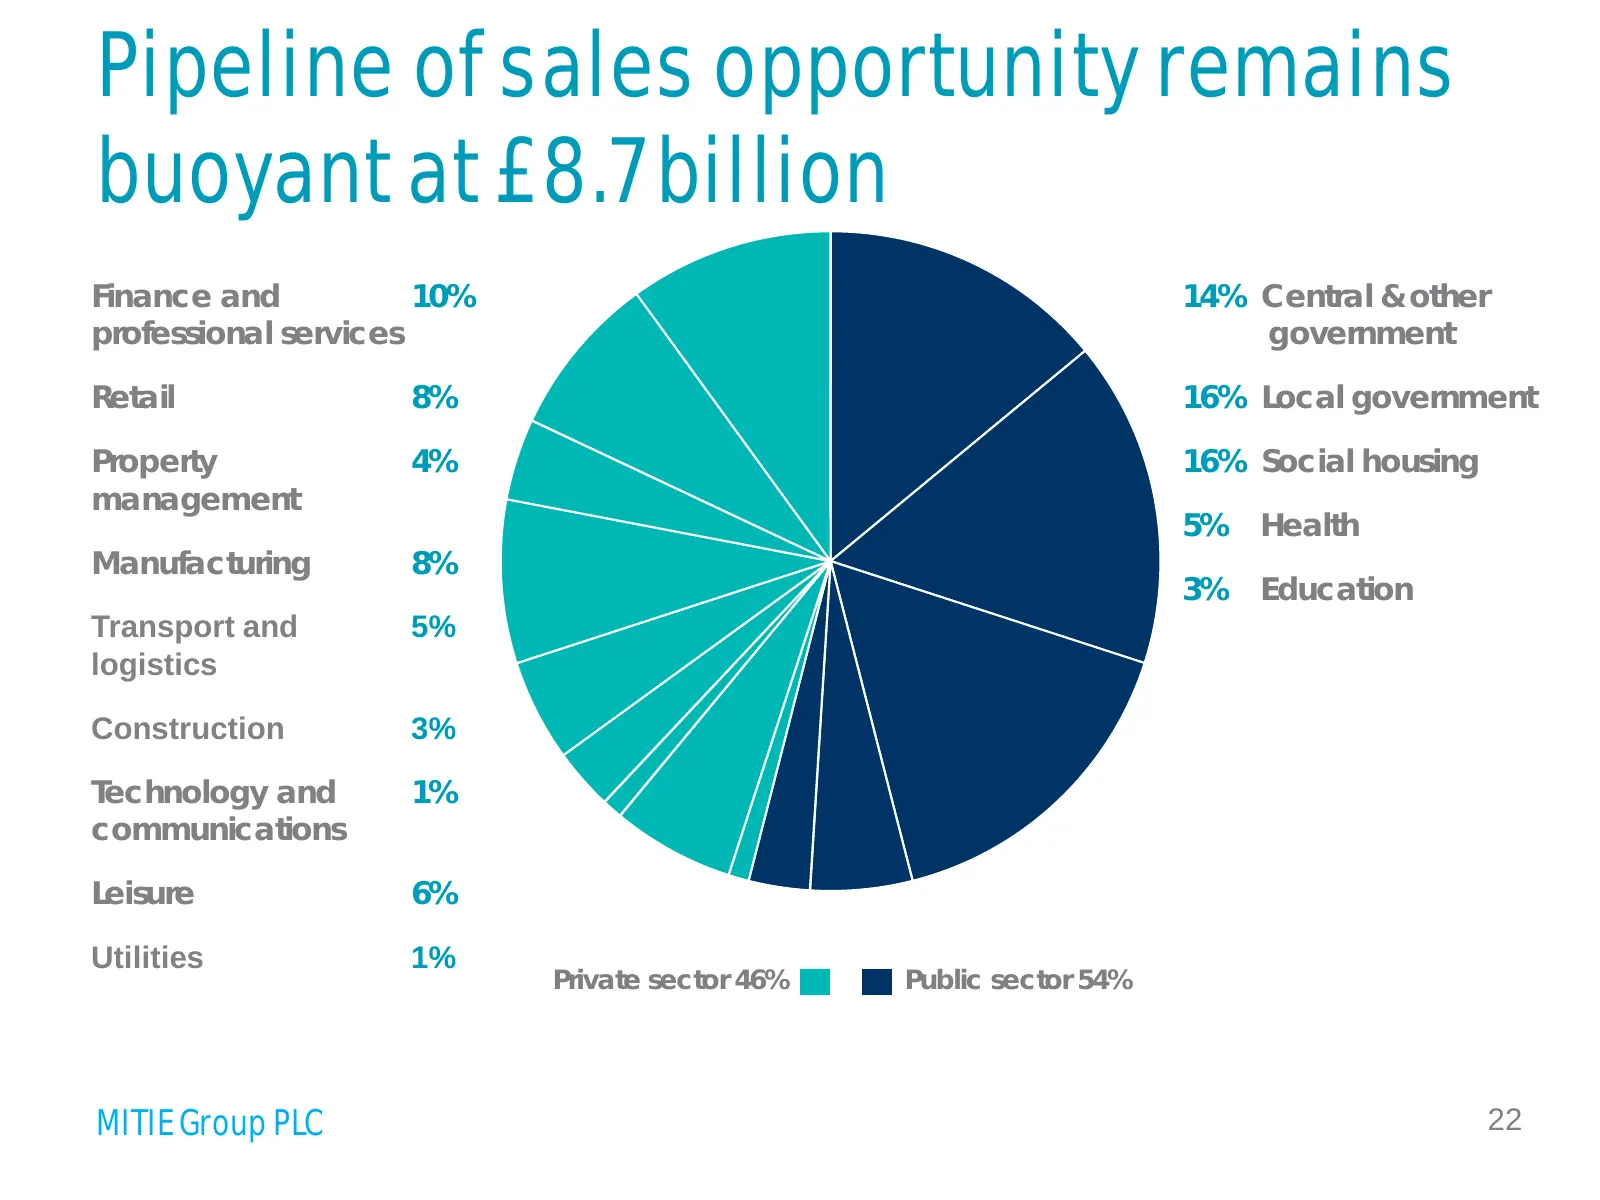
Slide 22: Pipeline of sales opportunity remains buoyant at £8.7 billion
Pipeline of sales opportunity remains buoyant at £8.7 billion Finance and 10% 14% Central & other professional services government Retail 8% 16% Local government Property 4% 16% Social housing management 5% Health Manufacturing 8% 3% Education Transport and 5% logistics Construction 3% Technology an
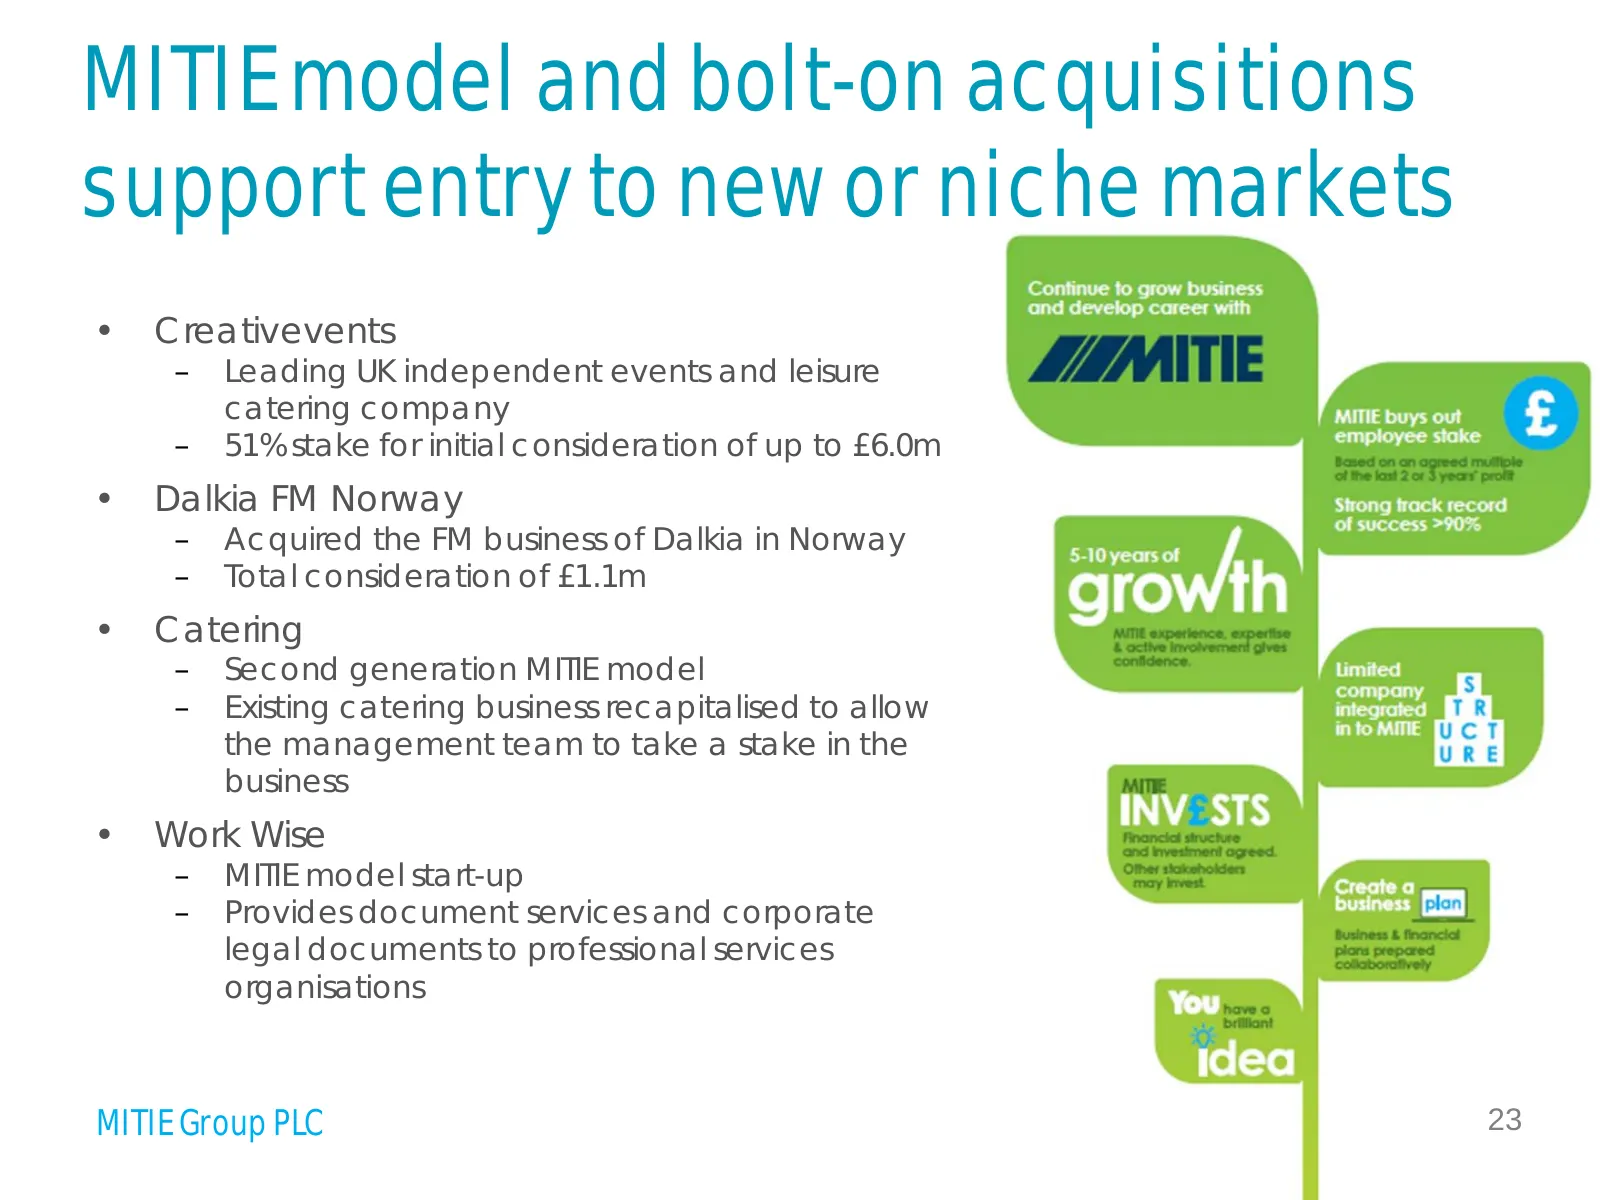
Slide 23: MITIE model and bolt-on acquisitions support entry to new markets
MITIE model and bolt-on acquisitions support entry to new or niche markets • Creativevents – Leading UK independent events and leisure catering company – 51% stake for initial consideration of up to £6.0m • Dalkia FM Norway – Acquired the FM business of Dalkia in Norway – Total consideration of £1.1

Slide 24: Suzanne Baxter, Group Finance Director
Suzanne Baxter Group Finance Director MITIE Group PLC 24
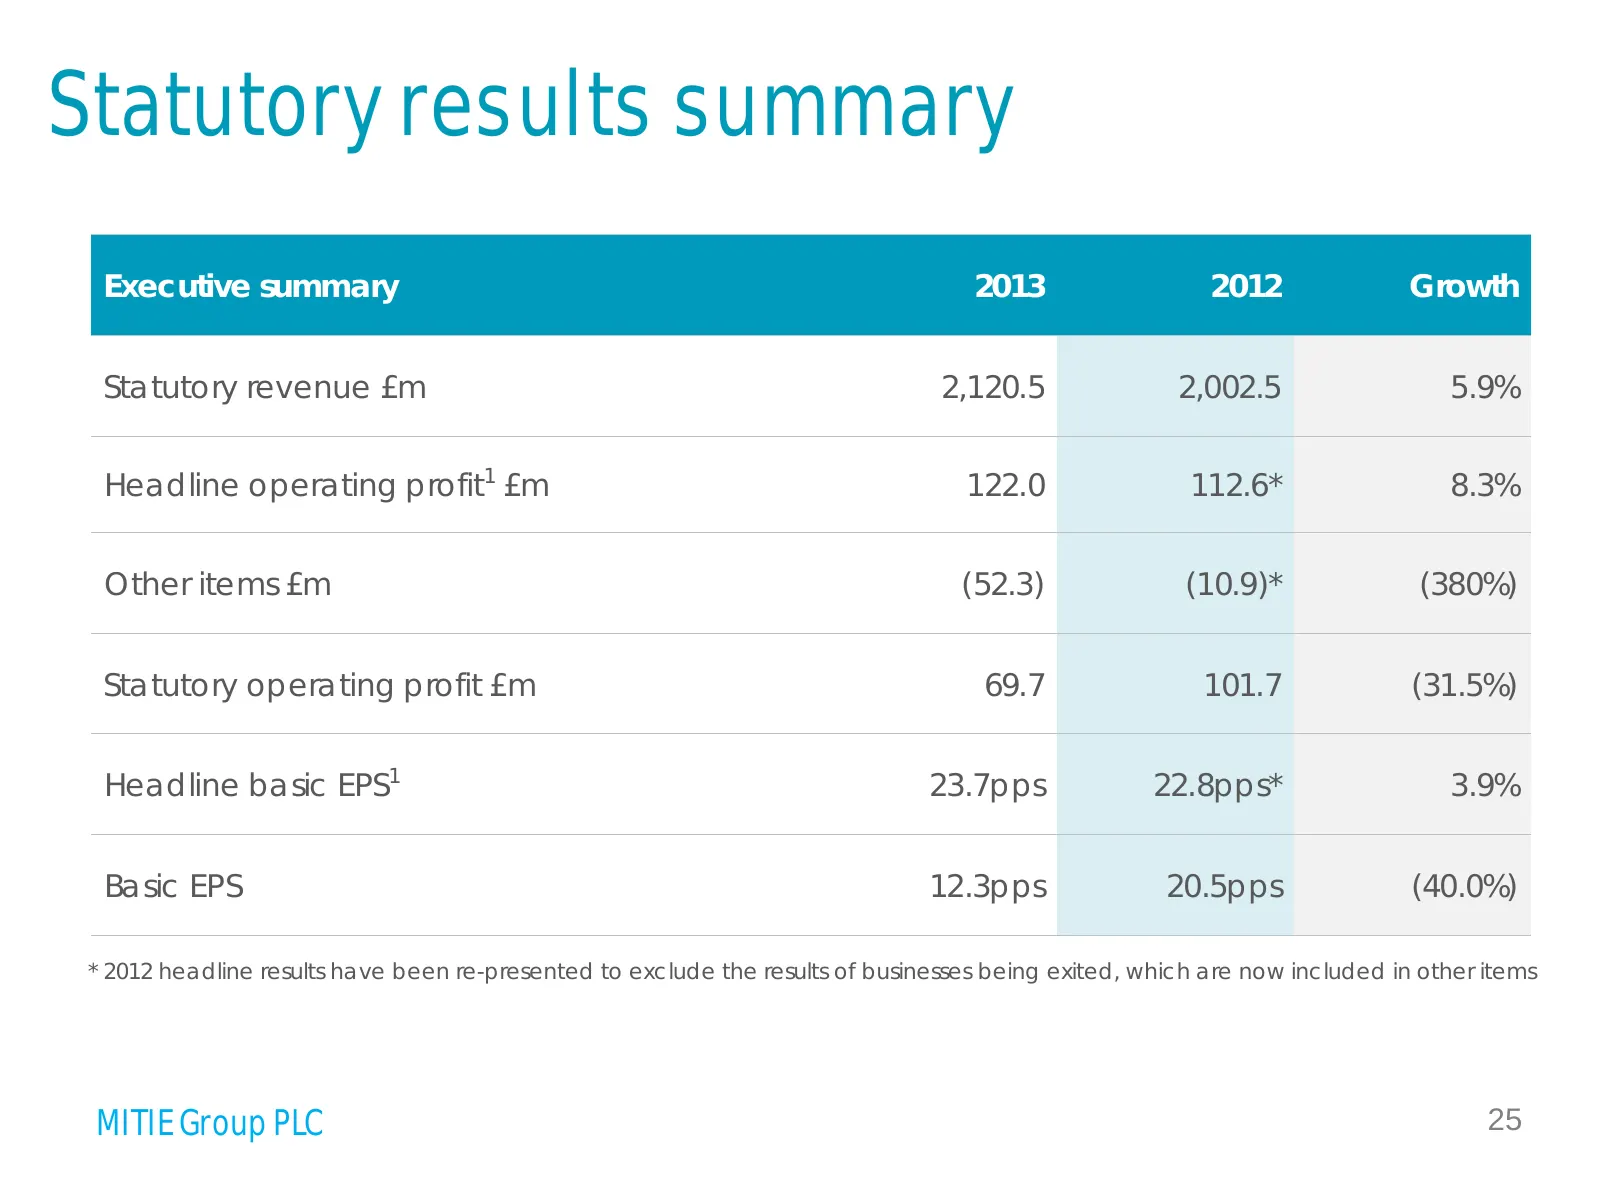
Slide 25: Statutory results summary
Statutory results summary Executive summary 2013 2012 Growth Statutory revenue £m 2,120.5 2,002.5 5.9% Headline operating profit1 £m 122.0 112.6* 8.3% Other items £m (52.3) (10.9)* (380%) Statutory operating profit £m 69.7 101.7 (31.5%) Headline basic EPS1 23.7pps 22.8pps* 3.9% Basic EPS 12.3pps 20.
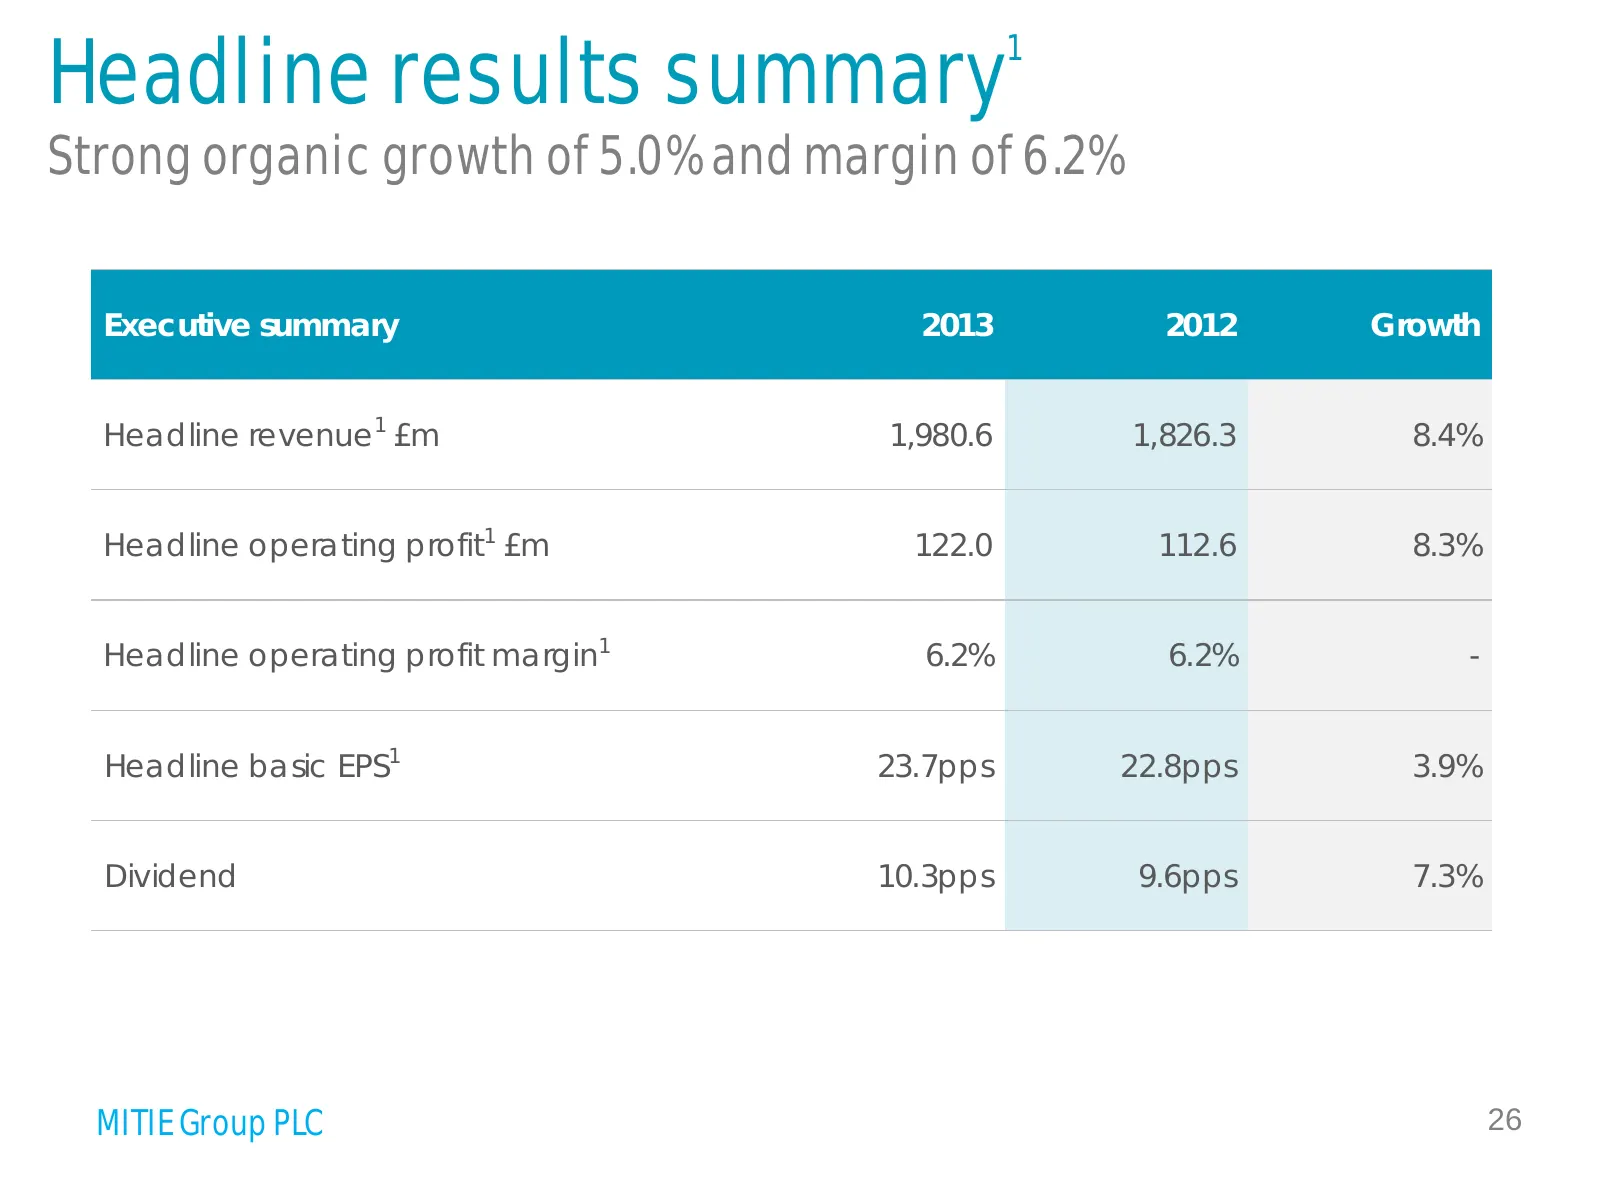
Slide 26: Headline results summary
Headline results summary 1 Strong organic growth of 5.0% and margin of 6.2% Executive summary 2013 2012 Growth Headline revenue1 £m 1,980.6 1,826.3 8.4% Headline operating profit1 £m 122.0 112.6 8.3% Headline operating profit margin1 6.2% 6.2% - Headline basic EPS1 23.7pps 22.8pps 3.9% Dividend 10.3
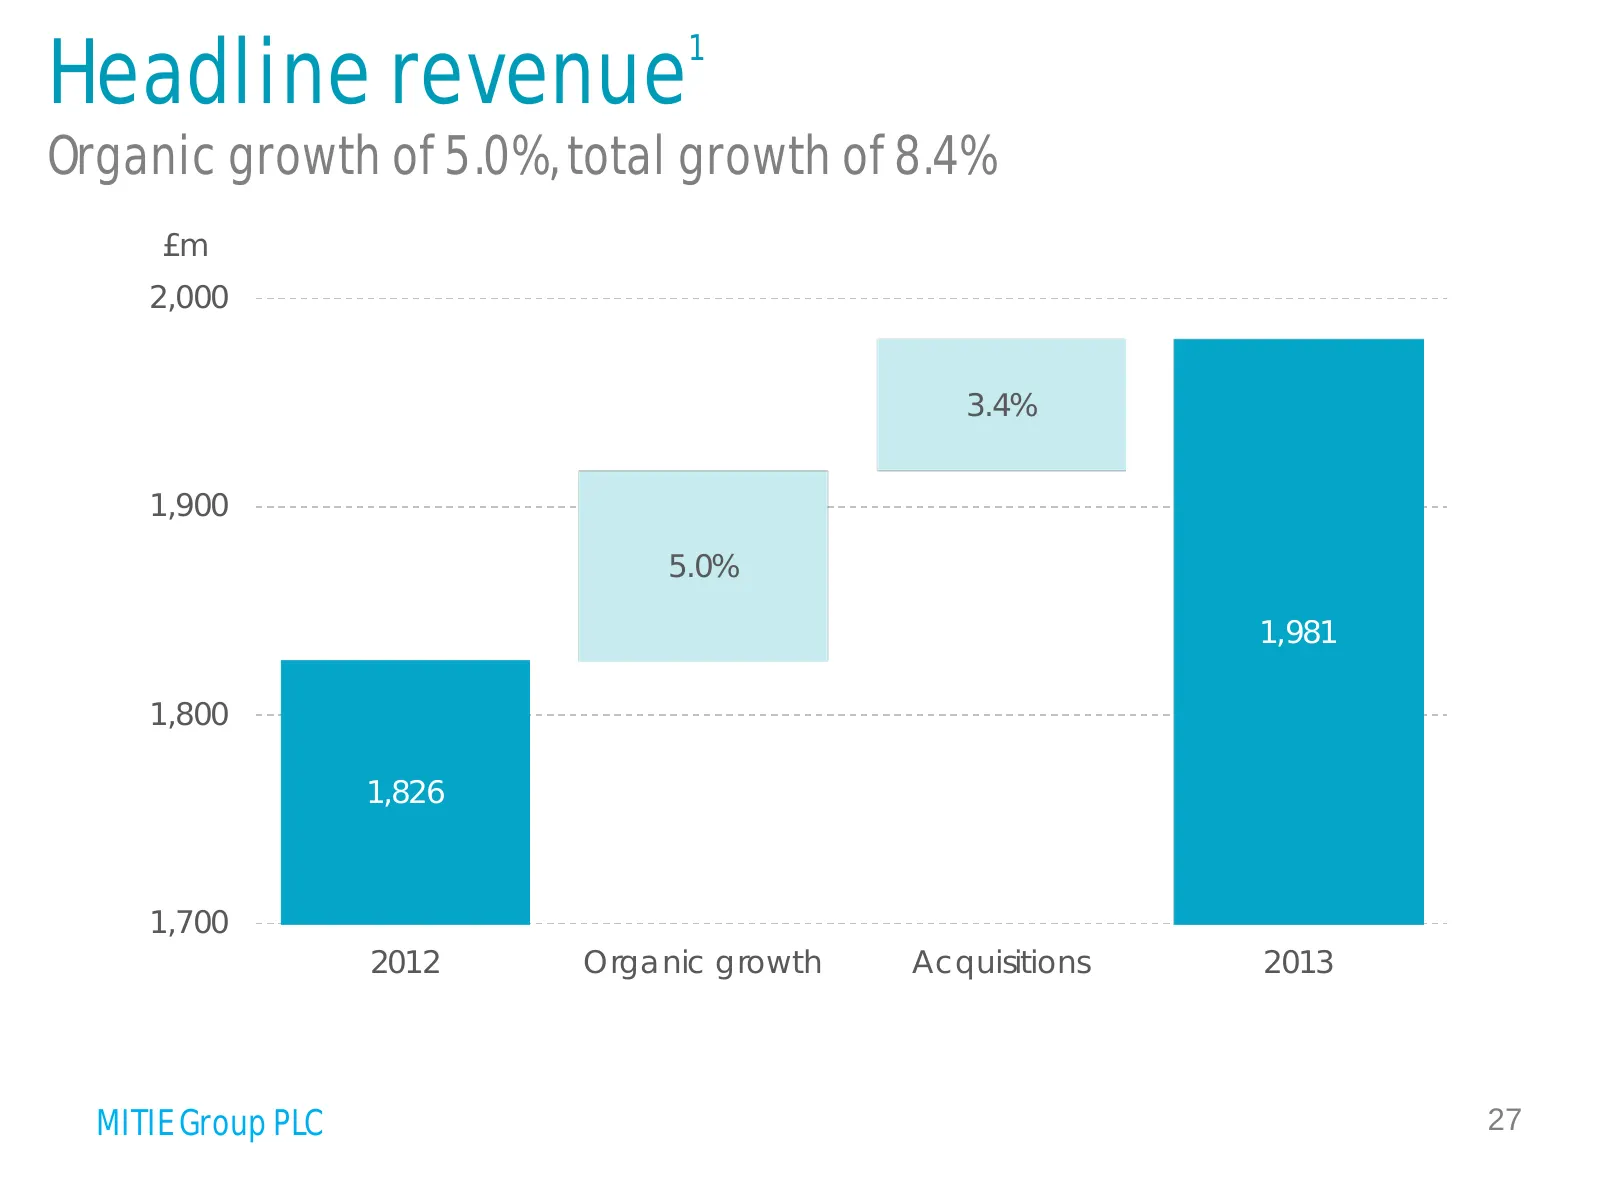
Slide 27: Headline revenue
Headline revenue 1 Organic growth of 5.0%, total growth of 8.4% £m 2,000 3.4% 1,900 5.0% 1,981 1,800 1,826 1,700 2012 Organic growth Acquisitions 2013 MITIE Group PLC 27
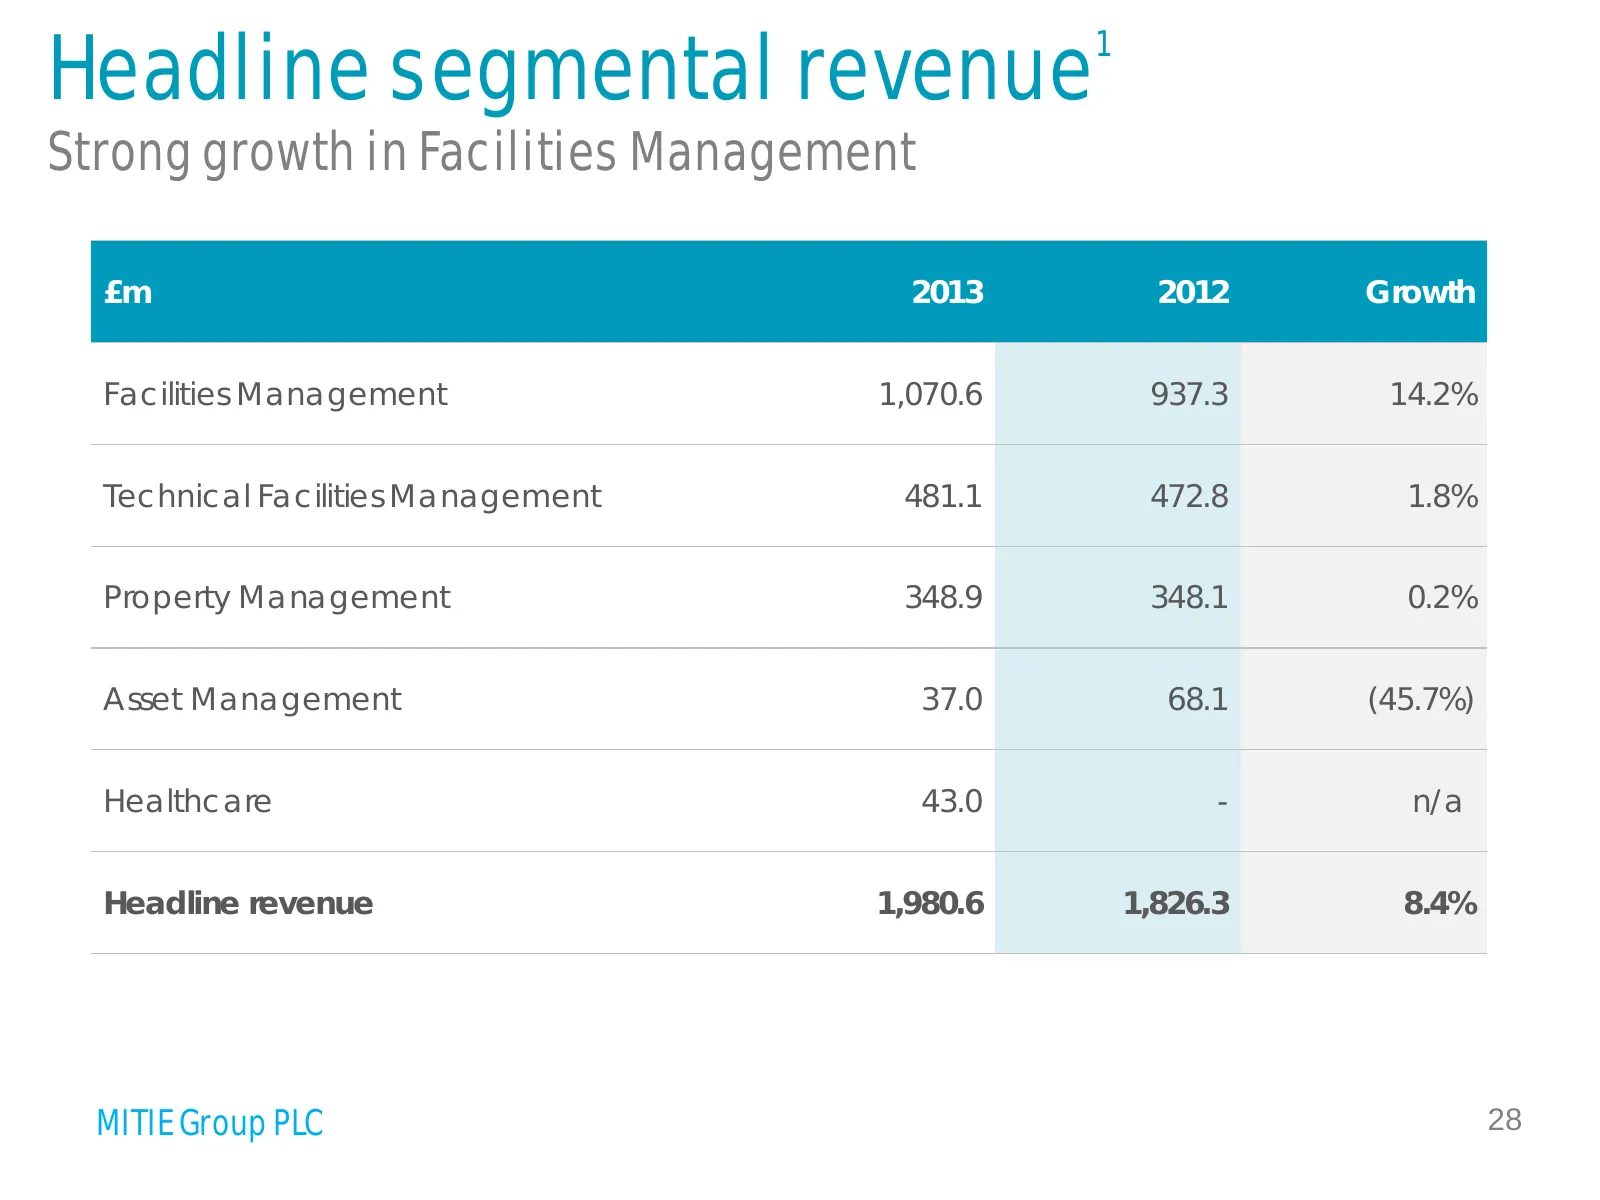
Slide 28: Headline segmental revenue
Headline segmental revenue 1 Strong growth in Facilities Management £m 2013 2012 Growth Facilities Management 1,070.6 937.3 14.2% Technical Facilities Management 481.1 472.8 1.8% Property Management 348.9 348.1 0.2% Asset Management 37.0 68.1 (45.7%) Healthcare 43.0 - n/a Headline revenue 1,980.6 1,
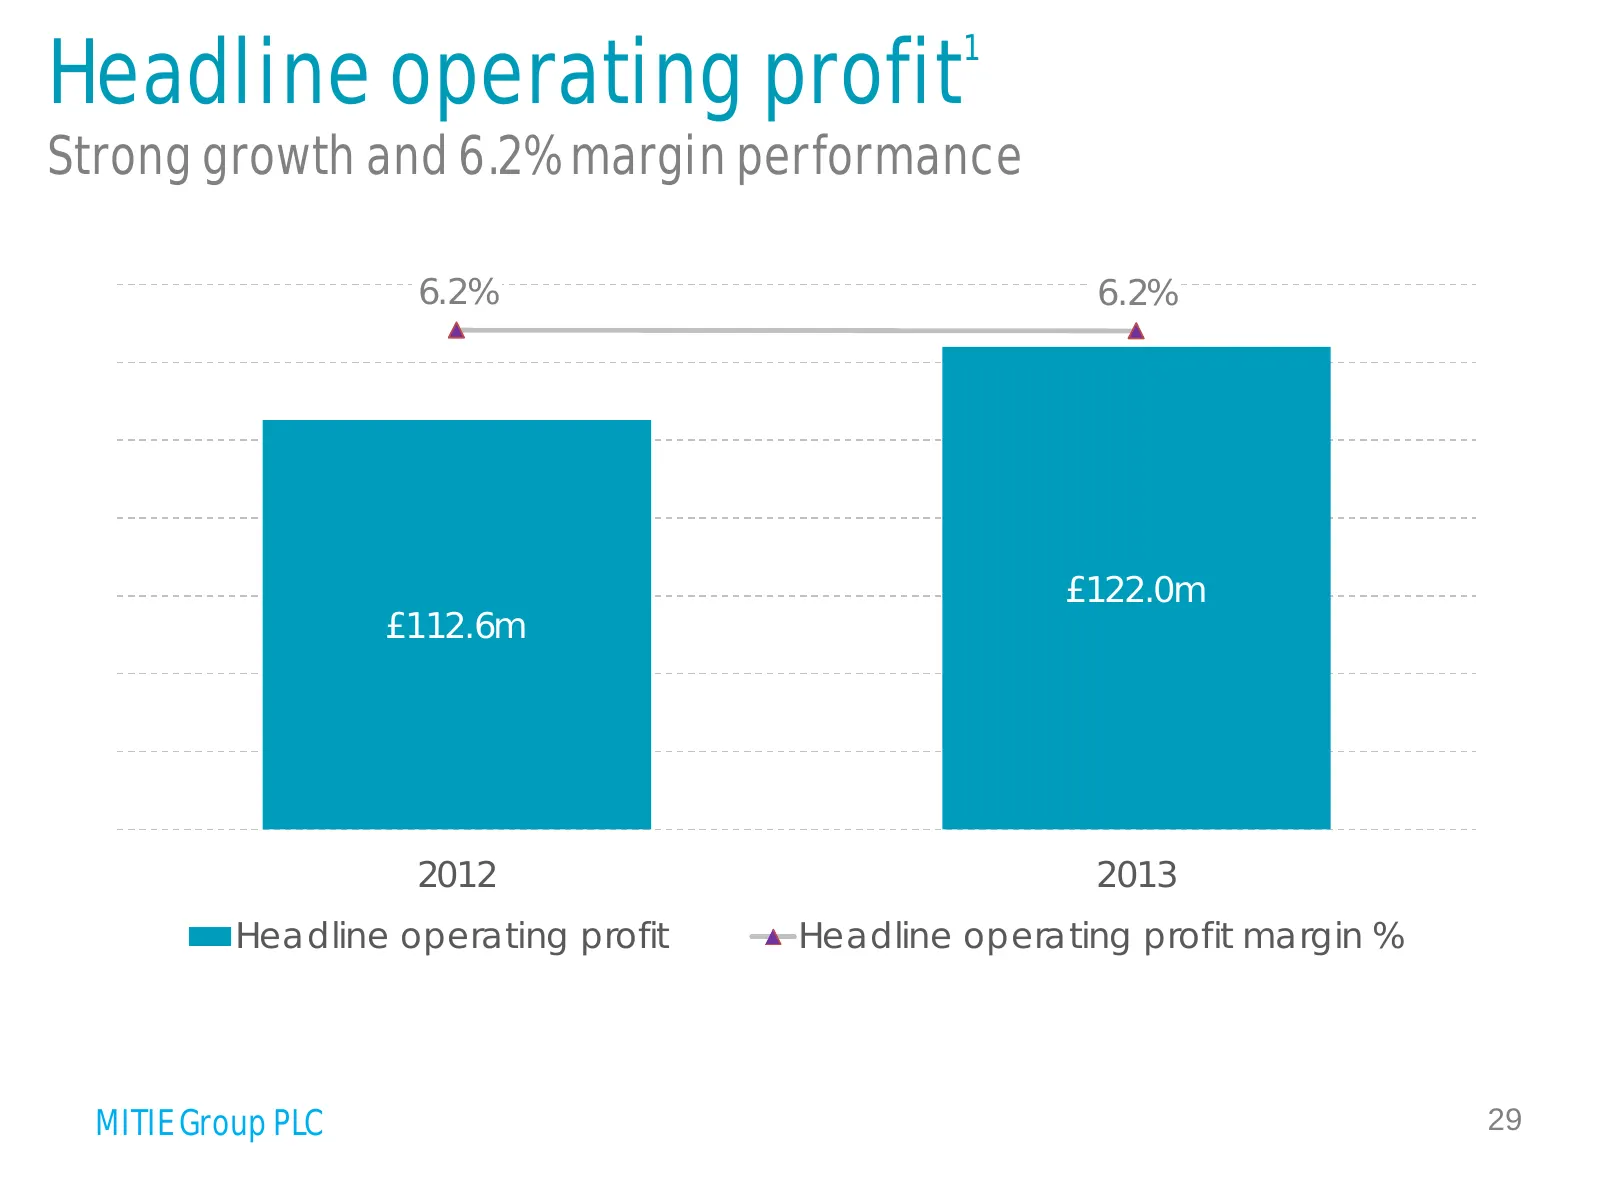
Slide 29: Headline operating profit
Headline operating profit 1 Strong growth and 6.2% margin performance 130.0 6.2% 6.2% 6.5% 120.0 6.0% 5.5% 110.0 5.0% 100.0 4.5% 90.0 £122.0m £112.6m 4.0% 80.0 3.5% 70.0 3.0% 60.0 2.5% 2012 2013 Headline operating profit Headline operating profit margin % MITIE Group PLC 29
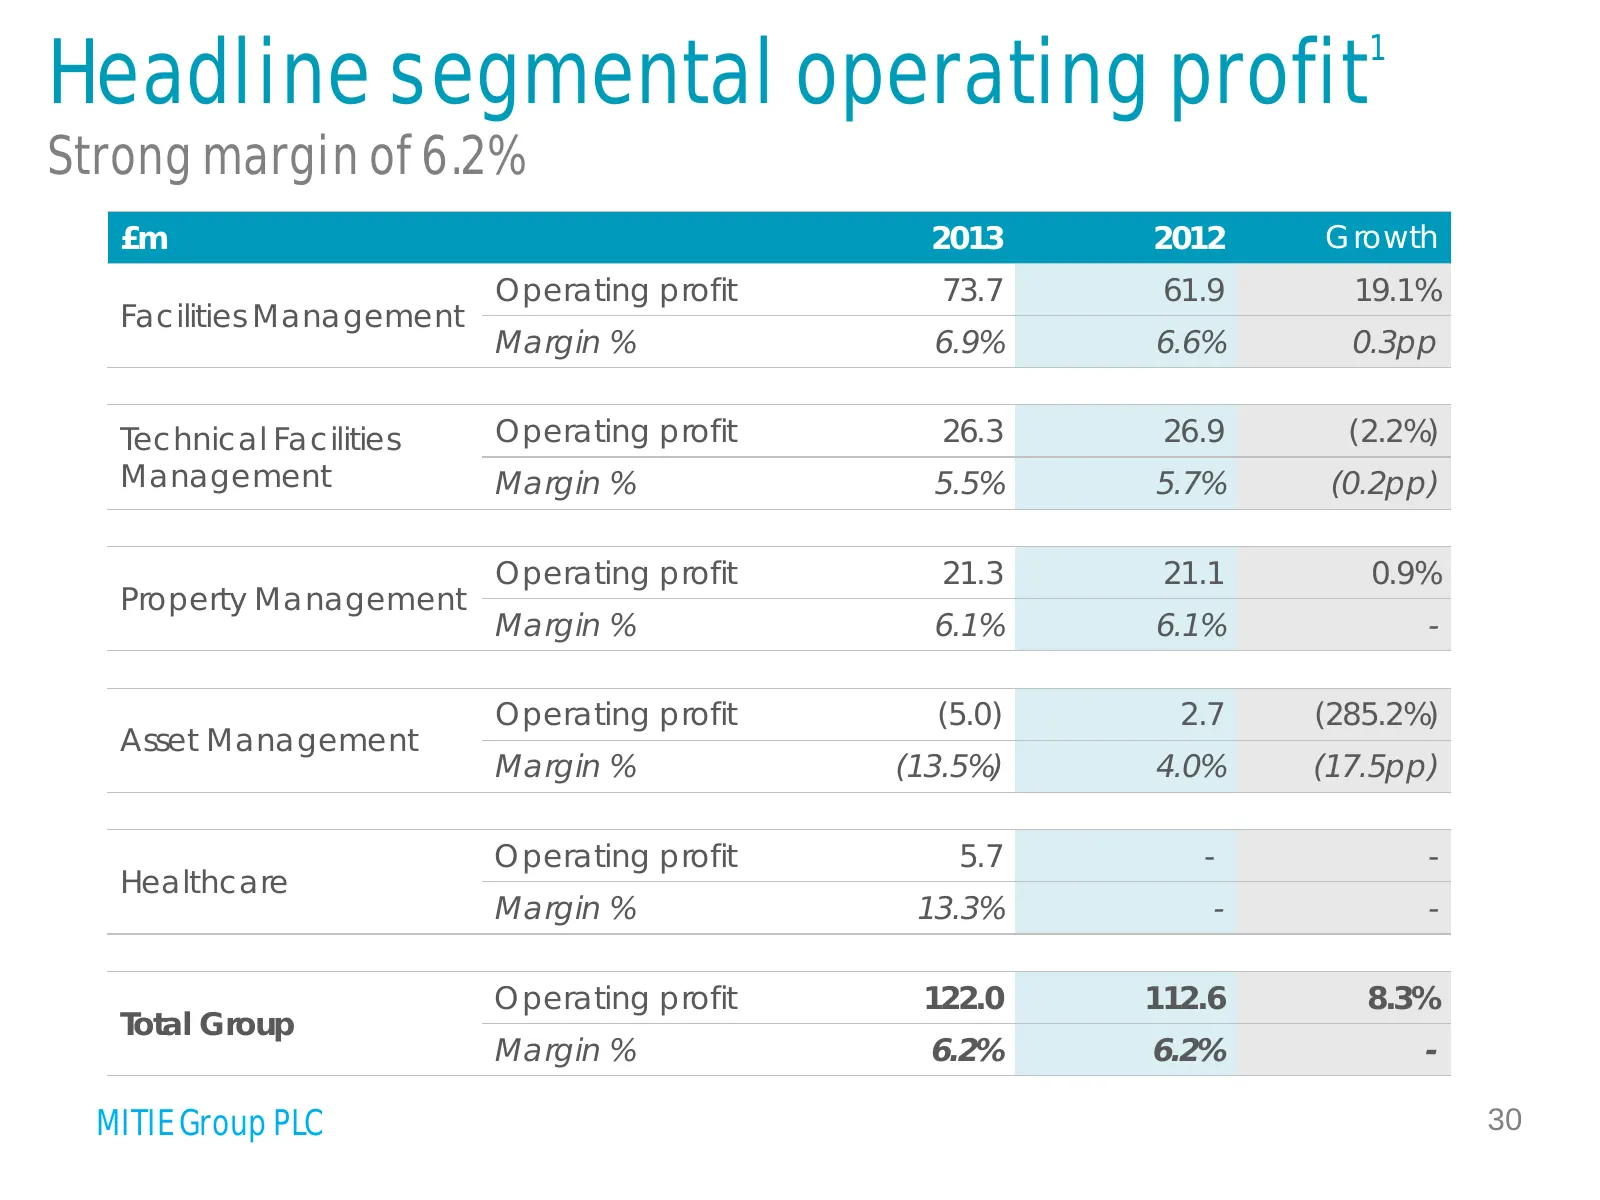
Slide 30: Headline segmental operating profit
Headline segmental operating profit 1 Strong margin of 6.2% £m 2013 2012 Growth Operating profit 73.7 61.9 19.1% Facilities Management Margin % 6.9% 6.6% 0.3pp Technical Facilities Operating profit 26.3 26.9 (2.2%) Management Margin % 5.5% 5.7% (0.2pp) Operating profit 21.3 21.1 0.9% Property Manage
Slide 31: New structure
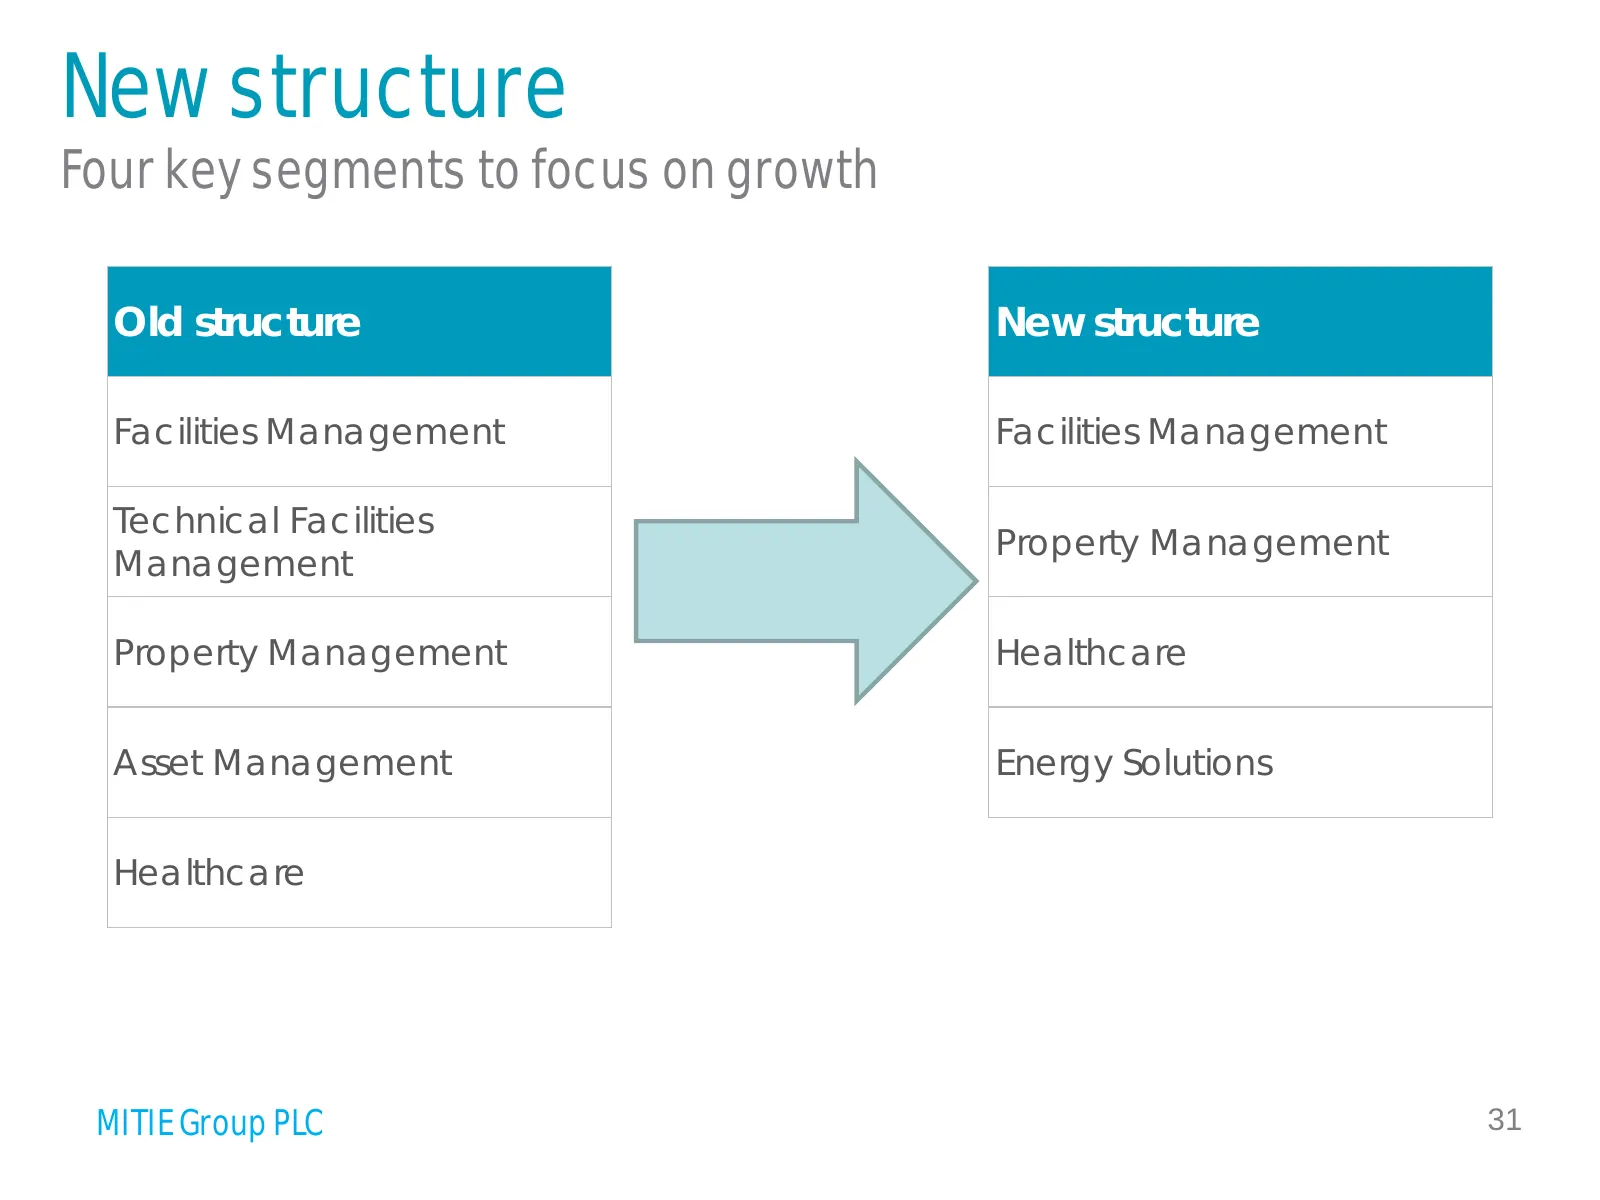
New structure Four key segments to focus on growth Old structure New structure Facilities Management Facilities Management Technical Facilities Property Management Management Property Management Healthcare Asset Management Energy Solutions Healthcare MITIE Group PLC 31
Slide 32: Headline segmental revenue, effective April 2013
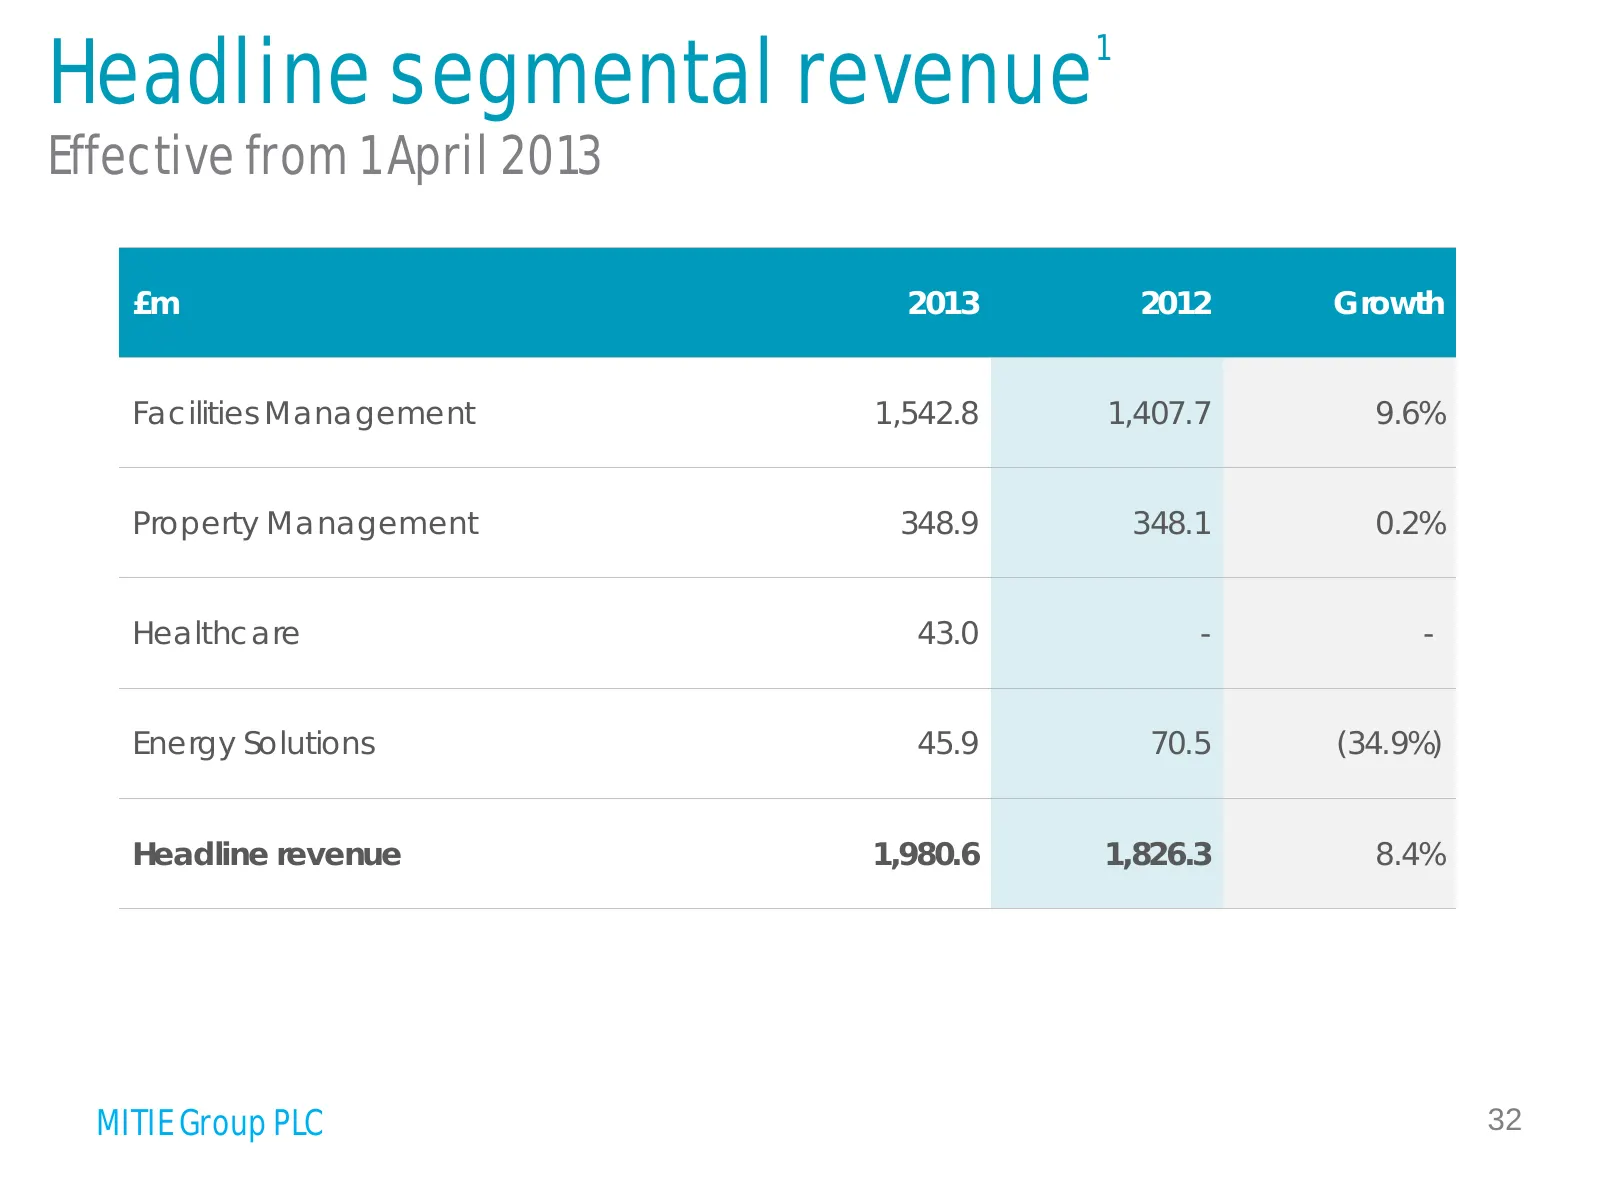
Headline segmental revenue 1 Effective from 1 April 2013 £m 2013 2012 Growth Facilities Management 1,542.8 1,407.7 9.6% Property Management 348.9 348.1 0.2% Healthcare 43.0 - - Energy Solutions 45.9 70.5 (34.9%) Headline revenue 1,980.6 1,826.3 8.4% MITIE Group PLC 32
Slide 33: Headline segmental operating profit, effective April 2013
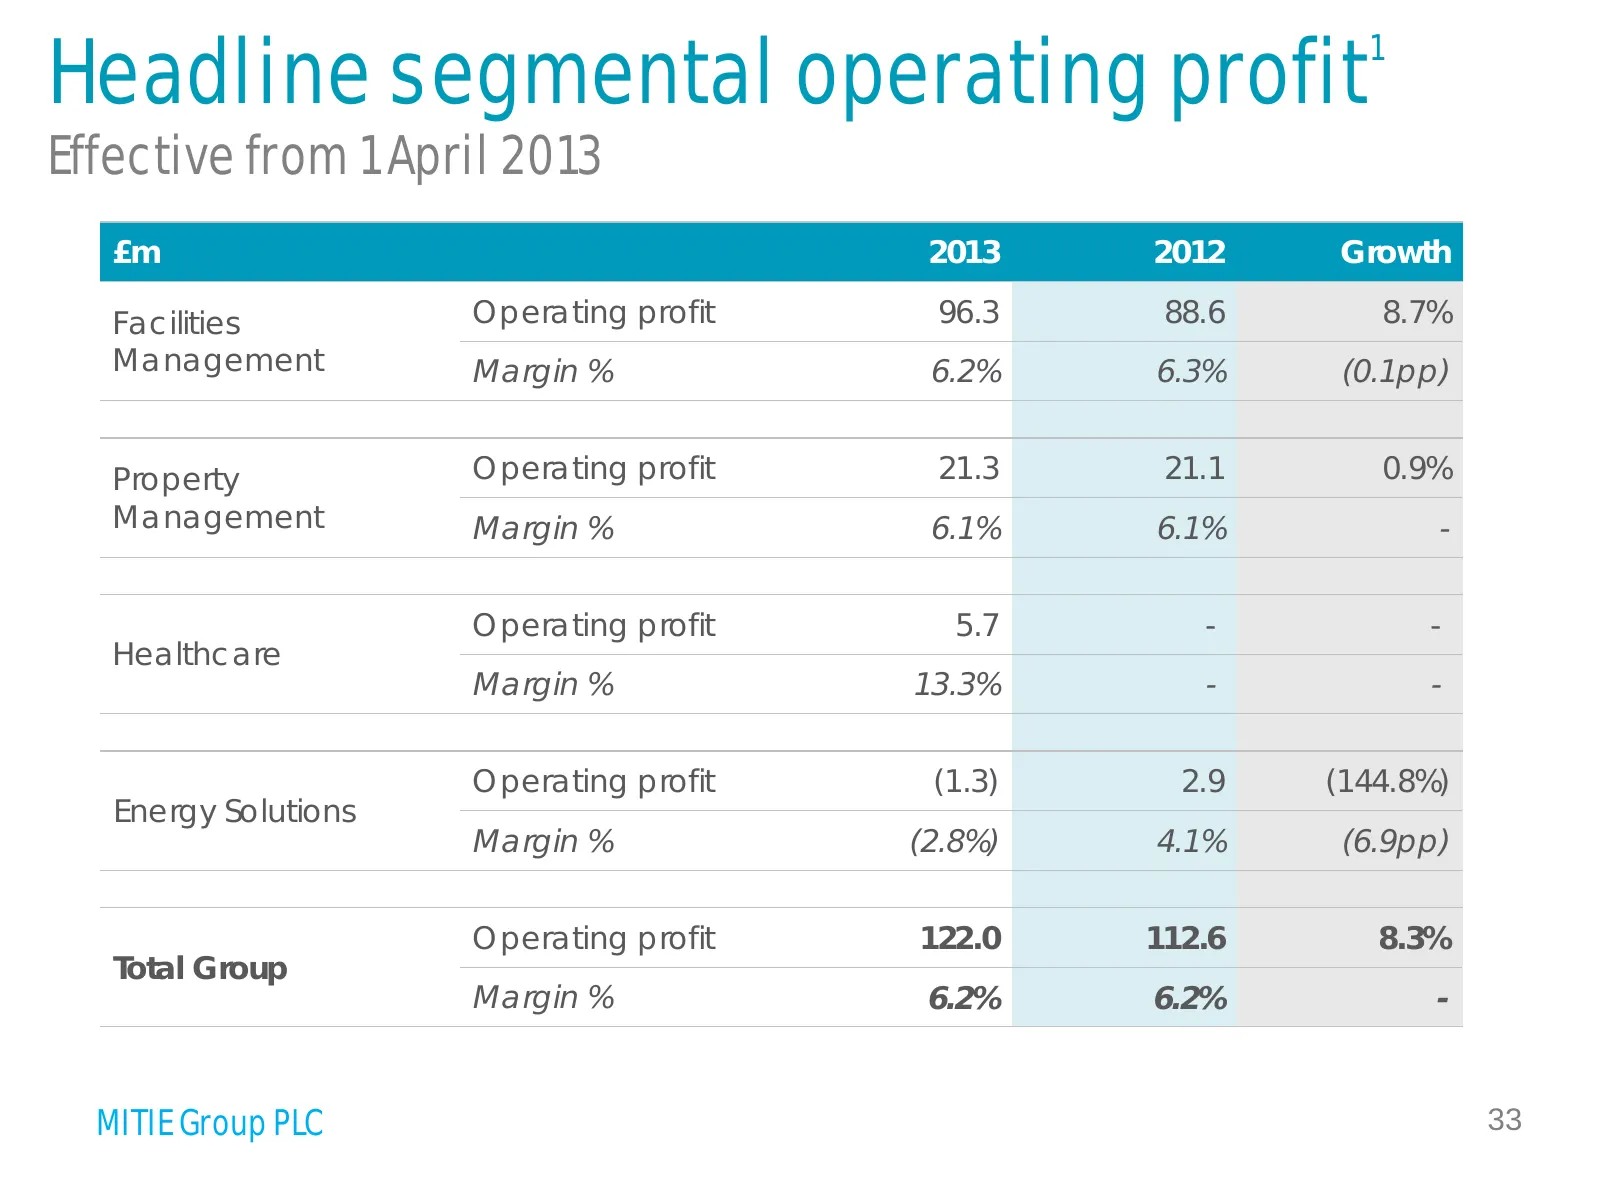
Headline segmental operating profit 1 Effective from 1 April 2013 £m 2013 2012 Growth Facilities Operating profit 96.3 88.6 8.7% Management Margin % 6.2% 6.3% (0.1pp) Property Operating profit 21.3 21.1 0.9% Management Margin % 6.1% 6.1% - Operating profit 5.7 - - Healthcare Margin % 13.3% - - Opera
Slide 34: Other items
Other items Driven by our decision to exit our cyclical M&E engineering contracting businesses Impact of businesses being exited £m 2013 2012 Growth Revenue 139.9 176.2 (20.6%) Other items £m 2013 2012 Trading loss of businesses being exited 3.1 0.9 Business closure costs of businesses being exited
Slide 35: Finance costs
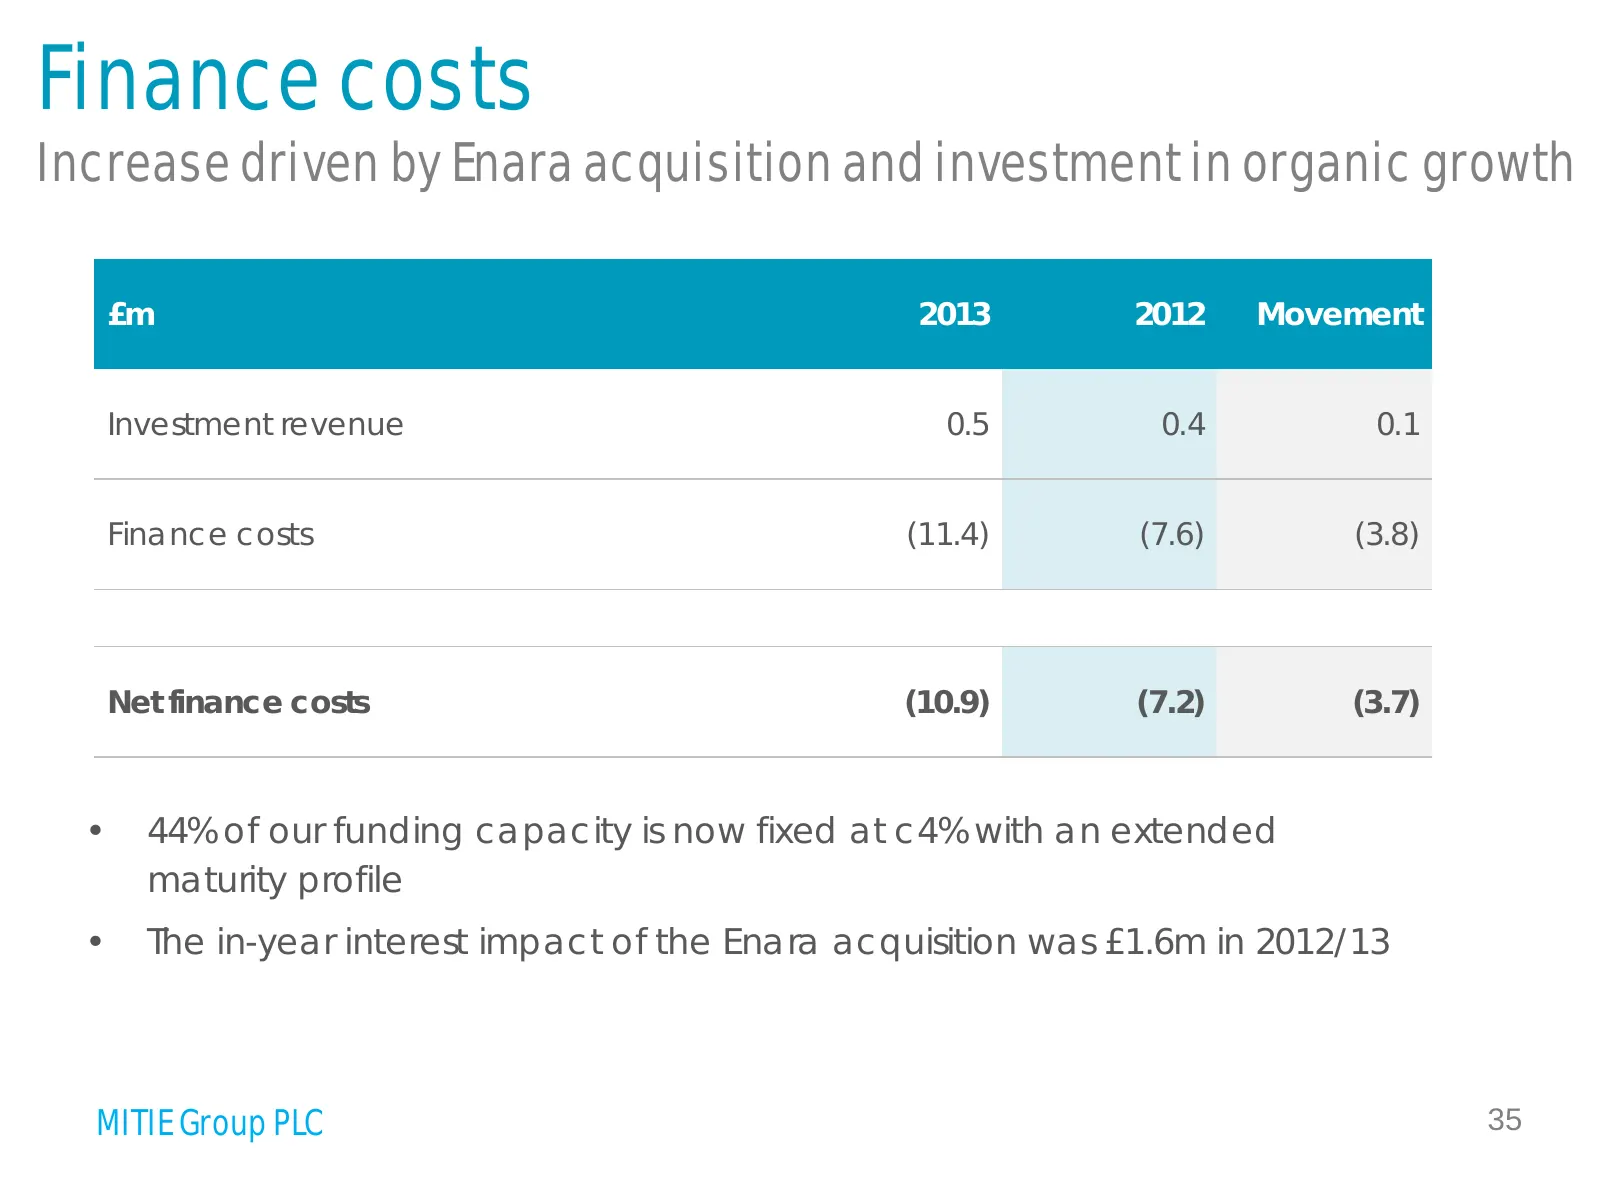
Finance costs Increase driven by Enara acquisition and investment in organic growth £m 2013 2012 Movement Investment revenue 0.5 0.4 0.1 Finance costs (11.4) (7.6) (3.8) Net finance costs (10.9) (7.2) (3.7) • 44% of our funding capacity is now fixed at c4% with an extended maturity profile • The in-
Slide 36: Dividend
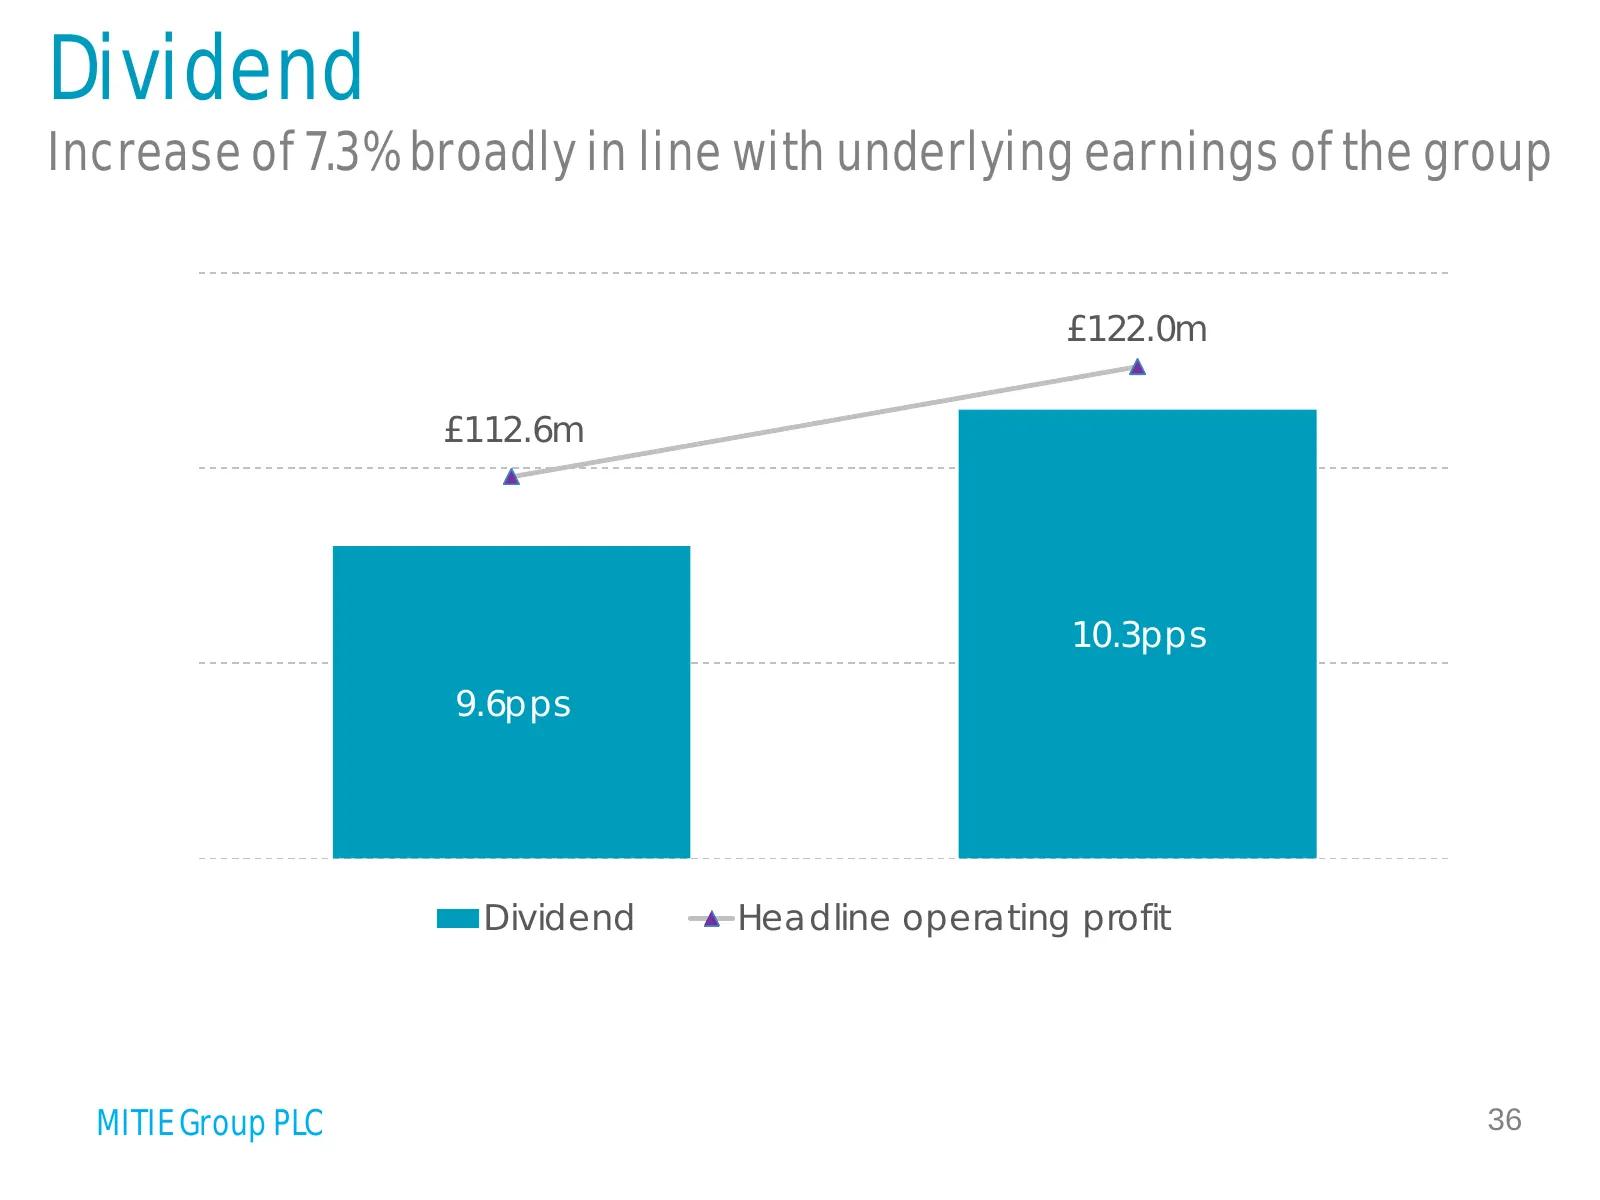
Dividend Increase of 7.3% broadly in line with underlying earnings of the group 130.0 11 £122.0m 120.0 £112.6m 10 110.0 100.0 10.3pps 9 9.6pps 90.0 80.0 8 Dividend Headline operating profit MITIE Group PLC 36
Slide 37: Cash conversion
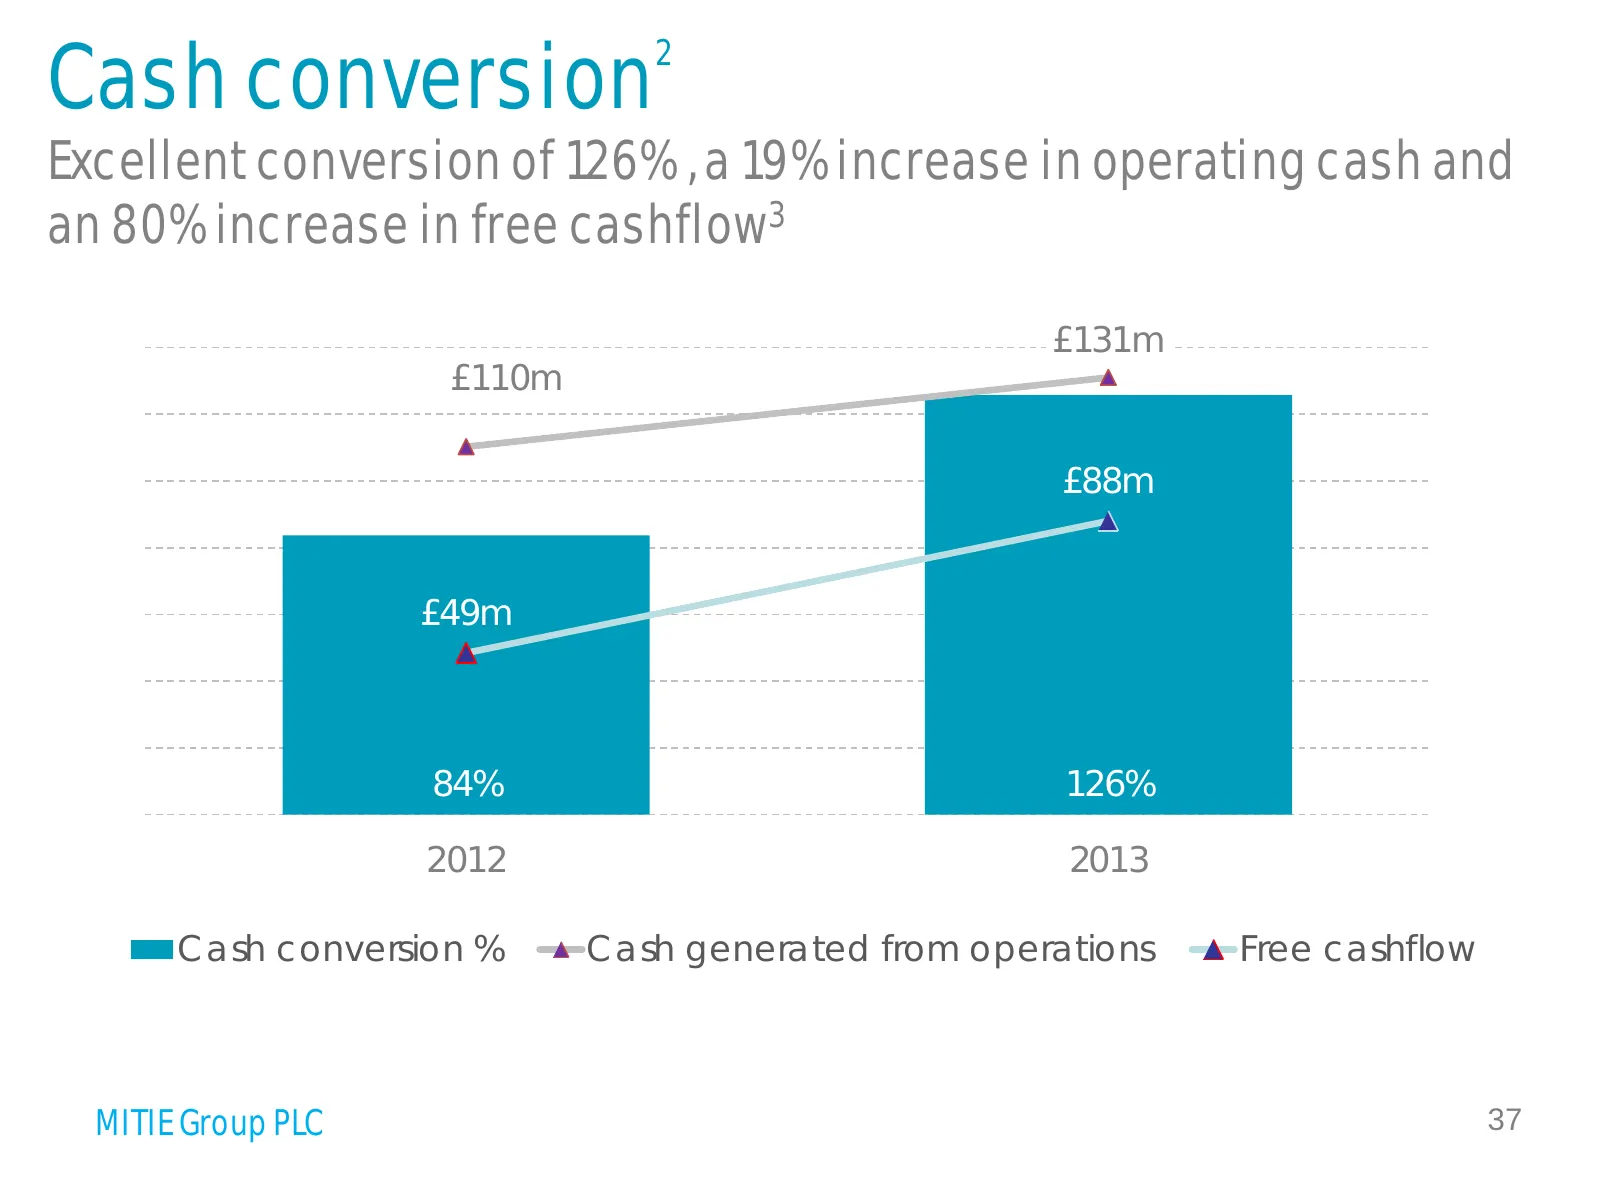
Cash conversion 2 Excellent conversion of 126% , a 19% increase in operating cash and an 80% increase in free cashflow3 140% £131m 140 £110m 105.9 120% 120 100% £88m 100 80% 80 60% £49m 60 40% 40 20% 20 84% 126% 0% 0 2012 2013 Cash conversion % Cash generated from operations Free cashflow MITIE Grou
Slide 38: Strong working capital management
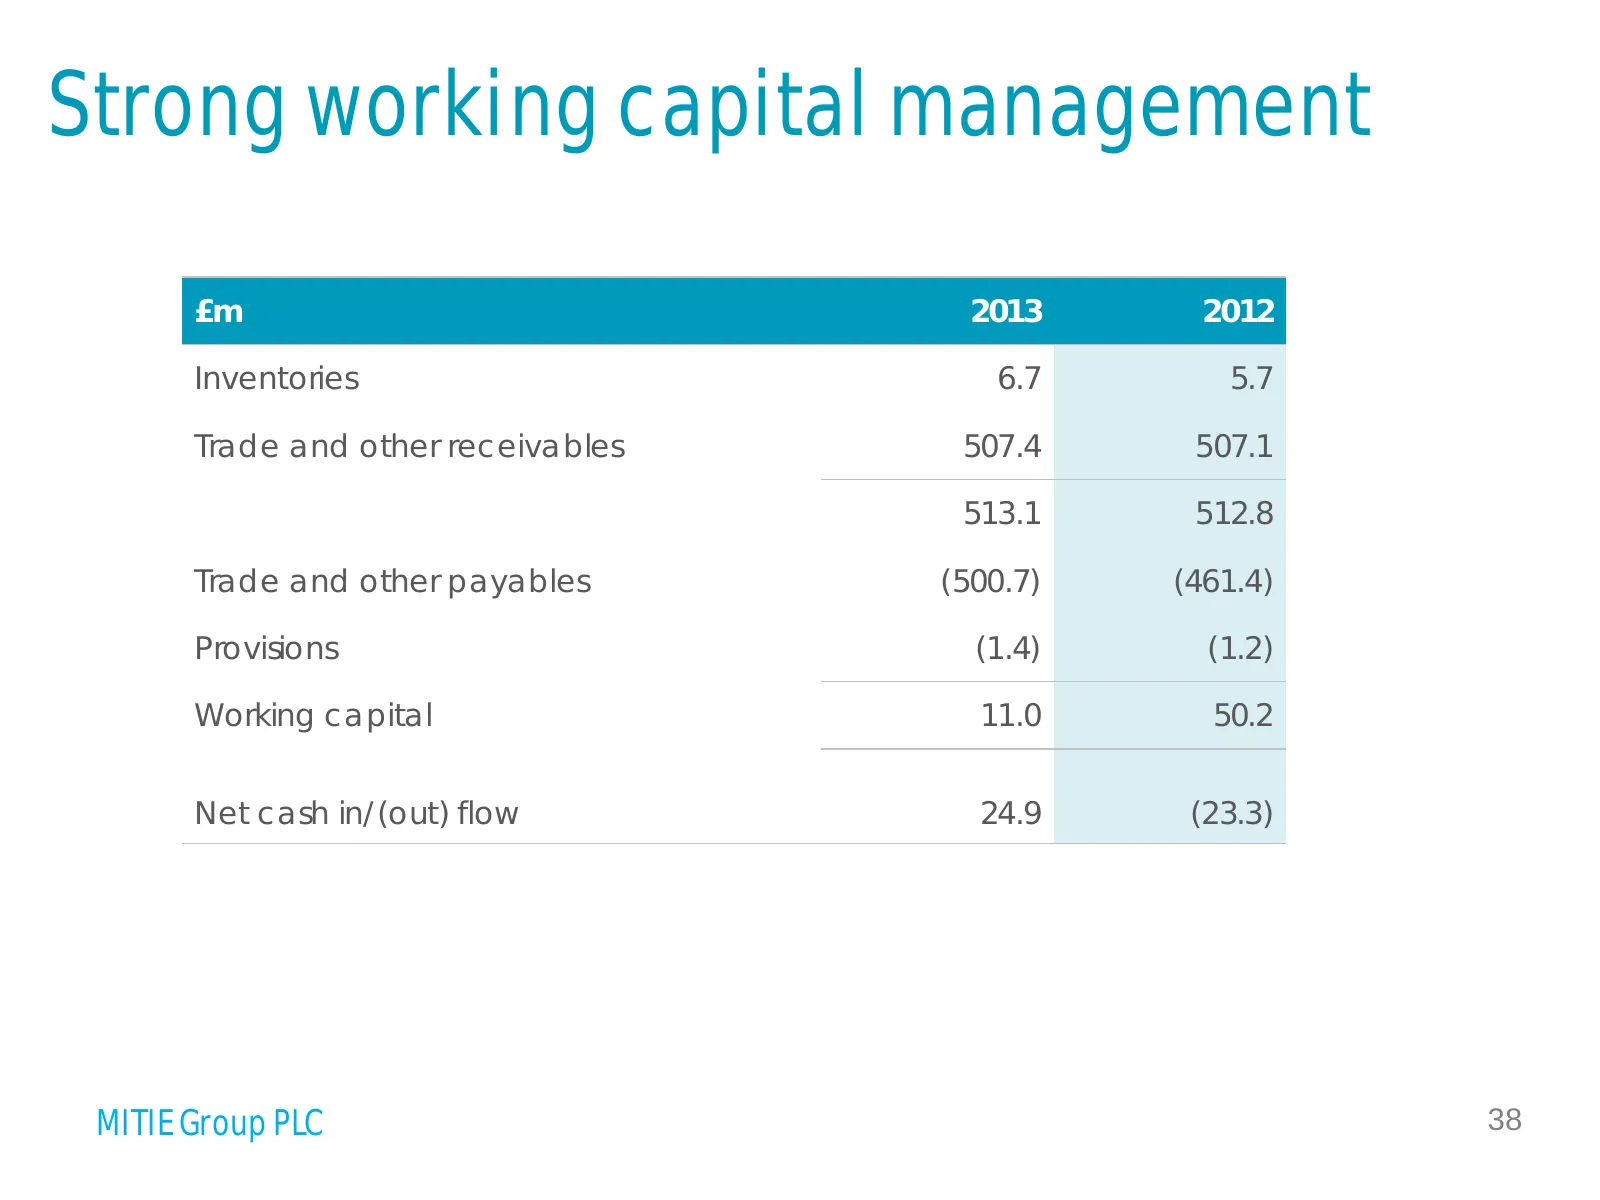
Strong working capital management £m 2013 2012 Inventories 6.7 5.7 Trade and other receivables 507.4 507.1 513.1 512.8 Trade and other payables (500.7) (461.4) Provisions (1.4) (1.2) Working capital 11.0 50.2 Net cash in/(out) flow 24.9 (23.3) MITIE Group PLC 38
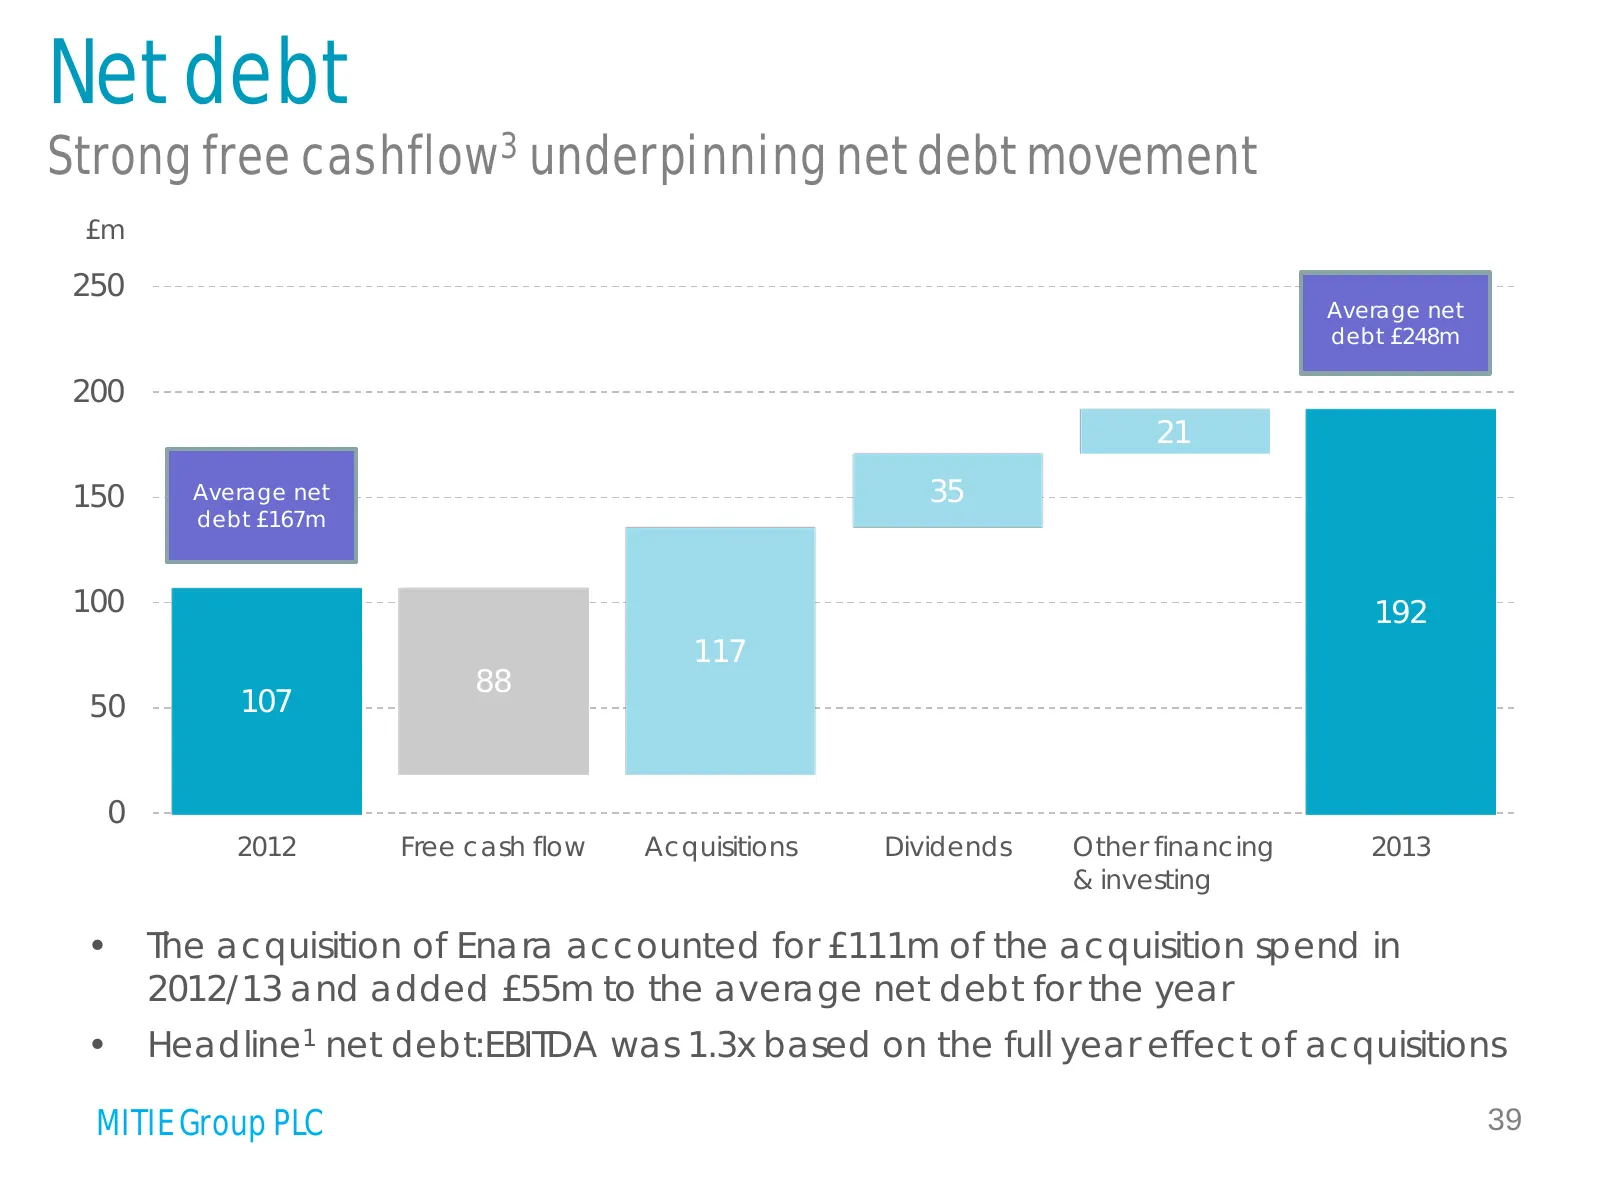
Slide 39: Net debt
Net debt Strong free cashflow3 underpinning net debt movement £m 250 Average net debt £248m 200 21 150 Average net 35 debt £167m 100 192 117 88 50 107 0 2012 Free cash flow Acquisitions Dividends Other financing 2013 & investing • The acquisition of Enara accounted for £111m of the acquisition spend
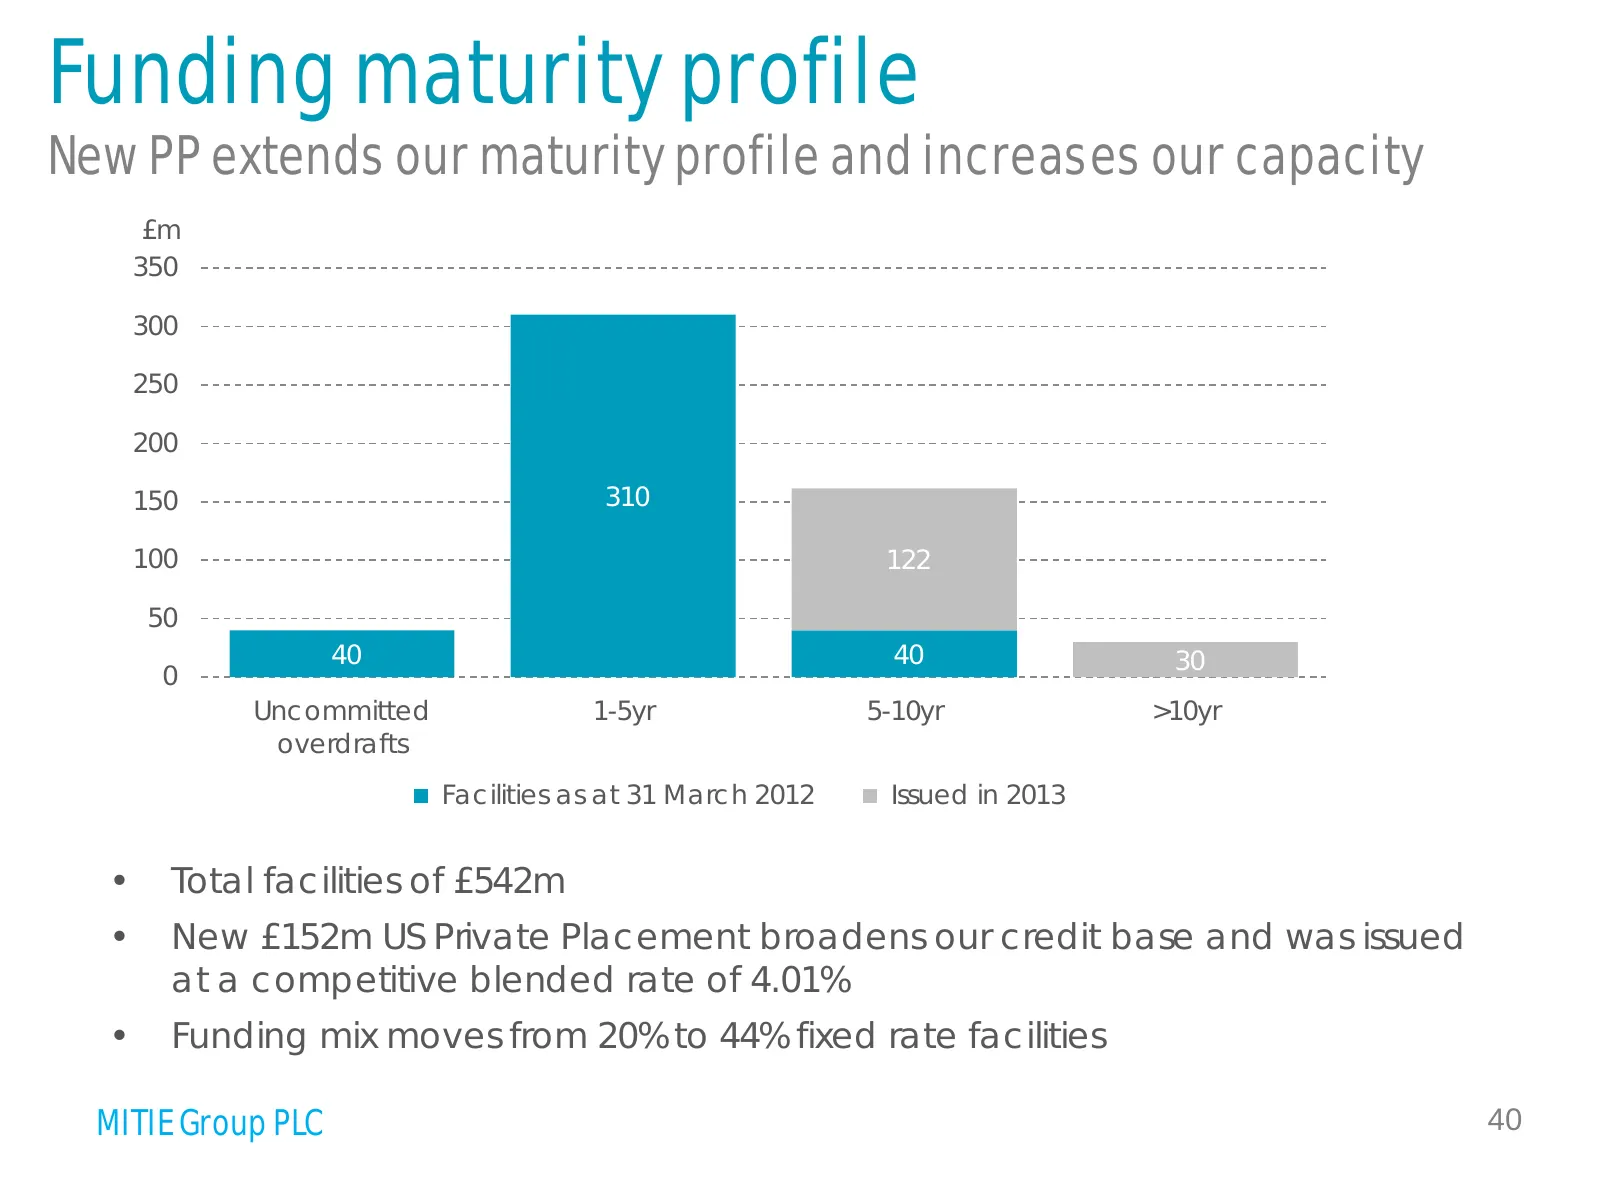
Slide 40: Funding maturity profile
Funding maturity profile New PP extends our maturity profile and increases our capacity £m 350 300 250 200 150 310 100 122 50 40 40 30 0 - Uncommitted 1-5yr 5-10yr >10yr overdrafts Facilities as at 31 March 2012 Issued in 2013 • Total facilities of £542m • New £152m US Private Placement broadens our
Slide 41: MITIE investment case
MITIE investment case • Diversified portfolio with high quality blue chip client base • Strong margins with focus on future margin enhancement in growth markets • Exit strategy for cyclical businesses enacted to curtail downside risk • Acquisitive growth – Track record of value creation – Capacity i
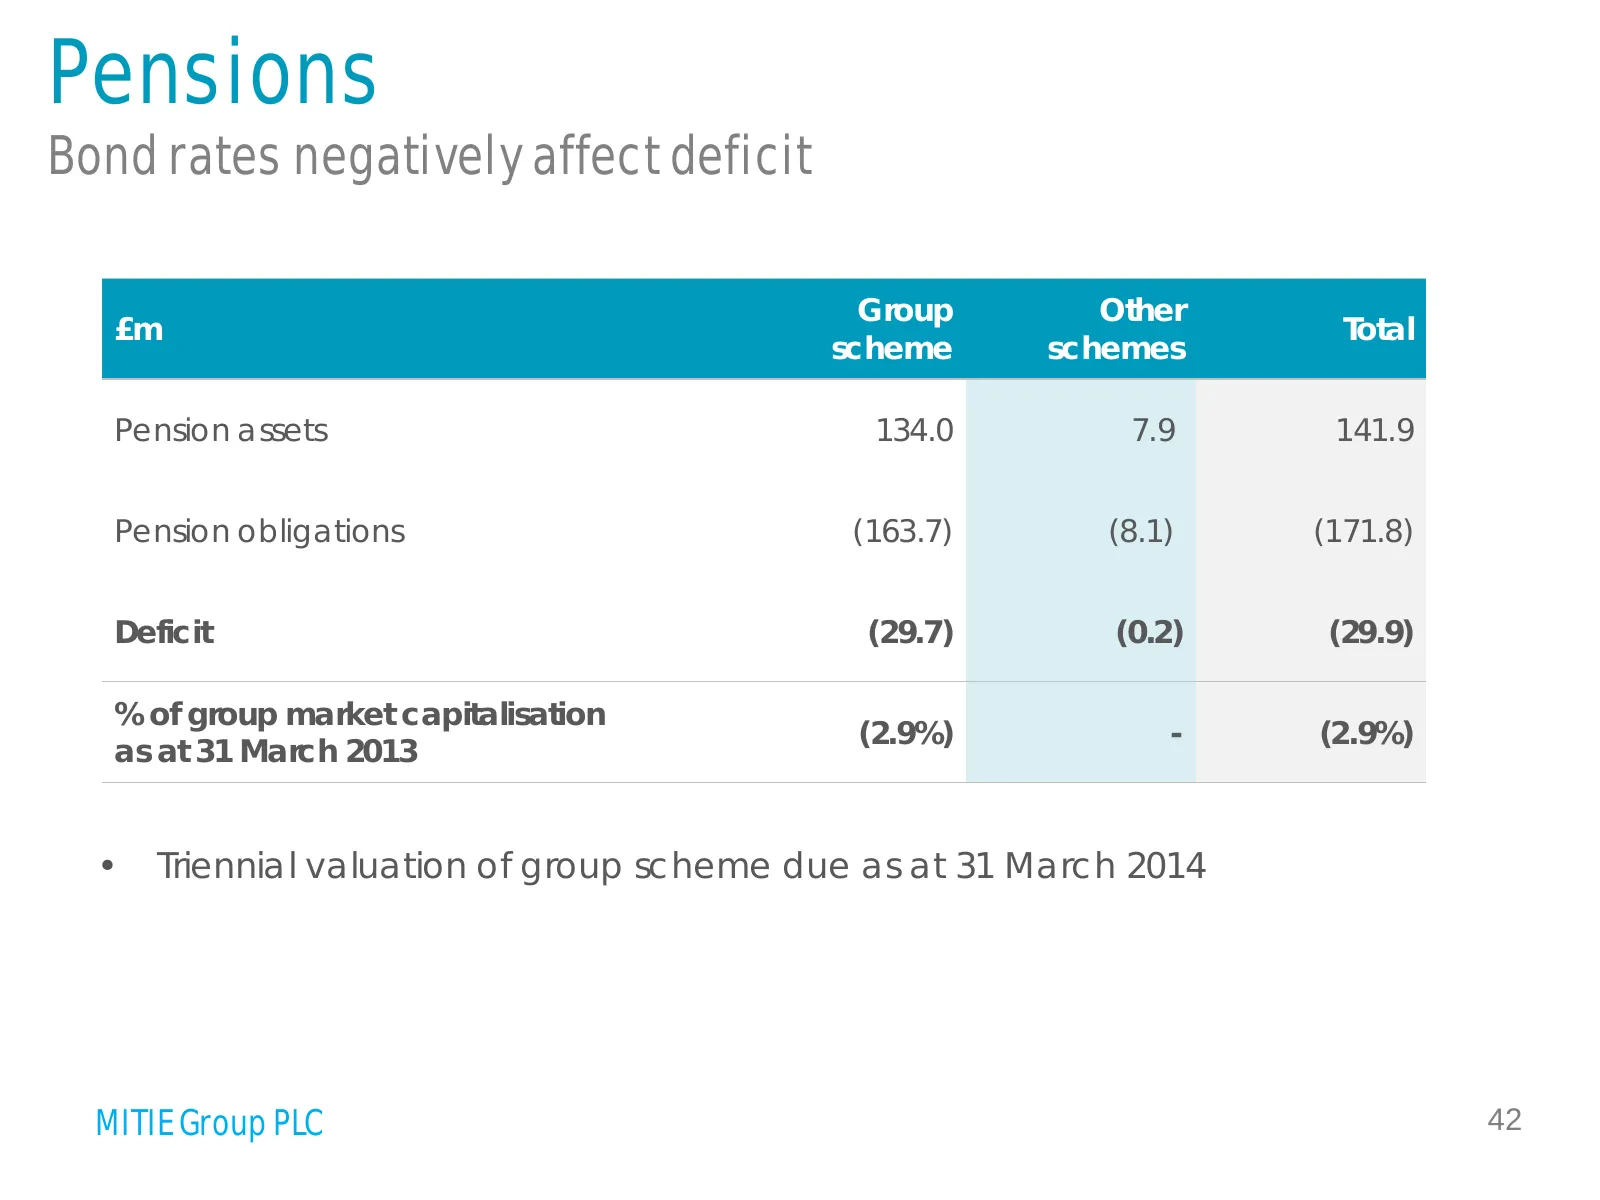
Slide 42: Pensions
Pensions Bond rates negatively affect deficit Group Other £m Total scheme schemes Pension assets 134.0 7.9 141.9 Pension obligations (163.7) (8.1) (171.8) Deficit (29.7) (0.2) (29.9) % of group market capitalisation (2.9%) - (2.9%) as at 31 March 2013 • Triennial valuation of group scheme due as at
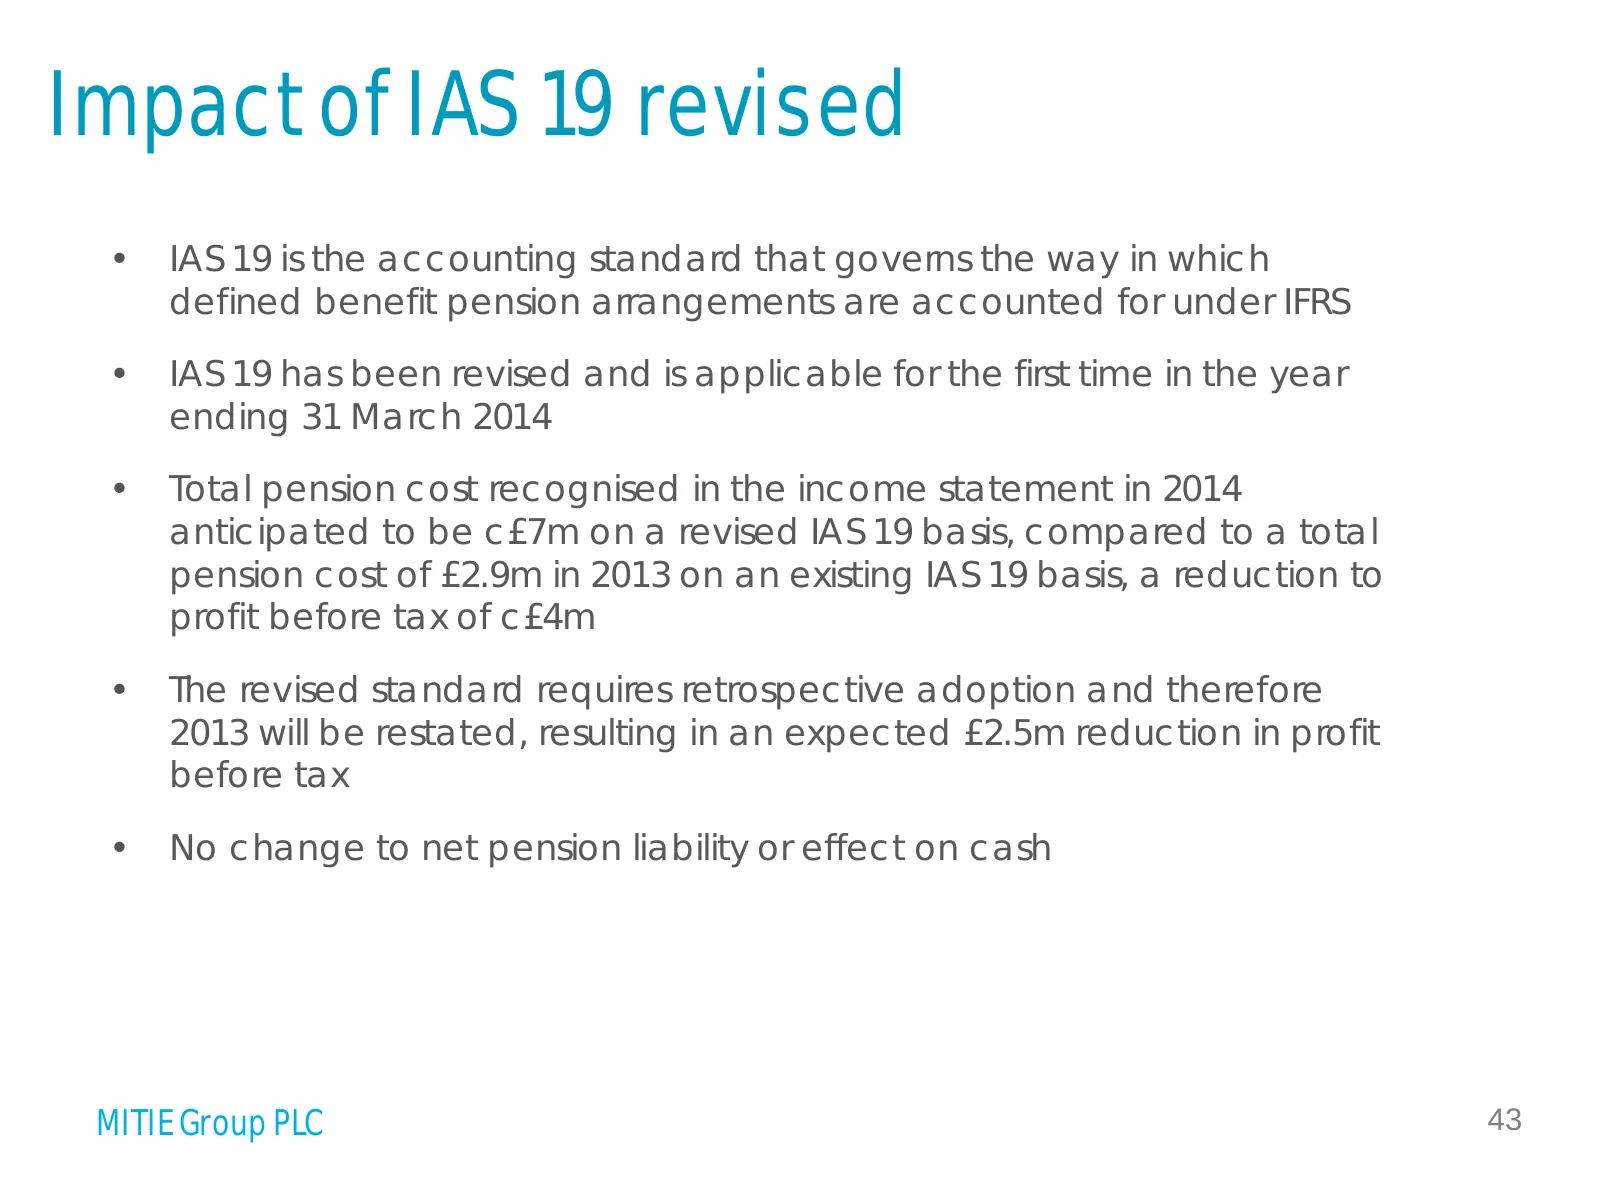
Slide 43: Impact of IAS 19 revised
Impact of IAS 19 revised • IAS 19 is the accounting standard that governs the way in which defined benefit pension arrangements are accounted for under IFRS • IAS 19 has been revised and is applicable for the first time in the year ending 31 March 2014 • Total pension cost recognised in the income s
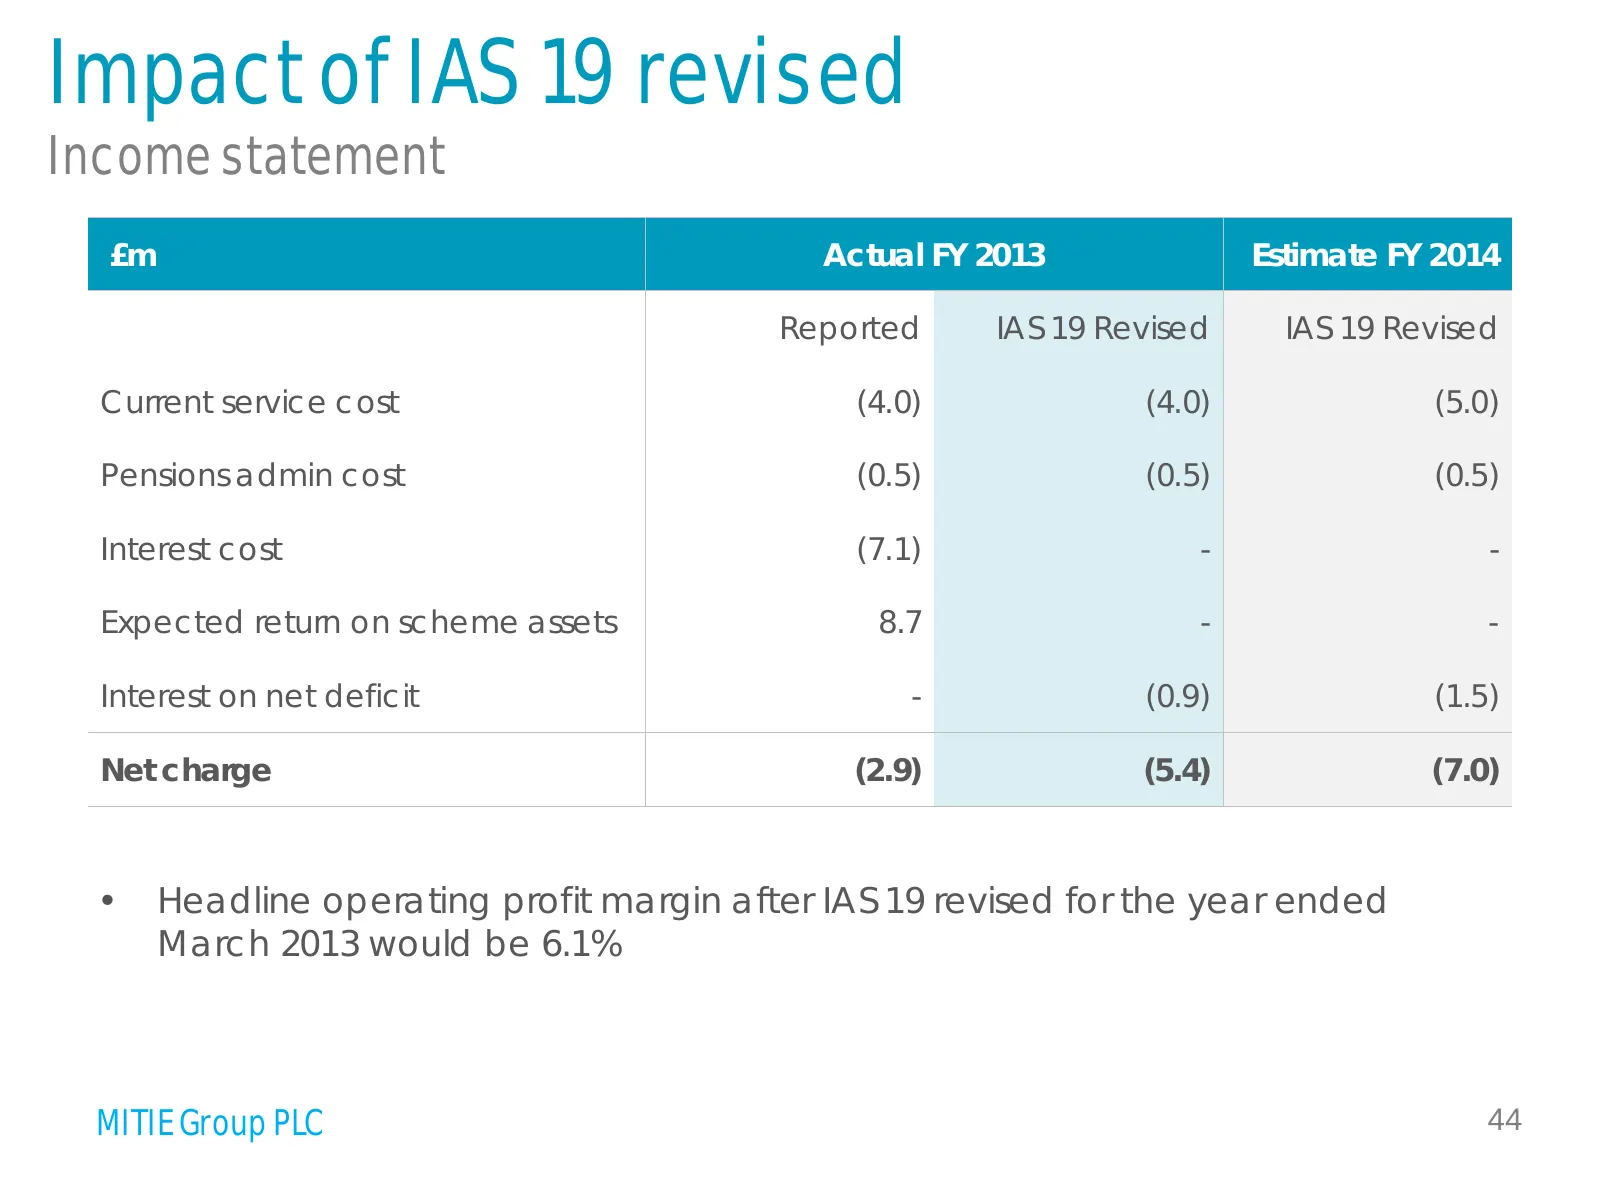
Slide 44: Impact of IAS 19 revised: Income statement
Impact of IAS 19 revised Income statement £m Actual FY 2013 Estimate FY 2014 Reported IAS 19 Revised IAS 19 Revised Current service cost (4.0) (4.0) (5.0) Pensions admin cost (0.5) (0.5) (0.5) Interest cost (7.1) - - Expected return on scheme assets 8.7 - - Interest on net deficit - (0.9) (1.5) Net
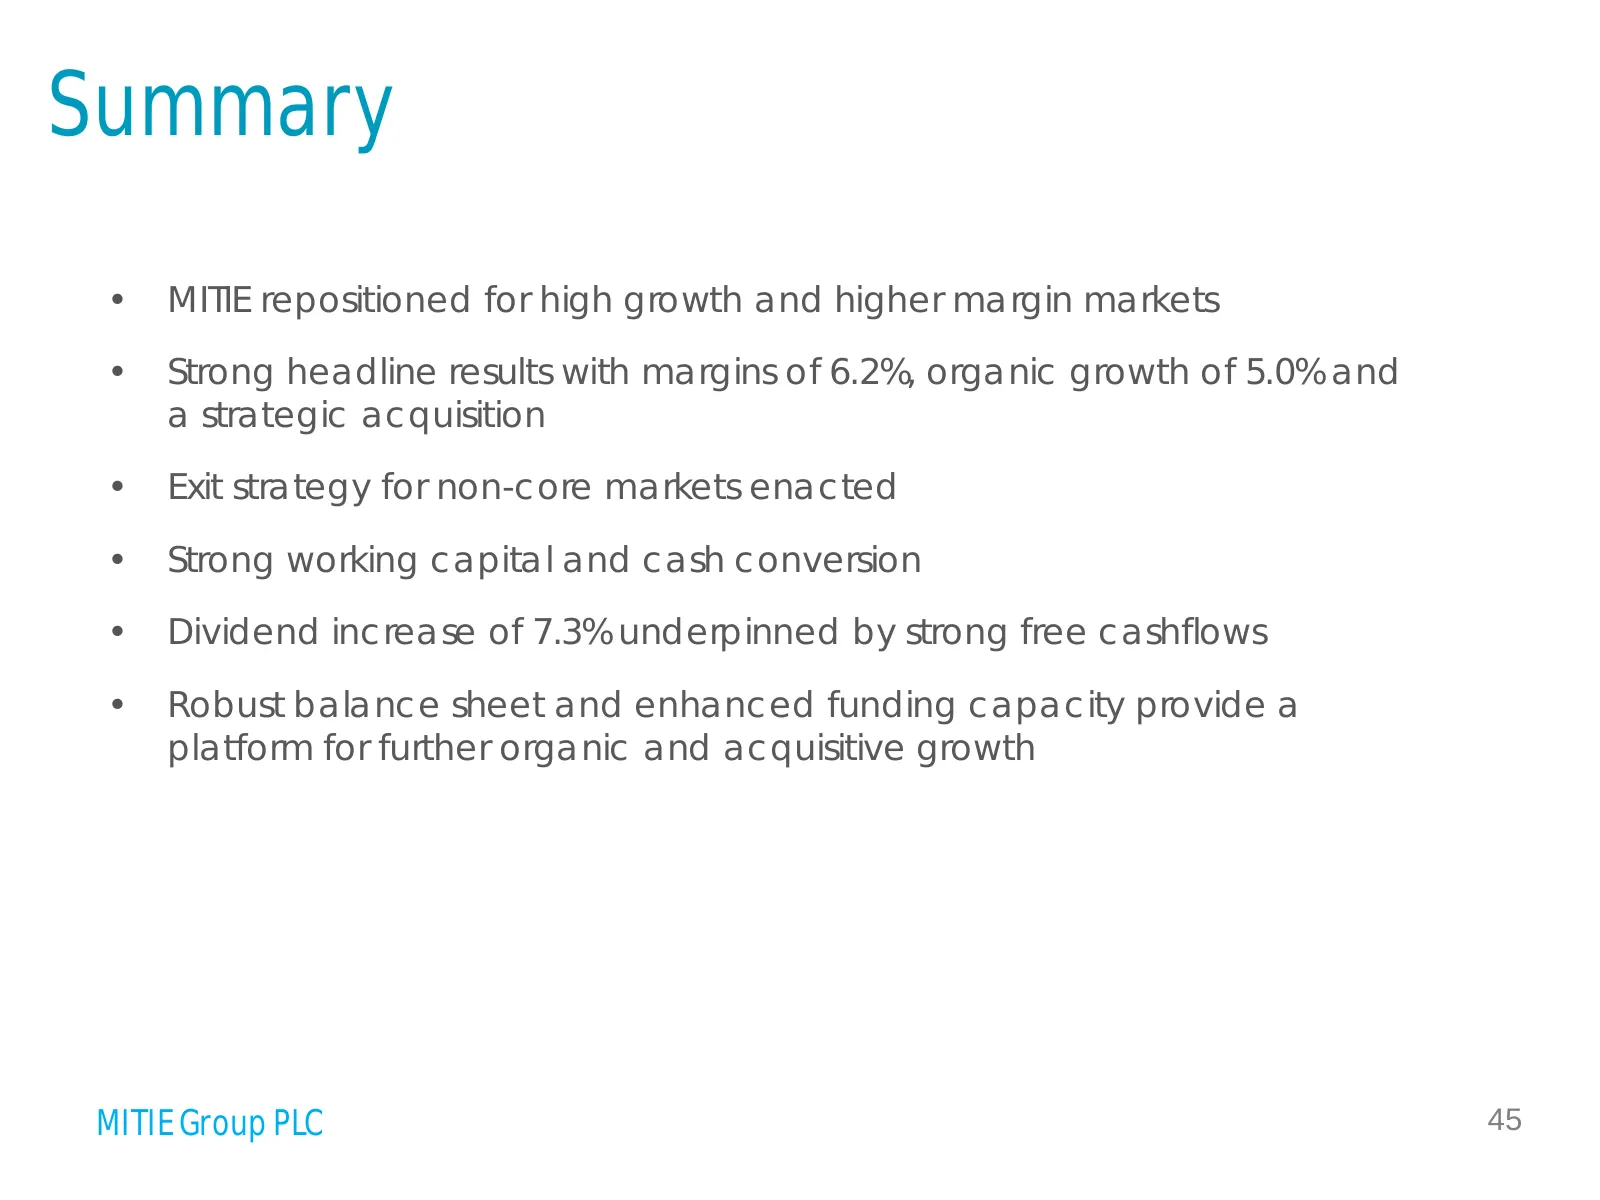
Slide 45: Summary
Summary • MITIE repositioned for high growth and higher margin markets • Strong headline results with margins of 6.2%, organic growth of 5.0% and a strategic acquisition • Exit strategy for non-core markets enacted • Strong working capital and cash conversion • Dividend increase of 7.3% underpinned

Slide 46: Ruby McGregor-Smith CBE, Chief Executive
Ruby McGregor-Smith CBE Chief Executive MITIE Group PLC 46
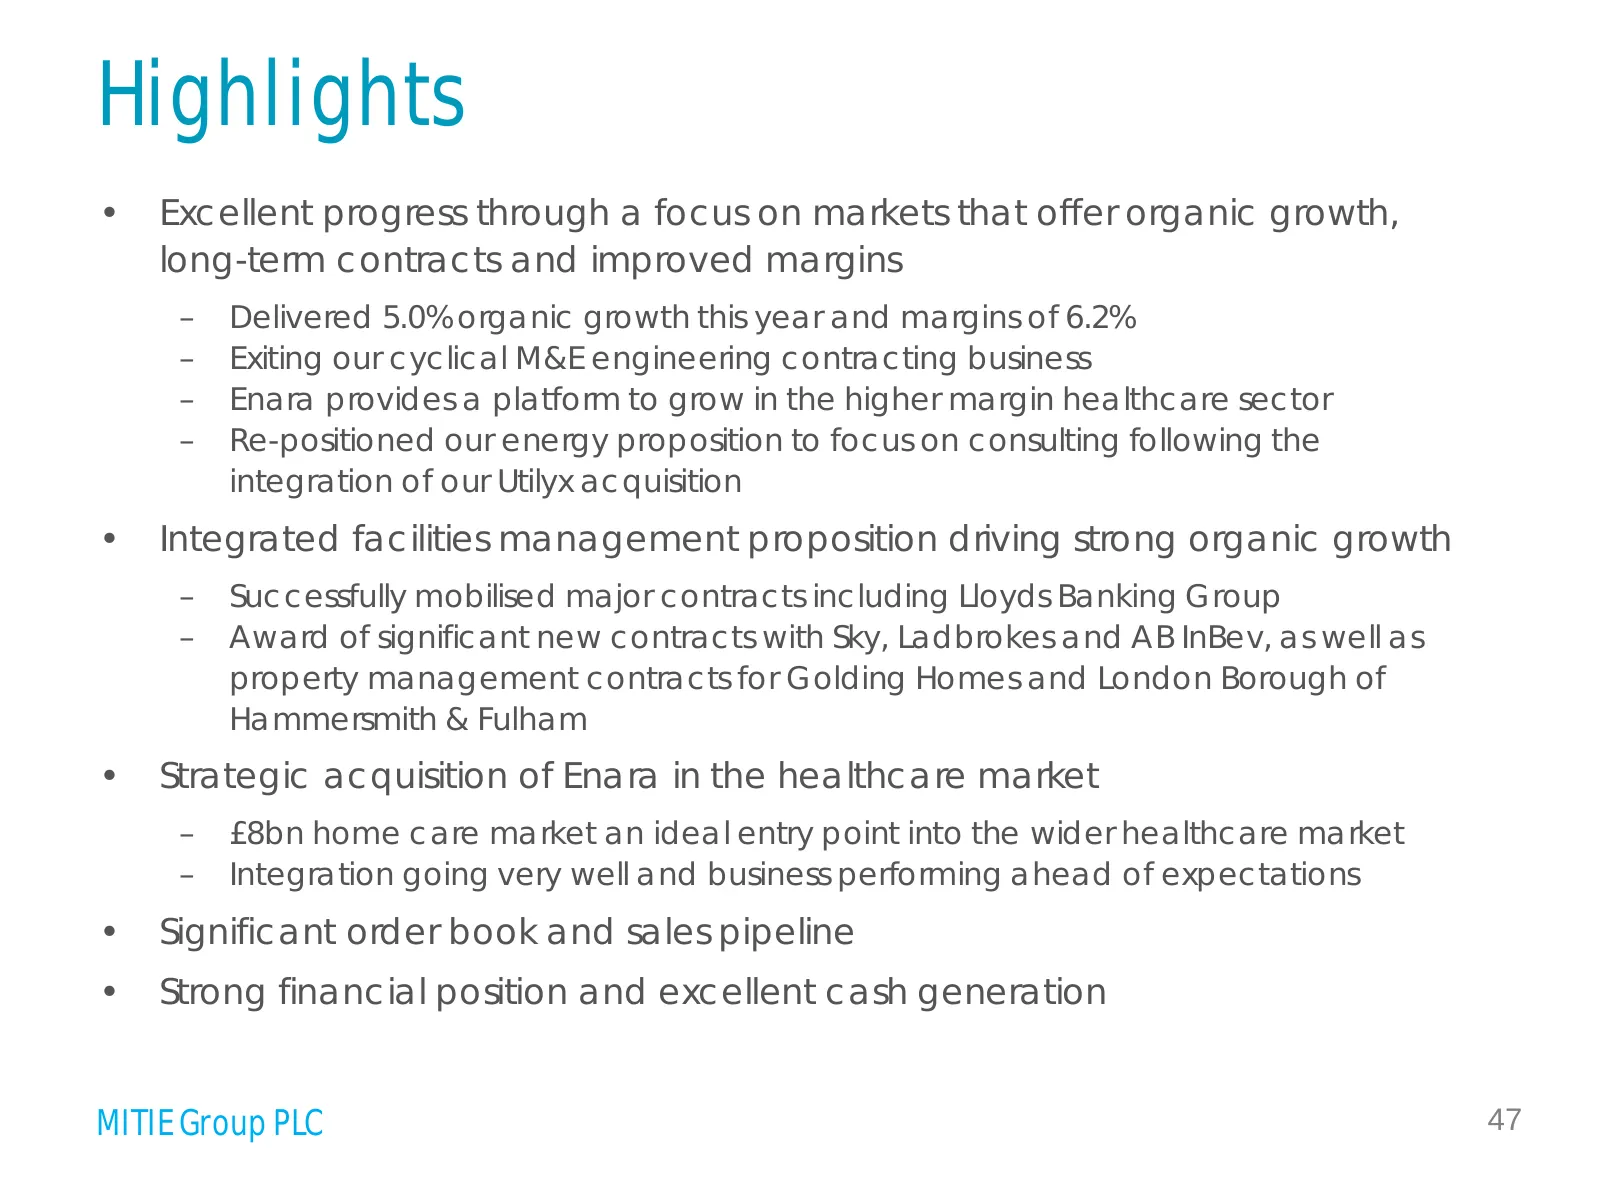
Slide 47: Highlights
Highlights • Excellent progress through a focus on markets that offer organic growth, long-term contracts and improved margins – Delivered 5.0% organic growth this year and margins of 6.2% – Exiting our cyclical M&E engineering contracting business – Enara provides a platform to grow in the higher m
Slide 48: Outlook
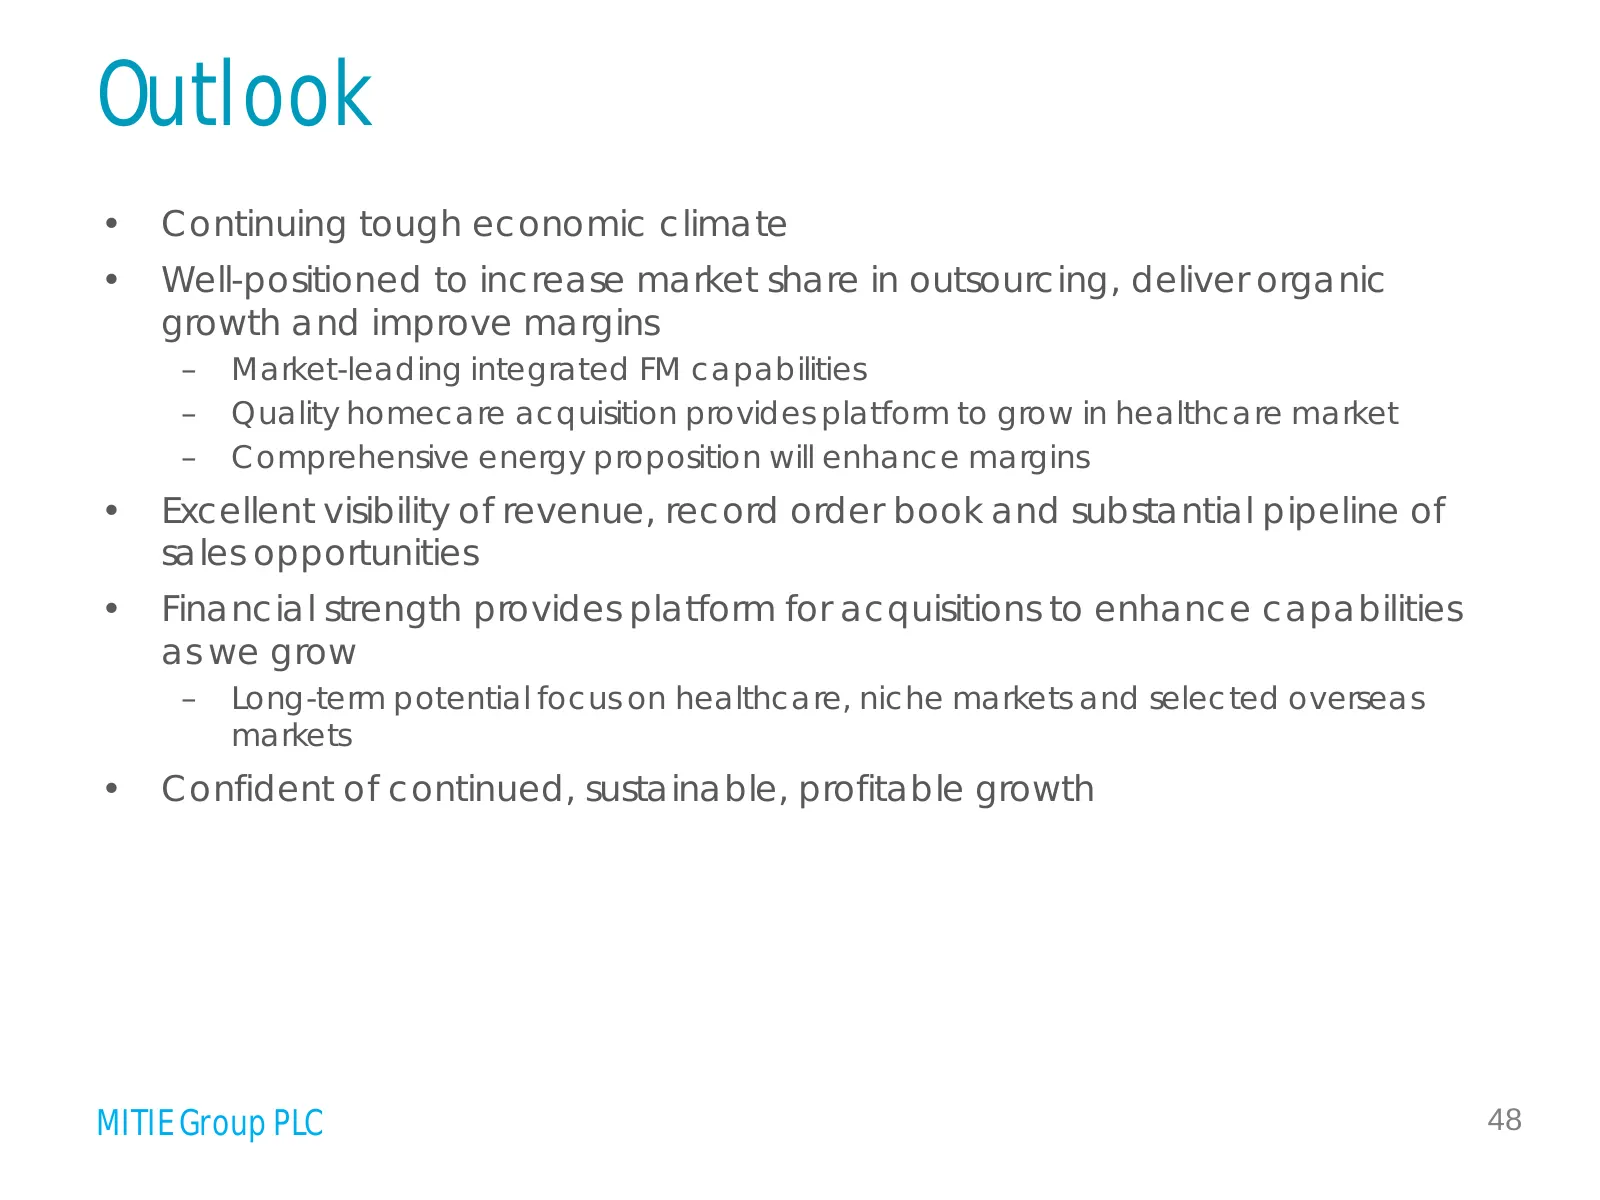
Outlook • Continuing tough economic climate • Well-positioned to increase market share in outsourcing, deliver organic growth and improve margins – Market-leading integrated FM capabilities – Quality homecare acquisition provides platform to grow in healthcare market – Comprehensive energy propositi

Slide 49: Appendix
Appendix MITIE Group PLC 49
Slide 50: Definitions
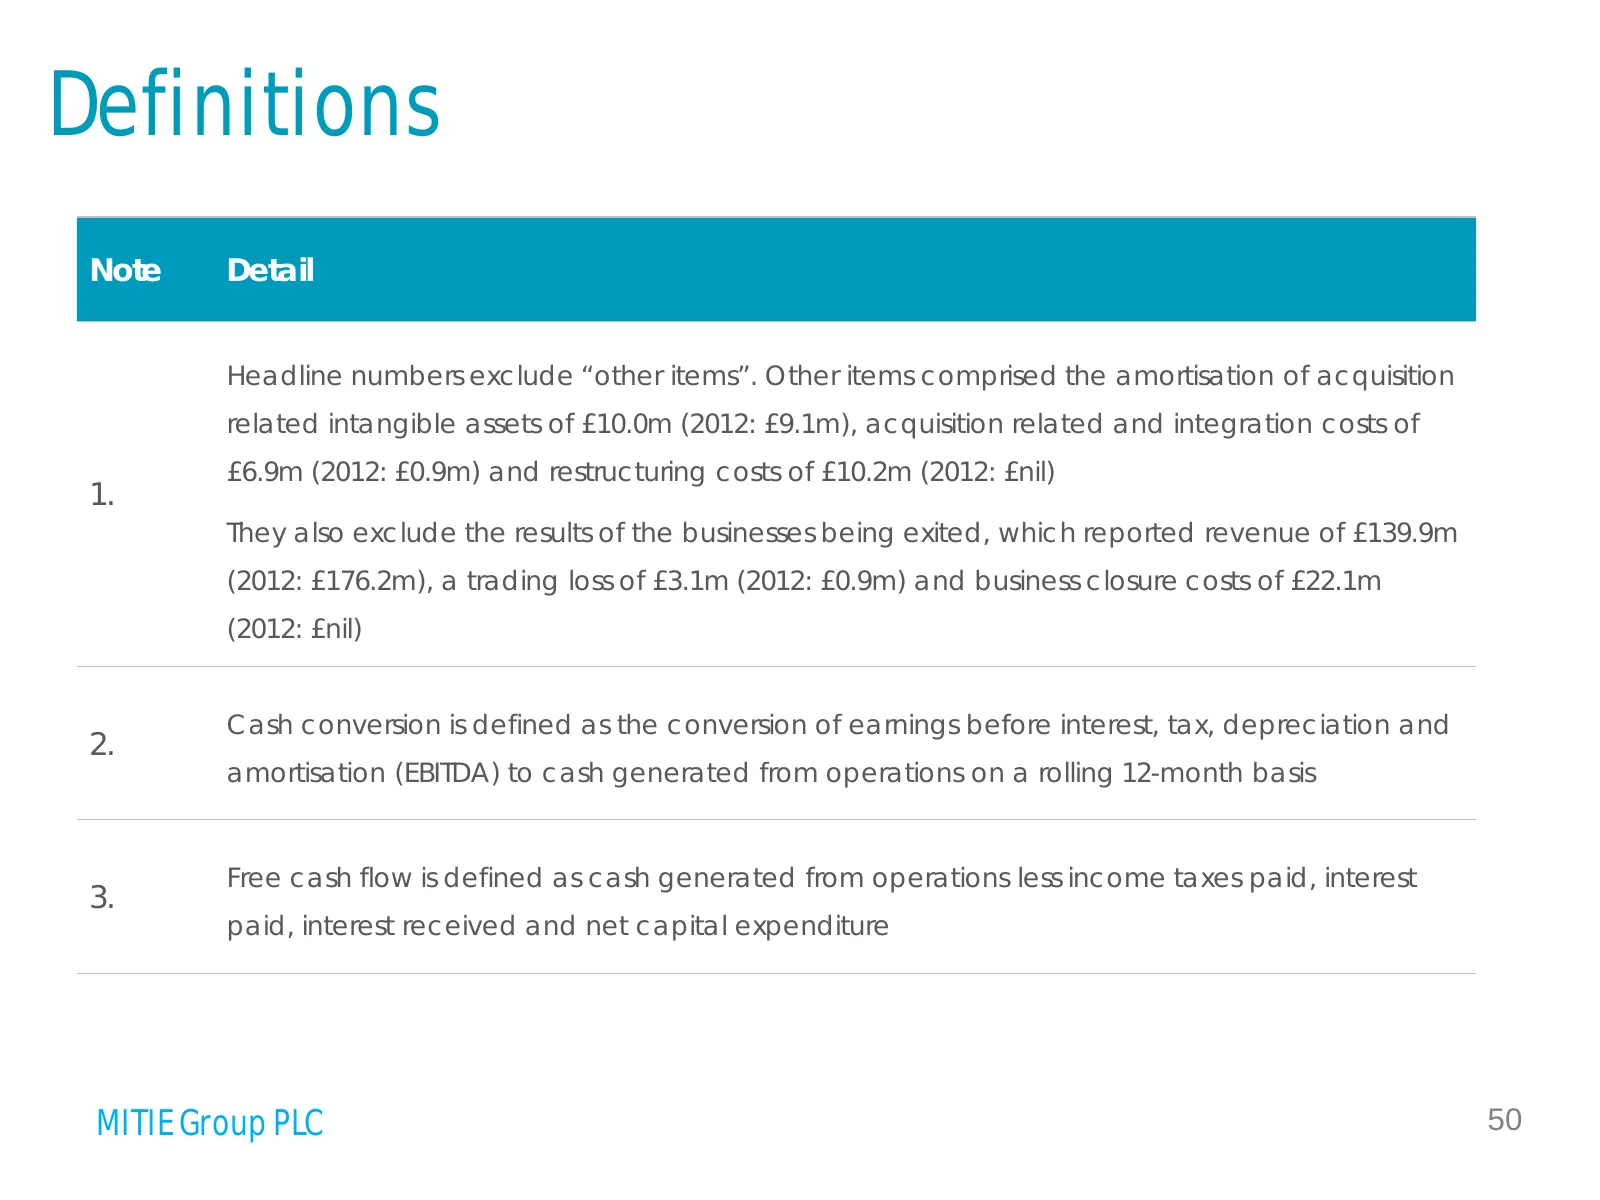
Definitions Note Detail Headline numbers exclude “other items”. Other items comprised the amortisation of acquisition related intangible assets of £10.0m (2012: £9.1m), acquisition related and integration costs of £6.9m (2012: £0.9m) and restructuring costs of £10.2m (2012: £nil) 1. They also exclud
Slide 51: Strong sustainable profitable growth
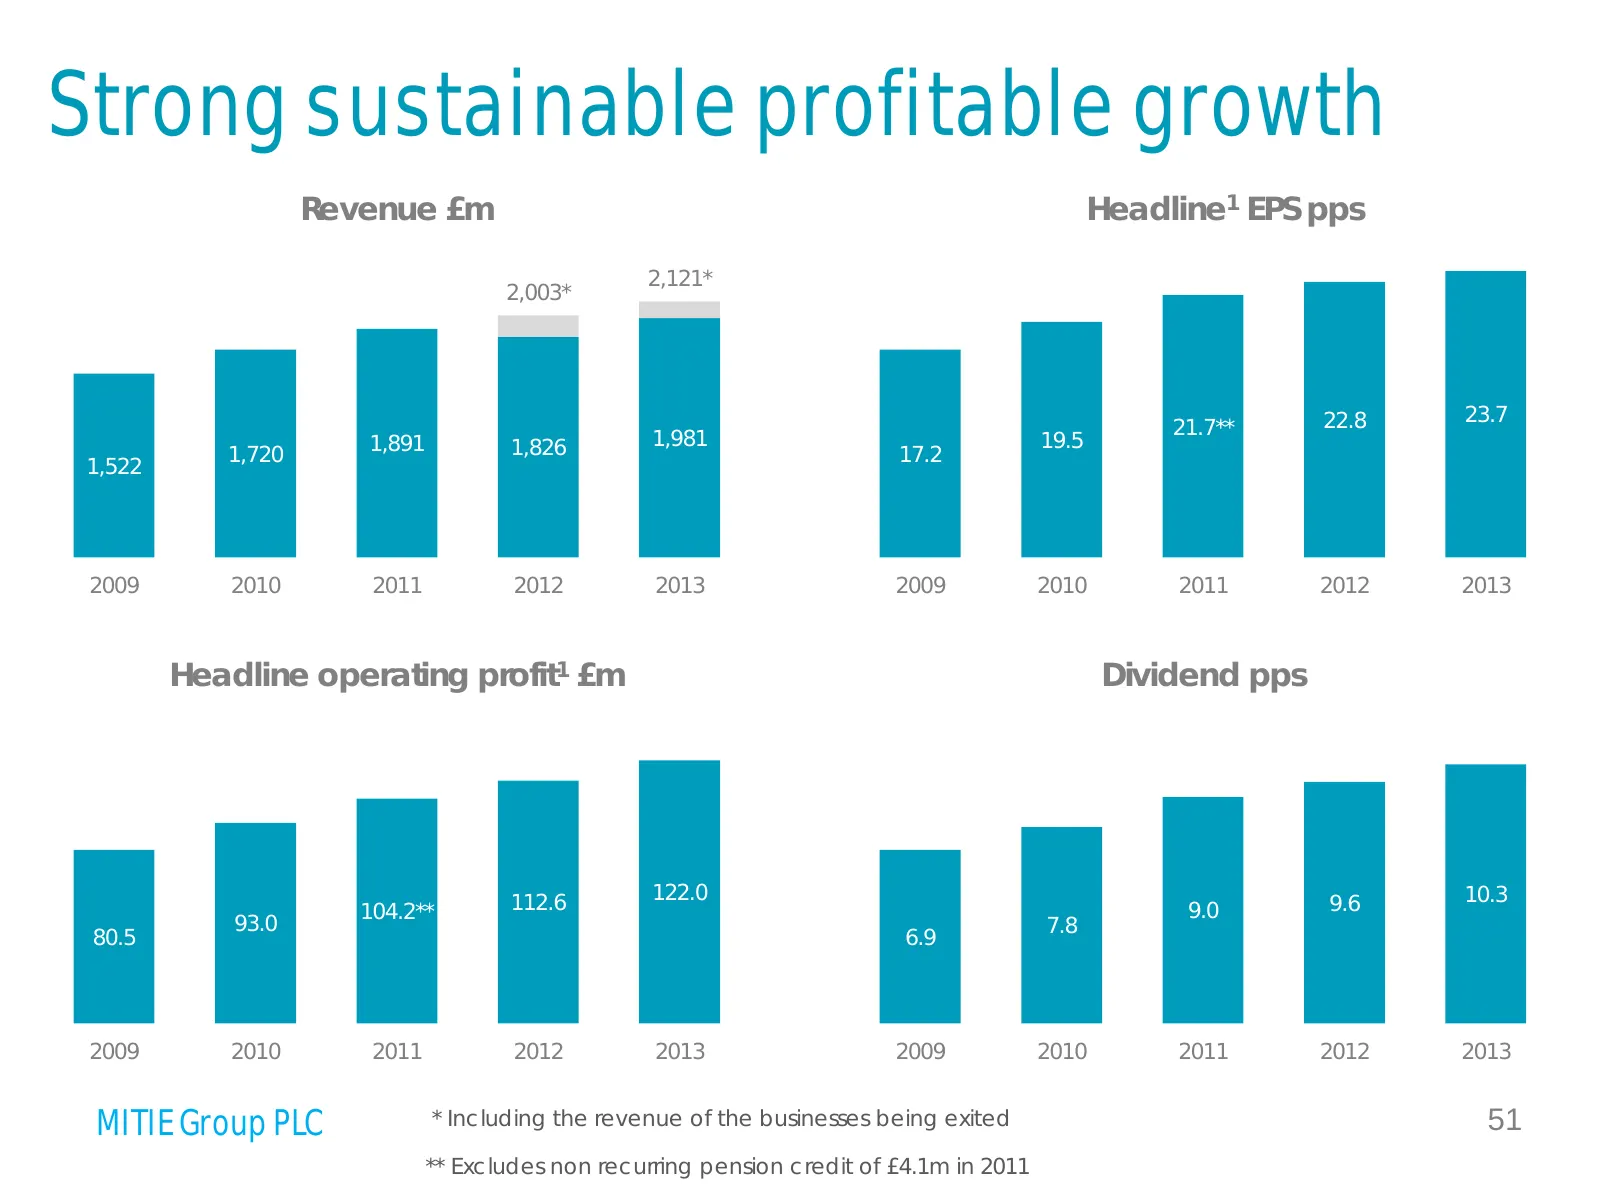
Strong sustainable profitable growth Revenue £m Headline1 EPS pps 2,121* 2,003* 22.8 23.7 21.7** 1,891 1,826 1,981 19.5 1,720 17.2 1,522 2009 2010 2011 2012 2013 2009 2010 2011 2012 2013 Headline operating profit1 £m Dividend pps 112.6 122.0 9.6 10.3 104.2** 9.0 93.0 7.8 80.5 6.9 2009 2010 2011 2012
Slide 52: Cash conversion
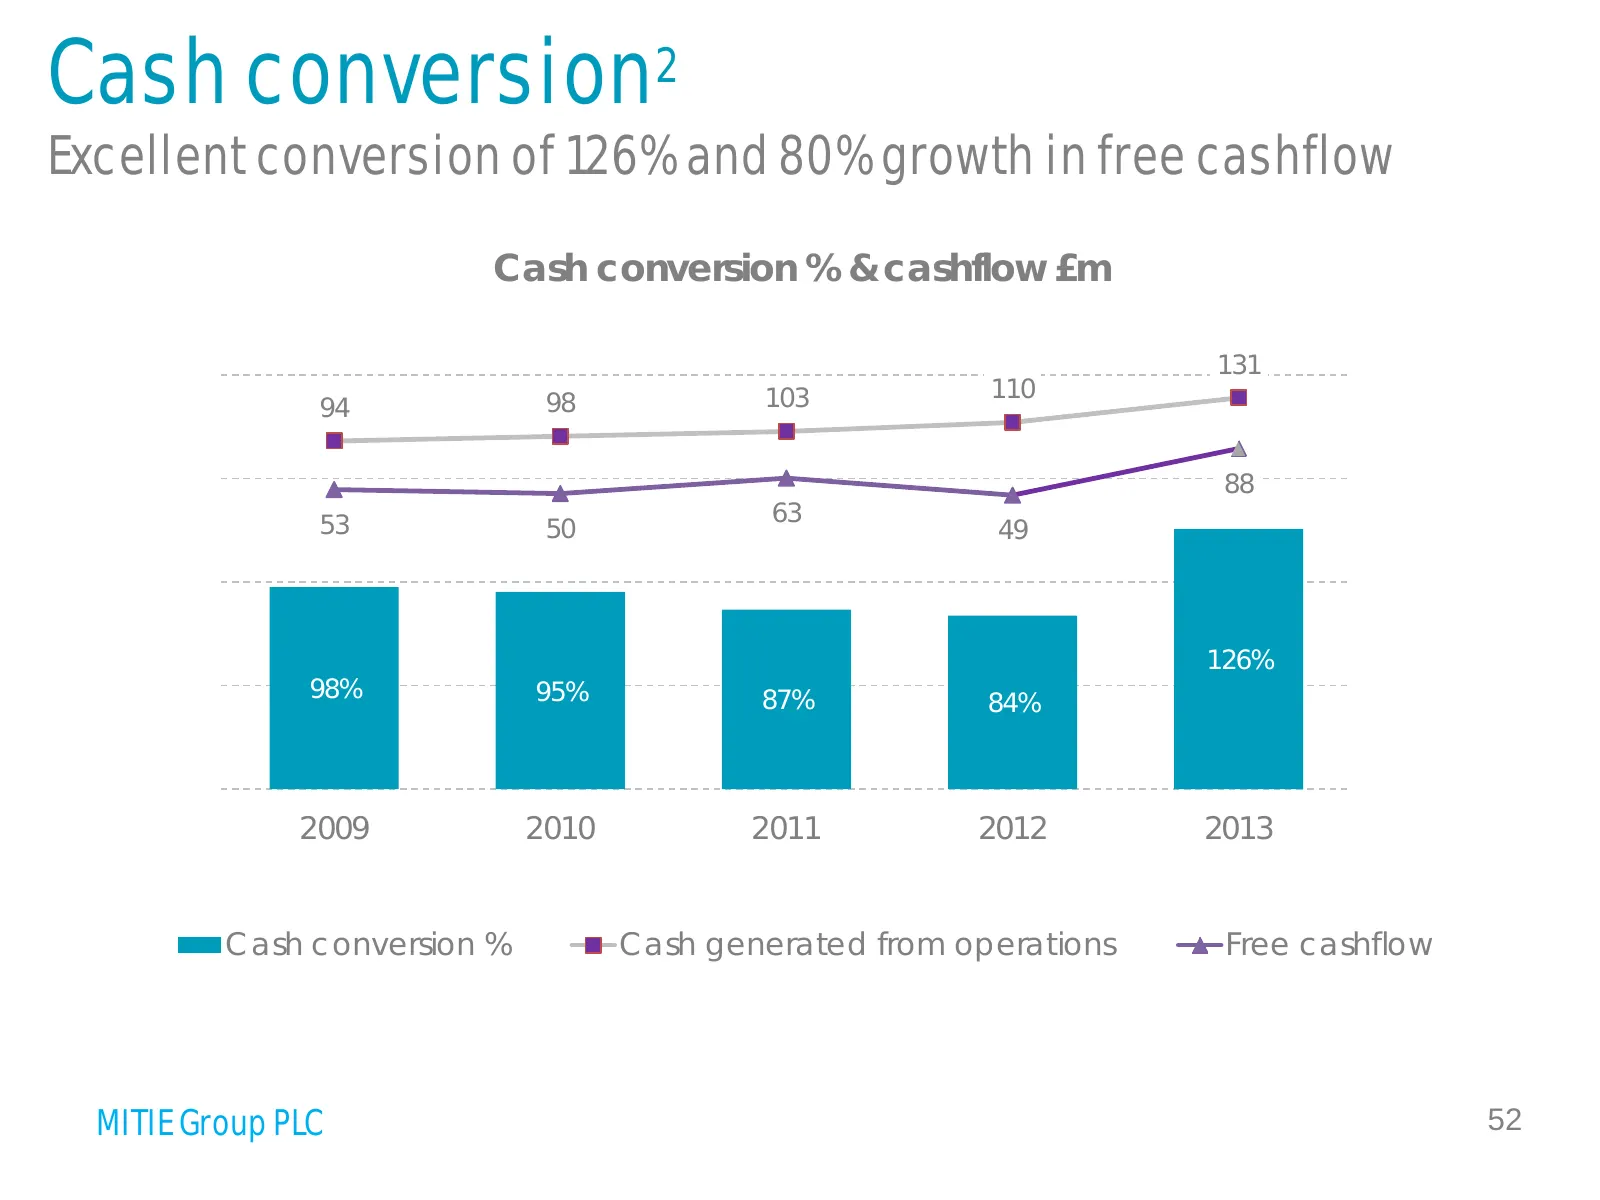
Cash conversion2 Excellent conversion of 126% and 80% growth in free cashflow Cash conversion % & cashflow £m 200% 131 150 103 105.9 110 94 98 100 150% 88 50 53 63 50 49 0 100% -50 126% -100 50% 98% 95% 87% 84% -150 0% -200 2009 2010 2011 2012 2013 Cash conversion % Cash generated from operations Fr
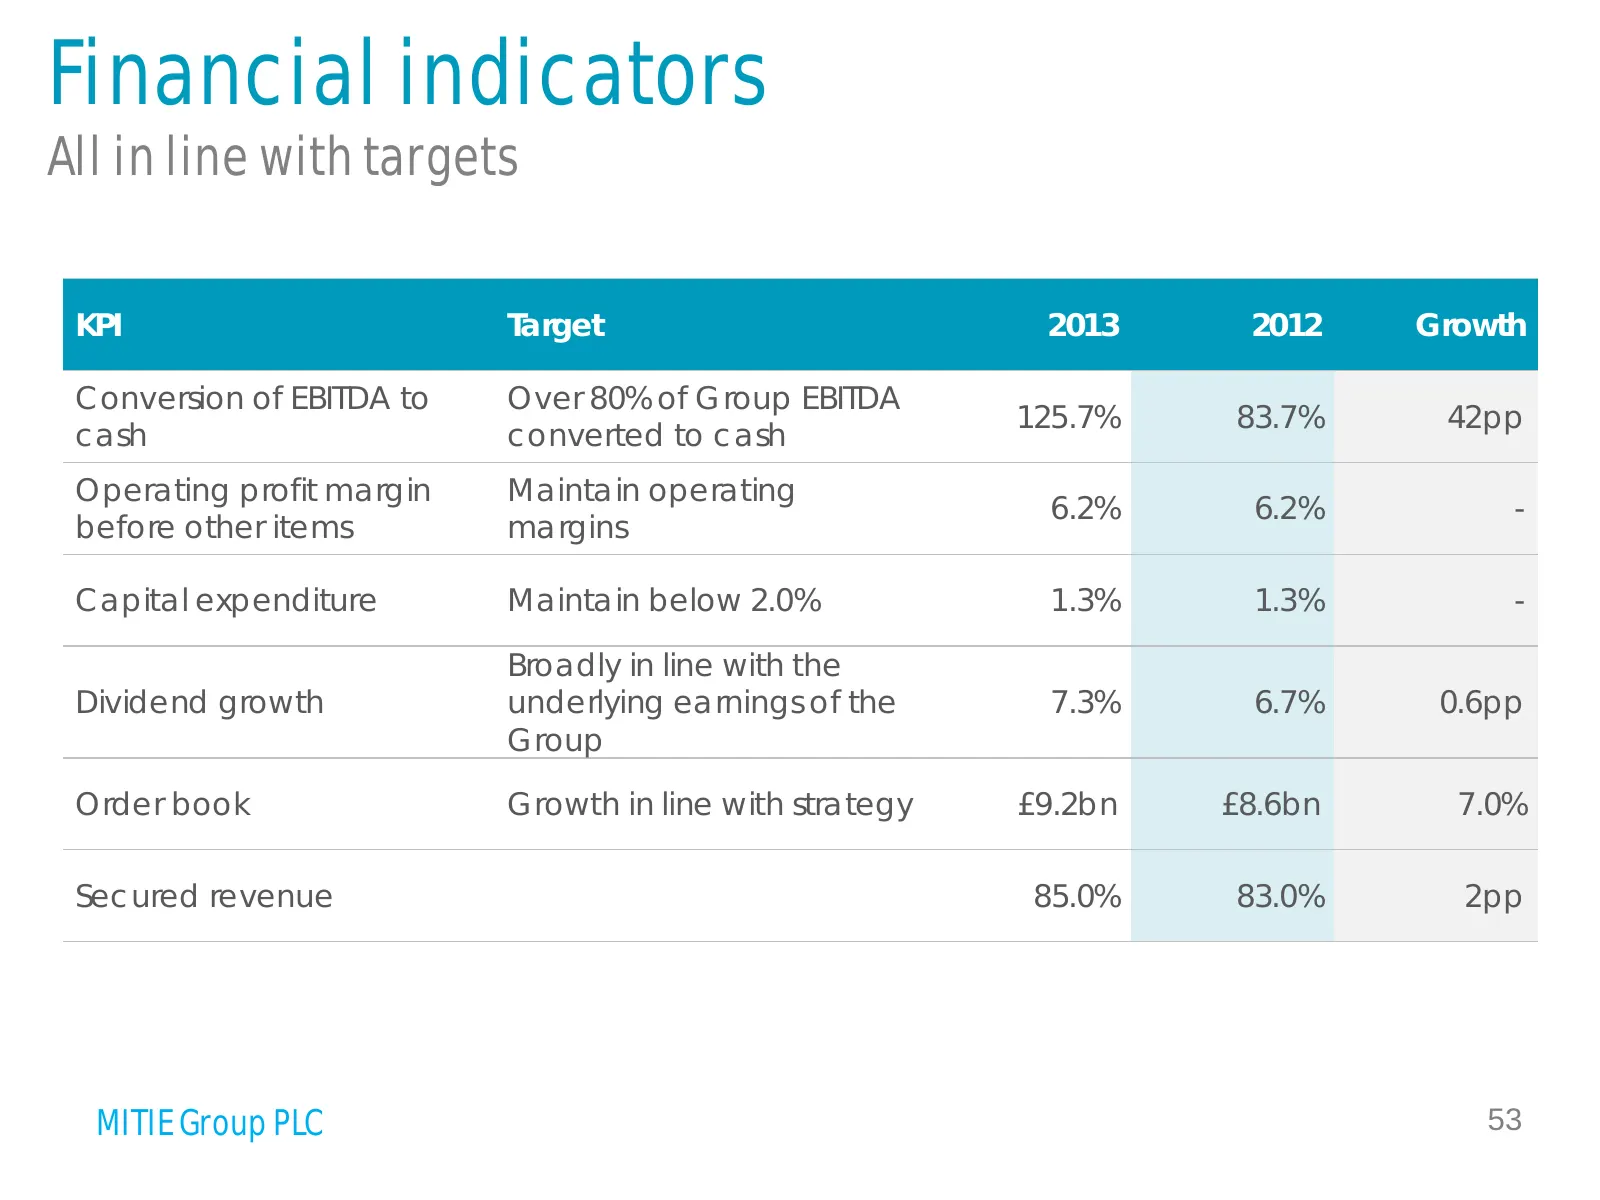
Slide 53: Financial indicators
Financial indicators All in line with targets KPI Target 2013 2012 Growth Conversion of EBITDA to Over 80% of Group EBITDA 125.7% 83.7% 42pp cash converted to cash Operating profit margin Maintain operating 6.2% 6.2% - before other items margins Capital expenditure Maintain below 2.0% 1.3% 1.3% - Br
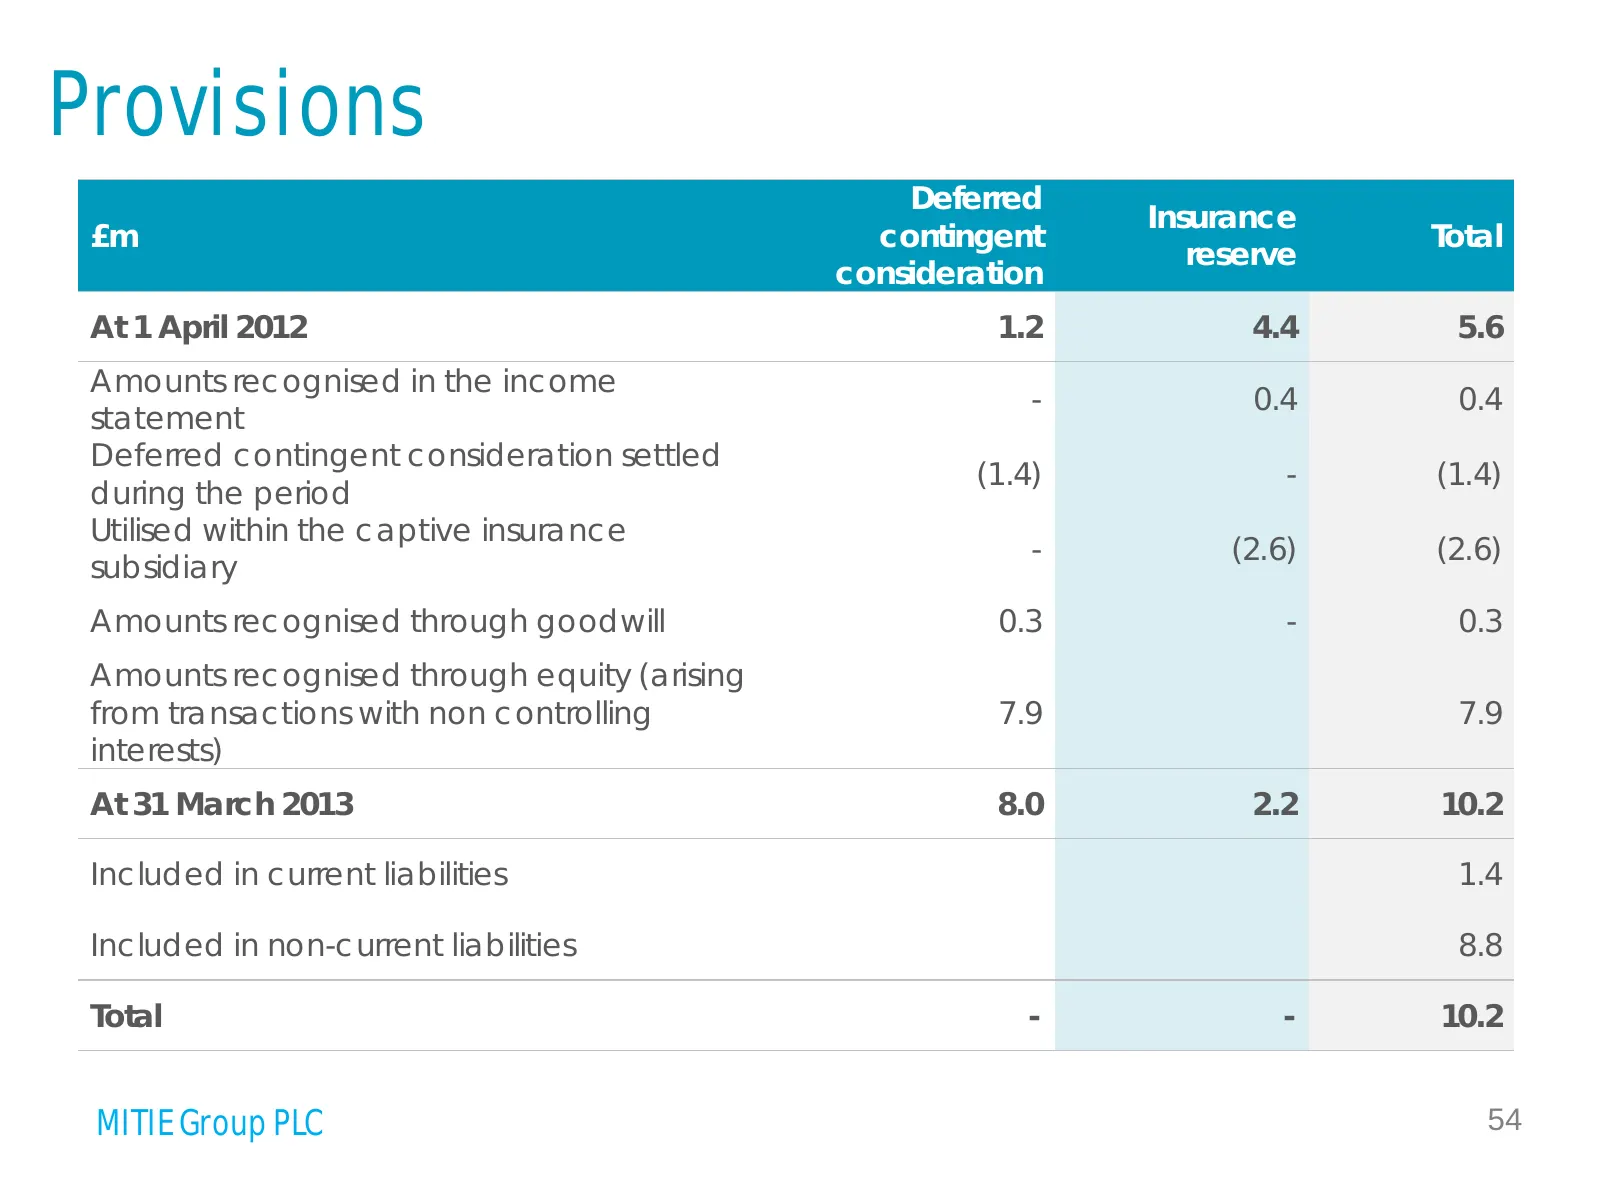
Slide 54: Provisions
Provisions Deferred Insurance £m contingent Total reserve consideration At 1 April 2012 1.2 4.4 5.6 Amounts recognised in the income - 0.4 0.4 statement Deferred contingent consideration settled (1.4) - (1.4) during the period Utilised within the captive insurance - (2.6) (2.6) subsidiary Amounts re
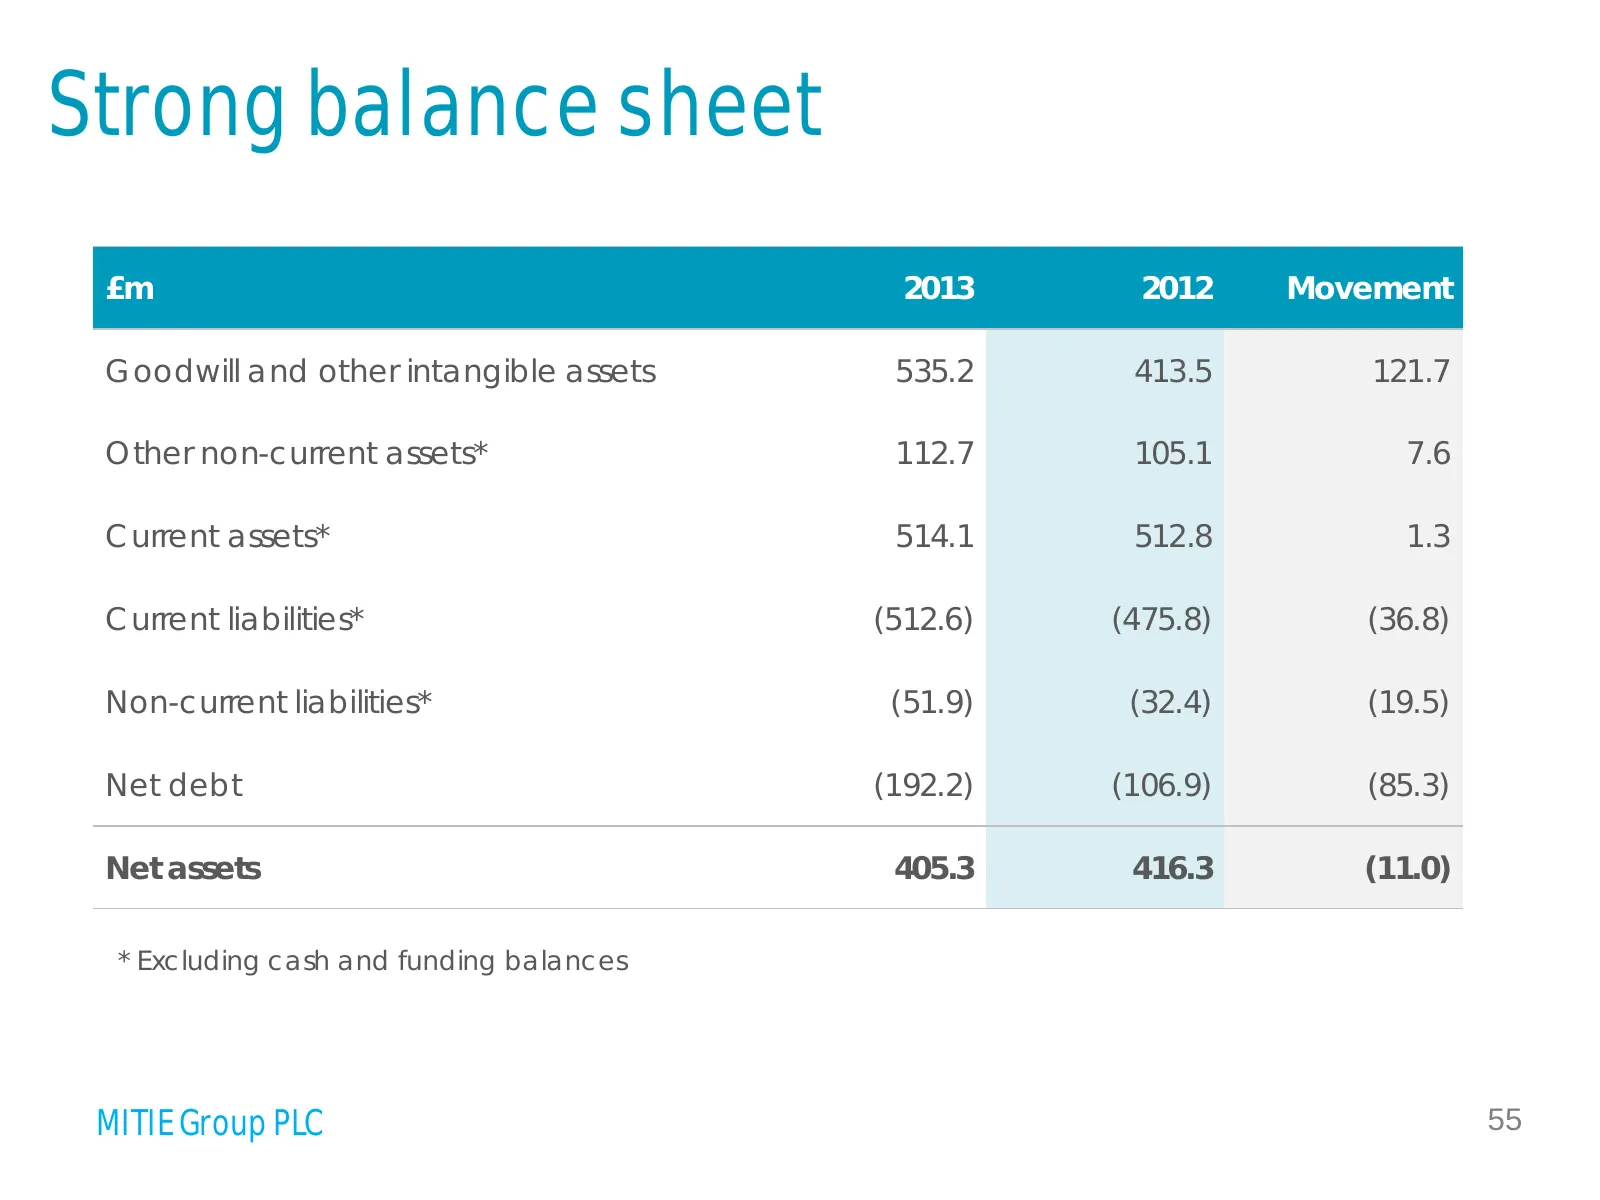
Slide 55: Strong balance sheet
Strong balance sheet £m 2013 2012 Movement Goodwill and other intangible assets 535.2 413.5 121.7 Other non-current assets* 112.7 105.1 7.6 Current assets* 514.1 512.8 1.3 Current liabilities* (512.6) (475.8) (36.8) Non-current liabilities* (51.9) (32.4) (19.5) Net debt (192.2) (106.9) (85.3) Net as
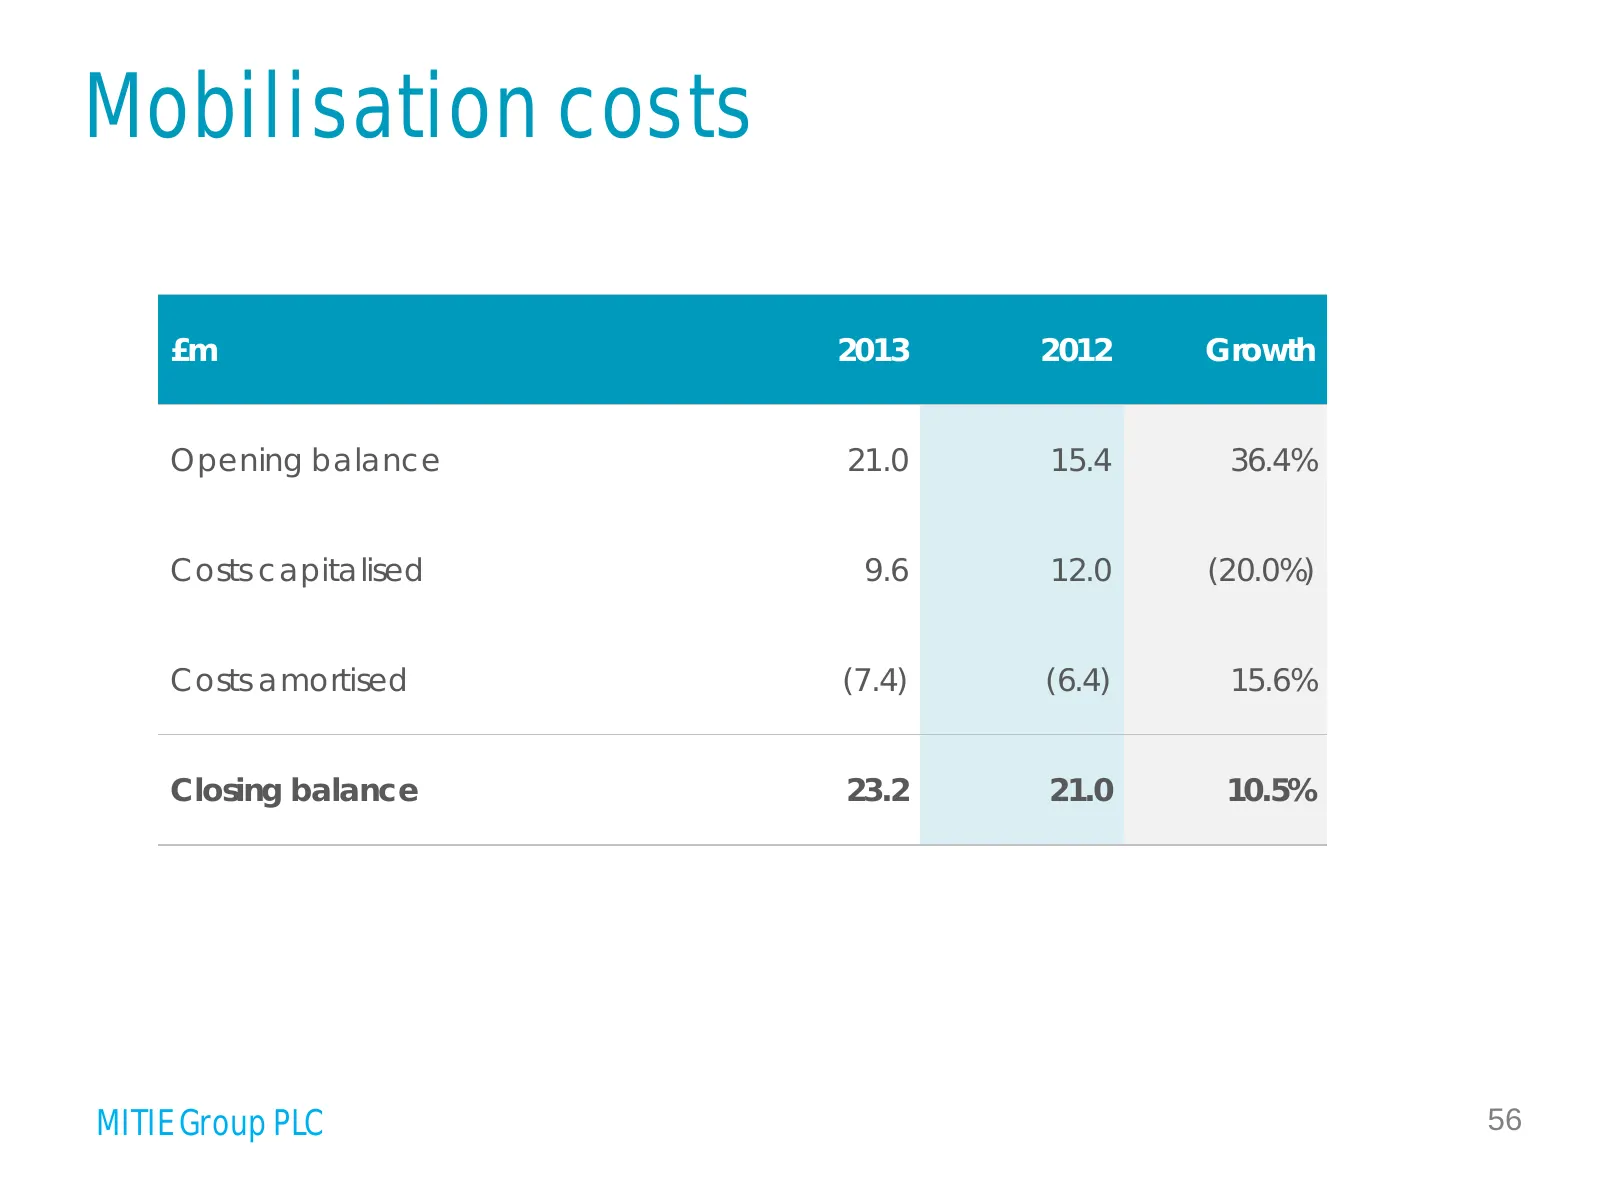
Slide 56: Mobilisation costs
Mobilisation costs £m 2013 2012 Growth Opening balance 21.0 15.4 36.4% Costs capitalised 9.6 12.0 (20.0%) Costs amortised (7.4) (6.4) 15.6% Closing balance 23.2 21.0 10.5% MITIE Group PLC 56
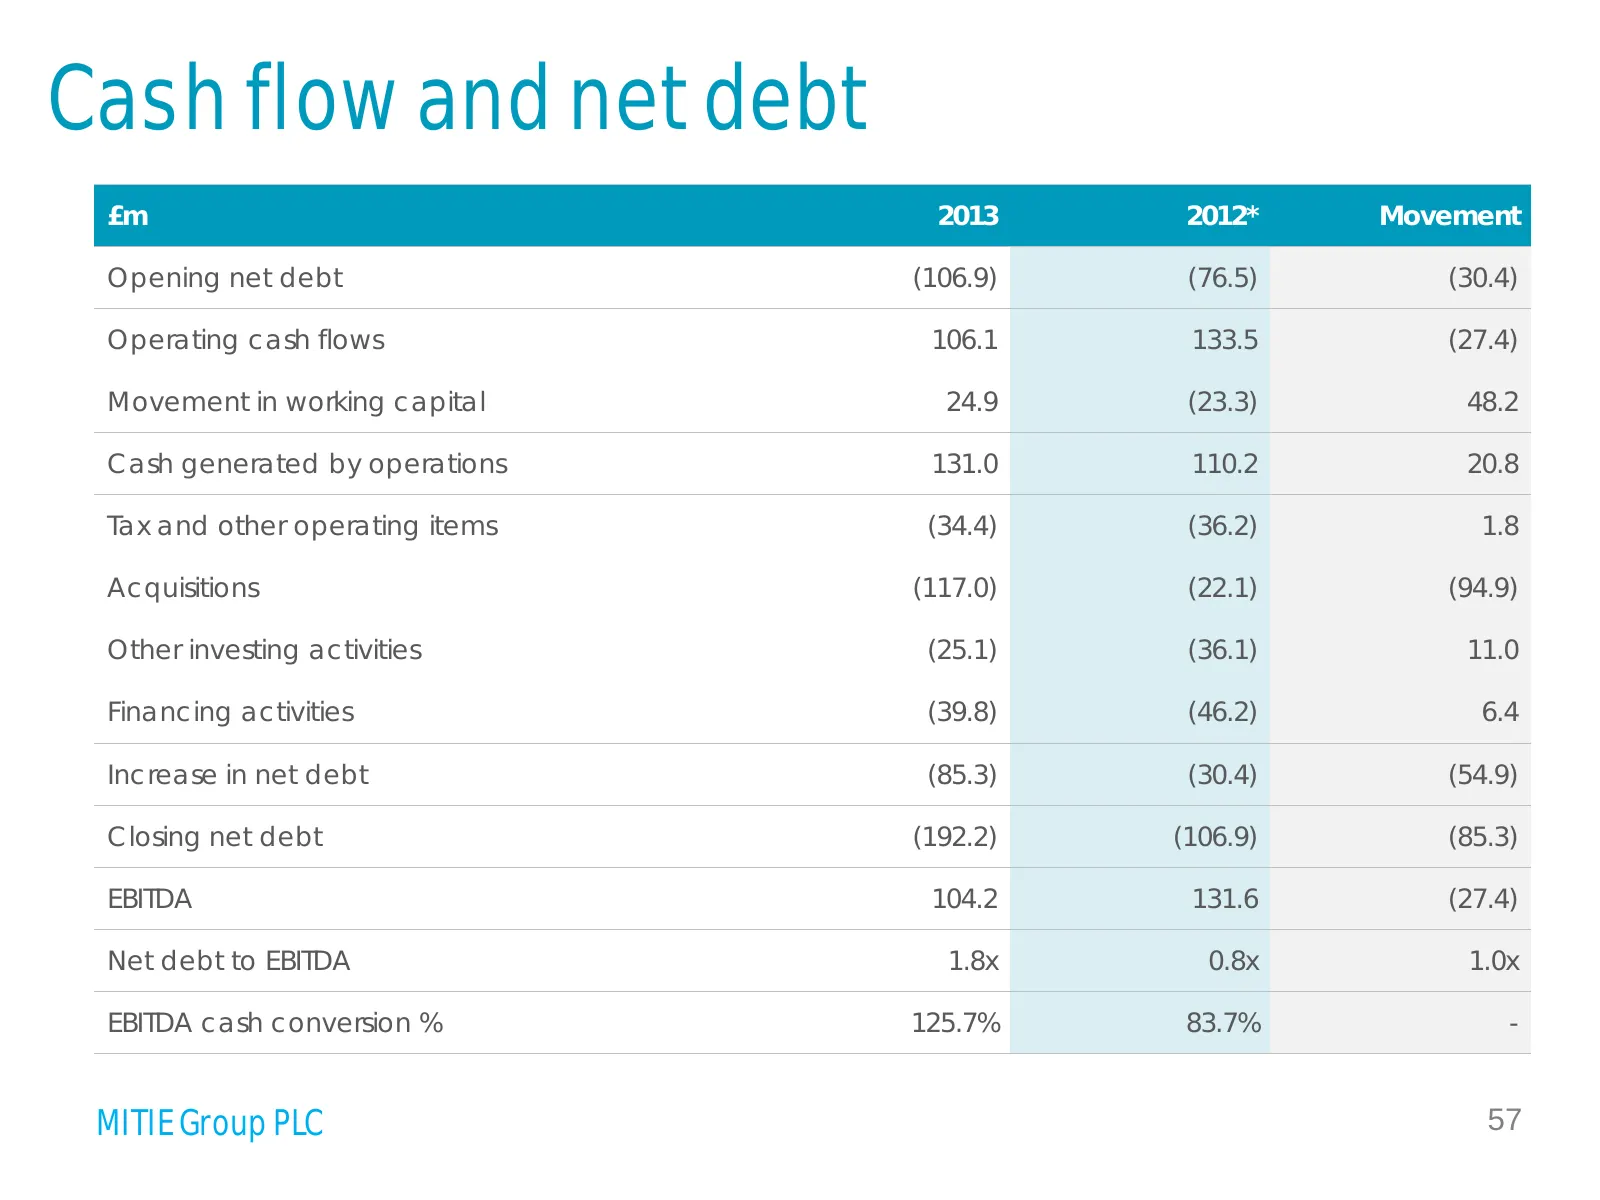
Slide 57: Cash flow and net debt
Cash flow and net debt £m 2013 2012* Movement Opening net debt (106.9) (76.5) (30.4) Operating cash flows 106.1 133.5 (27.4) Movement in working capital 24.9 (23.3) 48.2 Cash generated by operations 131.0 110.2 20.8 Tax and other operating items (34.4) (36.2) 1.8 Acquisitions (117.0) (22.1) (94.9) O
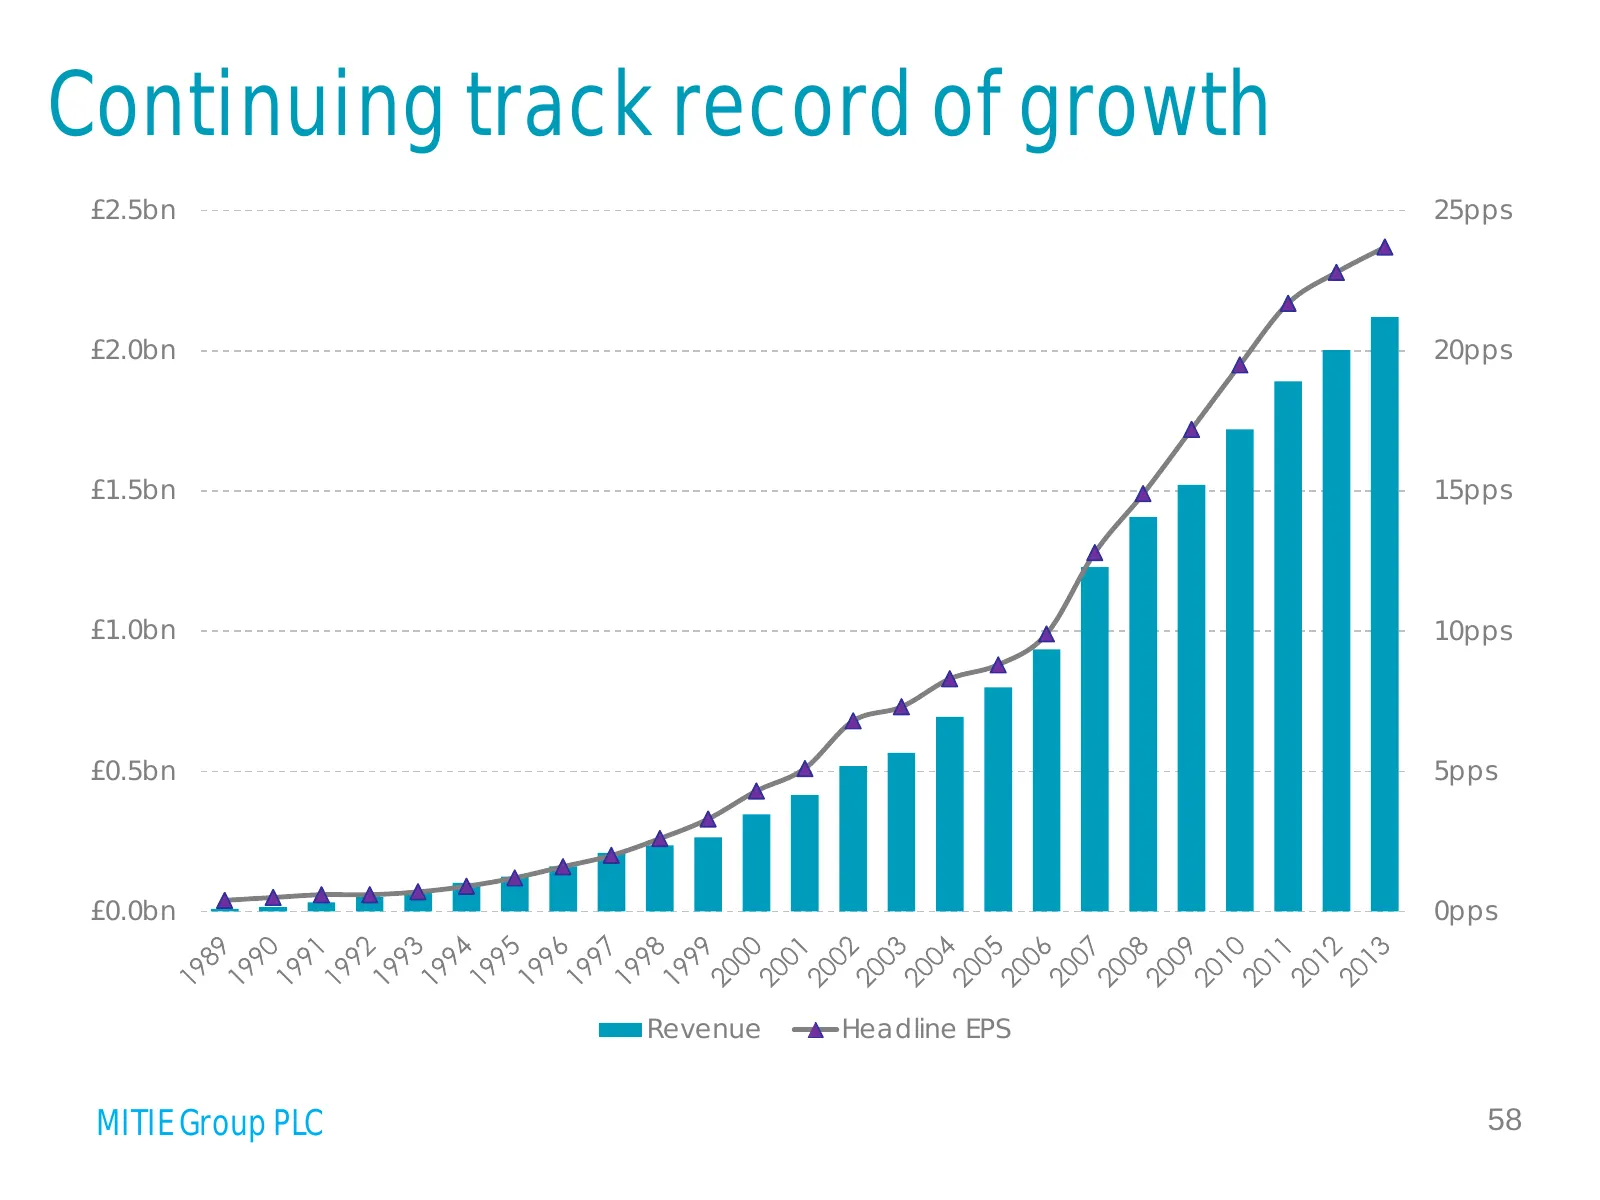
Slide 58: Continuing track record of growth
Continuing track record of growth £2.5bn 25pps £2.0bn 20pps £1.5bn 15pps £1.0bn 10pps £0.5bn 5pps £0.0bn 0pps Revenue Headline EPS MITIE Group PLC 58
Source: Internet Archive copy of mitie.com
More decks from MITIE Group PLC
 FY2026 Earnings Presentation34 slides · Jun 4, 2026
 H1 FY26 Earnings Presentation29 slides · Nov 20, 2025
 FY2025 Earnings Presentation36 slides · Jun 5, 2025
 H1 FY25 Earnings Presentation29 slides · Nov 21, 2024
 FY2024 Earnings Presentation34 slides · Jun 6, 2024
 H1 FY24 Earnings Presentation29 slides · Nov 23, 2023