Edgen — Jefferies Industrial and Aerospace & Defense Conference 2012
13 slides from Edgen's conference presentation, Aug 7, 2012
Slide 1: Edgen: Connecting Specialized Products to Energy & Infrastructure Applications
EDGEN CONNECTING SPECIALIZED PRODUCTS TO ENERGY & Joreue INFRASTRUCTURE APPLICATIONS | Farry Ne gy i ; 4 iY i 4 Jefferies Industrial and Aerospace & Defense Conference August 7, 2012
Slide 2: Disclosures
Disclosures OL This presentation is based on managements current beliefS and assumptions, which in turn are based on curenty available information. All statements and other information contained in this presentation, other than statements of historical fact, constitute fonvardooking statements withi
Slide 3: Edgen Group Snapshot
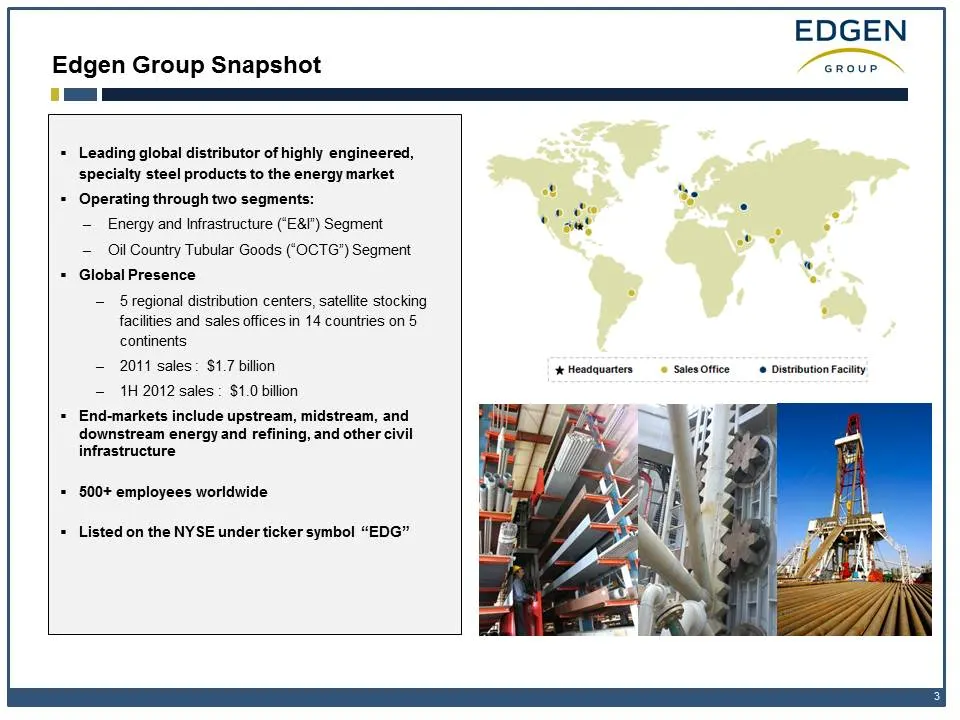
Edgen Group Snapshot + Leading global distributor of highly engineered, specialty steel products to the energy market = Operating through two segments: — Energy and Infrastructure ("E&I") Segment — Oil Country Tubular Goods (‘OCTG") Segment + Global Presence — Srregional distribution centers, sateli
Slide 4: Successful History of Acquisitions and Platform Built for Growth
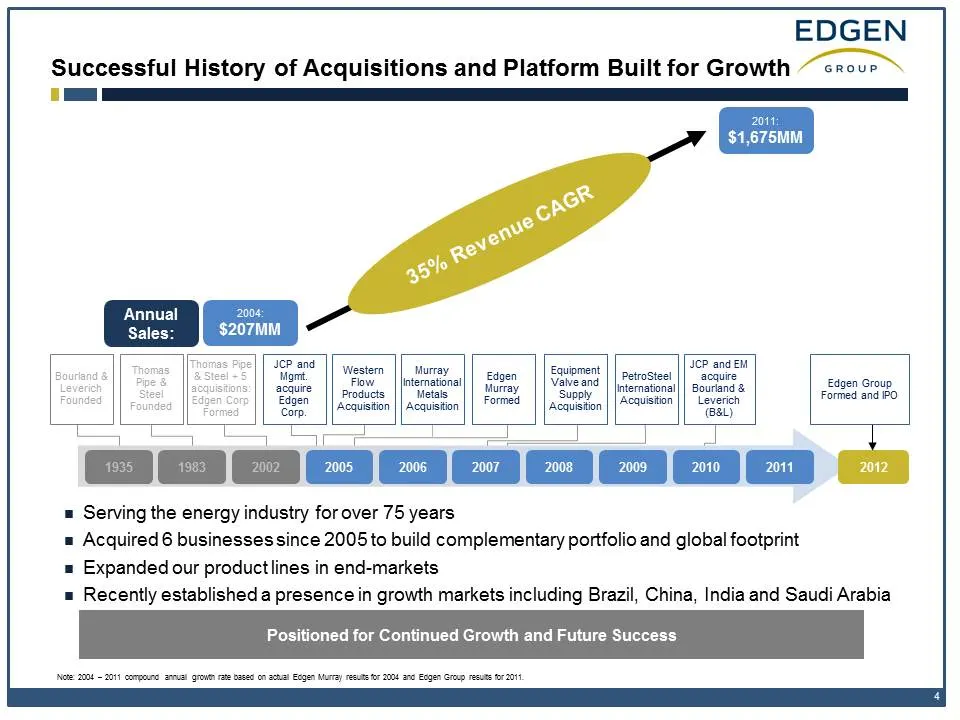
EDGEN Successful History of Acquisitions and Platform Built for Growth /onoue _ Annual r Sales: $207MM TGP and TGP and gmt. |] Western | maray ai{| Edgen | | eaoment | | petrosteet ||" acquire isitions: acquire Lica international] | furray: Valveand | linernational| | Sourland & Lic teabie 2 P ‘anon
Slide 5: What We Sell
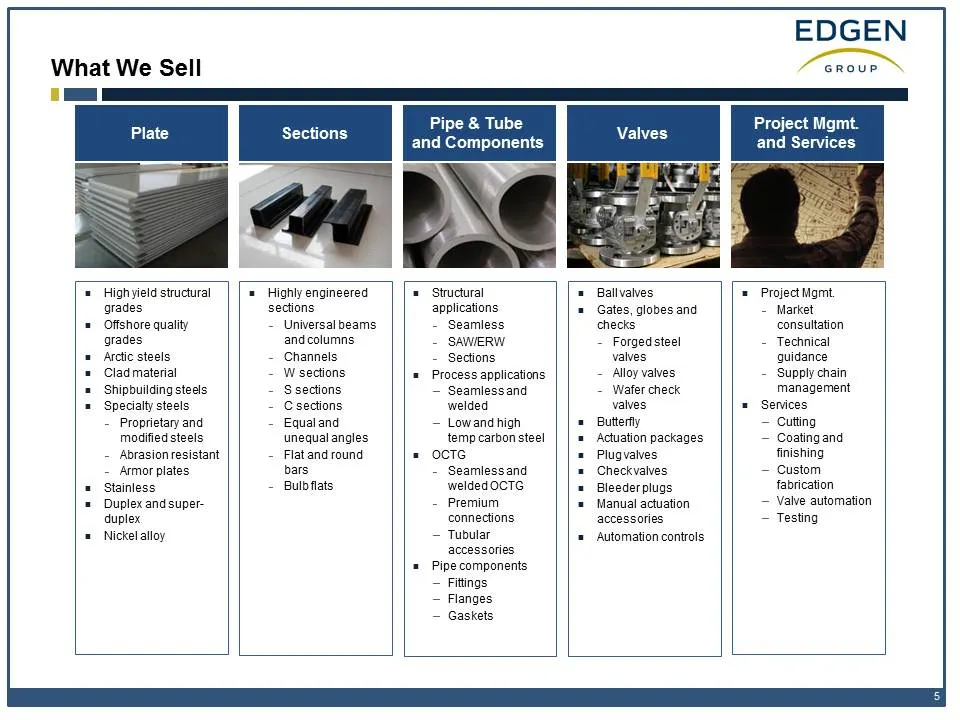
What We Sell Picts Pipe & Tube Project Mgmt. and Components and Services = Highyield structural] [* Highlyengineered | [* Structural = Ballvalves = Project Mgmt grades sections applications = Gates, globes and - Market + Offshore quality ~ Universalbeams ~ Seamless checks consultation grades andcolu
Slide 6: What We Do Best
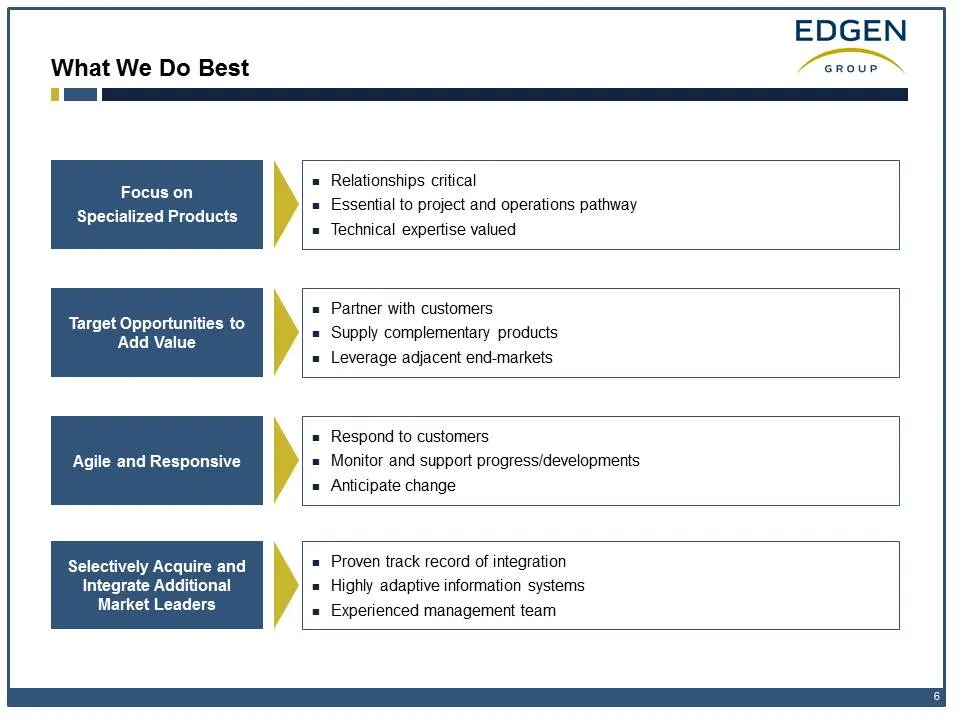
What We Do Best Focus on Specialized Products Target Opportunities to Add Value Agile and Responsive Selectively Acquire and Integrate Additional Market Leaders Relationships critical Essential to project and operations pathway Technical expertise valued Partner with customers Supply complementary p
Slide 7: Critical Partner to Major Global Suppliers and Customers
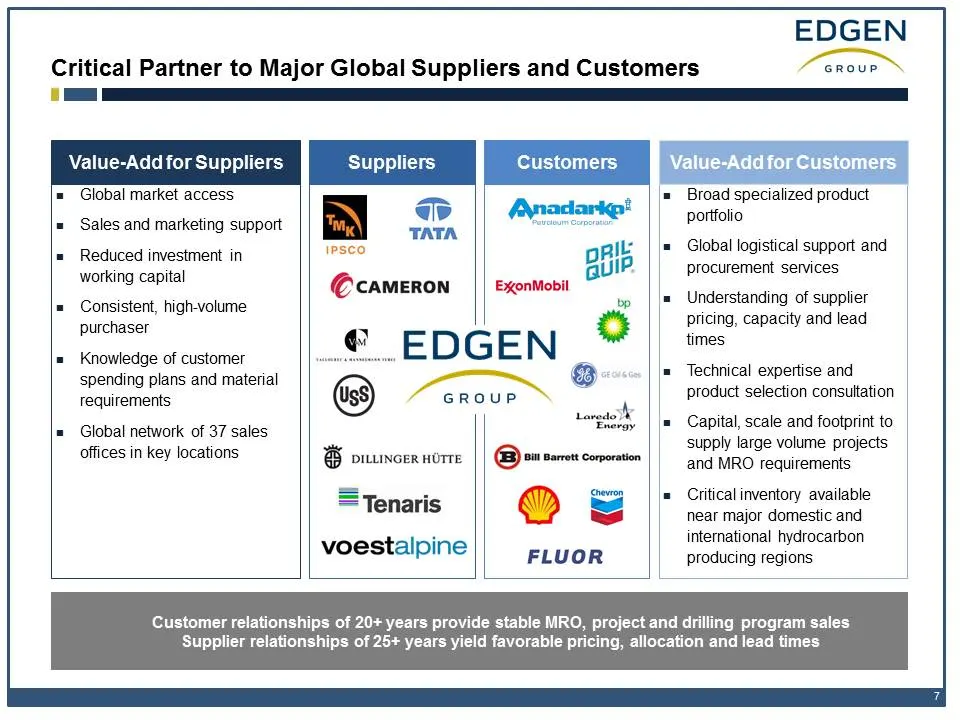
Critical Partner to Major Global Suppliers and Customers EDGEN Value-Add for Suppliers —= Value-Add for Customers Global market access = Sales and marketing support = Reduced investment in working capital = Consistent, high-volume purchaser = Knowledge of customer spending plans and material require
Slide 8: Local Business Model with Global Reach
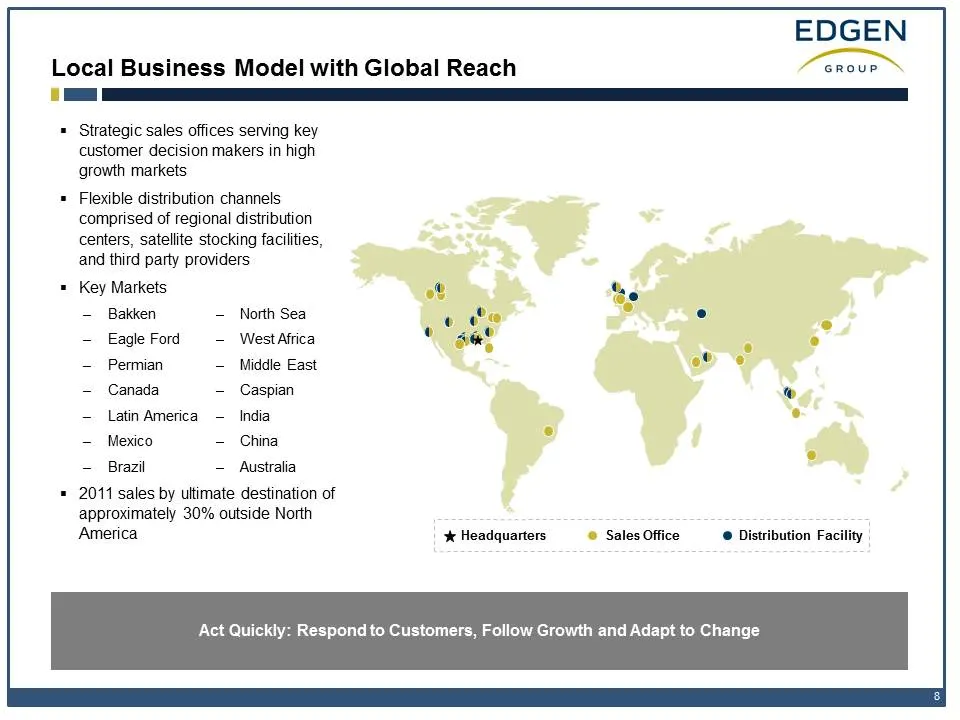
Local Business Model with Global Reach fcnour _ * Strategic sales offices serving key customer decision makers in high growth markets + Flexible distribution channels comprised of regional distribution centers, satellite stocking facilities, and third party providers = Key Markets — Bakken - North S
Slide 9: Aligned With Global Growth Trends
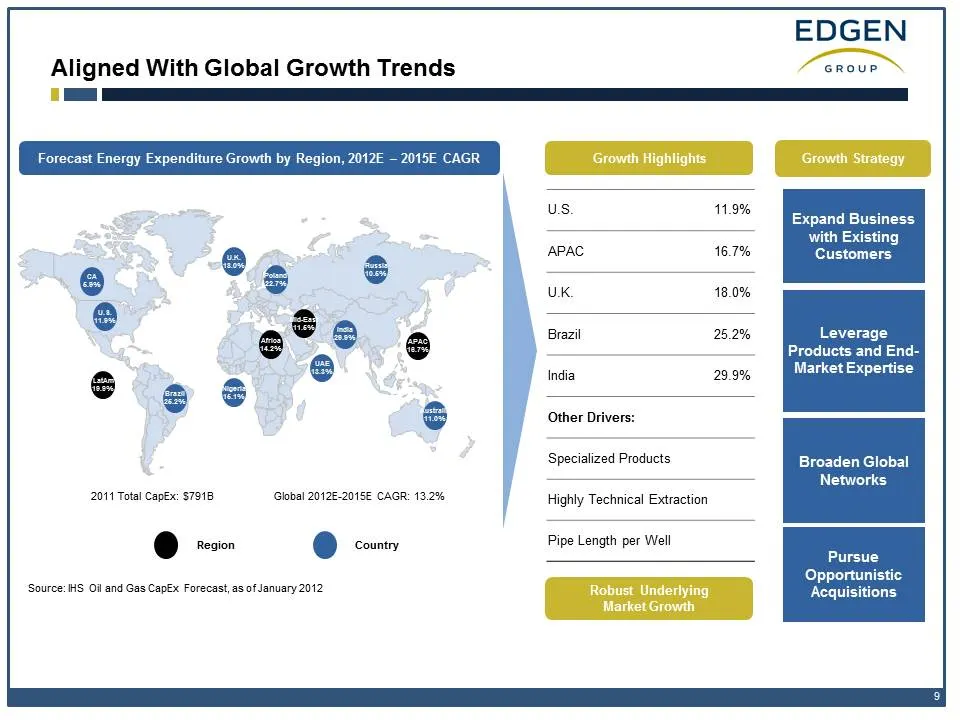
EDGEN Aligned With Global Growth Trends Pica = <= ee us iliaas Expand Business with Existing a 3 APAC 16.7% Customers & UK. 18.0% @ Soa Beal BPE Leverase @ @ Products and End- 3 S$ @ India PAPE Market Expertise S Other Drivers: ‘Specialized Products Broaden Global Networks 2041 Total Capex: $7918 Gl
Slide 10: Financial Highlights
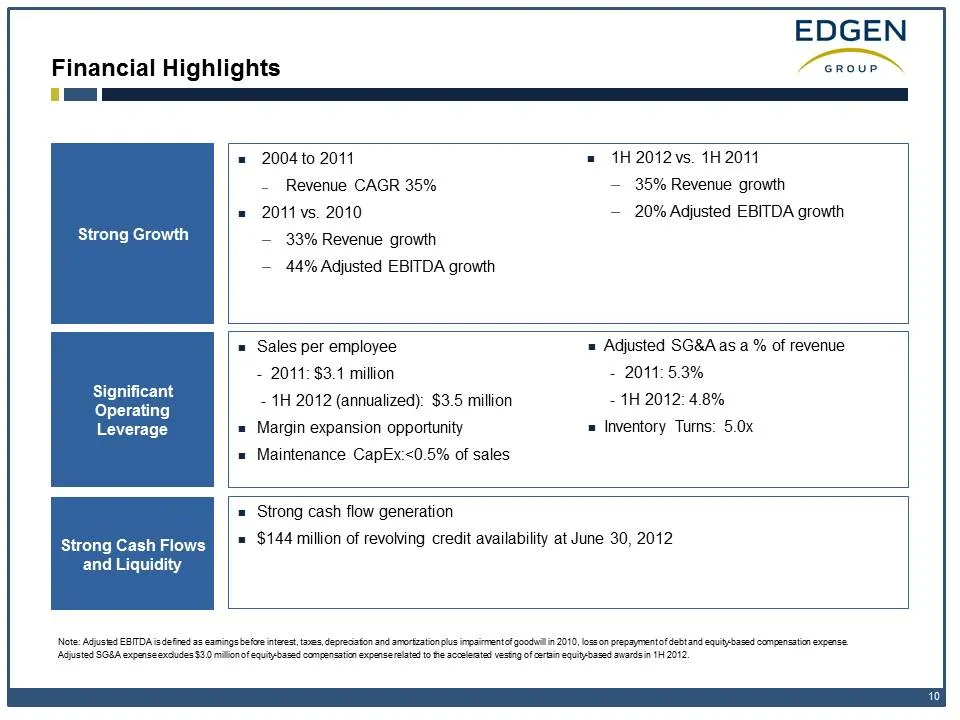
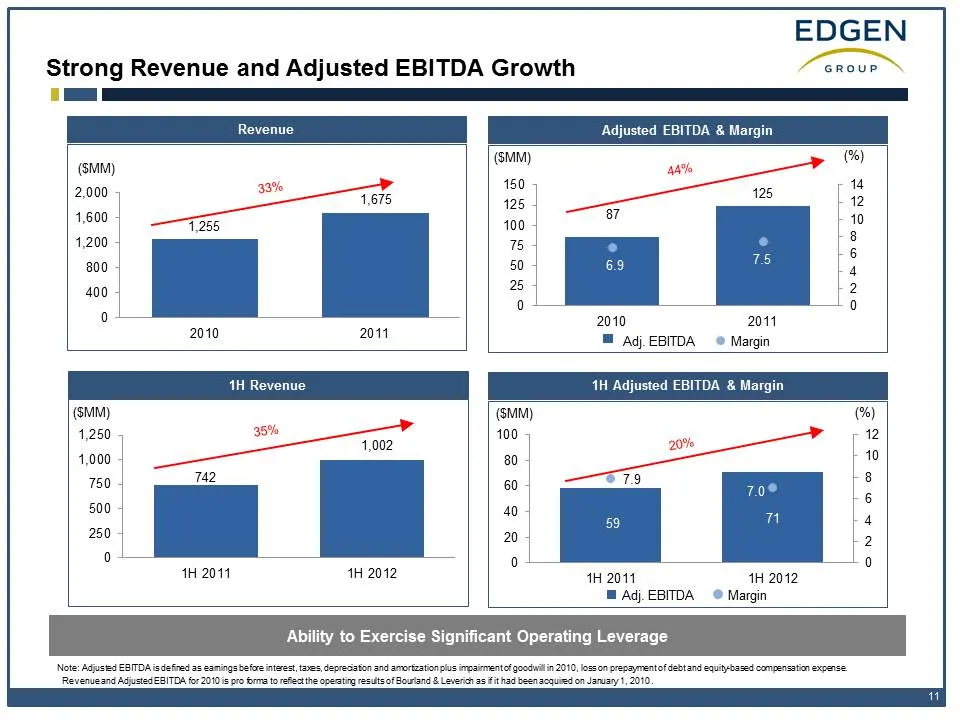
EDGEN Financial Highlights fcnour = = 2004 to 2011 = 1H 2012 vs. 1H 2011 — Revenue CAGR 35% — 35% Revenue growth = 2011 vs. 2010 — 20% Adjusted EBITDA growth Strong Growth — 33% Revenue growth — 44% Adjusted EBITDA growth = Sales per employee = Adjusted SG&Aas a % of revenue = 2011: $3.1 million = 2
Slide 11: Strong Revenue and Adjusted EBITDA Growth
Strong Revenue and Adjusted EBITDA Growth Group = Rave Adjusted EBITDA 3 % (SMM) (%) 4 2,000 ee 125 le 4,600 es [0 4,200 in) 6 800 4 400 Le — 0 o. 2010 2011 Pate Eu Ad. EBITDA © Margin (smM) (SMM) (%) 41,250 5 sf 100 yp 2 ] 1,002 ] | 4,000 aa f 10 750 rae 0 79 rs 500 | 40 | . | | 59 4 250 20 L2 ol a
Slide 12: Capitalization
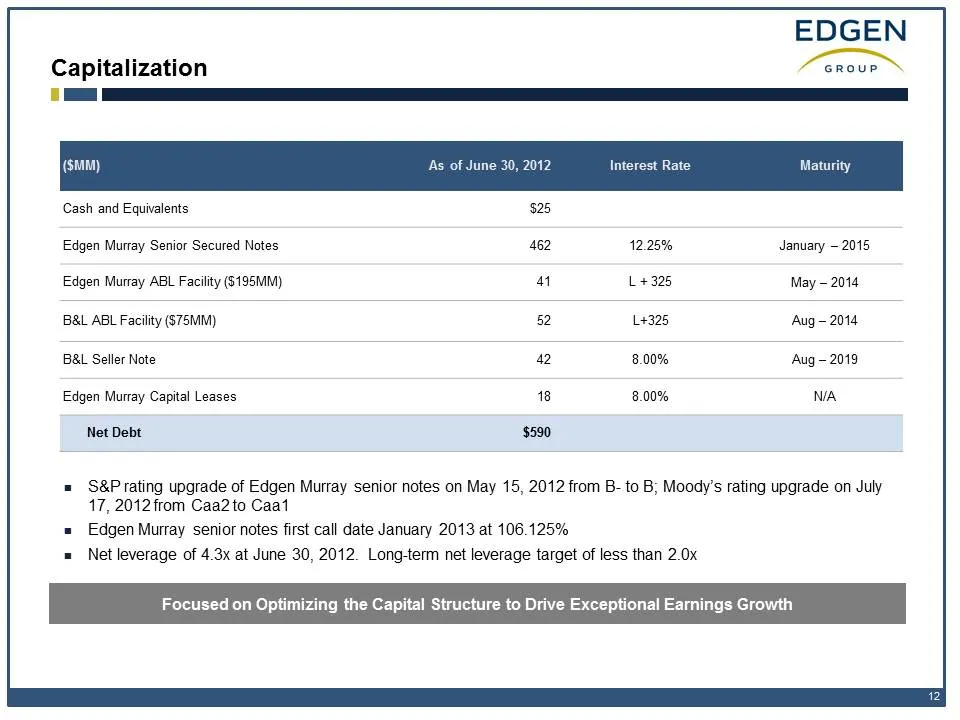
Capitalization Pocsur he (smn) As of June 30, 2012 Interest Rate Cash and Equivalents $25 Edgen Murray Senior Secured Notes 462 12.25% January — 2015 Edgen Murray ABL Facility ($195MM) 4 +325 May ~ 2014 BAL ABL Facility (S75MM) 52 14325 ‘Aug - 2014 BAL Seller Note 42 8.00% ‘Aug - 2019 Edgen Murray C
Slide 13: Investment Highlights
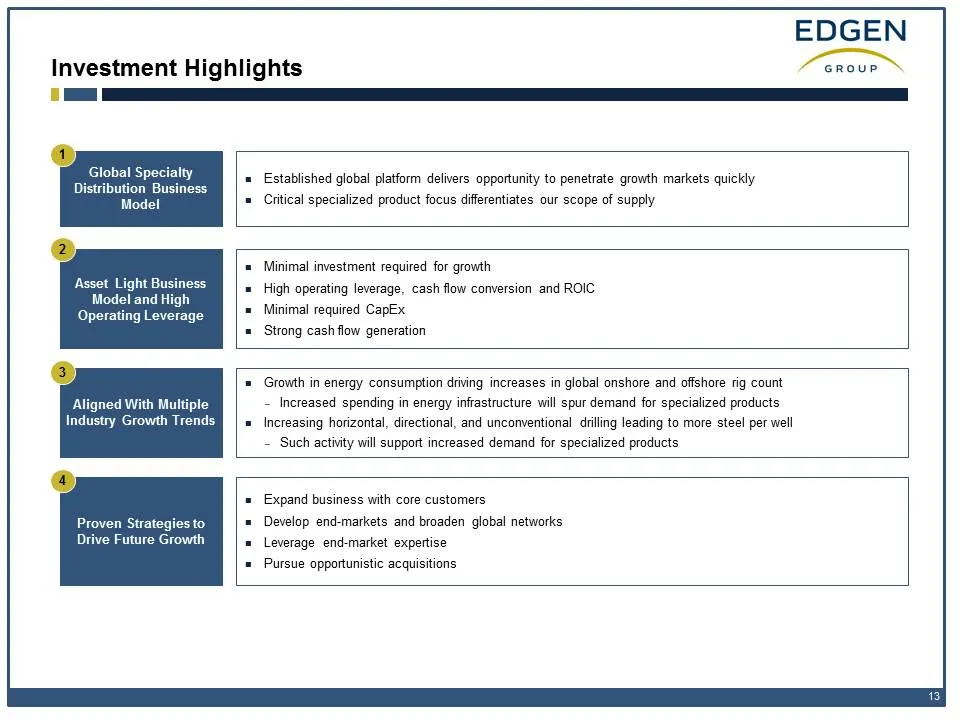
Investment Highlights Asset Light Business Model and High Operating Leverage Aligned With Multiple Industry Growth Trends Proven Strategies to Drive Future Growth Established global platform delivers opportunity to penetrate growth markets quickly Critical specialized product focus differentiates ou
Source: SEC EDGAR · 8-K filed Aug 7, 2012