Emaar Properties (P.J.S.C) · DFM:EMAAR
Emaar Properties (P.J.S.C) — Emaar Properties — H1 2024 Earnings Presentation
70 slides from Emaar Properties (P.J.S.C)'s earnings presentation, Aug 16, 2024
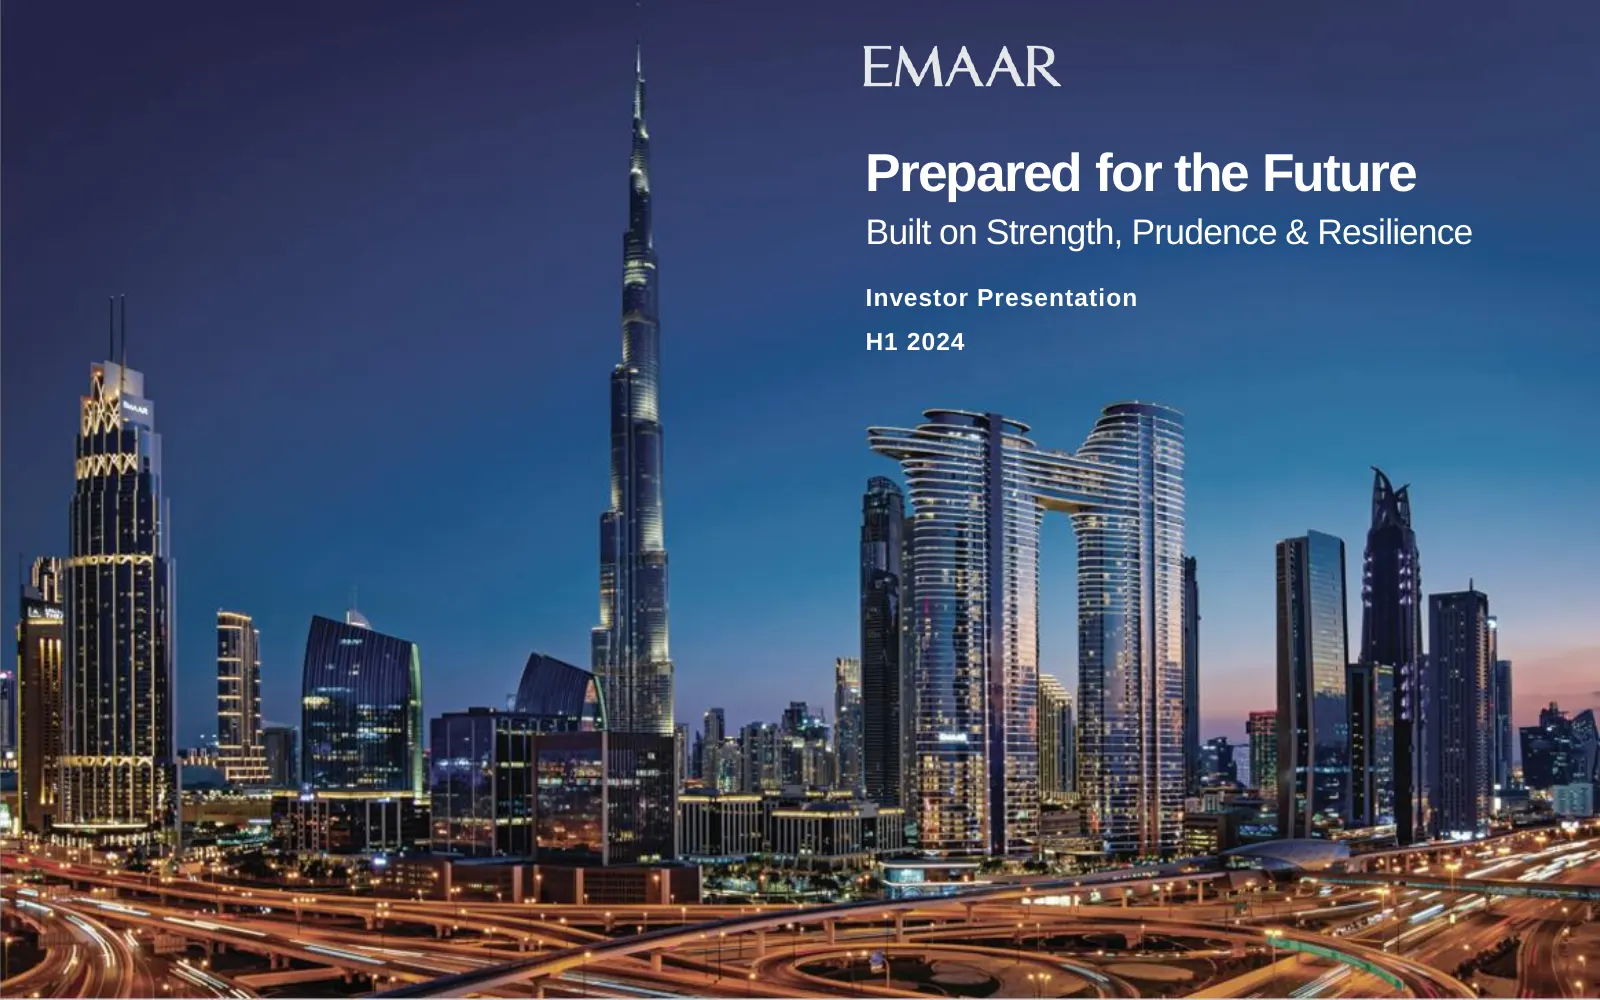
Slide 1: Prepared for the Future
Prepared for the Future Built on Strength, Prudence & Resilience Investor Presentation H1 2024 0 |
Slide 2: Disclaimer
Disclaimer Emaar Properties PJSC, for themselves and for Emaar Group, give notice that: The particulars of this presentation do not constitute any part of an offer or a contract. Given that the presentation contains information based on forecasts and roll outs, all statements contained in this prese
Slide 3: Discussion Summary
Discussion Summary 1 Investing In Emaar Expanding Footprint in UAE 2 & International Markets 3 Business Strategy & Outlook 4 Sustainability 5 H1-2024 Results Update 6 Annexure 2 |
Slide 4: Investing In Emaar
Investing In Emaar 3 |
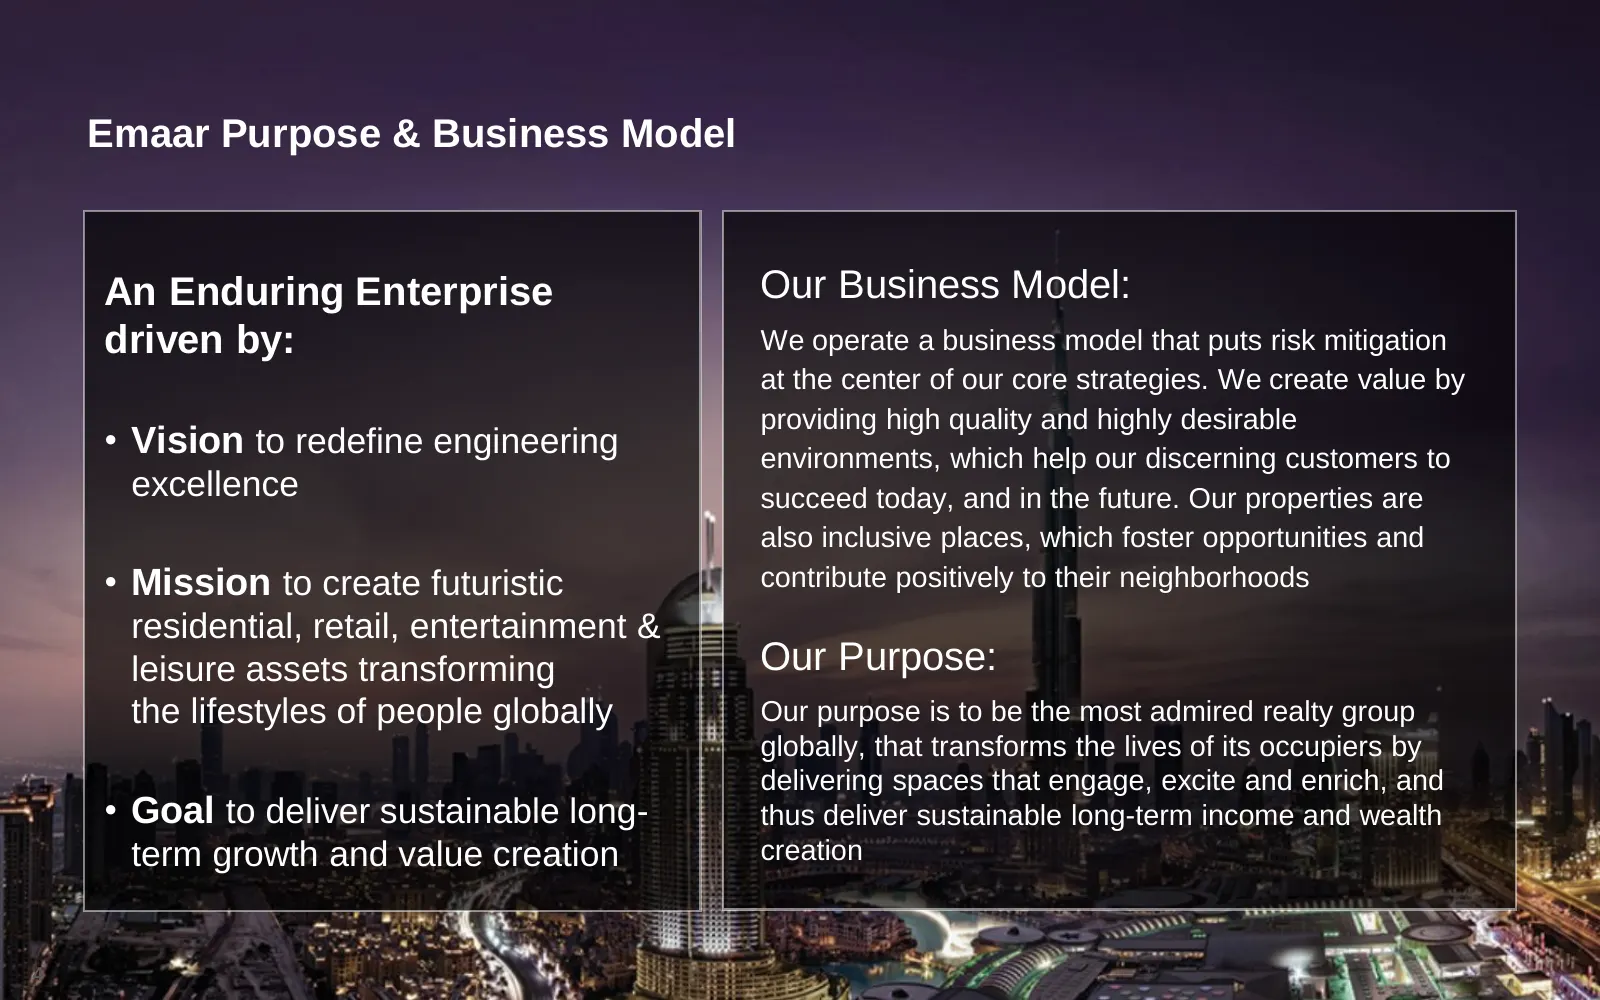
Slide 5: Emaar Purpose & Business Model
Emaar Purpose & Business Model An Enduring Enterprise Our Business Model: driven by: We operate a business model that puts risk mitigation at the center of our core strategies. We create value by providing high quality and highly desirable • Vision to redefine engineering environments, which help ou
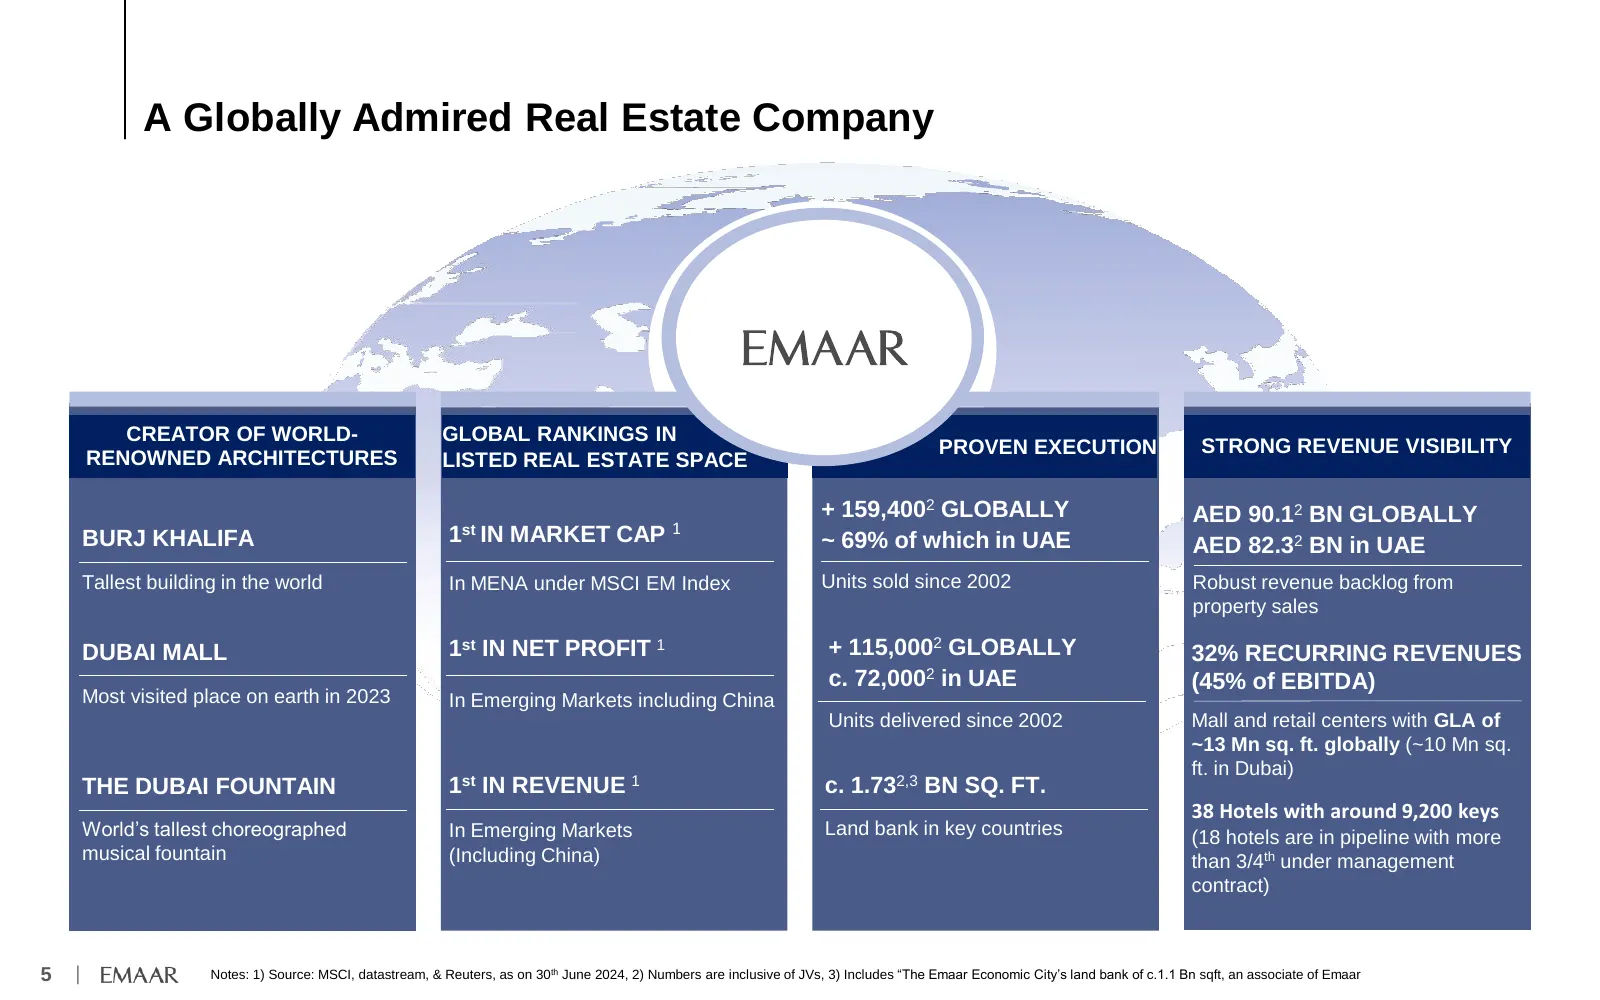
Slide 6: A Globally Admired Real Estate Company
A Globally Admired Real Estate Company CREATOR OF WORLD- GLOBAL RANKINGS IN PROVEN EXECUTION STRONG REVENUE VISIBILITY RENOWNED ARCHITECTURES LISTED REAL ESTATE SPACE + 159,4002 GLOBALLY AED 90.12 BN GLOBALLY BURJ KHALIFA 1st IN MARKET CAP 1 ~ 69% of which in UAE AED 82.32 BN in UAE Tallest building
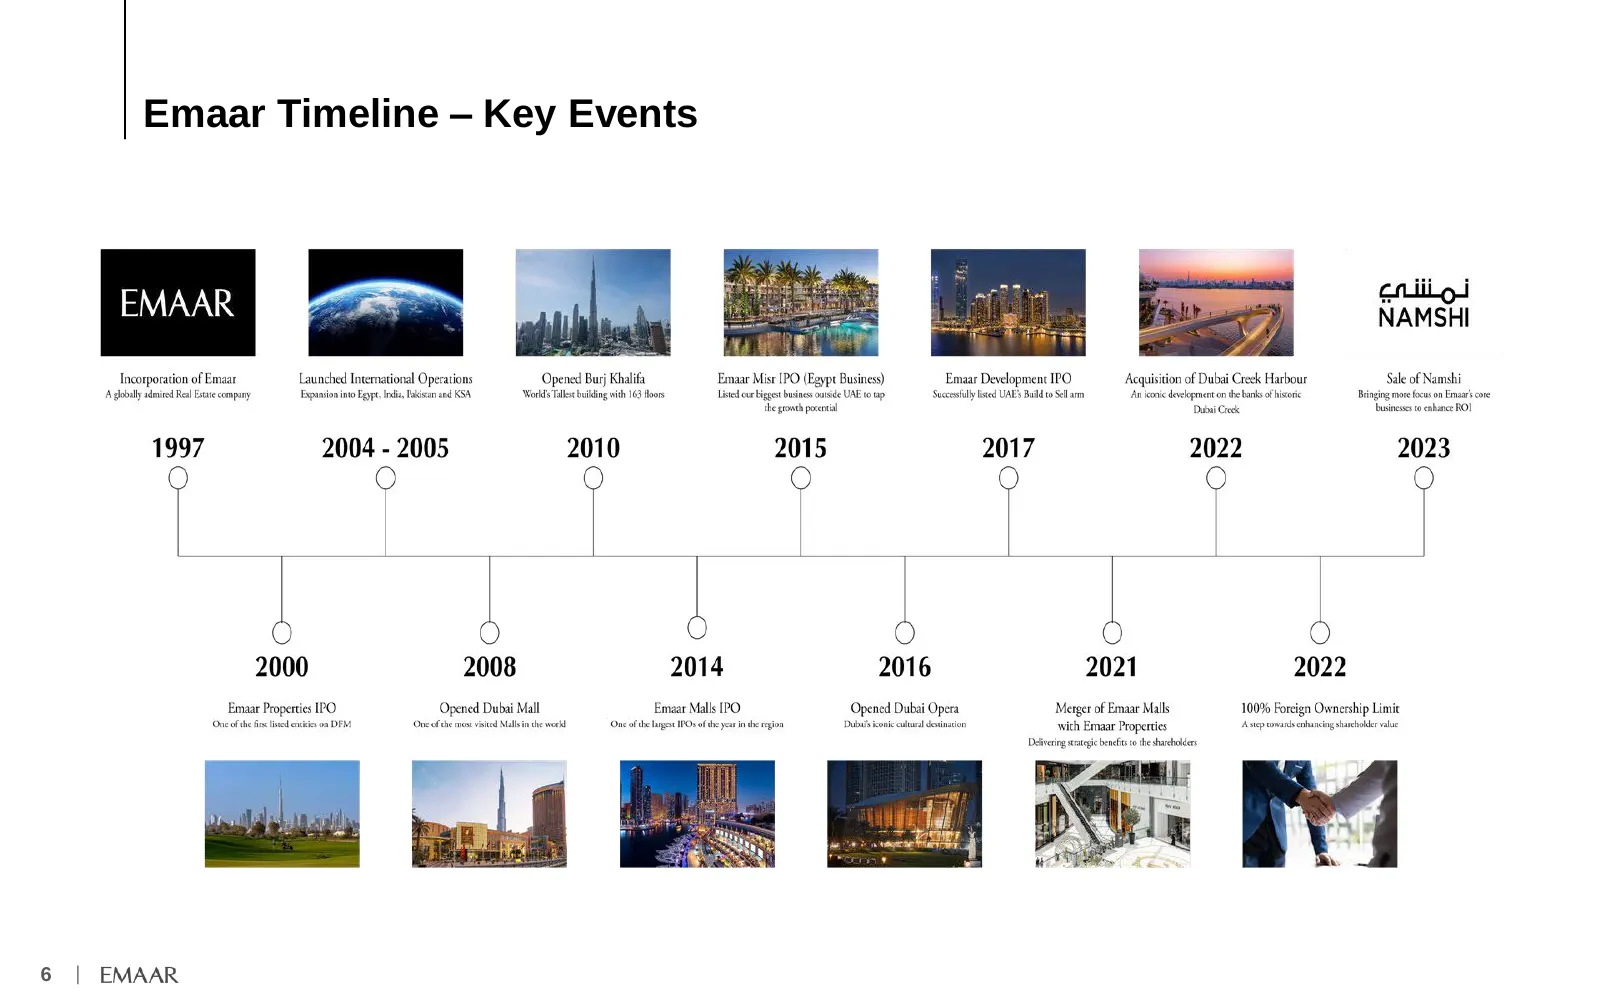
Slide 7: Emaar Timeline – Key Events
Emaar Timeline – Key Events 6 |
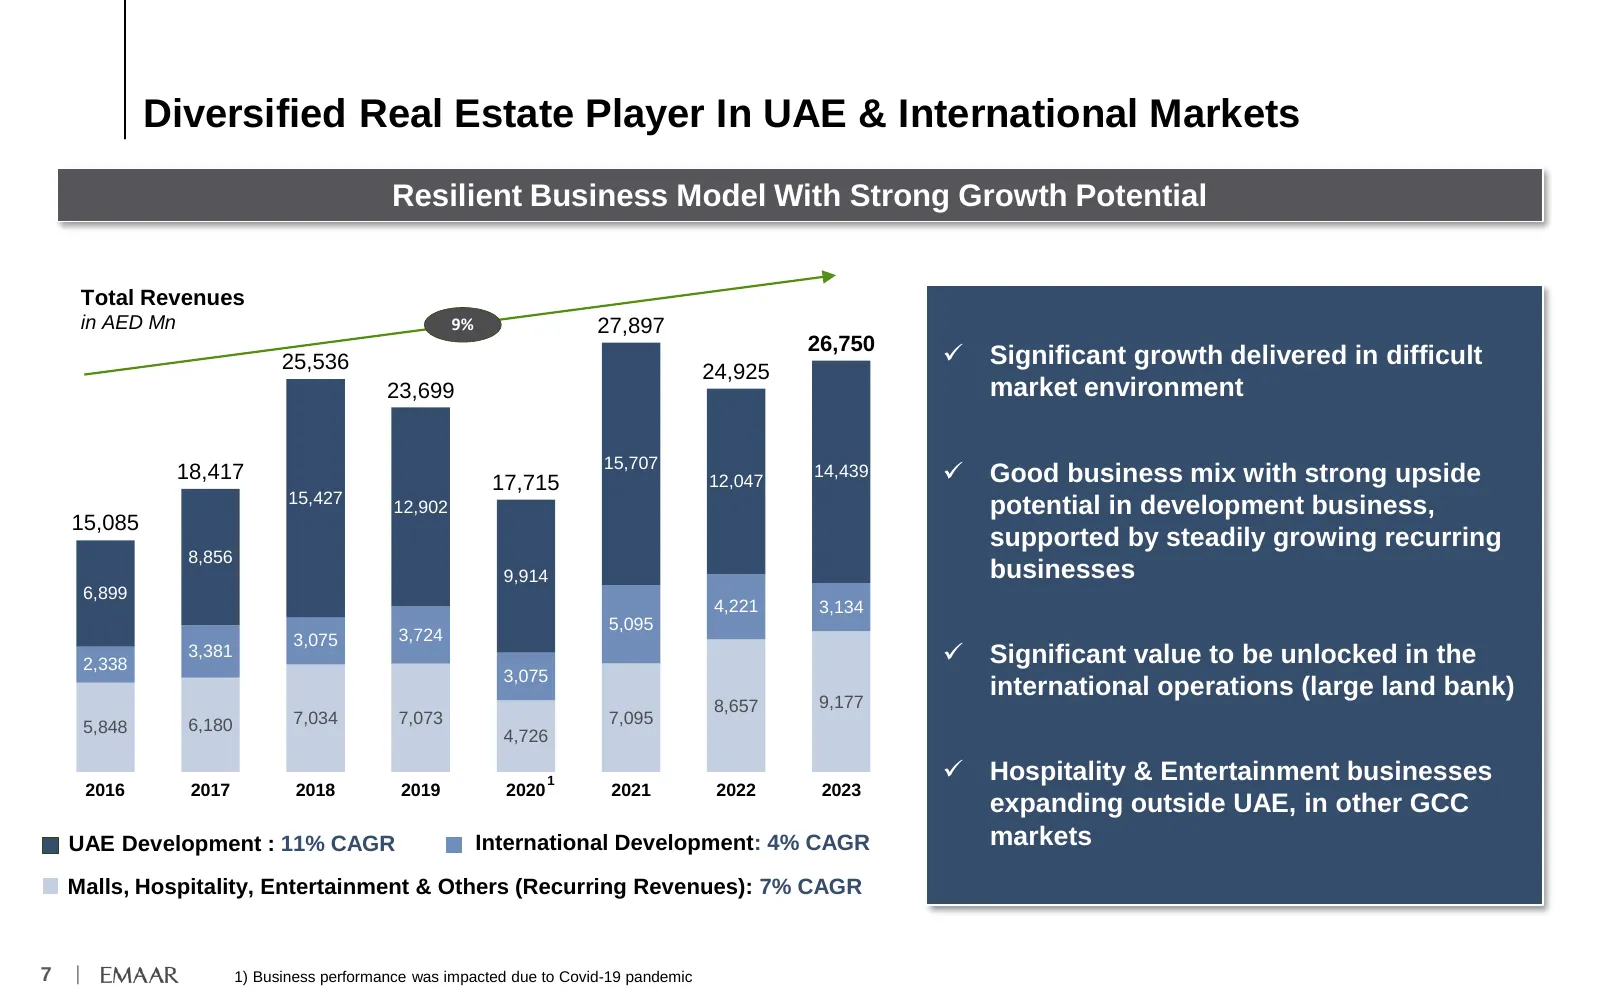
Slide 8: Diversified Real Estate Player In UAE & International Markets
Diversified Real Estate Player In UAE & International Markets Resilient Business Model With Strong Growth Potential Total Revenues in AED Mn 9% 27,897 26,750 25,536 ✓ Significant growth delivered in difficult 24,925 23,699 market environment 15,707 18,417 17,715 12,047 14,439 ✓ Good business mix wit
Slide 9: Strong Balance Sheet
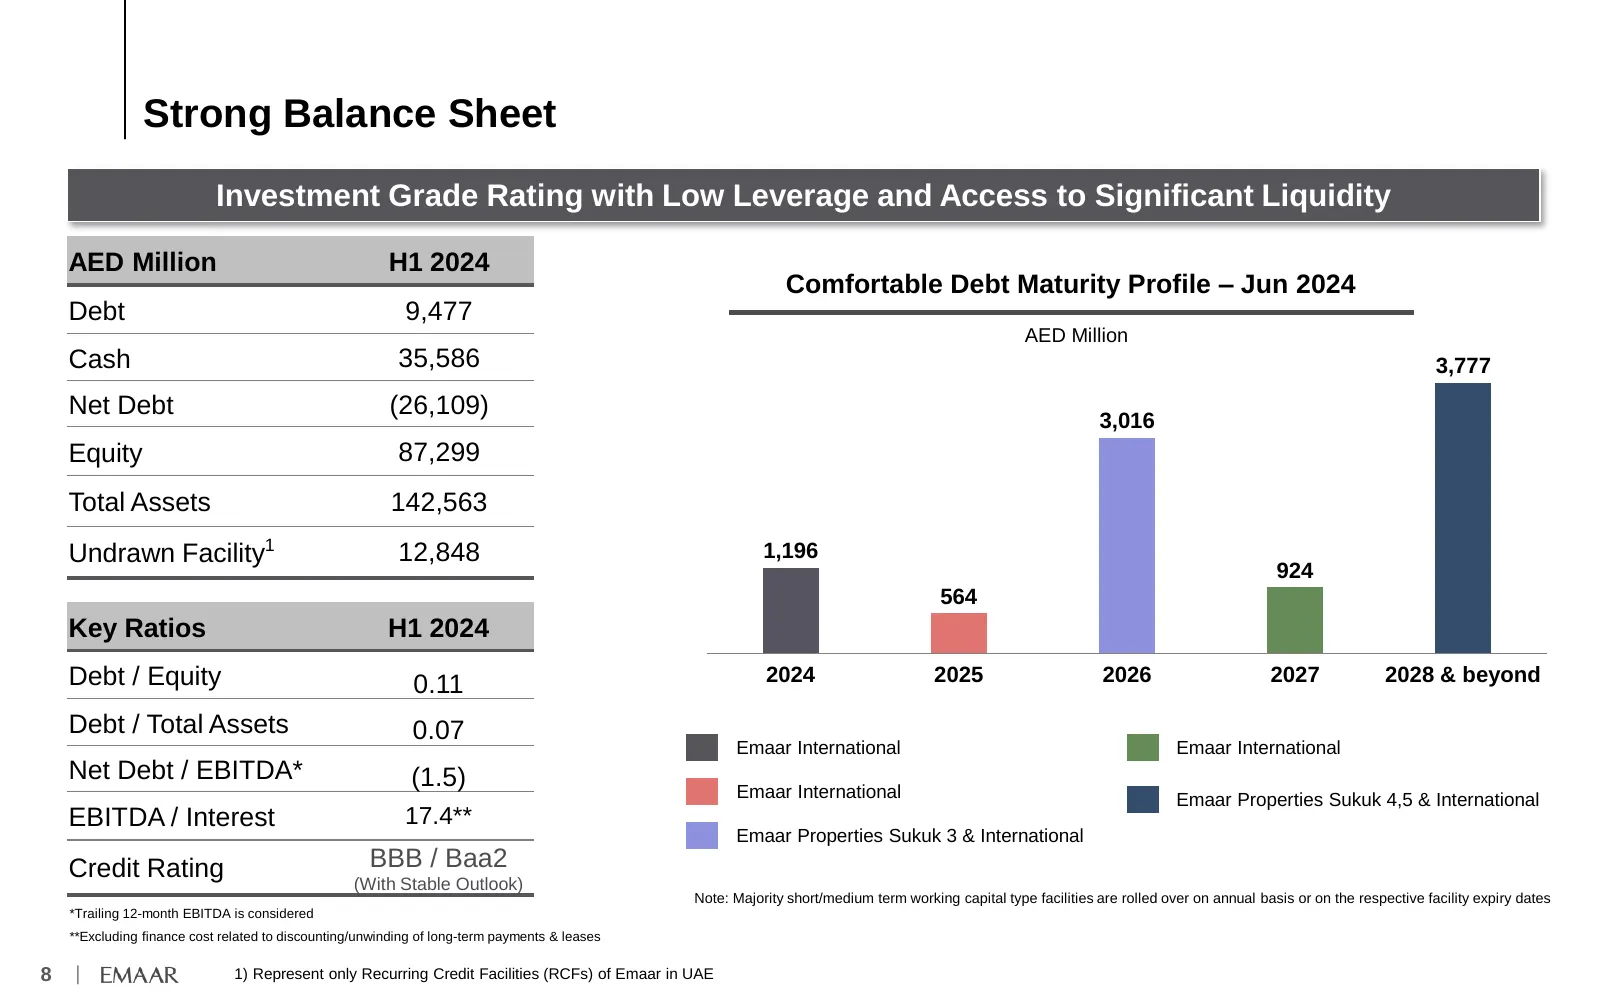
Strong Balance Sheet Investment Grade Rating with Low Leverage and Access to Significant Liquidity AED Million H1 2024 Comfortable Debt Maturity Profile – Jun 2024 Debt 9,477 AED Million Cash 35,586 3,777 Net Debt (26,109) 3,016 Equity 87,299 Total Assets 142,563 Undrawn Facility1 12,848 1,196 924 5
Slide 10: Emaar In The Value Zone
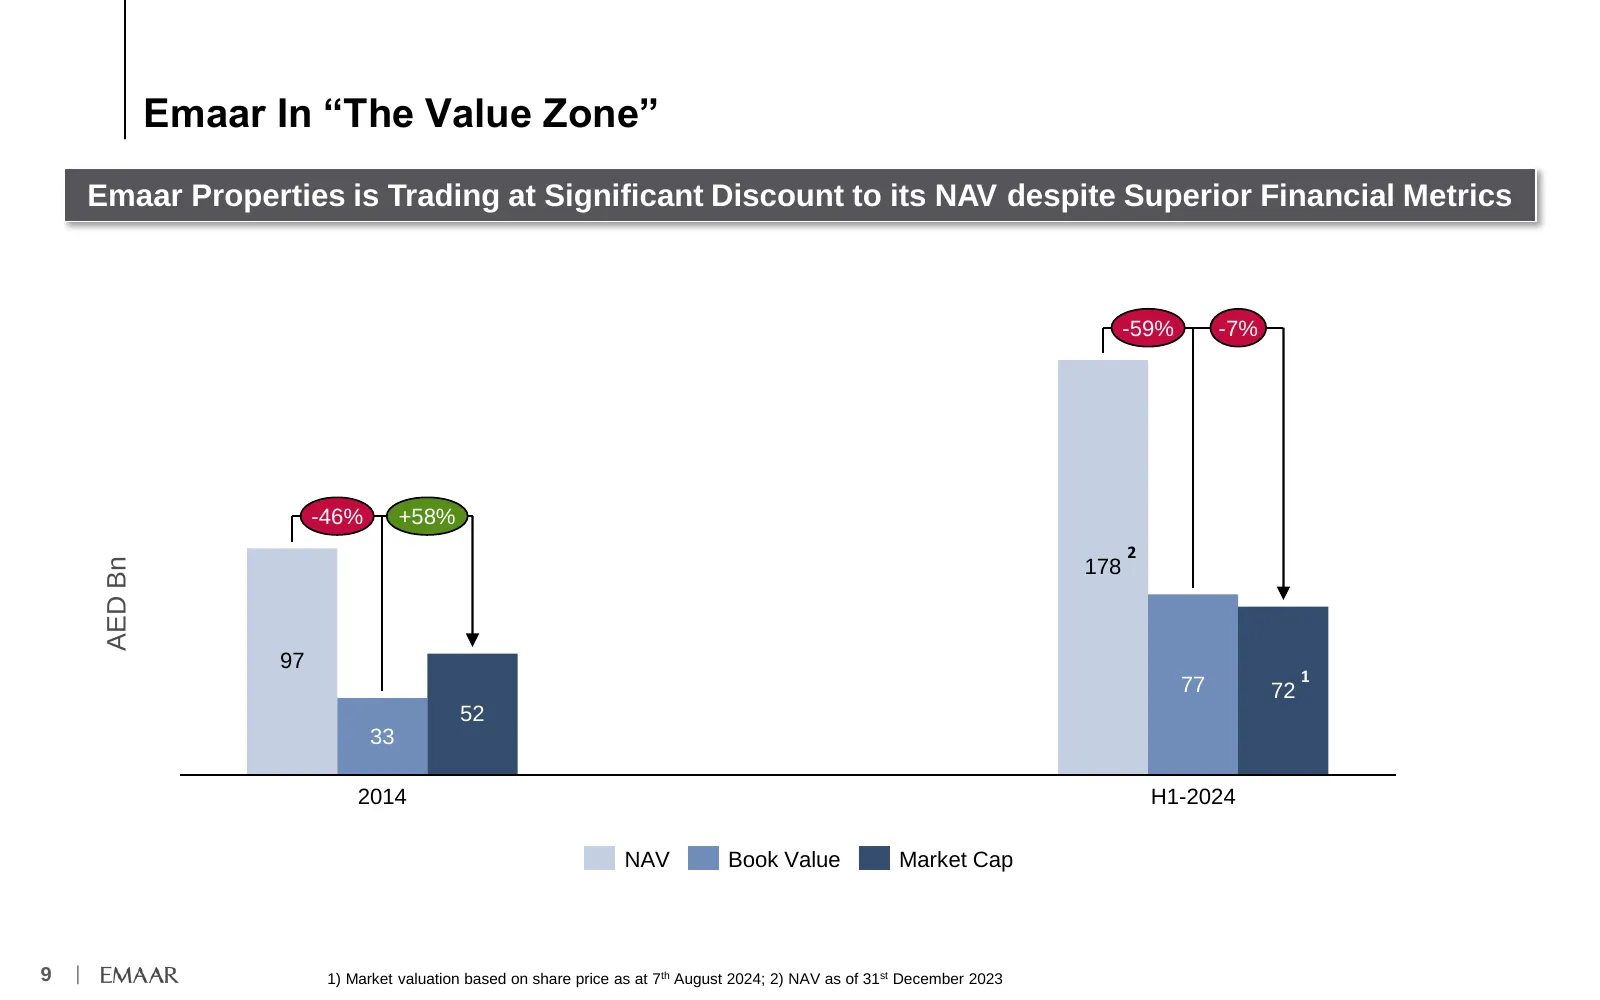
Emaar In “The Value Zone” Emaar Properties is Trading at Significant Discount to its NAV despite Superior Financial Metrics -59% -7% -46% +58% 2 AED Bn 178 97 1 77 72 52 33 2014 H1-2024 NAV Book Value Market Cap 9 | 1) Market valuation based on share price as at 7th August 2024; 2) NAV as of 31st De
Slide 11: Expanding Footprint in UAE & International Markets
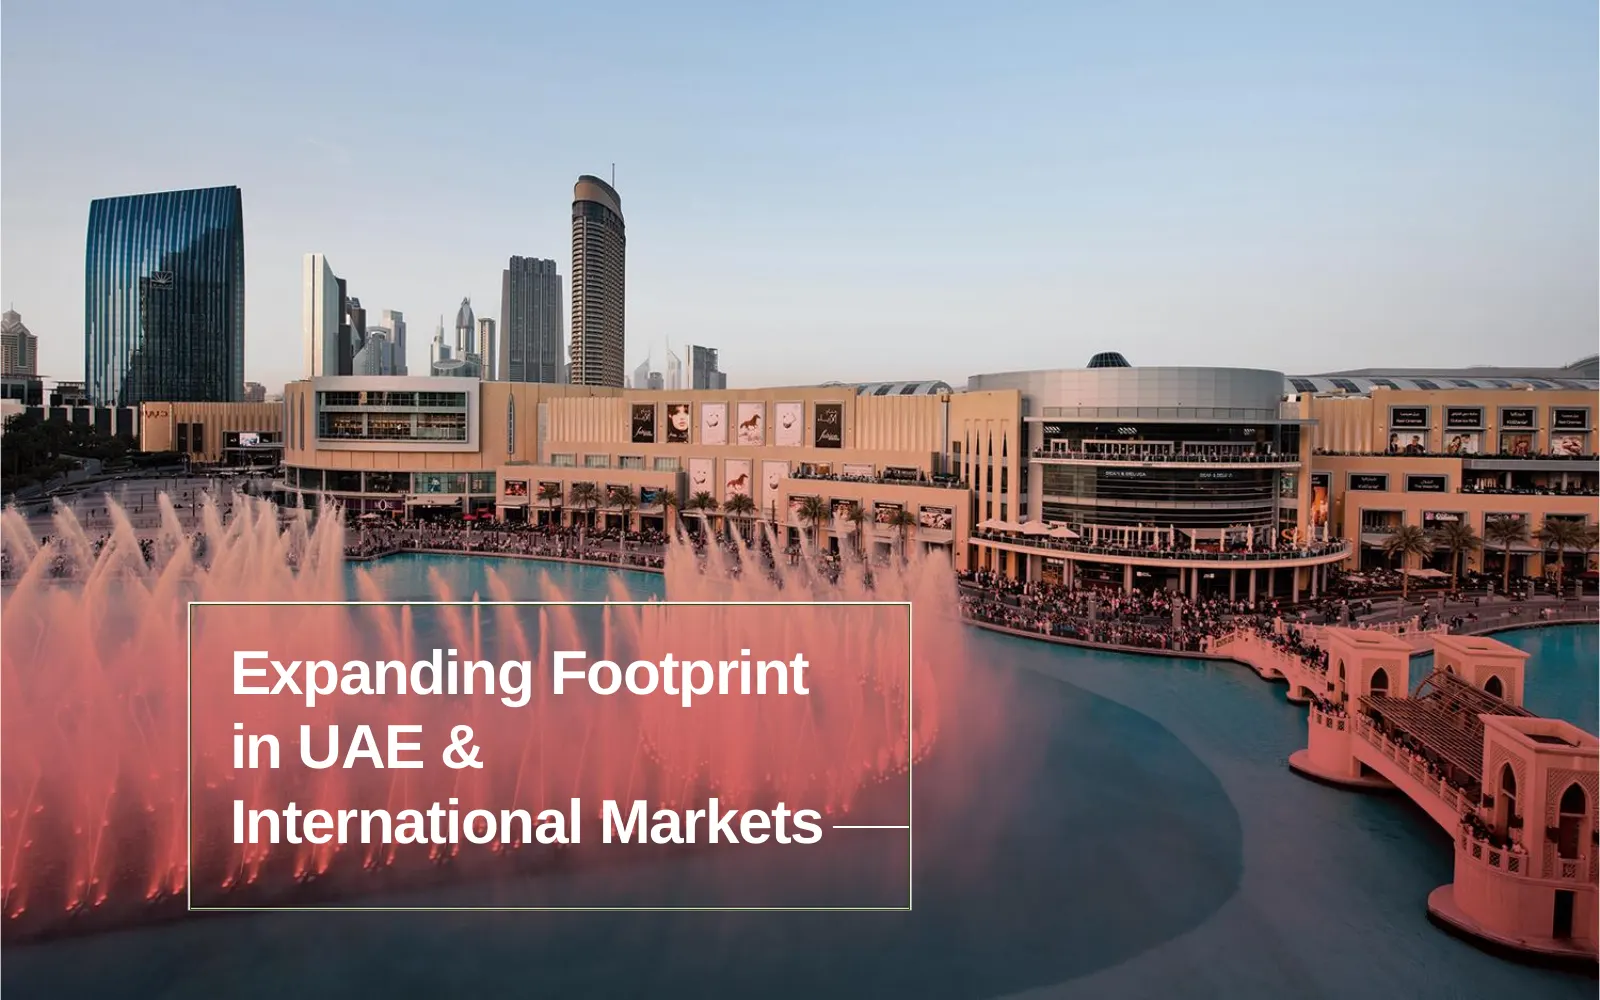
Expanding Footprint in UAE & International Markets 10 |
Slide 12: Developer of Iconic Master Plans Transforming Dubai
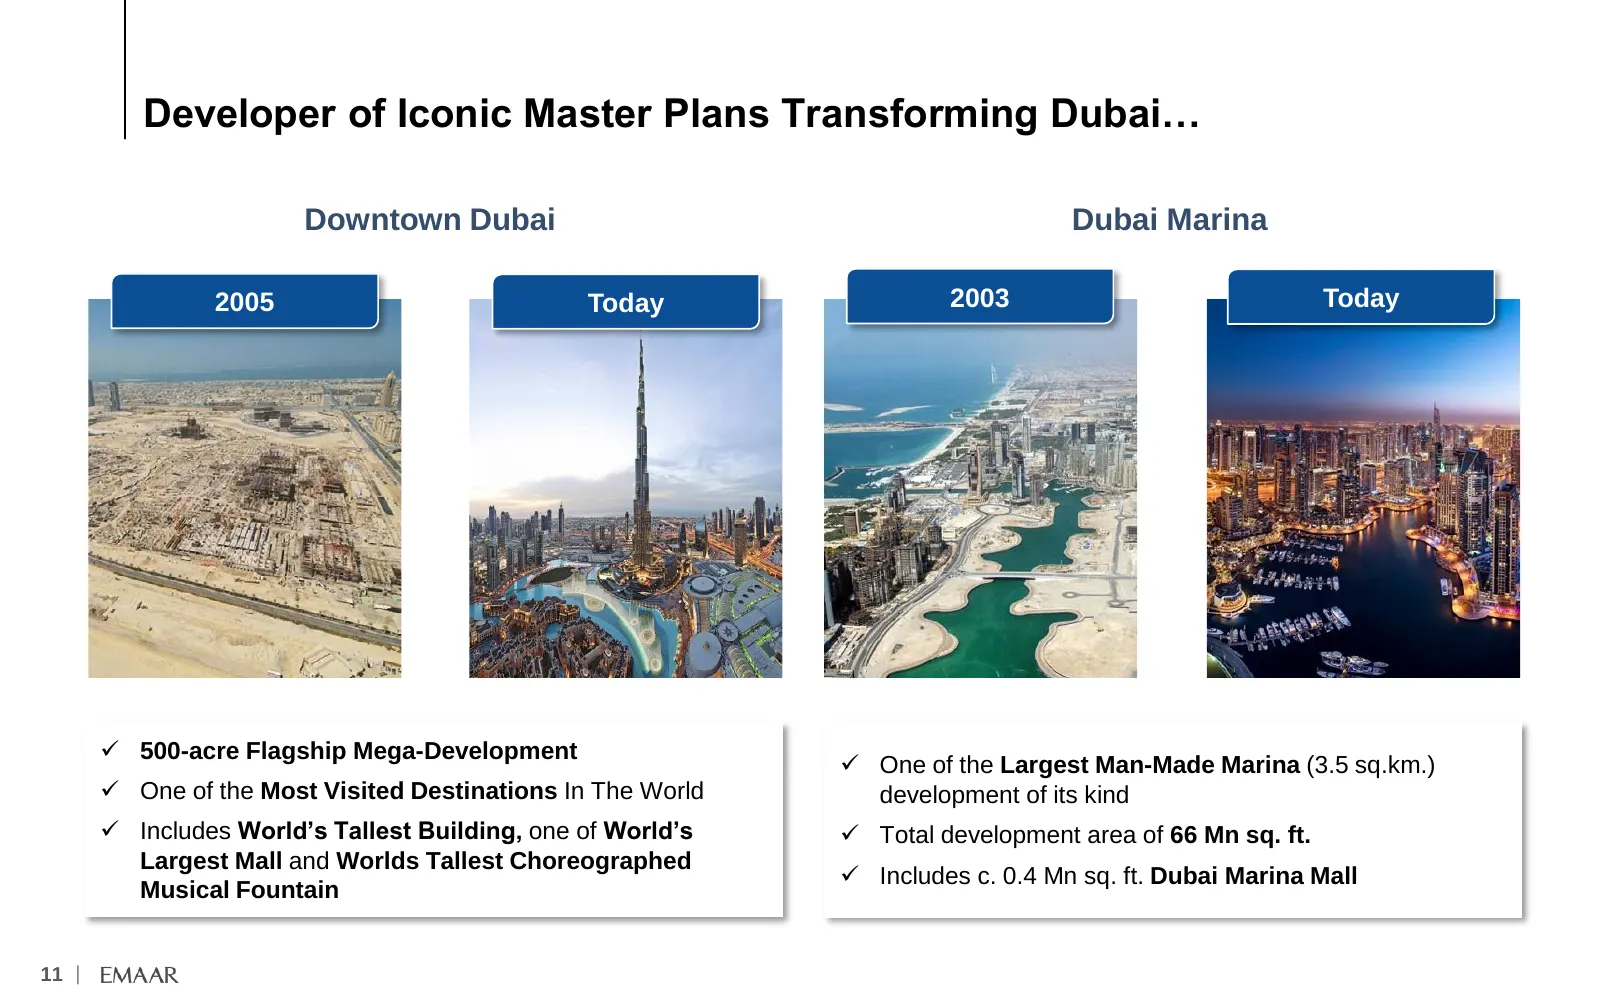
Developer of Iconic Master Plans Transforming Dubai… Downtown Dubai Dubai Marina 2005 Today 2003 Today ✓ 500-acre Flagship Mega-Development ✓ One of the Largest Man-Made Marina (3.5 sq.km.) ✓ One of the Most Visited Destinations In The World development of its kind ✓ Includes World’s Tallest Buildin
Slide 13: Having Stood Multiple Tests of Time
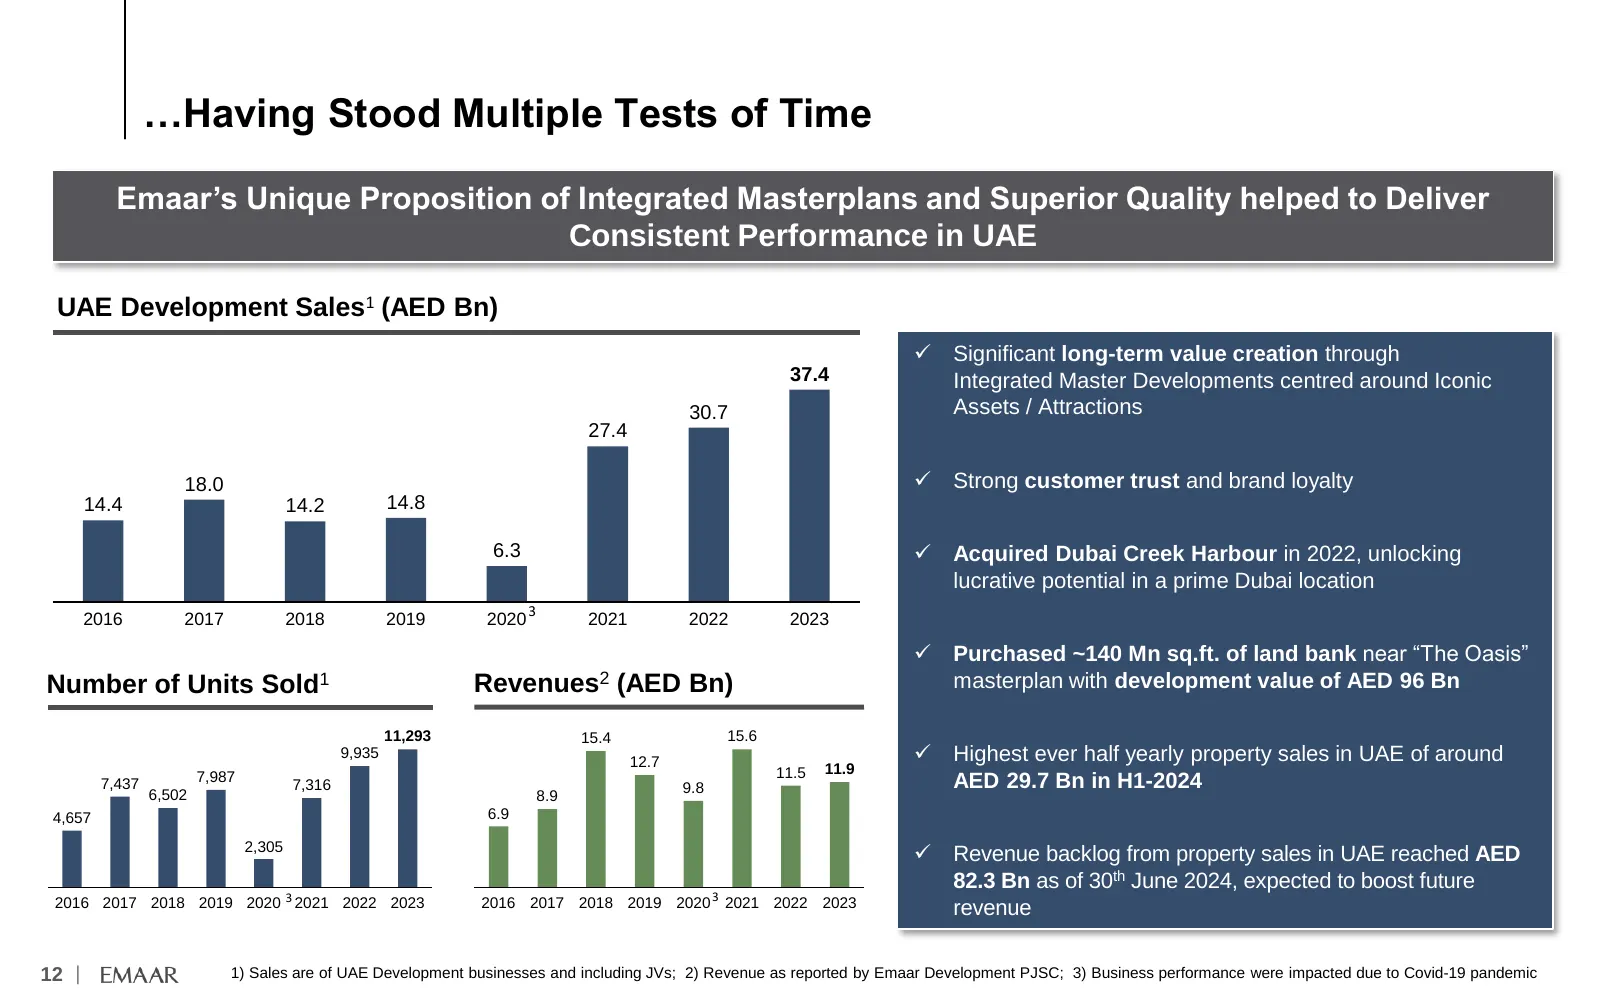
…Having Stood Multiple Tests of Time Emaar’s Unique Proposition of Integrated Masterplans and Superior Quality helped to Deliver Consistent Performance in UAE UAE Development Sales1 (AED Bn) ✓ Significant long-term value creation through 37.4 Integrated Master Developments centred around Iconic 30.7
Slide 14: Renowned For Its Iconic Retail Assets
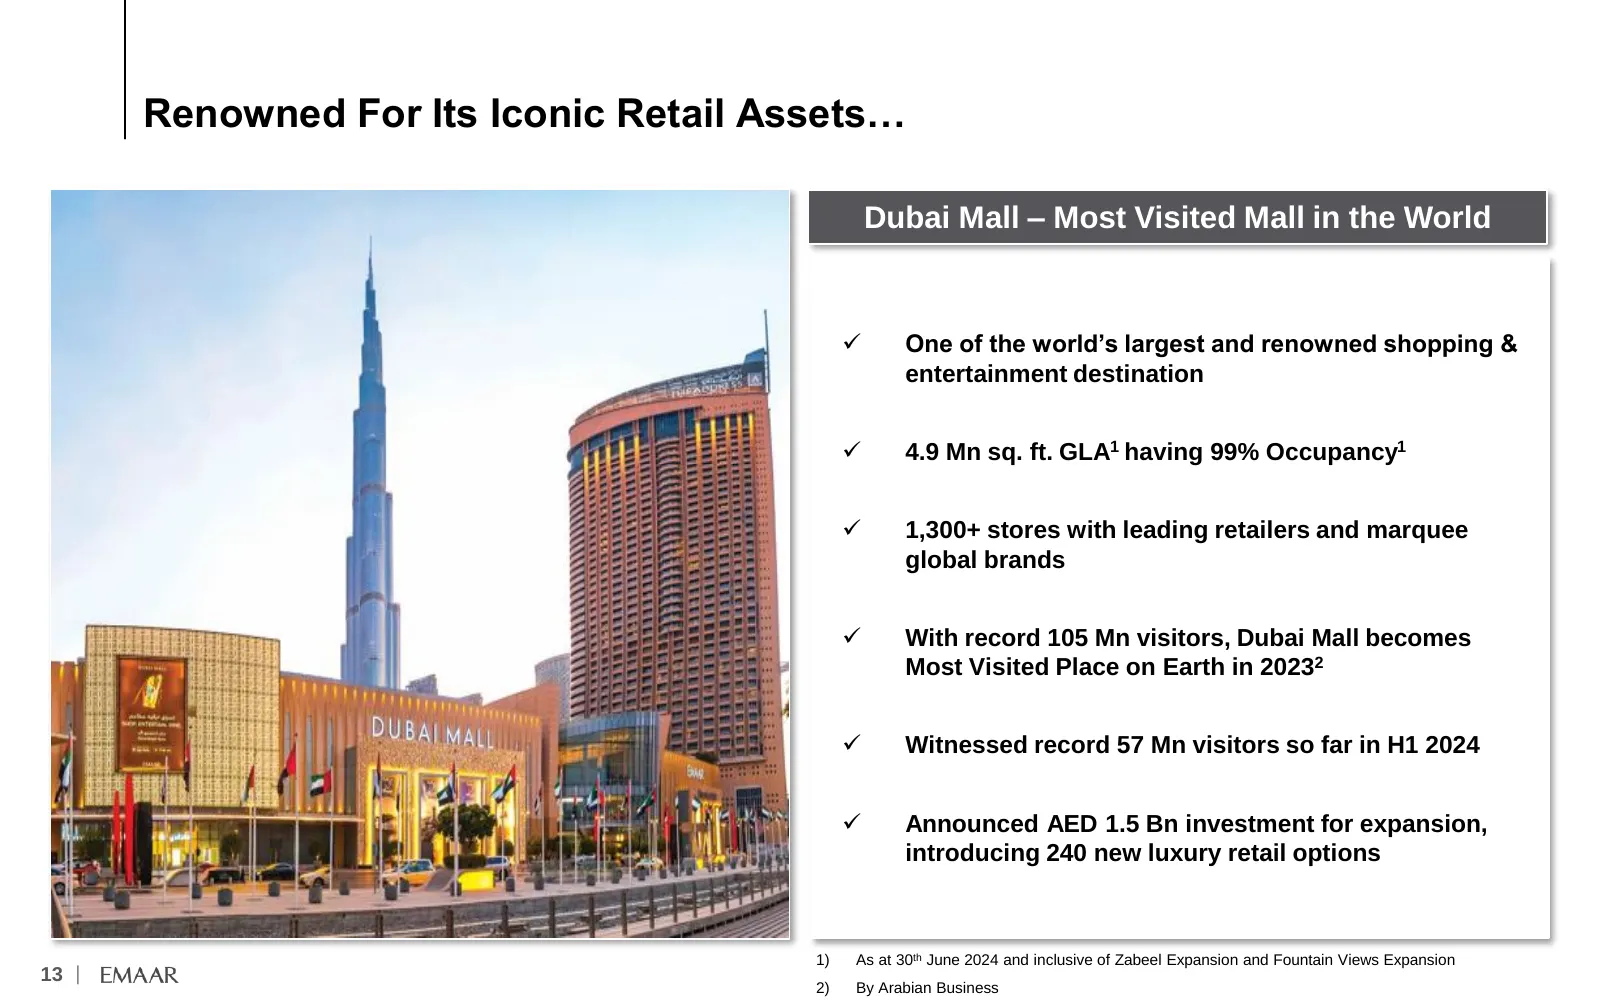
Renowned For Its Iconic Retail Assets… Dubai Mall – Most Visited Mall in the World ✓ One of the world’s largest and renowned shopping & entertainment destination ✓ 4.9 Mn sq. ft. GLA1 having 99% Occupancy1 ✓ 1,300+ stores with leading retailers and marquee global brands ✓ With record 105 Mn visitors
Slide 15: Delivering Robust Growth
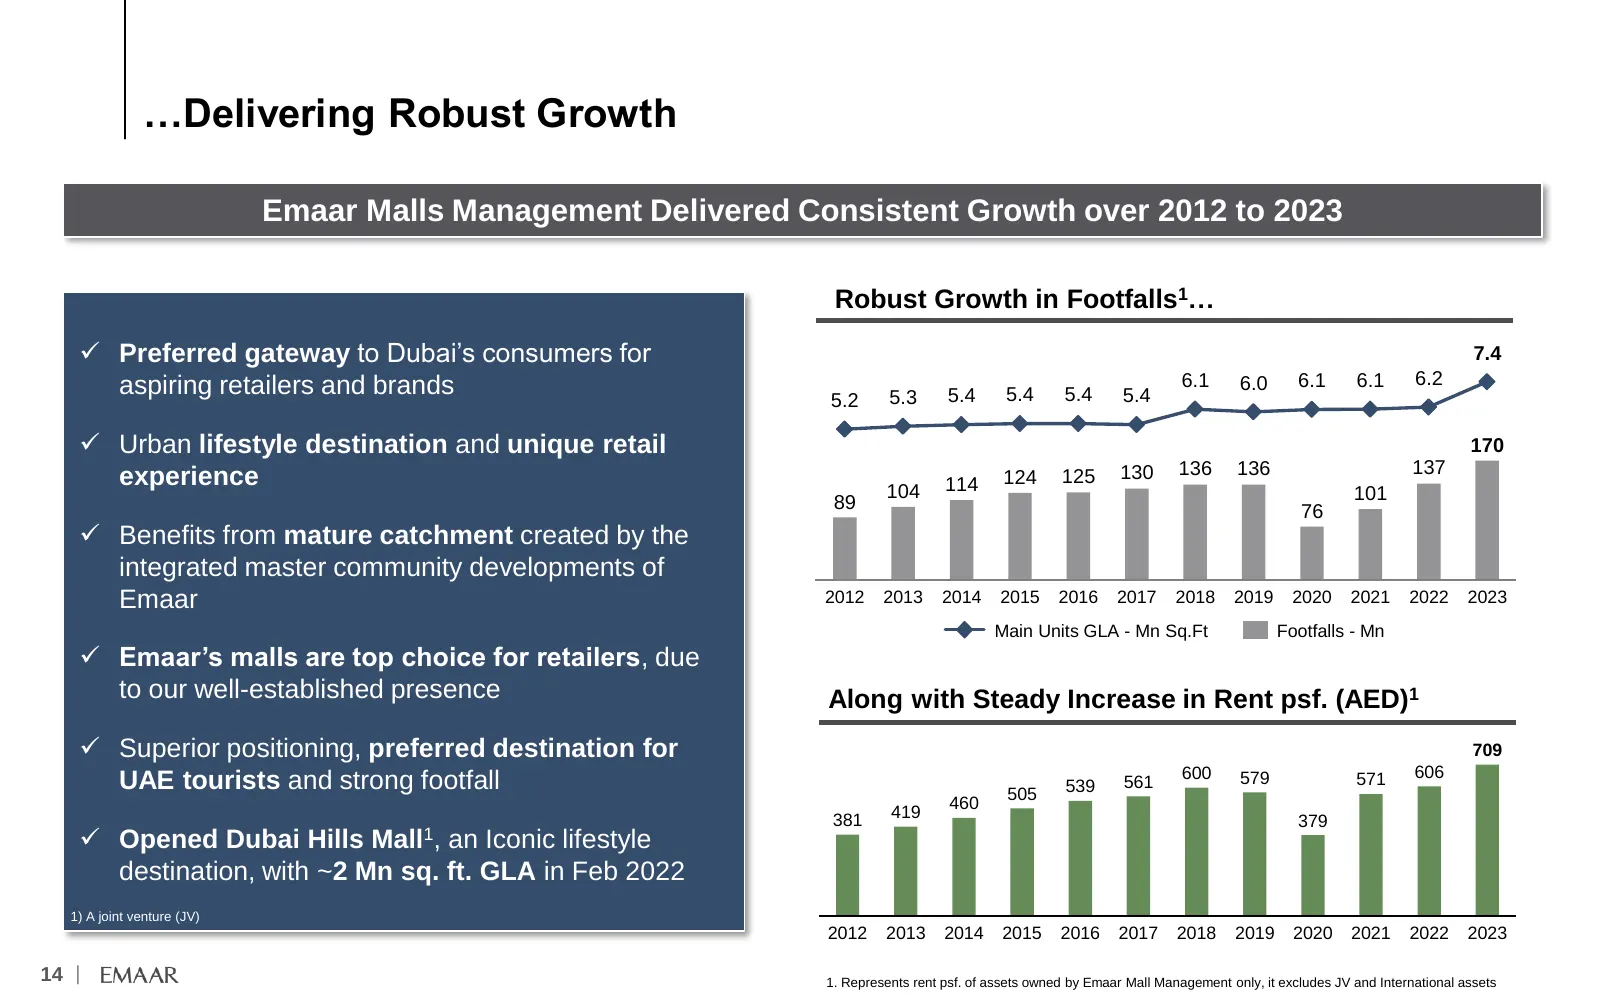
…Delivering Robust Growth Emaar Malls Management Delivered Consistent Growth over 2012 to 2023 Robust Growth in Footfalls1… ✓ Preferred gateway to Dubai’s consumers for 300 7.4 aspiring retailers and brands 6.1 6.0 6.1 6.1 6.2 250 5.2 5.3 5.4 5.4 5.4 5.4 ✓ Urban lifestyle destination and unique reta
Slide 16: Complemented by Immersive Entertainment Avenues
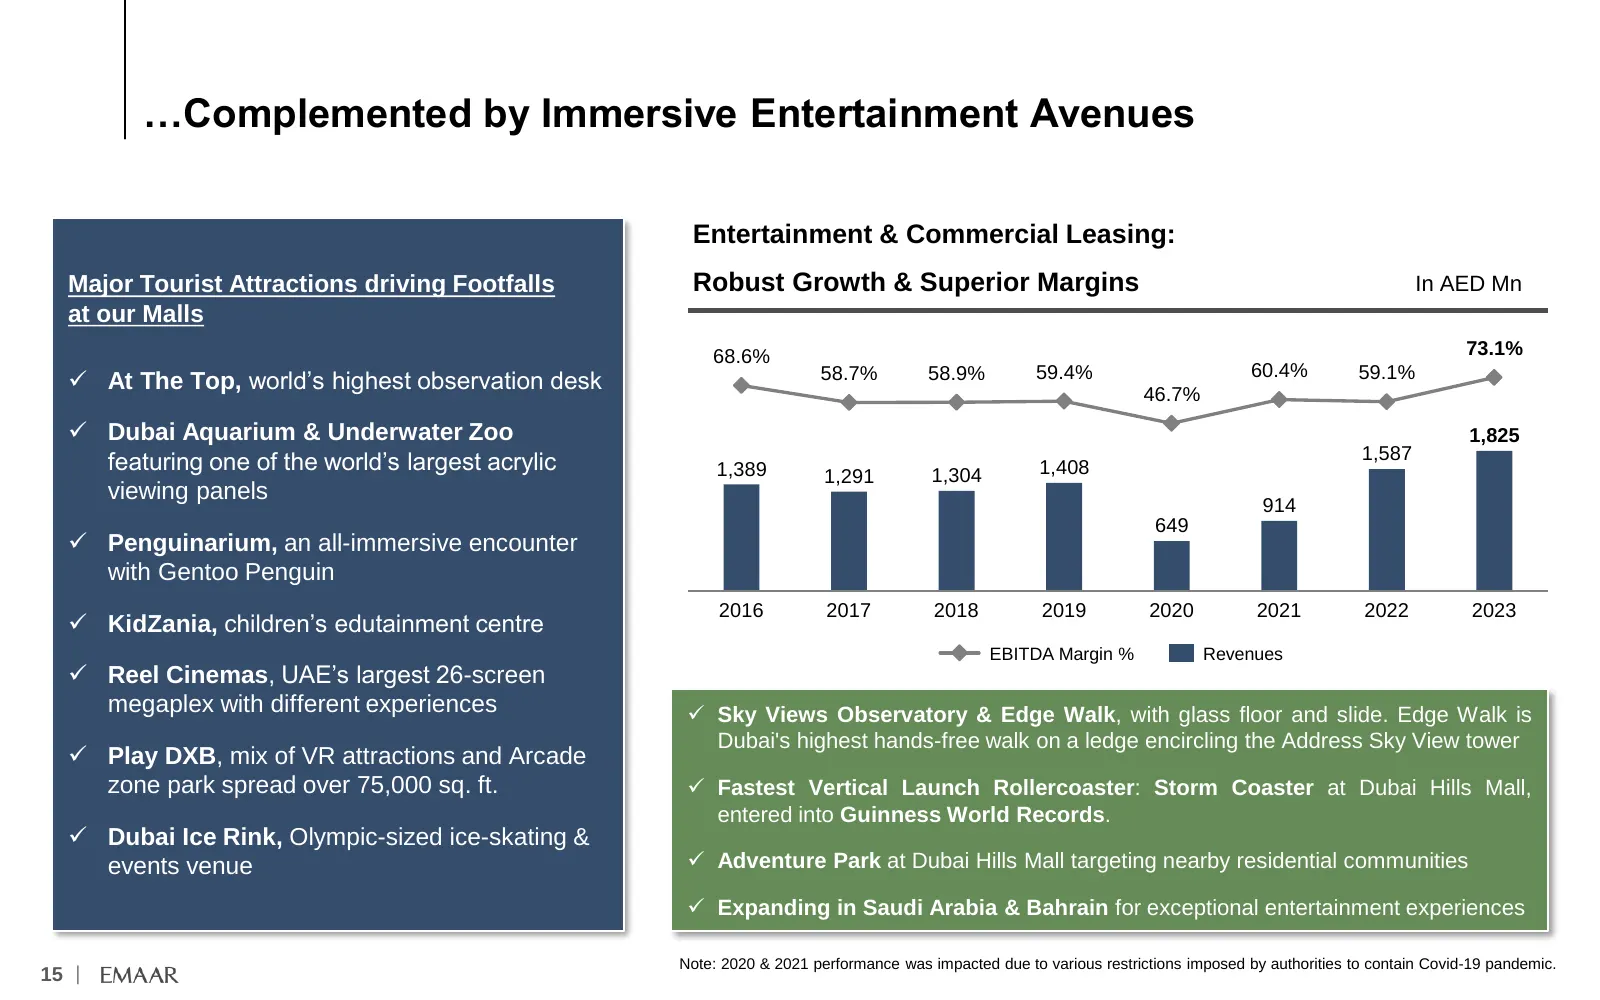
…Complemented by Immersive Entertainment Avenues Entertainment & Commercial Leasing: Major Tourist Attractions driving Footfalls Robust Growth & Superior Margins In AED Mn at our Malls 68.6% 73.1% 58.7% 58.9% 59.4% 60.4% 59.1% ✓ At The Top, world’s highest observation desk 46.7% ✓ Dubai Aquarium & U
Slide 17: Hospitality Assets Deliver Steady Performance
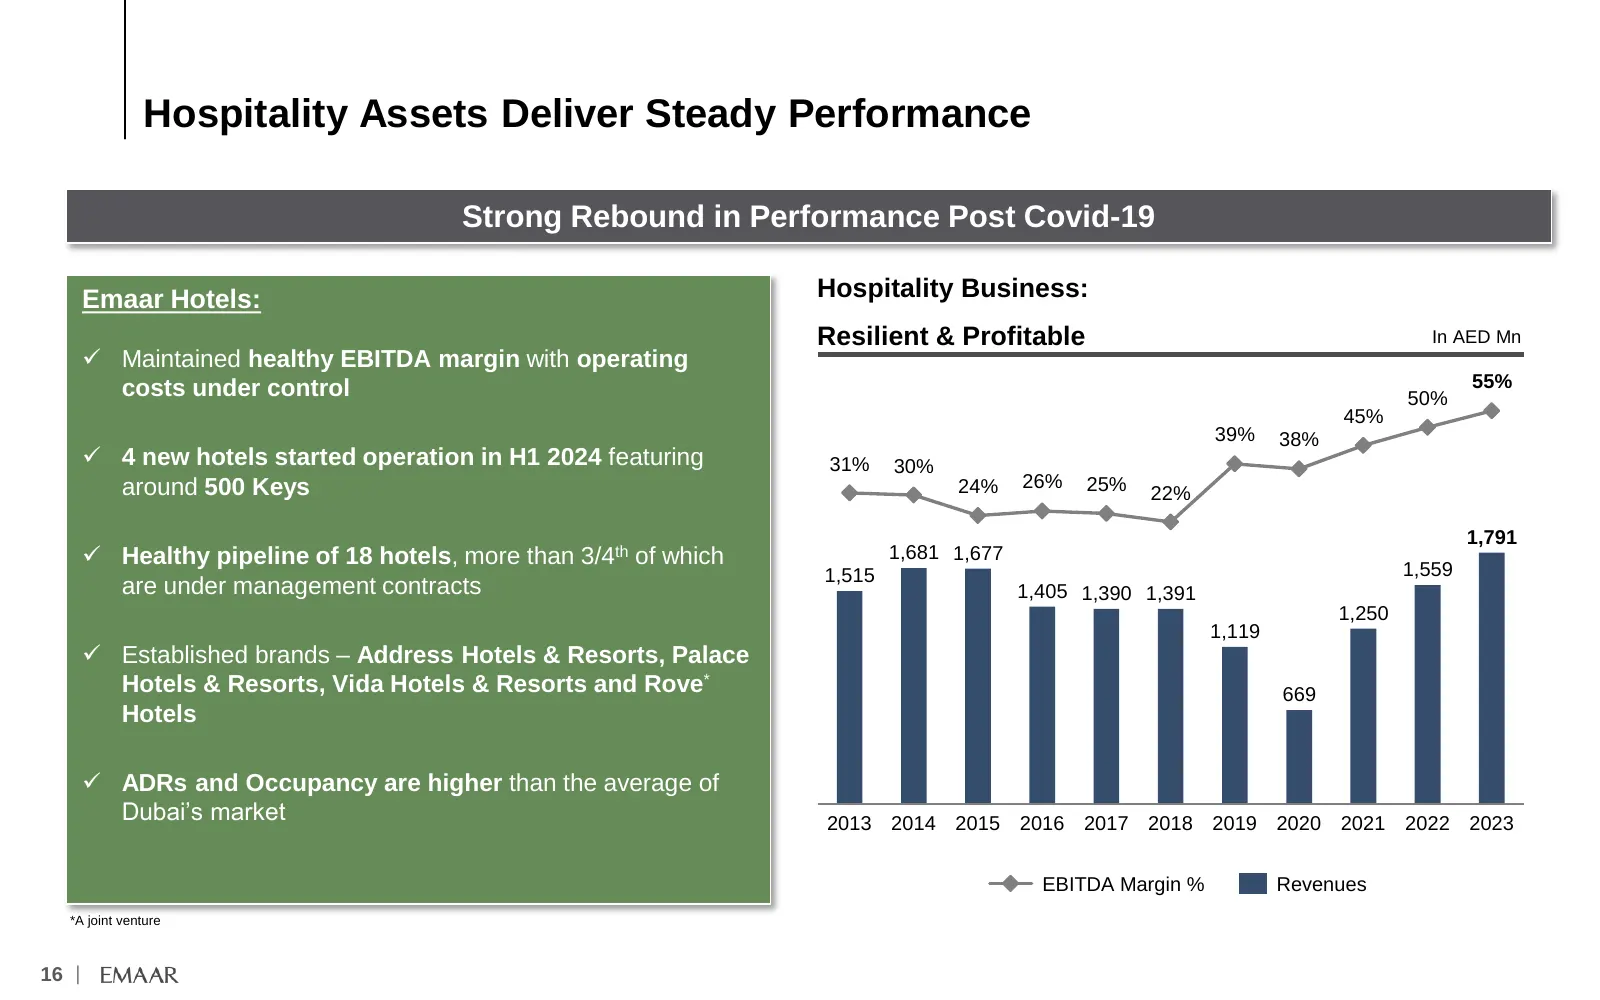
Hospitality Assets Deliver Steady Performance Strong Rebound in Performance Post Covid-19 Emaar Hotels: Hospitality Business: Resilient & Profitable In AED Mn ✓ Maintained healthy EBITDA margin with operating costs under control 55% 50% 45% 39% 38% ✓ 4 new hotels started operation in H1 2024 featuri
Slide 18: Replicating Our Success In International Markets
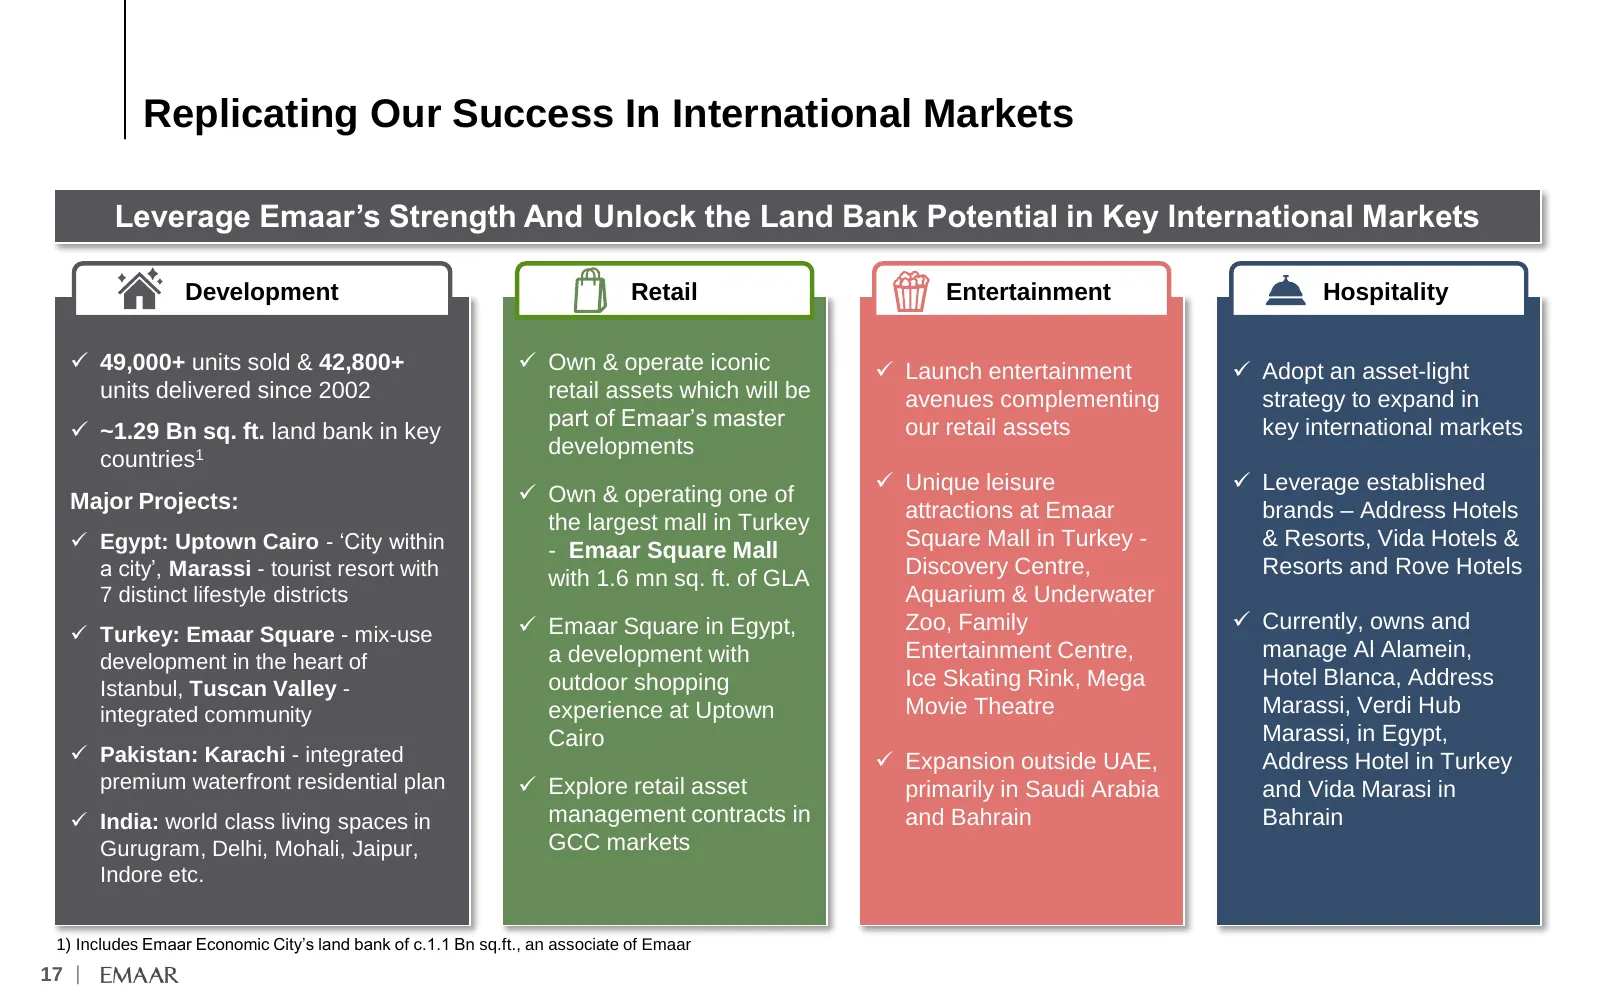
Replicating Our Success In International Markets Leverage Emaar’s Strength And Unlock the Land Bank Potential in Key International Markets Development Retail Entertainment Hospitality ✓ 49,000+ units sold & 42,800+ ✓ Own & operate iconic ✓ Launch entertainment ✓ Adopt an asset-light units delivered
Slide 19: Business Strategy & Outlook
Business Strategy & Outlook 18 |
Slide 20: Top Priorities
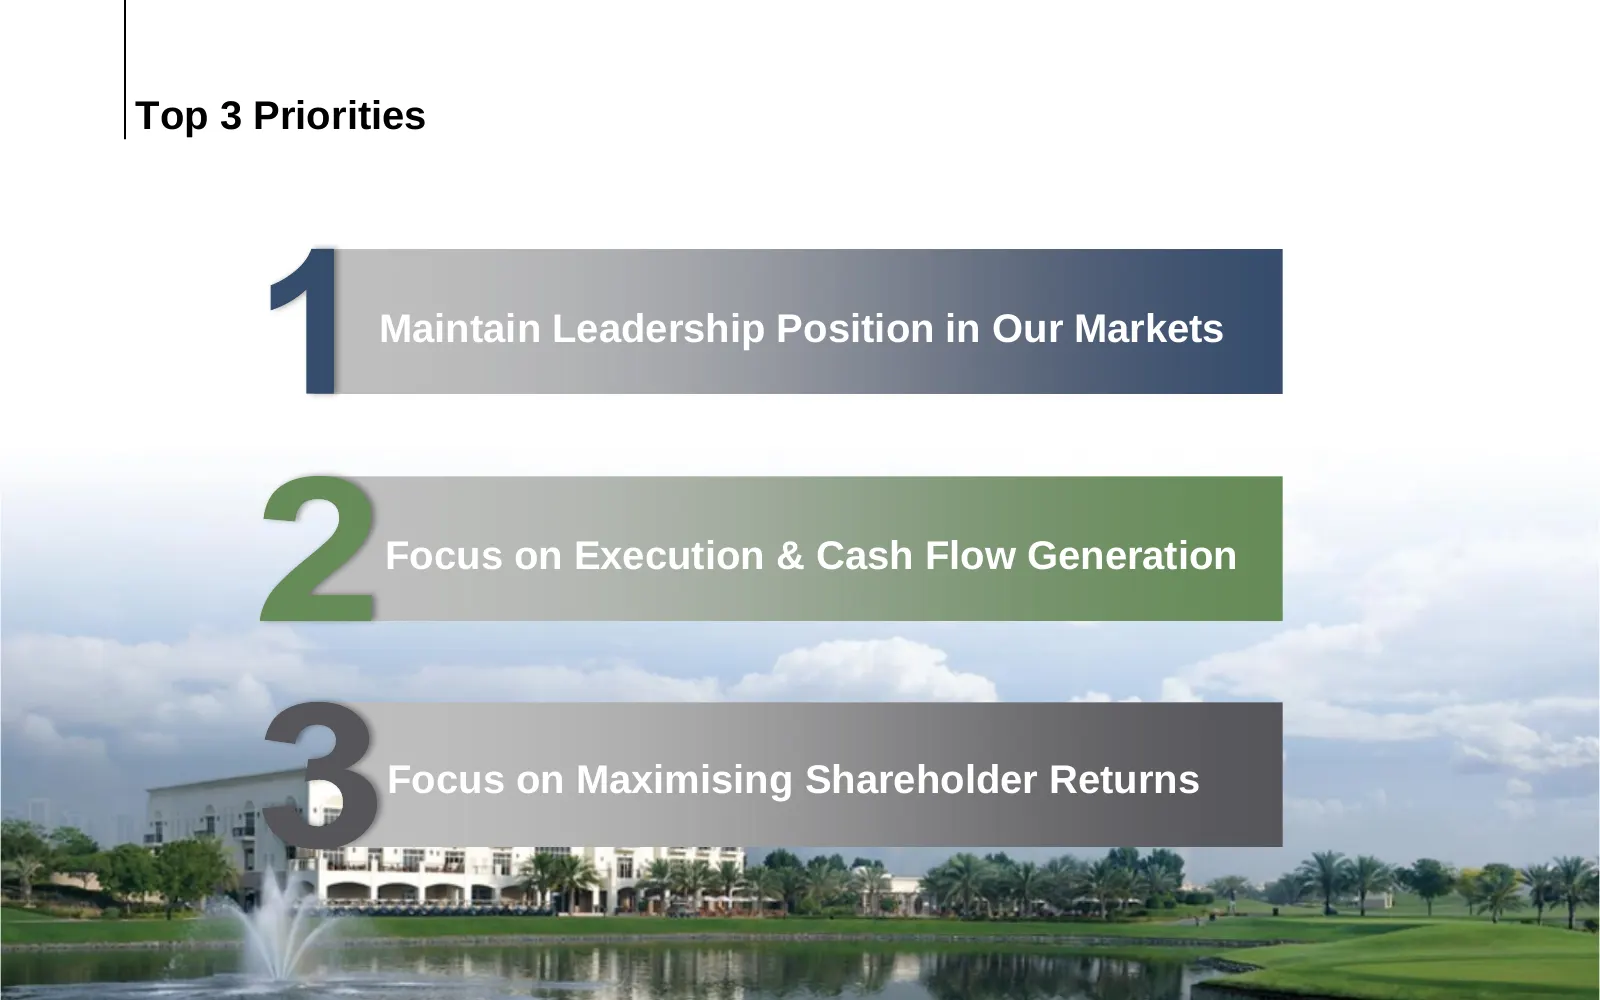
Top 3 Priorities Maintain Leadership Position in Our Markets Focus on Execution & Cash Flow Generation Focus on Maximising Shareholder Returns 19 |
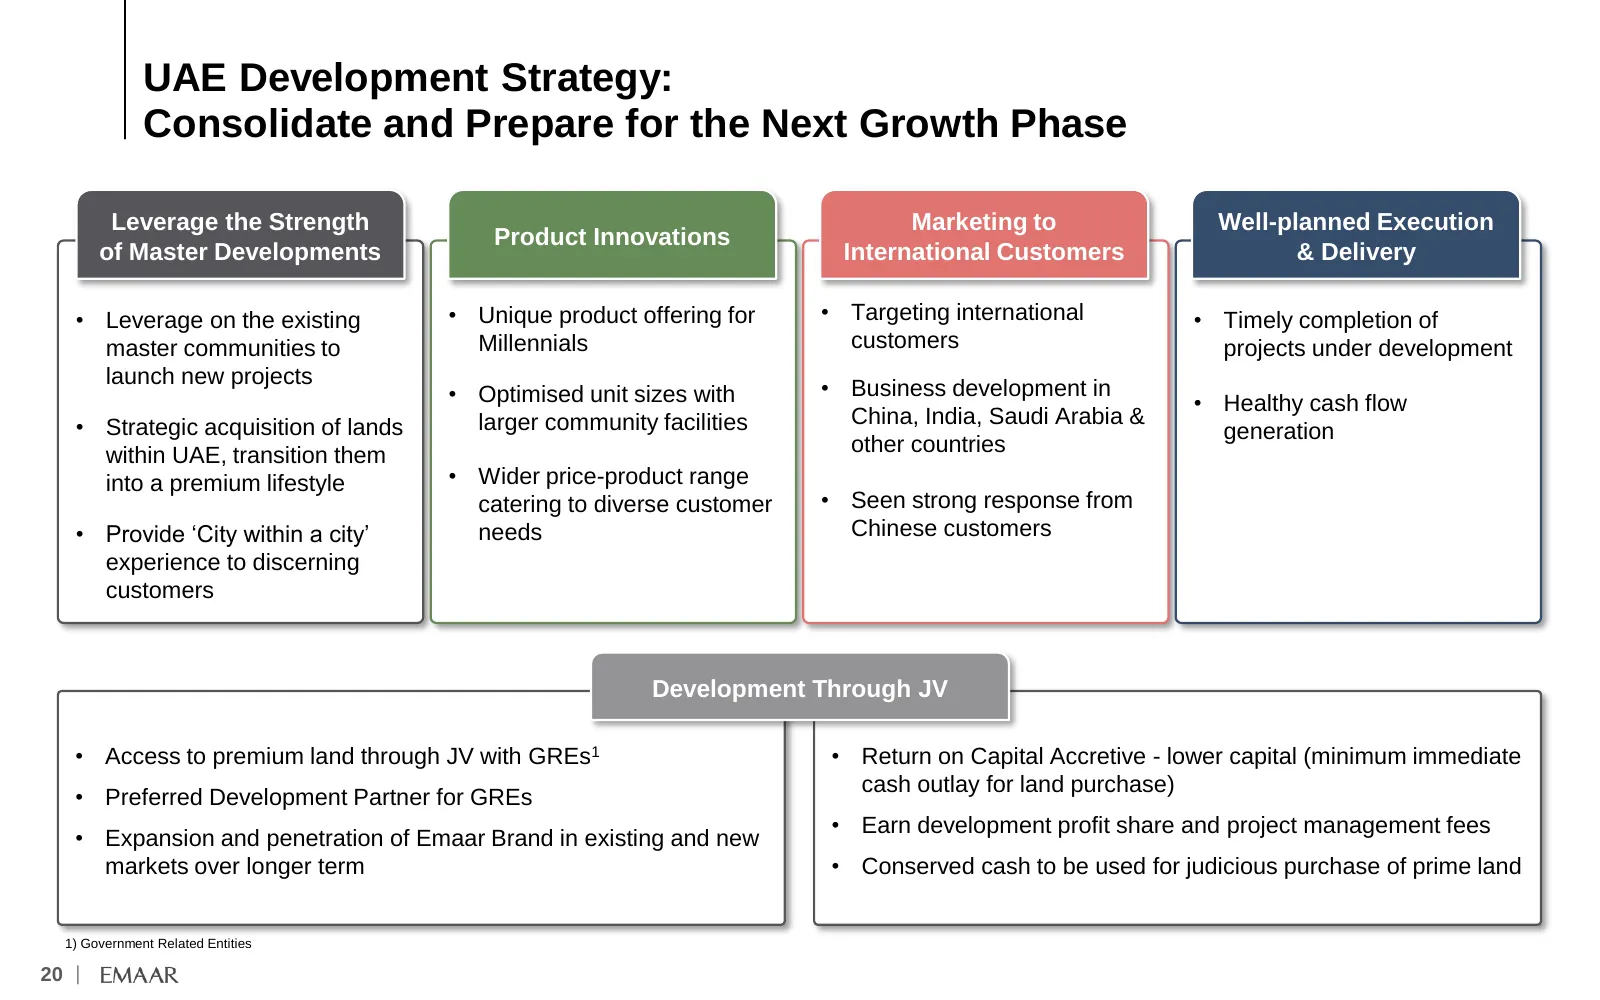
Slide 21: UAE Development Strategy: Consolidate and Prepare for Next Growth Phase
UAE Development Strategy: Consolidate and Prepare for the Next Growth Phase Leverage the Strength Marketing to Well-planned Execution Product Innovations of Master Developments International Customers & Delivery • Leverage on the existing • Unique product offering for • Targeting international • Tim
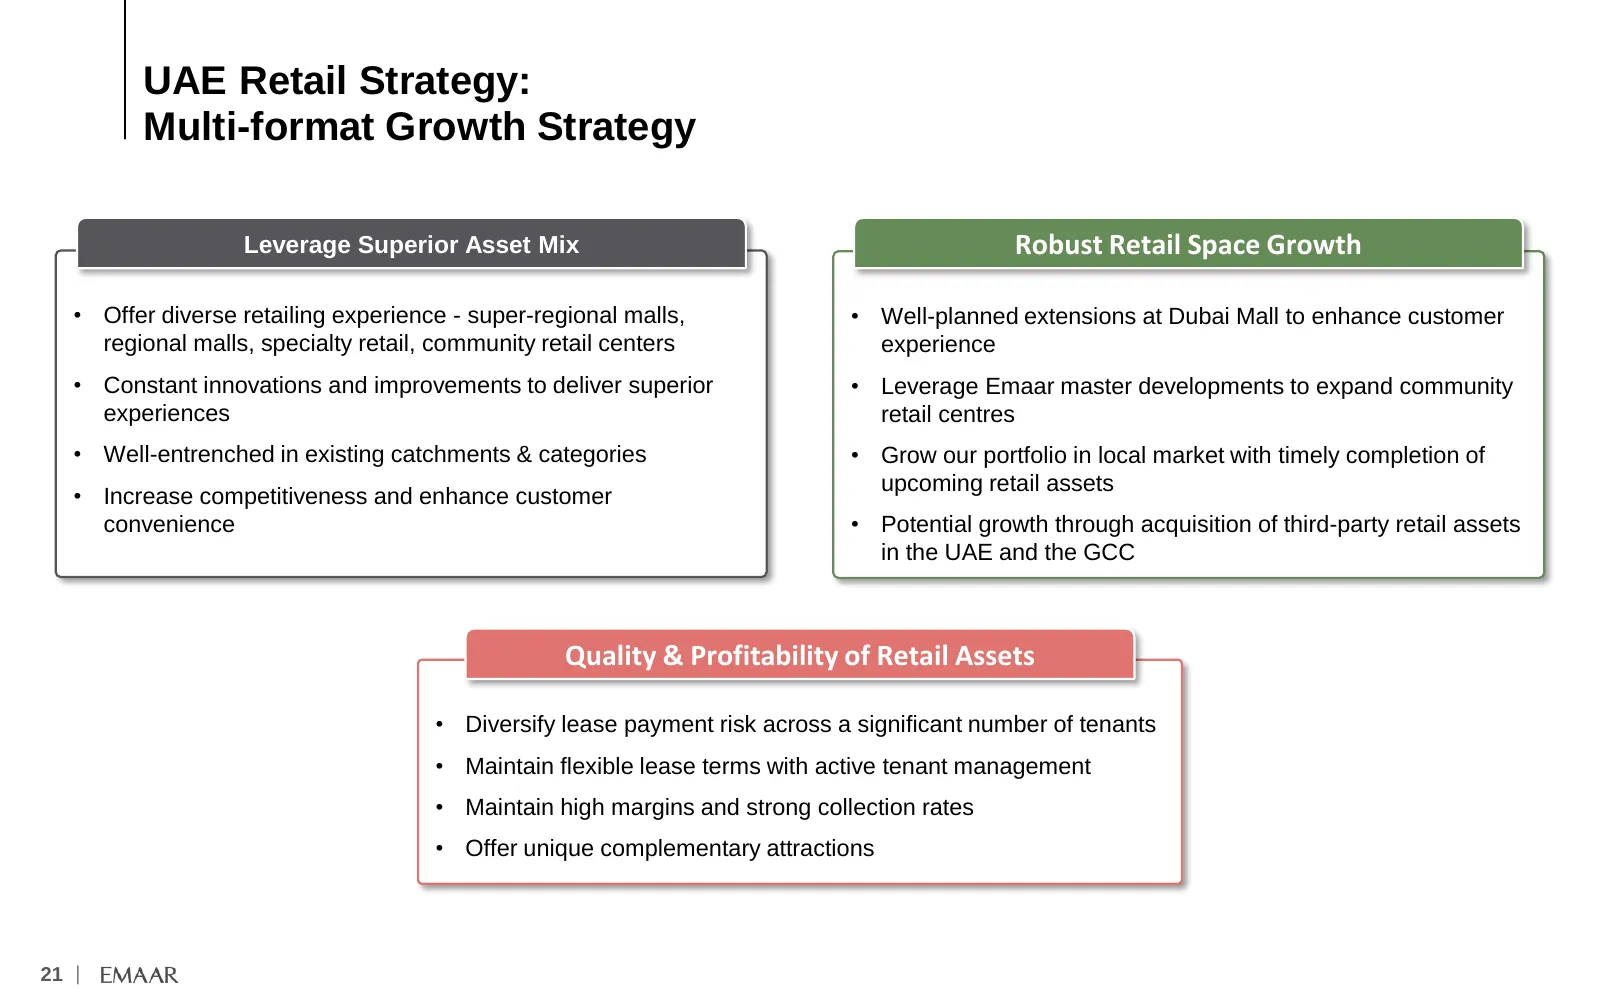
Slide 22: UAE Retail Strategy: Multi-format Growth Strategy
UAE Retail Strategy: Multi-format Growth Strategy Leverage Superior Asset Mix Robust Retail Space Growth • Offer diverse retailing experience - super-regional malls, • Well-planned extensions at Dubai Mall to enhance customer regional malls, specialty retail, community retail centers experience • Co
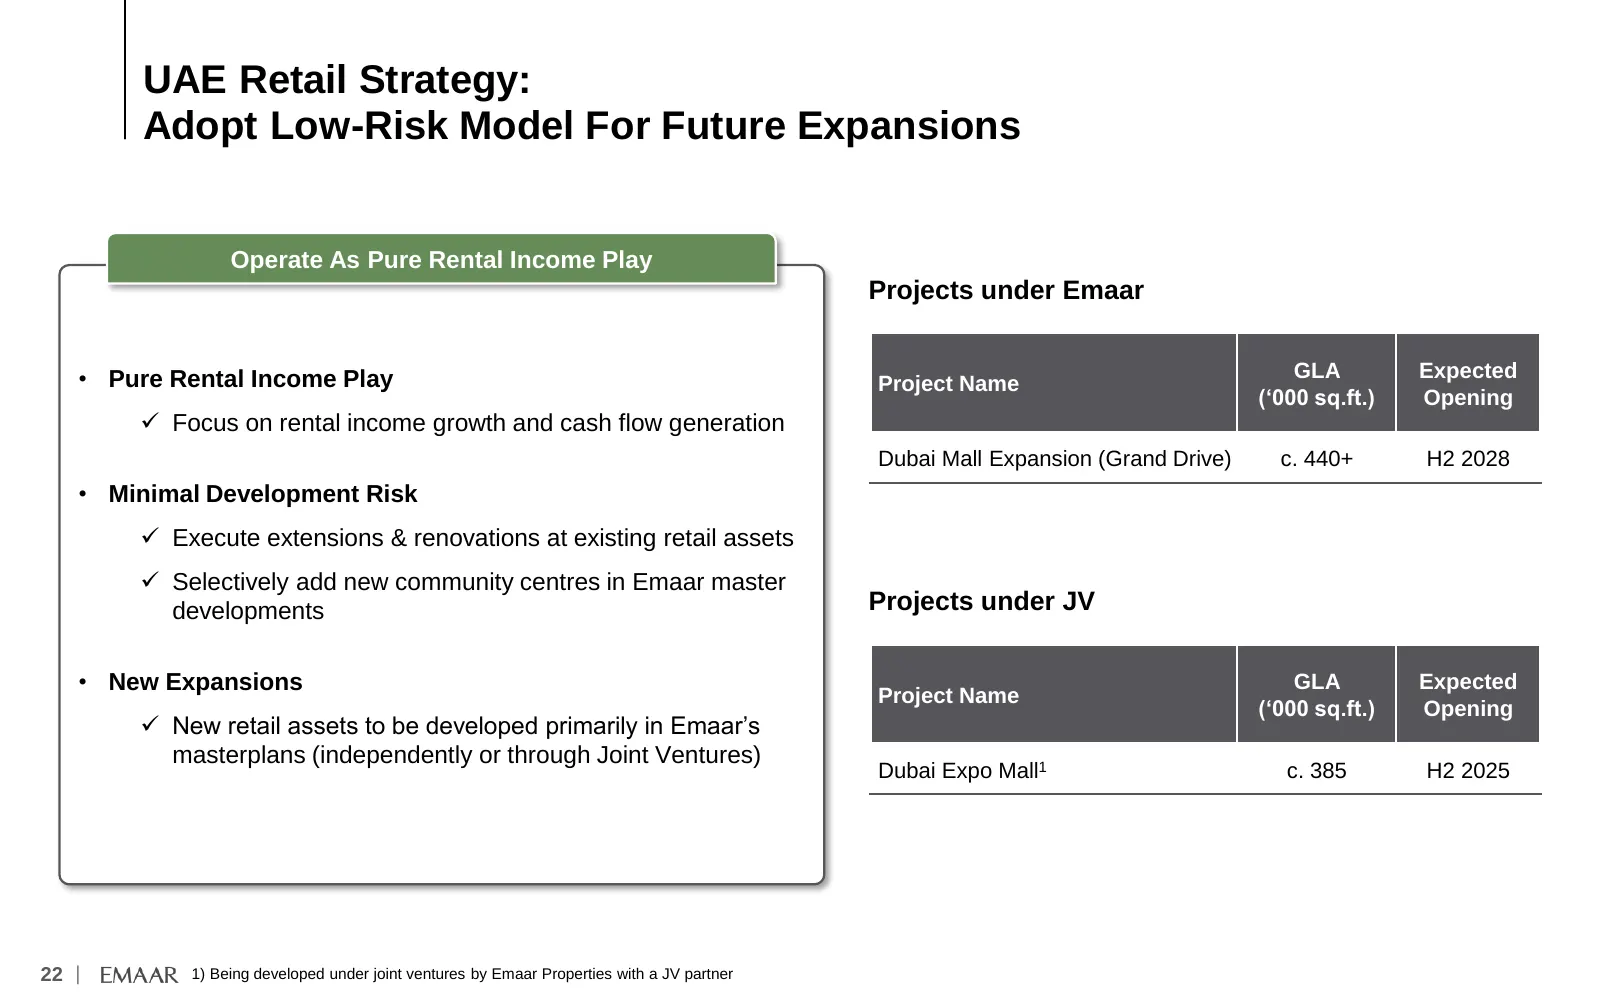
Slide 23: UAE Retail Strategy: Adopt Low-Risk Model For Future Expansions
UAE Retail Strategy: Adopt Low-Risk Model For Future Expansions Operate As Pure Rental Income Play Projects under Emaar • Pure Rental Income Play GLA Expected Project Name (‘000 sq.ft.) Opening ✓ Focus on rental income growth and cash flow generation Dubai Mall Expansion (Grand Drive) c. 440+ H2 202
Slide 24: Sustainability
Sustainability Environment, Social & Governance 23 |
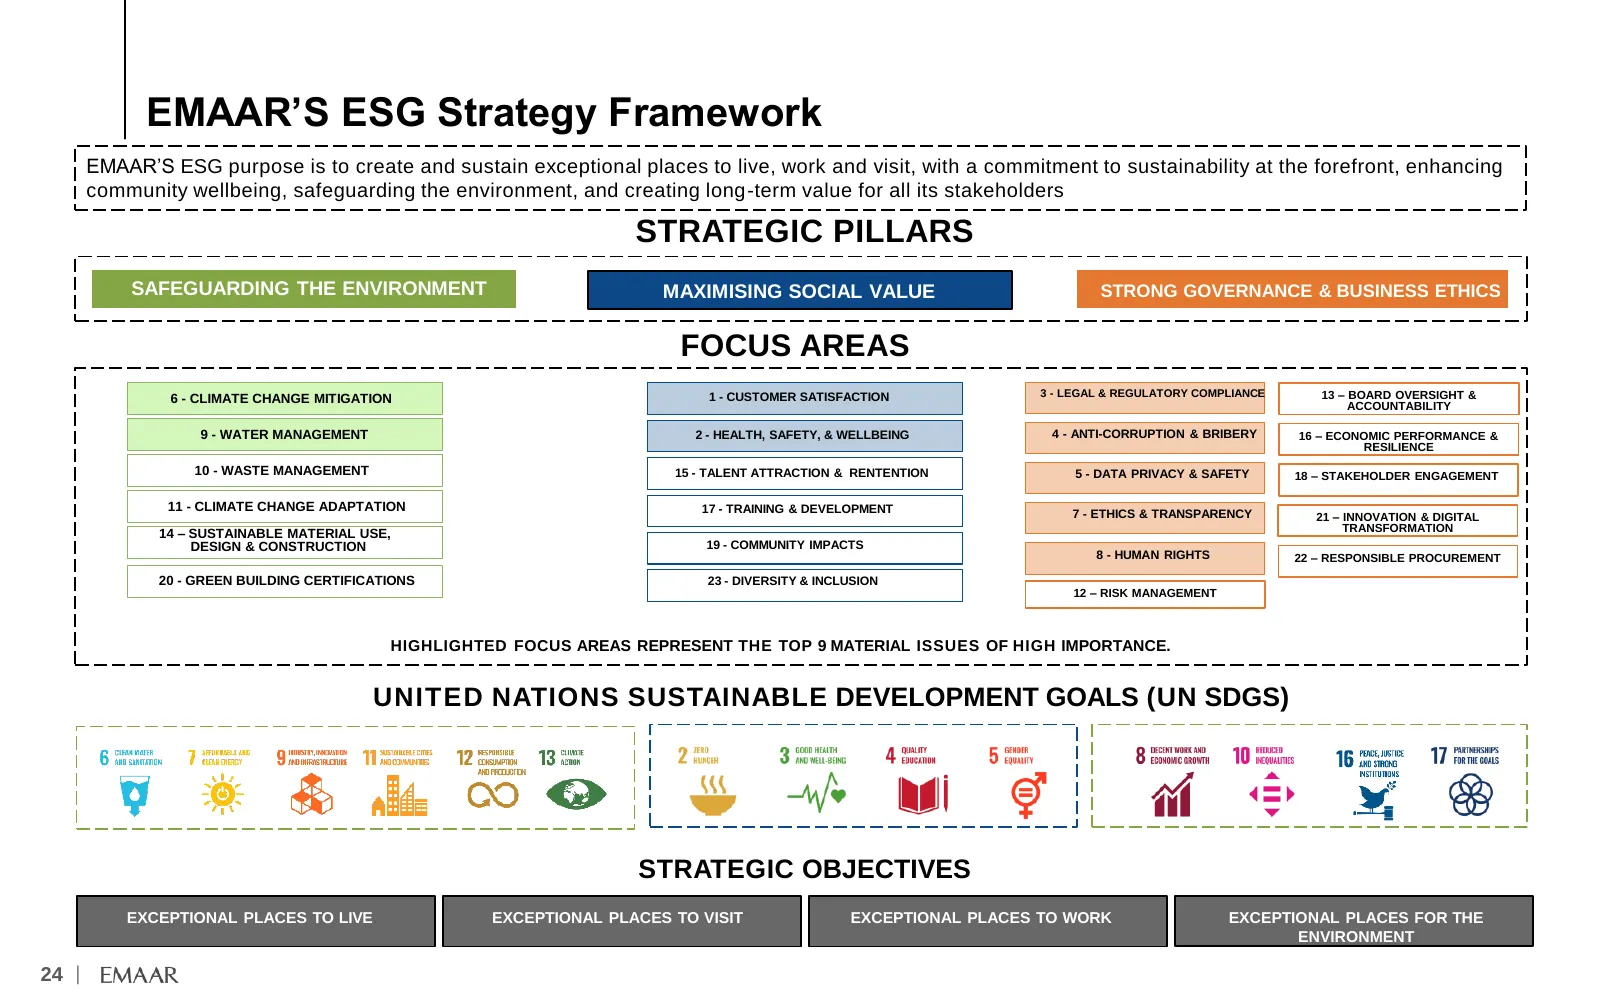
Slide 25: Emaar's ESG Strategy Framework
EMAAR’S ESG Strategy Framework EMAAR’S ESG purpose is to create and sustain exceptional places to live, work and visit, with a commitment to sustainability at the forefront, enhancing community wellbeing, safeguarding the environment, and creating long-term value for all its stakeholders STRATEGIC P
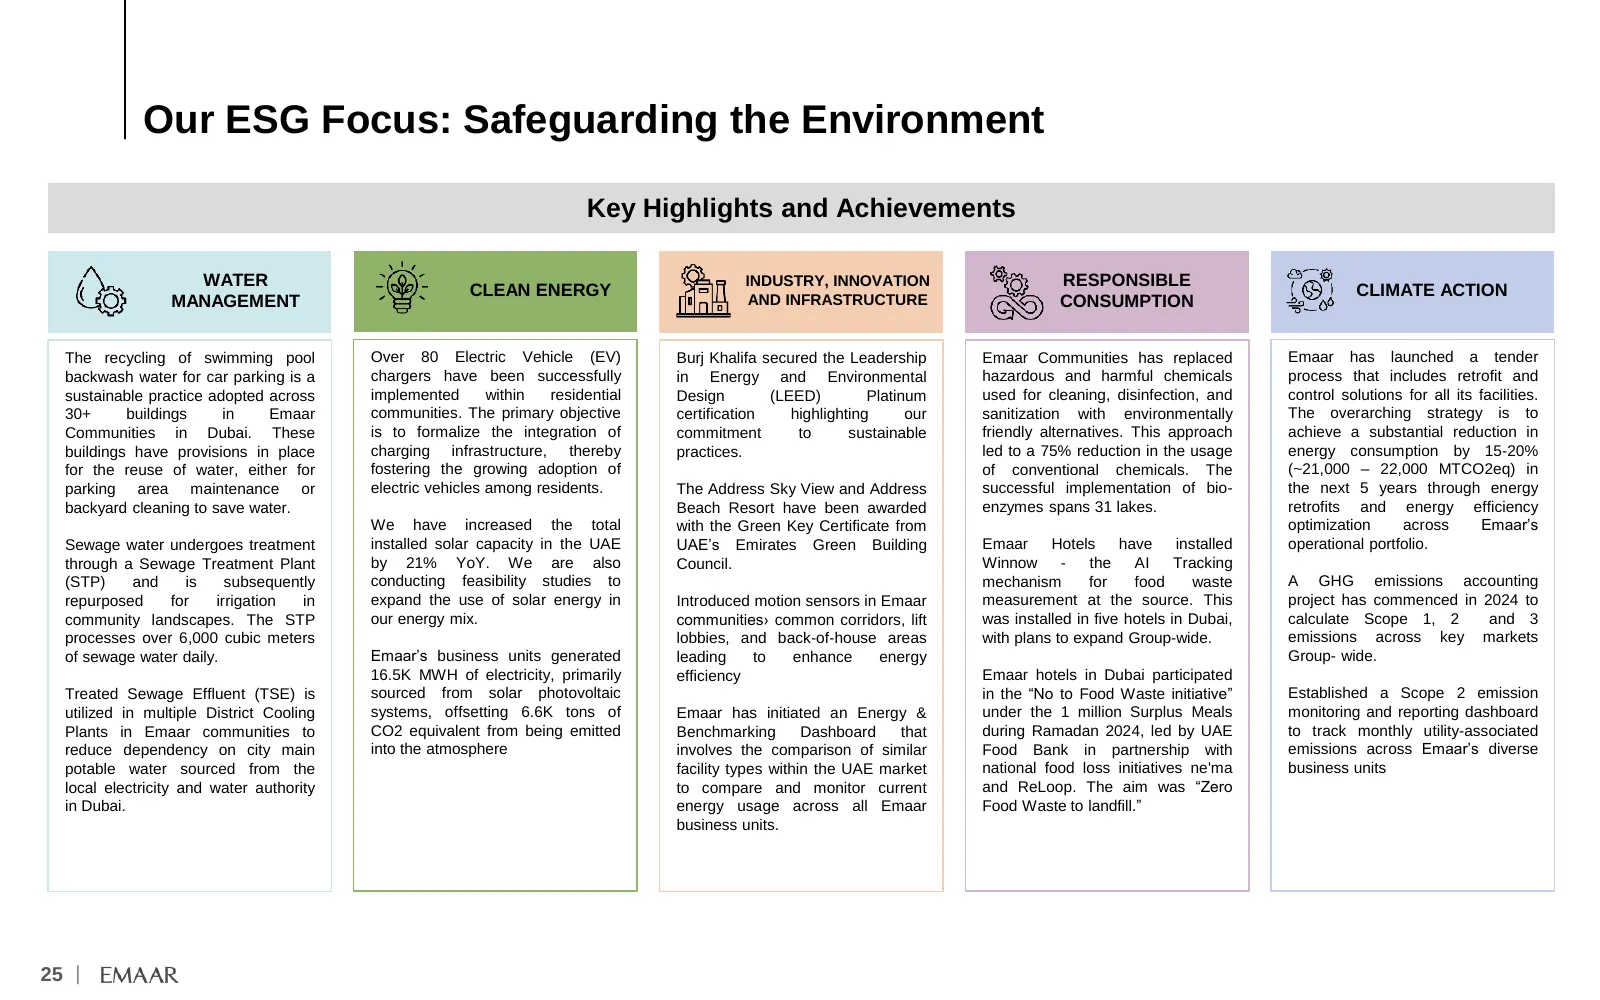
Slide 26: Our ESG Focus: Safeguarding the Environment
Our ESG Focus: Safeguarding the Environment Key Highlights and Achievements WATER INDUSTRY, INNOVATION RESPONSIBLE CLEAN ENERGY AND INFRASTRUCTURE CLIMATE ACTION MANAGEMENT CONSUMPTION The recycling of swimming pool Over 80 Electric Vehicle (EV) Burj Khalifa secured the Leadership Emaar Communities
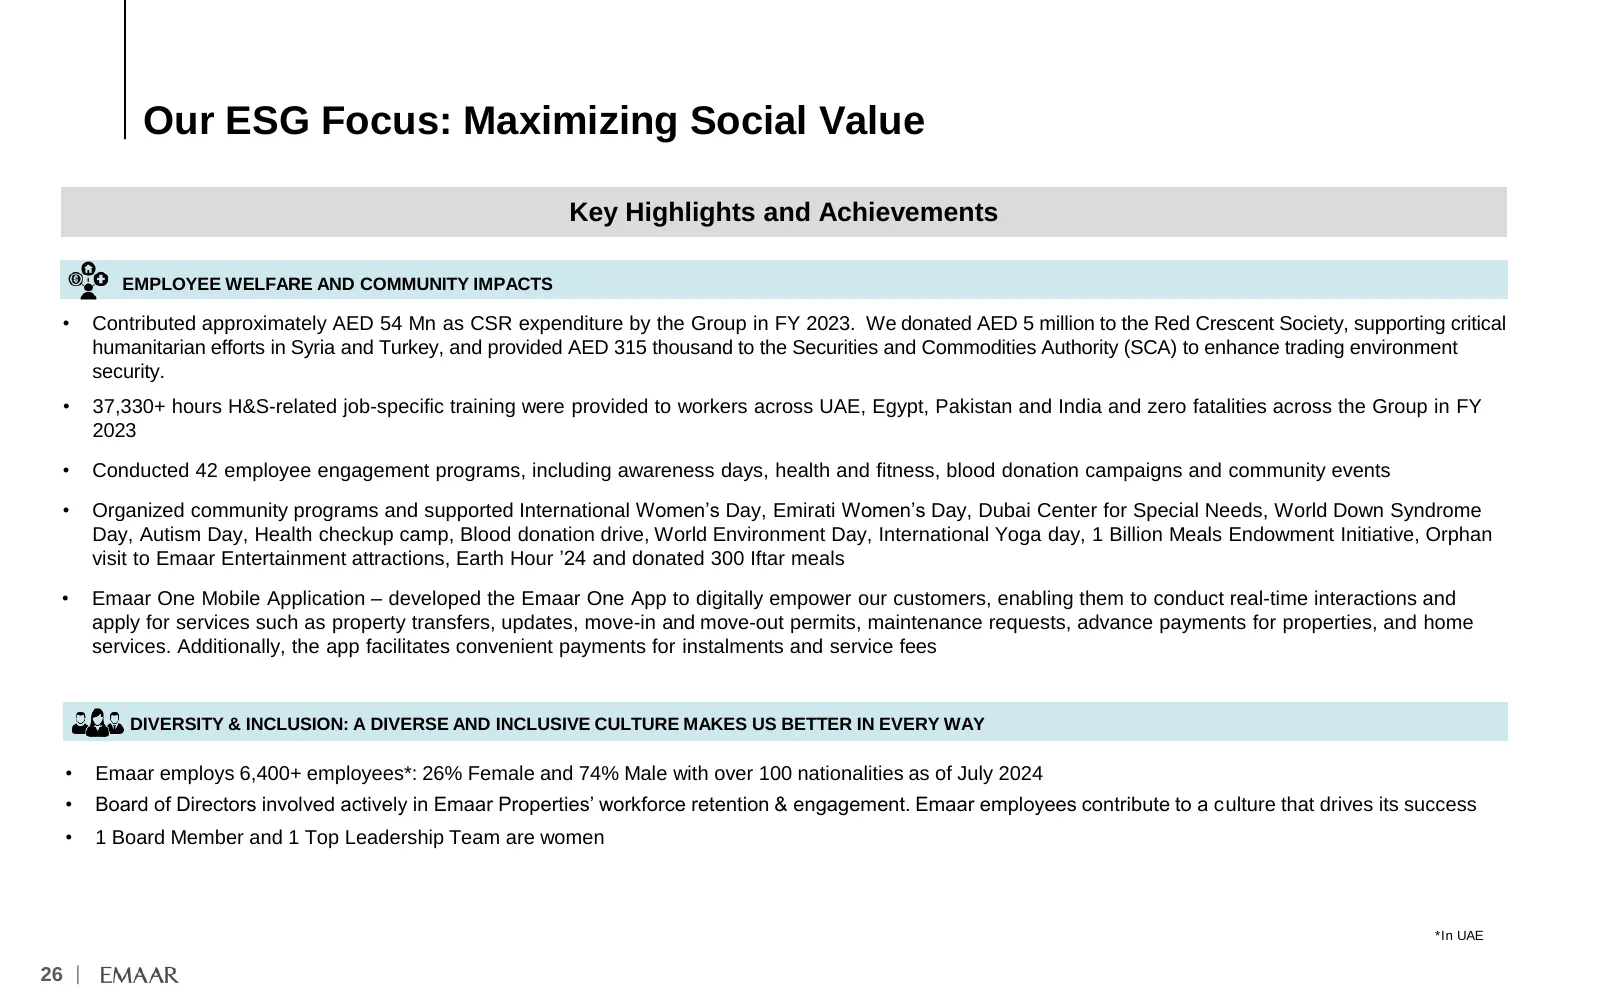
Slide 27: Our ESG Focus: Maximizing Social Value
Our ESG Focus: Maximizing Social Value Key Highlights and Achievements EMPLOYEE WELFARE AND COMMUNITY IMPACTS • Contributed approximately AED 54 Mn as CSR expenditure by the Group in FY 2023. We donated AED 5 million to the Red Crescent Society, supporting critical humanitarian efforts in Syria and
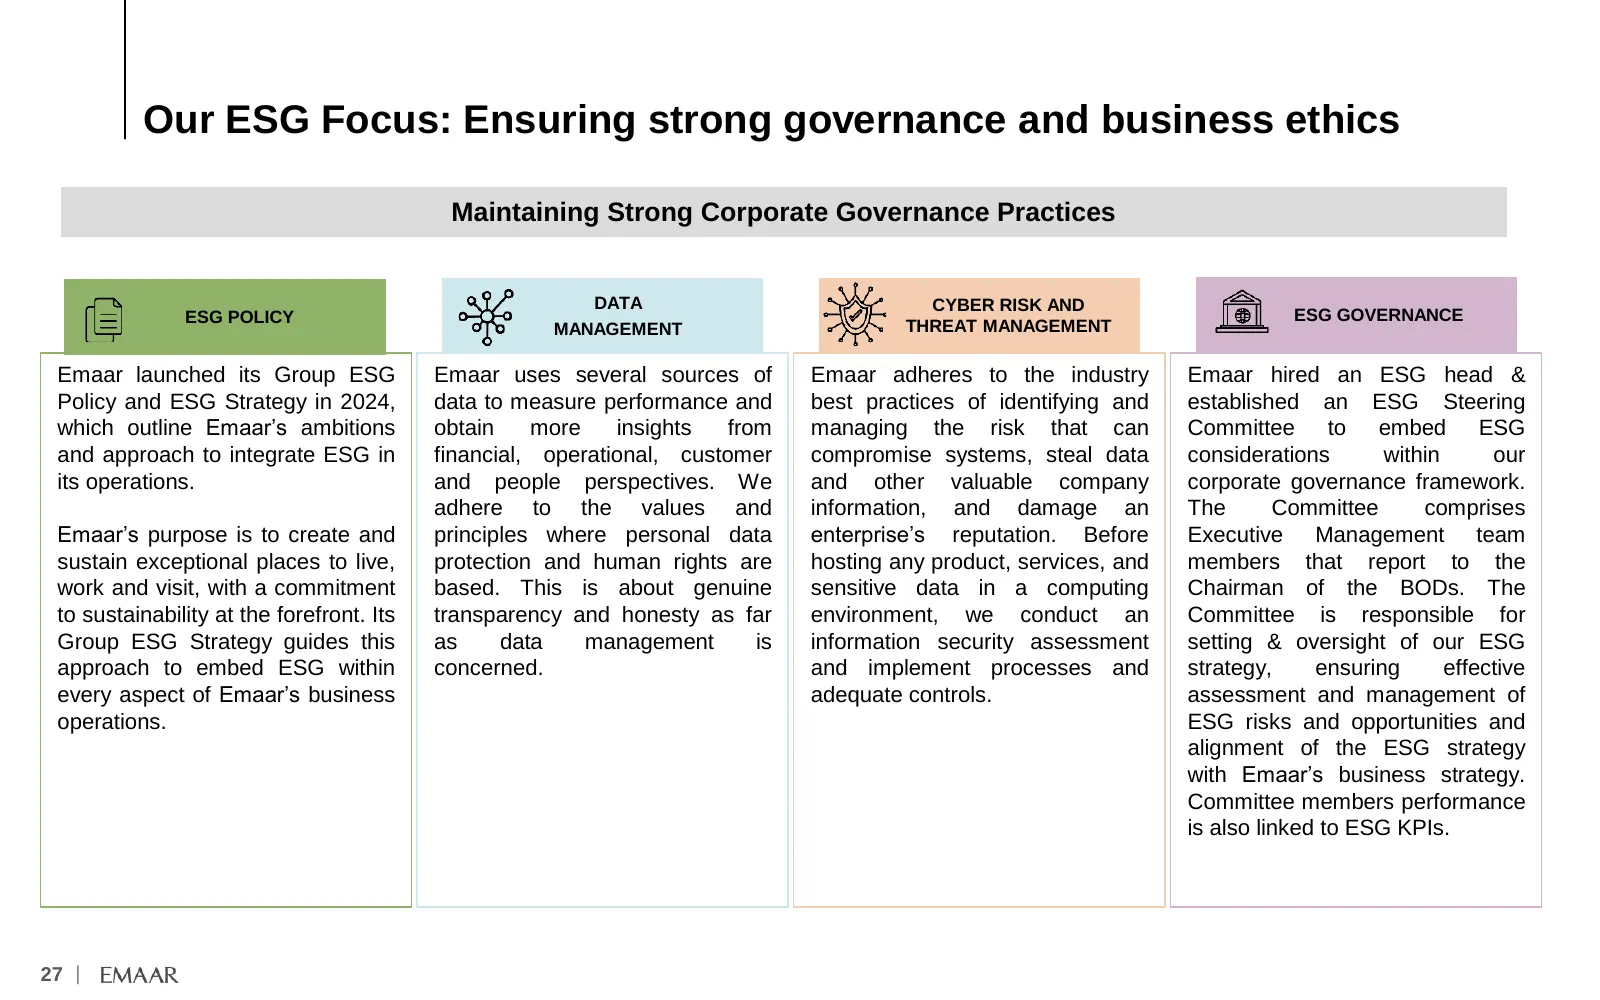
Slide 28: Our ESG Focus: Ensuring strong governance and business ethics
Our ESG Focus: Ensuring strong governance and business ethics Maintaining Strong Corporate Governance Practices DATA CYBER RISK AND ESG POLICY ESG GOVERNANCE MANAGEMENT THREAT MANAGEMENT Emaar launched its Group ESG Emaar uses several sources of Emaar adheres to the industry Emaar hired an ESG head
Slide 29: Our ESG Focus: Ensuring strong governance and business ethics
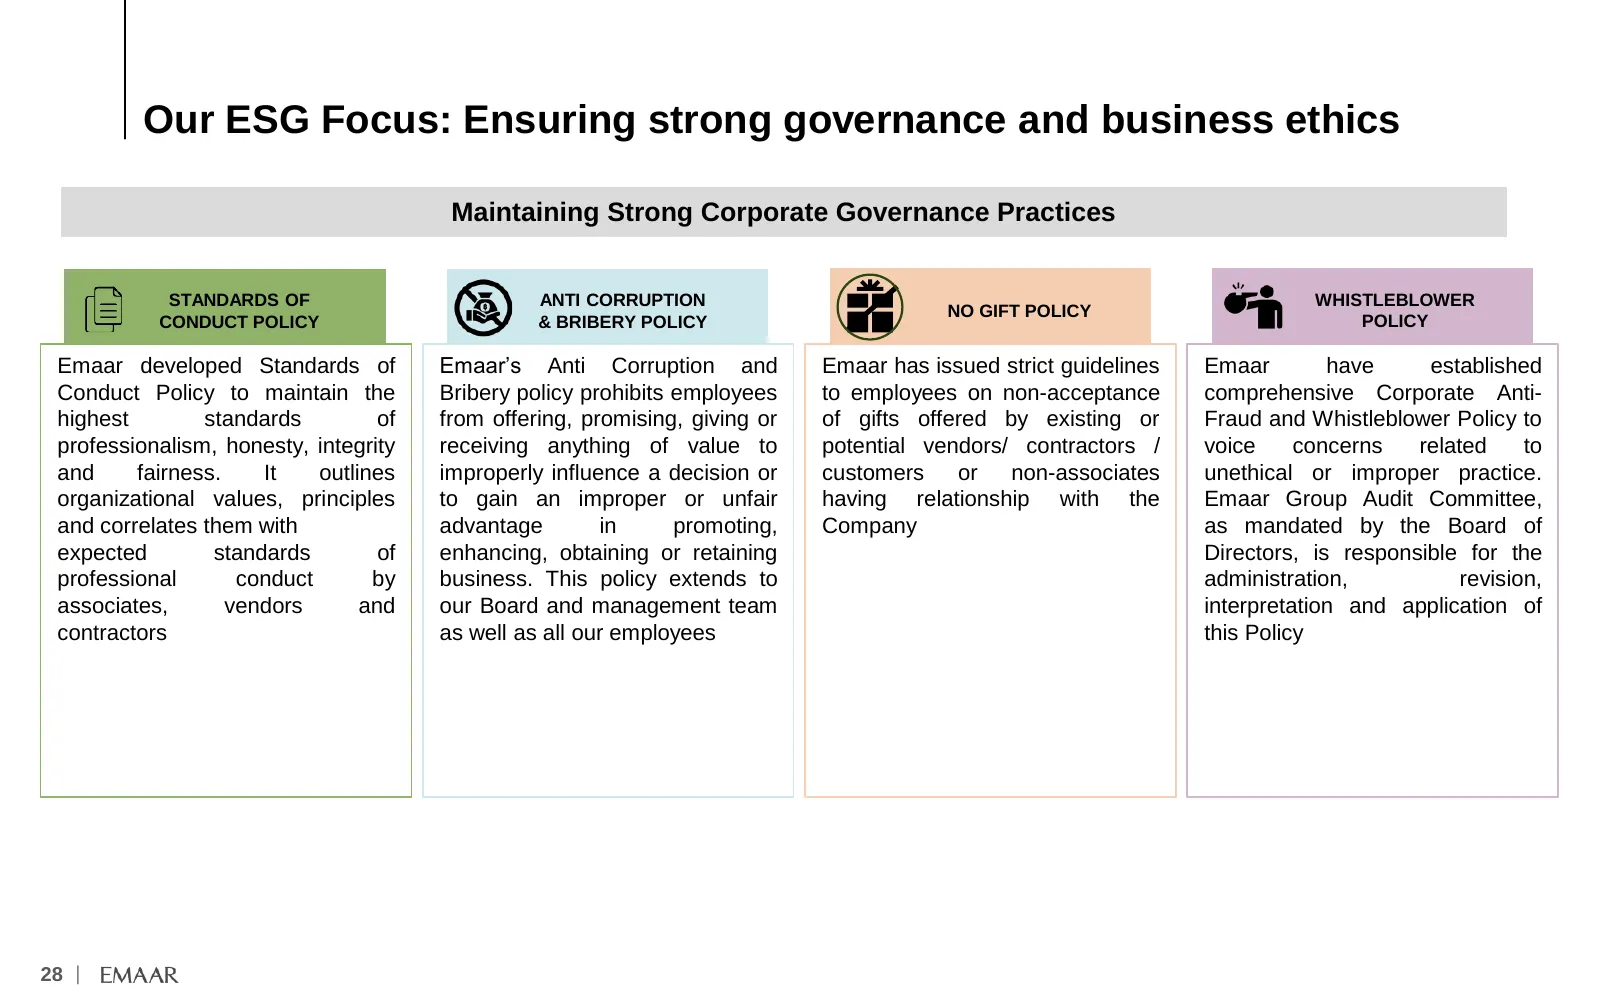
Our ESG Focus: Ensuring strong governance and business ethics Maintaining Strong Corporate Governance Practices STANDARDS OF ANTI CORRUPTION WHISTLEBLOWER NO GIFT POLICY CONDUCT POLICY & BRIBERY POLICY POLICY Emaar developed Standards of Emaar’s Anti Corruption and Emaar has issued strict guidelines
Slide 30: H1 2024 Results Update
H1 2024 Results Update —___—
Slide 31: H1 2024 Key Highlights
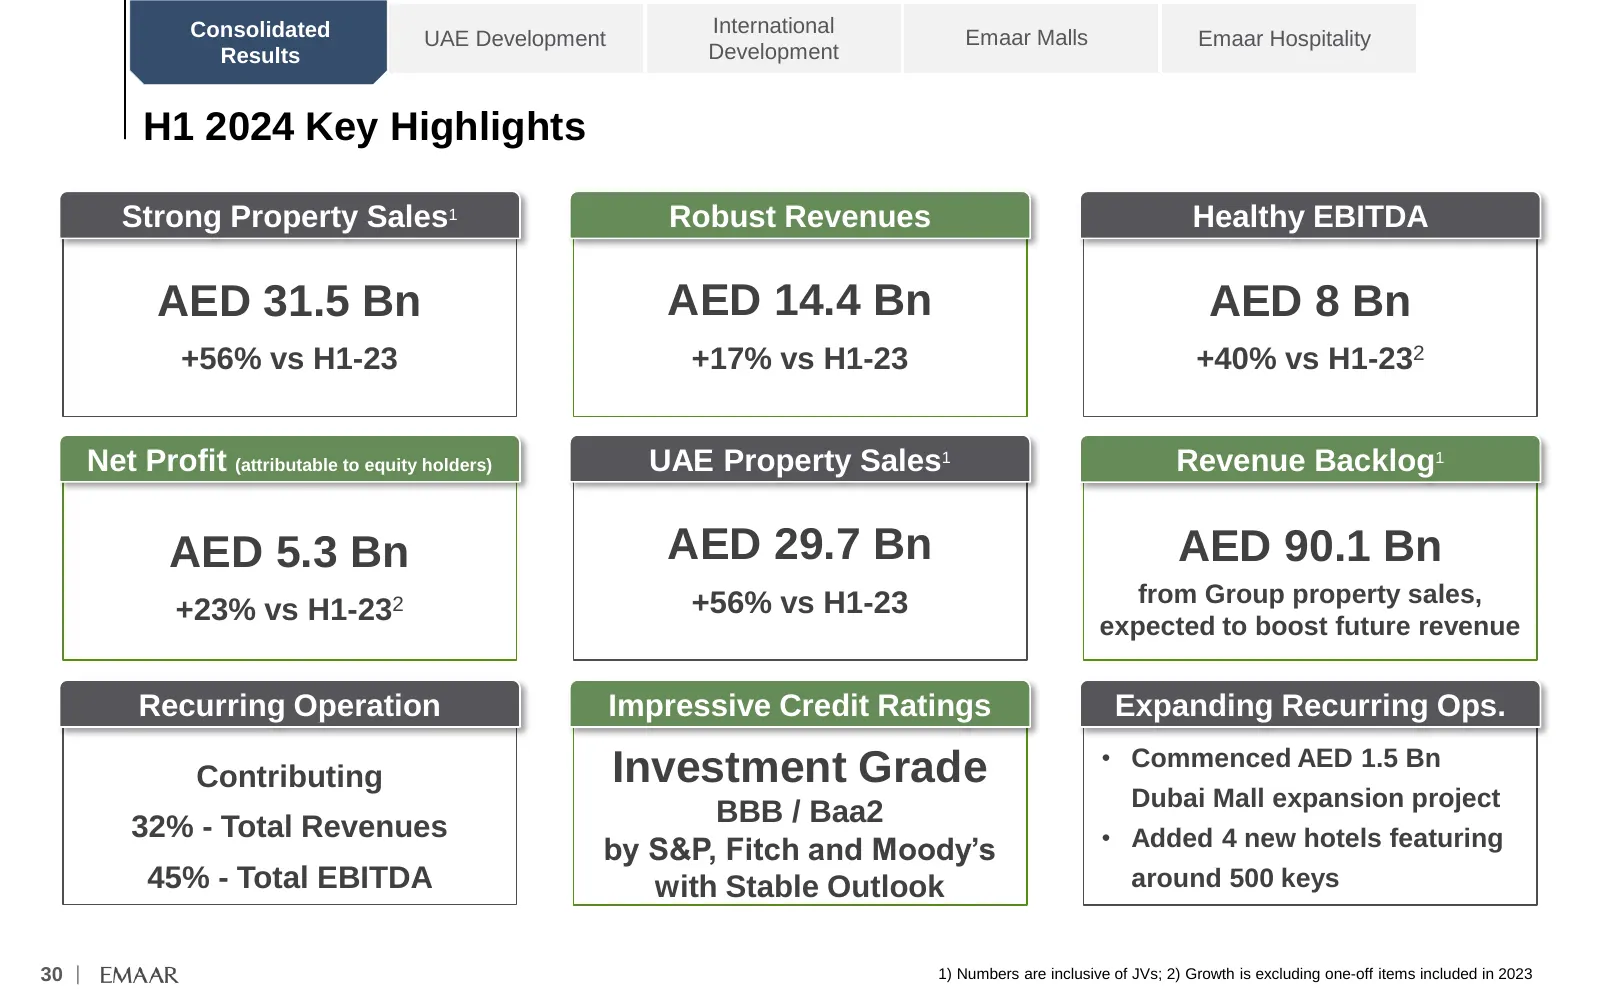
Consolidated International UAE Development Emaar Malls Emaar Hospitality Results Development H1 2024 Key Highlights Strong Property Sales1 Robust Revenues Healthy EBITDA AED 31.5 Bn AED 14.4 Bn AED 8 Bn +56% vs H1-23 +17% vs H1-23 +40% vs H1-232 Net Profit (attributable to equity holders) UAE Proper
Slide 32: Key Highlights
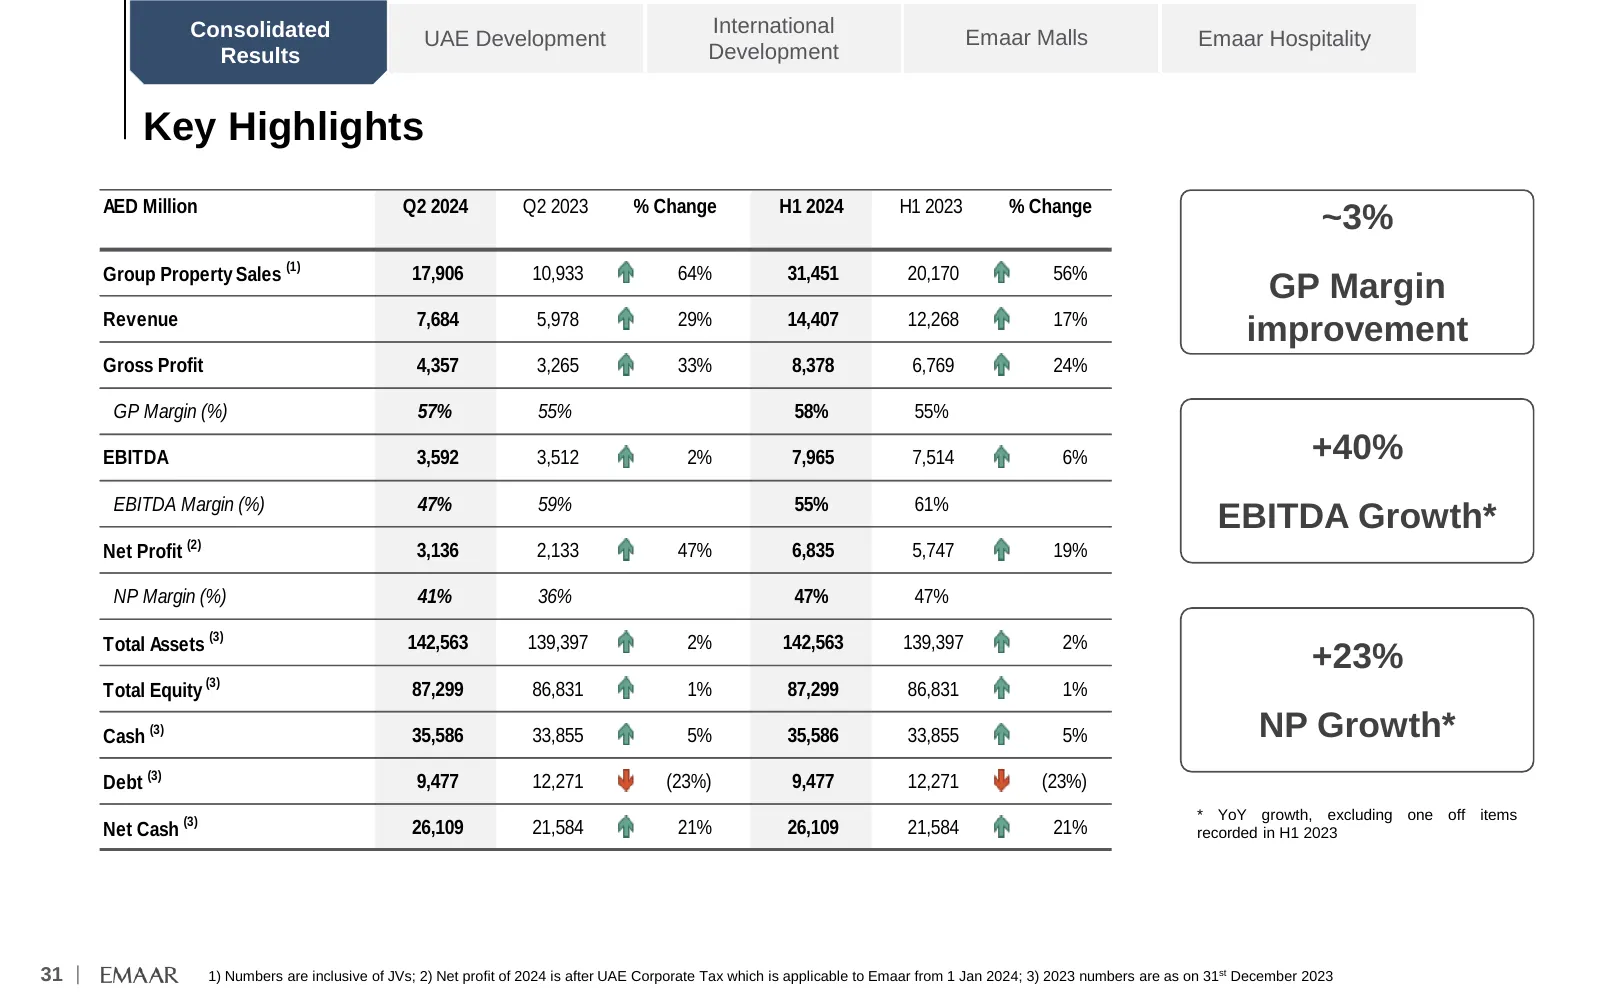
Consolidated International UAE Development Emaar Malls Emaar Hospitality Results Development Key Highlights AED Million Q2 2024 Q2 2023 % Change H1 2024 H1 2023 % Change ~3% Group Property Sales (1) 17,906 10,933 64% 31,451 20,170 56% GP Margin Revenue 7,684 5,978 29% 14,407 12,268 17% improvement G
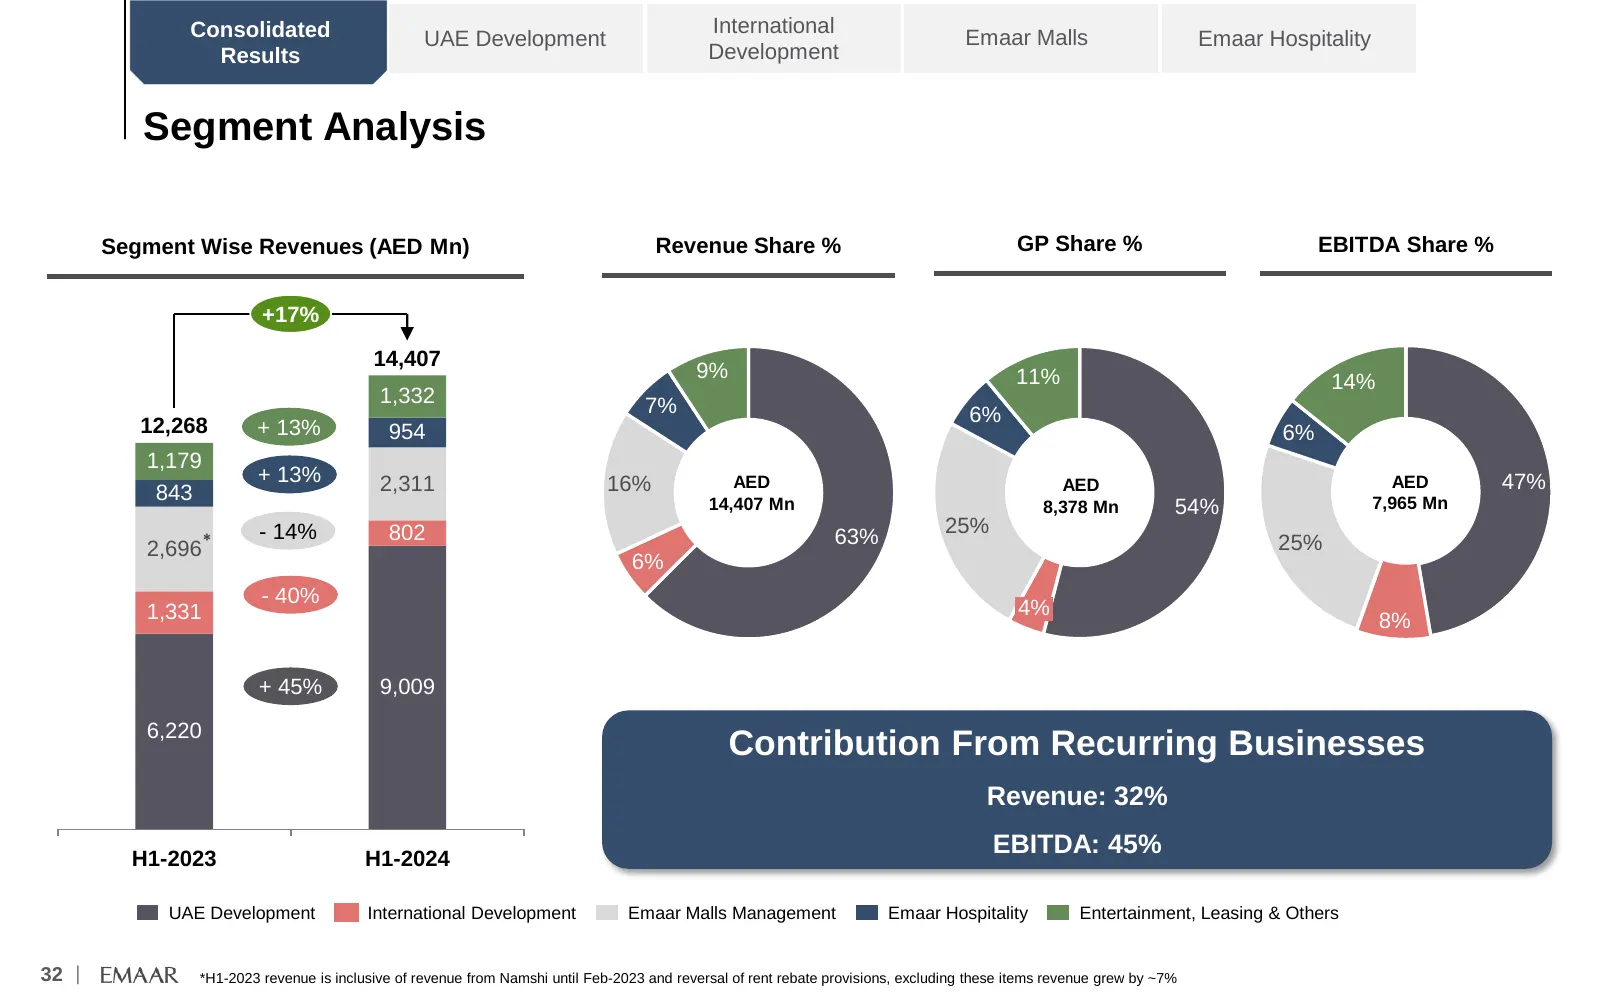
Slide 33: Segment Analysis
Consolidated International UAE Development Emaar Malls Emaar Hospitality Results Development Segment Analysis Segment Wise Revenues (AED Mn) Revenue Share % GP Share % EBITDA Share % +17% 14,407 9% 11% 14% 1,332 7% 6% 12,268 + 13% 954 6% 1,179 + 13% 2,311 16% AED AED AED 47% 843 14,407 Mn 7,965 Mn 8
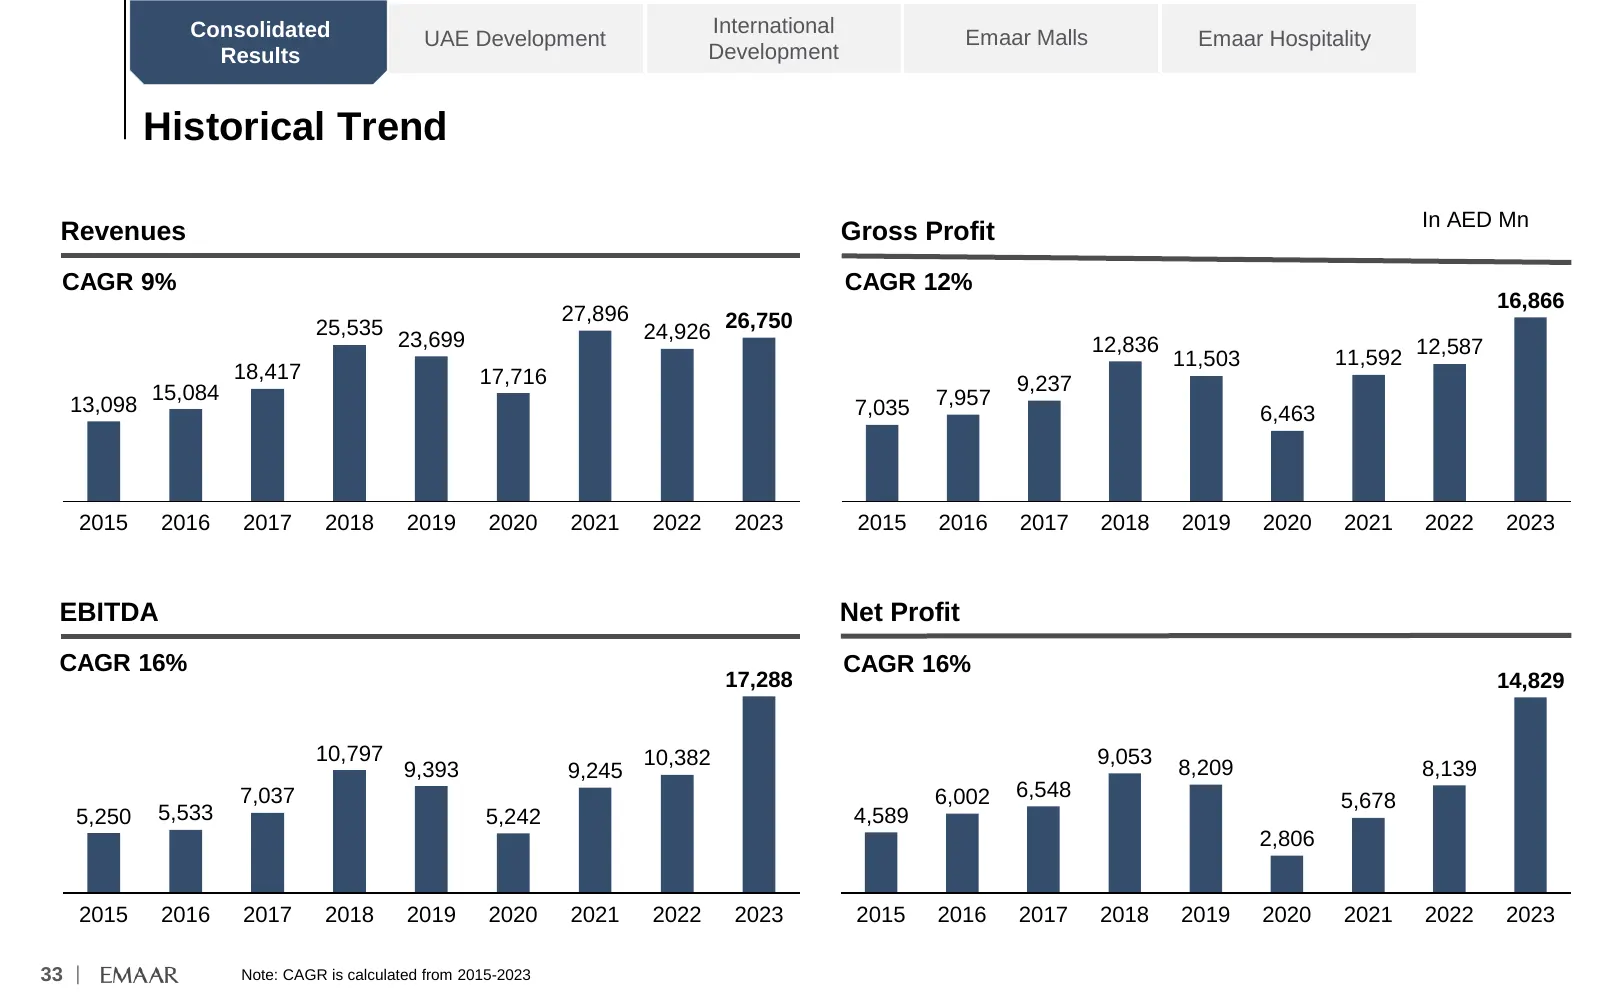
Slide 34: Historical Trend
Consolidated International UAE Development Emaar Malls Emaar Hospitality Results Development Historical Trend In AED Mn Revenues Gross Profit CAGR 9% CAGR 12% 16,866 27,896 26,750 25,535 24,926 23,699 12,836 11,503 11,592 12,587 18,417 17,716 15,084 9,237 13,098 7,035 7,957 6,463 2015 2016 2017 2018
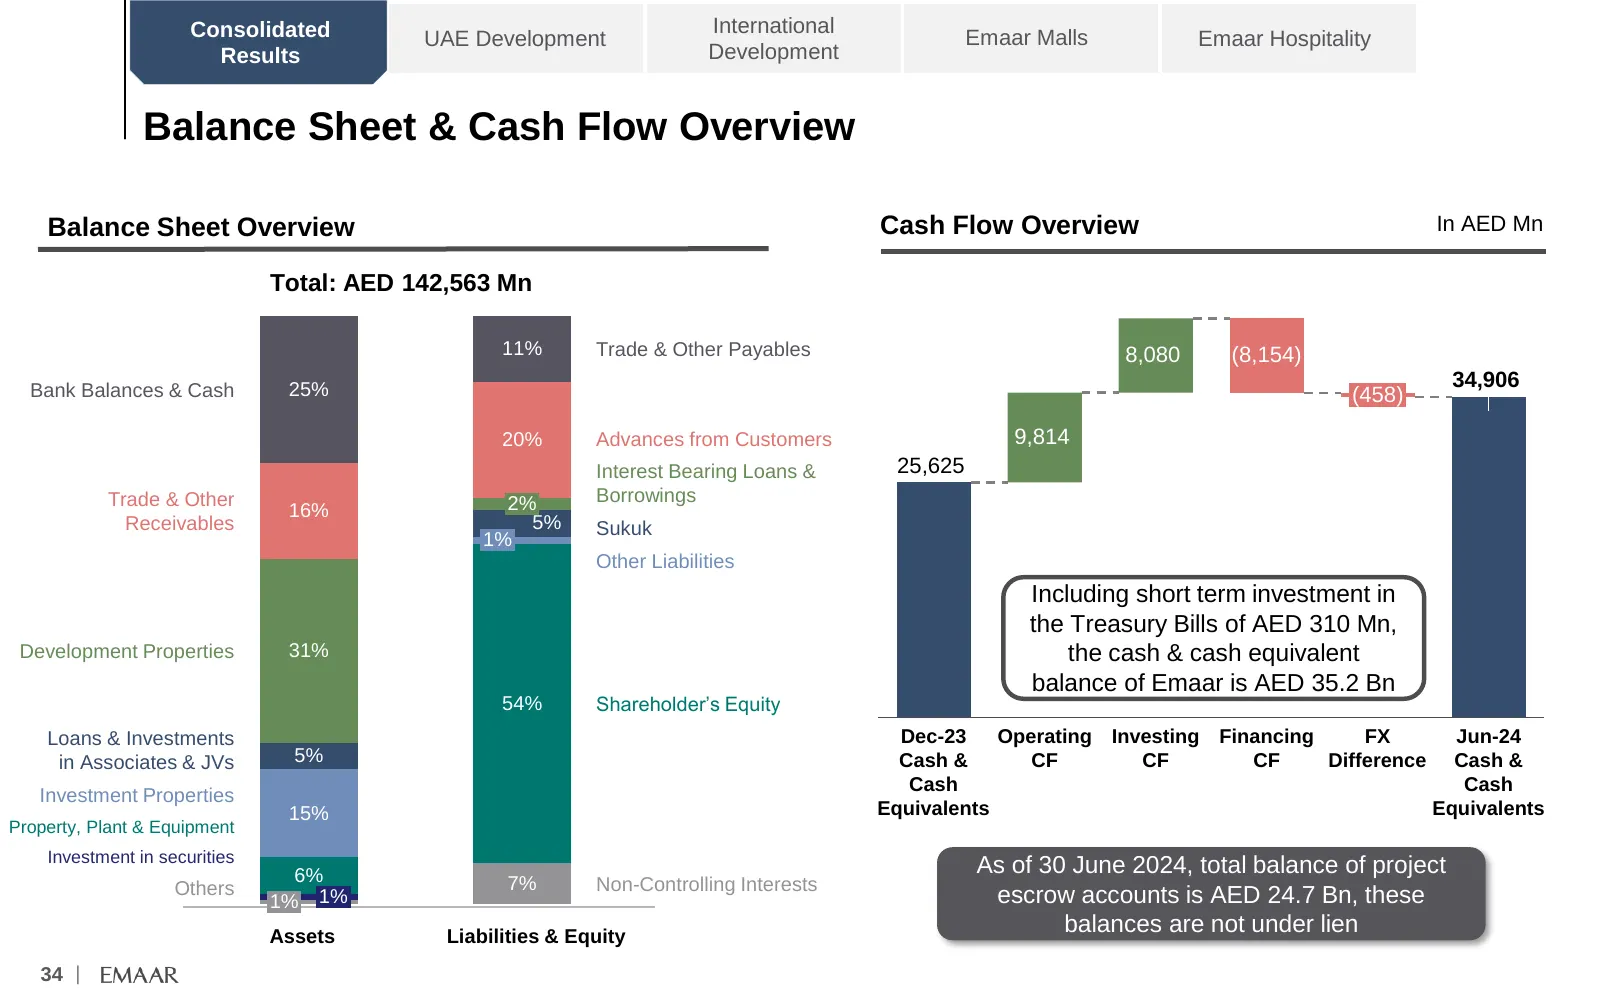
Slide 35: Balance Sheet & Cash Flow Overview
Consolidated International UAE Development Emaar Malls Emaar Hospitality Results Development Balance Sheet & Cash Flow Overview Balance Sheet Overview Cash Flow Overview In AED Mn Total: AED 142,563 Mn 11% Trade & Other Payables 8,080 (8,154) Bank Balances & Cash 25% 34,906 (458) 20% Advances from C
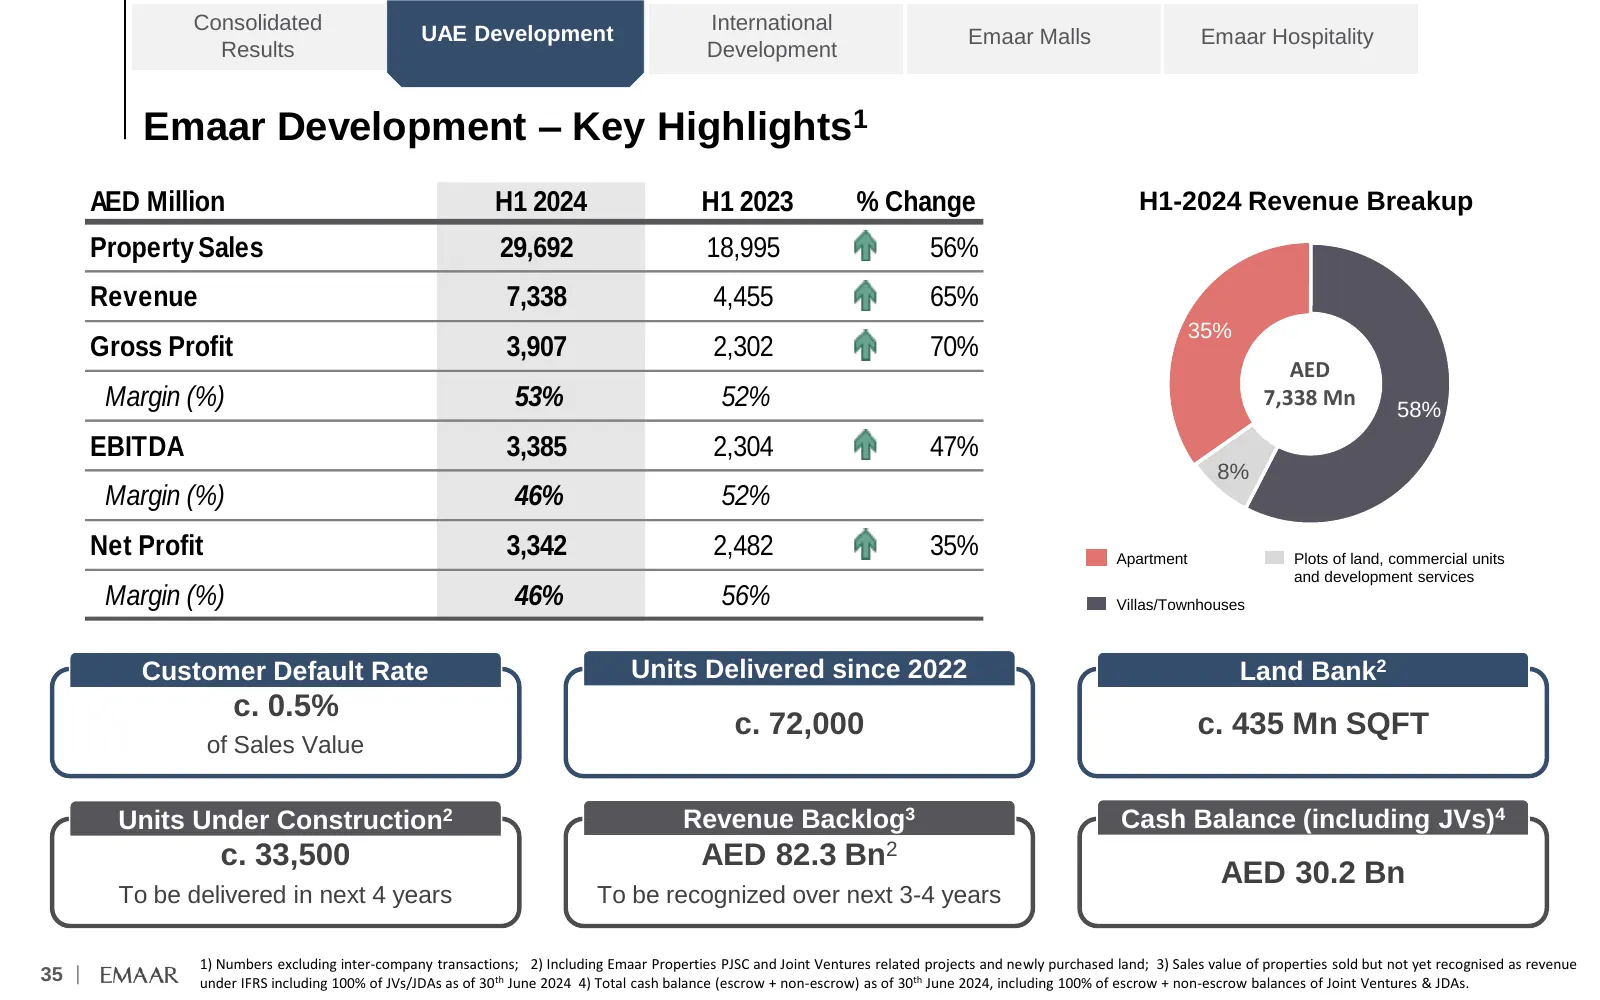
Slide 36: Emaar Development – Key Highlights
Consolidated UAE Development International Emaar Malls Emaar Hospitality Results Development Emaar Development – Key Highlights1 AED Million H1 2024 H1 2023 % Change H1-2024 Revenue Breakup Property Sales 29,692 18,995 56% Revenue 7,338 4,455 65% 35% Gross Profit 3,907 2,302 70% AED Margin (%) 53% 5
Slide 37: UAE Development – Current Project Status
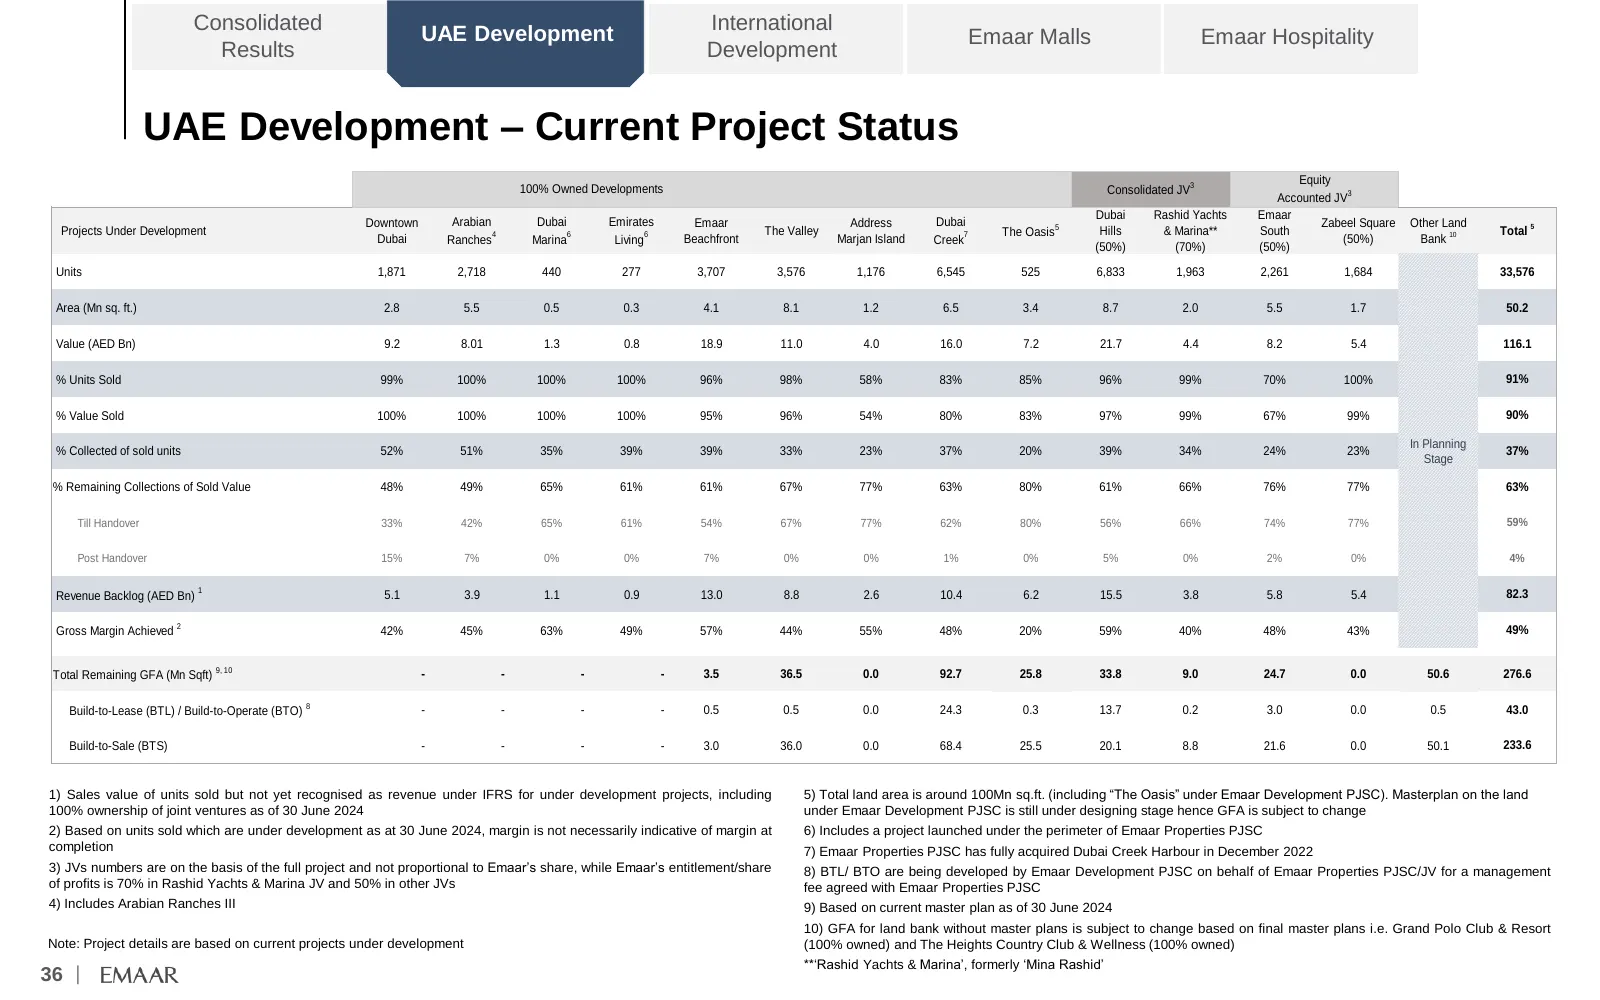
Consolidated UAE Development International Emaar Malls Emaar Hospitality Results Development UAE Development – Current Project Status Equity 100% Owned Developments Consolidated JV3 Accounted JV3 Dubai Rashid Yachts Emaar Downtown Arabian Dubai Emirates Emaar Address Dubai Zabeel Square Other Land P
Slide 38: Emaar Development – Historical Trend
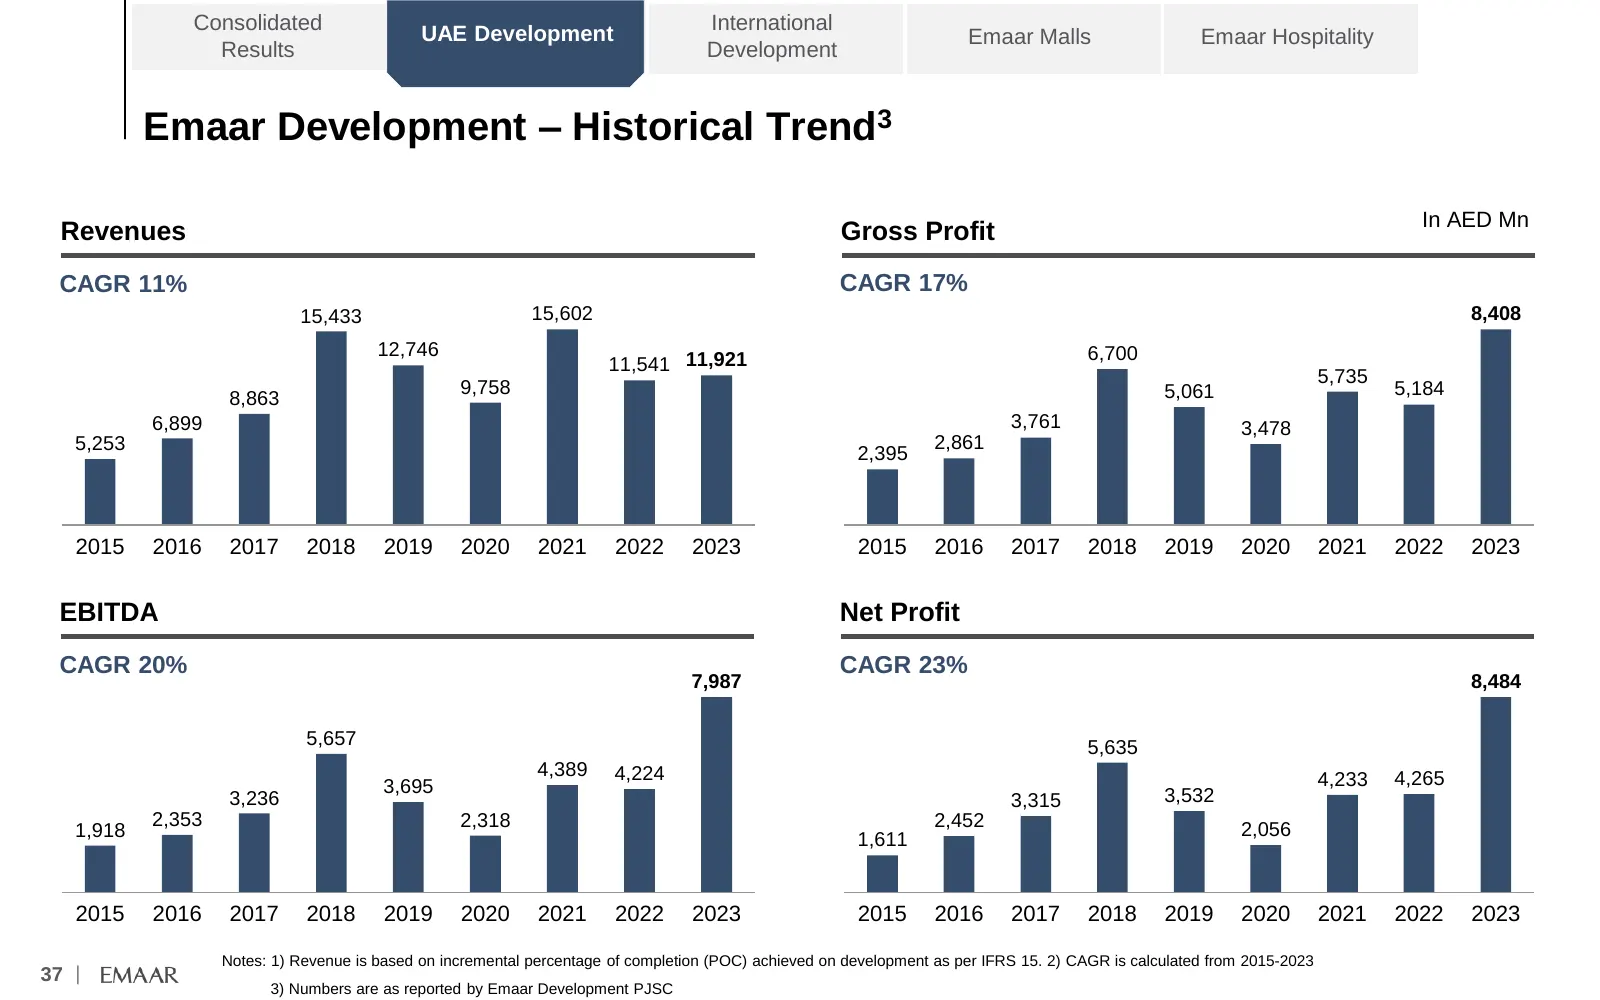
Consolidated UAE Development International Emaar Malls Emaar Hospitality Results Development Emaar Development – Historical Trend3 In AED Mn Revenues Gross Profit CAGR 11% CAGR 17% 15,433 15,602 8,408 12,746 6,700 11,541 11,921 5,735 9,758 5,061 5,184 8,863 6,899 3,761 3,478 5,253 2,861 2,395 2015 2
Slide 39: International Development – Key Highlights
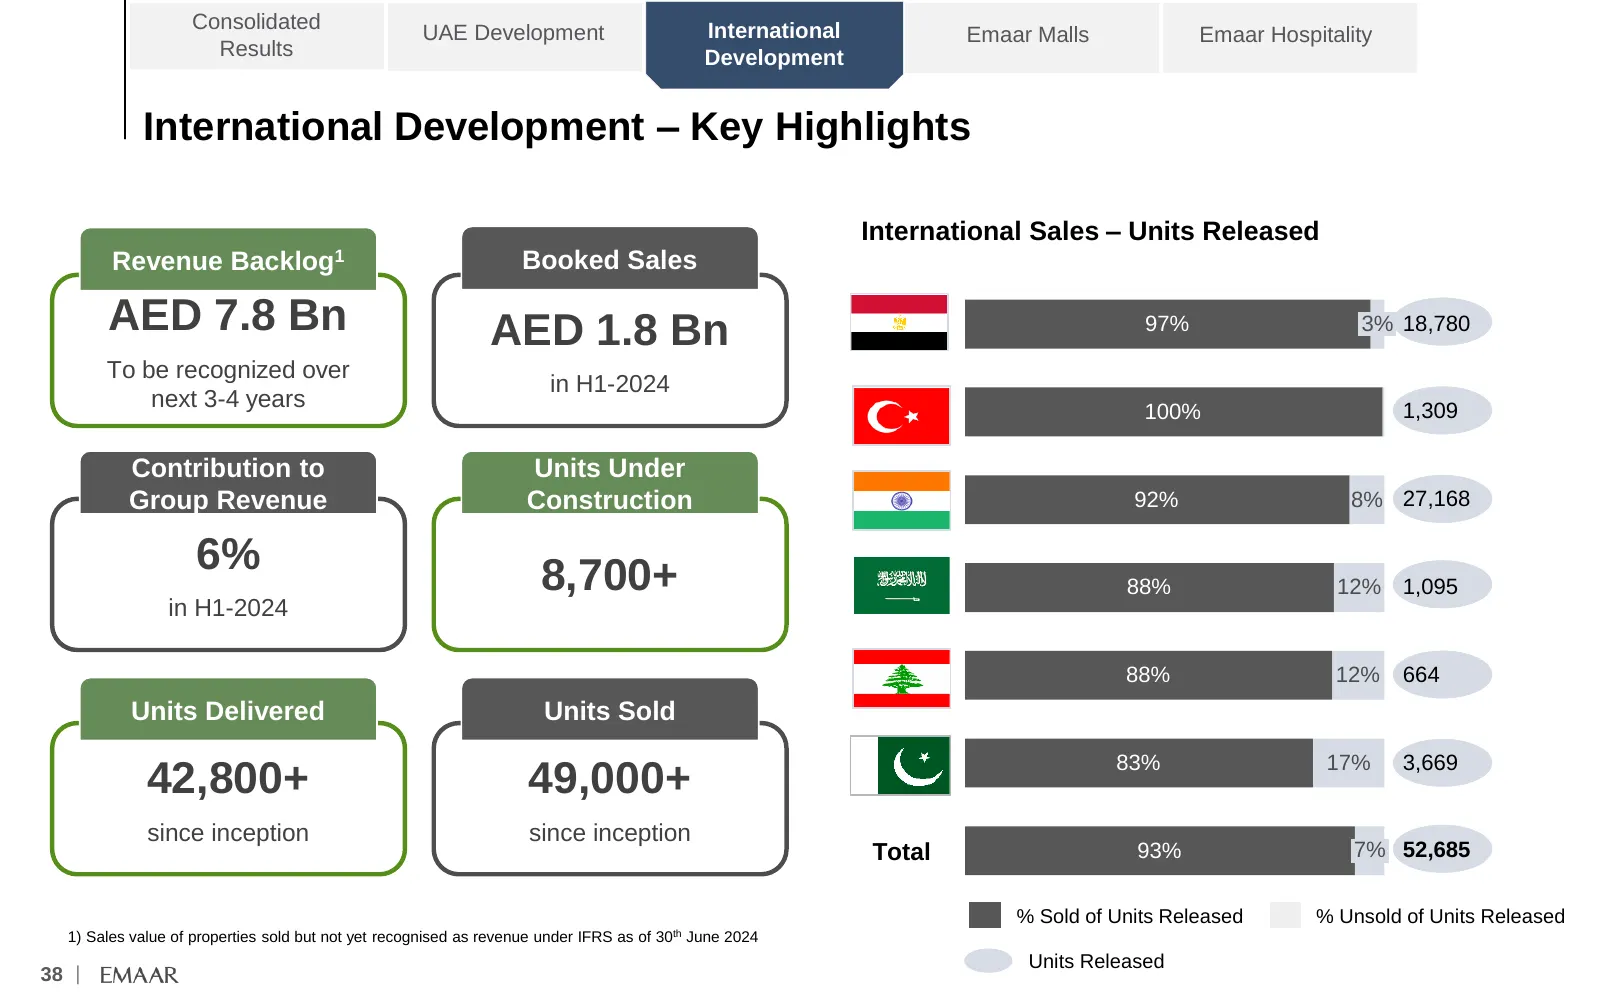
Consolidated UAE Development International Emaar Malls Emaar Hospitality Results Development International Development – Key Highlights International Sales – Units Released Revenue Backlog1 Booked Sales AED 7.8 Bn AED 1.8 Bn 97% 3% 18,780 To be recognized over in H1-2024 next 3-4 years 100% 1,309 Co
Slide 40: International Development – Key Highlights
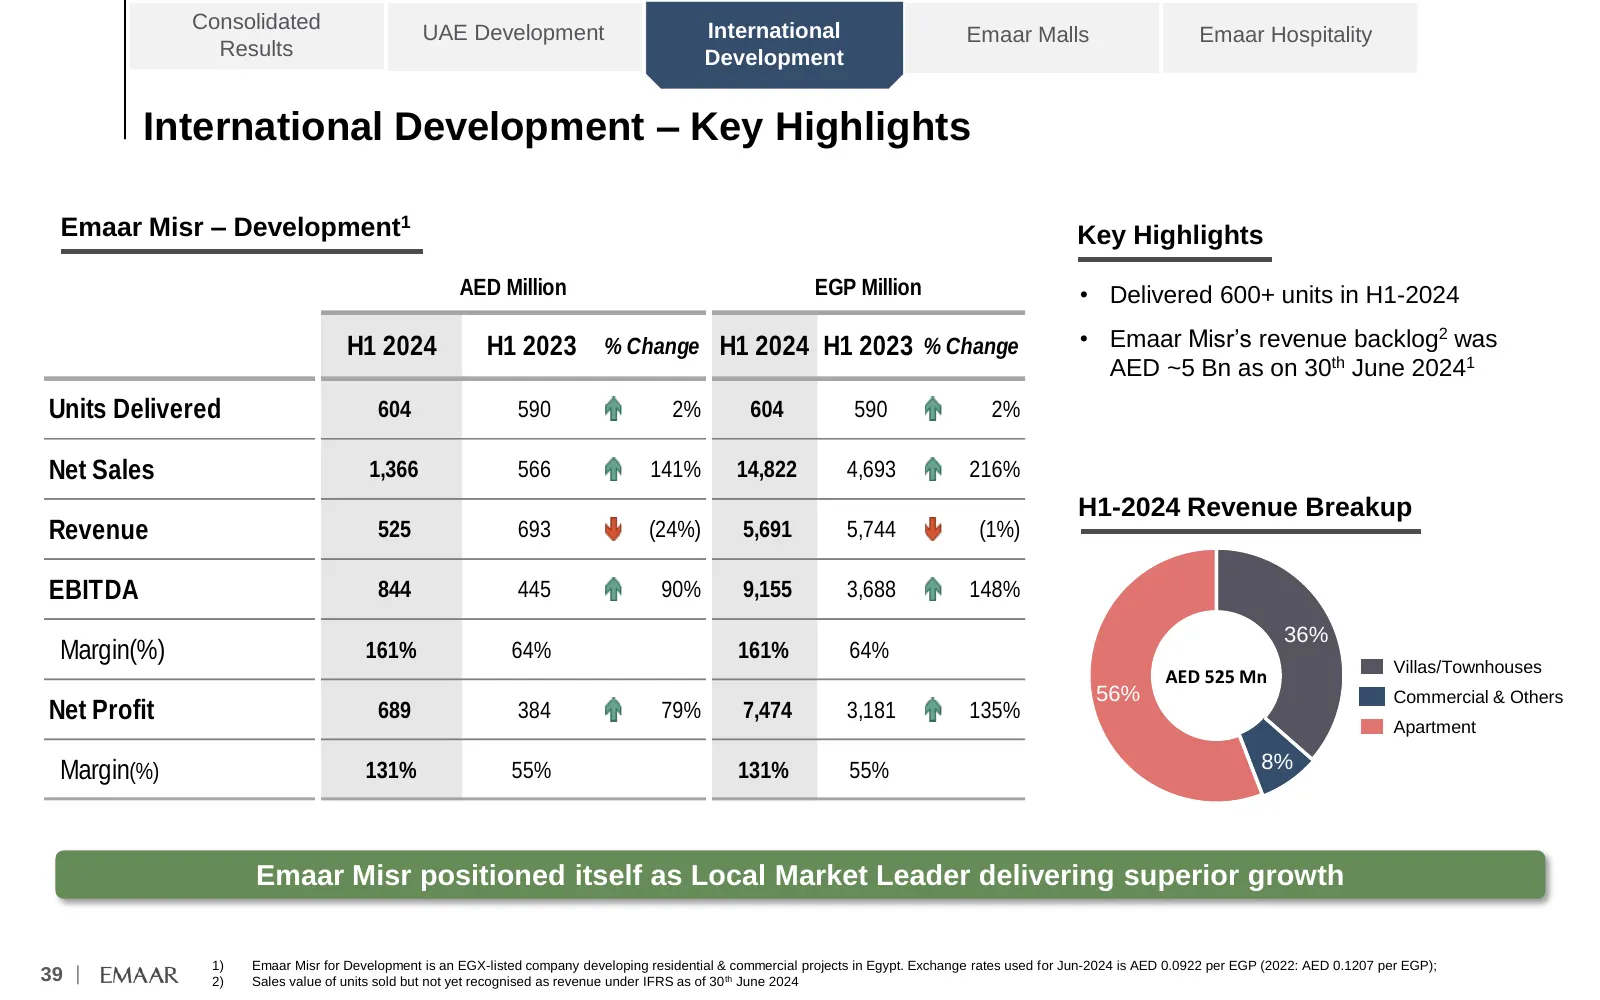
Consolidated UAE Development International Emaar Malls Emaar Hospitality Results Development International Development – Key Highlights Emaar Misr – Development1 Key Highlights AED Million EGP Million • Delivered 600+ units in H1-2024 H1 2024 H1 2023 % Change H1 2024 H1 2023 % Change • Emaar Misr’s
Slide 41: Emaar Mall Management – Key Highlights
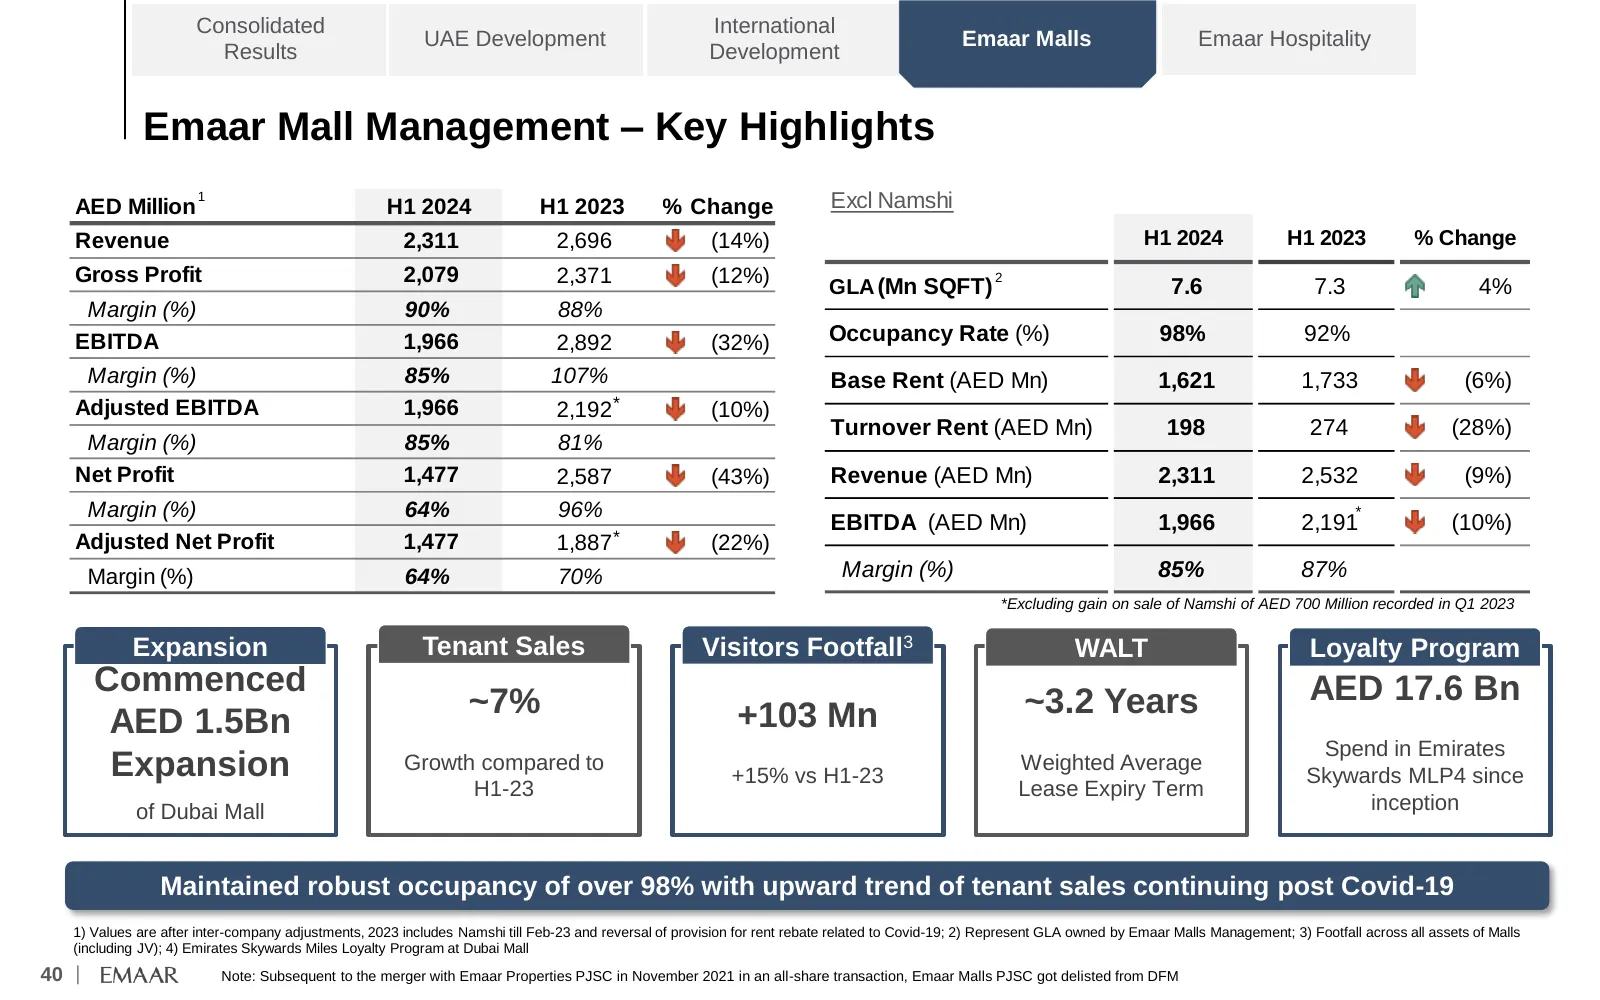
Consolidated International UAE Development Emaar Malls Emaar Hospitality Results Development Emaar Mall Management – Key Highlights AED Million 1 H1 2024 H1 2023 % Change Excl Namshi Revenue 2,311 2,696 (14%) H1 2024 H1 2023 % Change Gross Profit 2,079 2,371 (12%) 2 GLA (Mn SQFT) 7.6 7.3 4% Margin (
Slide 42: Emaar Mall Management (Excl. Namshi) – Historical Trend
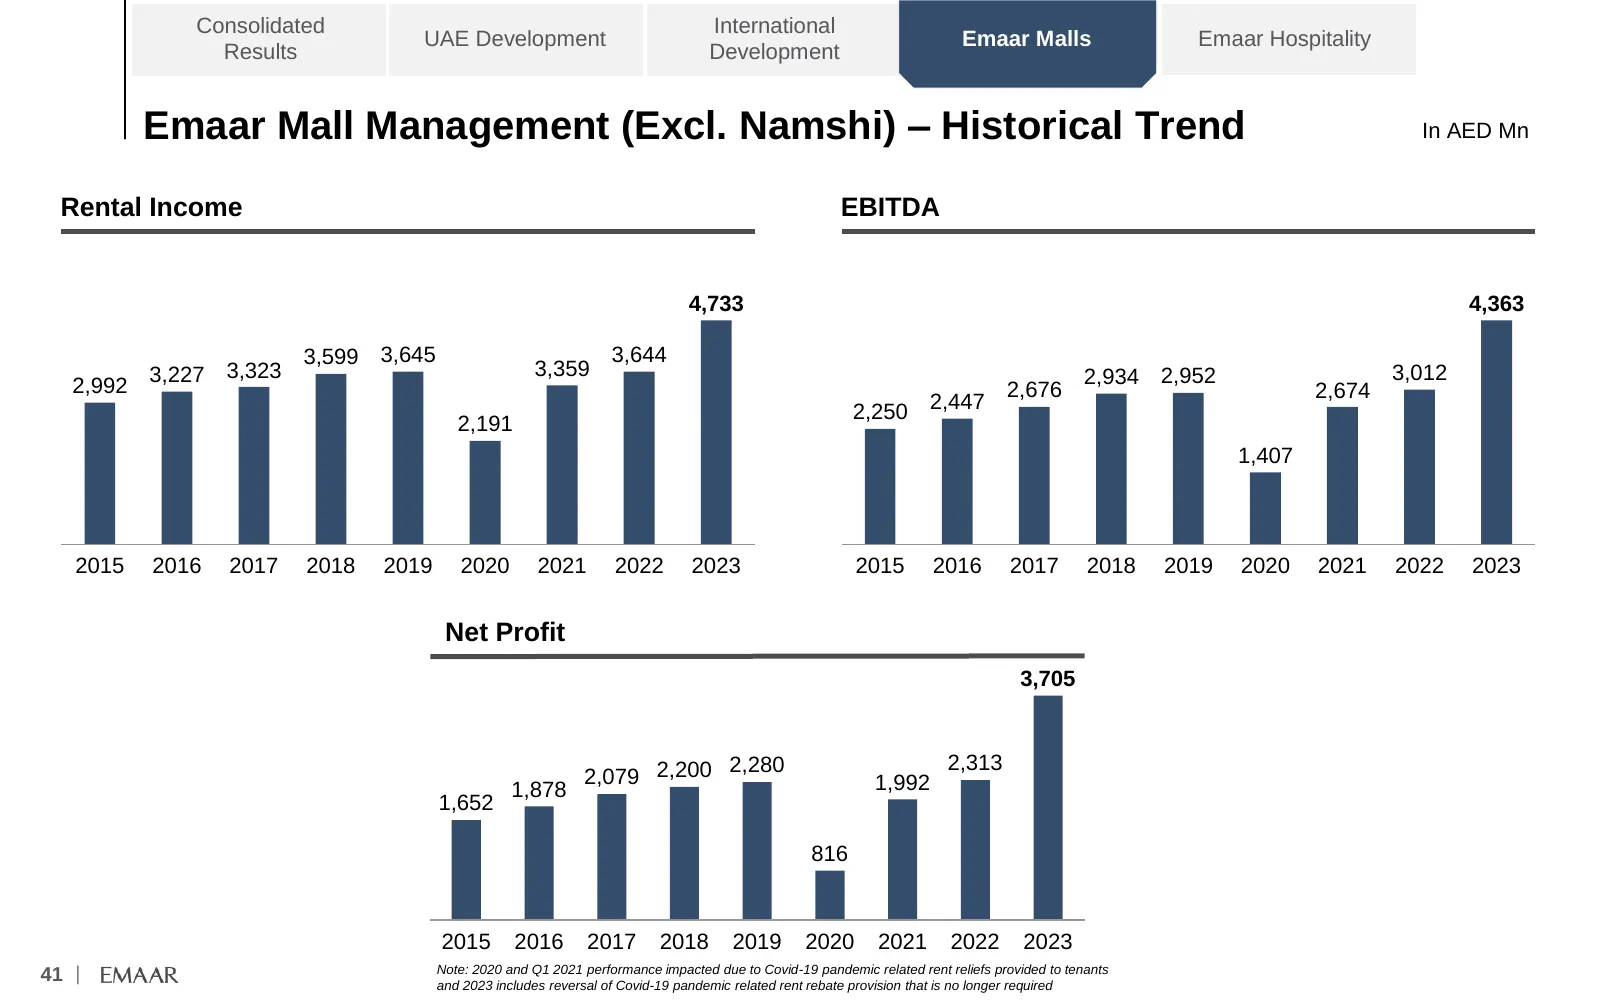
Consolidated International UAE Development Emaar Malls Emaar Hospitality Results Development Emaar Mall Management (Excl. Namshi) – Historical Trend In AED Mn Rental Income EBITDA 4,733 4,363 3,599 3,645 3,644 3,227 3,323 3,359 2,934 2,952 3,012 2,992 2,676 2,674 2,250 2,447 2,191 1,407 2015 2016 20
Slide 43: Steady Rental Income Growth, High Operating Profitability
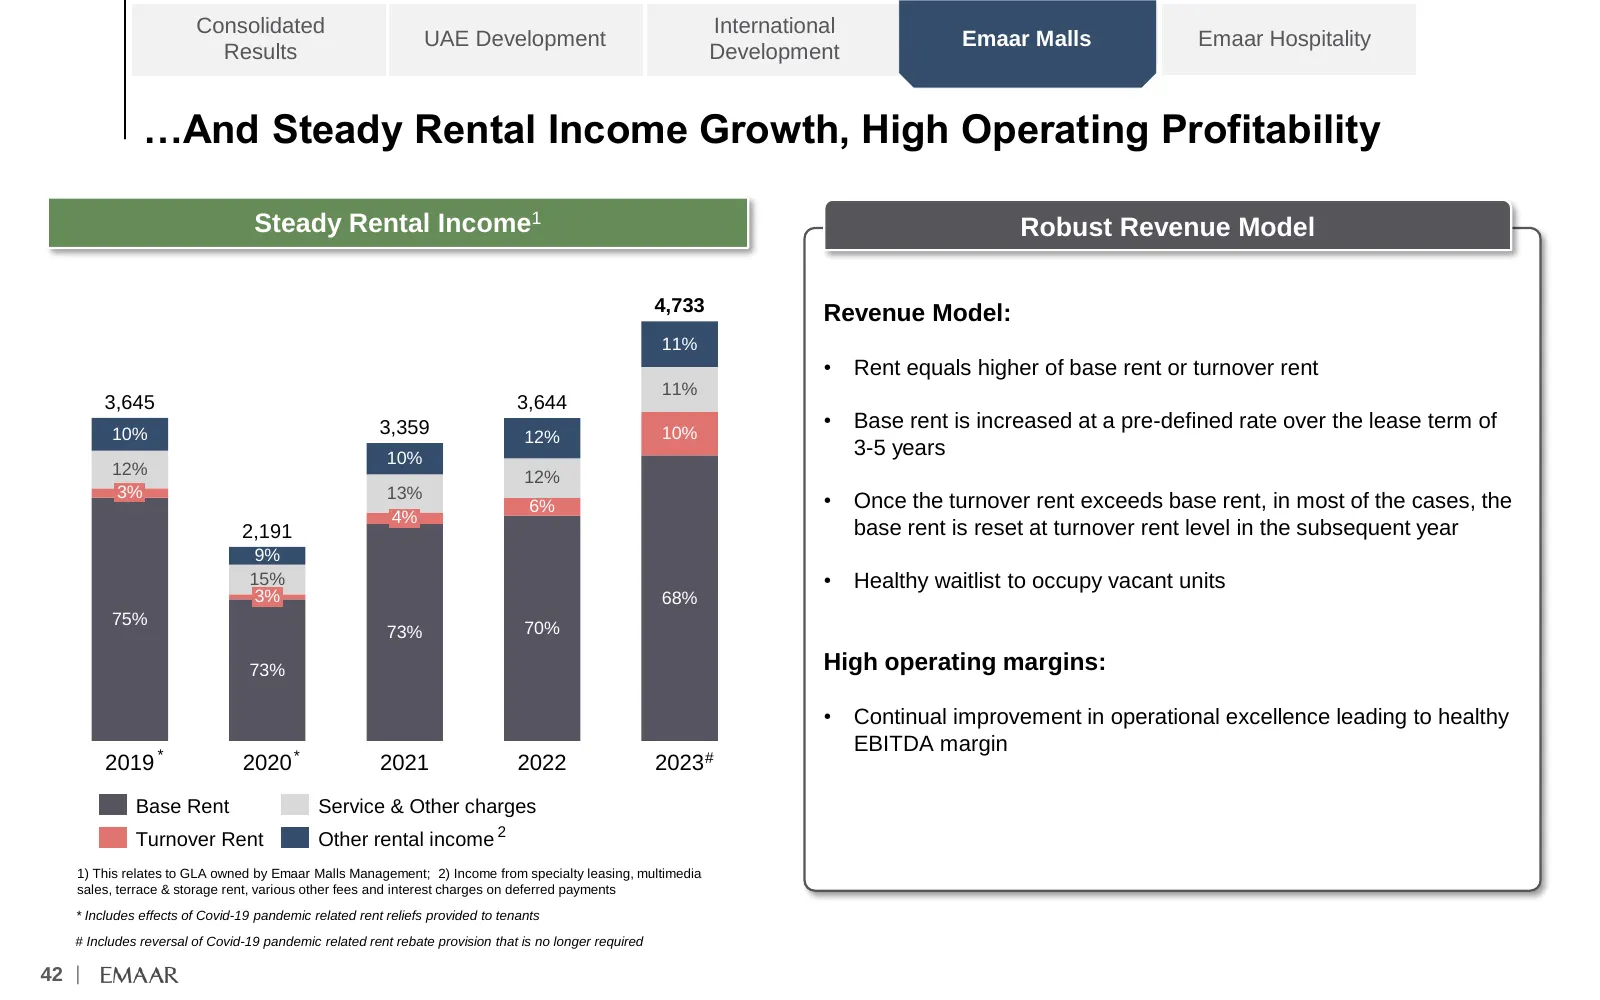
Consolidated International UAE Development Emaar Malls Emaar Hospitality Results Development …And Steady Rental Income Growth, High Operating Profitability Steady Rental Income1 Robust Revenue Model 4,733 Revenue Model: 11% • Rent equals higher of base rent or turnover rent 11% 3,645 3,644 3,359 10%
Slide 44: Active Tenant & Space Management with Healthy Lease Renewals
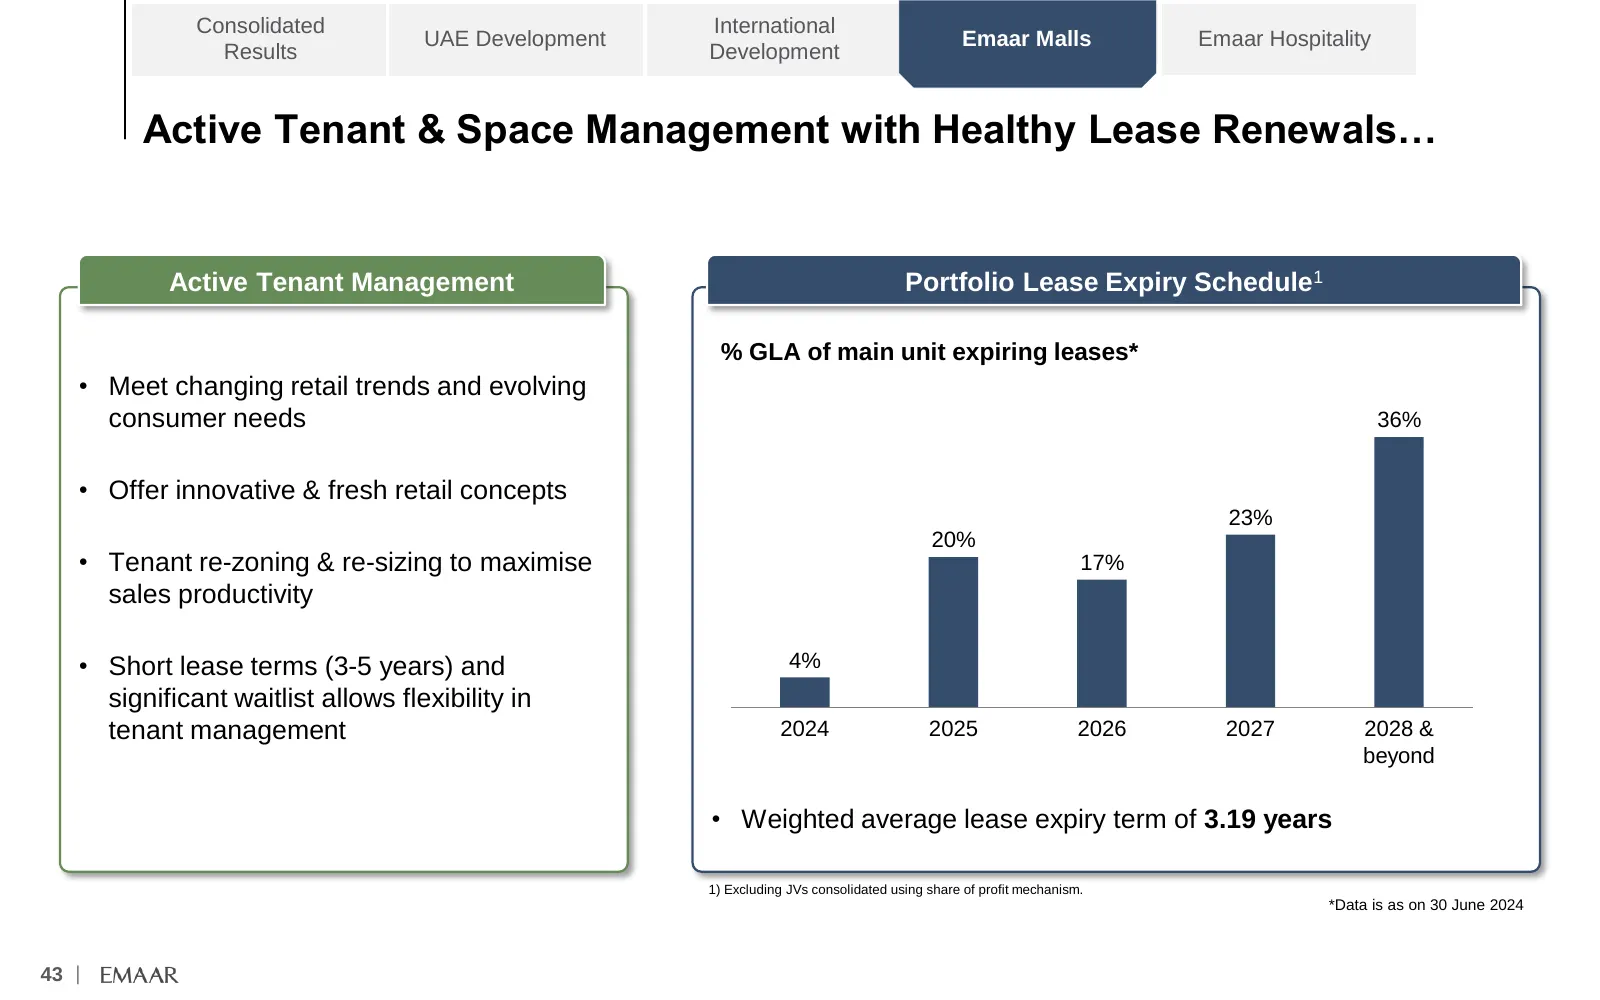
Consolidated International UAE Development Emaar Malls Emaar Hospitality Results Development Active Tenant & Space Management with Healthy Lease Renewals… Active Tenant Management Portfolio Lease Expiry Schedule1 % GLA of main unit expiring leases* • Meet changing retail trends and evolving consumer
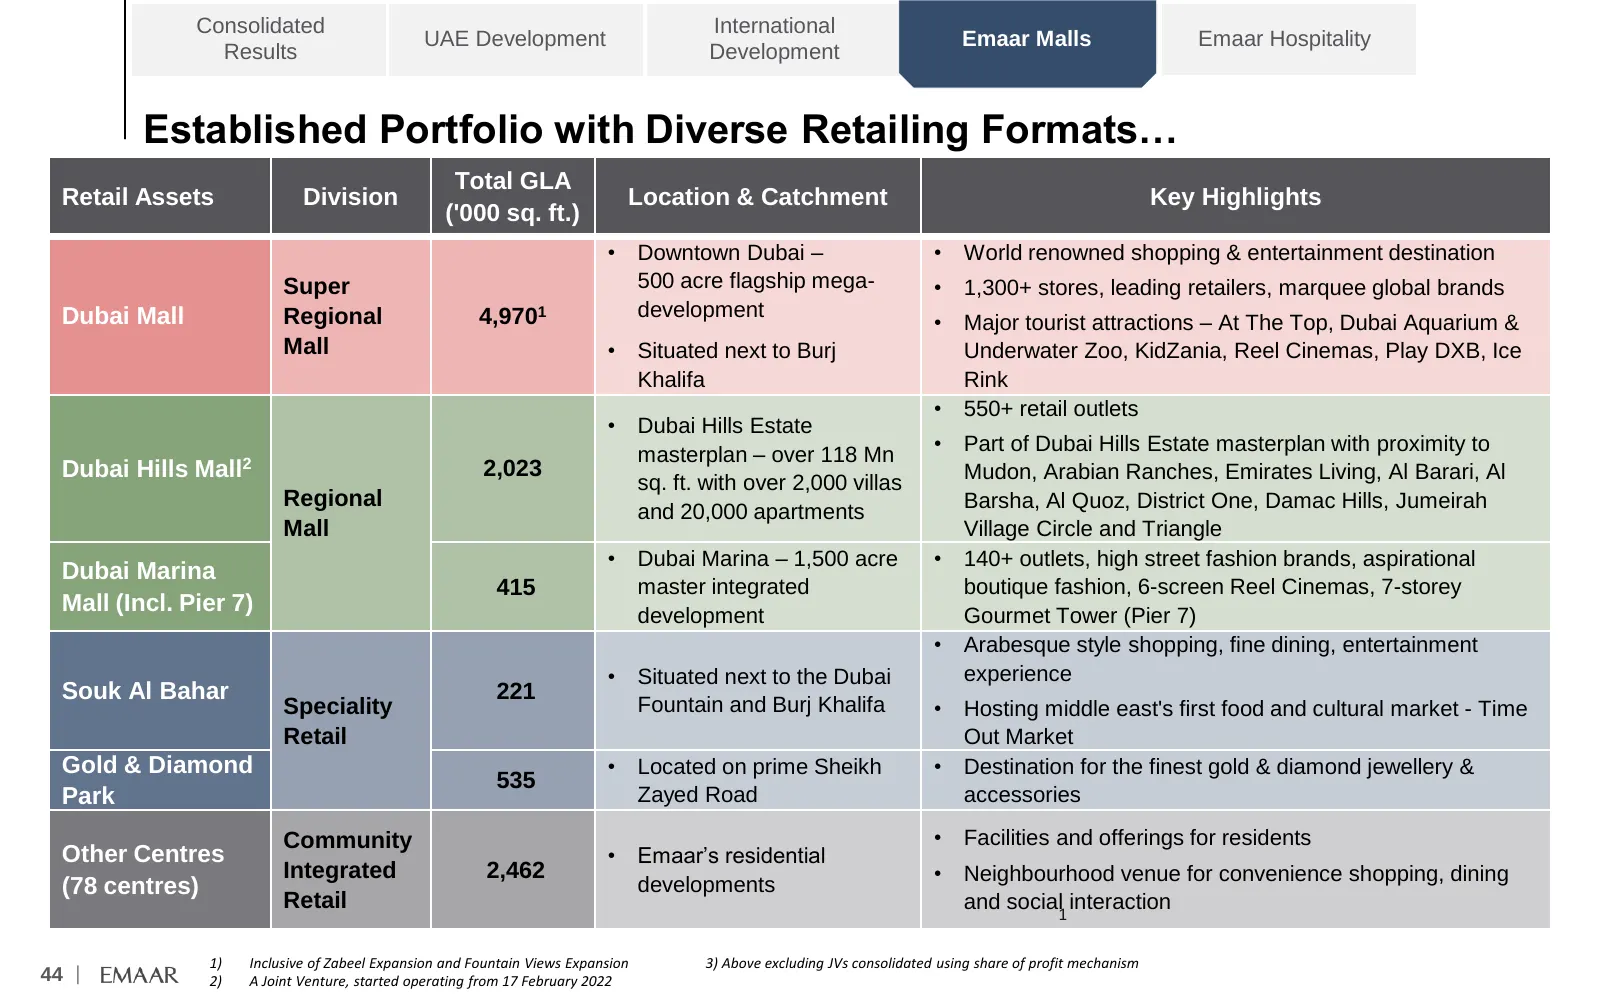
Slide 45: Established Portfolio with Diverse Retailing Formats
Consolidated International UAE Development Emaar Malls Emaar Hospitality Results Development Established Portfolio with Diverse Retailing Formats… Total GLA Retail Assets Division Location & Catchment Key Highlights ('000 sq. ft.) • Downtown Dubai – • World renowned shopping & entertainment destinat
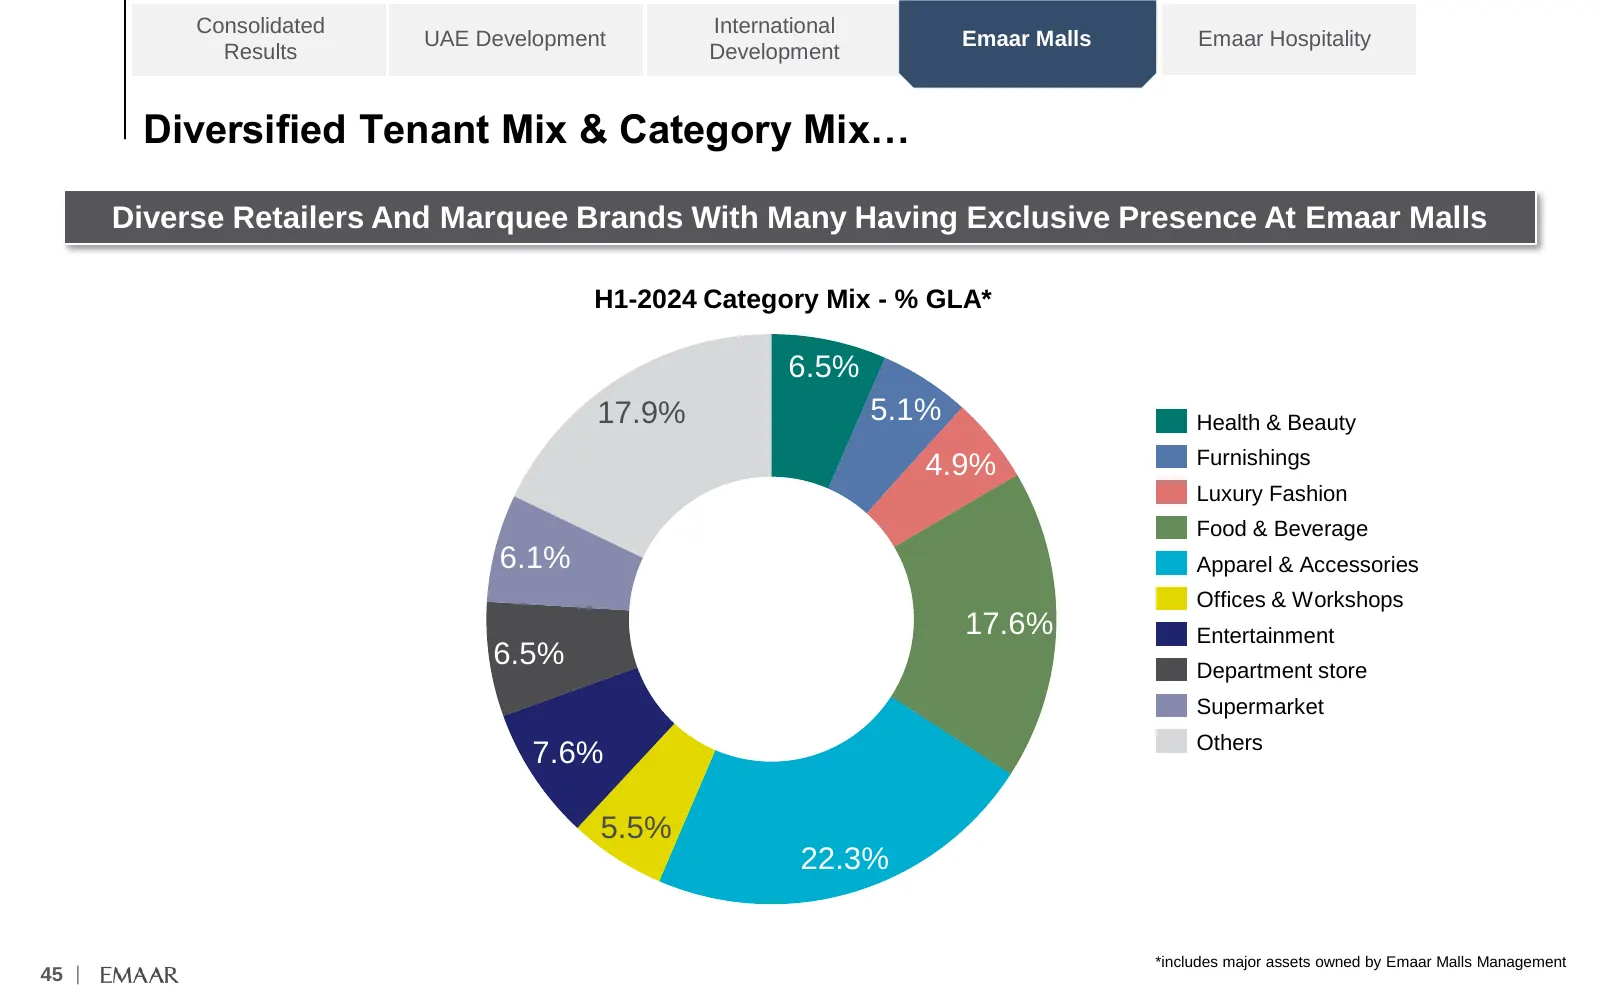
Slide 46: Diversified Tenant Mix & Category Mix
Consolidated International UAE Development Emaar Malls Emaar Hospitality Results Development Diversified Tenant Mix & Category Mix… Diverse Retailers And Marquee Brands With Many Having Exclusive Presence At Emaar Malls H1-2024 Category Mix - % GLA* 6.5% 17.9% 5.1% Health & Beauty 4.9% Furnishings L
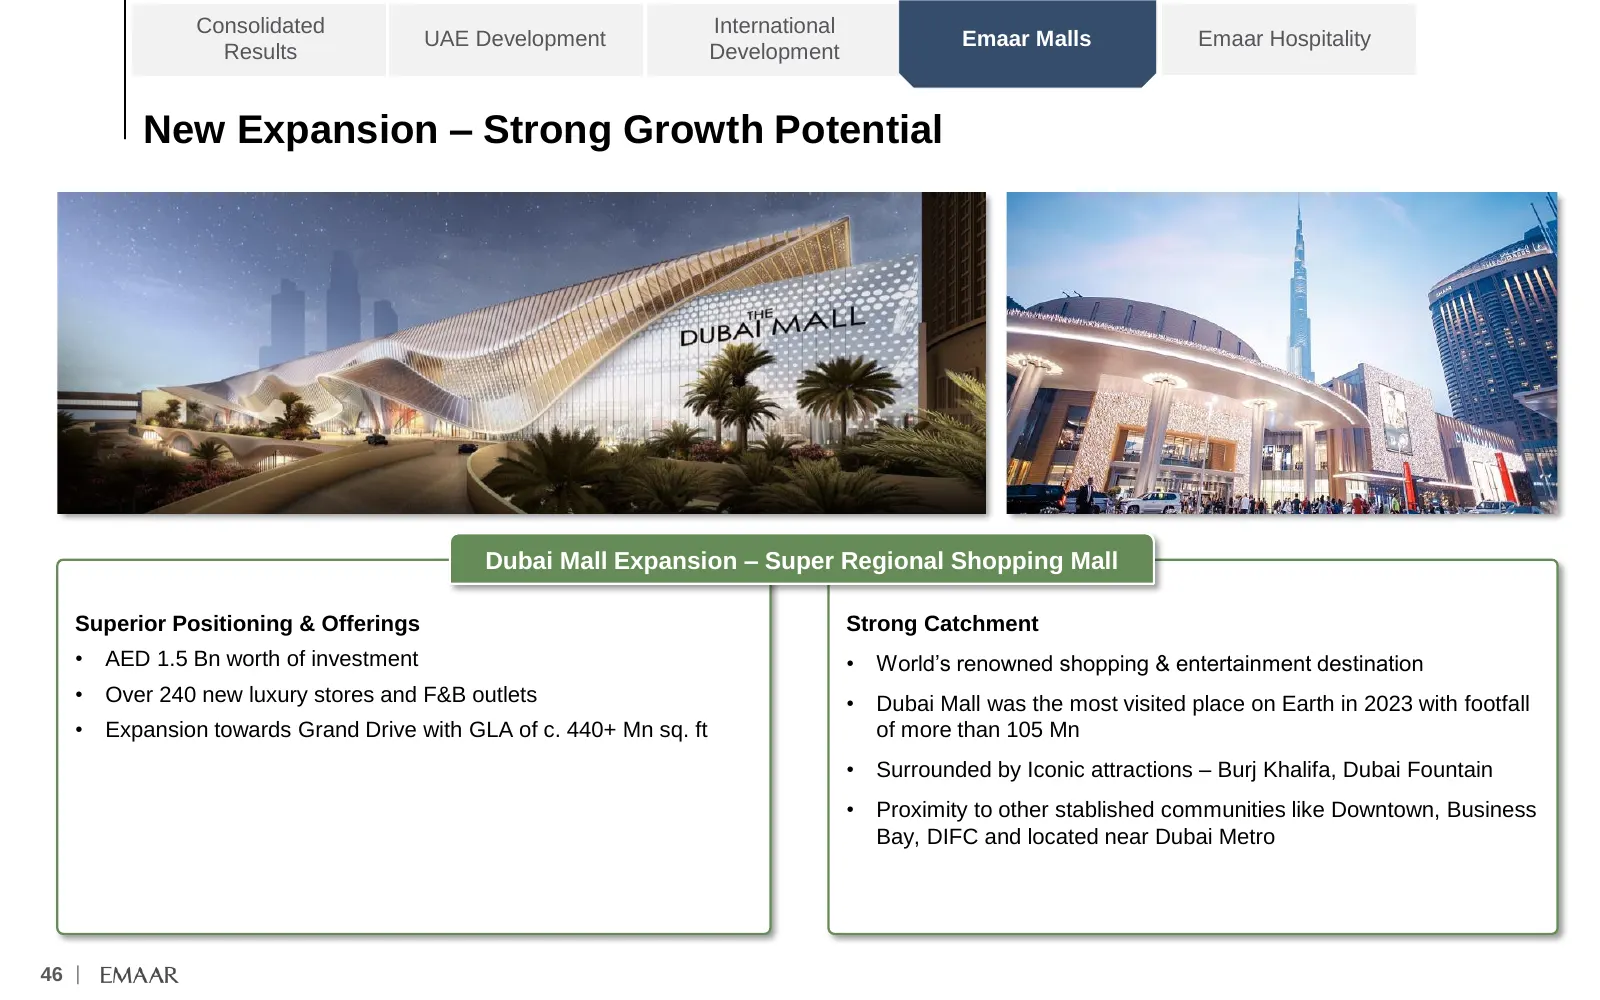
Slide 47: New Expansion – Strong Growth Potential
Consolidated International UAE Development Emaar Malls Emaar Hospitality Results Development New Expansion – Strong Growth Potential 1 Dubai Mall Expansion – Super Regional Shopping Mall Superior Positioning & Offerings Strong Catchment • AED 1.5 Bn worth of investment • World’s renowned shopping &
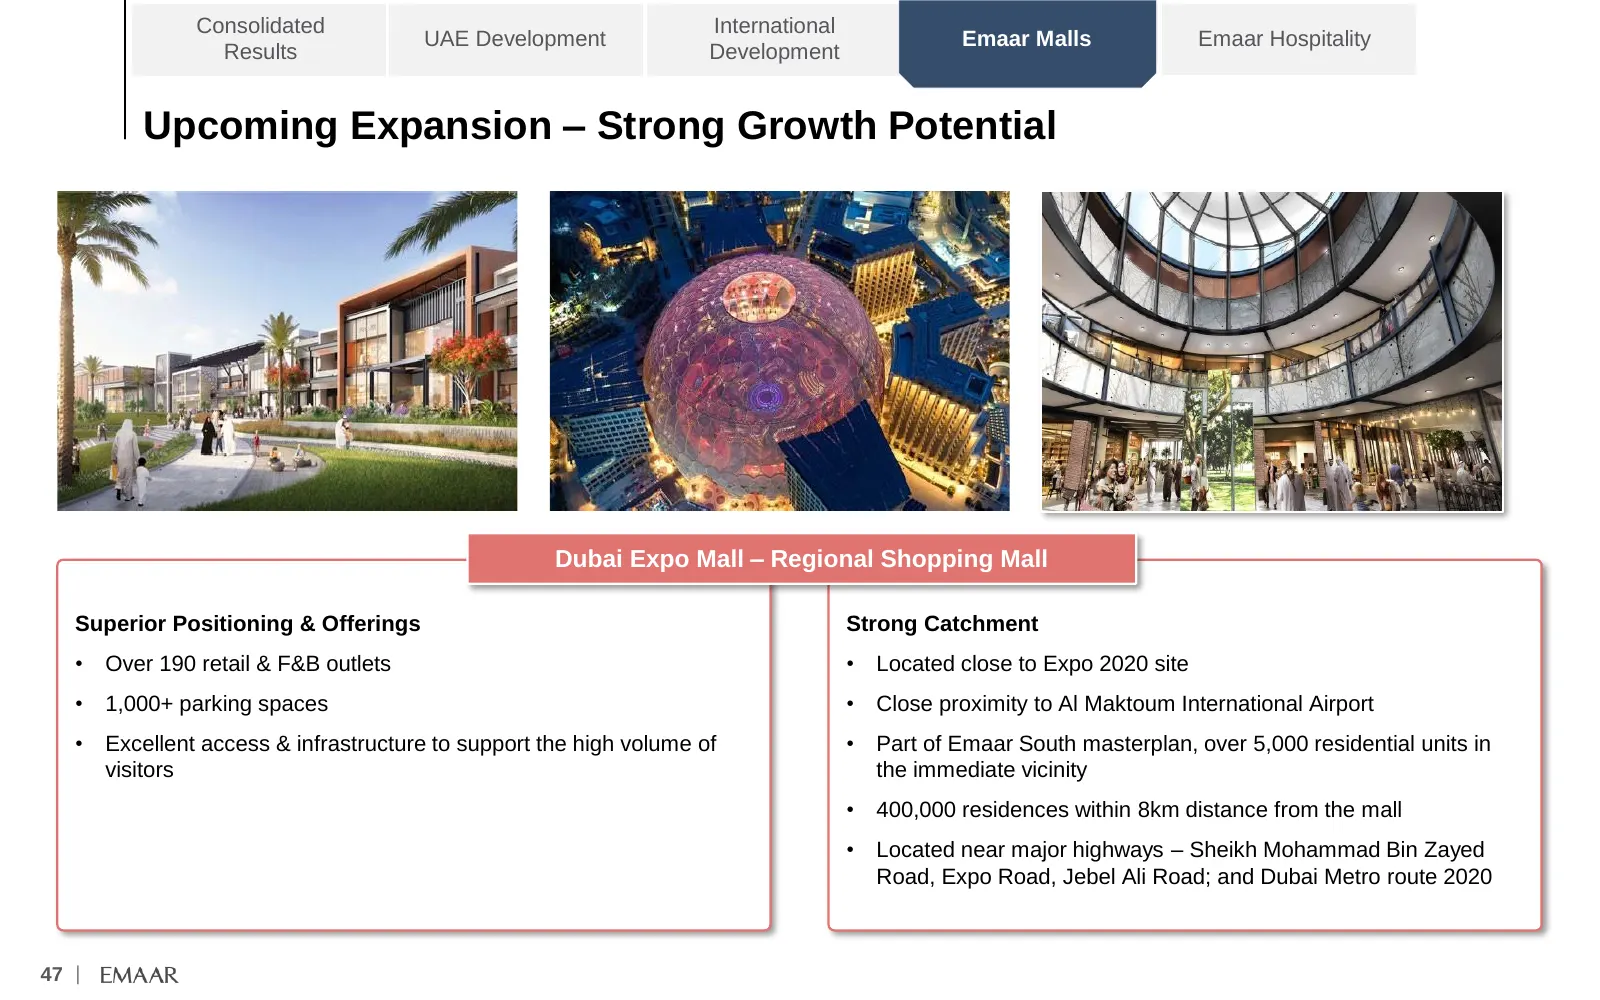
Slide 48: Upcoming Expansion – Strong Growth Potential
Consolidated International UAE Development Emaar Malls Emaar Hospitality Results Development Upcoming Expansion – Strong Growth Potential 1 Dubai Expo Mall – Regional Shopping Mall Superior Positioning & Offerings Strong Catchment • Over 190 retail & F&B outlets • Located close to Expo 2020 site • 1
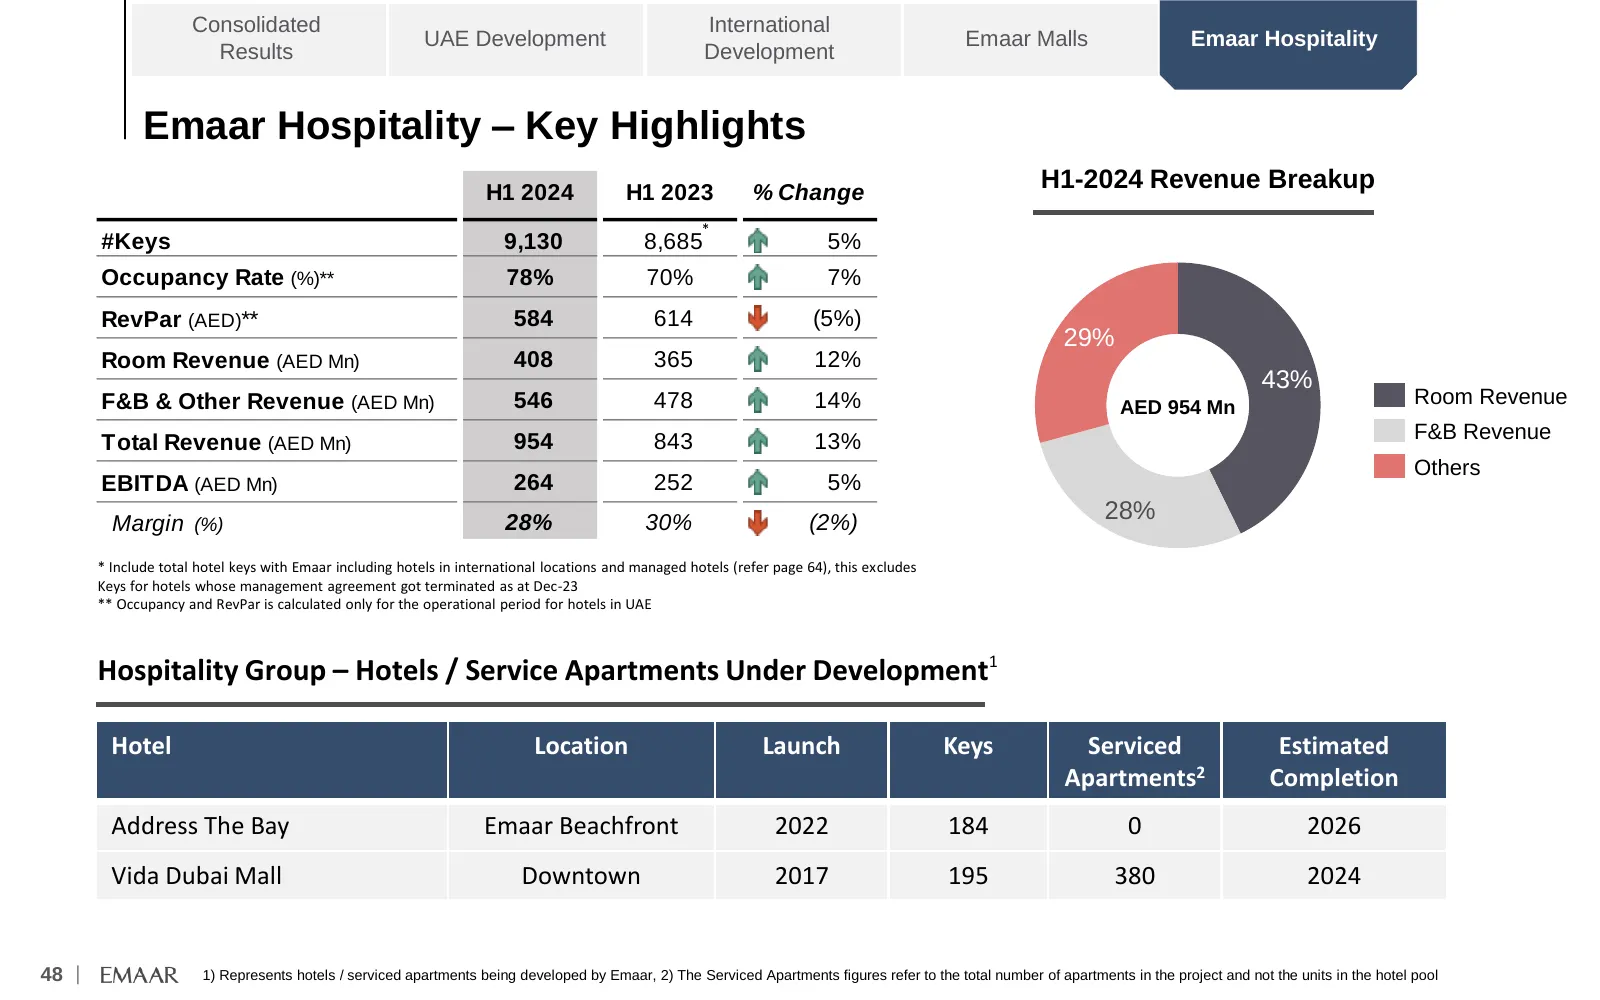
Slide 49: Emaar Hospitality – Key Highlights
Consolidated International UAE Development Emaar Malls Emaar Hospitality Results Development Emaar Hospitality – Key Highlights H1 2024 H1 2023 % Change H1-2024 Revenue Breakup * #Keys 9,130 8,685 5% Occupancy Rate (%)** 78% 70% 7% RevPar (AED)** 584 614 (5%) 29% Room Revenue (AED Mn) 408 365 12% 43
Slide 50: Annexure
Annexure 49 |
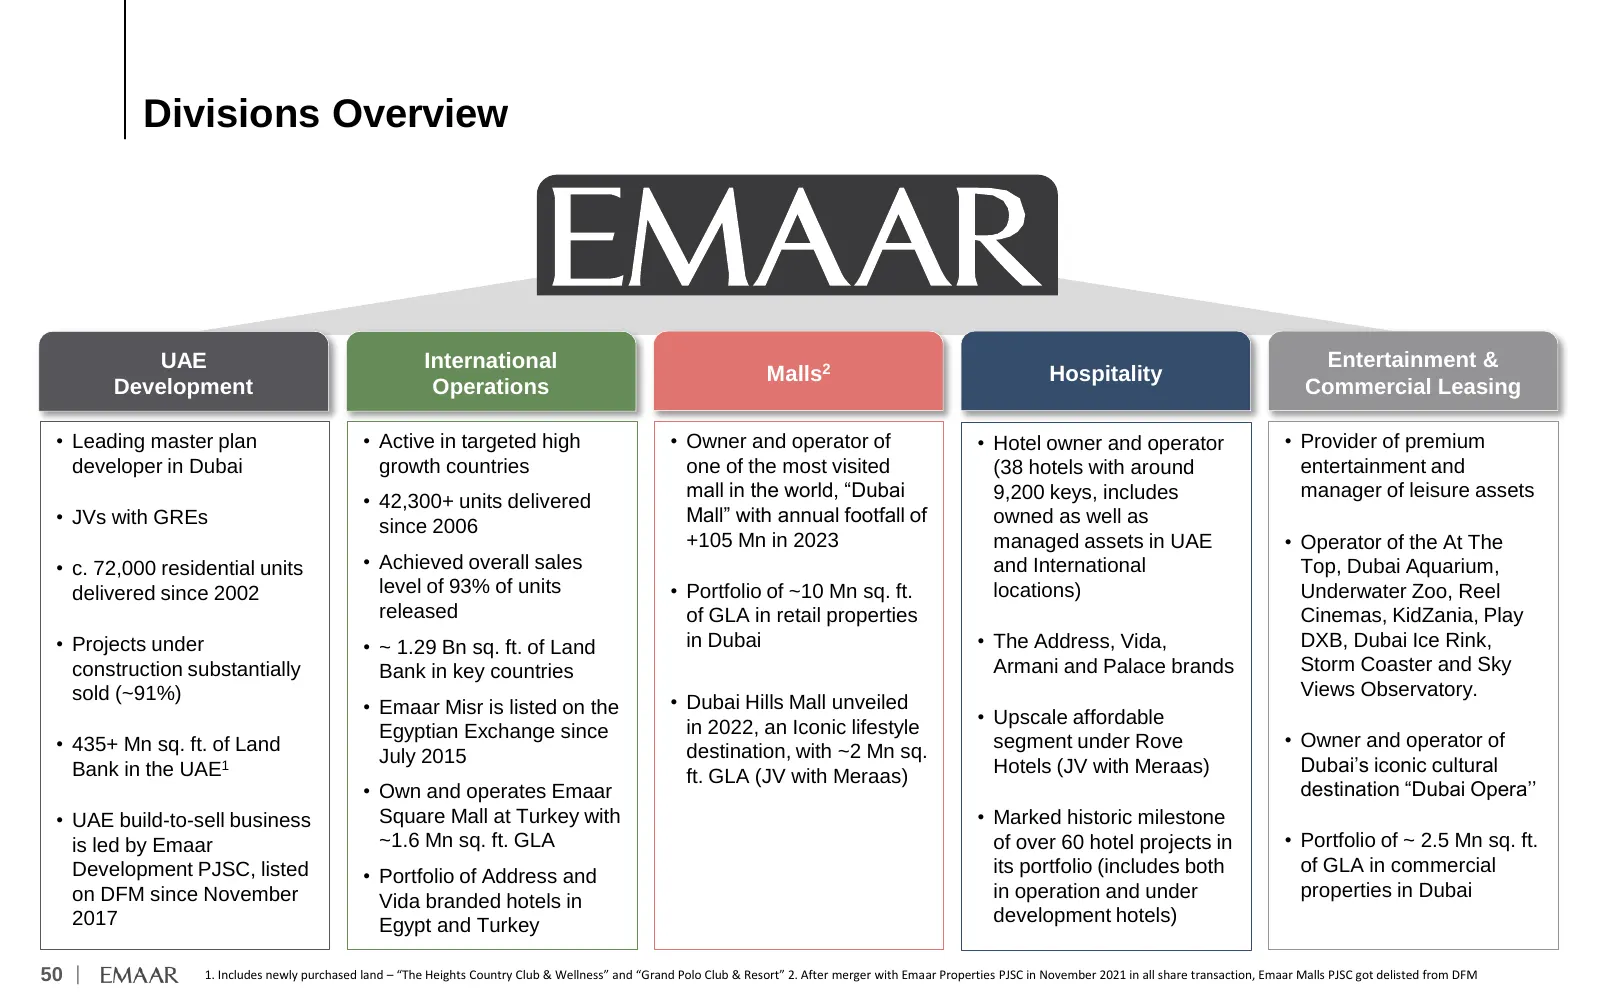
Slide 51: Divisions Overview
Divisions Overview UAE International Entertainment & Malls2 Hospitality Development Operations Commercial Leasing • Leading master plan • Active in targeted high • Owner and operator of • Hotel owner and operator • Provider of premium developer in Dubai growth countries one of the most visited (38 h
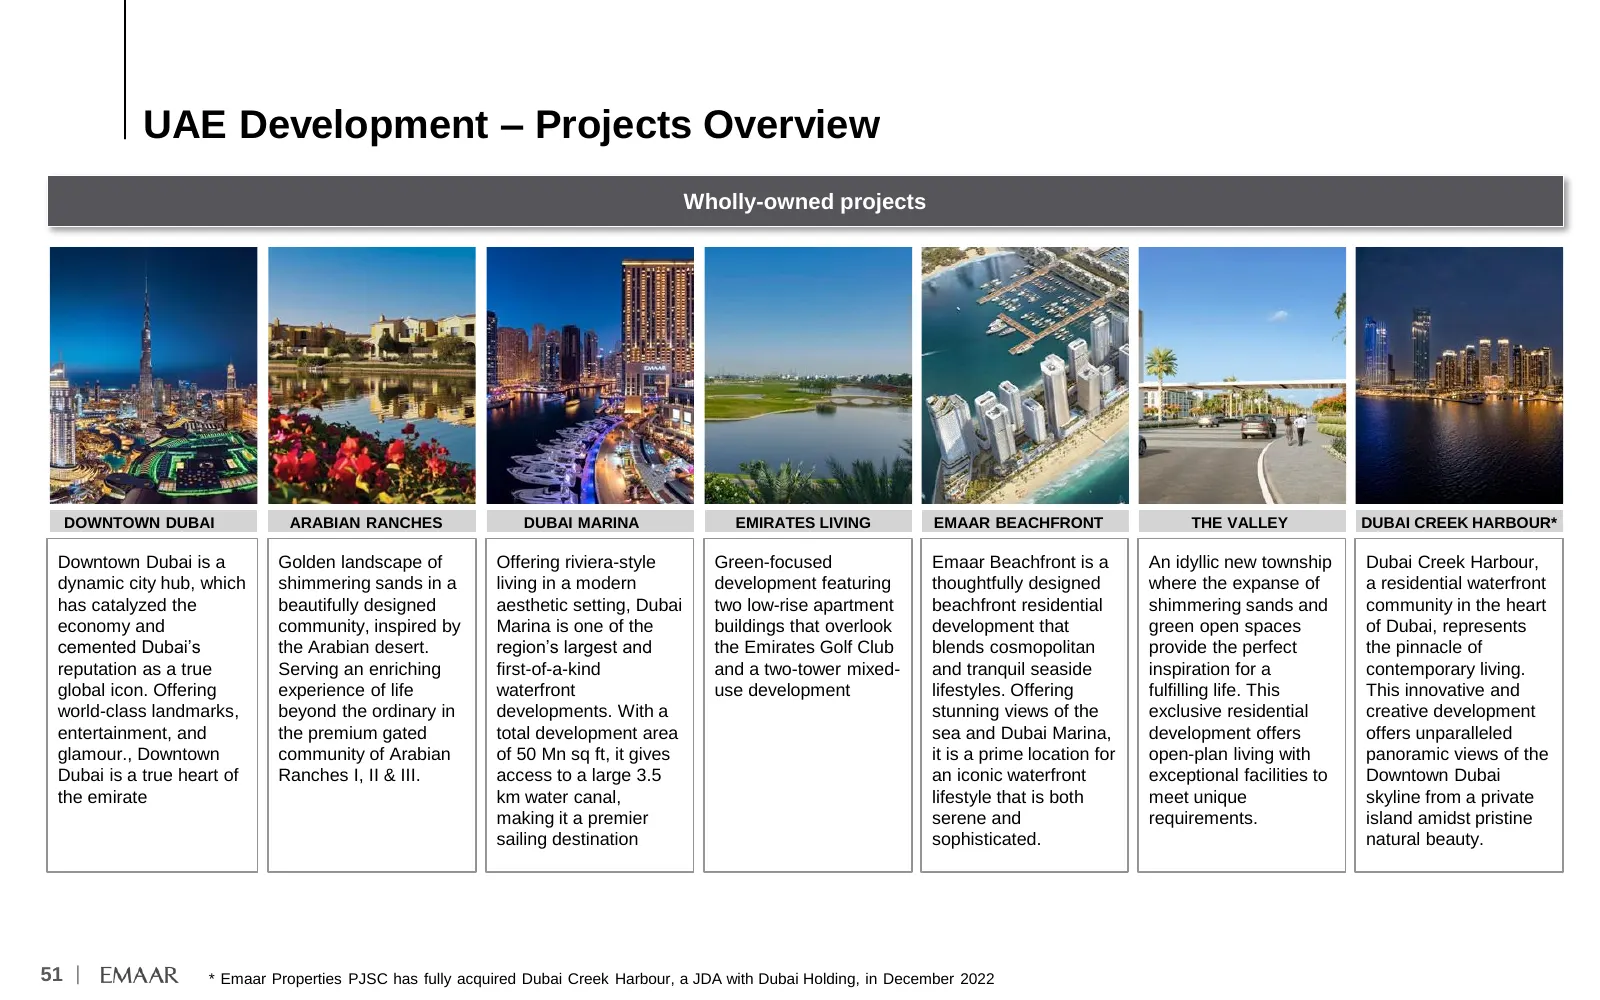
Slide 52: UAE Development – Projects Overview
UAE Development – Projects Overview Wholly-owned projects DOWNTOWN DUBAI ARABIAN RANCHES DUBAI MARINA EMIRATES LIVING EMAAR BEACHFRONT THE VALLEY DUBAI CREEK HARBOUR* Downtown Dubai is a Golden landscape of Offering riviera-style Green-focused Emaar Beachfront is a An idyllic new township Dubai Cree
Slide 53: UAE Development – Projects Overview
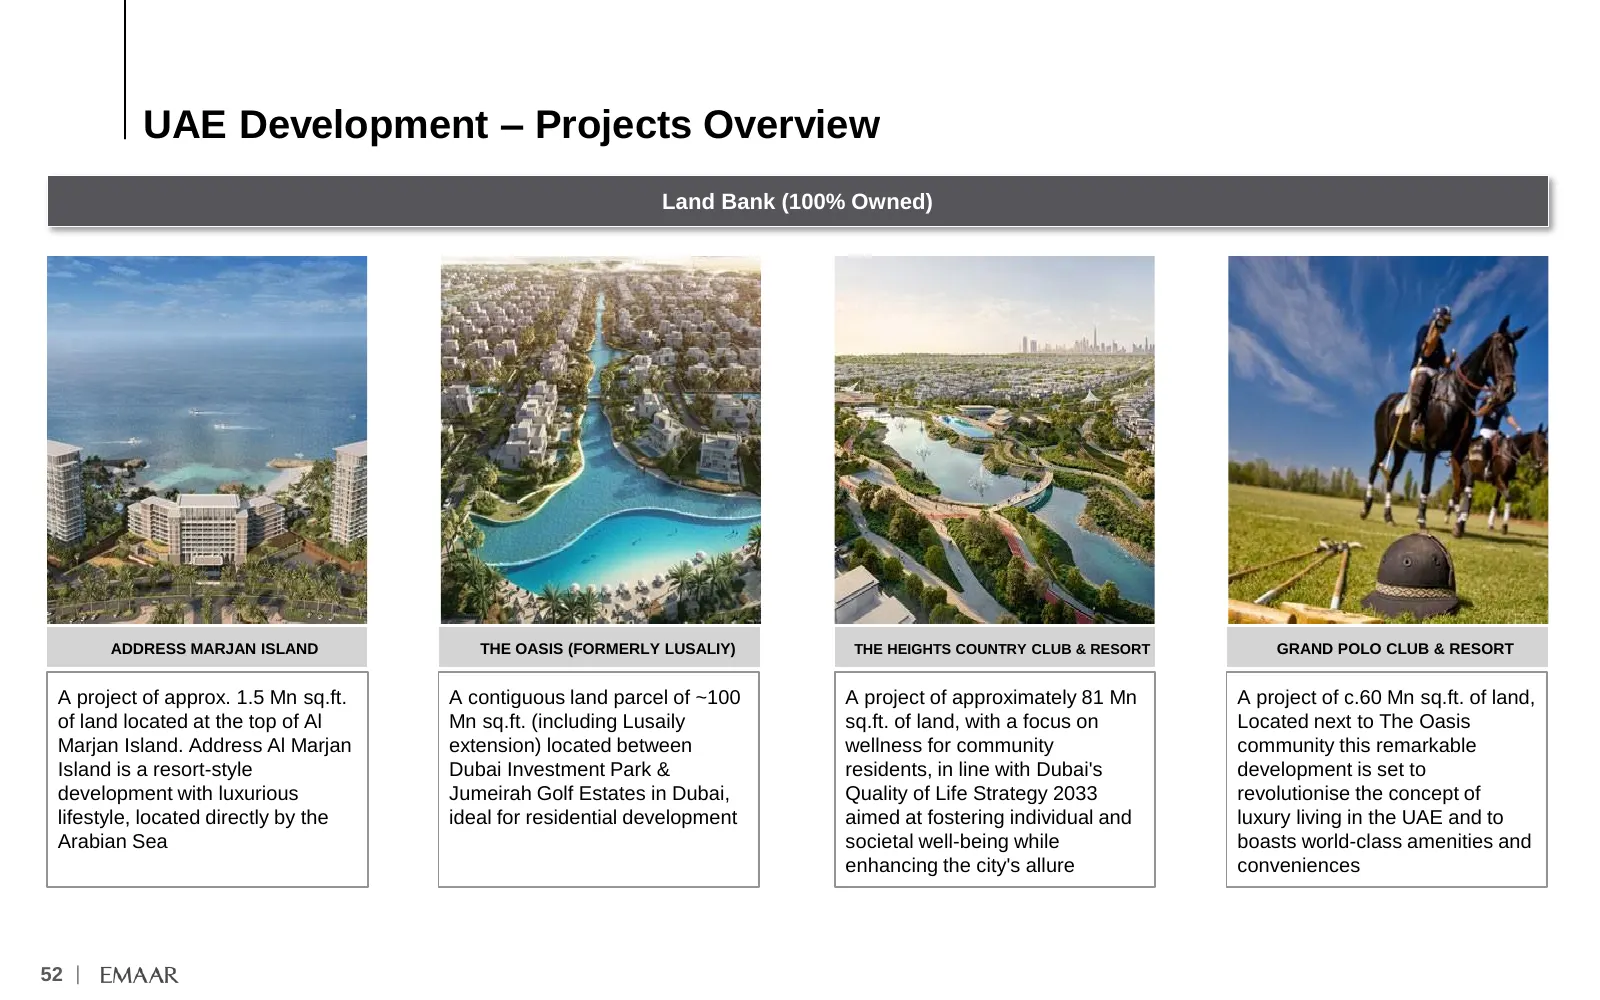
UAE Development – Projects Overview Land Bank (100% Owned) ADDRESS MARJAN ISLAND THE OASIS (FORMERLY LUSALIY) THE HEIGHTS COUNTRY CLUB & RESORT GRAND POLO CLUB & RESORT A project of approx. 1.5 Mn sq.ft. A contiguous land parcel of ~100 A project of approximately 81 Mn A project of c.60 Mn sq.ft. of
Slide 54: UAE Development – Projects Overview
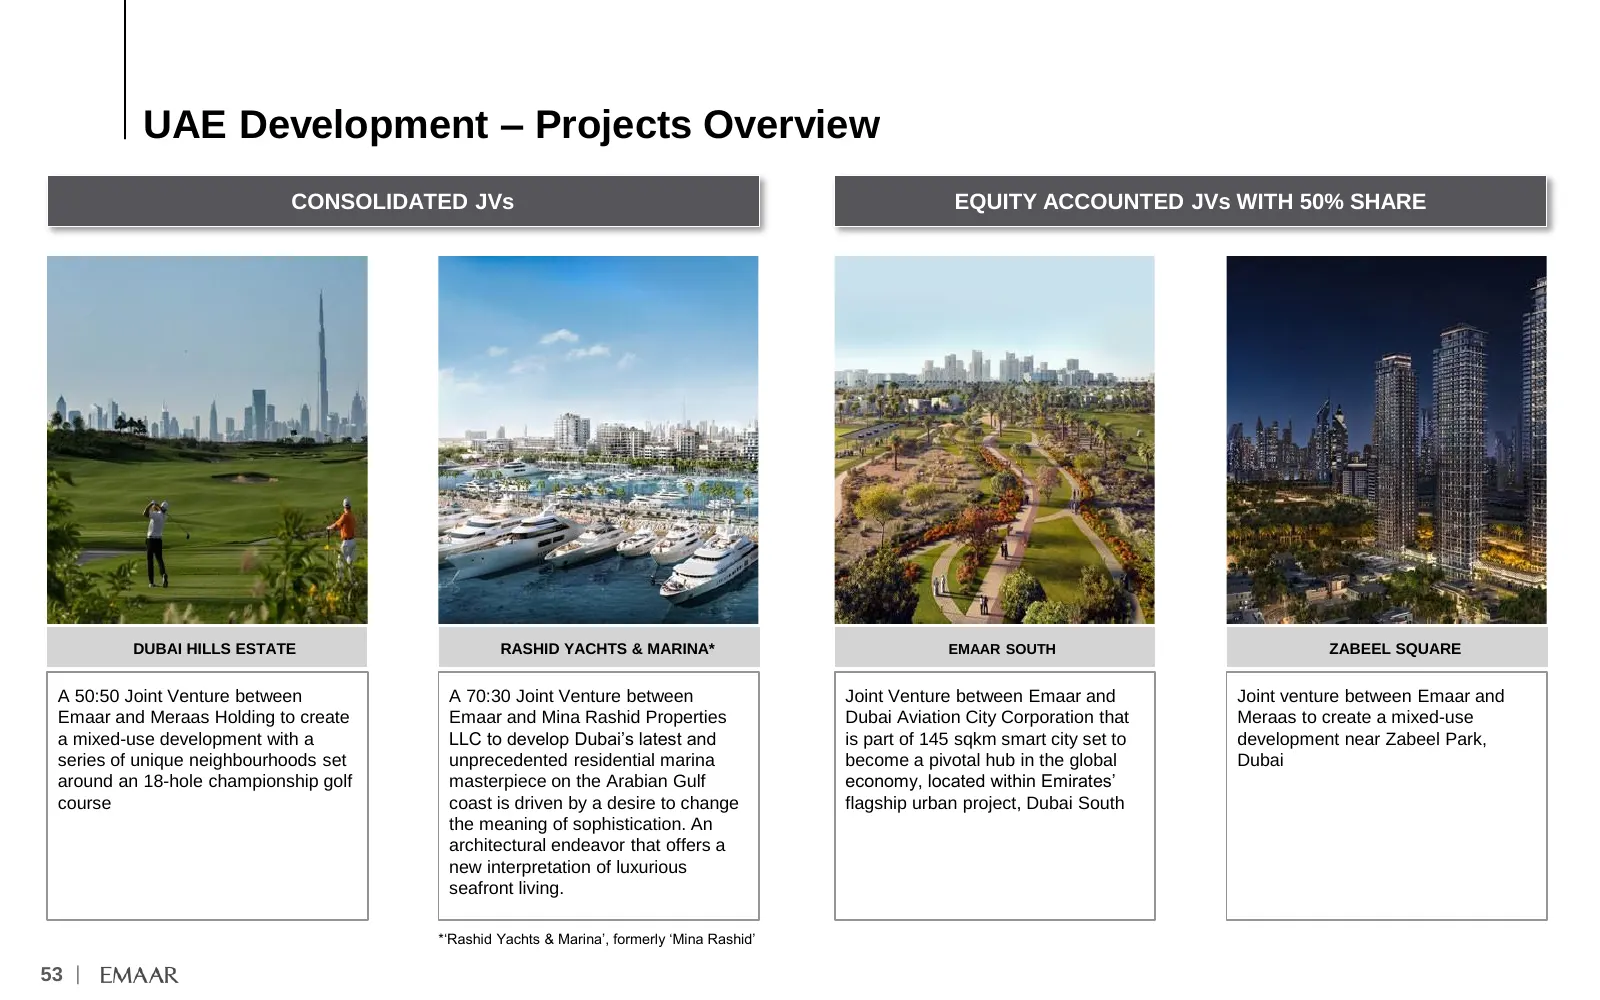
UAE Development – Projects Overview CONSOLIDATED JVs EQUITY ACCOUNTED JVs WITH 50% SHARE DUBAI HILLS ESTATE RASHID YACHTS & MARINA* EMAAR SOUTH ZABEEL SQUARE A 50:50 Joint Venture between A 70:30 Joint Venture between Joint Venture between Emaar and Joint venture between Emaar and Emaar and Meraas H
Slide 55: UAE Development – Projects Under Development (100% Owned)
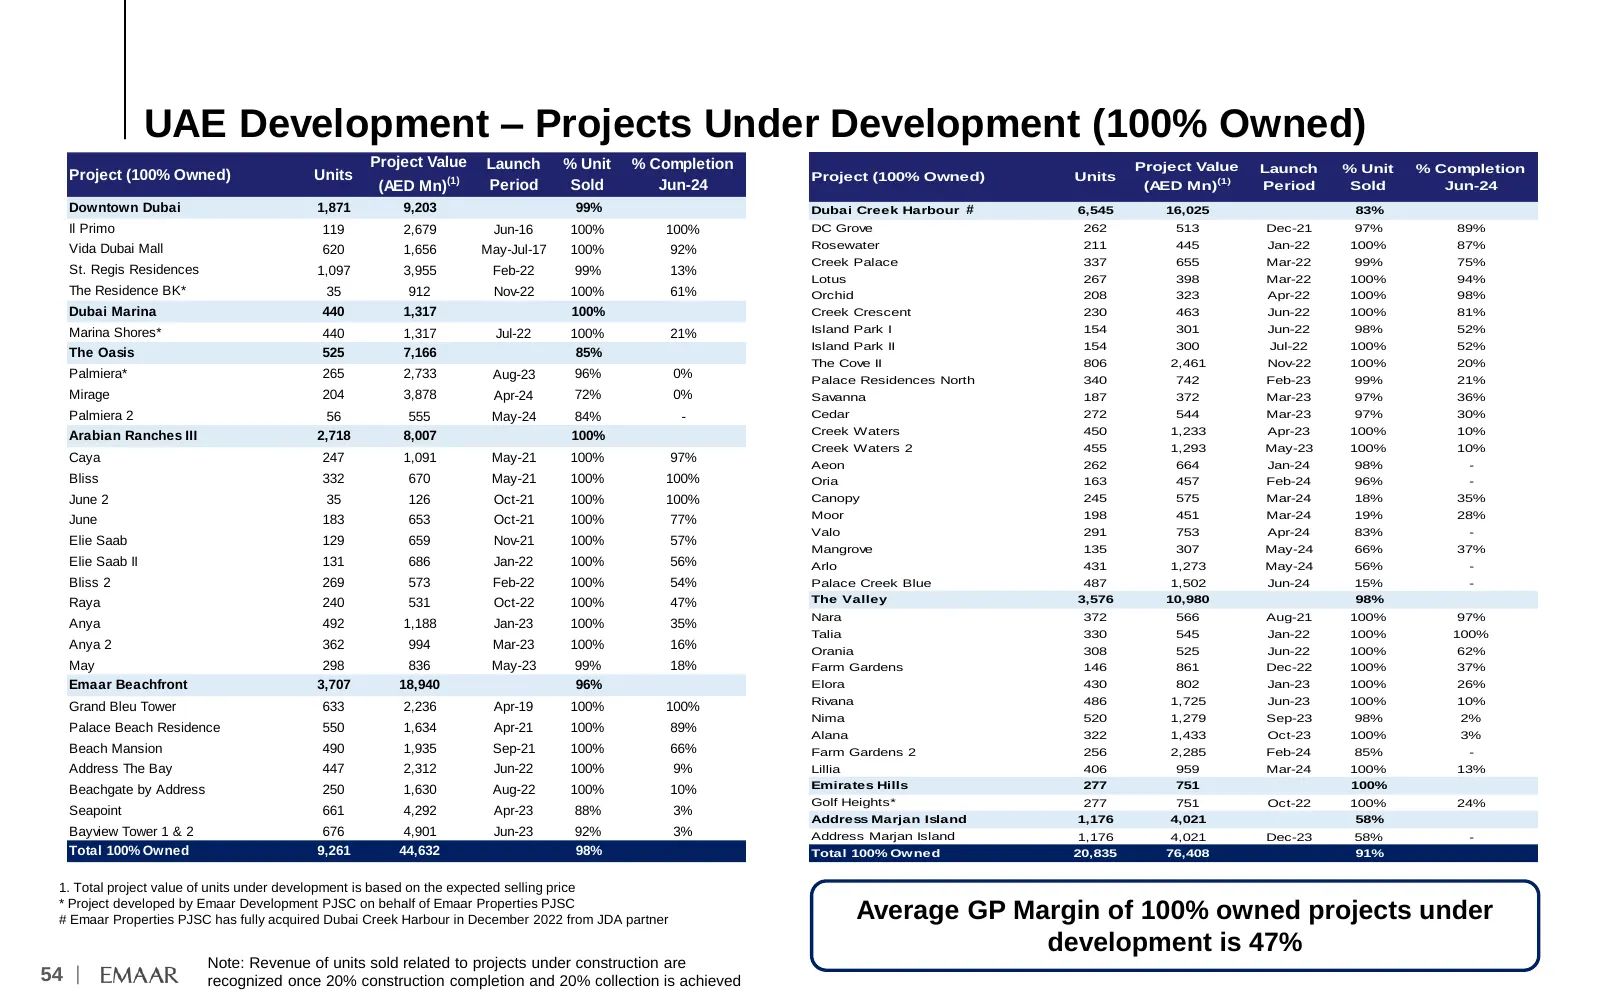
UAE Development – Projects Under Development (100% Owned) Project Value Launch % Unit % Completion Project Value Launch % Unit % Completion Project (100% Owned) Units Project (100% Owned) Units (AED Mn)(1) Period Sold Jun-24 (AED Mn)(1) Period Sold Jun-24 Downtown Dubai 1,871 9,203 99% Dubai Creek H
Slide 56: UAE Development – Projects Under Development (JVs)
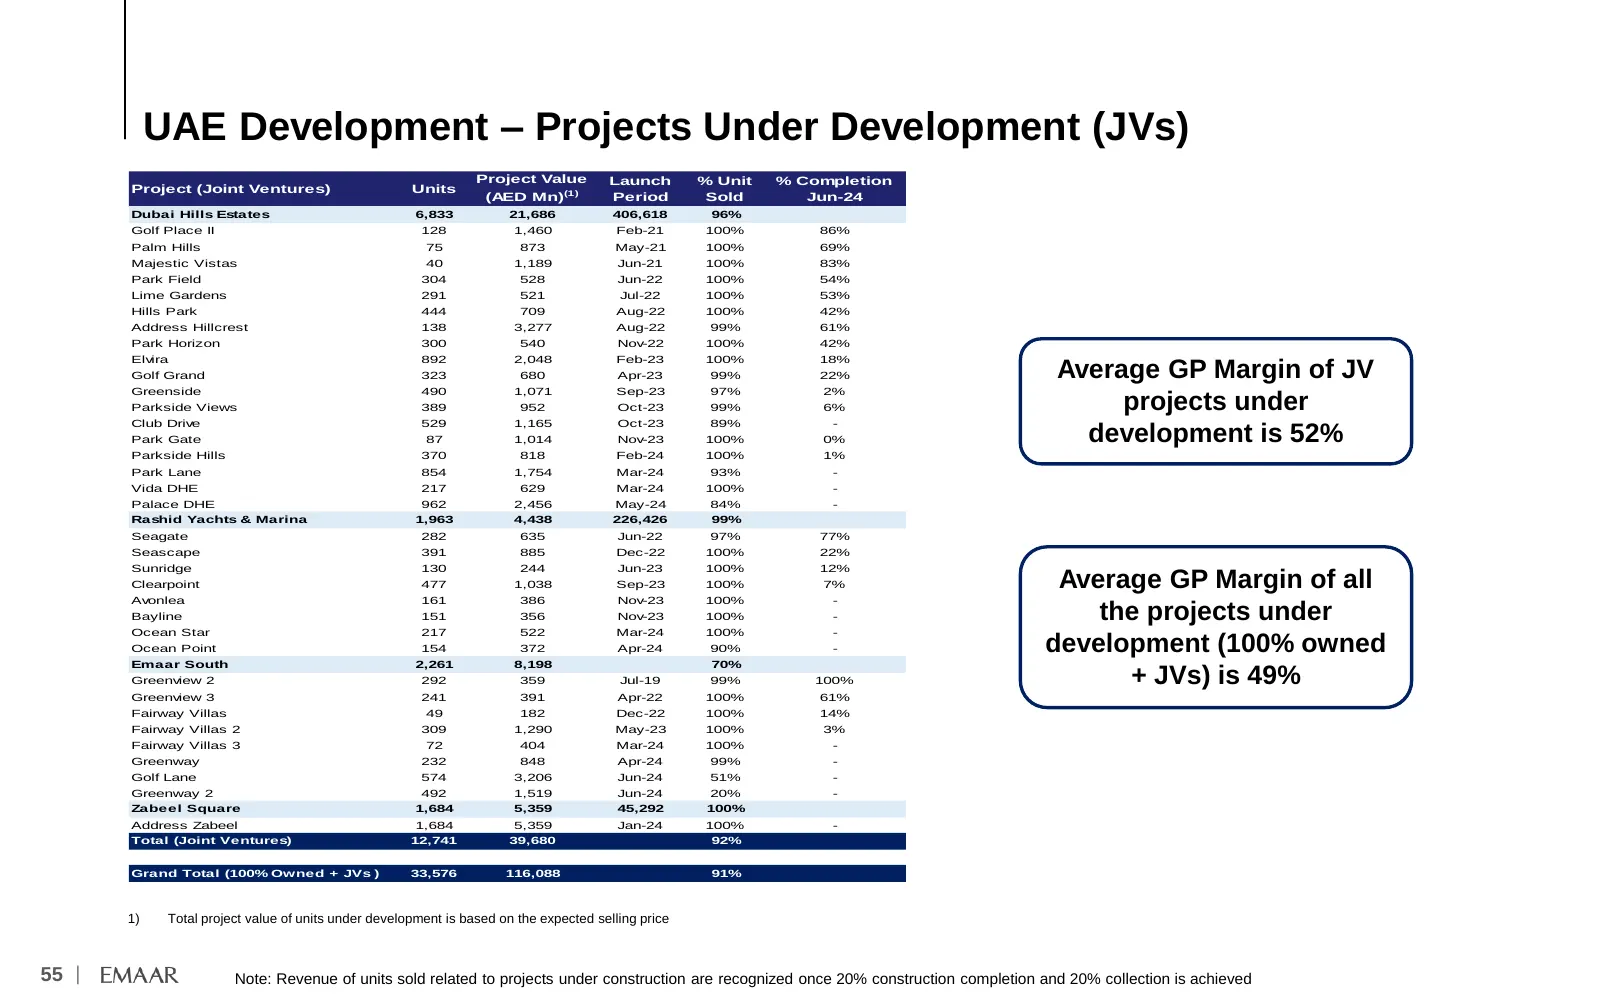
UAE Development – Projects Under Development (JVs) Project Value Launch % Unit % Completion Project (Joint Ventures) Units (AED Mn)(1) Period Sold Jun-24 Dubai Hills Estates 6,833 21,686 406,618 96% Golf Place II 128 1,460 Feb-21 100% 86% Palm Hills 75 873 May-21 100% 69% Majestic Vistas 40 1,189 Ju
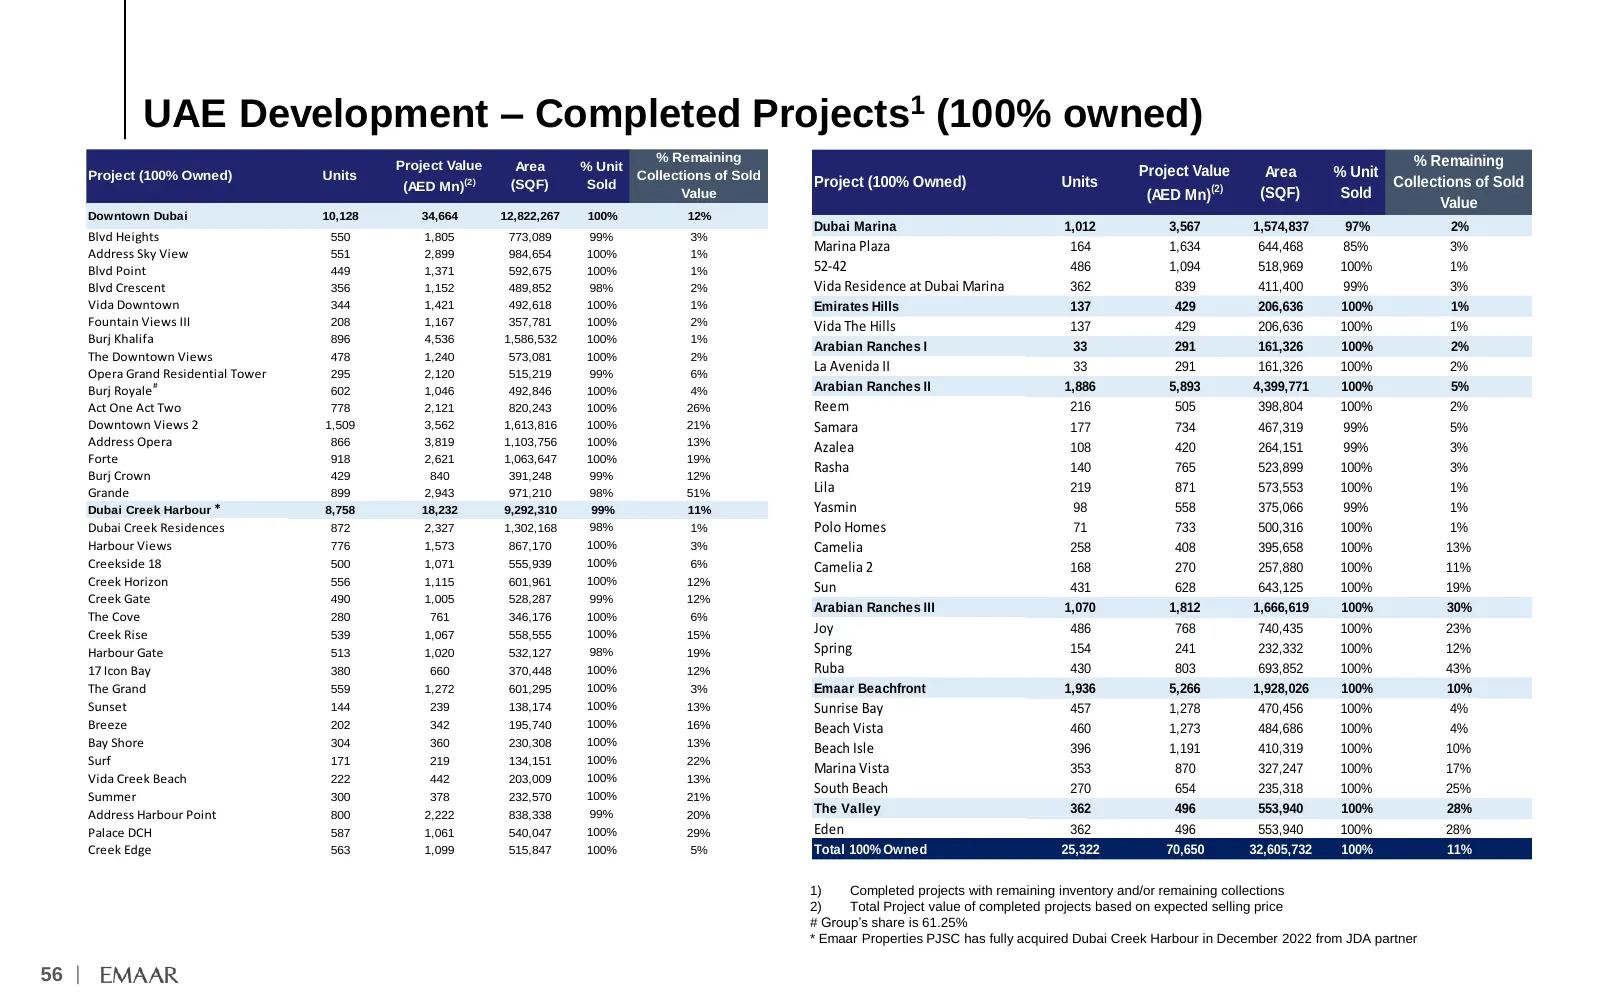
Slide 57: UAE Development – Completed Projects (100% owned)
UAE Development – Completed Projects1 (100% owned) % Remaining % Remaining Project Value Area % Unit Project Value Area % Unit Project (100% Owned) Units Collections of Sold (AED Mn)(2) (SQF) Sold Project (100% Owned) Units (2) Collections of Sold Value (AED Mn) (SQF) Sold Value Downtown Dubai 10,12
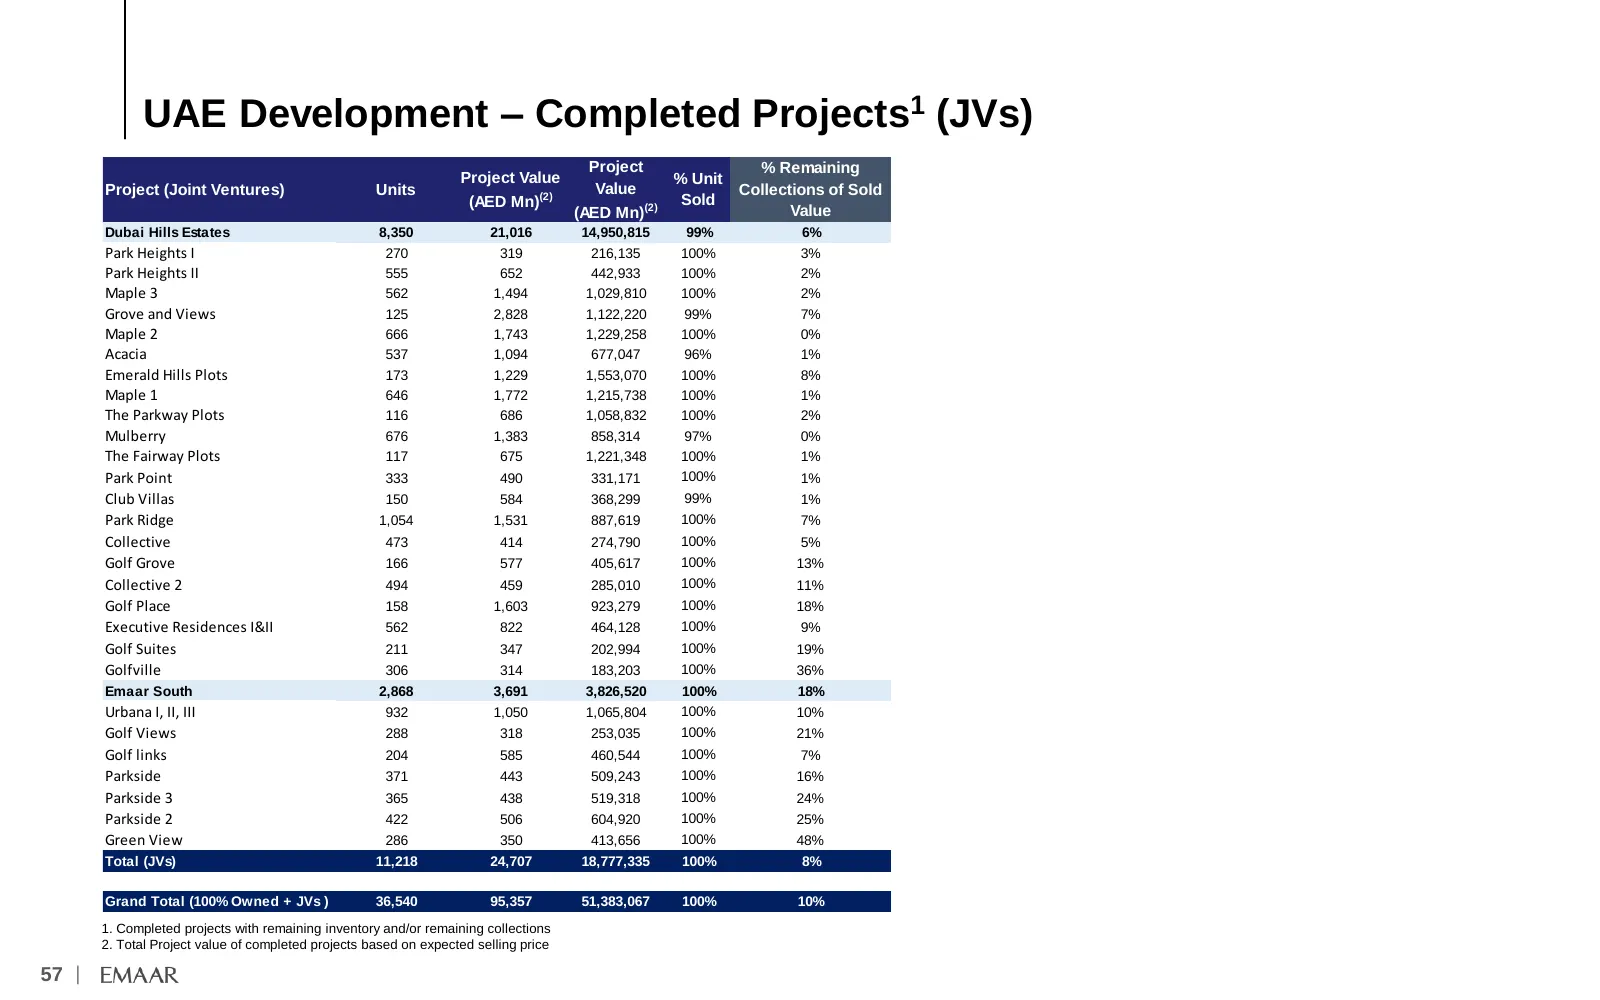
Slide 58: UAE Development – Completed Projects (JVs)
UAE Development – Completed Projects1 (JVs) Project % Remaining Project Value % Unit Project (Joint Ventures) Units (2) Value Collections of Sold (AED Mn) Sold (AED Mn)(2) Value Dubai Hills Estates 8,350 21,016 14,950,815 99% 6% Park Heights I 270 319 216,135 100% 3% Park Heights II 555 652 442,933
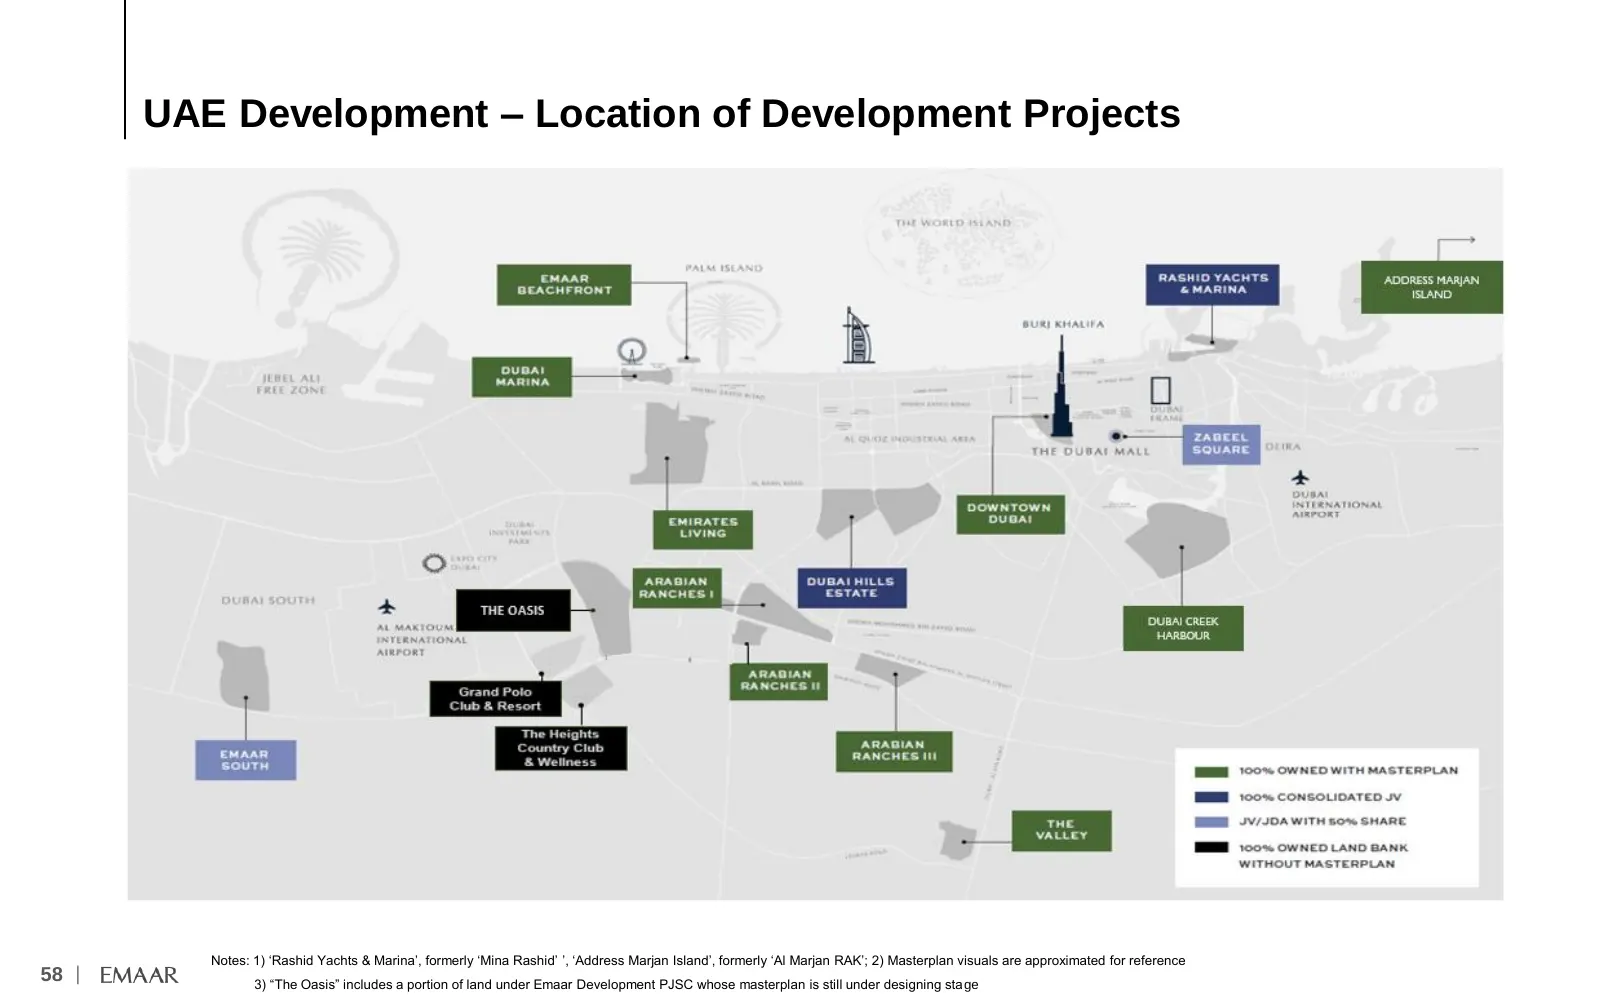
Slide 59: UAE Development – Location of Development Projects
UAE Development – Location of Development Projects Notes: 1) ‘Rashid Yachts & Marina’, formerly ‘Mina Rashid’ ’, ‘Address Marjan Island’, formerly ‘Al Marjan RAK’; 2) Masterplan visuals are approximated for reference 58 | 3) “The Oasis” includes a portion of land under Emaar Development PJSC whose m
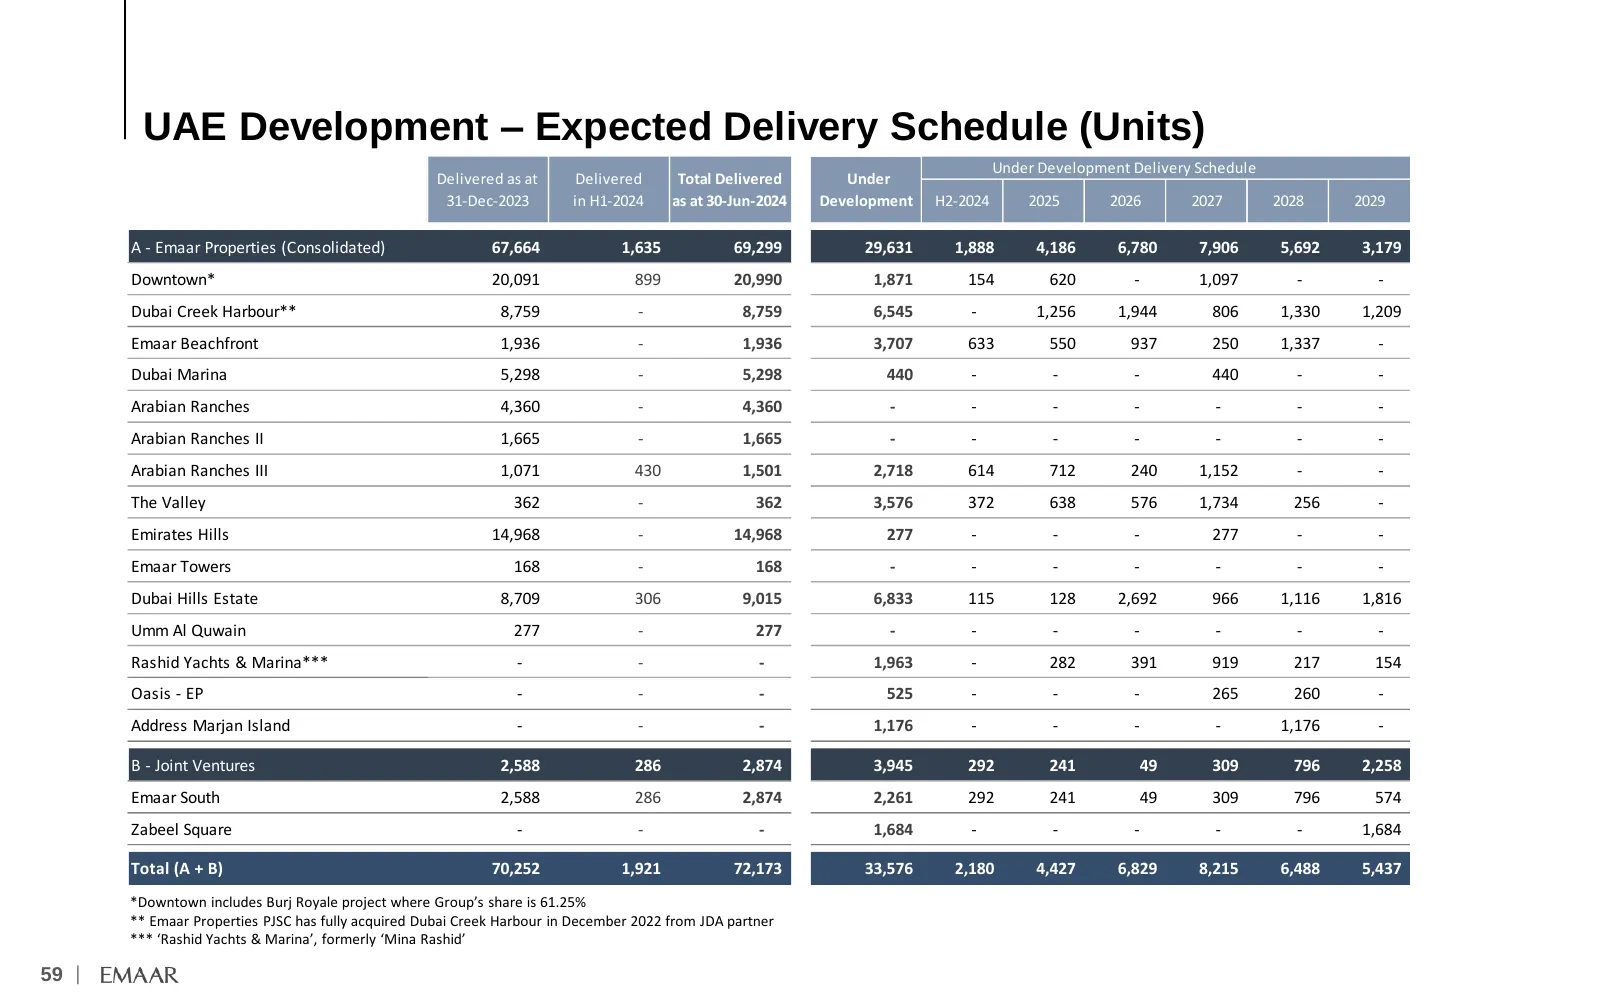
Slide 60: UAE Development – Expected Delivery Schedule (Units)
UAE Development – Expected Delivery Schedule (Units) Under Development Delivery Schedule Delivered as at Delivered Total Delivered Under 31-Dec-2023 in H1-2024 as at 30-Jun-2024 Development H2-2024 2025 2026 2027 2028 2029 A - Emaar Properties (Consolidated) 67,664 1,635 69,299 29,631 1,888 4,186 6,
Slide 61: UAE Development – Land Bank Details
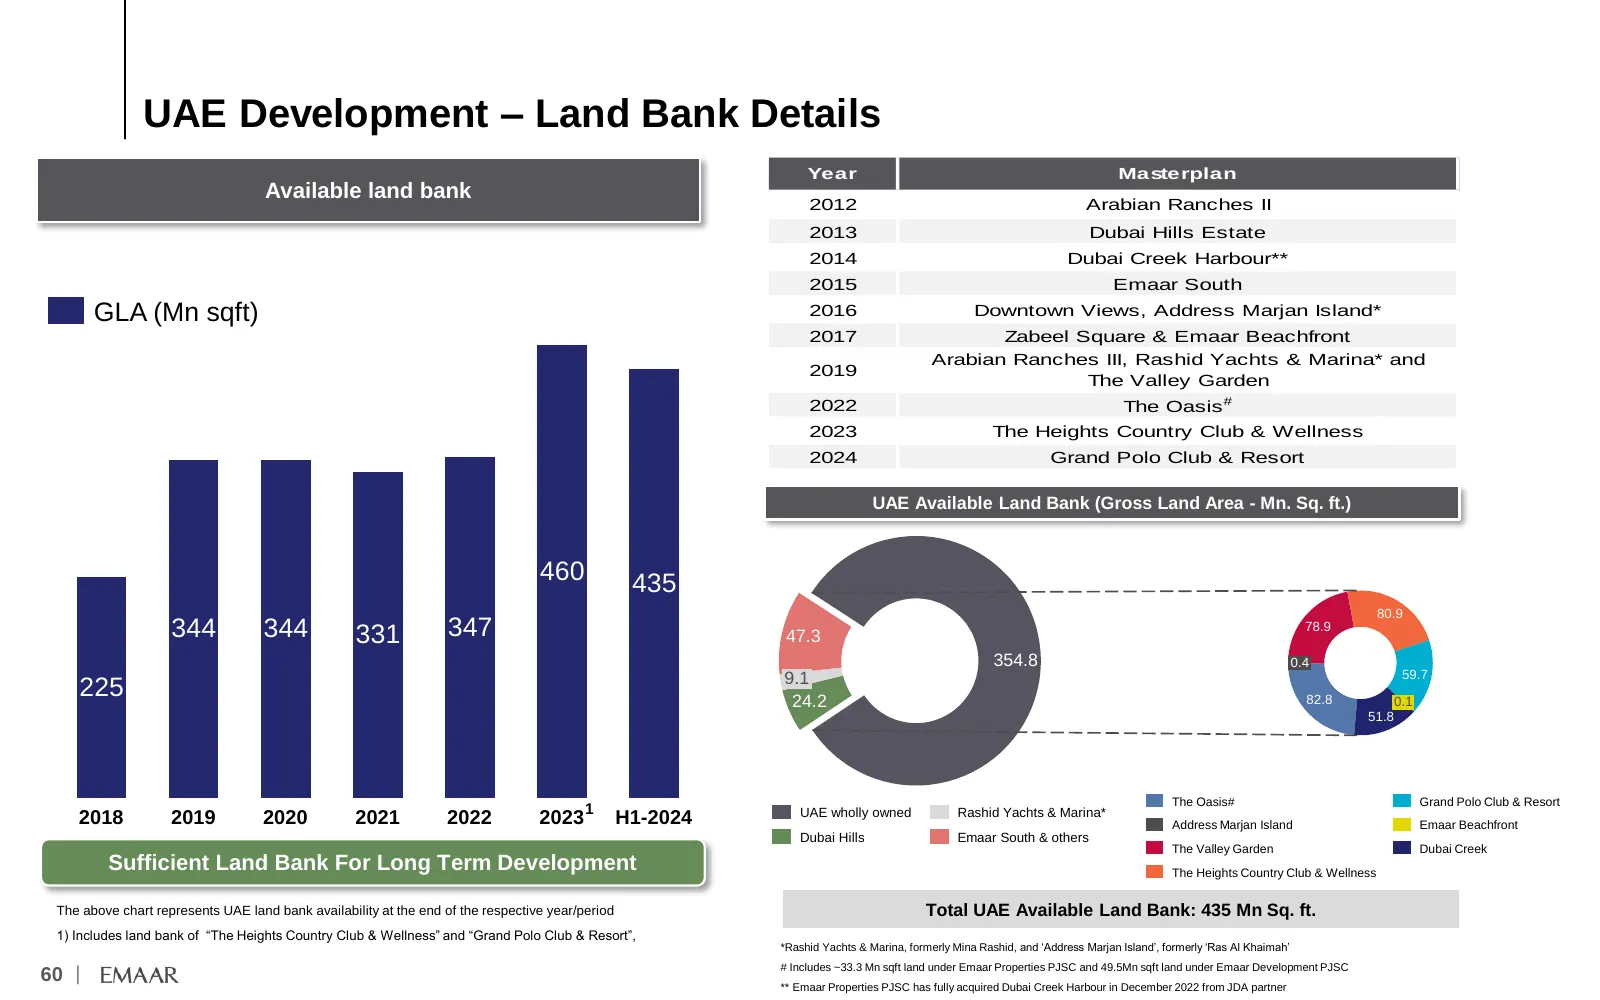
UAE Development – Land Bank Details Year Masterplan Available land bank 2012 Arabian Ranches II 2013 Dubai Hills Estate 2014 Dubai Creek Harbour** (million sq ft) 2015 Emaar South GLA (Mn sqft) 460 2016 Downtown Views, Address Marjan Island* 2017 Zabeel Square & Emaar Beachfront 435 Arabian Ranches
Slide 62: International Development – Expected Delivery Schedule
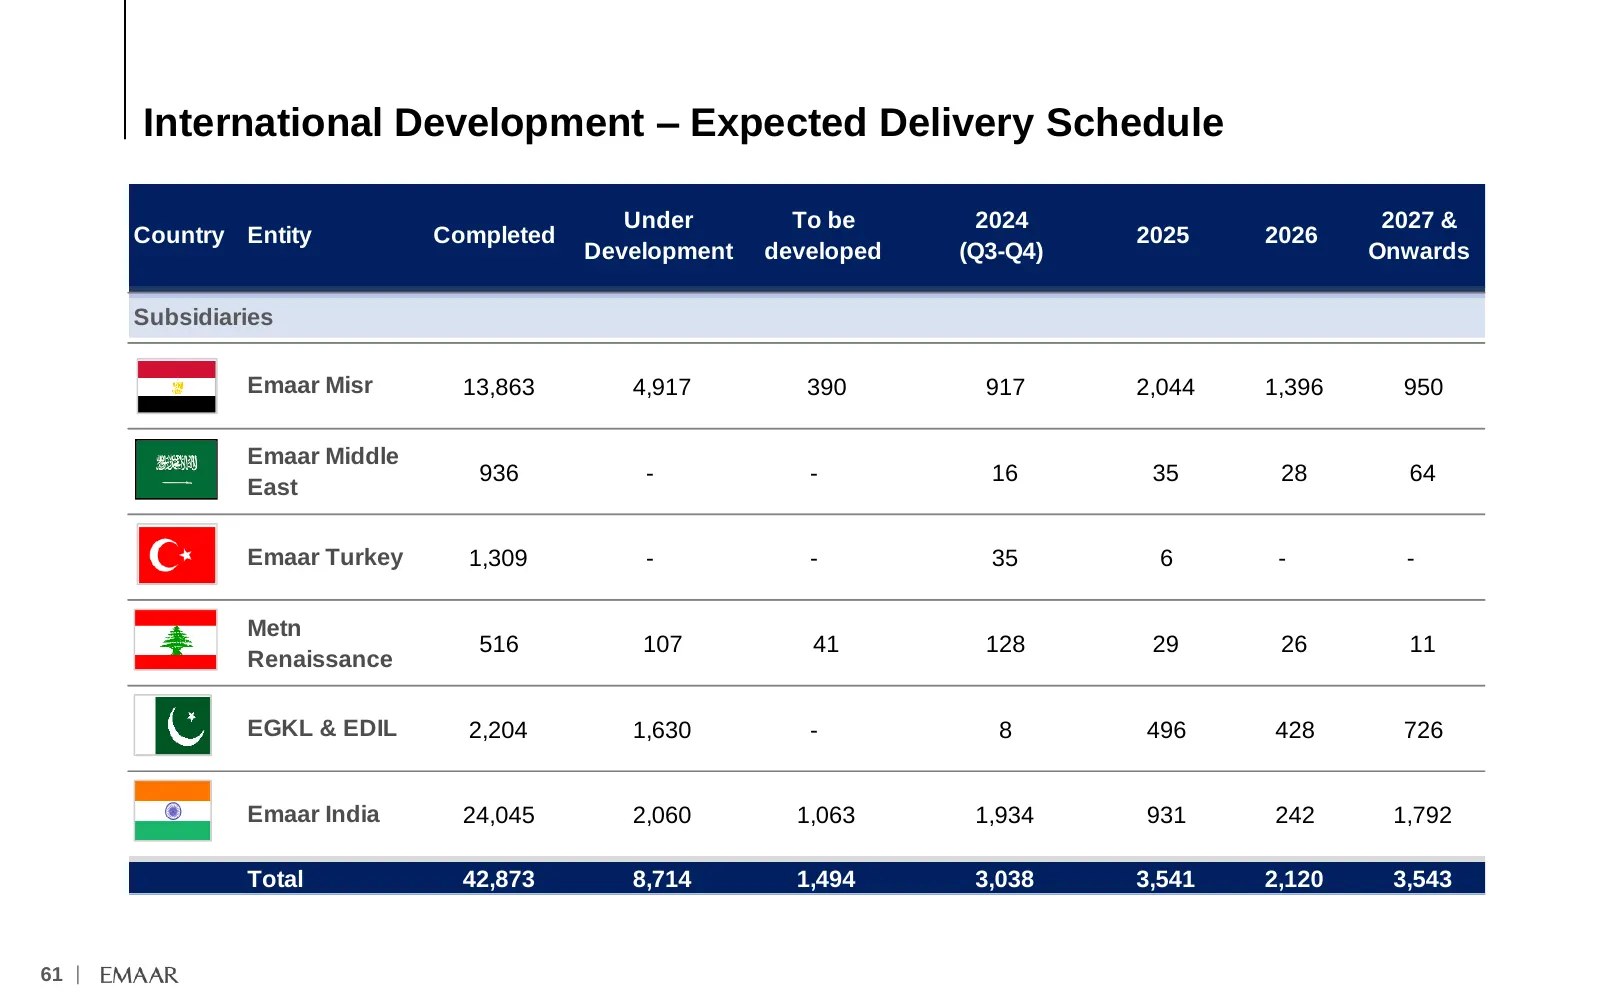
International Development – Expected Delivery Schedule Under To be 2024 2027 & Country Entity Completed 2025 2026 Development developed (Q3-Q4) Onwards Subsidiaries Emaar Misr 13,863 4,917 390 917 2,044 1,396 950 Emaar Middle 936 - - 16 35 28 64 East Emaar Turkey 1,309 - - 35 6 - - Metn 516 107 41 1
Slide 63: International Development – Land Bank Details (GLA)
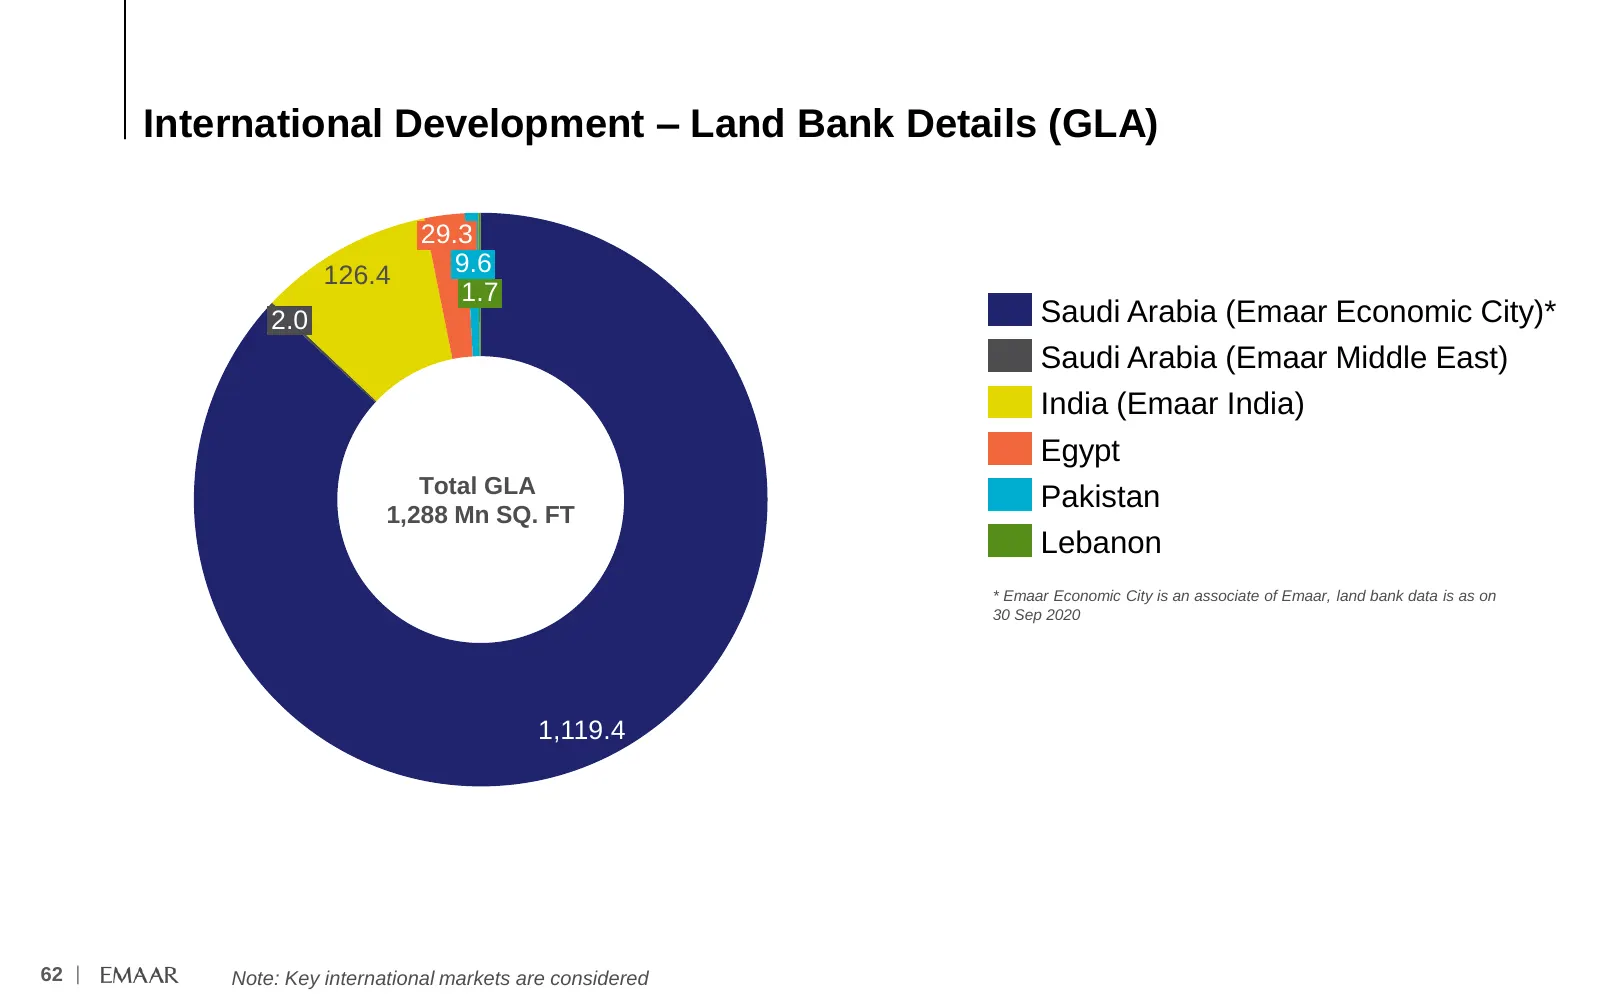
International Development – Land Bank Details (GLA) 29.3 126.4 9.6 1.7 2.0 Saudi Arabia (Emaar Economic City)* Saudi Arabia (Emaar Middle East) India (Emaar India) Egypt Total GLA Pakistan 1,288 Mn SQ. FT Lebanon * Emaar Economic City is an associate of Emaar, land bank data is as on 30 Sep 2020 1,1
Slide 64: JV Accounting Treatment
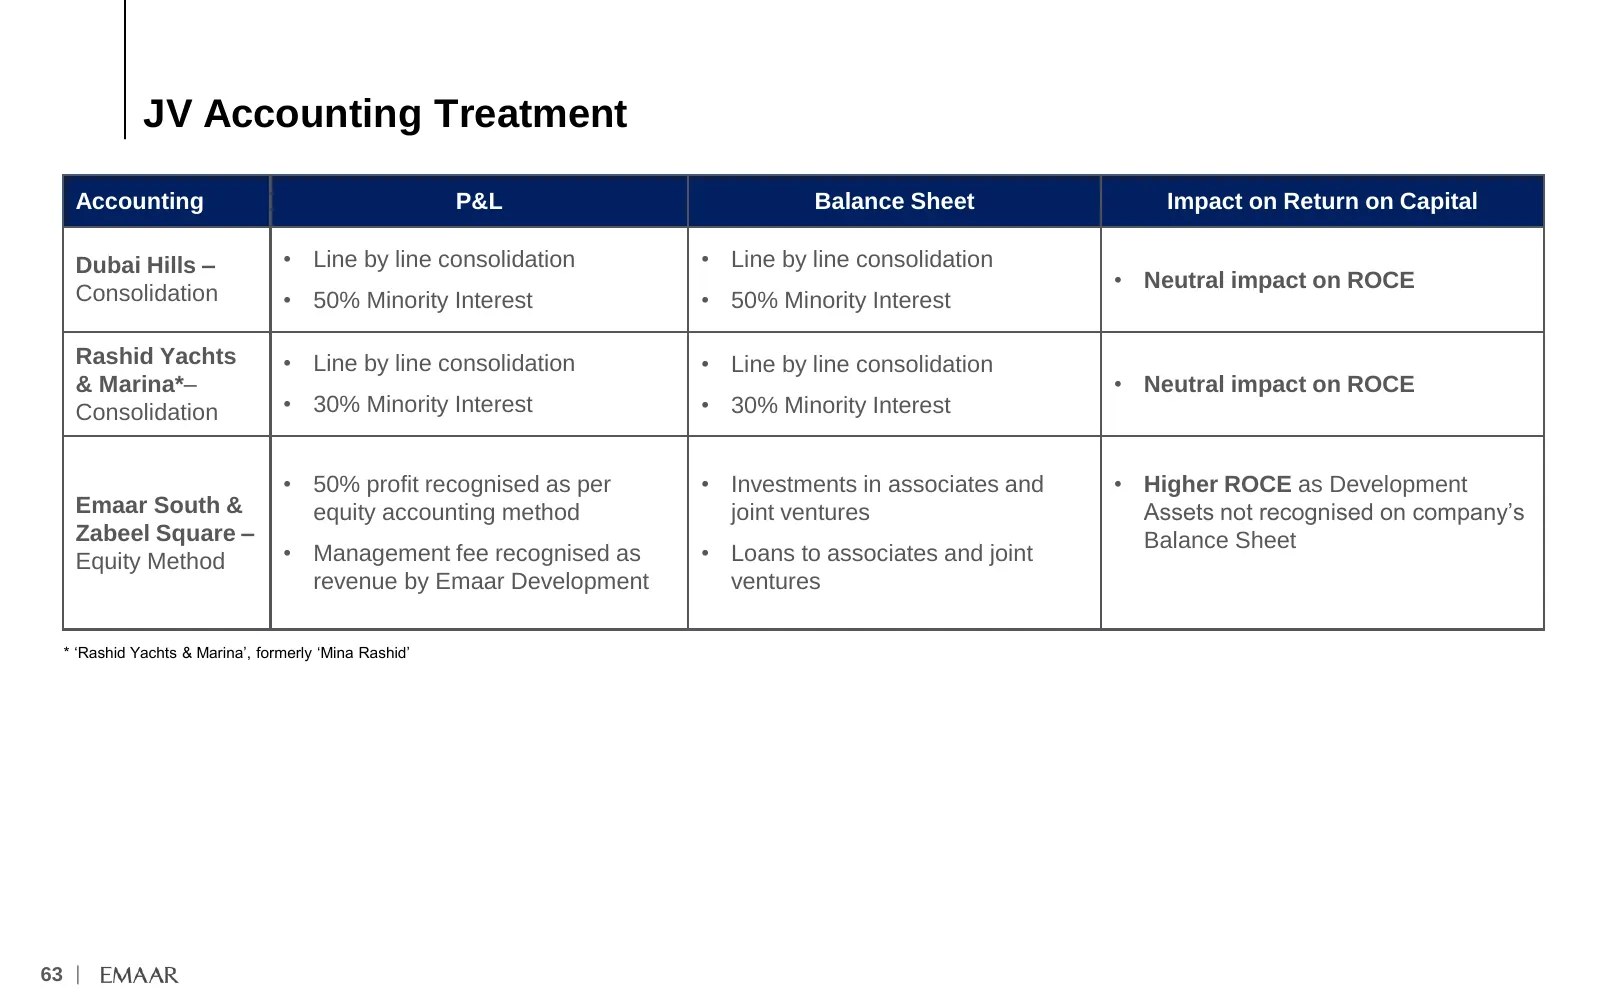
JV Accounting Treatment Accounting P&L Balance Sheet Impact on Return on Capital Dubai Hills – • Line by line consolidation • Line by line consolidation • Neutral impact on ROCE Consolidation • 50% Minority Interest • 50% Minority Interest Rashid Yachts • Line by line consolidation • Line by line co
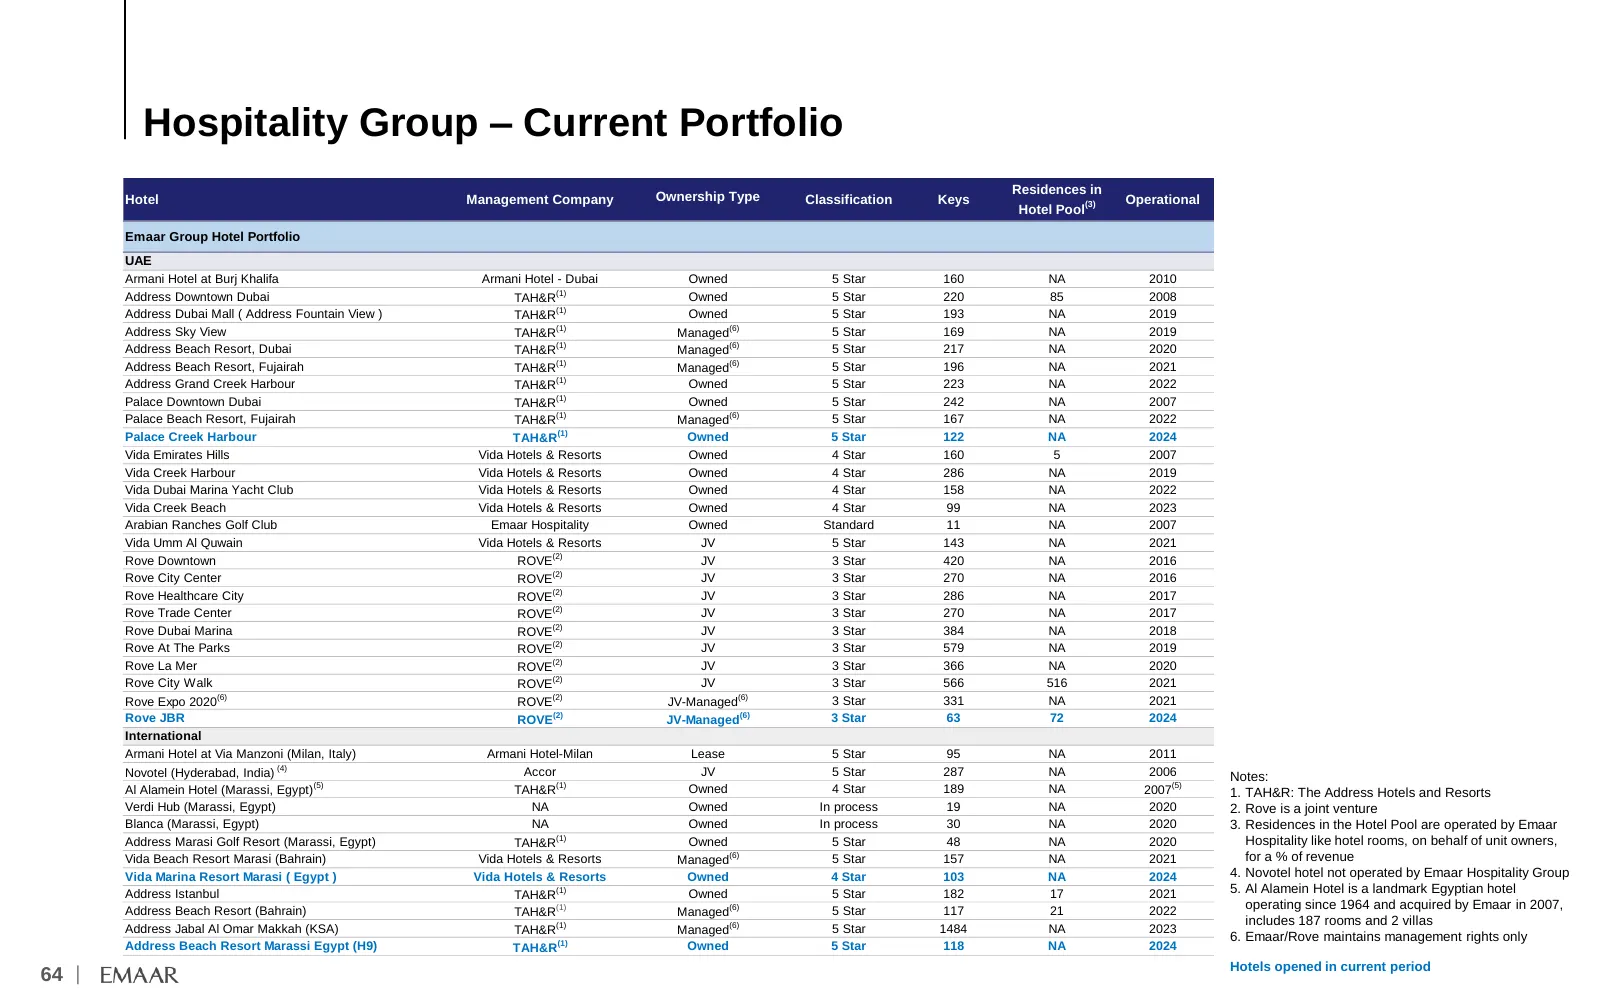
Slide 65: Hospitality Group – Current Portfolio
Hospitality Group – Current Portfolio Ownership Type Residences in Hotel Management Company Classification Keys Operational Hotel Pool(3) Emaar Group Hotel Portfolio UAE Armani Hotel at Burj Khalifa Armani Hotel - Dubai Owned 5 Star 160 NA 2010 Address Downtown Dubai TAH&R(1) Owned 5 Star 220 85 200
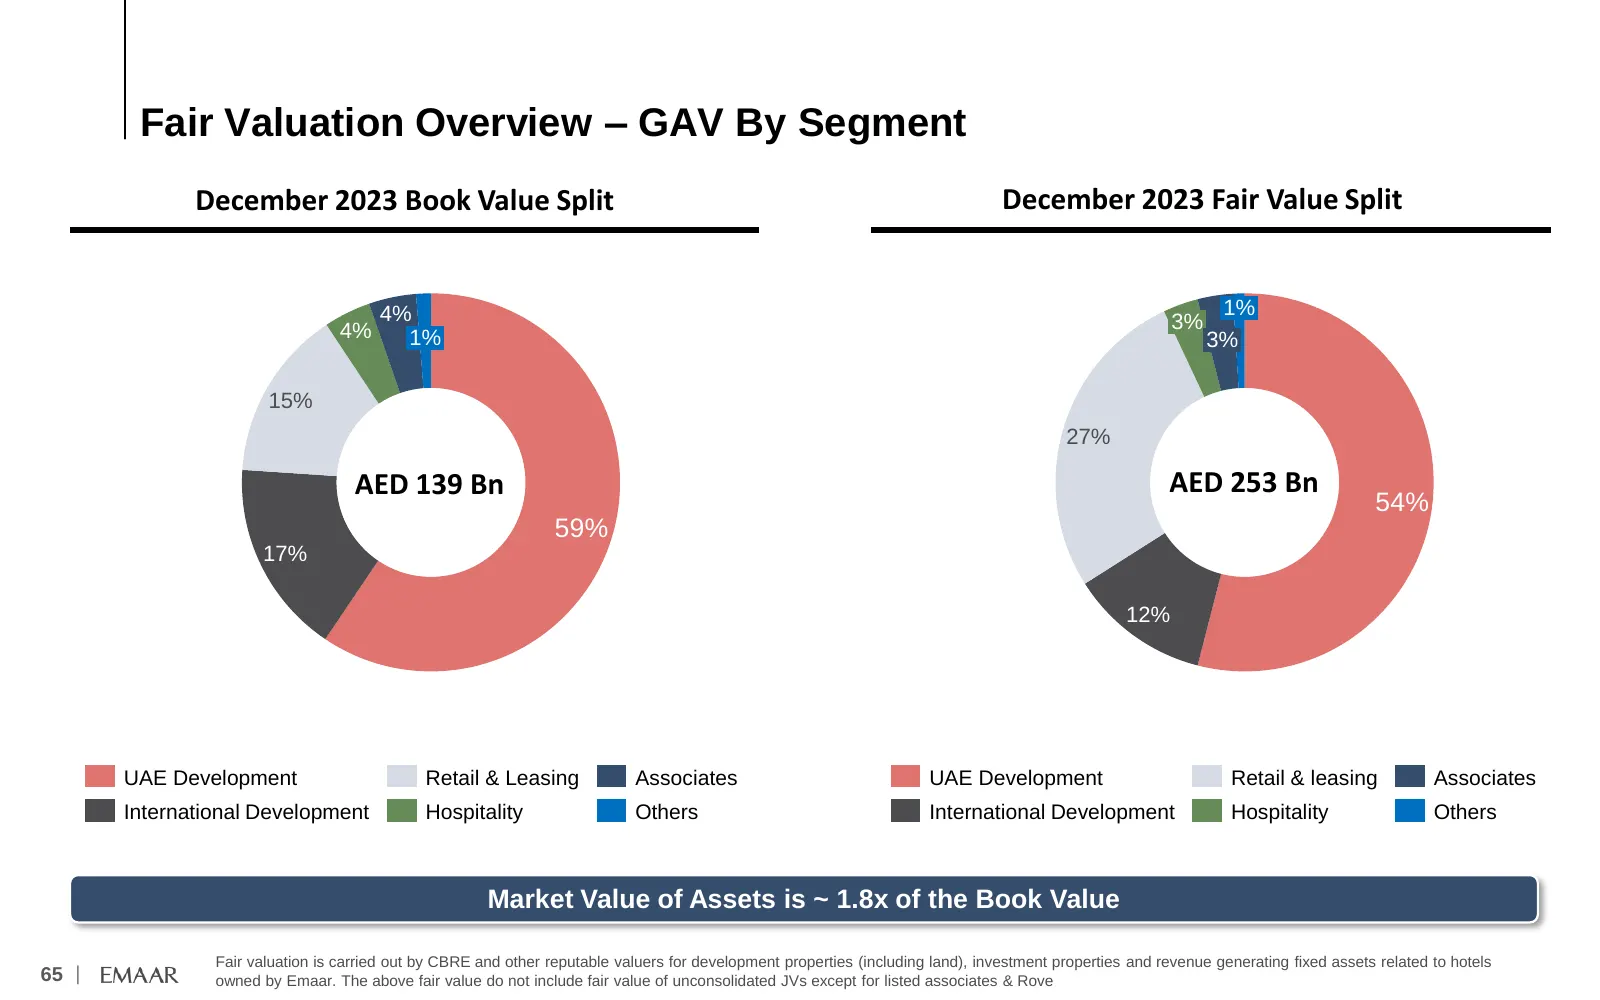
Slide 66: Fair Valuation Overview – GAV By Segment
Fair Valuation Overview – GAV By Segment December 2023 Book Value Split December 2023 Fair Value Split 4% 1% 4% 3% 1% 3% 15% 27% AED 139 Bn AED 253 Bn 54% 59% 17% 12% UAE Development Retail & Leasing Associates UAE Development Retail & leasing Associates International Development Hospitality Others
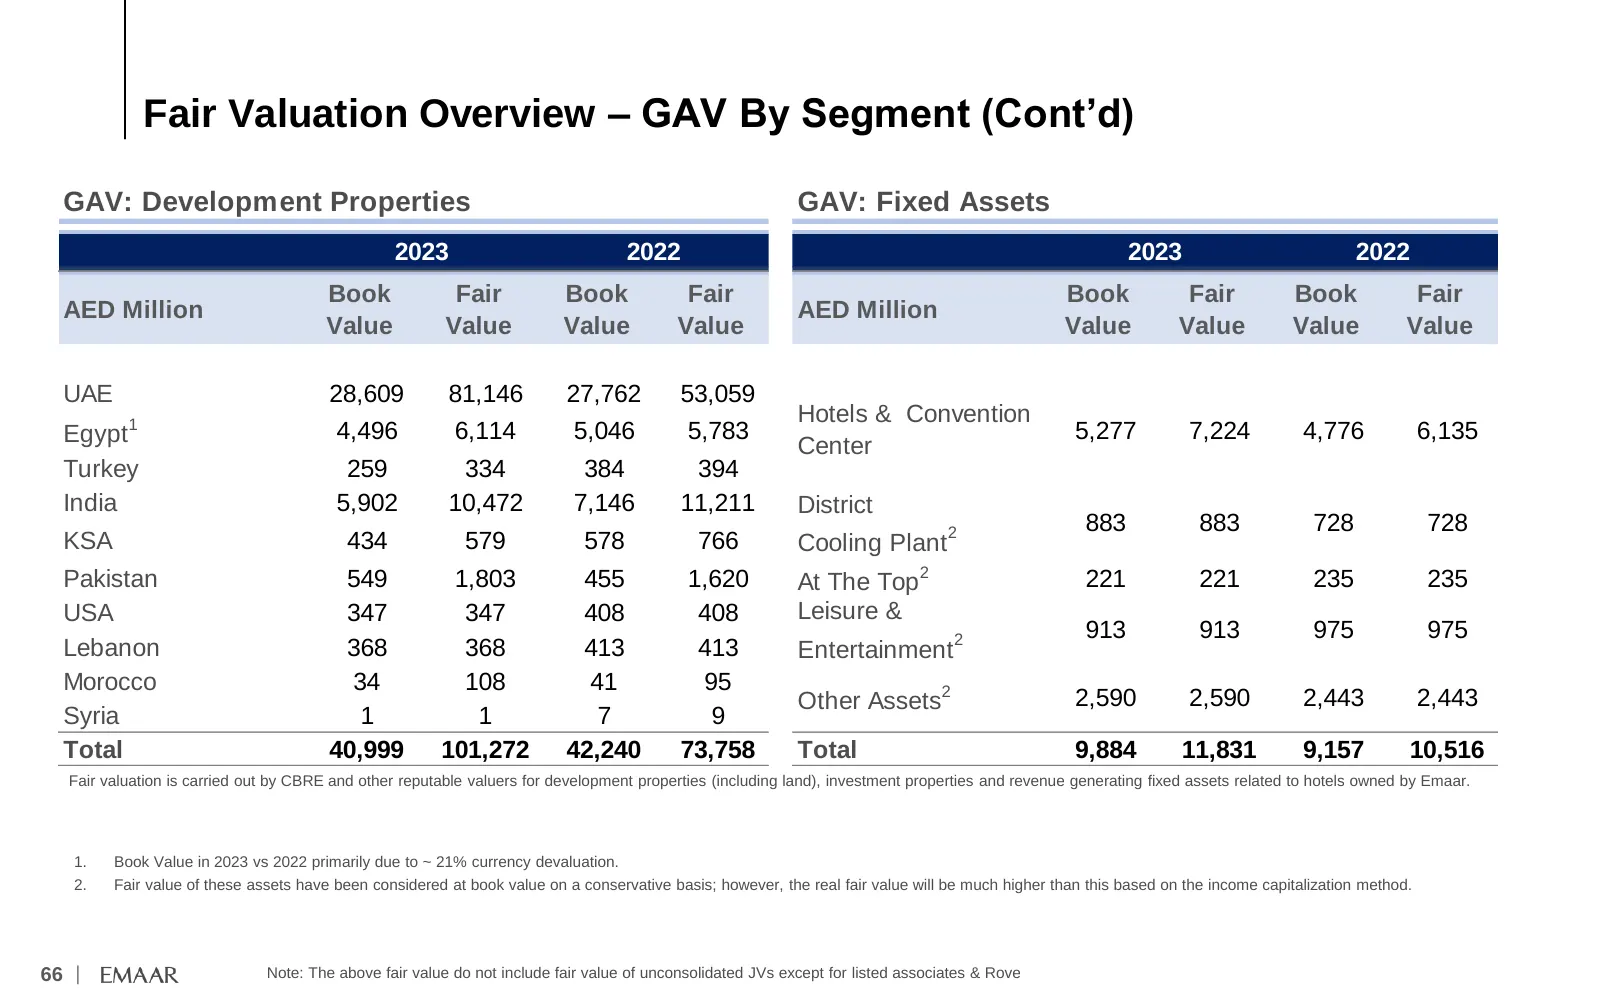
Slide 67: Fair Valuation Overview – GAV By Segment (Cont'd)
Fair Valuation Overview – GAV By Segment (Cont’d) GAV: Development Properties GAV: Fixed Assets 2023 2022 2023 2022 Book Fair Book Fair Book Fair Book Fair AED Million AED Million Value Value Value Value Value Value Value Value UAE 28,609 81,146 27,762 53,059 1 Hotels & Convention Egypt 4,496 6,114
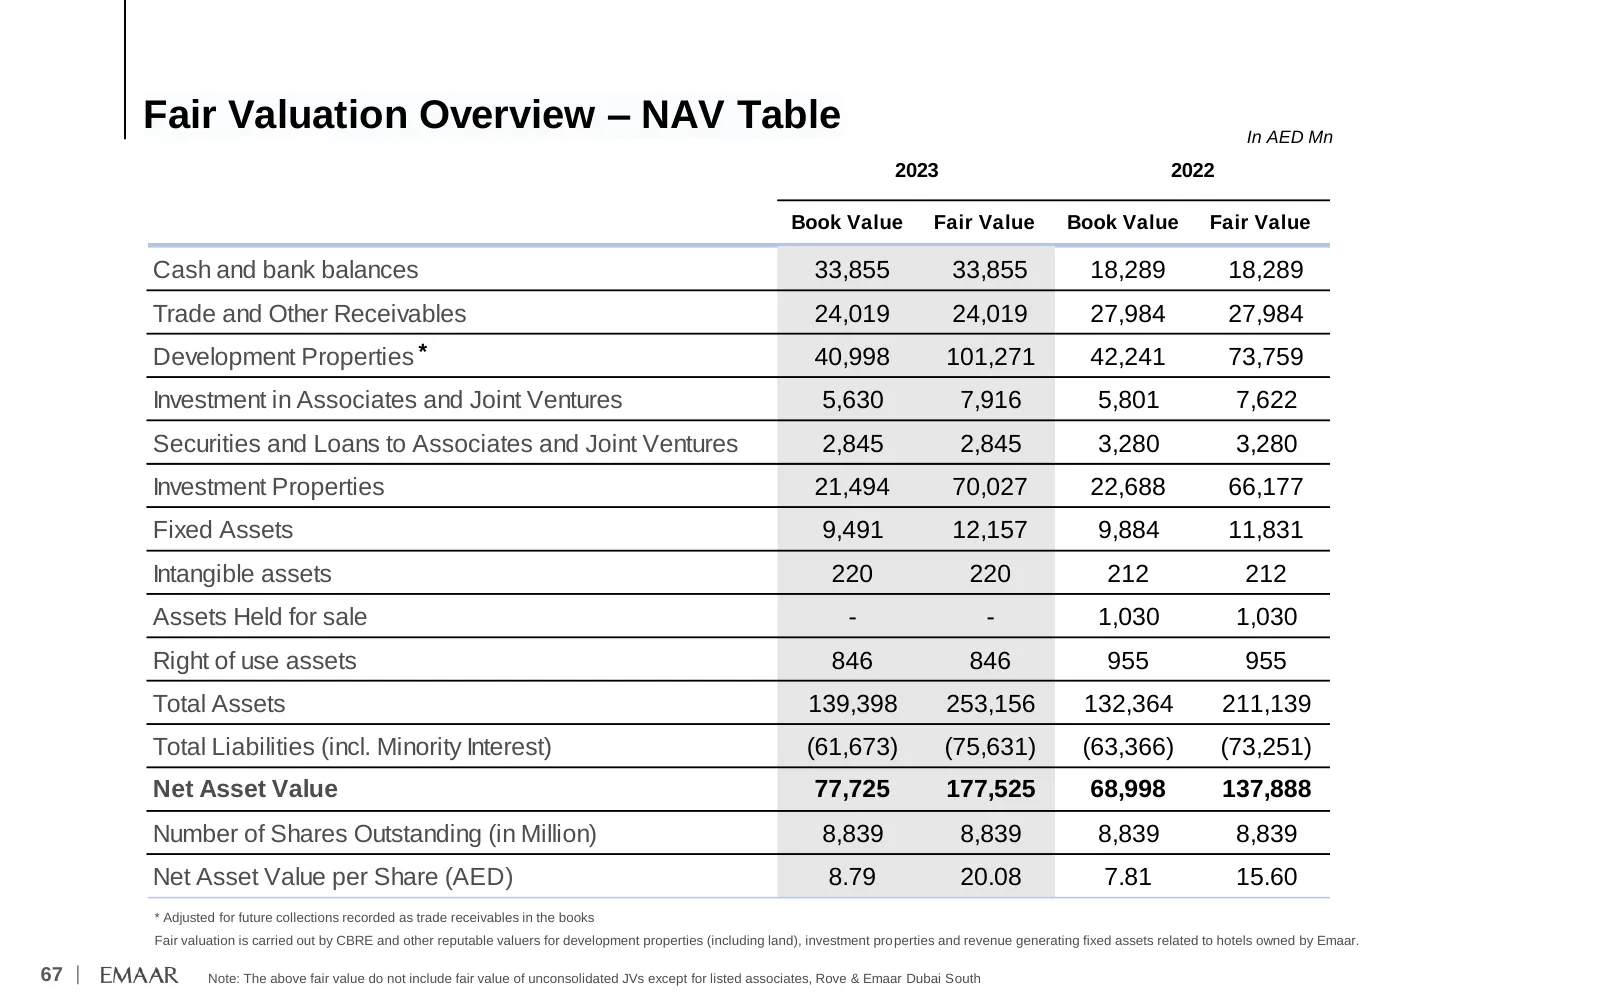
Slide 68: Fair Valuation Overview – NAV Table
Fair Valuation Overview – NAV Table In AED Mn 2023 2022 Book Value Fair Value Book Value Fair Value Cash and bank balances 33,855 33,855 18,289 18,289 Trade and Other Receivables 24,019 24,019 27,984 27,984 Development Properties * 40,998 101,271 42,241 73,759 Investment in Associates and Joint Vent
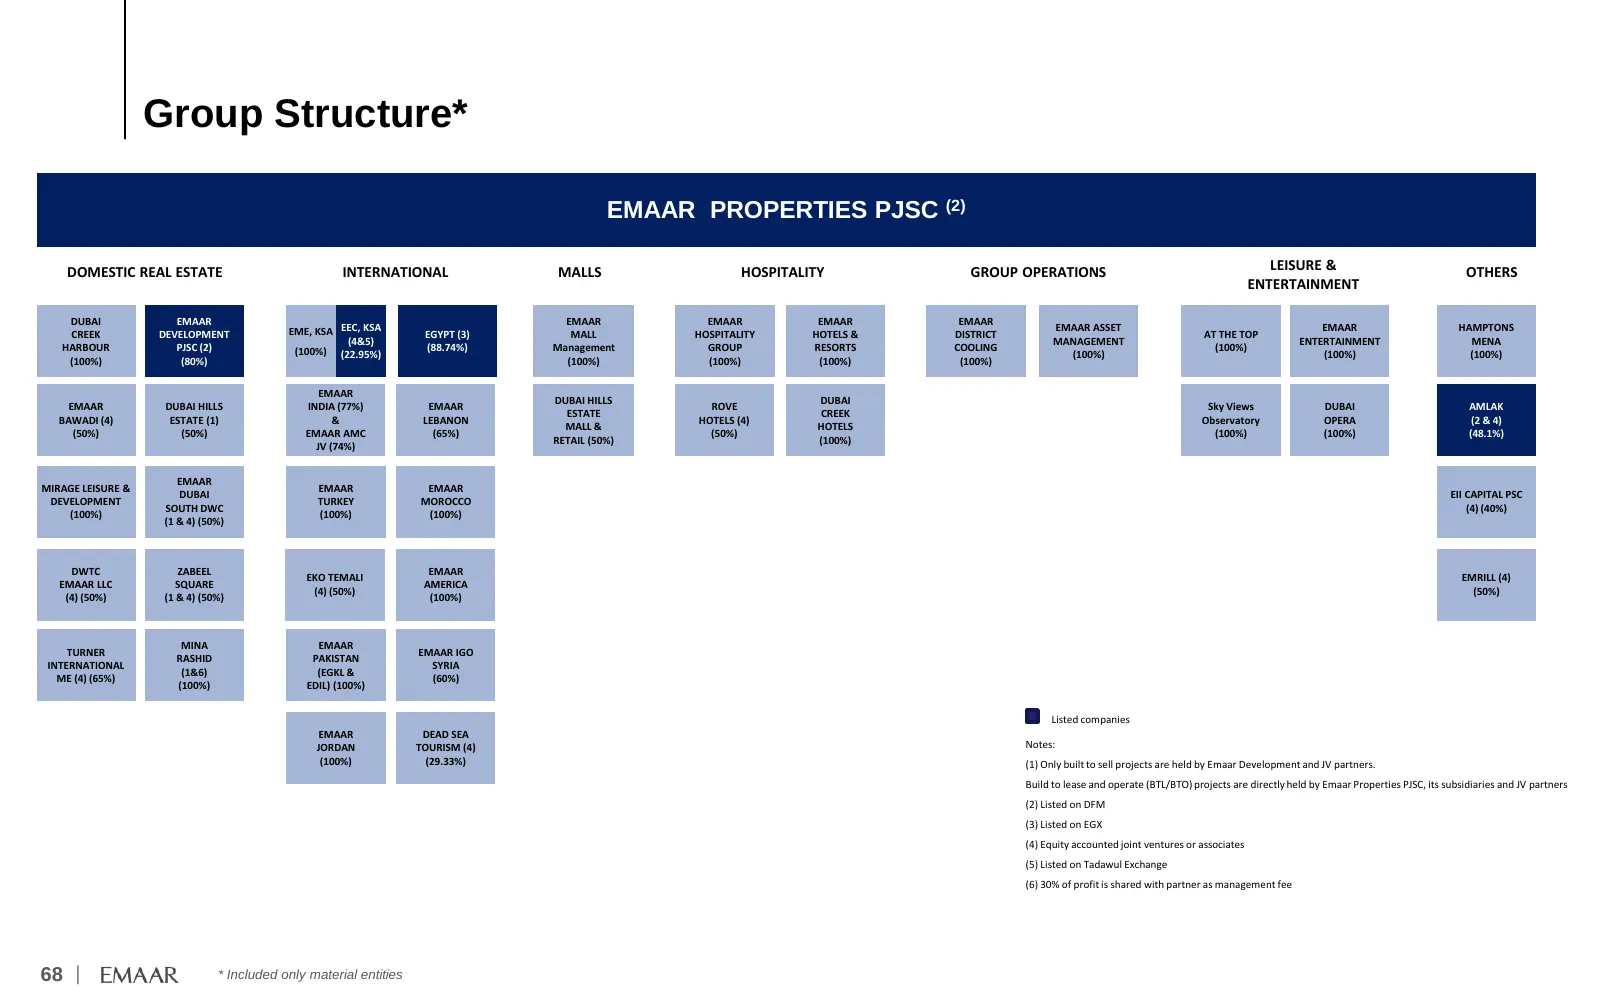
Slide 69: Group Structure
Group Structure* EMAAR PROPERTIES PJSC (2) DOMESTIC REAL ESTATE INTERNATIONAL MALLS HOSPITALITY GROUP OPERATIONS LEISURE & OTHERS ENTERTAINMENT DUBAI EMAAR EMAAR EMAAR EMAAR EMAAR CREEK DEVELOPMENT EME, KSA EEC, KSA EGYPT (3) MALL HOSPITALITY HOTELS & DISTRICT EMAAR ASSET AT THE TOP EMAAR HAMPTONS (
Slide 70: Thank You
Thank You EMAAR PROPERTIES Name – Abhay Singhvi Email ID - ASinghvi@emaar.ae, investor-relations@emaar.ae 69 |
Source: Internet Archive copy of propdubaidc.emaar.com
More decks from Emaar Properties (P.J.S.C)
 H1 2026 Earnings Presentation78 slides · 2026
 Emaar Properties — 9M 2025 Earnings Presentation69 slides · November 2025
 H1 2025 Earnings Presentation69 slides · August 2025
 Emaar Properties — Q1 2025 Earnings Presentation68 slides · May 2025
 Emaar Properties — FY2025 Earnings Presentation71 slides · May 2025
 FY2024 Earnings Presentation70 slides · Feb 24, 2025