Boston Private Financial Holdings Inc
Boston Private Financial — Q1 2003 Earnings Presentation
18 slides from Boston Private Financial's earnings presentation, Apr 24, 2003
Slide 1: Forward Looking Statements
Forward Looking Statements Statements in this presentation that are not historical facts are forward-looking statements within the meaning of the Private Securities Litigation Reform Act of 1995 that involve risks and uncertainties. These ‘statements included, but are not limited fo, statements unde
Slide 2: 1998 1999 2000 2001 2002 Qi1- |
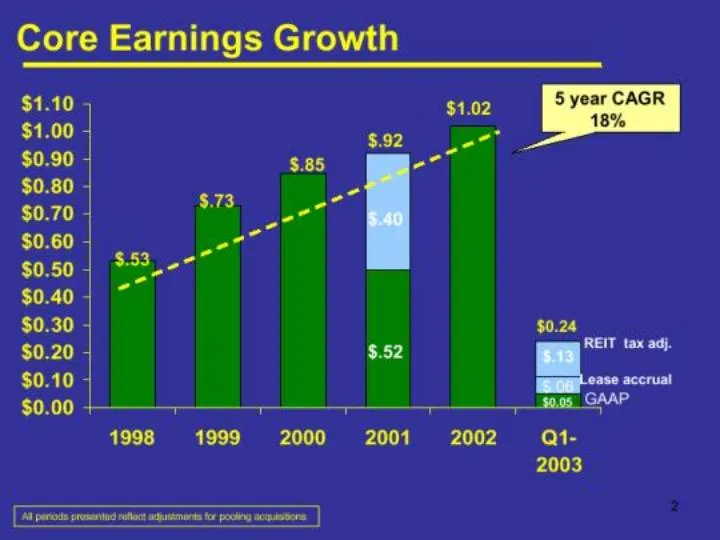
1998 1999 2000 2001 2002 Qi1- |
Slide 3: A g E Po
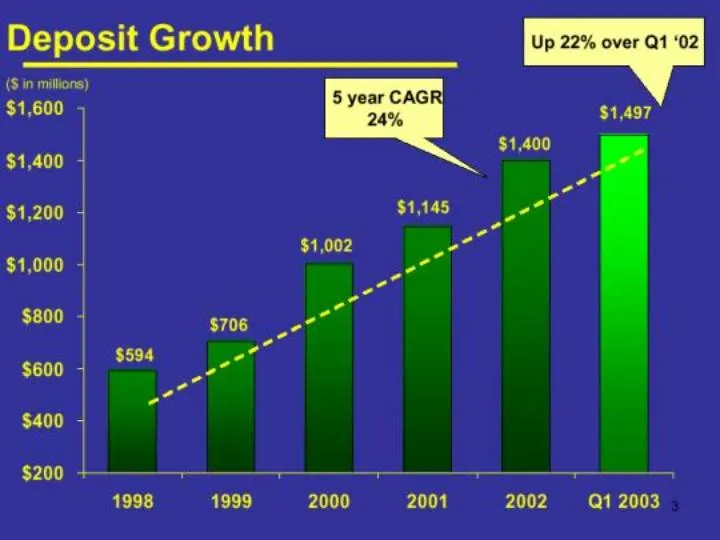
A g E Po
Slide 4: Loan Growth
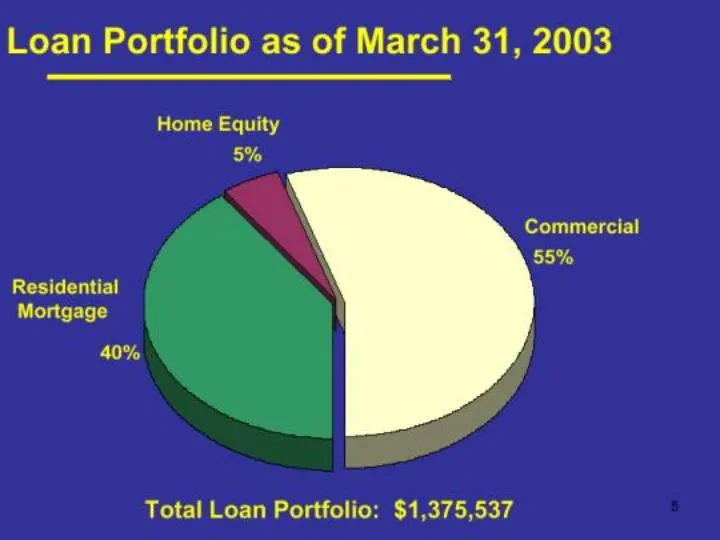
Slide 5: Loan Portfolio as of March 31, 2003
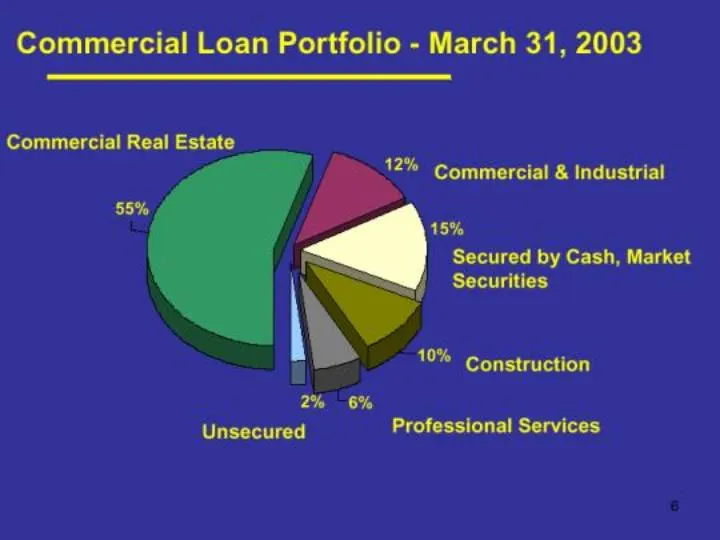
Slide 6: Commercial Loan Portfolio - March 31, 2003
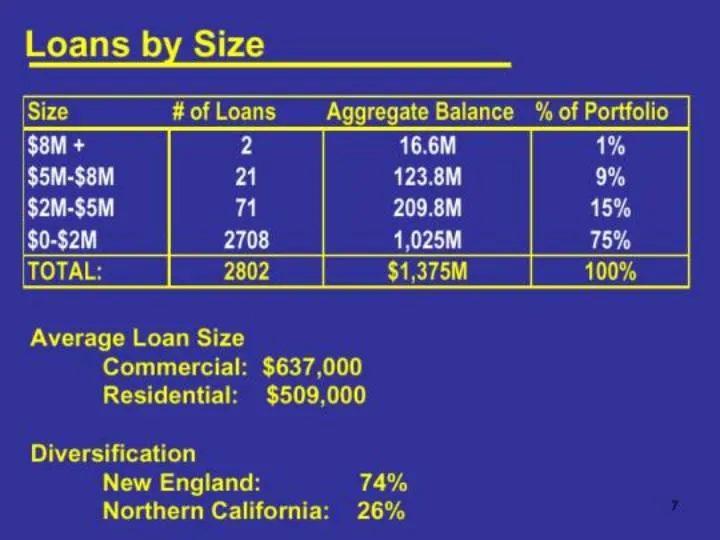
Slide 7: Loans by Size
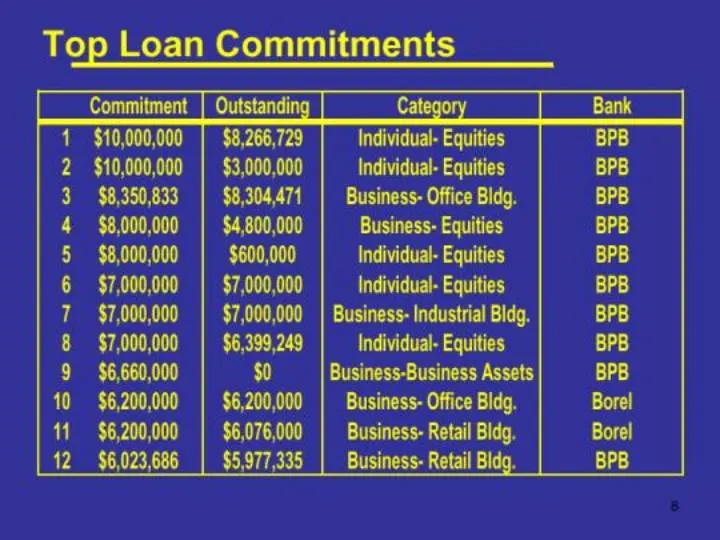
Slide 8: anal
anal NowtMerneaoera
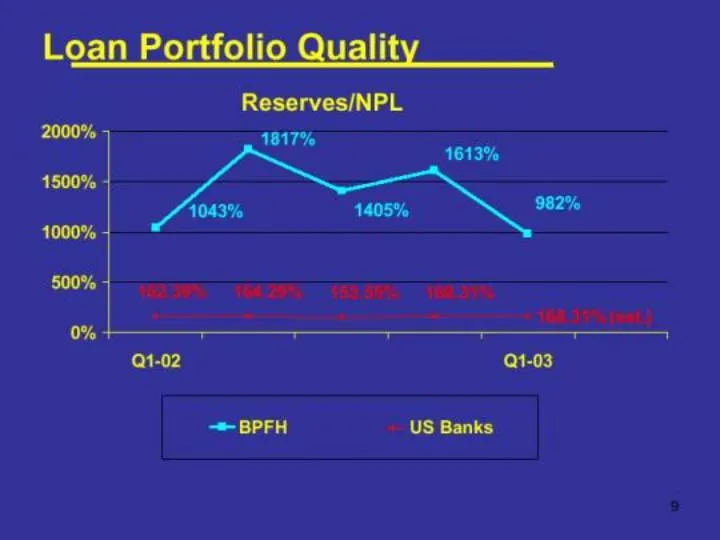
Slide 9: Loan Portfolio Quality
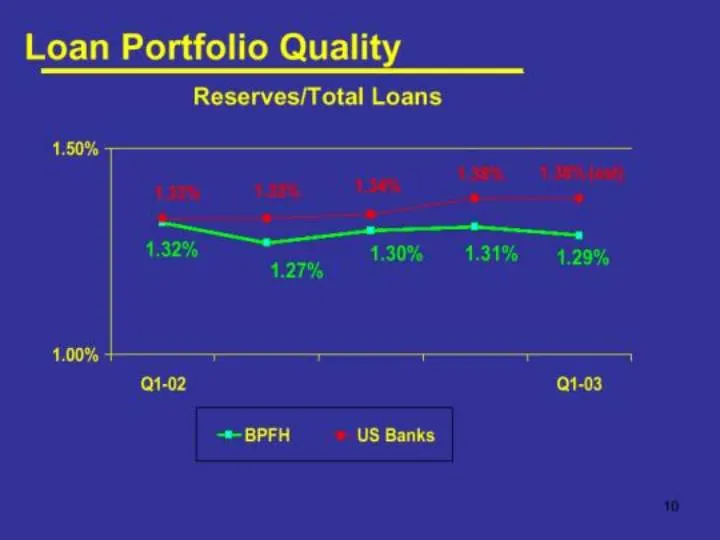
Slide 10: Loan Portfolio Quality
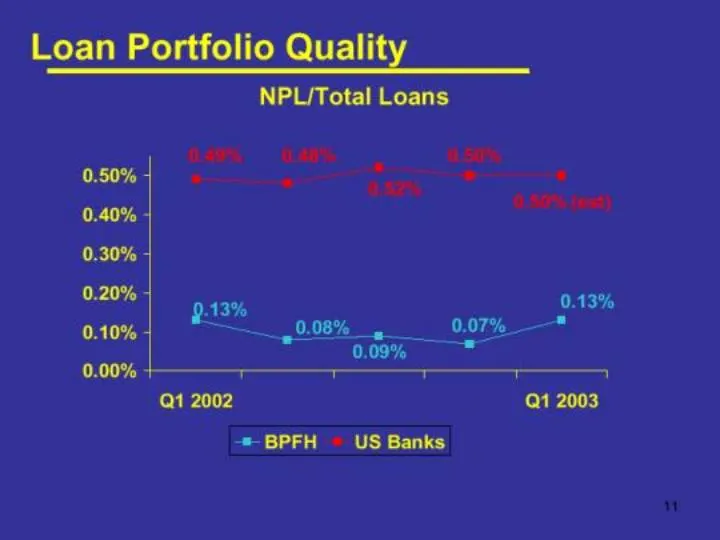
Slide 11: “4
“4
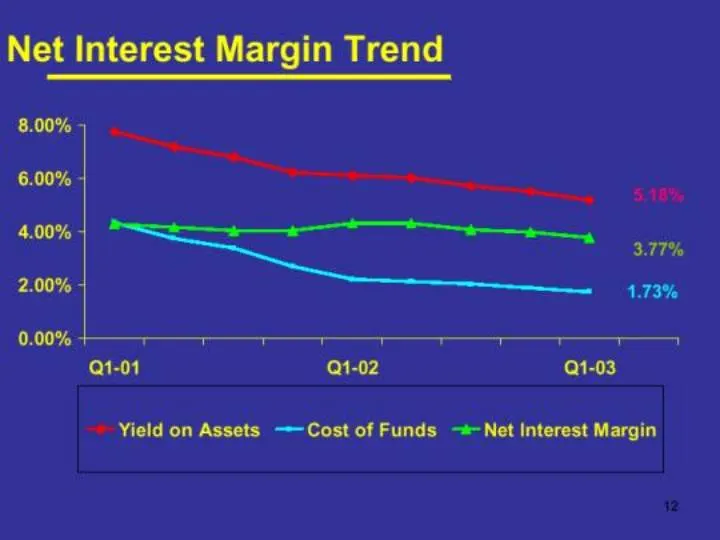
Slide 12: pie
pie 12
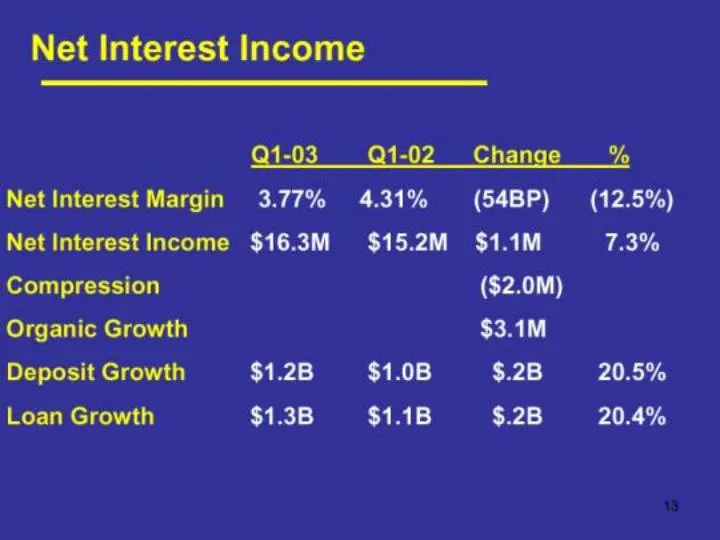
Slide 13: Net Interest Income
Net Interest Income Q1-03__Q1-02__ Change __% Net Interest Margin 3.77% 4.31% (54BP) (12.5%) Net Interest Income $16.3M $15.2M $1.1M 7.3% Compression ($2.0M) Organic Growth $3.1M Deposit Growth $1.2B = $1.0B $.2B 20.5% Loan Growth $1.3B $1.1B $.2B 20.4% 13
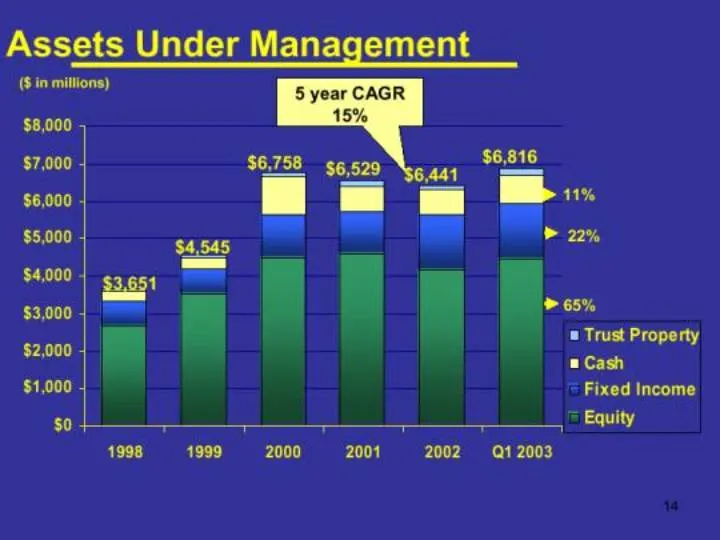
Slide 14: 14
14
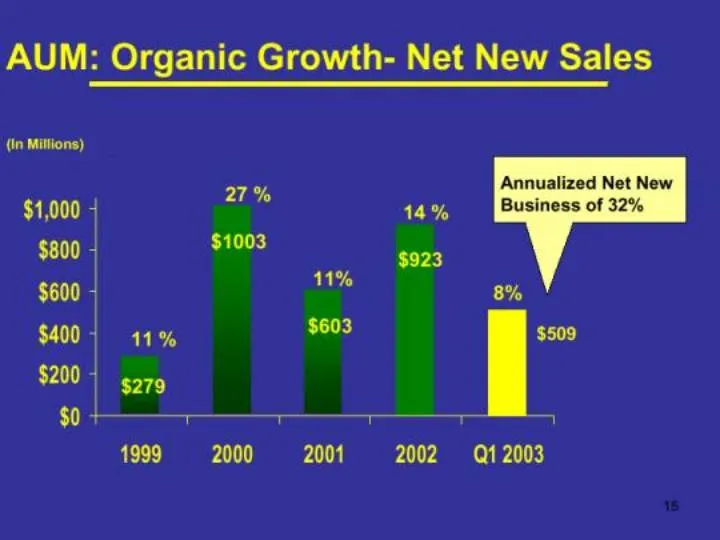
Slide 15: AUM: Organic Growth - Net New Sales
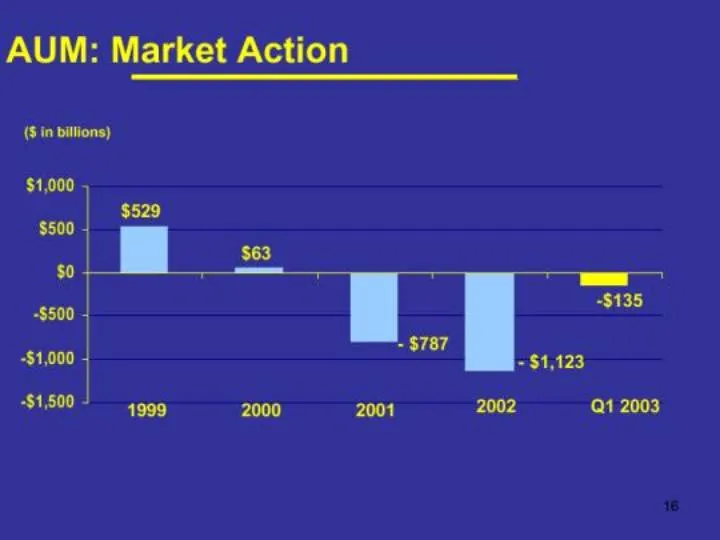
Slide 16: AUM: Market Action
AUM: Market Action (S in billions) $1,000 1999 2000
Slide 17: Q1 2003 Expenses vs. Q1 2002
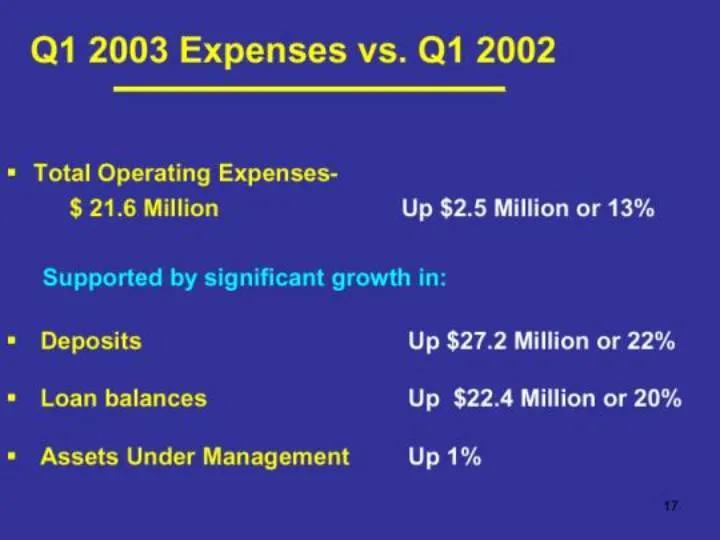
Q1 2003 Expenses vs. Q1 2002 $ 21.6 Million Up $2.5 Million or 13% Supported by significant growth in: Deposits Up $27.2 Million or 22% Loan balances Up $22.4 Million or 20% Assets Under Management Up1% 7
Slide 18: Searchable text section of document
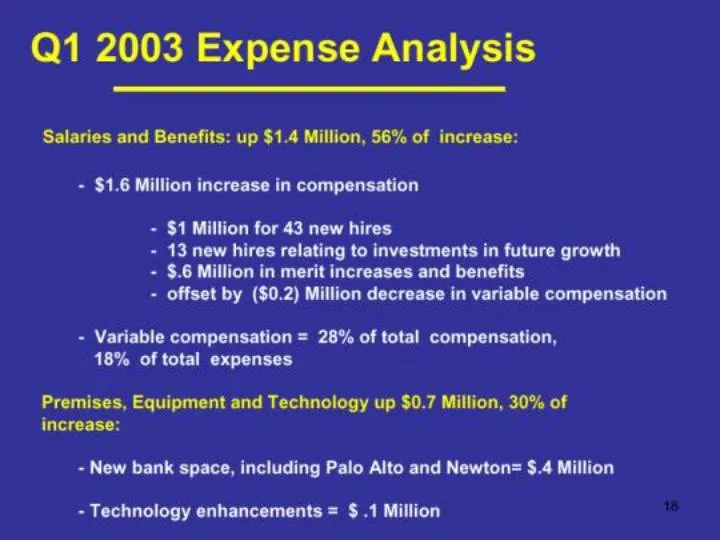
Searchable text section of document Forward Looking Statements Statements in this presentation that are not historical facts are forward-looking statements within the meaning of the Private Securities Litigation Reform Act of 1995 that involve risks and uncertainties. These statements included, but
Source: SEC EDGAR · 8-K filed Apr 24, 2003
More decks from Boston Private Financial Holdings Inc
 Proxy Contest (April 2021)28 slides · Apr 9, 2021
 Merger or Acquisition (April 2021)24 slides · Apr 7, 2021
 Proxy Contest (March 2021)50 slides · Mar 30, 2021
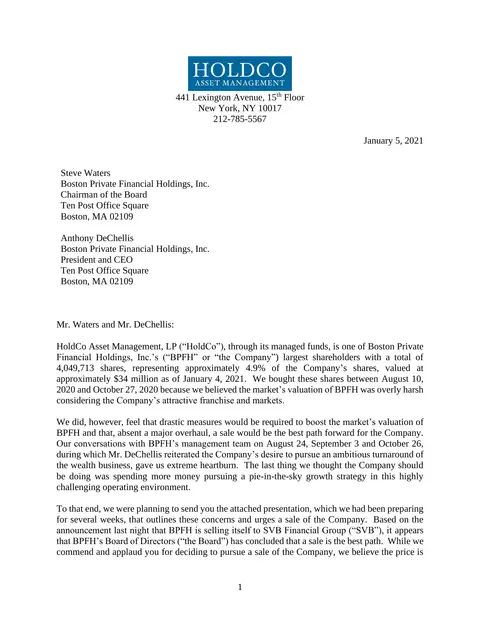 Proxy Contest (February 2021)67 slides · Feb 2, 2021
 Merger or Acquisition (January 2021)15 slides · Jan 4, 2021
 Investor Day (May 2019)52 slides · May 6, 2019