Adept Technology — Investor Presentation (December 2013)
13 slides from Adept Technology's investor presentation, Dec 9, 2013
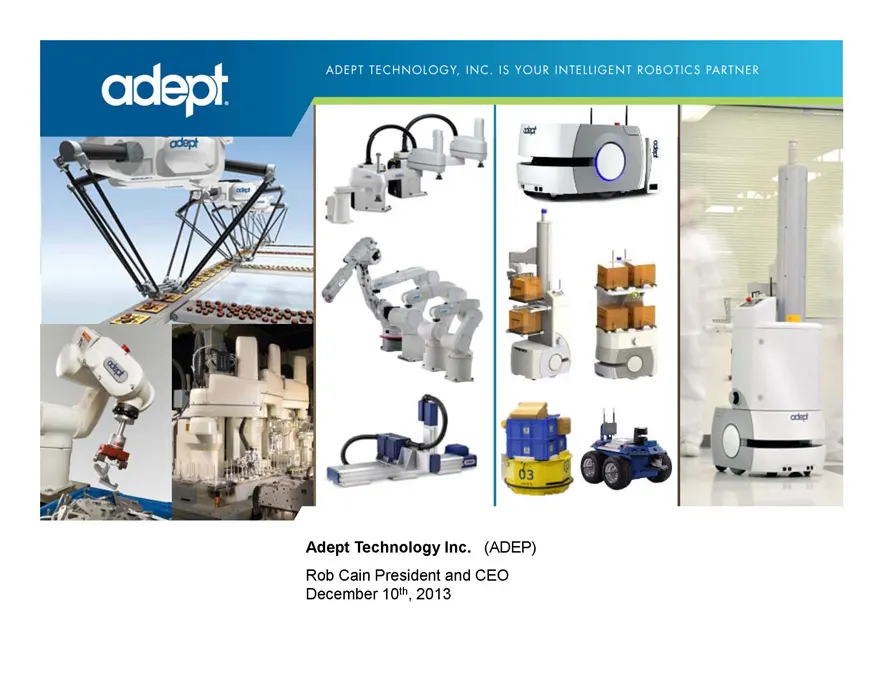
Slide 1: Adept Technology Inc. (ADEP)
Adept Technology Inc. (ADEP) Rob Cain President and CEO December 10", 2013
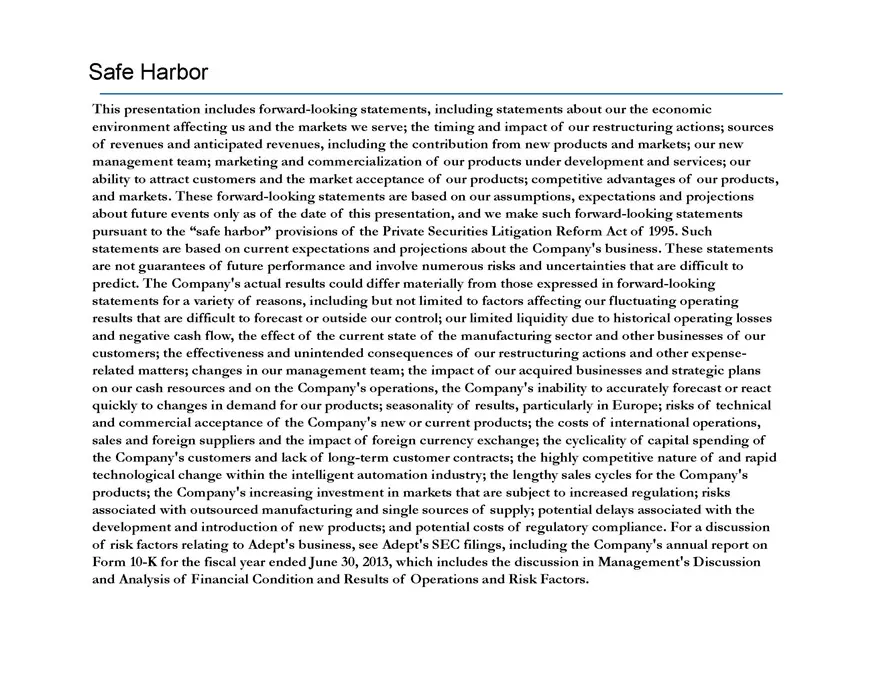
Slide 2: Safe Harbor
Safe Harbor This p ion includes forward-looking Jing st about our the economic environment affecting us and the markets we serve; the timing and impact of our restructuring actions; sources of revenues and anticipated revenues, including the contribution from new products and markets; our new manage
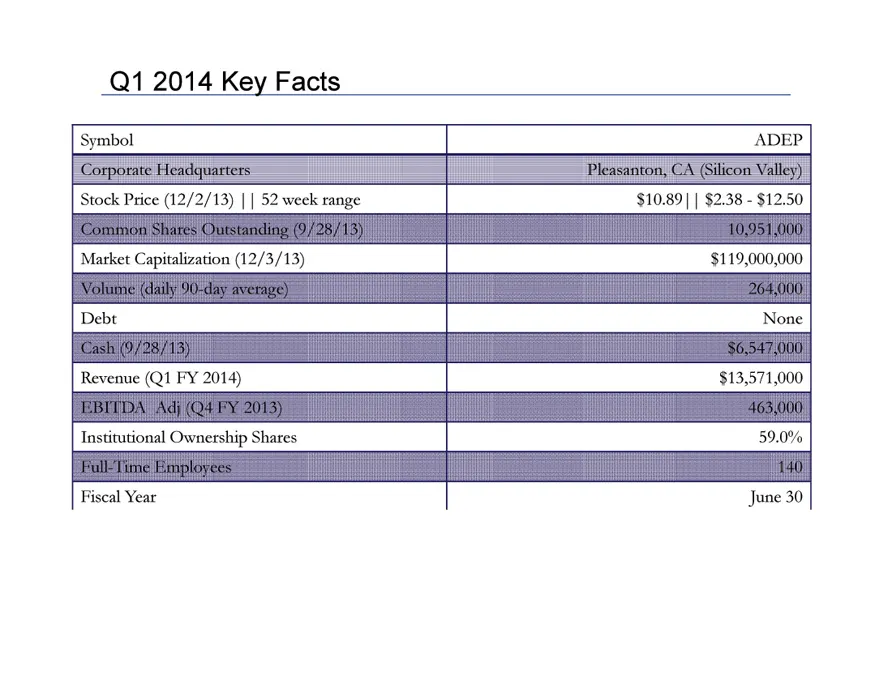
Slide 3: Q1 2014 Key Facts
Q1 2014 Key Facts Symbol ‘ADEP. Stock Price (12/2/13) | | 52 week range $10.89 | | $2.38 - $12.50 Market Capitalization (12/3/13) $119,000,000 [Dee None Revenue (Q1 FY 2014) $13,571,000 Tso Overt Shar Fiscal Year June 30
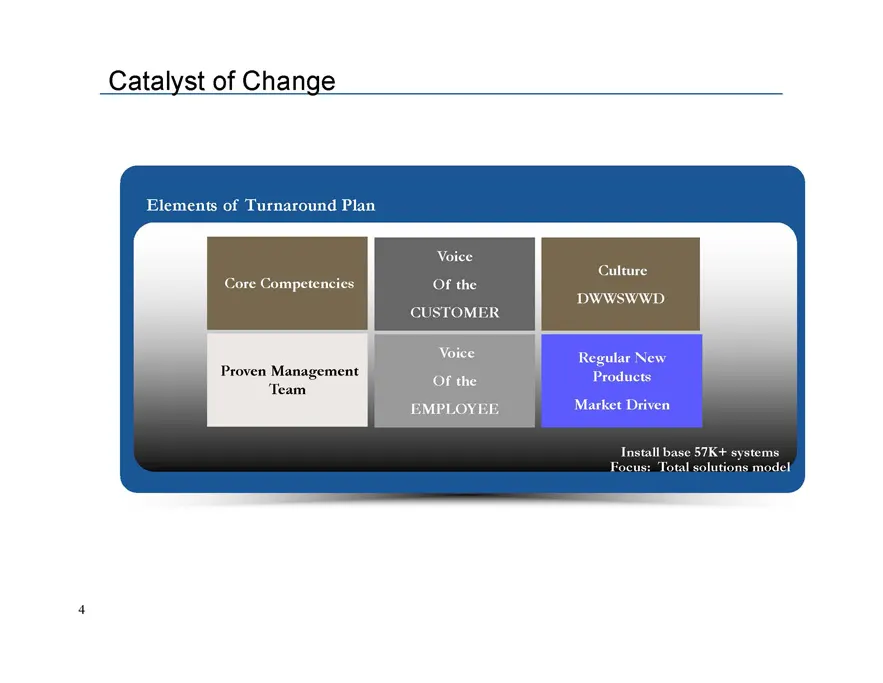
Slide 4: Catalyst of Change
Catalyst of Change Elements of Turnaround Plan Voice Core Competencies Of the ISTOMER Voice Proven Management ‘Team Of the EMPLOYEE, Culture DWWsWwD
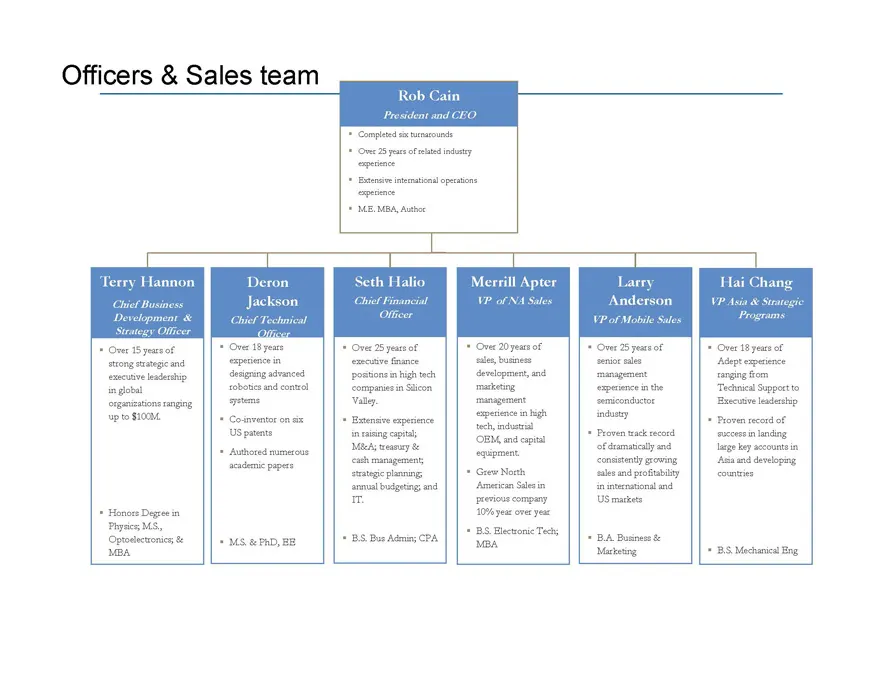
Slide 5: Officers & Sales team
Officers & Sales team Terry Hannon Hai Chang VP Asin & Strate
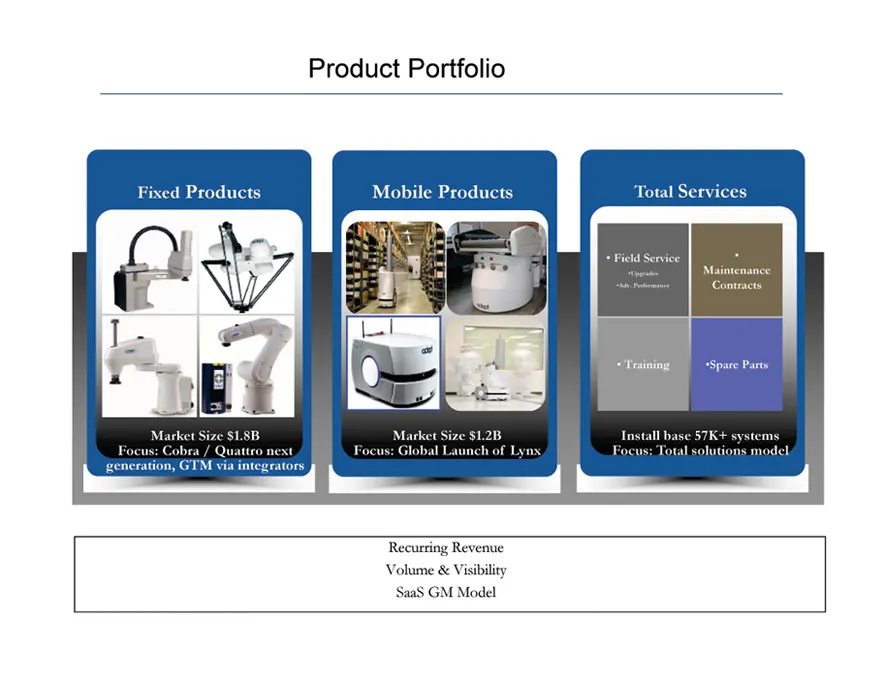
Slide 6: Product Portfolio
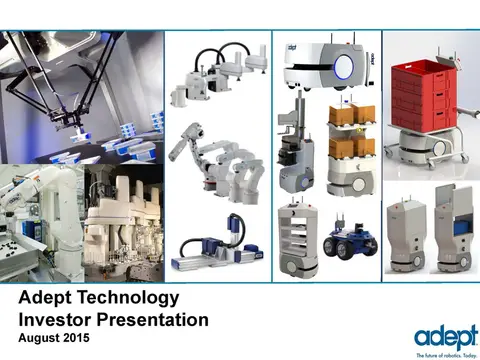
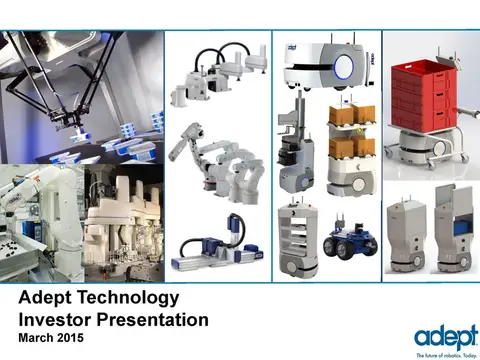
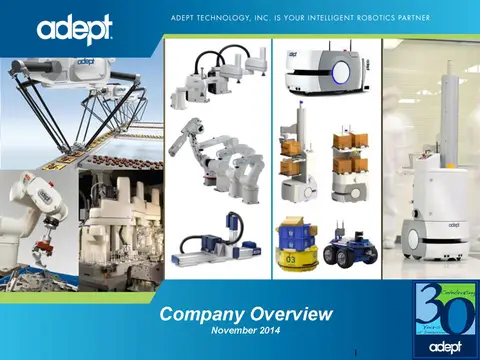
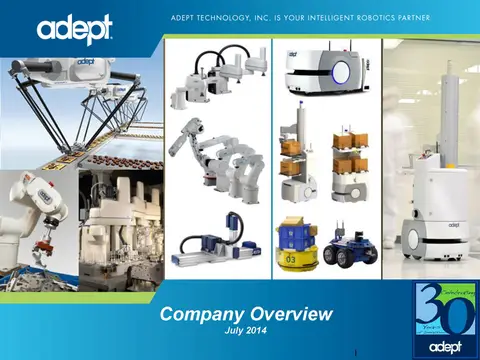
Product Portfolio Fixed Products Mobile Products Total Servi Maintenance Contracts “Training “Spare Parts Install base 57K+ systems Focus; Total solutions model Recurring Revenue Volume & V SaaS G?
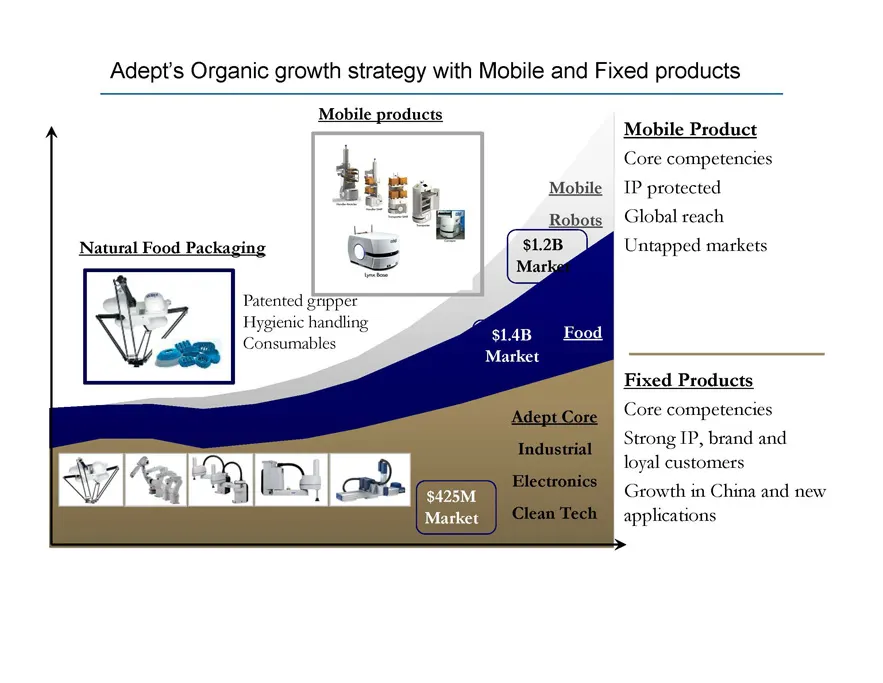
Slide 7: Adept's Organic growth strategy with Mobile and Fixed products
Adept's Organic growth strategy with Mobile and Fixed products tig a Mobile Product Core competencies IP protected Global reach Untapped markets Patented gripper Hygienic handling, Consumables. $14B Food Market Fixed Products Core competencies Strong IP, brand and loyal customers. Onn $425M Growth i
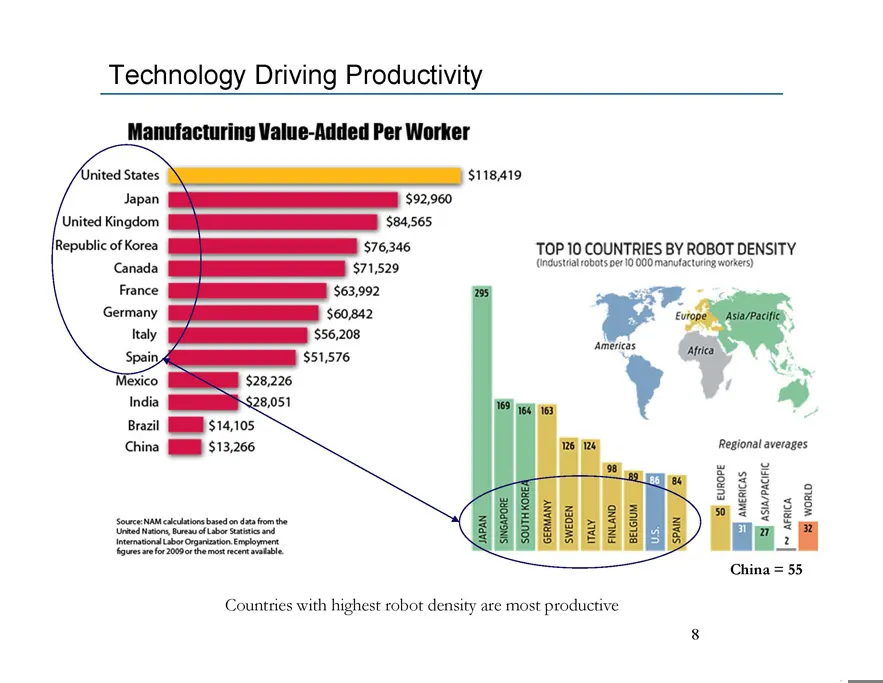
Slide 8: Technology Driving Productivity
Technology Driving Productivity Manufacturing Value-Added Per Worker $118,419 United Kingdom ‘iia TOP 10 COUNTRIES BY ROBOT DENSITY Canada 971,529 Jannaraatoe WEEN STIoMG France Germany americas $51,576 Brazil $14,105 China MB $13,266 Regional averages ASIA/PACIFIC Countries with highest robot densi
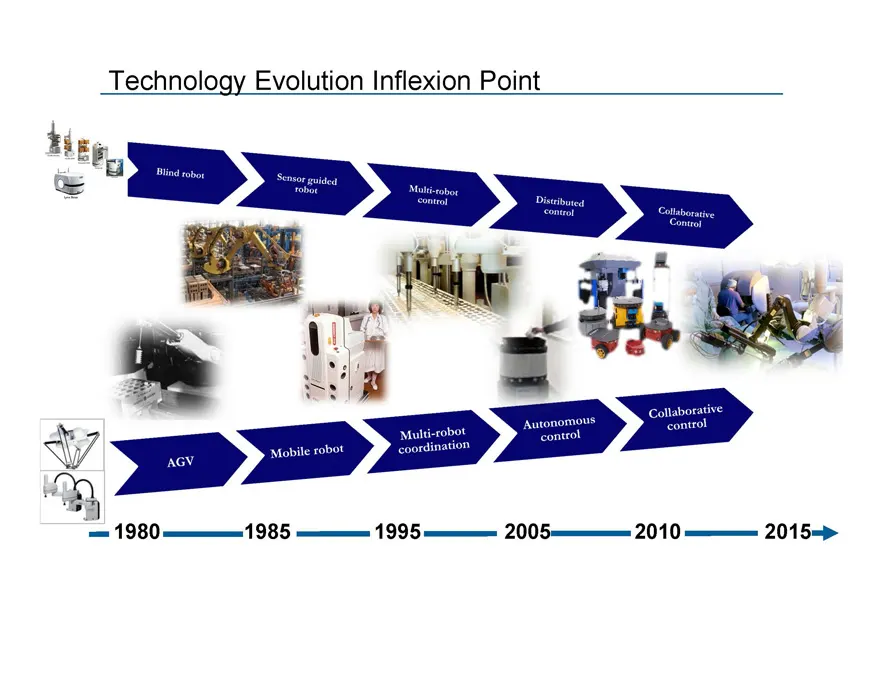
Slide 9: Technology Evolution Inflexion Point
Technology Evolution Inflexion Point = 1980 1985 1995. 2005: 2010 2015=>
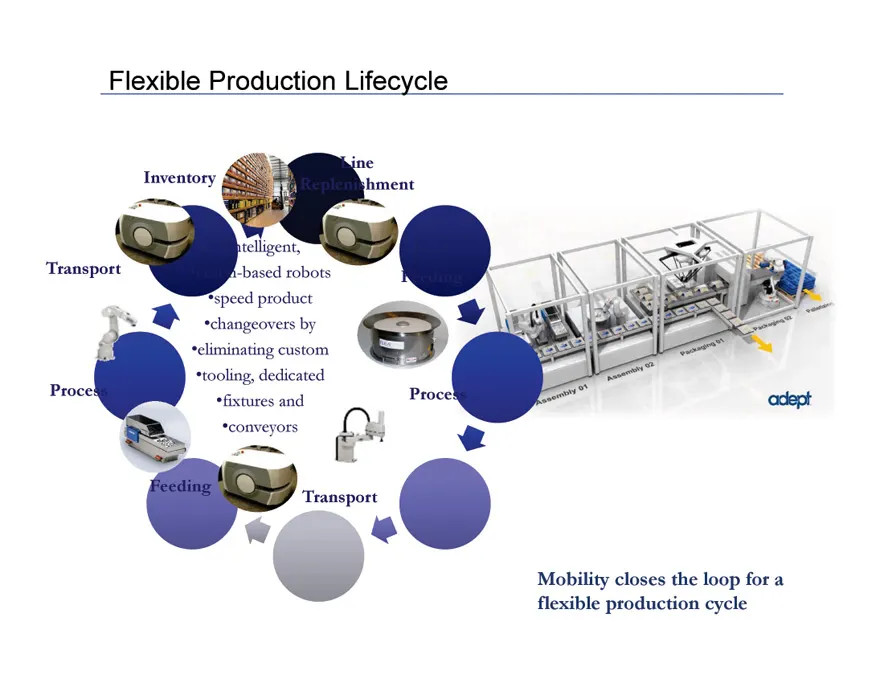
Slide 10: Flexible Production Lifecycle
Flexible Production Lifecycle Inventory telligent, — <oS < Transport -based robots ‘ ef speed product DW ccrangeovers by *climinating custom stooling, dedicated fixtures and “conveyors Mobility closes the loop for a flexible production cycle
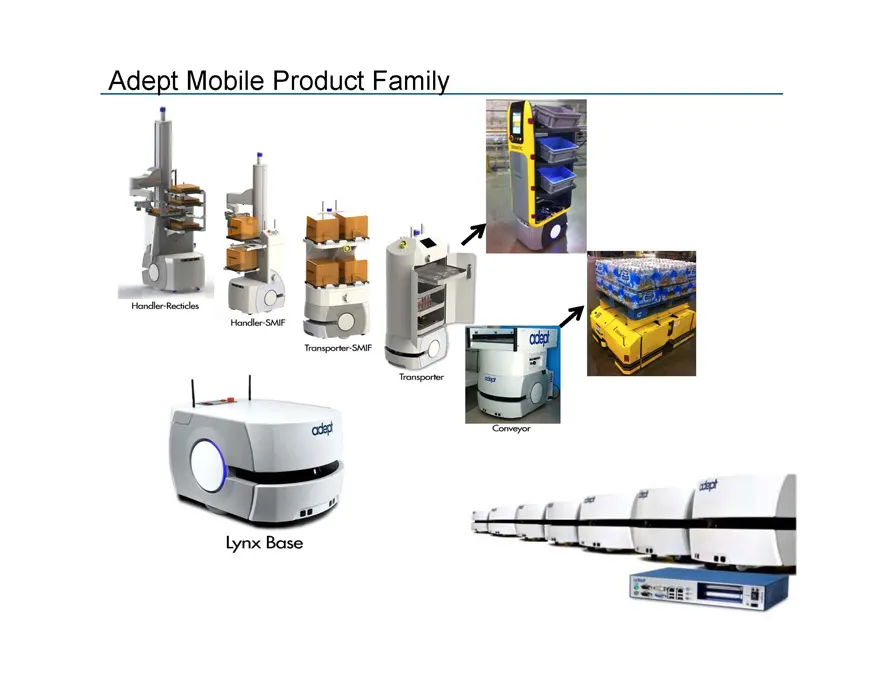
Slide 11: Adept Mobile Product Family
Adept Mobile Product Family
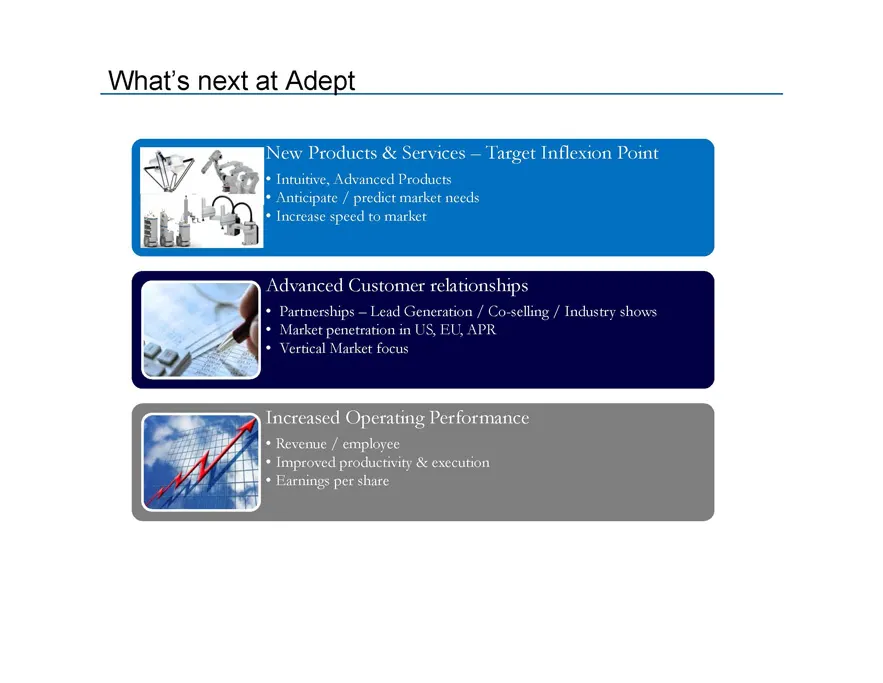
Slide 12: What's next at Adept
What's next at Adept Advanced Customer relationships + Partnerships — Lead Generation / Co-selling S, EU, APR Performance + Revenue / employ Improved productivity & arnings per share Industry shi

Slide 13: Thank you!
Thank you!
Source: SEC EDGAR · 8-K filed Dec 9, 2013