Ellaktor SA · ATHEX:ELLAKTOR
Ellaktor SA — FY2018 Earnings Presentation
16 slides from Ellaktor SA's earnings presentation, Apr 17, 2019
Slide 1: FY2018 Group Results
A ELLAKTOR FY2018 Group Results
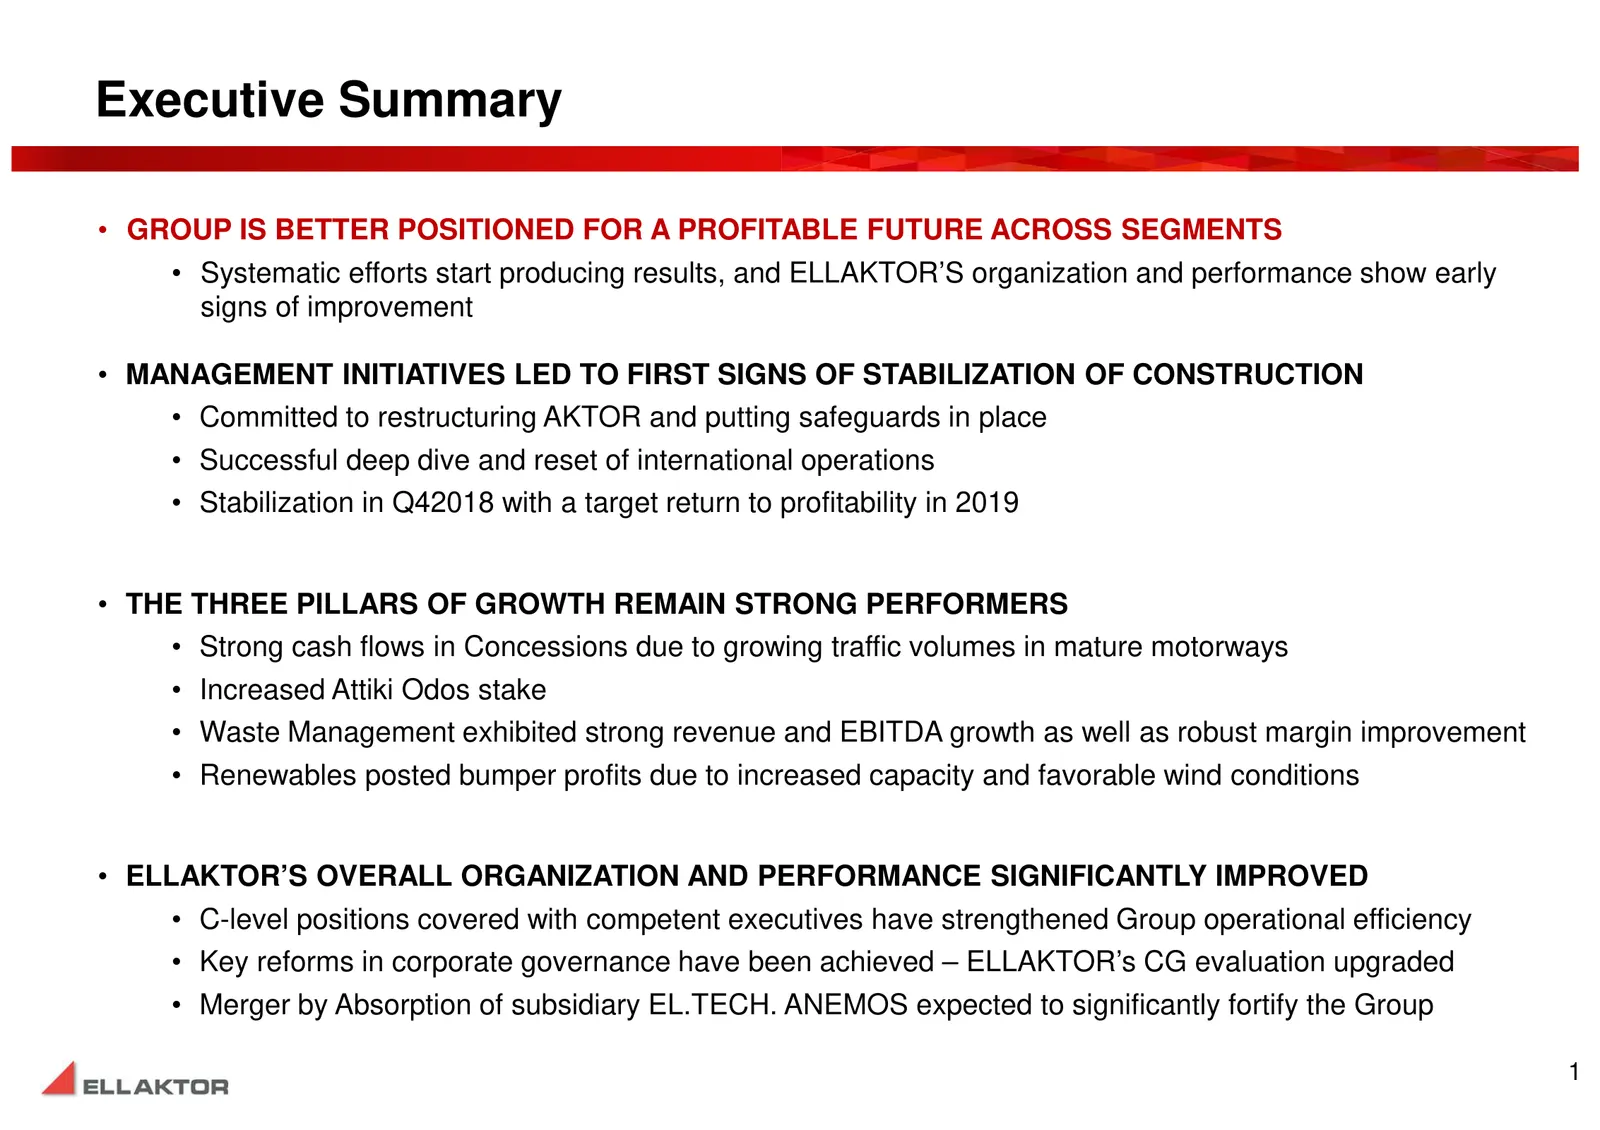
Slide 2: Executive Summary
Executive Summary • GROUP IS BETTER POSITIONED FOR A PROFITABLE FUTURE ACROSS SEGMENTS • Systematic efforts start producing results, and ELLAKTOR’S organization and performance show early signs of improvement • MANAGEMENT INITIATIVES LED TO FIRST SIGNS OF STABILIZATION OF CONSTRUCTION • Committed to
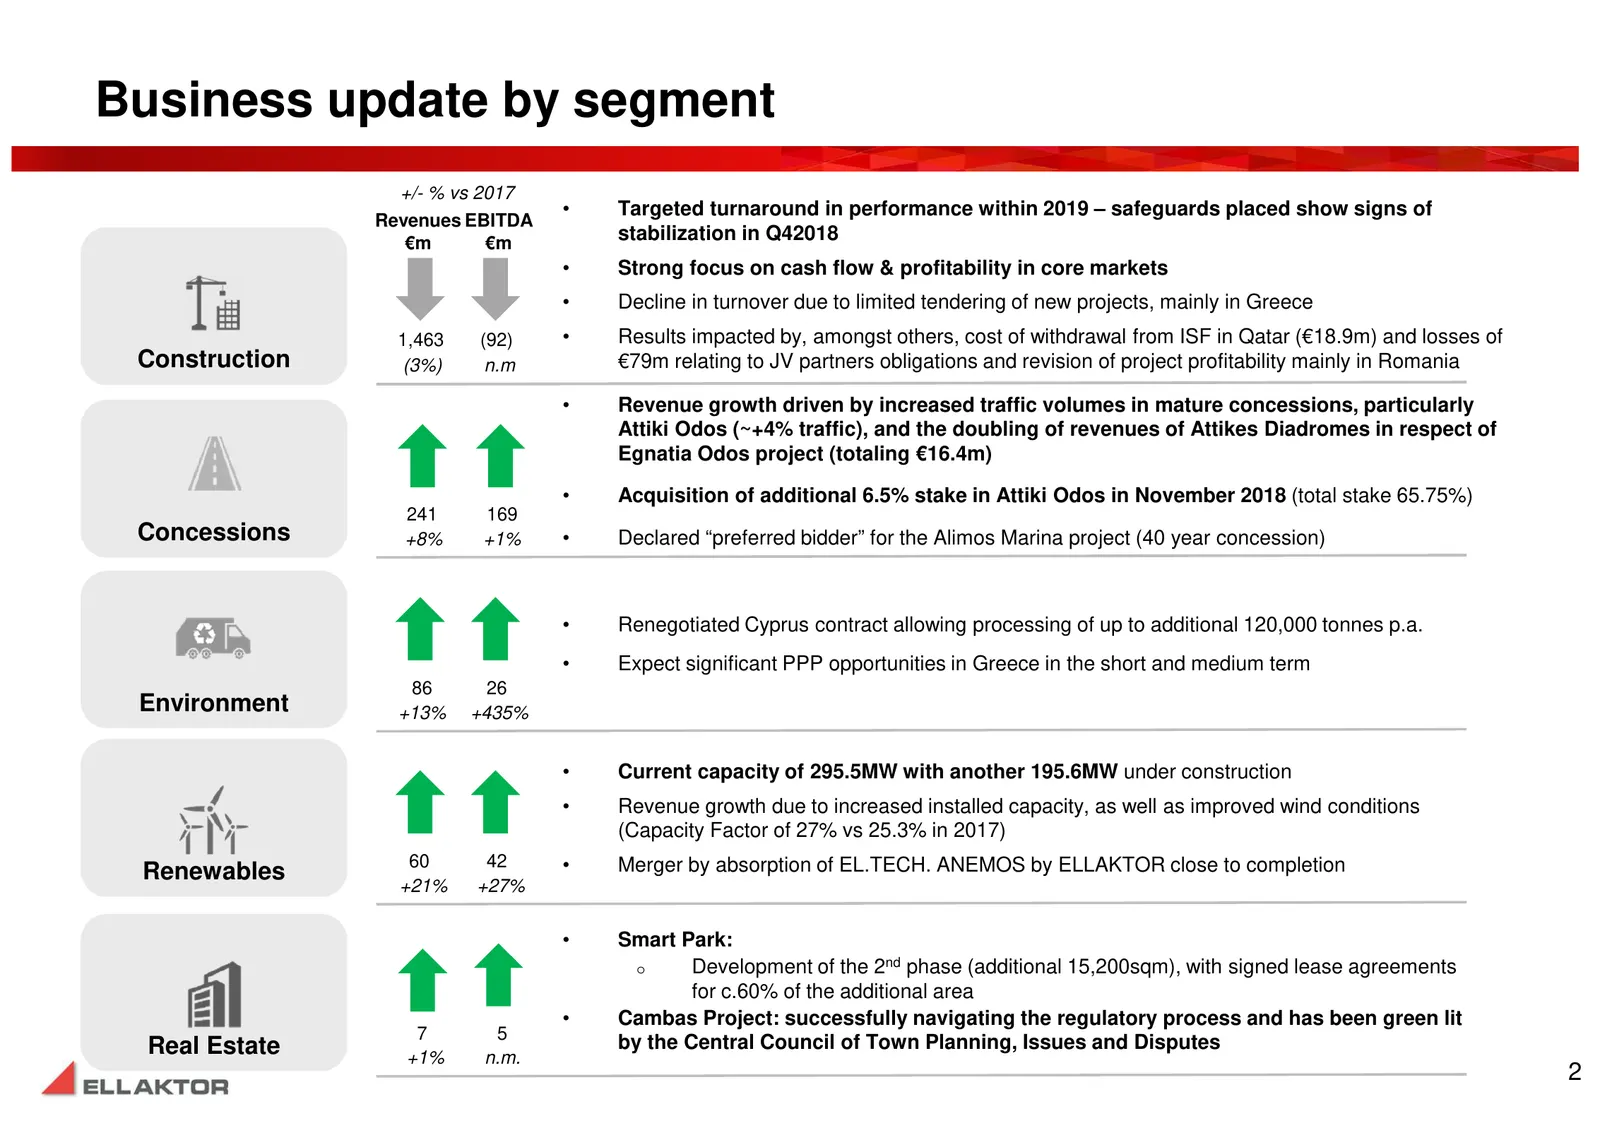
Slide 3: Business update by segment
Business update by segment +/- % vs 2017 • Targeted turnaround in performance within 2019 – safeguards placed show signs of Revenues EBITDA €m €m stabilization in Q42018 • Strong focus on cash flow & profitability in core markets • Decline in turnover due to limited tendering of new projects, mainly
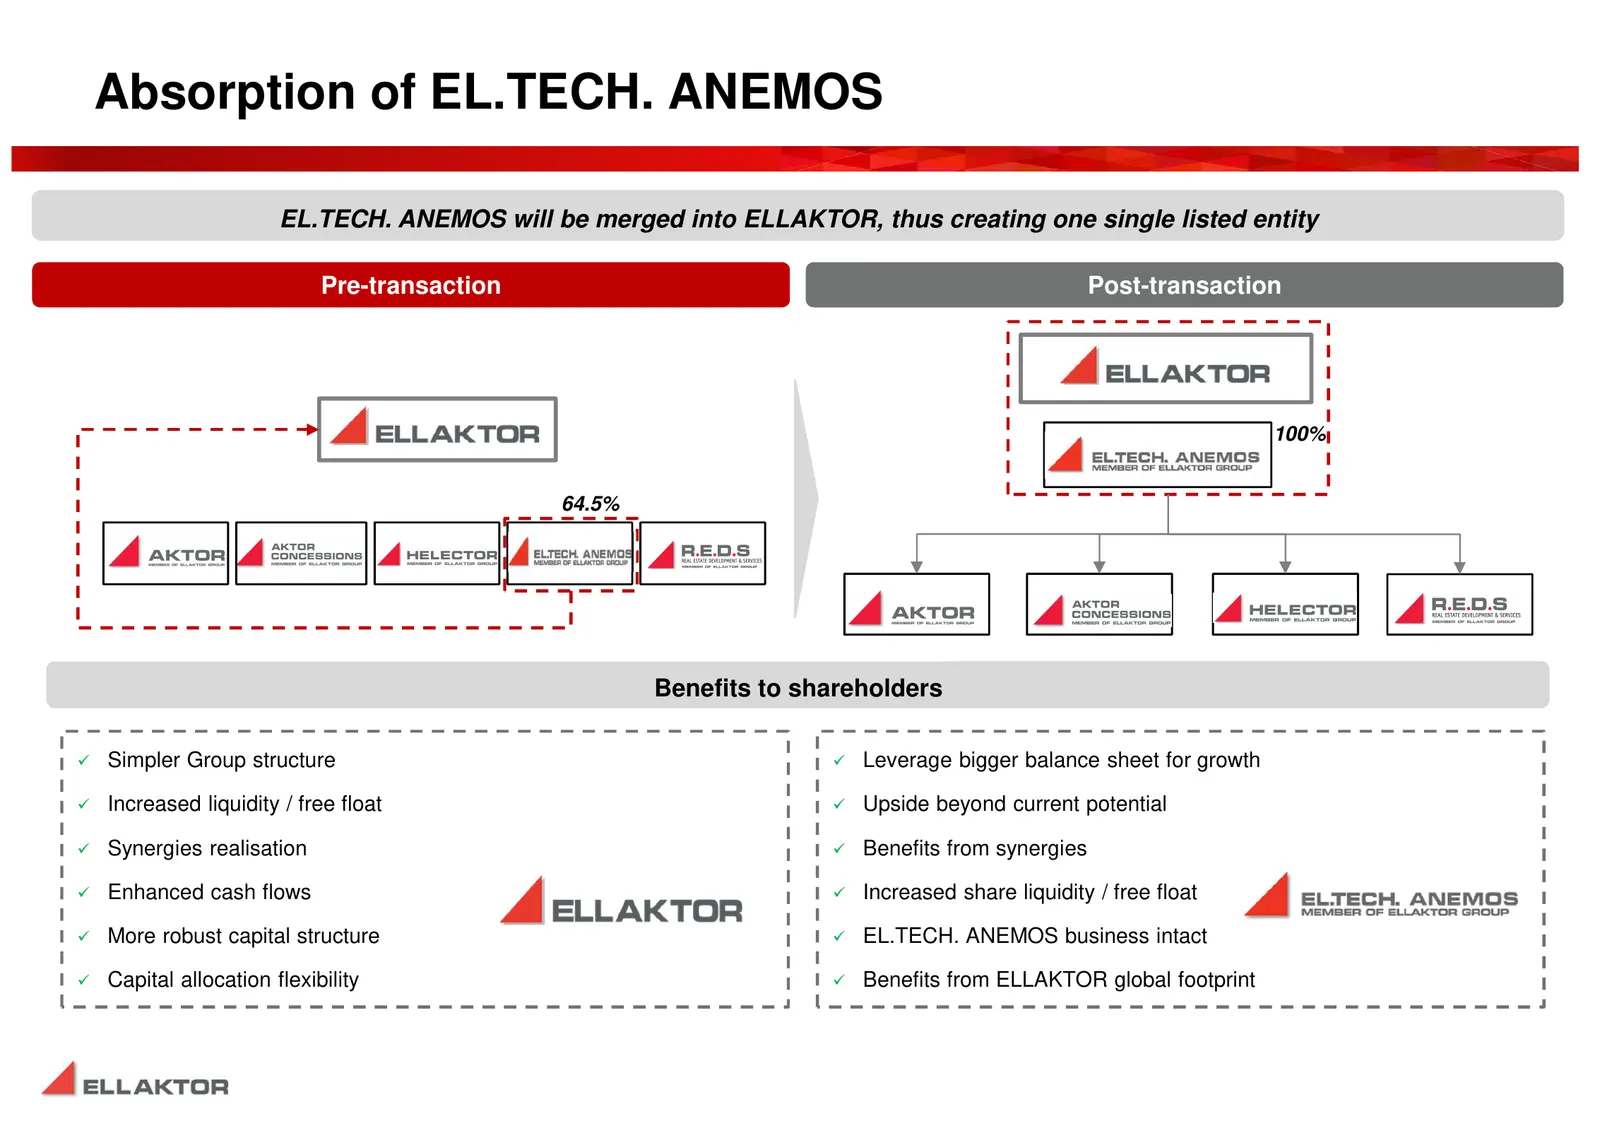
Slide 4: Absorption of EL.TECH. ANEMOS
Absorption of EL.TECH. ANEMOS EL.TECH. ANEMOS will be merged into ELLAKTOR, thus creating one single listed entity Pre-transaction Post-transaction 100% 64.5% Benefits to shareholders Simpler Group structure Leverage bigger balance sheet for growth Increased liquidity / free float Upside bey
Slide 5: Merger by Absorption well on track
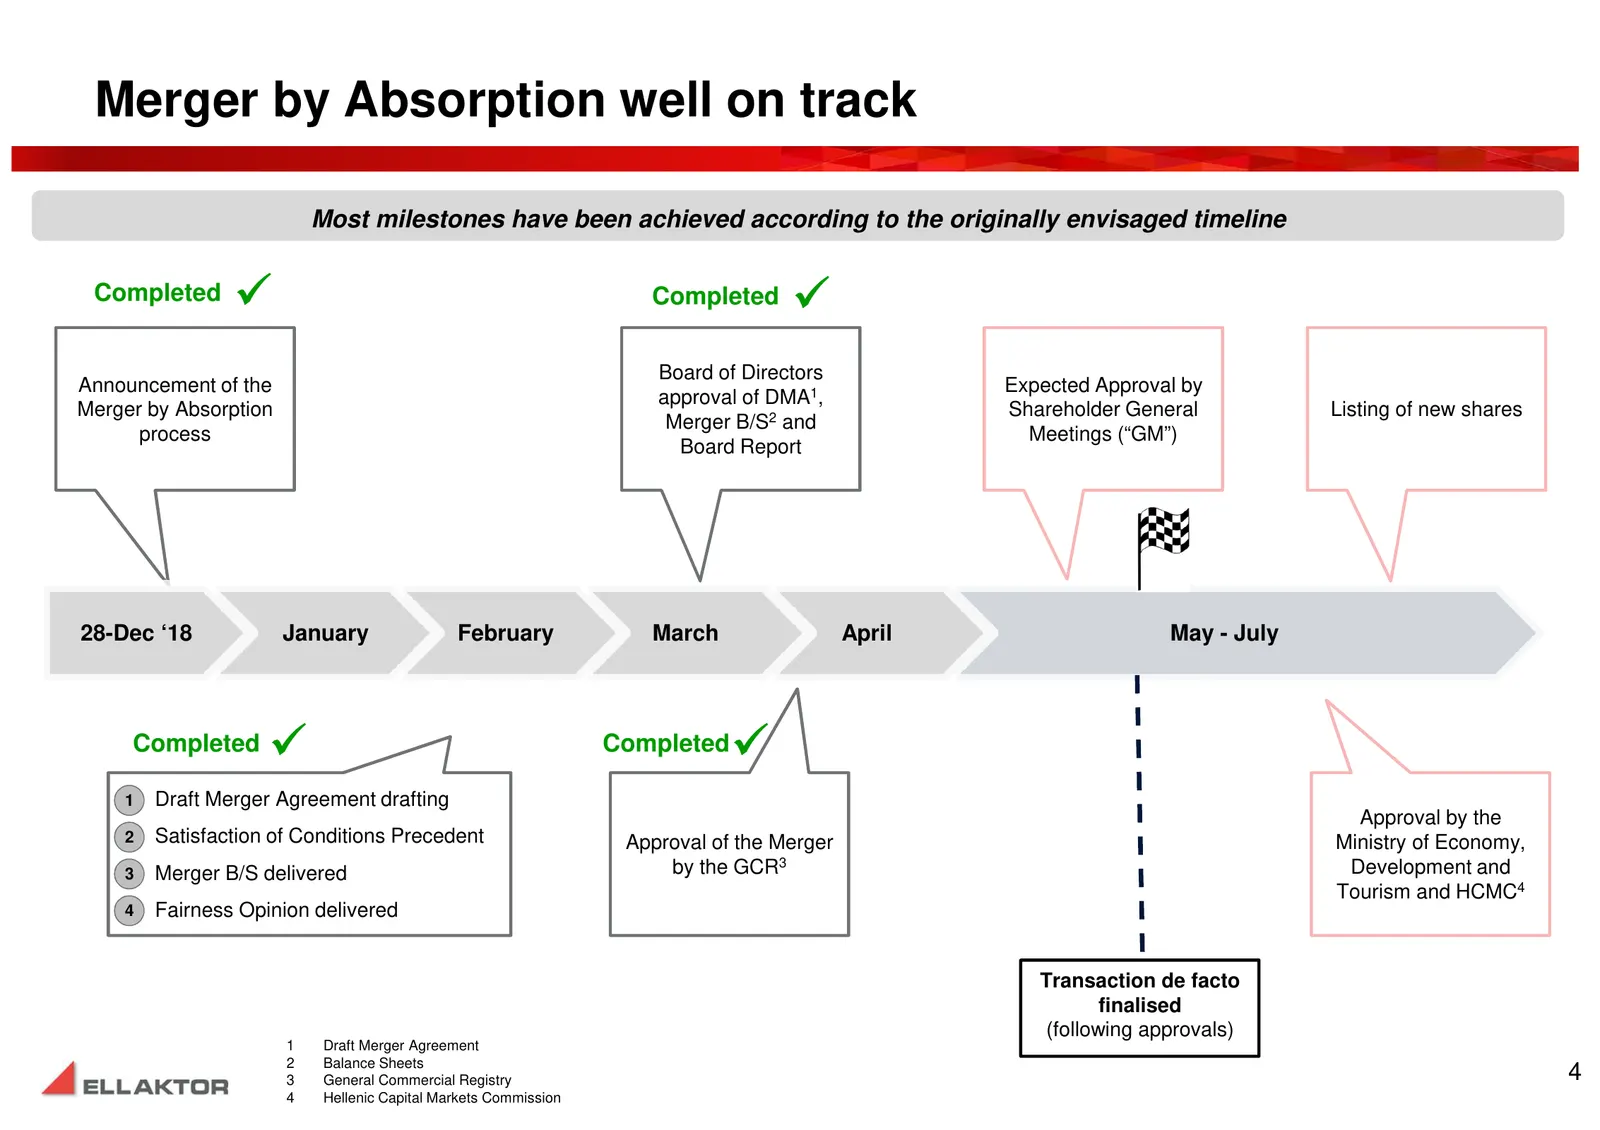
Merger by Absorption well on track Most milestones have been achieved according to the originally envisaged timeline Completed Completed Board of Directors Announcement of the Expected Approval by approval of DMA1, Merger by Absorption Shareholder General Listing of new shares Merger B/S2 and pr
Slide 6: Corporate Governance upgraded
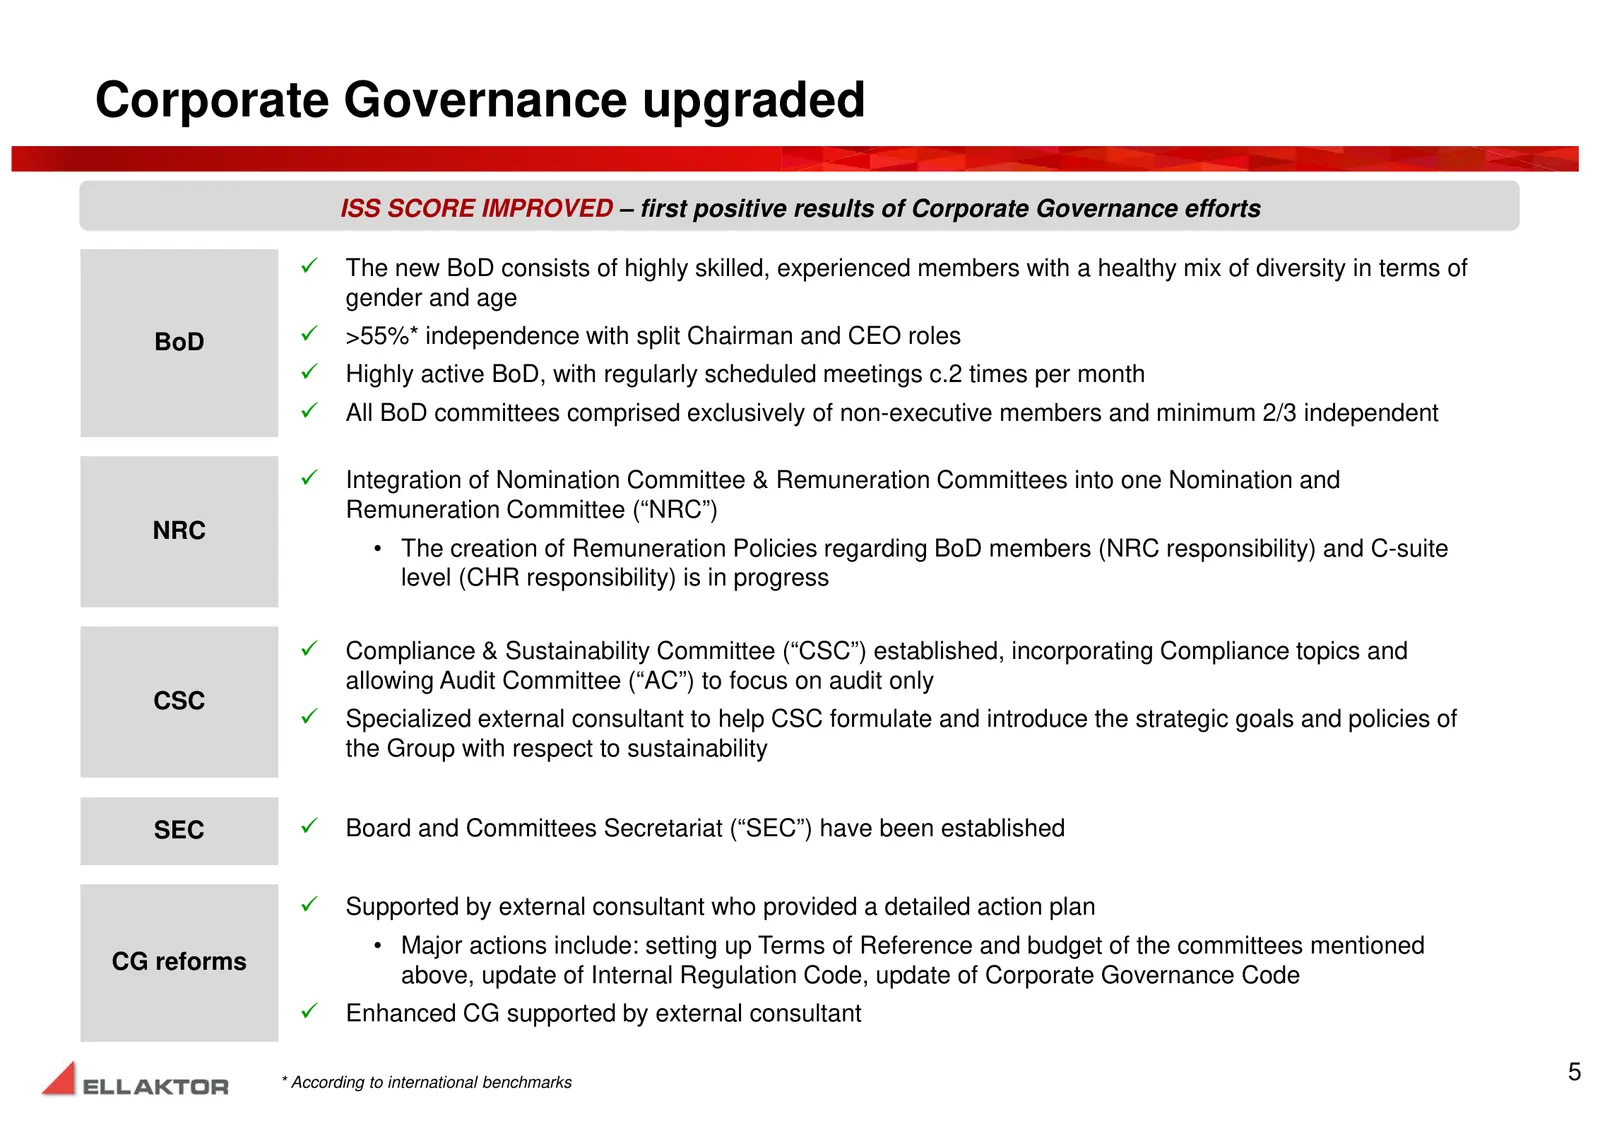
Corporate Governance upgraded ISS SCORE IMPROVED – first positive results of Corporate Governance efforts The new BoD consists of highly skilled, experienced members with a healthy mix of diversity in terms of gender and age BoD >55%* independence with split Chairman and CEO roles Highly activ
Slide 7: Evolution of Group P&L Items (IFRS – in €m)
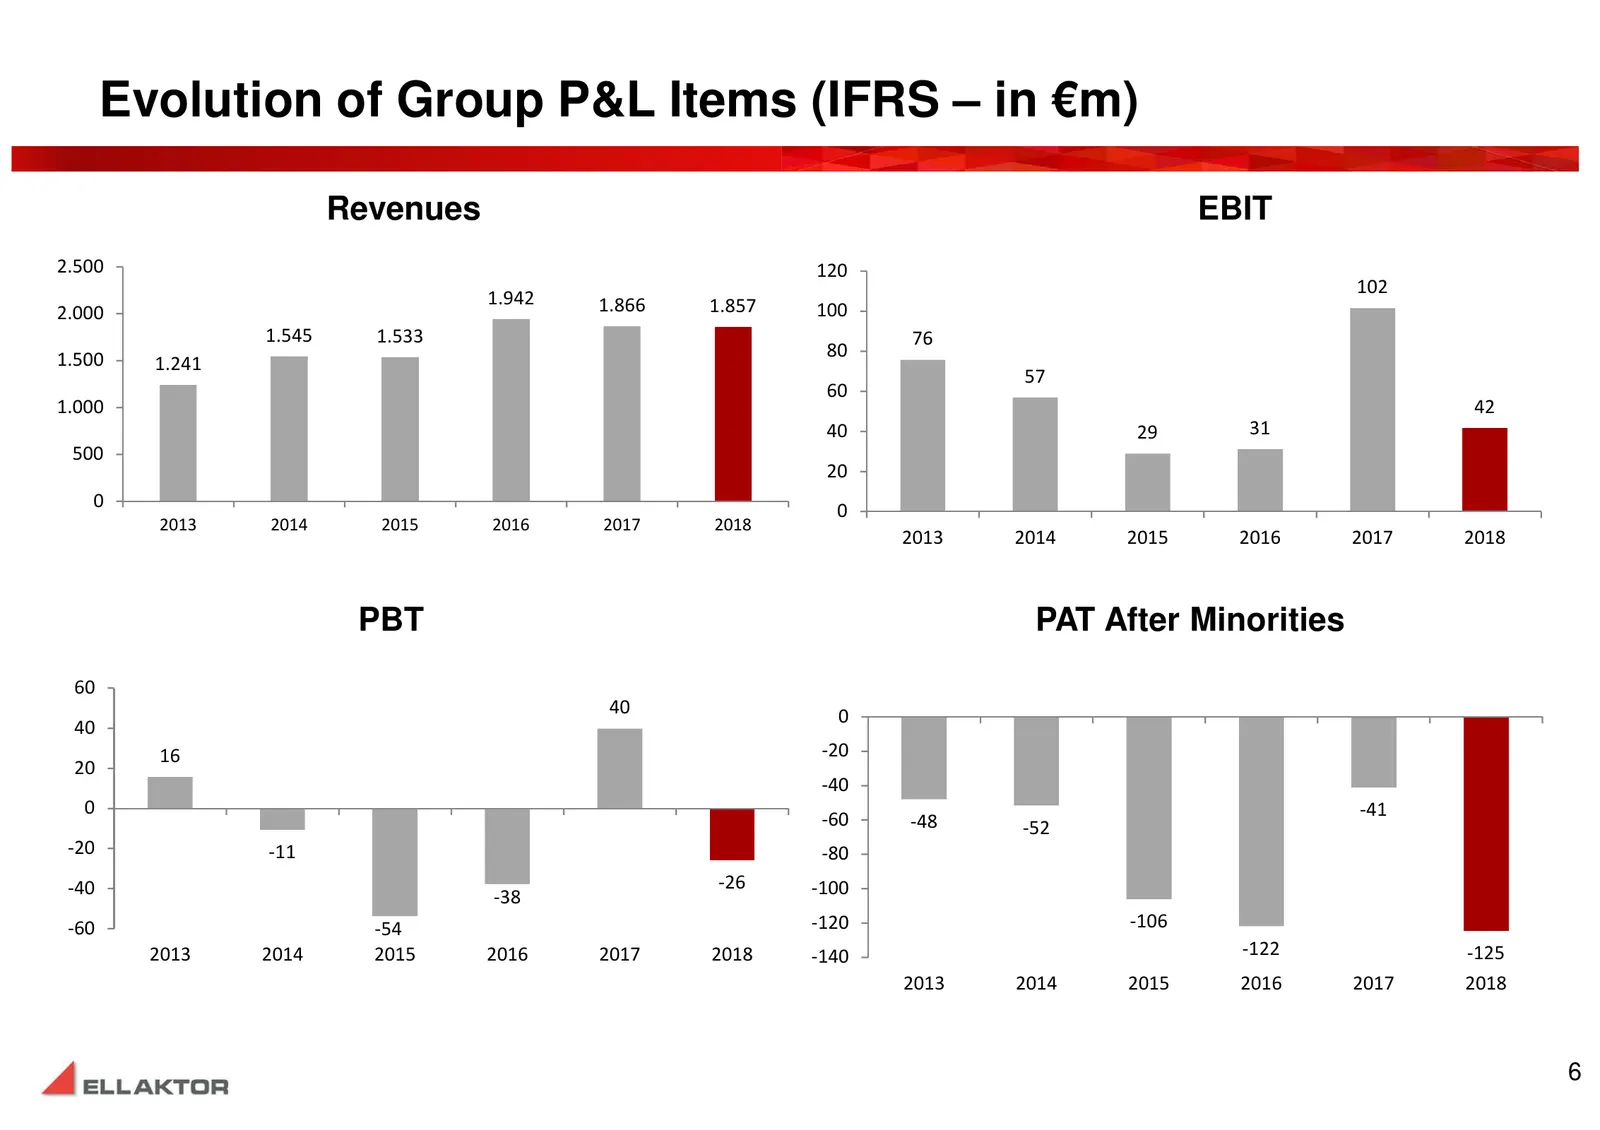
Evolution of Group P&L Items (IFRS – in €m) Revenues EBIT 2.500 120 102 1.942 1.866 1.857 2.000 100 1.545 1.533 76 1.500 80 1.241 57 60 1.000 42 40 29 31 500 20 0 0 2013 2014 2015 2016 2017 2018 2013 2014 2015 2016 2017 2018 PBT PAT After Minorities 60 40 0 40 16 -20 20 -40 0 -41 -60 -48 -52 -20 -11
Slide 8: Consolidated P&L
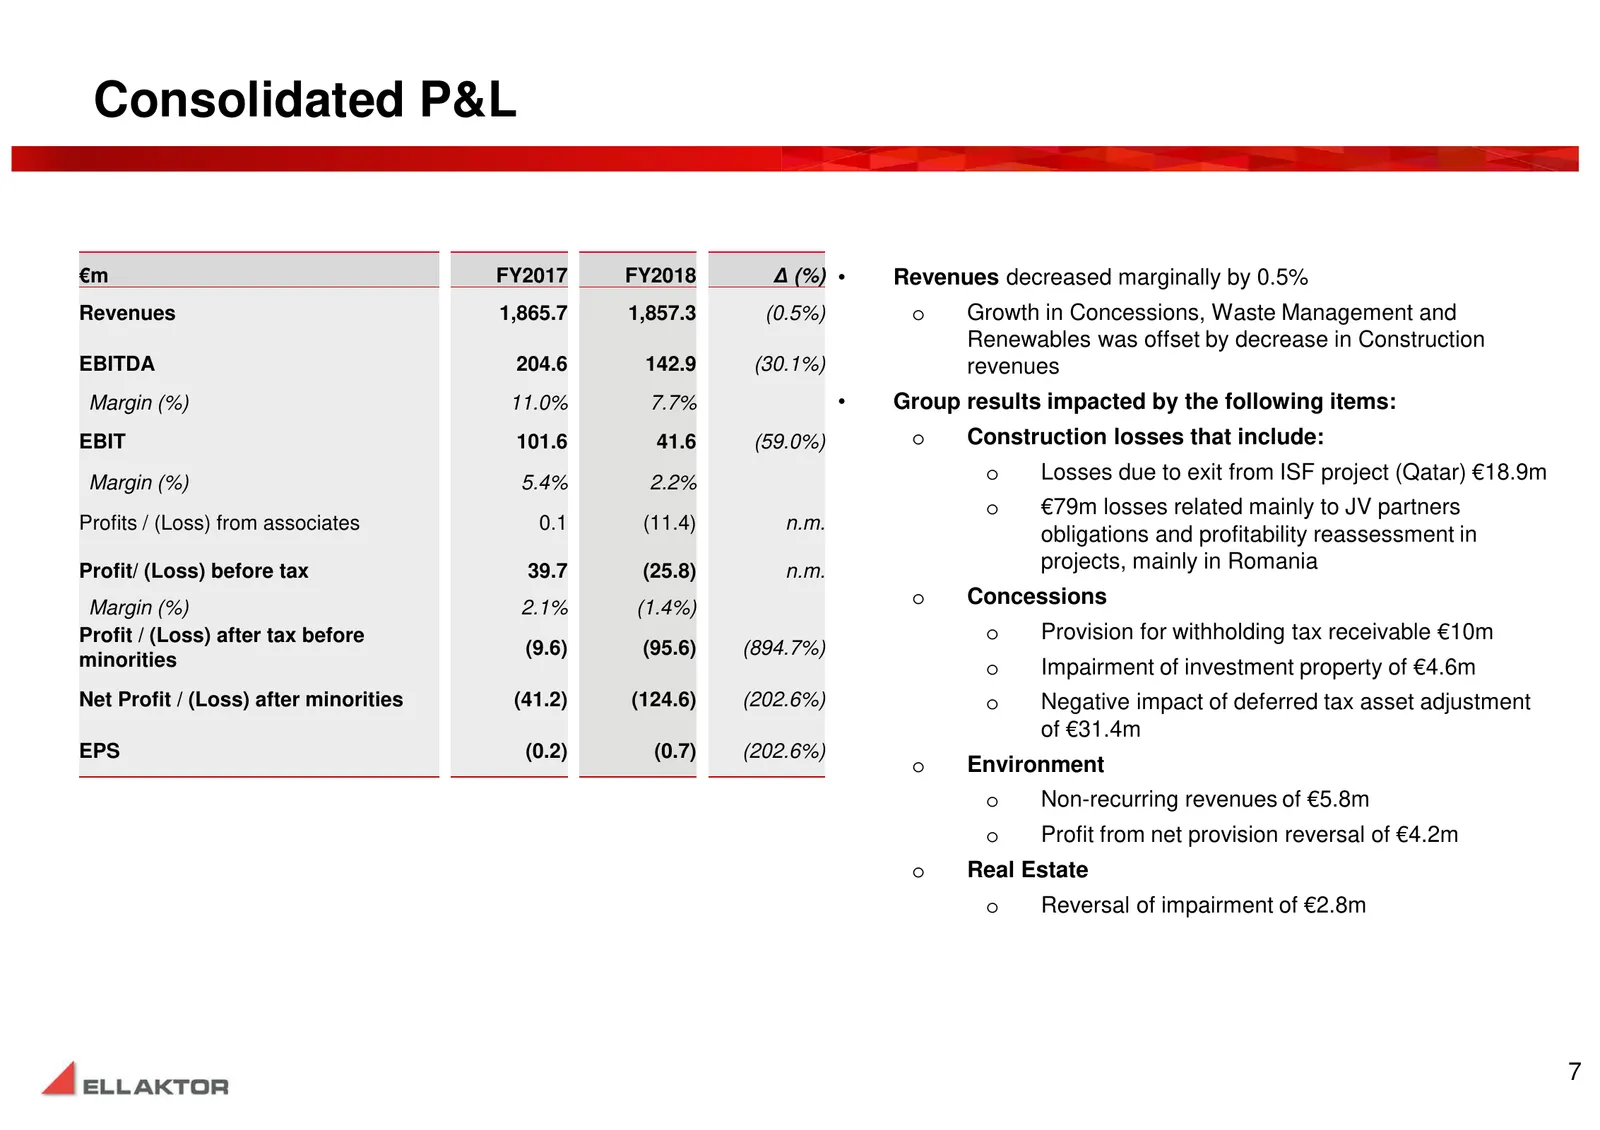
Consolidated P&L €m FY2017 FY2018 Δ (%) • Revenues decreased marginally by 0.5% Revenues 1,865.7 1,857.3 (0.5%) o Growth in Concessions, Waste Management and Renewables was offset by decrease in Construction EBITDA 204.6 142.9 (30.1%) revenues Margin (%) 11.0% 7.7% • Group results impacted by the fo
Slide 9: Revenue and EBITDA bridge (€m)
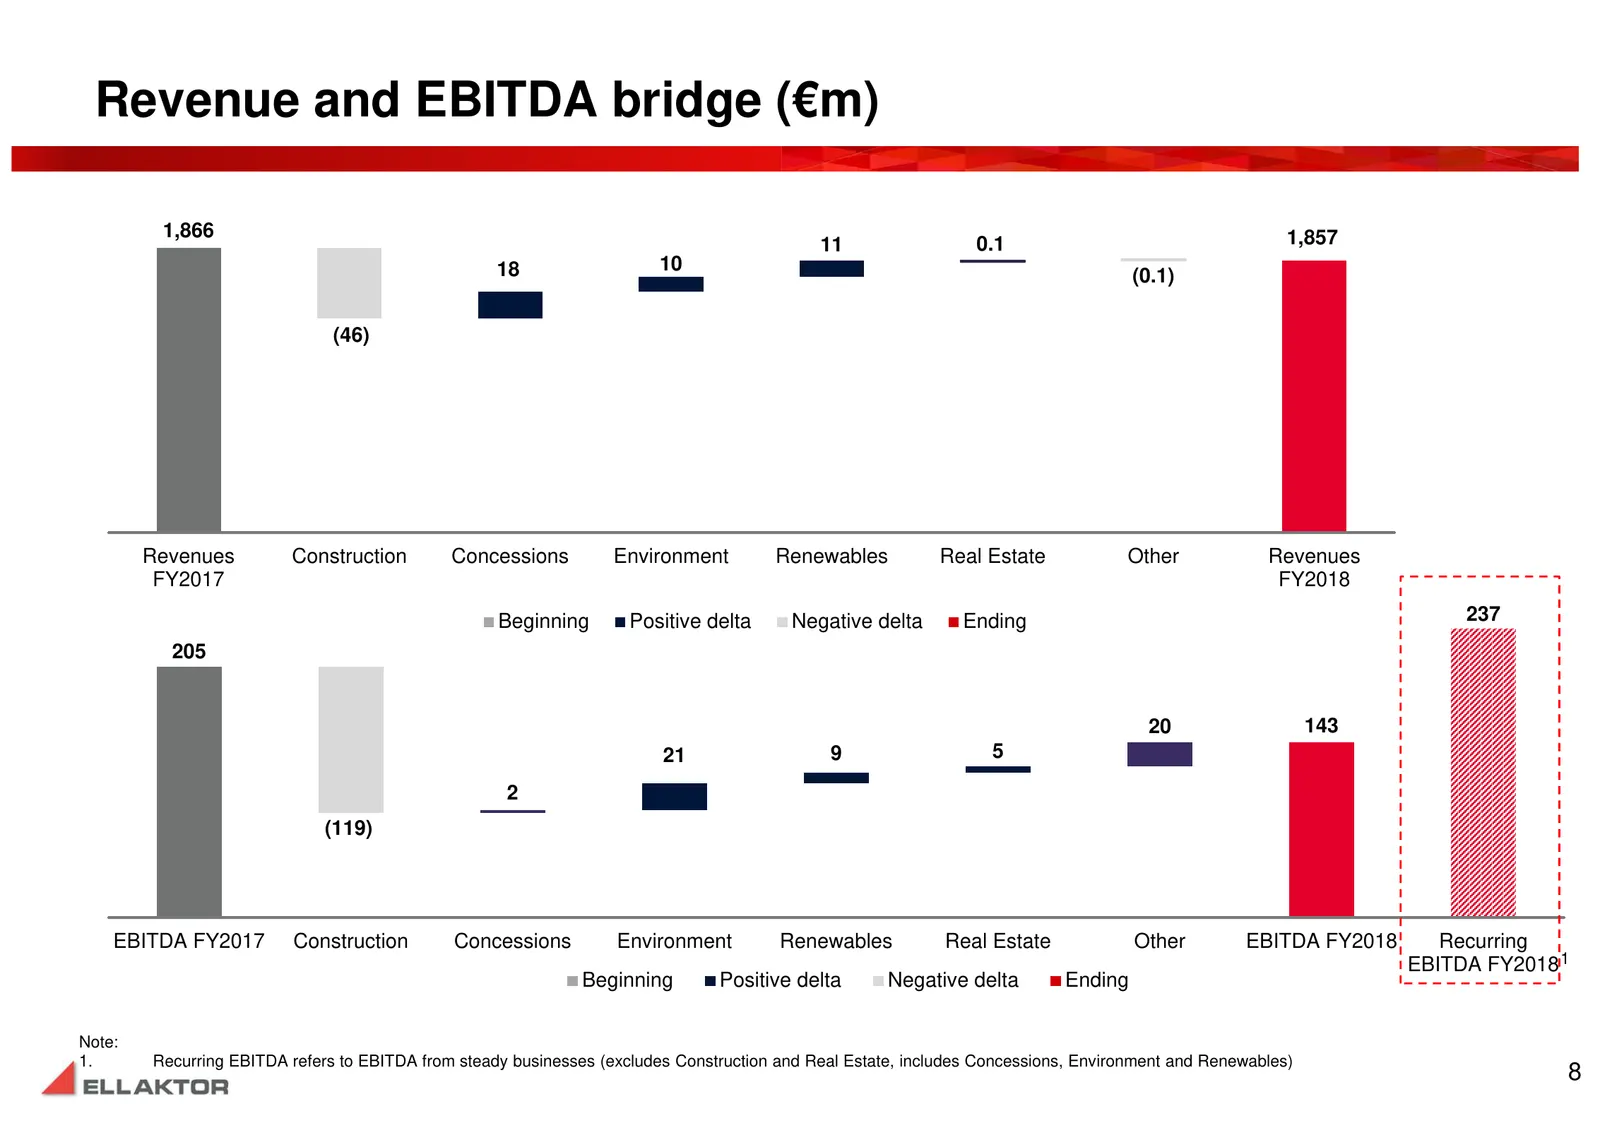
Revenue and EBITDA bridge (€m) 1,866 1,857 11 0.1 18 10 (0.1) (46) Revenues Construction Concessions Environment Renewables Real Estate Other Revenues FY2017 FY2018 Beginning Positive delta Negative delta Ending 237 205 20 143 21 9 5 2 (119) EBITDA FY2017 Construction Concessions Environment Renewab
Slide 10: Consolidated balance sheet as at 31/12/2018
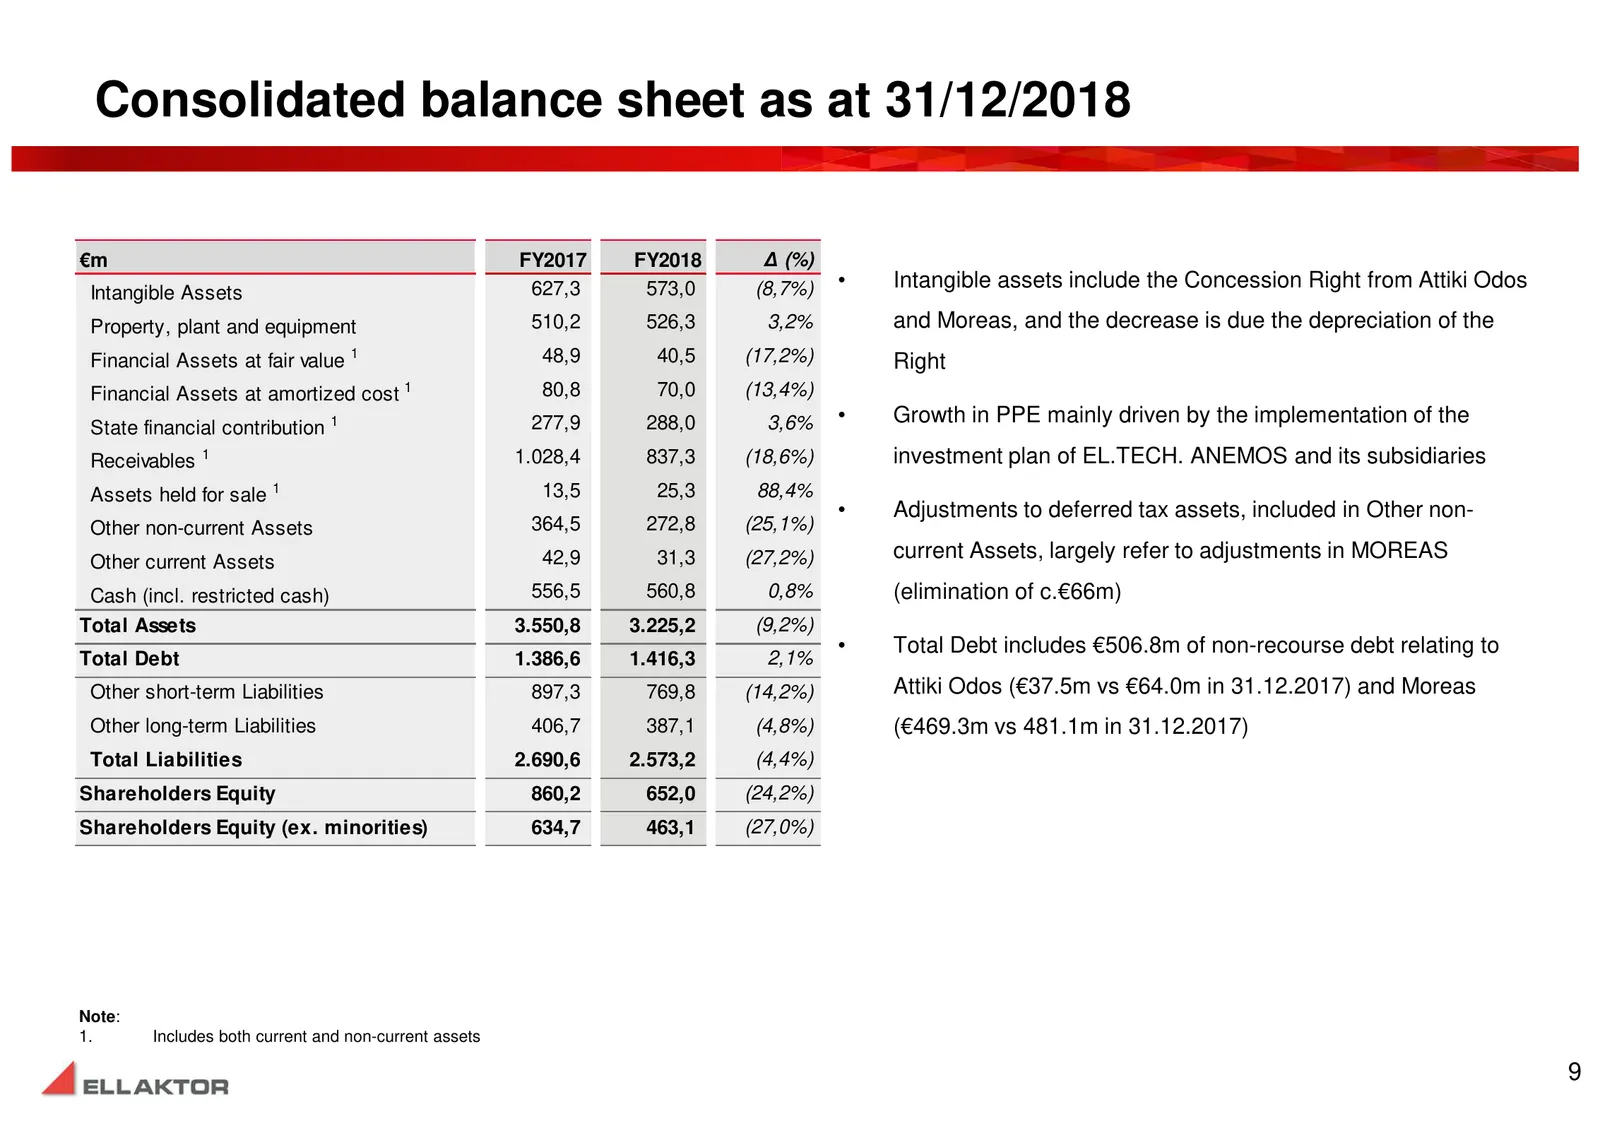
Consolidated balance sheet as at 31/12/2018 €m FY2017 FY2018 Δ (%) 627,3 573,0 (8,7%) • Intangible assets include the Concession Right from Attiki Odos Intangible Assets Property, plant and equipment 510,2 526,3 3,2% and Moreas, and the decrease is due the depreciation of the Financial Assets at fai
Slide 11: Consolidated cash flows
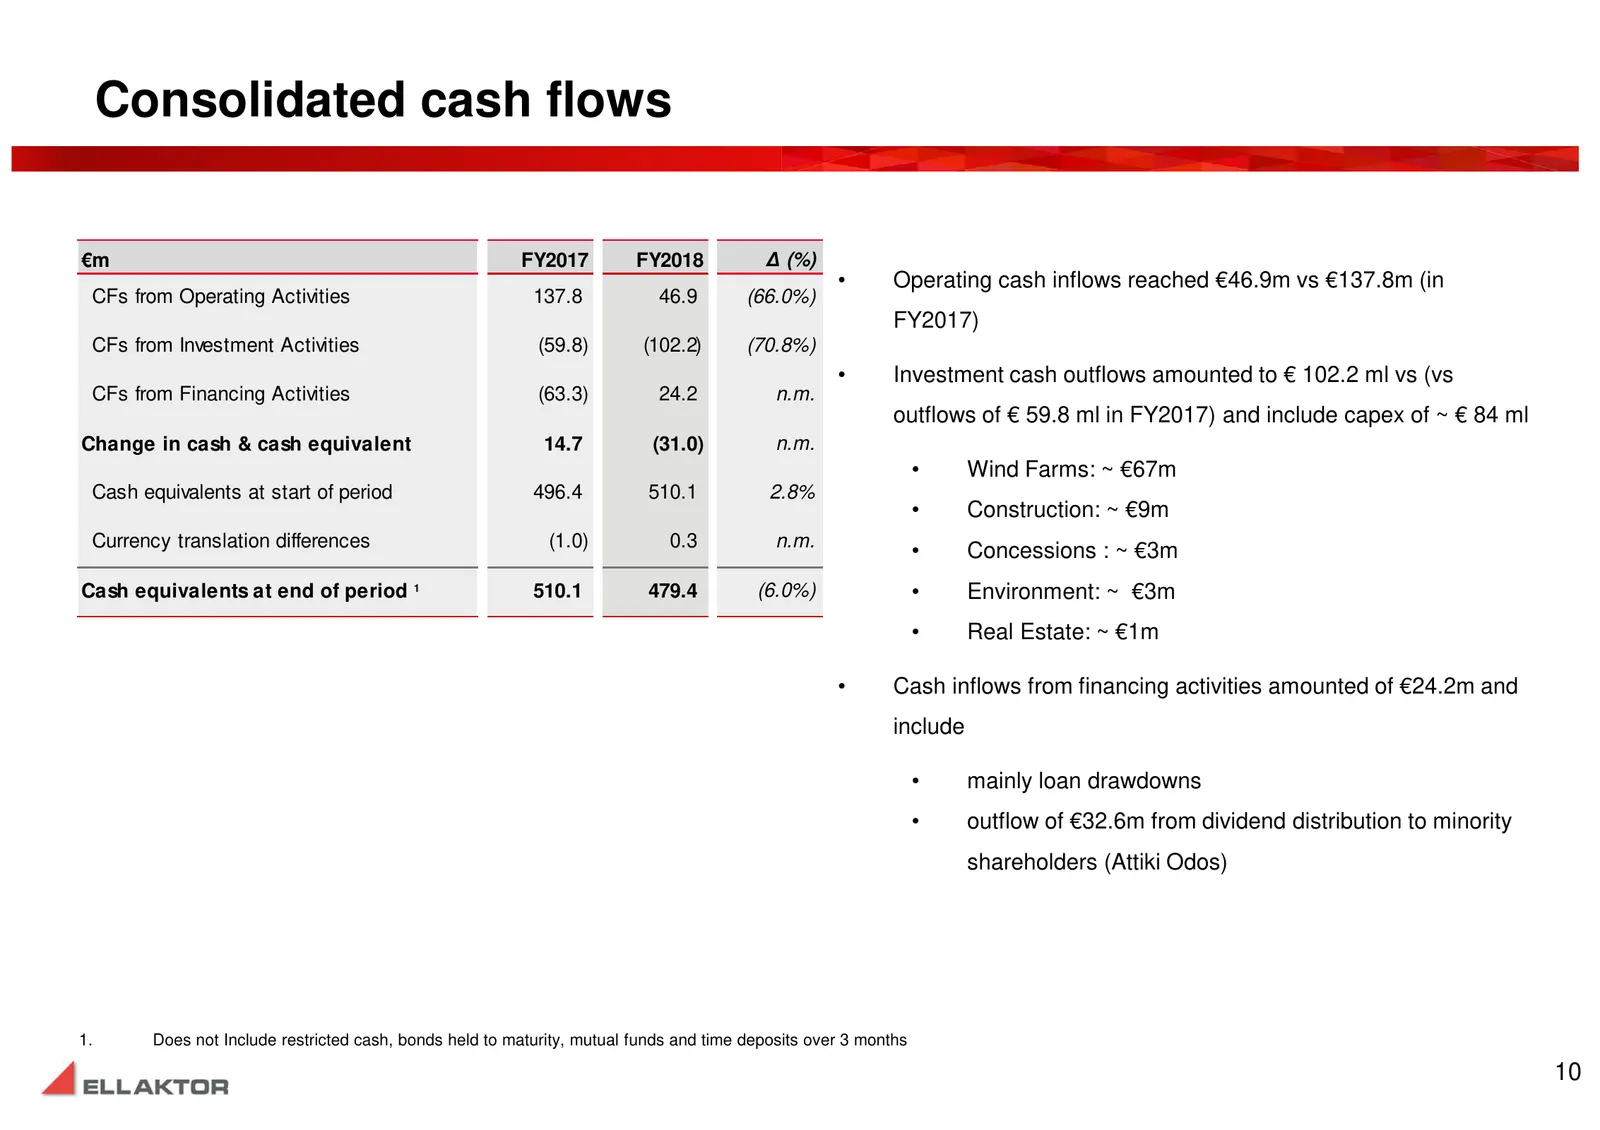
Consolidated cash flows €m FY2017 FY2018 Δ (%) • Operating cash inflows reached €46.9m vs €137.8m (in CFs from Operating Activities 137.8 46.9 (66.0%) FY2017) CFs from Investment Activities (59.8) (102.2) (70.8%) • Investment cash outflows amounted to € 102.2 ml vs (vs CFs from Financing Activities
Slide 12: Net debt by sector as at 31/12/2018
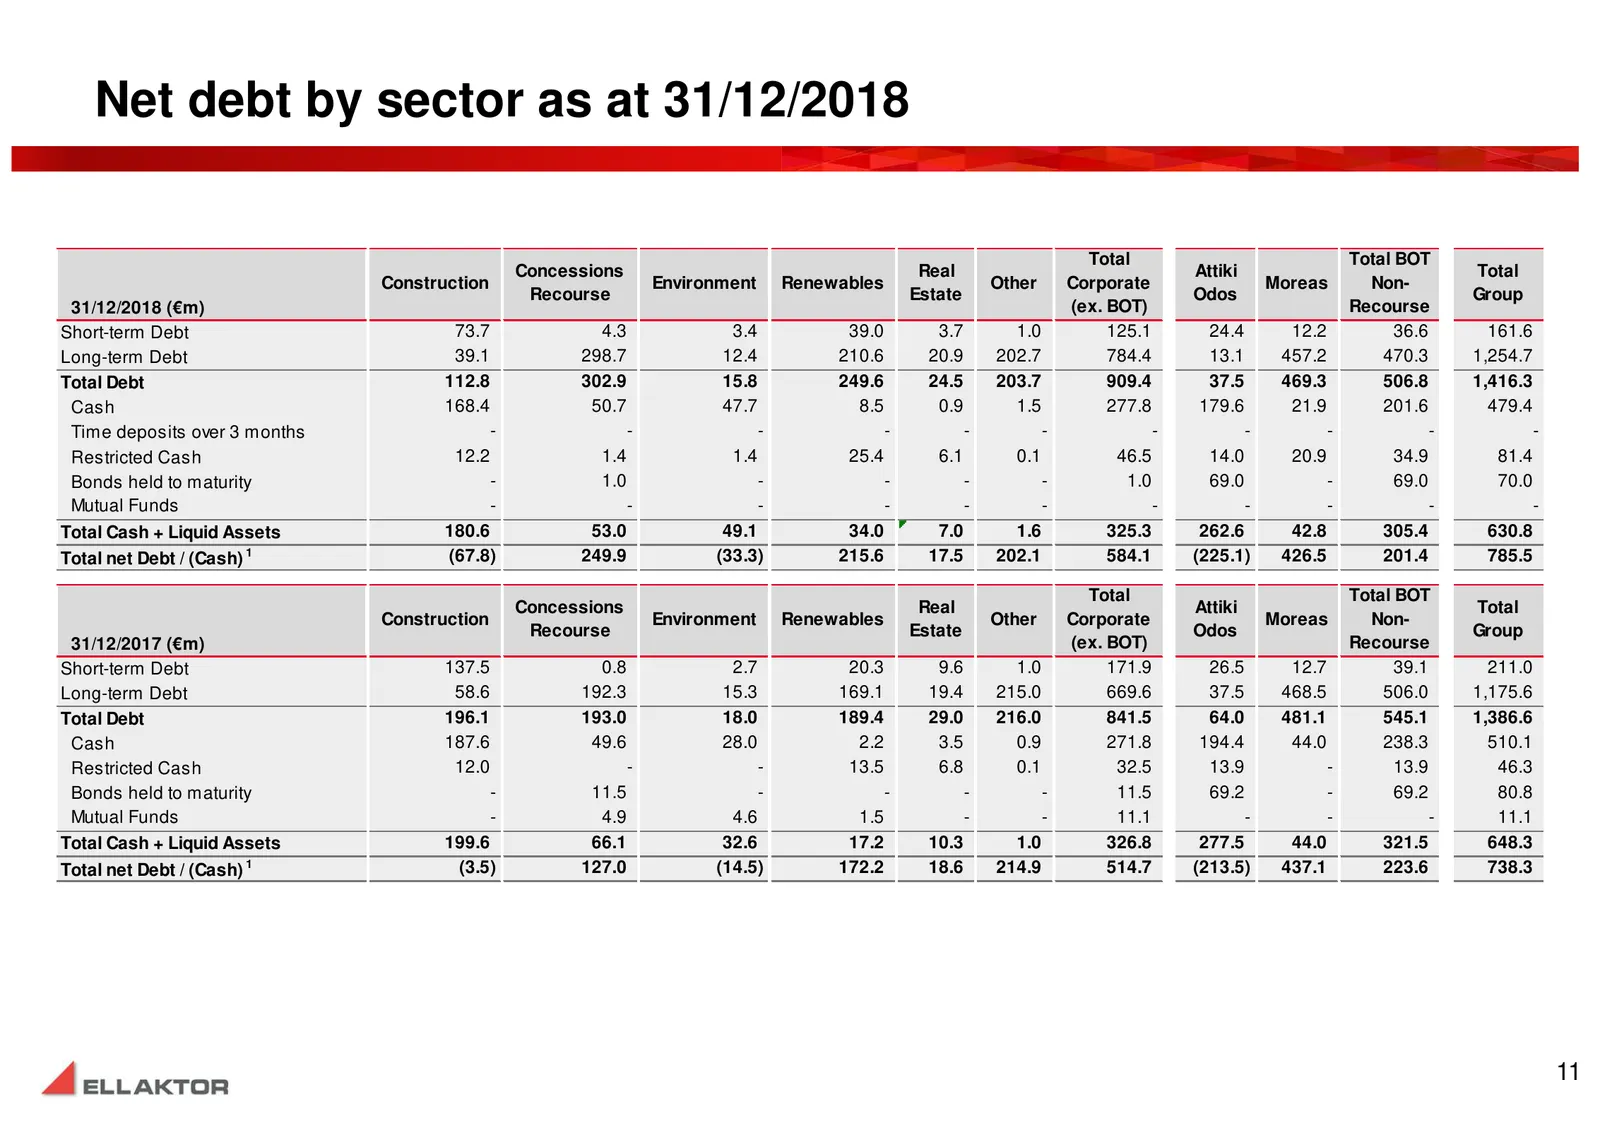
Net debt by sector as at 31/12/2018 Total Total BOT Concessions Real Attiki Total Construction Environment Renewables Other Corporate Moreas Non- Recourse Estate Odos Group 31/12/2018 (€m) (ex. BOT) Recourse Short-term Debt 73.7 4.3 3.4 39.0 3.7 1.0 125.1 24.4 12.2 36.6 161.6 Long-term Debt 39.1 298
Slide 13: Segmental analysis of FY2018 vs FY2017 results (€m)
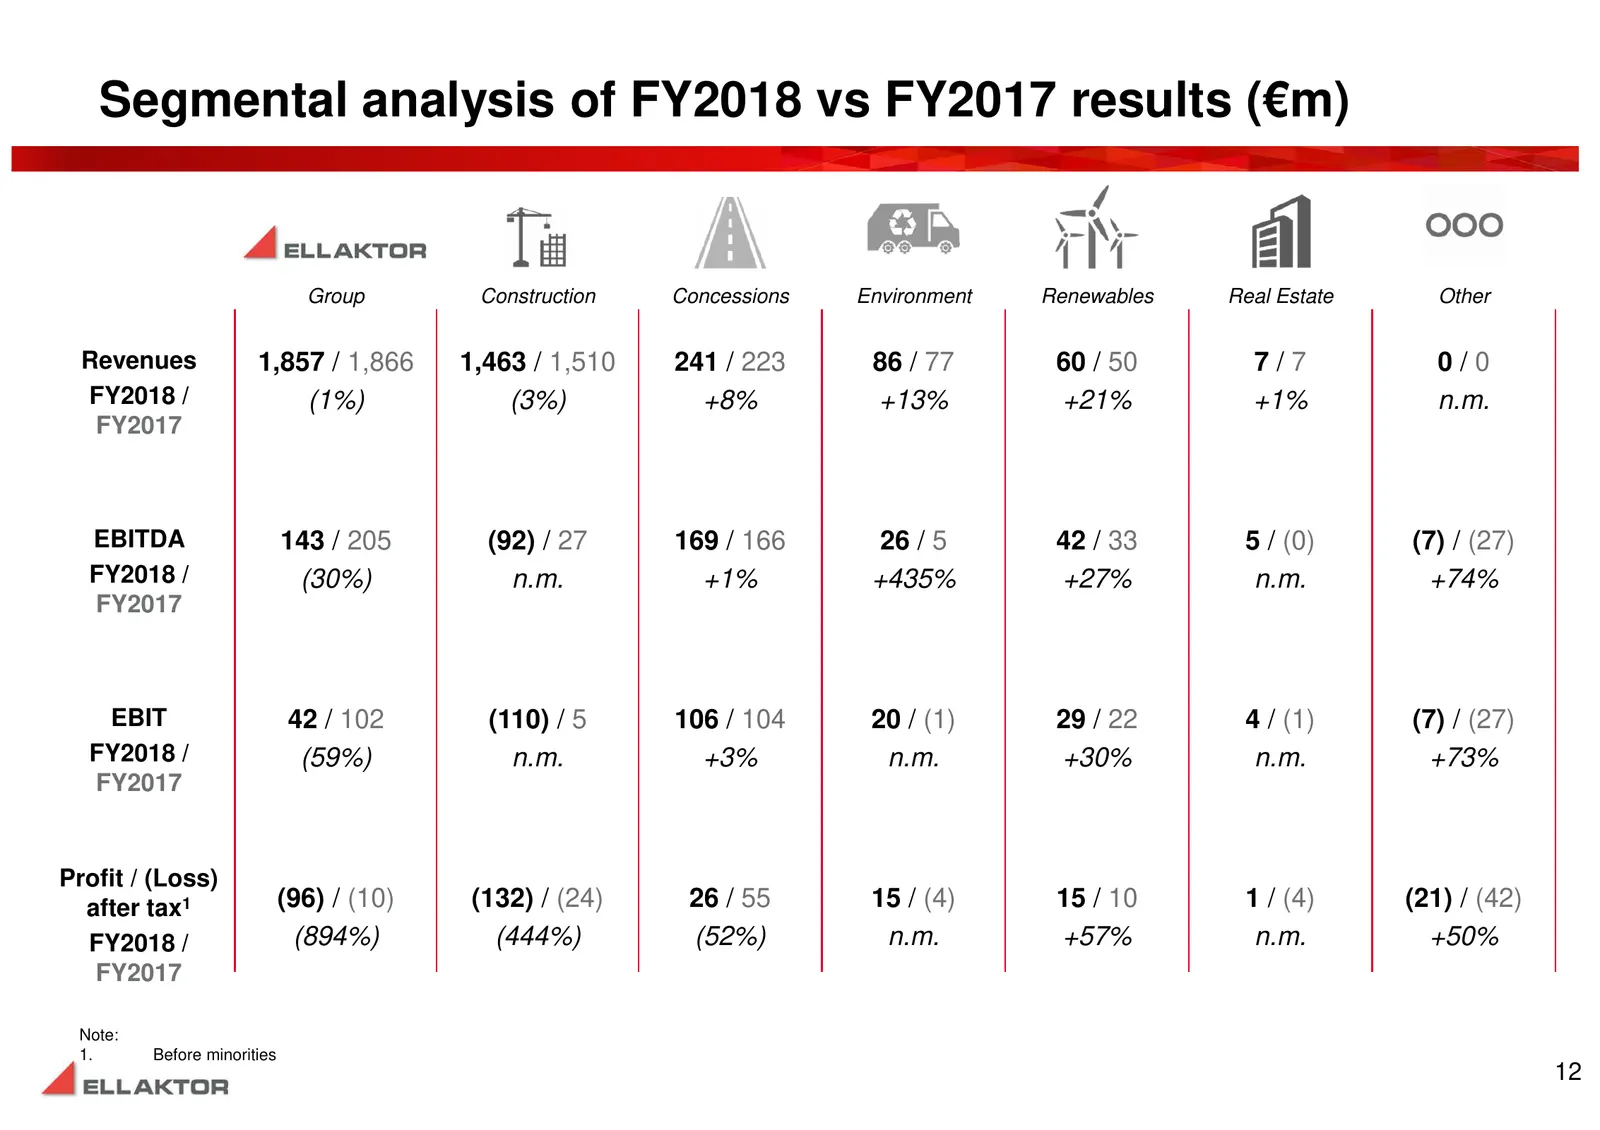
Segmental analysis of FY2018 vs FY2017 results (€m) Group Construction Concessions Environment Renewables Real Estate Other Revenues 1,857 / 1,866 1,463 / 1,510 241 / 223 86 / 77 60 / 50 7/7 0/0 FY2018 / (1%) (3%) +8% +13% +21% +1% n.m. FY2017 EBITDA 143 / 205 (92) / 27 169 / 166 26 / 5 42 / 33 5 /
Slide 14: Moving Forward
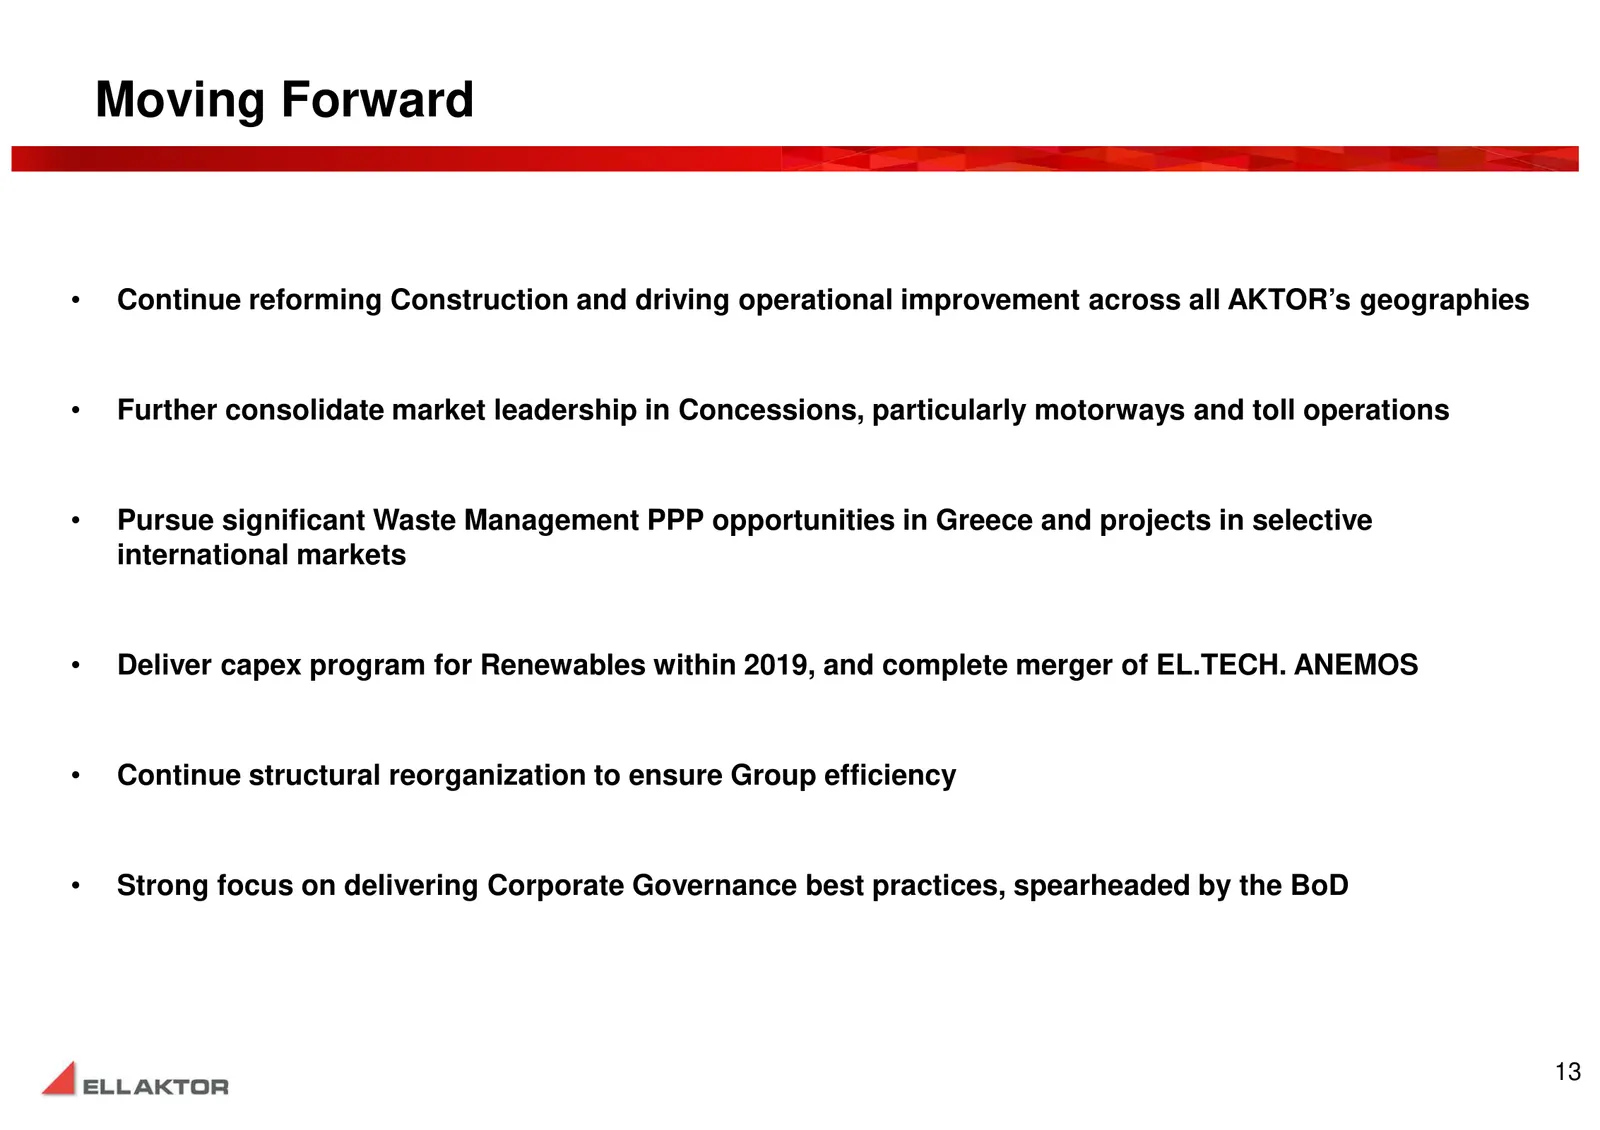
Moving Forward • Continue reforming Construction and driving operational improvement across all AKTOR’s geographies • Further consolidate market leadership in Concessions, particularly motorways and toll operations • Pursue significant Waste Management PPP opportunities in Greece and projects in sel
Slide 15: Disclaimer
Disclaimer This presentation has been prepared by ELLAKTOR S.A. (the“Company”). The information contained in this presentation has not been independently verified and no representation or warranty, express or implied, is made as to, and no reliance should be placed on, the fairness, accuracy, comple
Slide 16: Contact details
Contact details Antony Hadjioannou Interim Group CFO e-mail: ahadjioannou@ellaktor.com Stergios Pitoskas Investor Relations e-mail: spitoskas@ellaktor.com ELLAKTOR S.A. 25, Ermou St., GR 145 64 Nea Kifissia, Greece Athens TEL.: +30 210 8185000 FAX : +30 210 8185001 e-mail: info@ellaktor.com website:
Source: Internet Archive copy of ellaktor.com
More decks from Ellaktor SA
 FY2025 Earnings Presentation23 slides · Apr 17, 2026
 FY2024 Earnings Presentation30 slides · Apr 24, 2025
 H1 2024 Earnings Presentation30 slides · Sep 12, 2024
 FY2023 Earnings Presentation32 slides · Apr 18, 2024
 9M 2023 Earnings Presentation31 slides · Nov 23, 2023
 9M 2023 Earnings Presentation48 slides · November 2023