Tecan Group AG · SIX:TECN
Tecan — Agriculture and Agri-Food Canada — Tecan Symposium 2010
42 slides from Tecan's conference presentation, 2010
Slide 1: Challenges in the development and application of molecular tools for the detection of food-borne viruses
Challenges in the development and application of molecular tools for the detection of food-borne viruses Alain Houde Agriculture and Agri-Food Canada Tecan Symposium 2010 Salzburg, Austria
Slide 2: Outline
Outline Background Challenges for the detection of viruses in foods Developing Canadian standards Conclusion 2
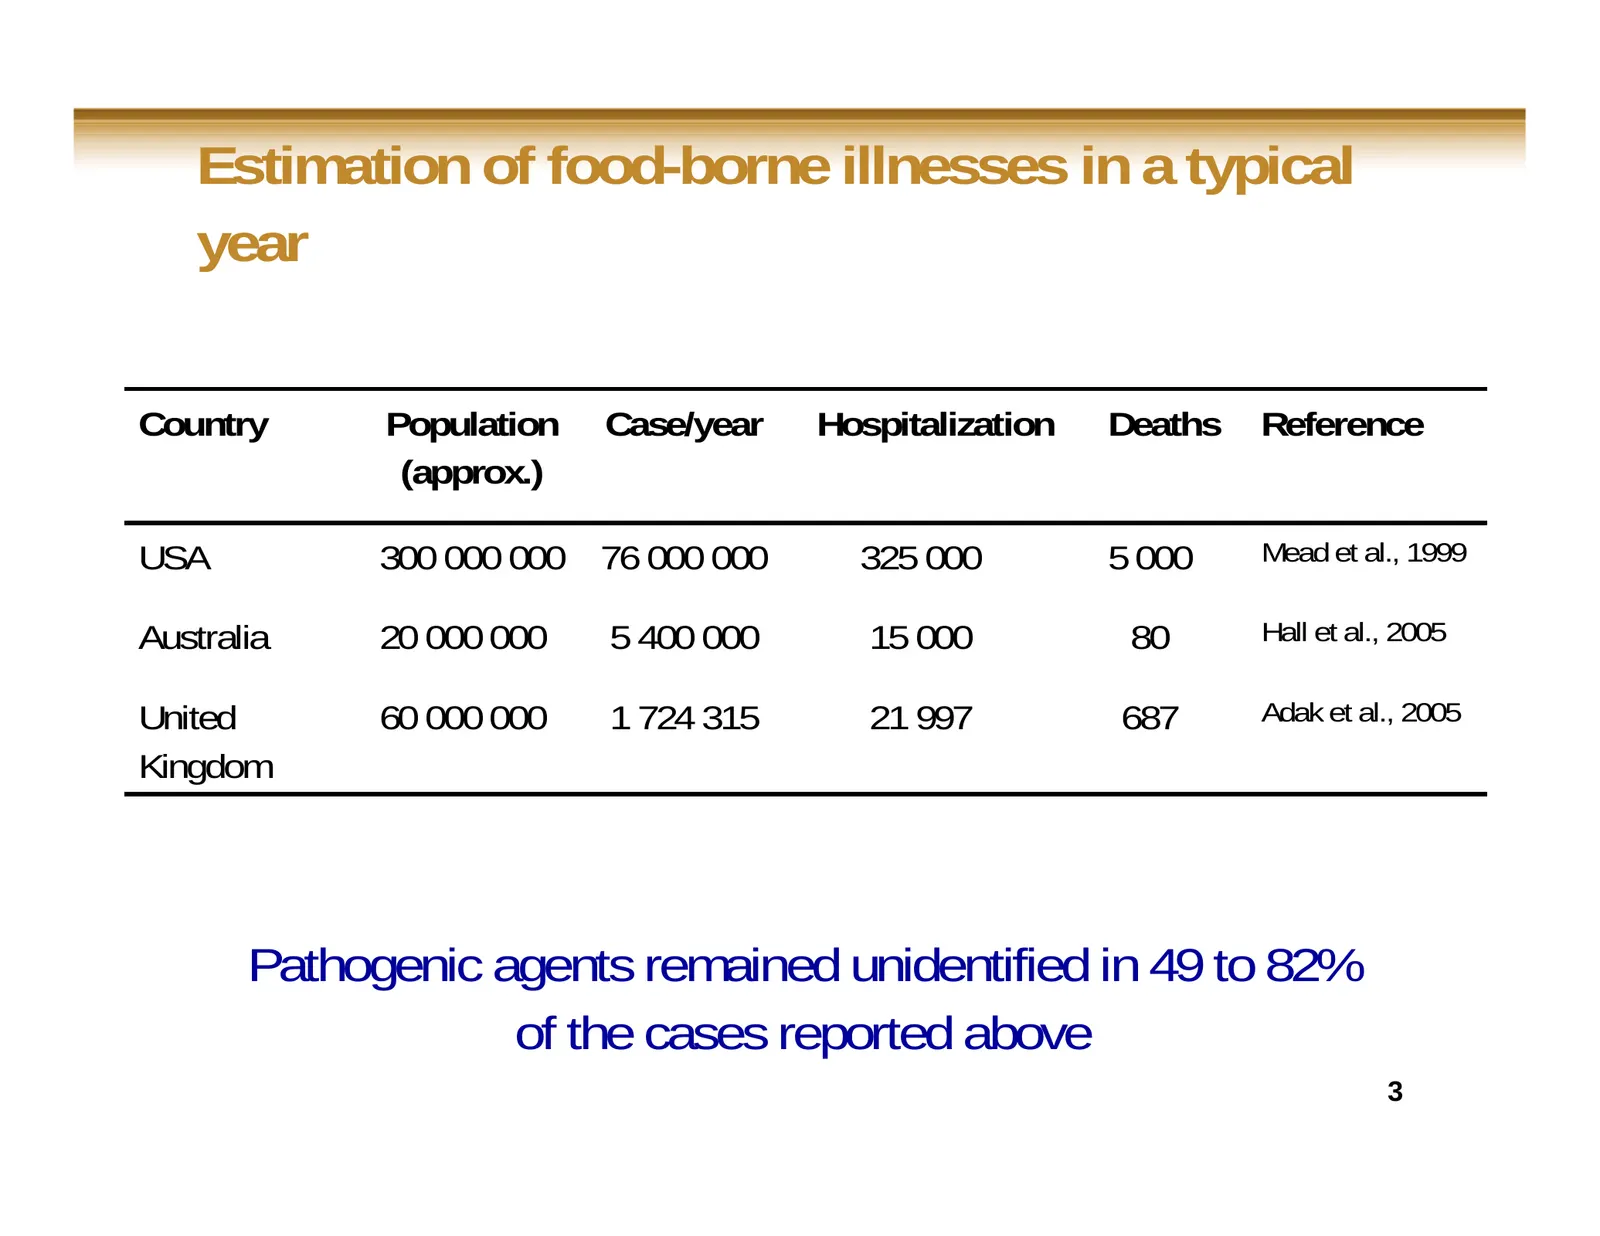
Slide 3: Estimation of food-borne illnesses in a typical year
Estimation of food-borne illnesses in a typical year Country Population Case/year Hospitalization Deaths Reference (approx.) USA 300 000 000 76 000 000 325 000 5 000 Mead et al., 1999 Australia 20 000 000 5 400 000 15 000 80 Hall et al., 2005 United 60 000 000 1 724 315 21 997 687 Adak et al., 2005
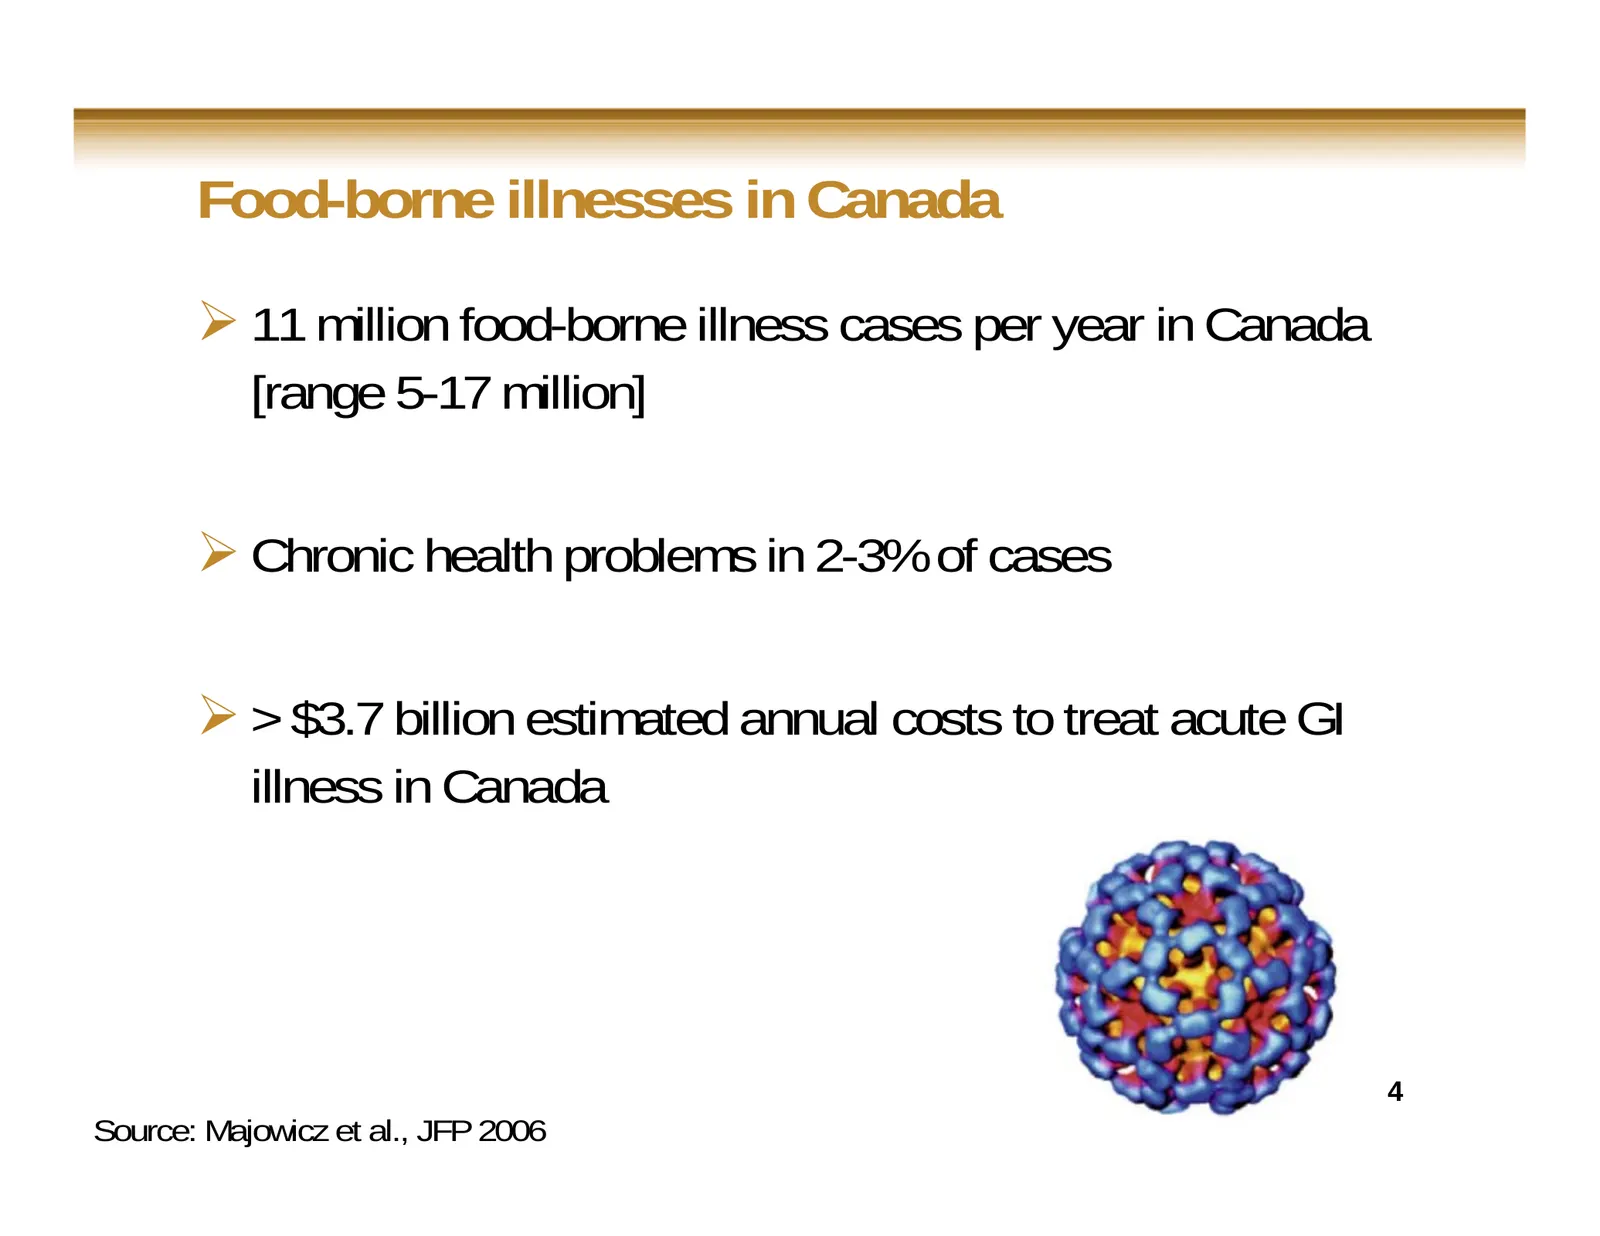
Slide 4: Food-borne illnesses in Canada
Food-borne illnesses in Canada 11 million food-borne illness cases per year in Canada [range 5-17 million] Chronic health problems in 2-3% of cases > $3.7 billion estimated annual costs to treat acute GI illness in Canada 4 Source: Majowicz et al., JFP 2006
Slide 5: Main food- and water-borne viral agents
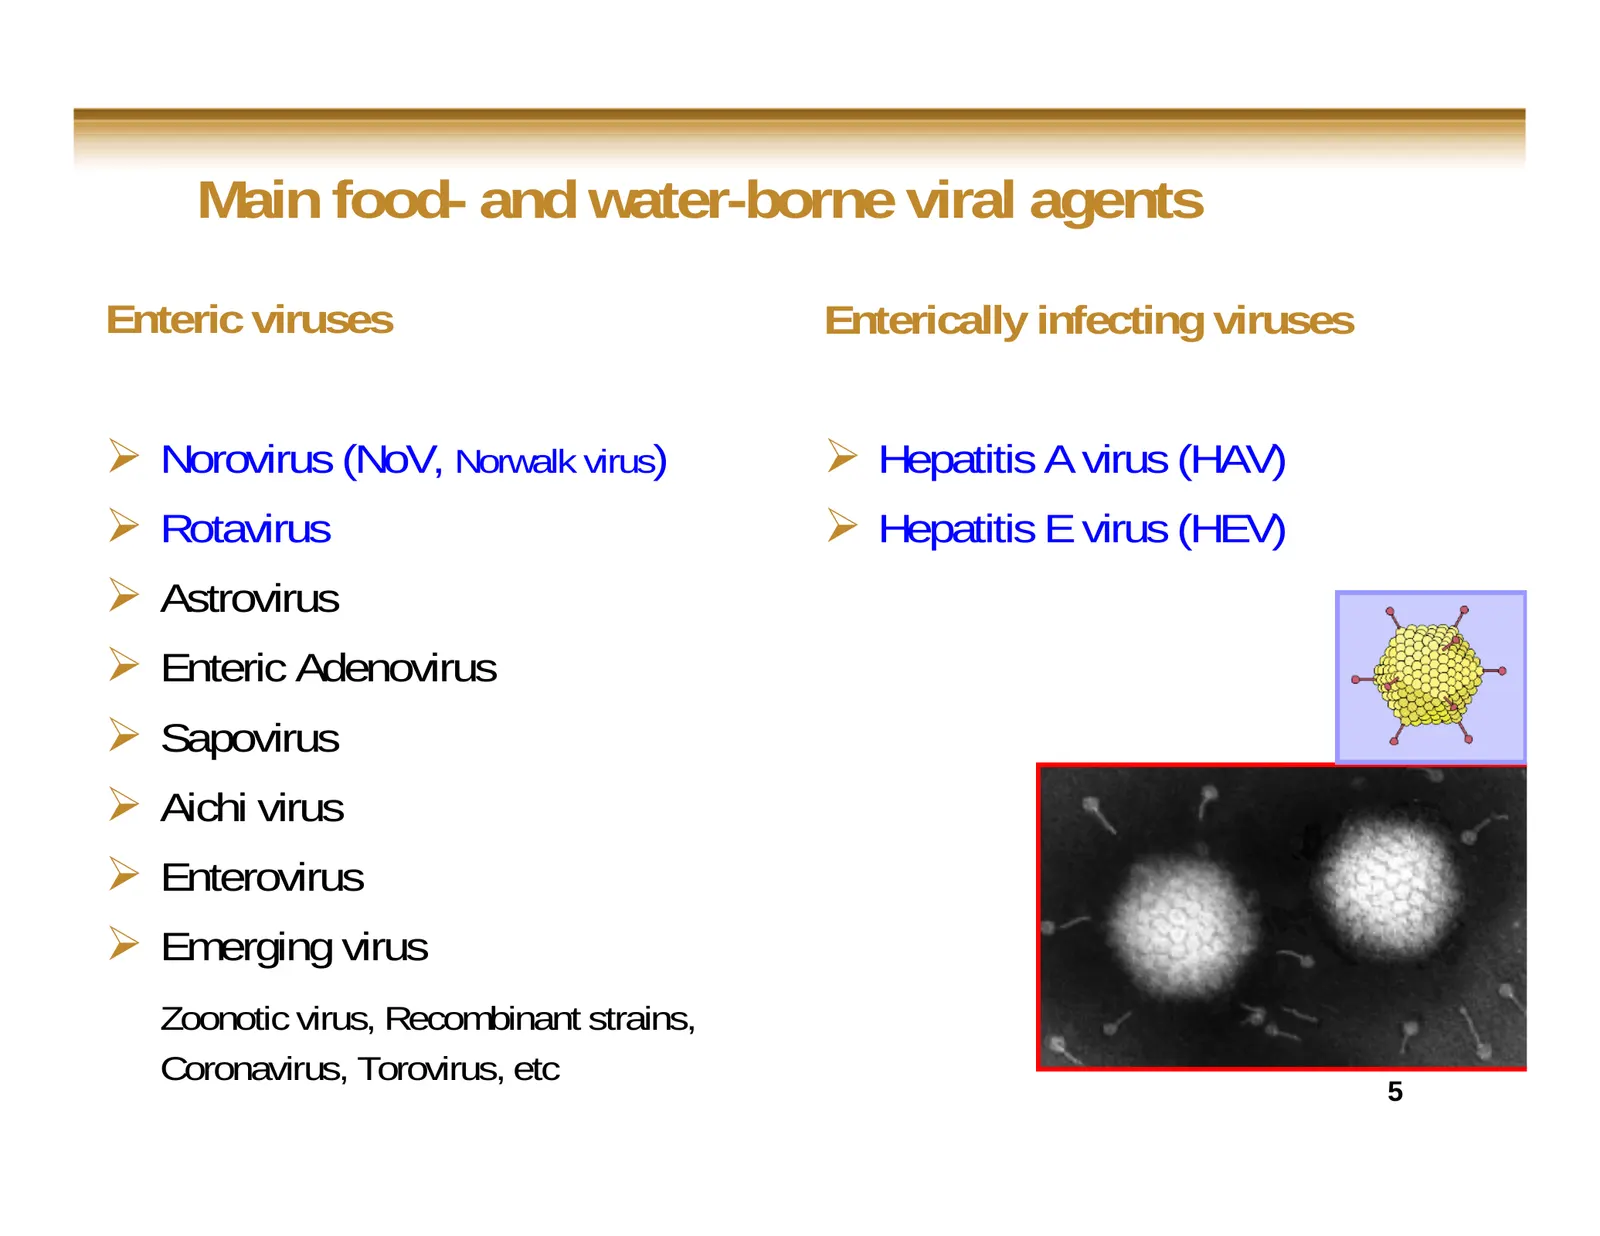
Main food- and water-borne viral agents Enteric viruses Enterically infecting viruses Norovirus (NoV, Norwalk virus) Hepatitis A virus (HAV) Rotavirus Hepatitis E virus (HEV) Astrovirus Enteric Adenovirus Sapovirus Aichi virus Enterovirus Emerging virus Zoonotic virus, Recombinan
Slide 6: AUSTRALIA: Tomato product linked to Hep-A cases
AUSTRALIA: Tomato product linked to Hep-A cases 22.may.09 AAP Sydney Morning Herald A semi-dried tomato product mixed with garlic, herbs and oil has been linked to a spike in hepatitis A cases in at least three states, health authorities say. South Australian director of public health Kevin Buckett
Slide 7: Food- and water-borne virus background
Food- and water-borne virus background Do not replicate in food, in water or on surfaces Are stable in the environment, food and water for long periods of time Do not grow or grow with difficulty in cell culture Cannot be enriched before detection 7
Slide 8: Food- and water-borne virus background
Food- and water-borne virus background Low infectious dose (10-100 viral particles) Food, water and environmental samples Excreted in large amount in feces (106-108 viral particles/ml) Clinical samples 8
Slide 9: Virus detection methods
Virus detection methods Traditional method (Cell culture) Electronic microscopy (requires 106 viral particles/g of stools) Immunological methods (Immunofluorescence, ELISA) Molecular methods 9
Slide 10: Virus detection methods: sensitivity
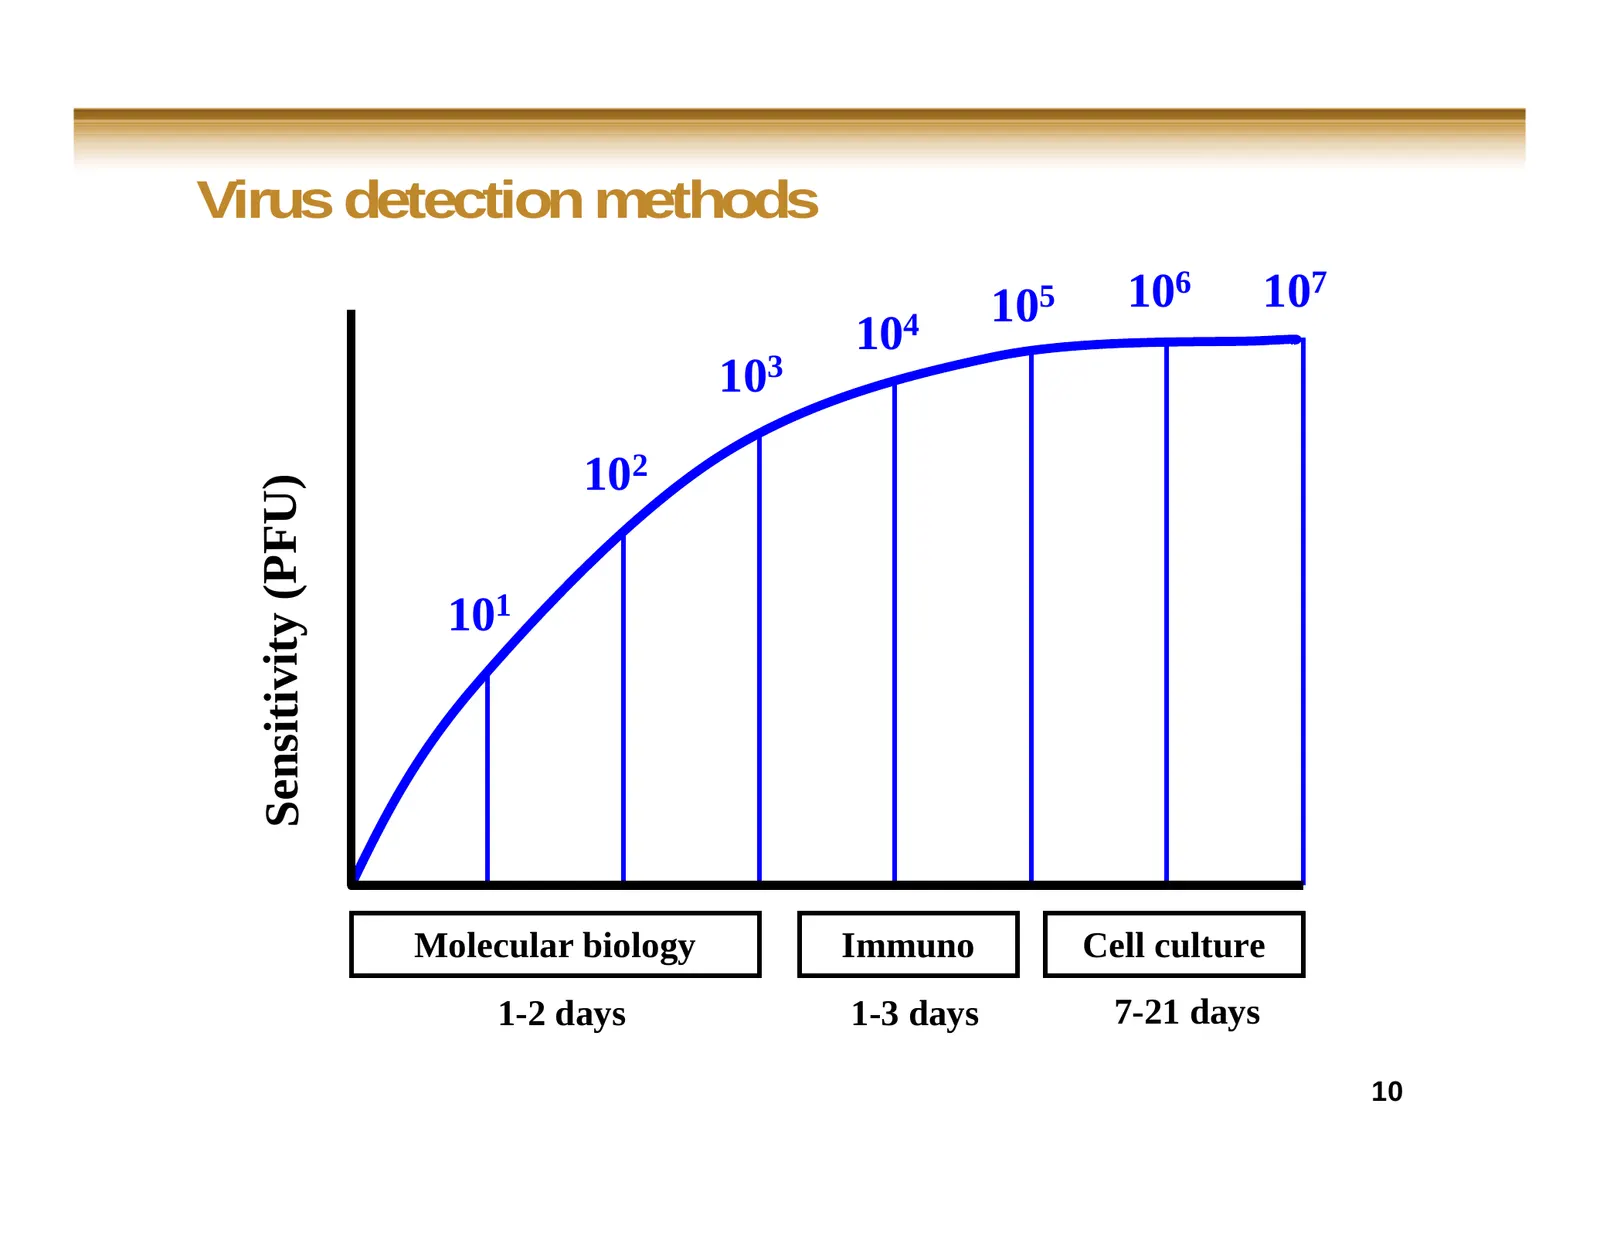
Virus detection methods 105 106 107 104 103 102 Sensitivity (PFU) 101 Molecular biology Immuno Cell culture 1-2 days 1-3 days 7-21 days 10
Slide 11: Virus detection methods
Virus detection methods Molecular detection (amplification of nucleic acid) methods could be sensitive enough and suitable to detect the presence of viral RNA in food, water and environment samples 11
Slide 12: Challenges for the detection of viruses in foods
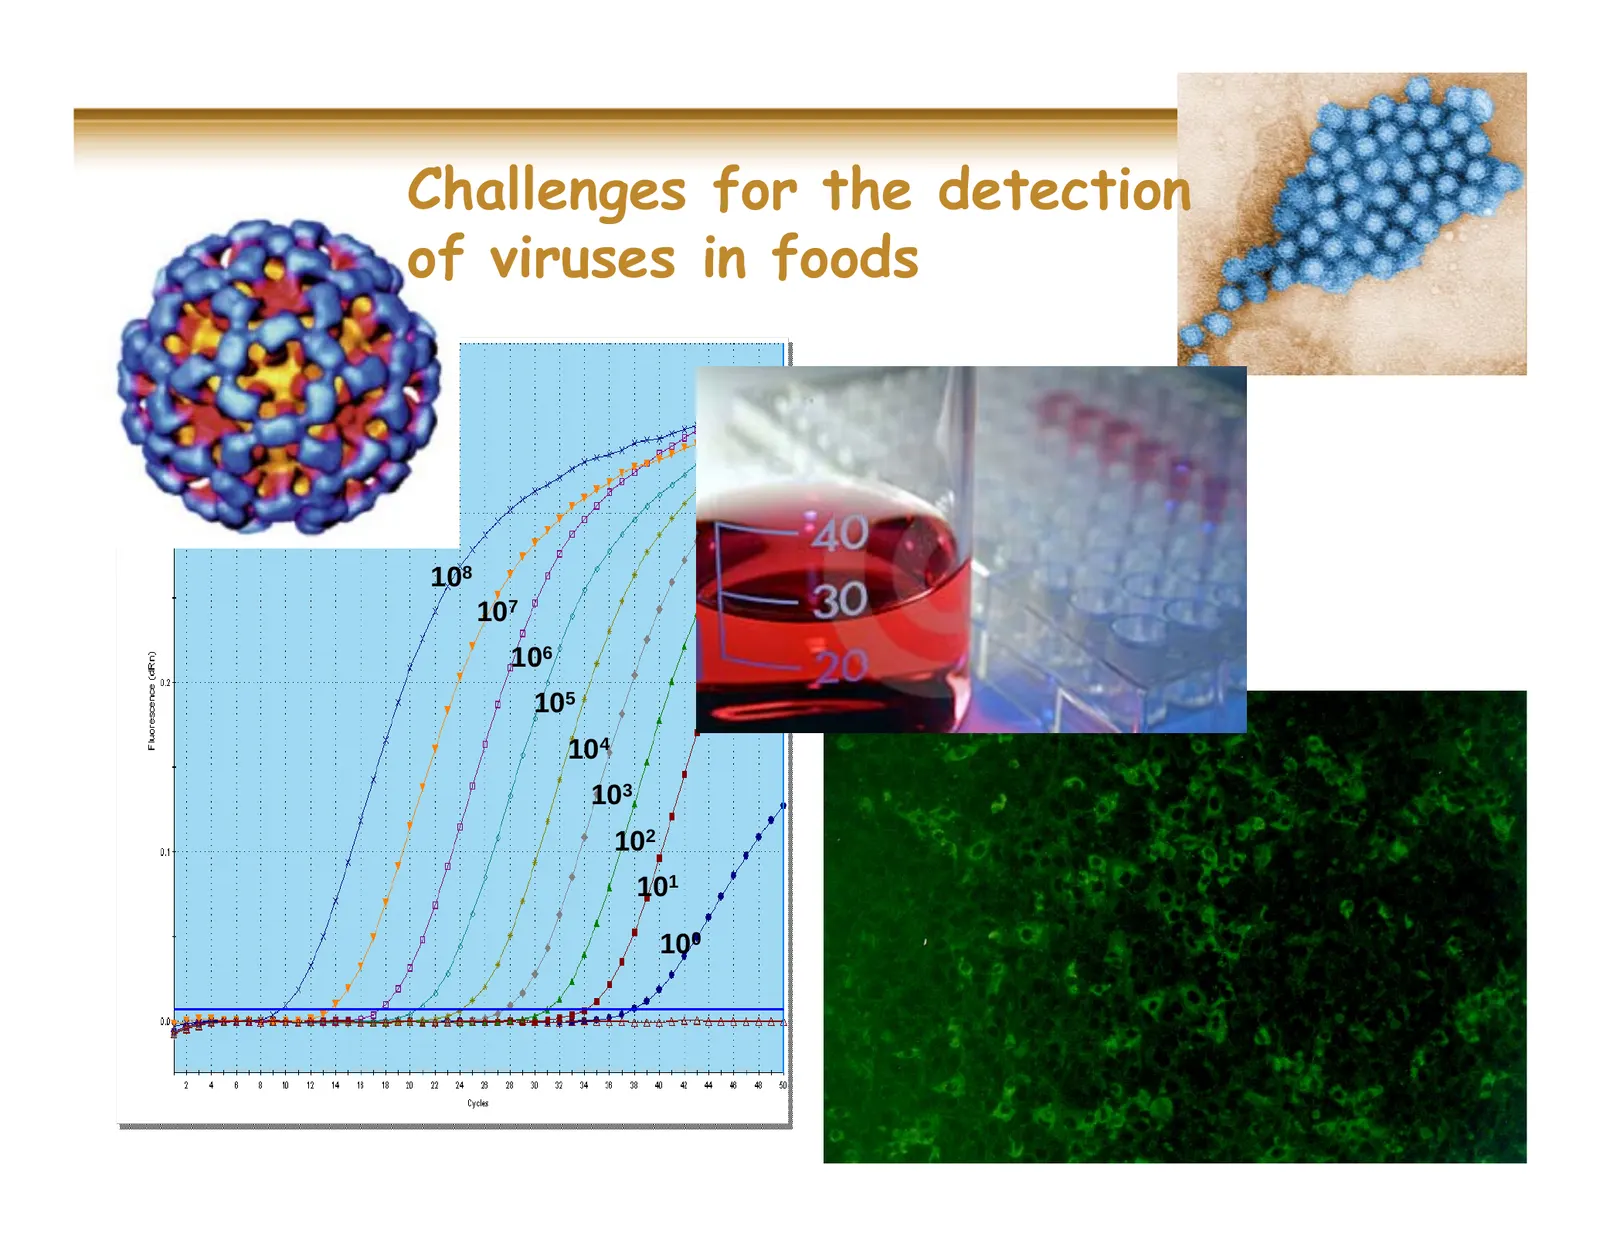
Challenges for the detection of viruses in foods 108 107 106 105 104 103 102 101 100
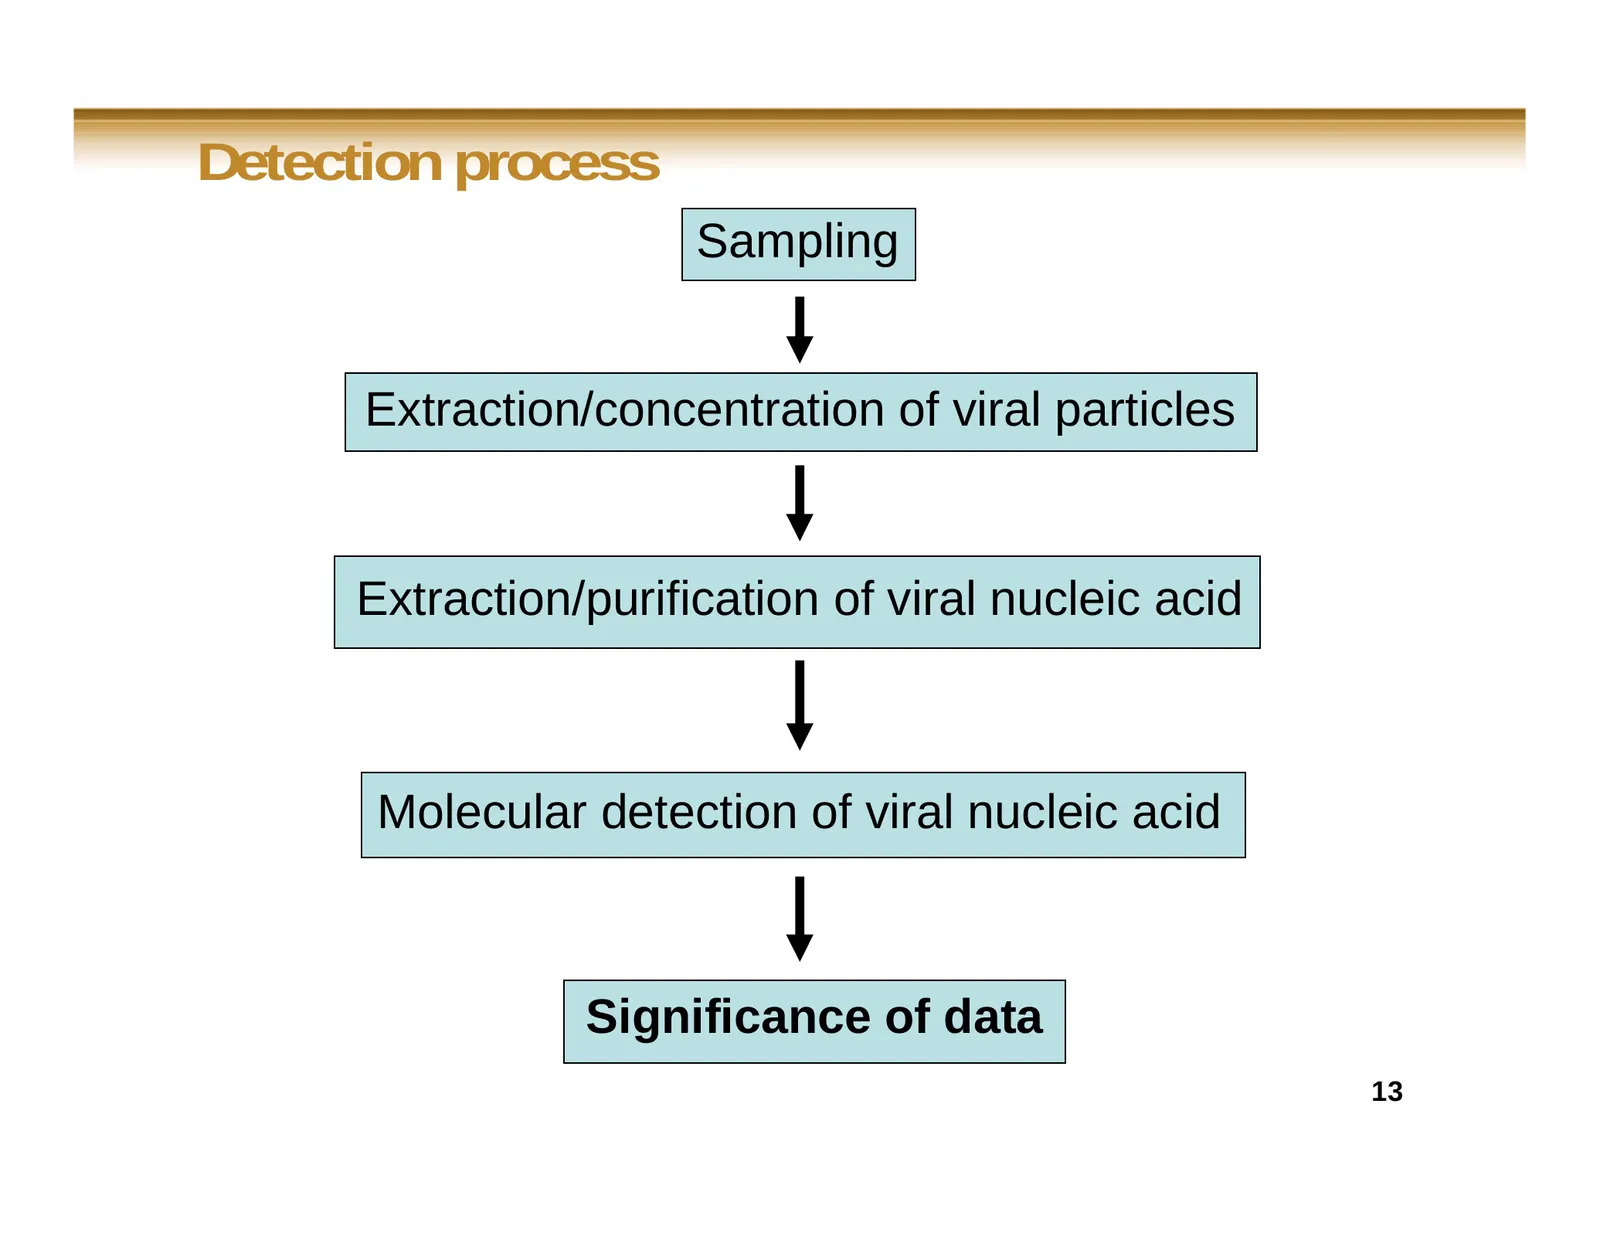
Slide 13: Detection process
Detection process Sampling Extraction/concentration of viral particles Extraction/purification of viral nucleic acid Molecular detection of viral nucleic acid Significance of data 13
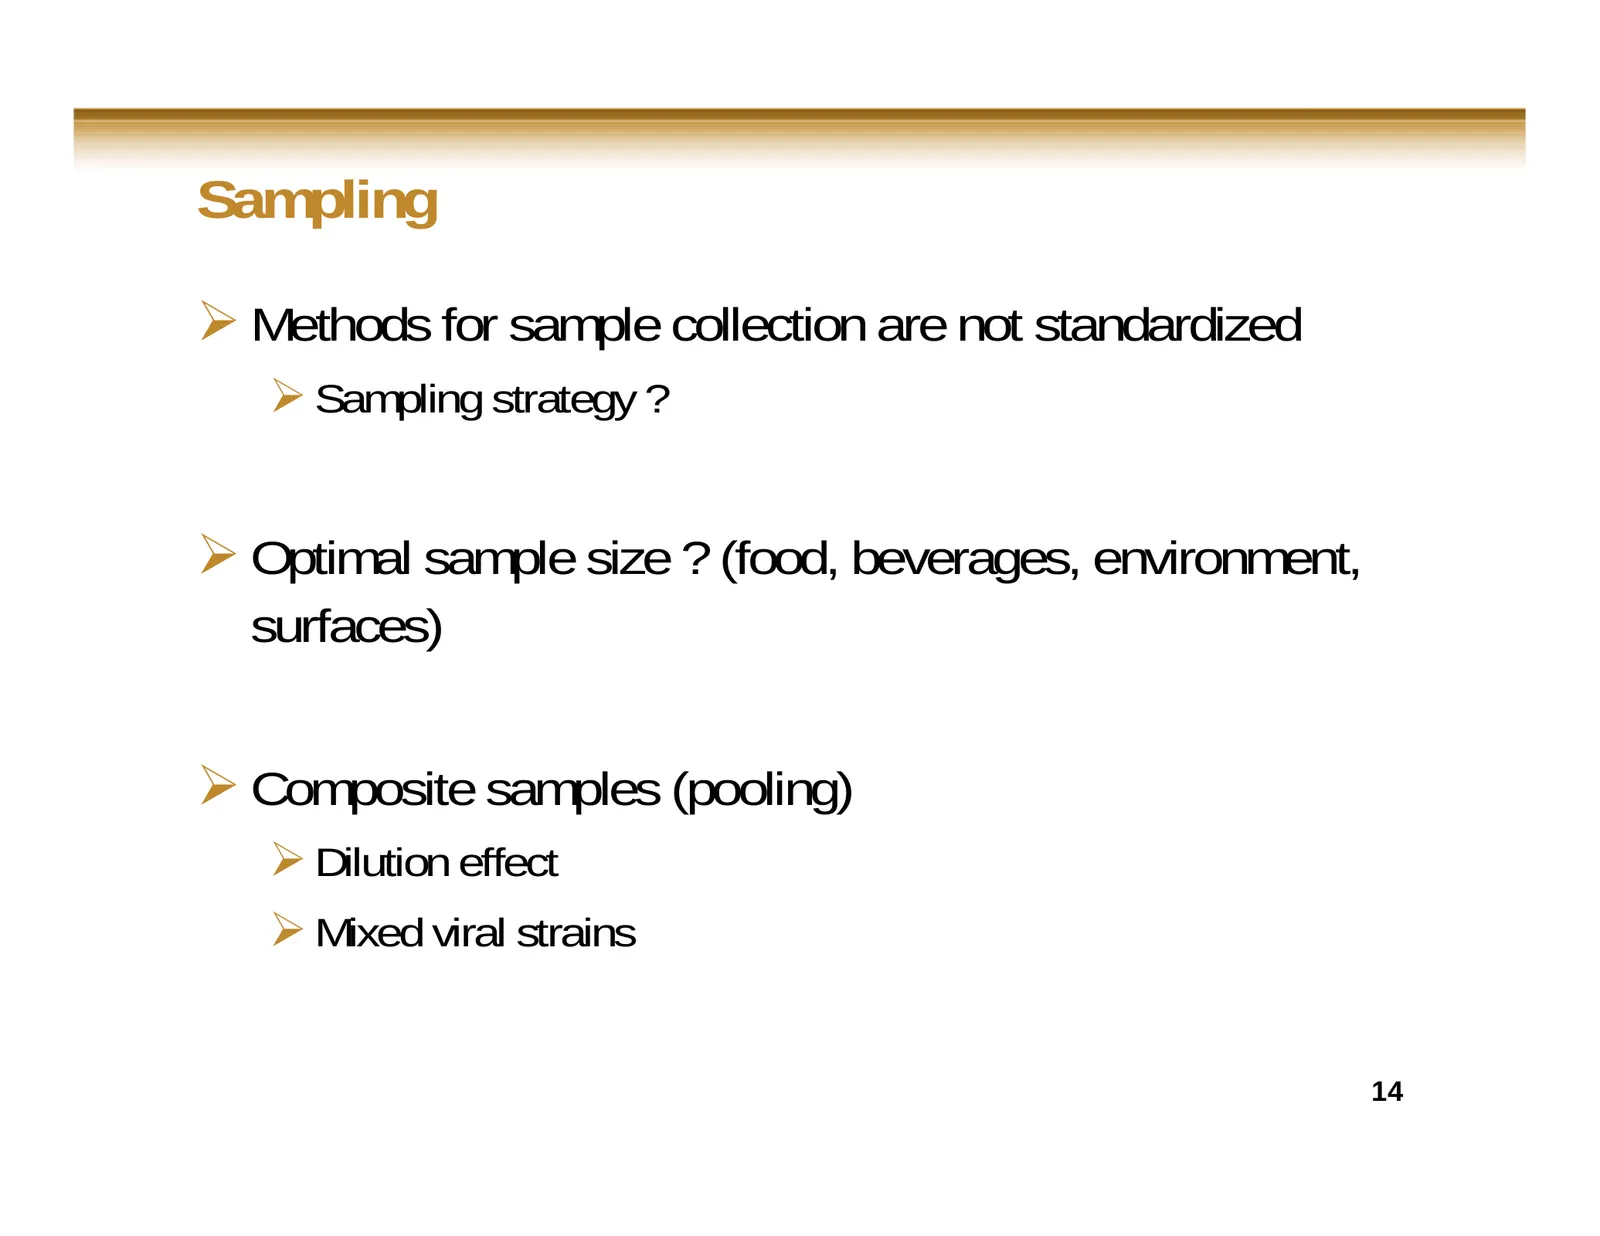
Slide 14: Sampling
Sampling Methods for sample collection are not standardized Sampling strategy ? Optimal sample size ? (food, beverages, environment, surfaces) Composite samples (pooling) Dilution effect Mixed viral strains 14
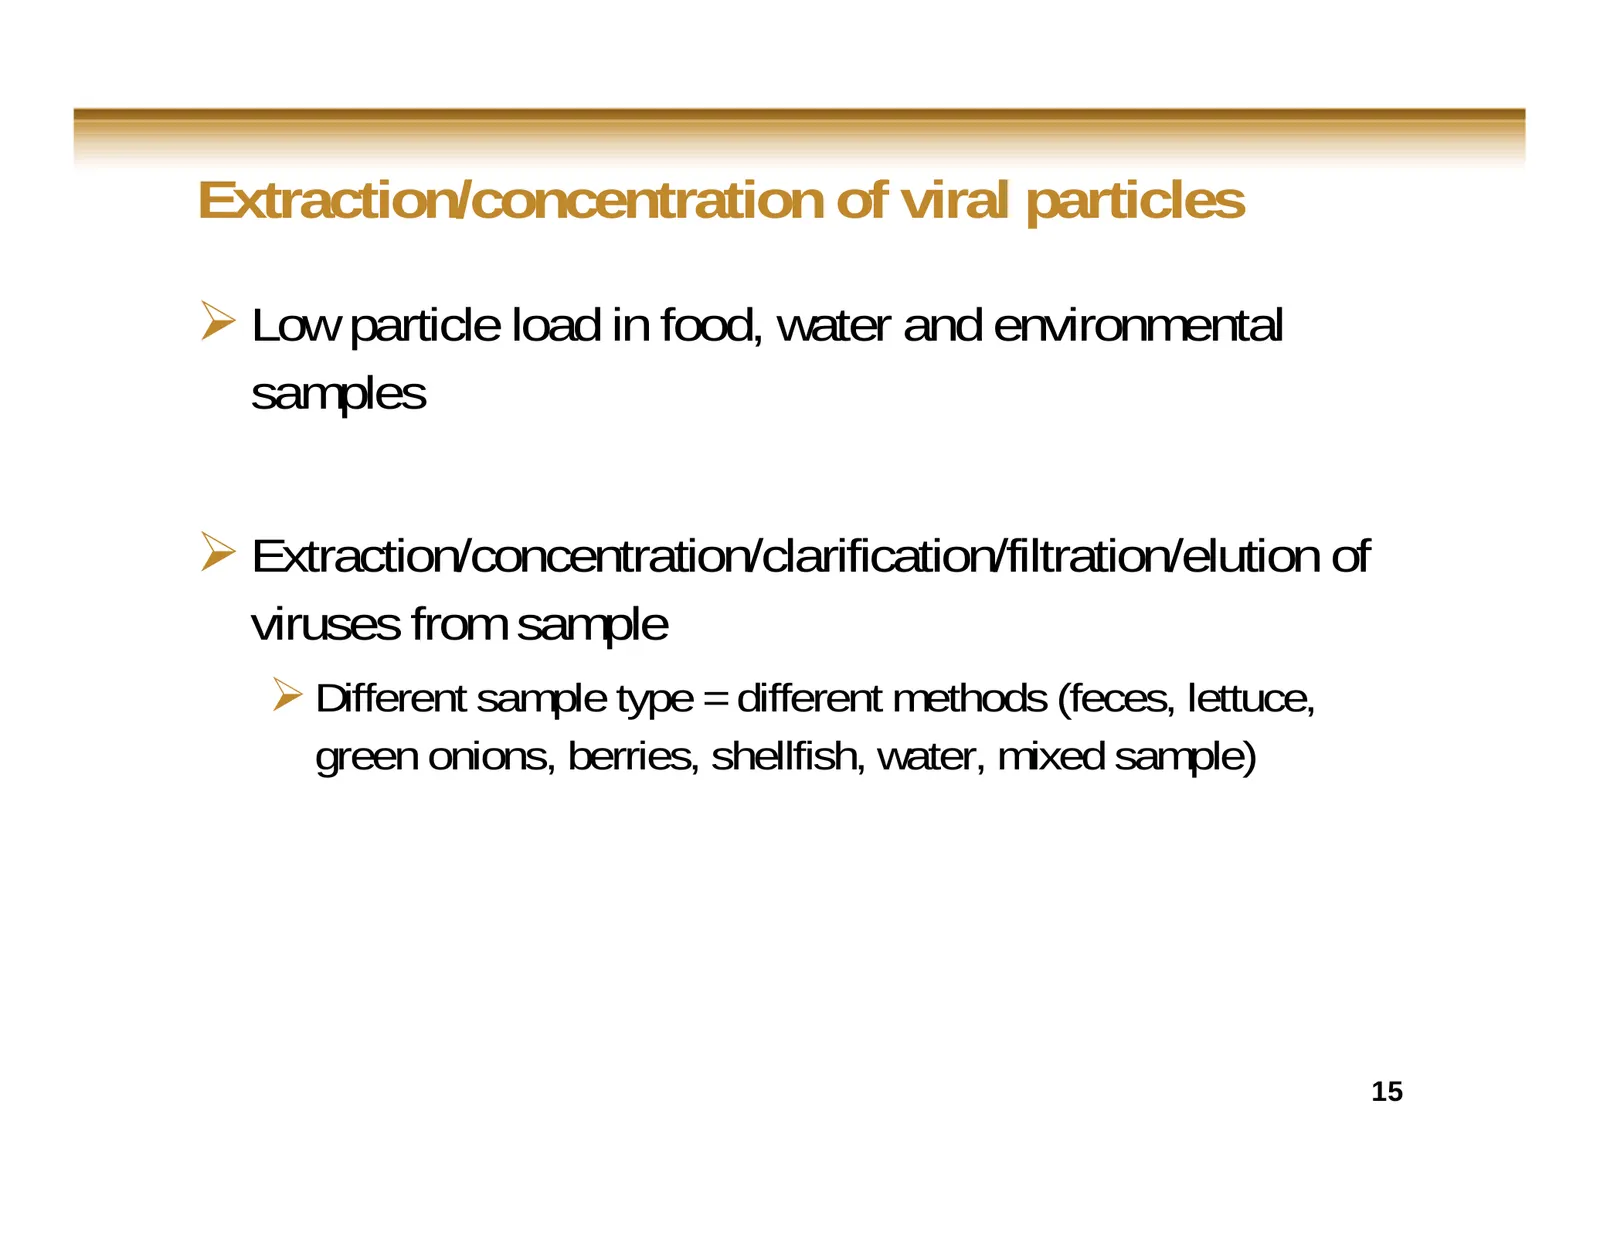
Slide 15: Extraction/concentration of viral particles
Extraction/concentration of viral particles Low particle load in food, water and environmental samples Extraction/concentration/clarification/filtration/elution of viruses from sample Different sample type = different methods (feces, lettuce, green onions, berries, shellfish, water, mixed samp
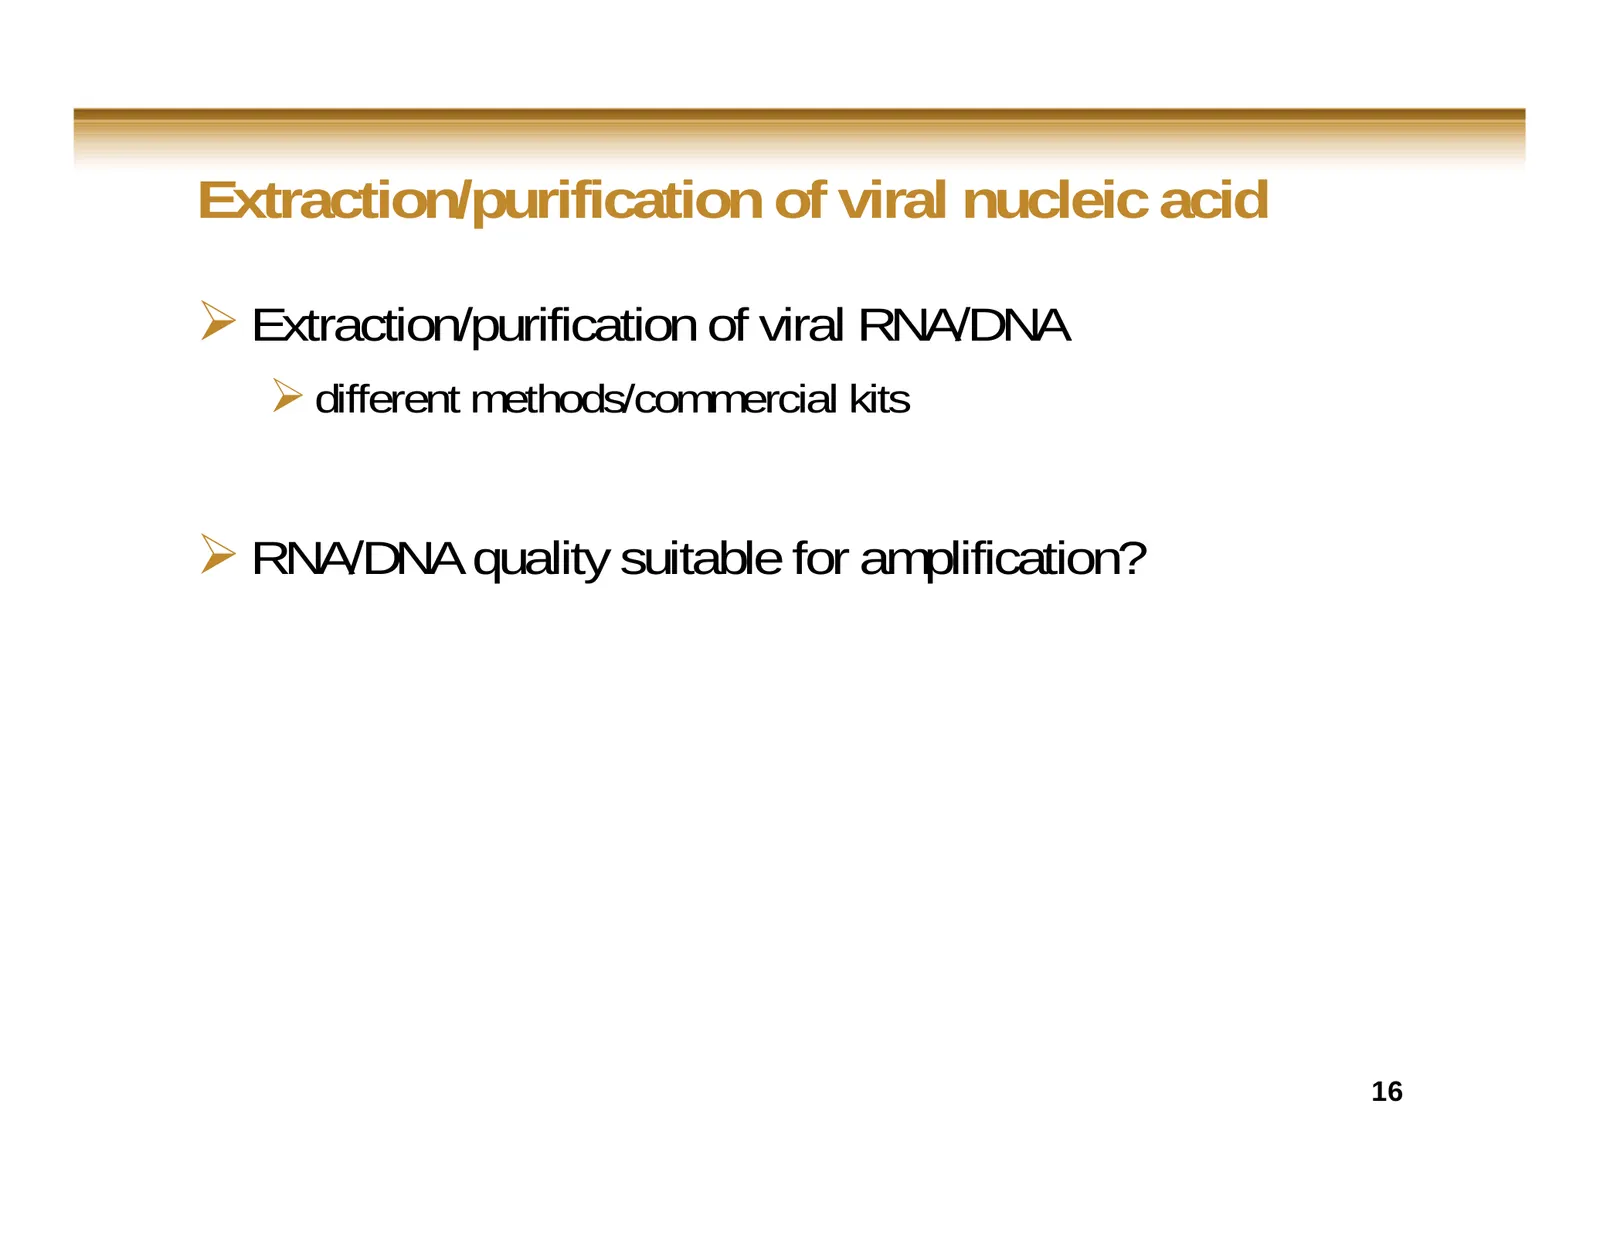
Slide 16: Extraction/purification of viral nucleic acid
Extraction/purification of viral nucleic acid Extraction/purification of viral RNA/DNA different methods/commercial kits RNA/DNA quality suitable for amplification? 16
Slide 17: Extraction/concentration/purification process
Extraction/concentration/purification process Extraction/concentration/ of viral particles and nucleic acid material from food, water and environment samples represent a critical step for viral RNA/DNA detection Co-extraction of inhibitors ? Efficiency/reproducibility ? Low vs high viral load
Slide 18: Molecular detection
Molecular detection Nucleic acid amplification-based techniques (RT-PCR, RT-qPCR: 1-step vs 2-step RT-PCR) Specificity of primers and probes to target viruses Detection of viral RNA/DNA (specificity, sensitivity, false-negative, false-positive) Molecular characterization of viral strains by
Slide 19: Molecular detection: disadvantages
Molecular detection: disadvantages Small reaction volume Cannot discriminate between infectious and non infectious particles (processed food, water treatment, disinfection) Genetic diversity of viruses (new strains, reassortant, recombinant) Cross-contamination 19
Slide 20: Significance of data
Significance of data Positive RT-PCR results Infectious/non infectious particles ?, contamination Negative RT-PCR results = not detected Appropriate controls, below limit of detection, specificity (new strain), failure in extraction of viral particles or nucleic material process, inhibitors,
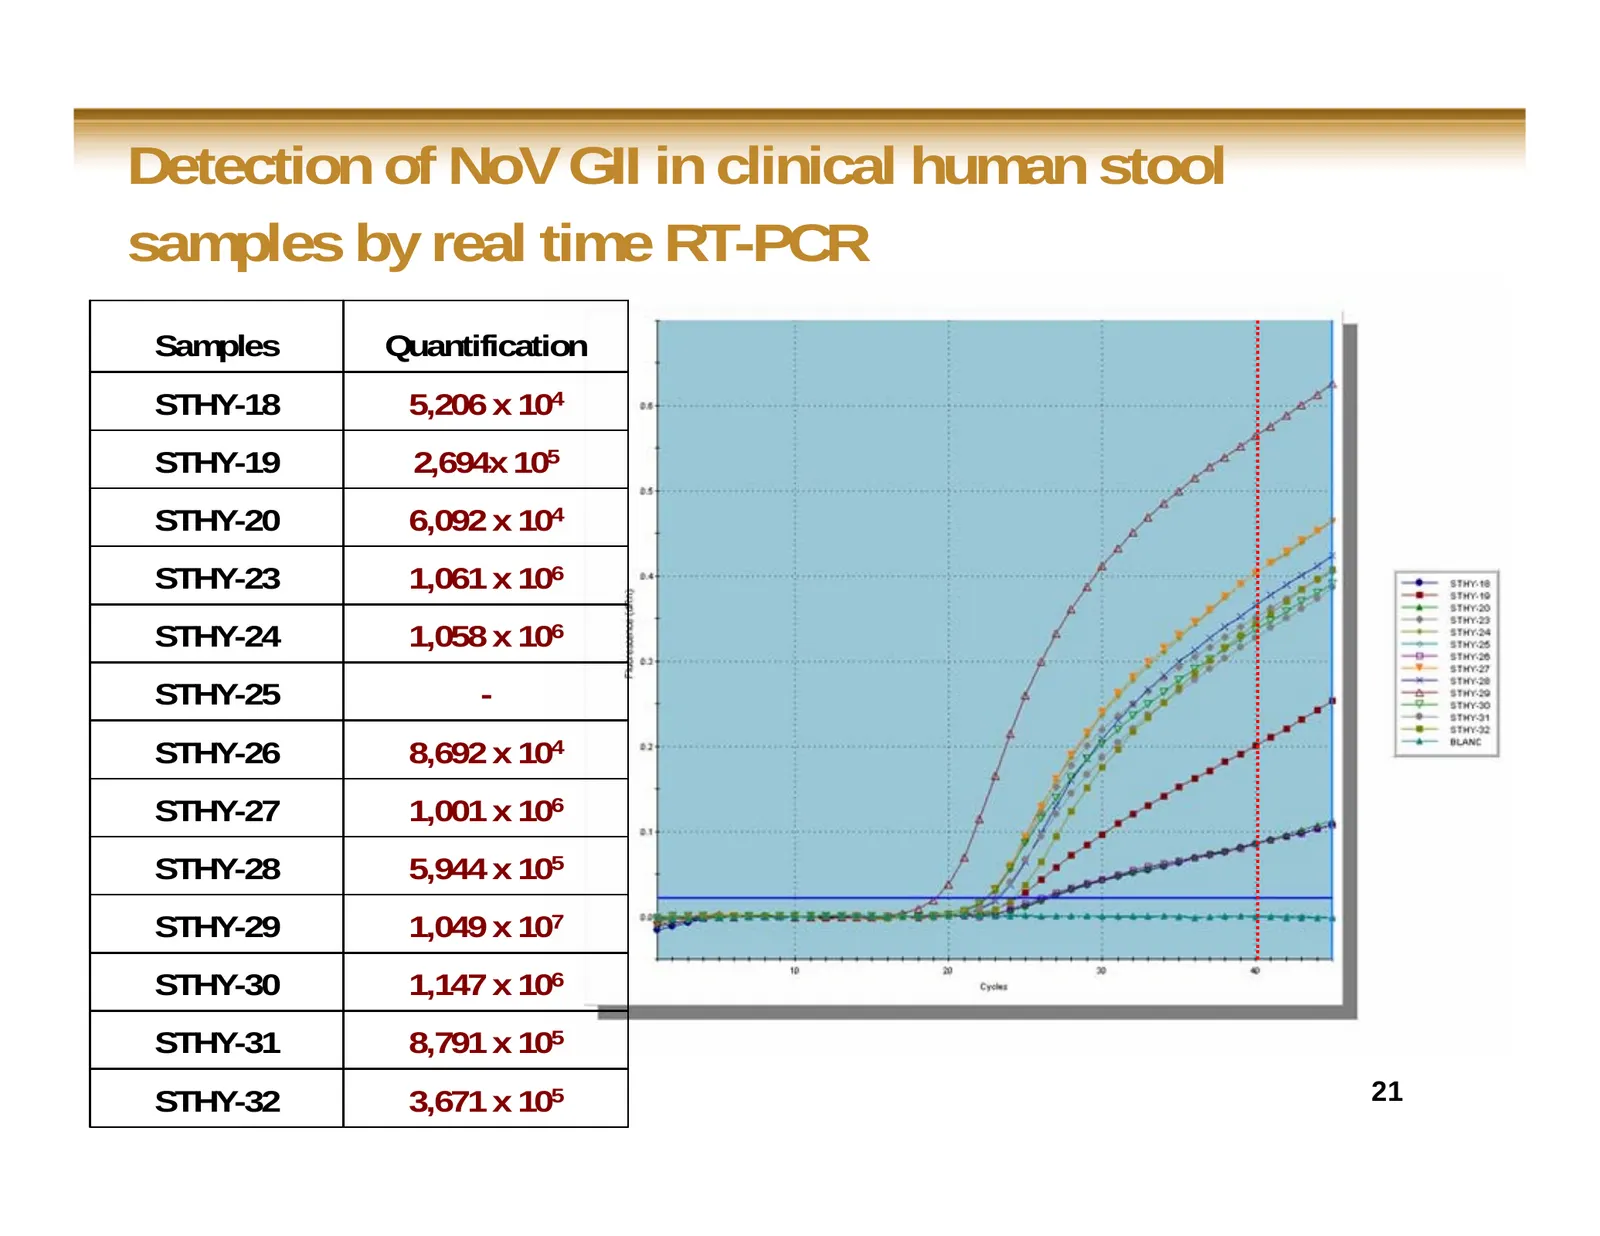
Slide 21: Detection of NoV GII in clinical human stool samples by real time RT-PCR
Detection of NoV GII in clinical human stool samples by real time RT-PCR Samples Quantification STHY-18 5,206 x 104 STHY-19 2,694x 105 STHY-20 6,092 x 104 STHY-23 1,061 x 106 STHY-24 1,058 x 106 STHY-25 - STHY-26 8,692 x 104 STHY-27 1,001 x 106 STHY-28 5,944 x 105 STHY-29 1,049 x 107 STHY-30 1,147 x
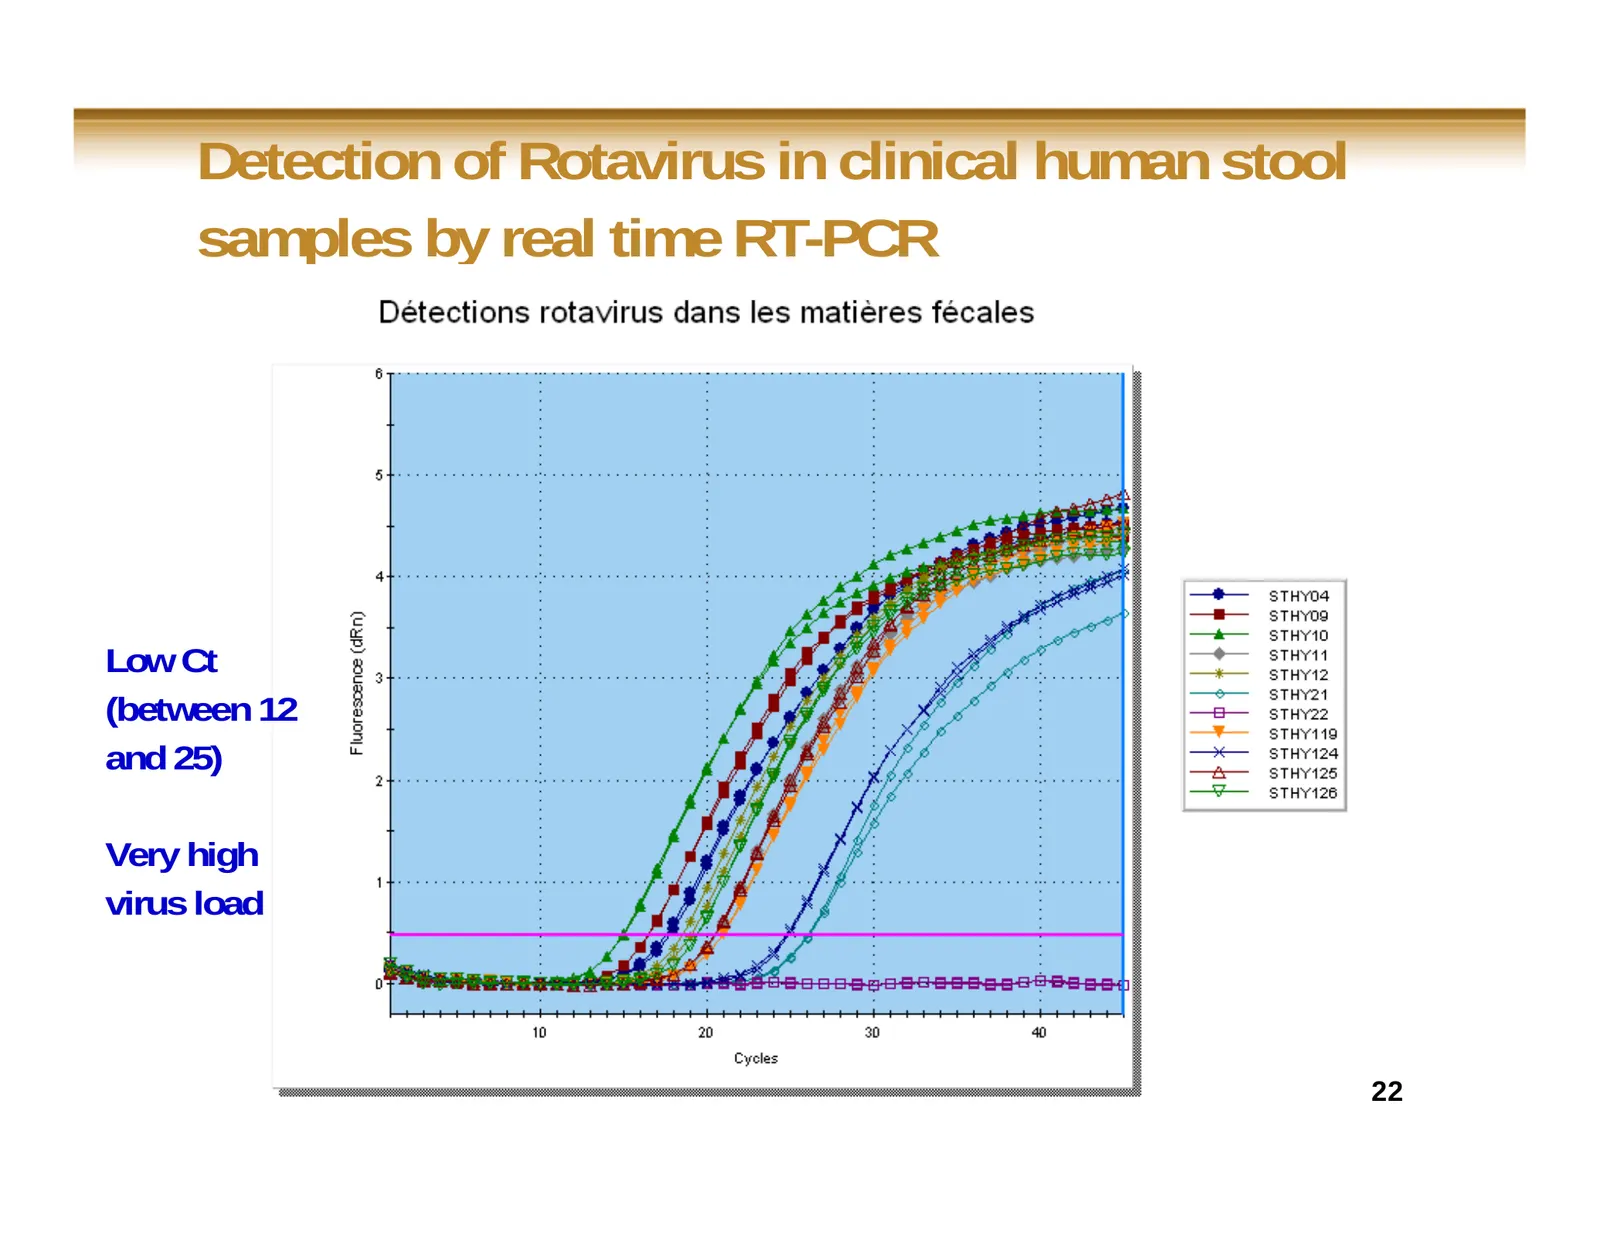
Slide 22: Detection of Rotavirus in clinical human stool samples by real time RT-PCR
Detection of Rotavirus in clinical human stool samples by real time RT-PCR Low Ct (between 12 and 25) Very high virus load 22
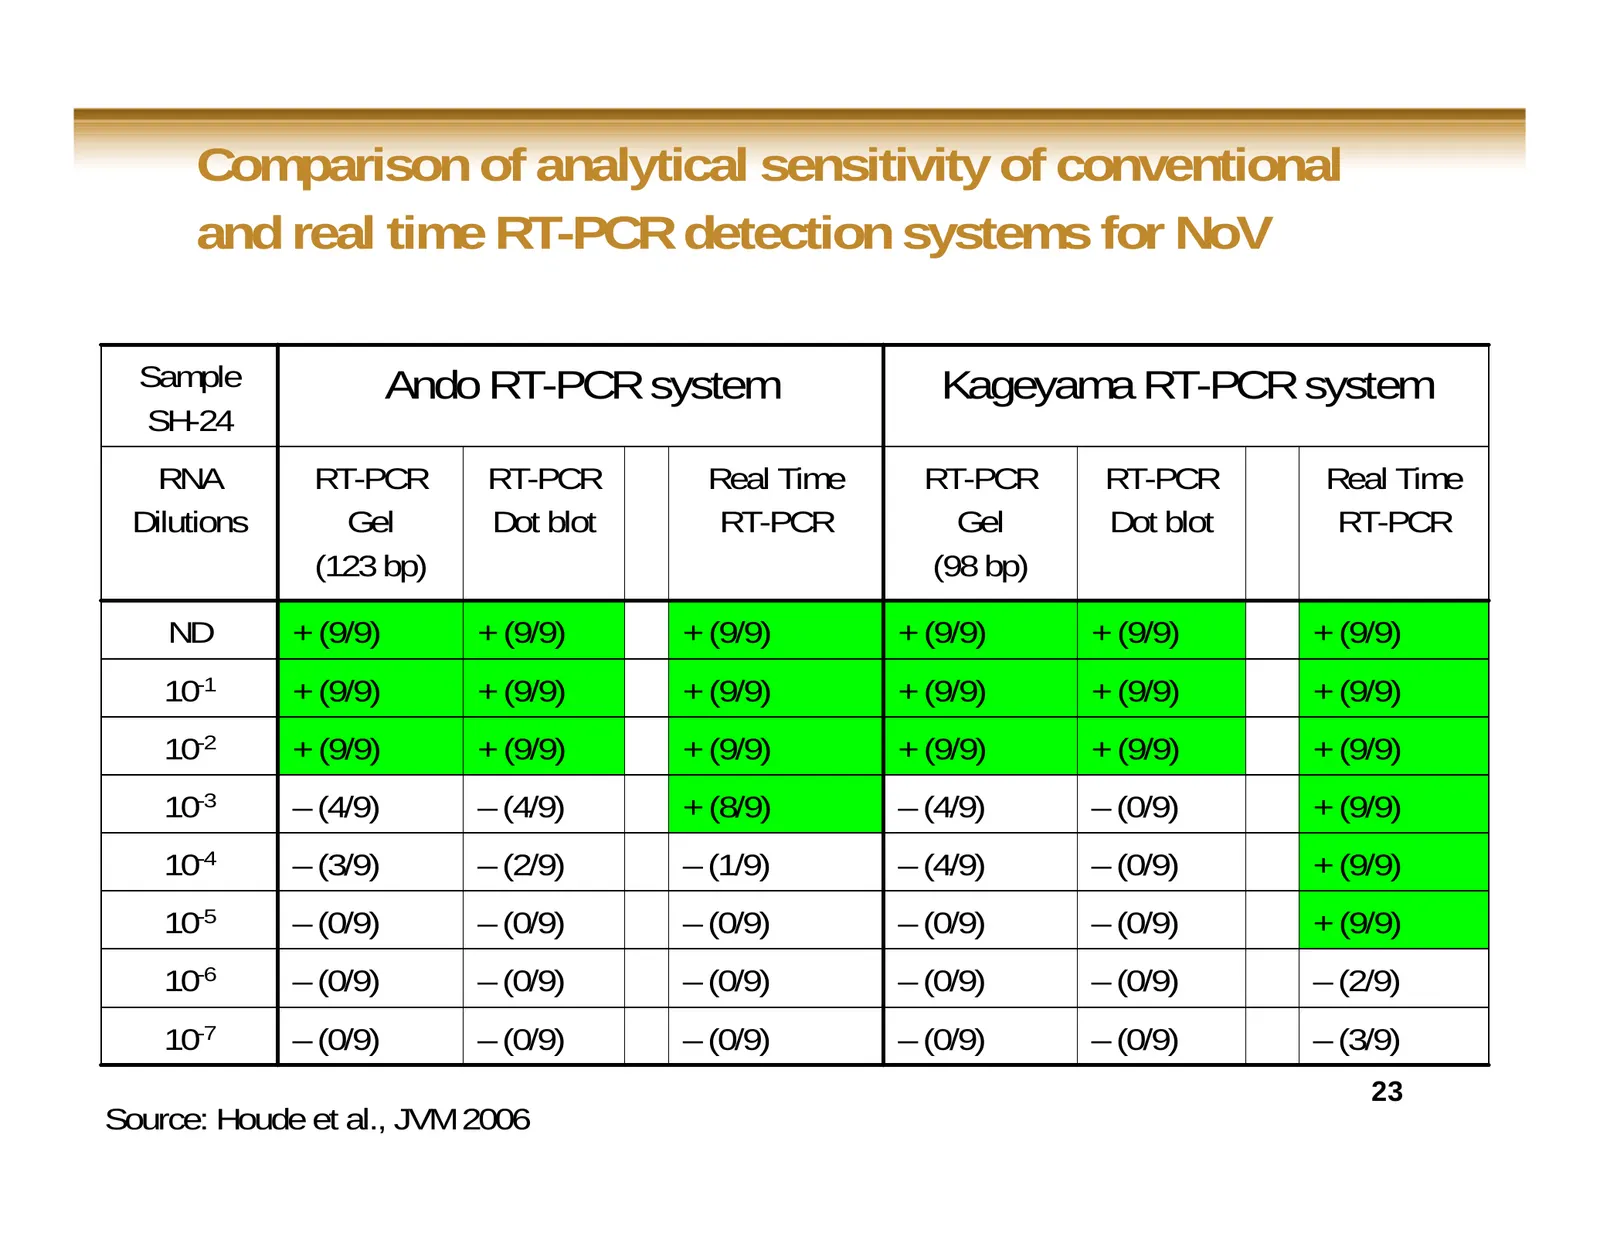
Slide 23: Comparison of analytical sensitivity of conventional and real time RT-PCR for NoV
Comparison of analytical sensitivity of conventional and real time RT-PCR detection systems for NoV Sample Ando RT-PCR system Kageyama RT-PCR system SH-24 RNA RT-PCR RT-PCR Real Time RT-PCR RT-PCR Real Time Dilutions Gel Dot blot RT-PCR Gel Dot blot RT-PCR (123 bp) (98 bp) ND + (9/9) + (9/9) + (9/9)
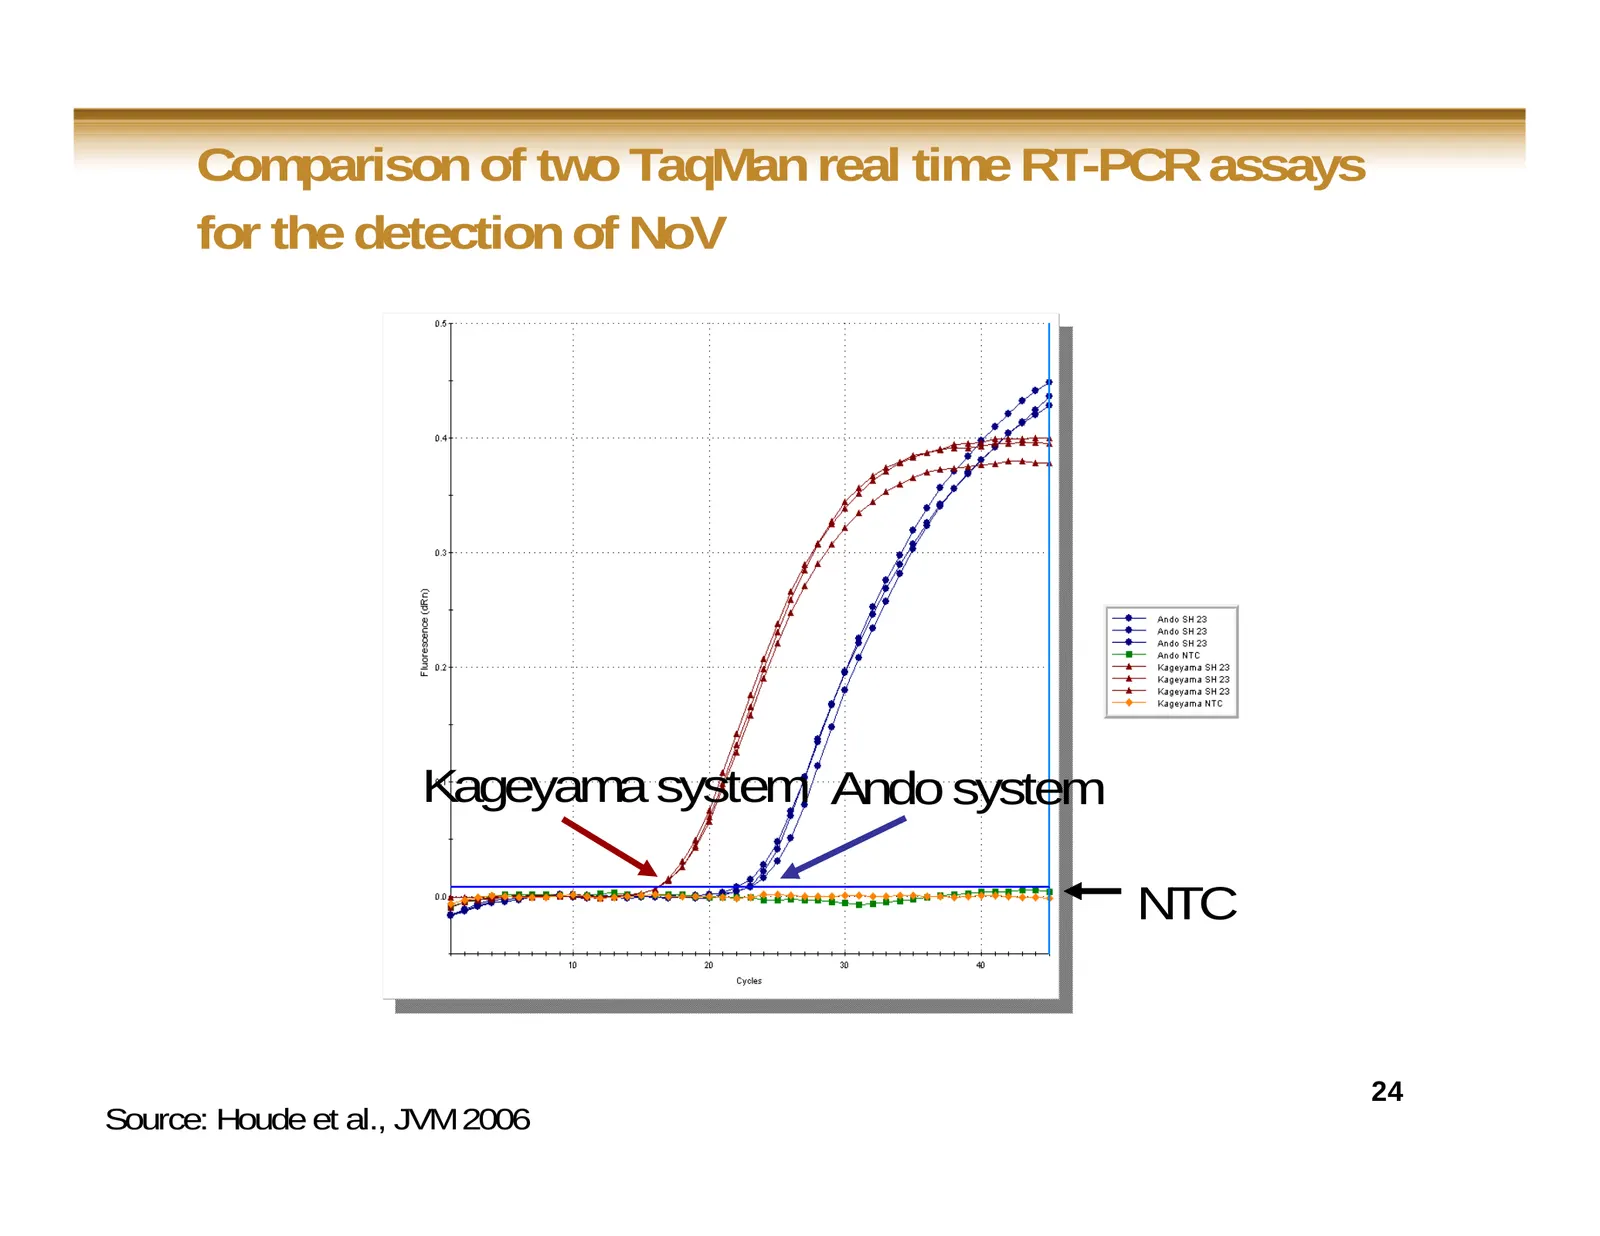
Slide 24: Comparison of two TaqMan real time RT-PCR assays for the detection of NoV
Comparison of two TaqMan real time RT-PCR assays for the detection of NoV Kageyama system Ando system NTC 24 Source: Houde et al., JVM 2006
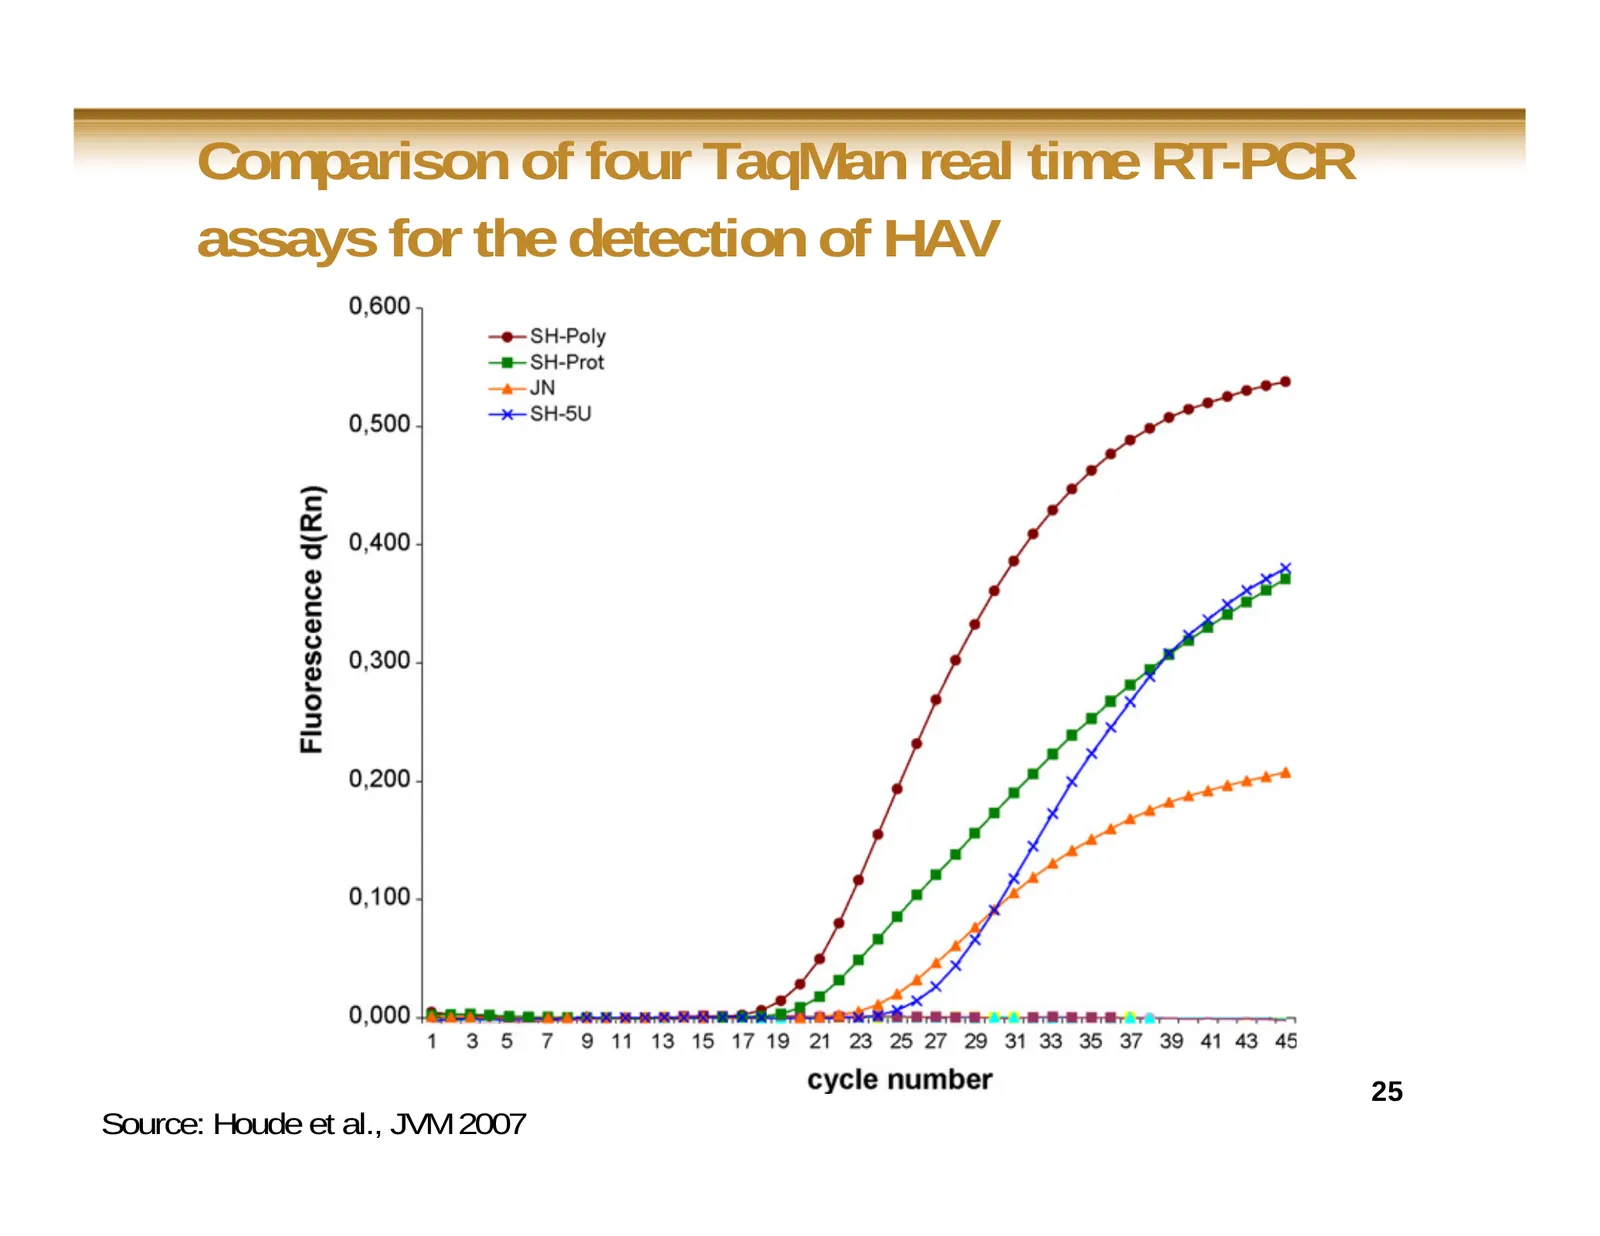
Slide 25: Comparison of four TaqMan real time RT-PCR assays for the detection of HAV
Comparison of four TaqMan real time RT-PCR assays for the detection of HAV 25 Source: Houde et al., JVM 2007
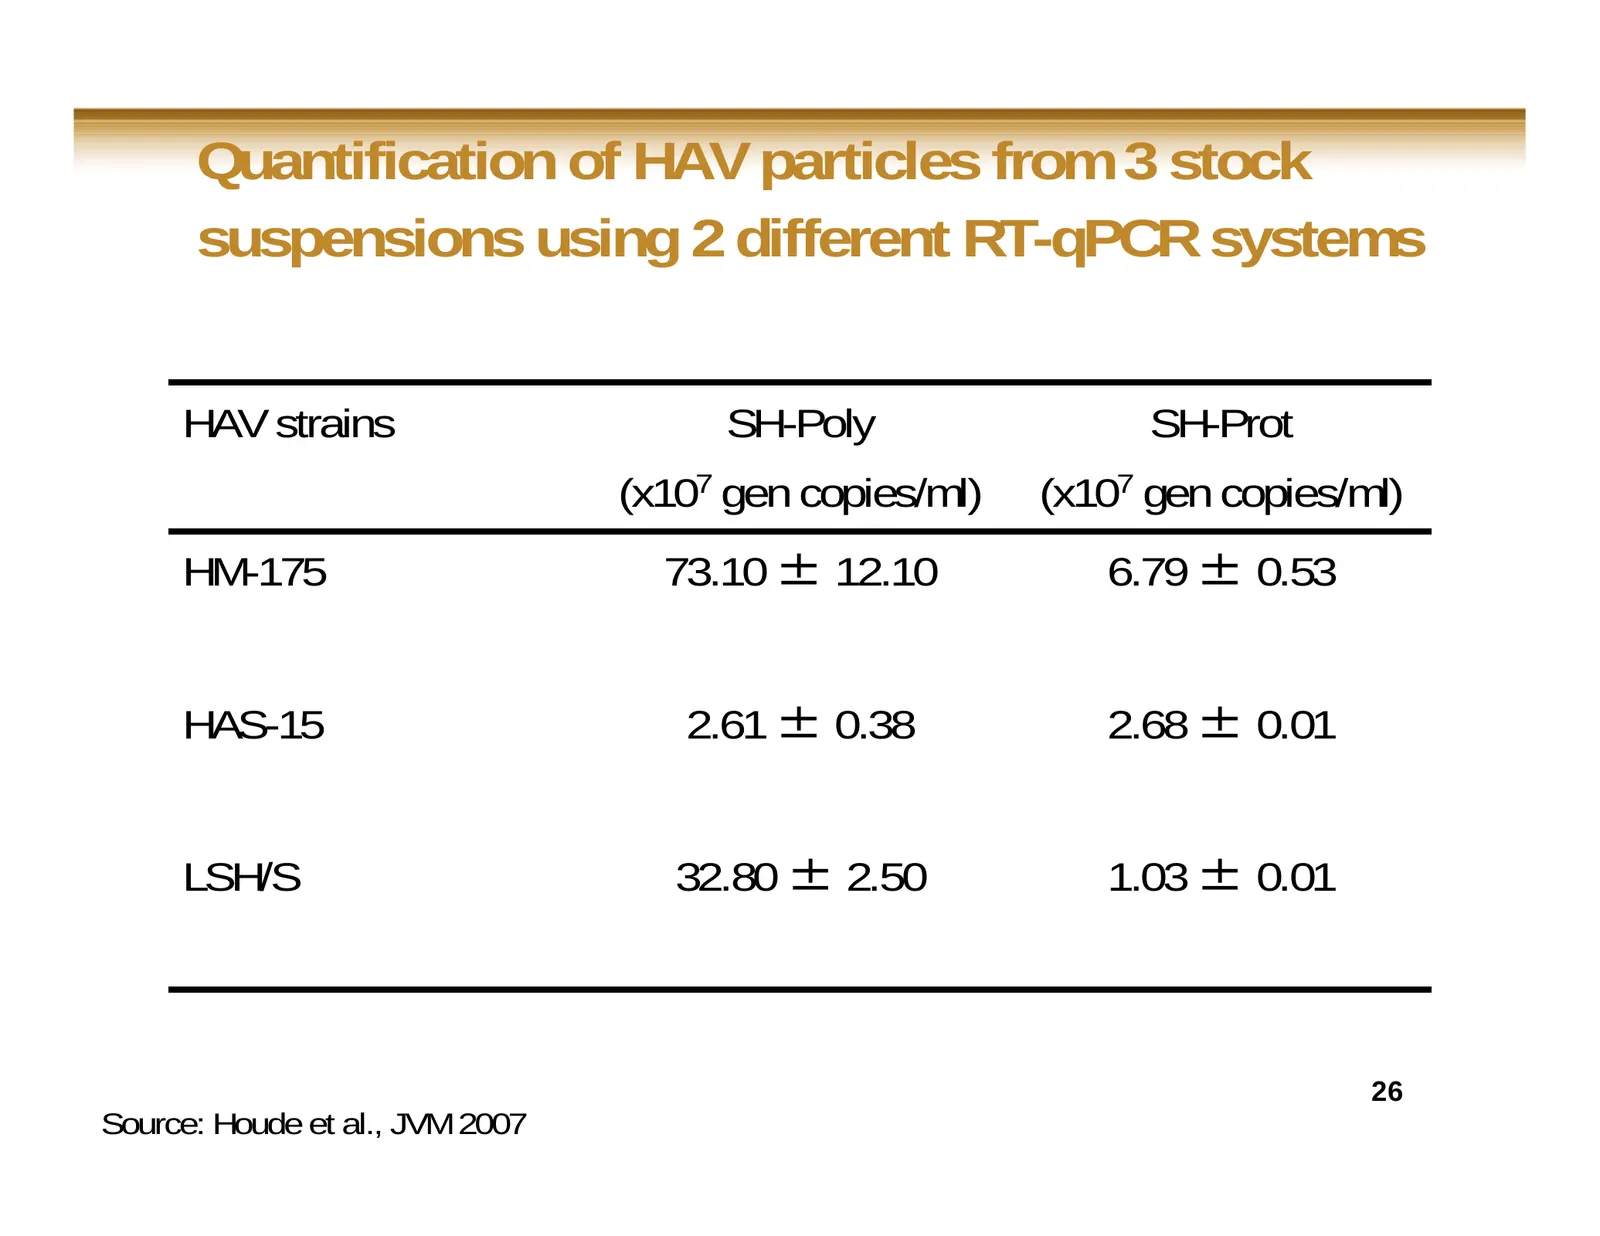
Slide 26: Quantification of HAV particles using 2 different RT-qPCR systems
Quantification of HAV particles from 3 stock suspensions using 2 different RT-qPCR systems HAV strains SH-Poly SH-Prot (x107 gen copies/ml) (x107 gen copies/ml) HM-175 73.10 ± 12.10 6.79 ± 0.53 HAS-15 2.61 ± 0.38 2.68 ± 0.01 LSH/S 32.80 ± 2.50 1.03 ± 0.01 26 Source: Houde et al., JVM 2007
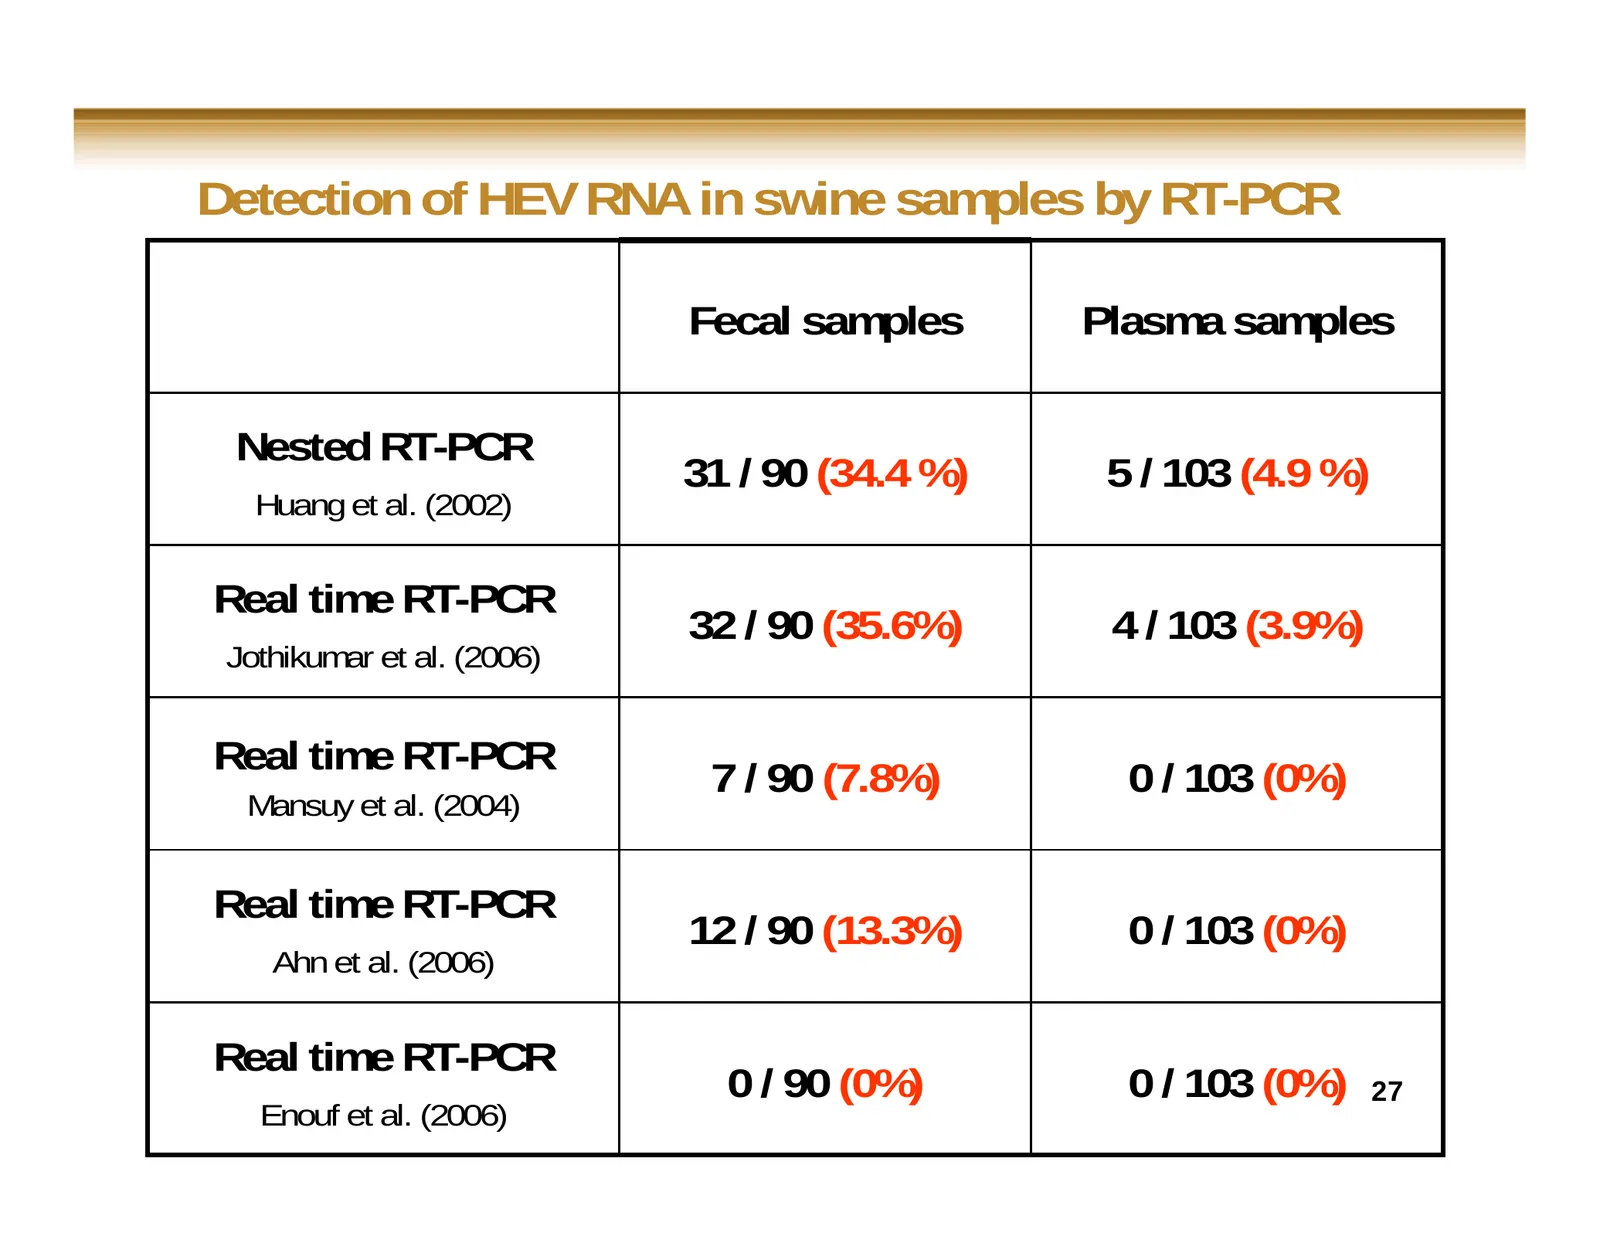
Slide 27: Detection of HEV RNA in swine samples by RT-PCR
Detection of HEV RNA in swine samples by RT-PCR Fecal samples Plasma samples Nested RT-PCR 31 / 90 (34.4 %) 5 / 103 (4.9 %) Huang et al. (2002) Real time RT-PCR 32 / 90 (35.6%) 4 / 103 (3.9%) Jothikumar et al. (2006) Real time RT-PCR 7 / 90 (7.8%) 0 / 103 (0%) Mansuy et al. (2004) Real time RT-PCR 1
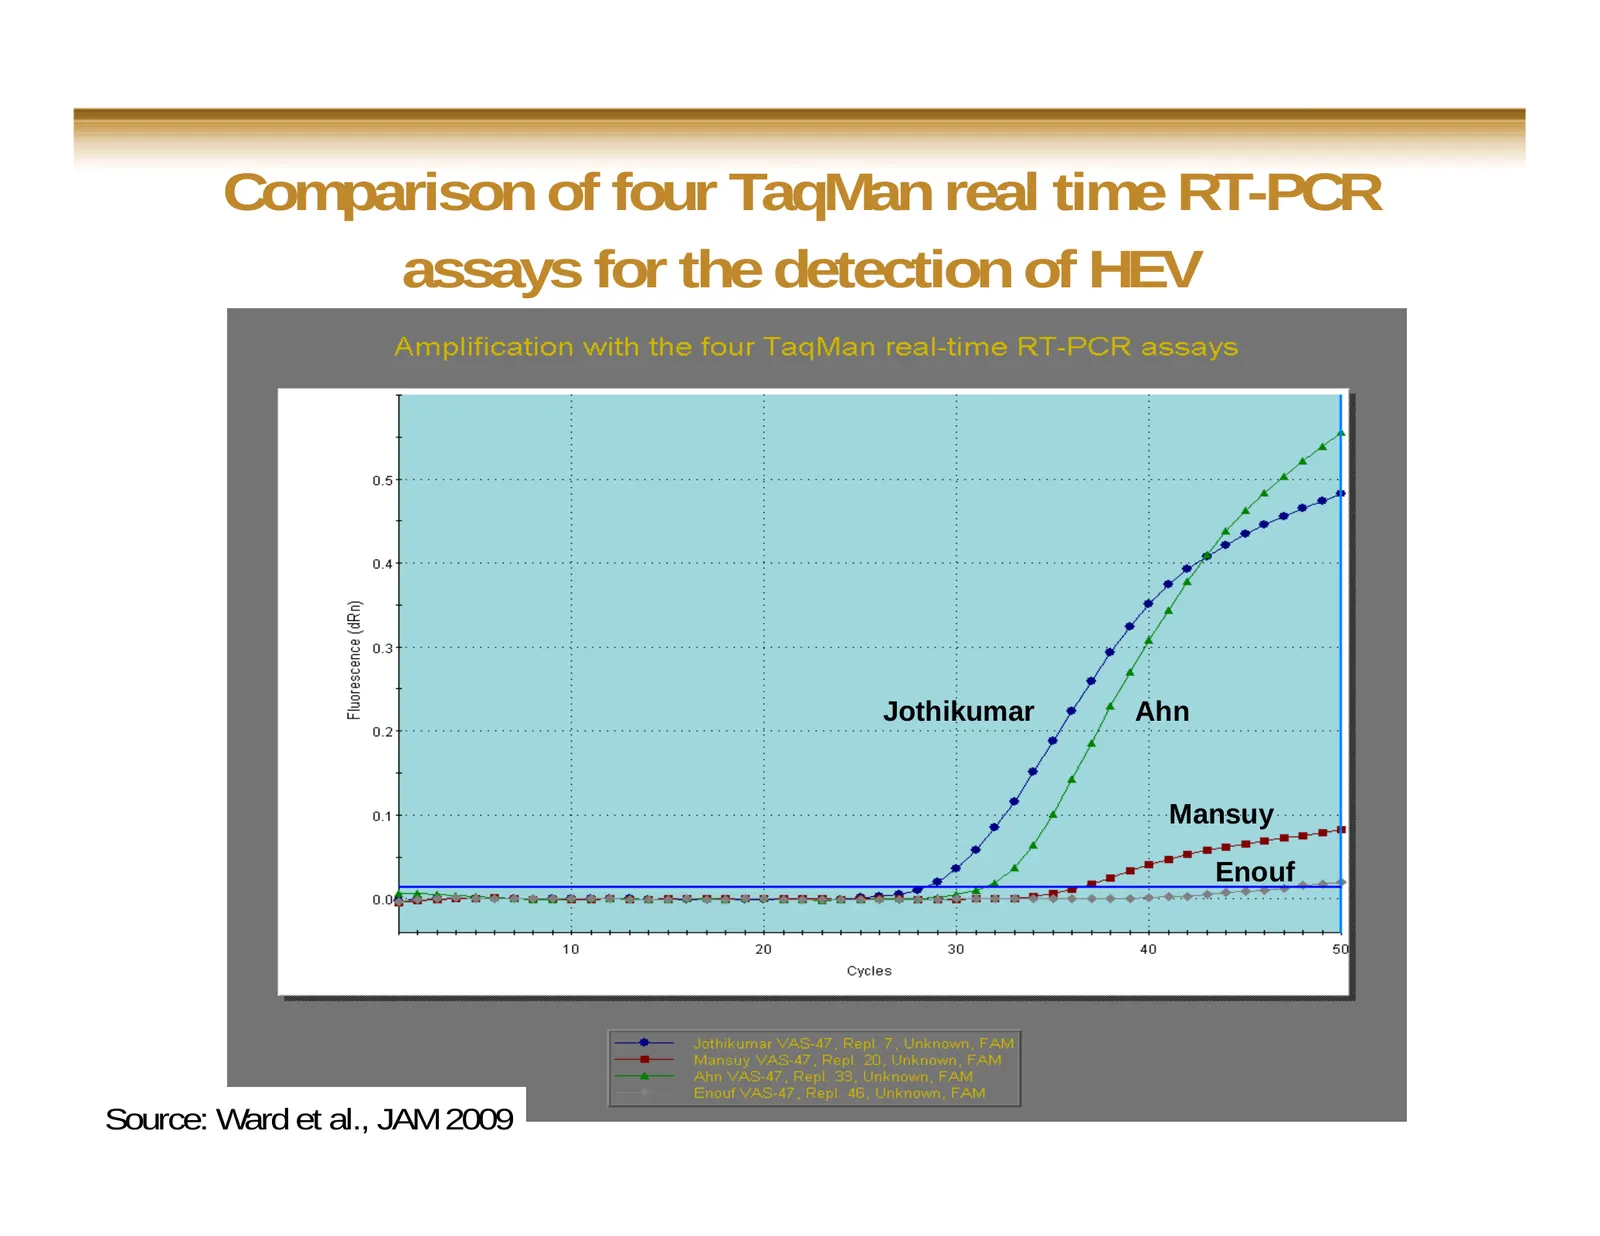
Slide 28: Comparison of four TaqMan real time RT-PCR assays for the detection of HEV
Comparison of four TaqMan real time RT-PCR assays for the detection of HEV Jothikumar Ahn Mansuy Enouf 28 Source: Ward et al., JAM 2009
Slide 29: Briefly
Briefly Real time RT-PCR systems are consistently more sensitive than their conventional RT-PCR counterparts Real time RT-PCR detection systems are not all equals They must be thoroughly tested and validated 29
Slide 30: Developing Canadian standards
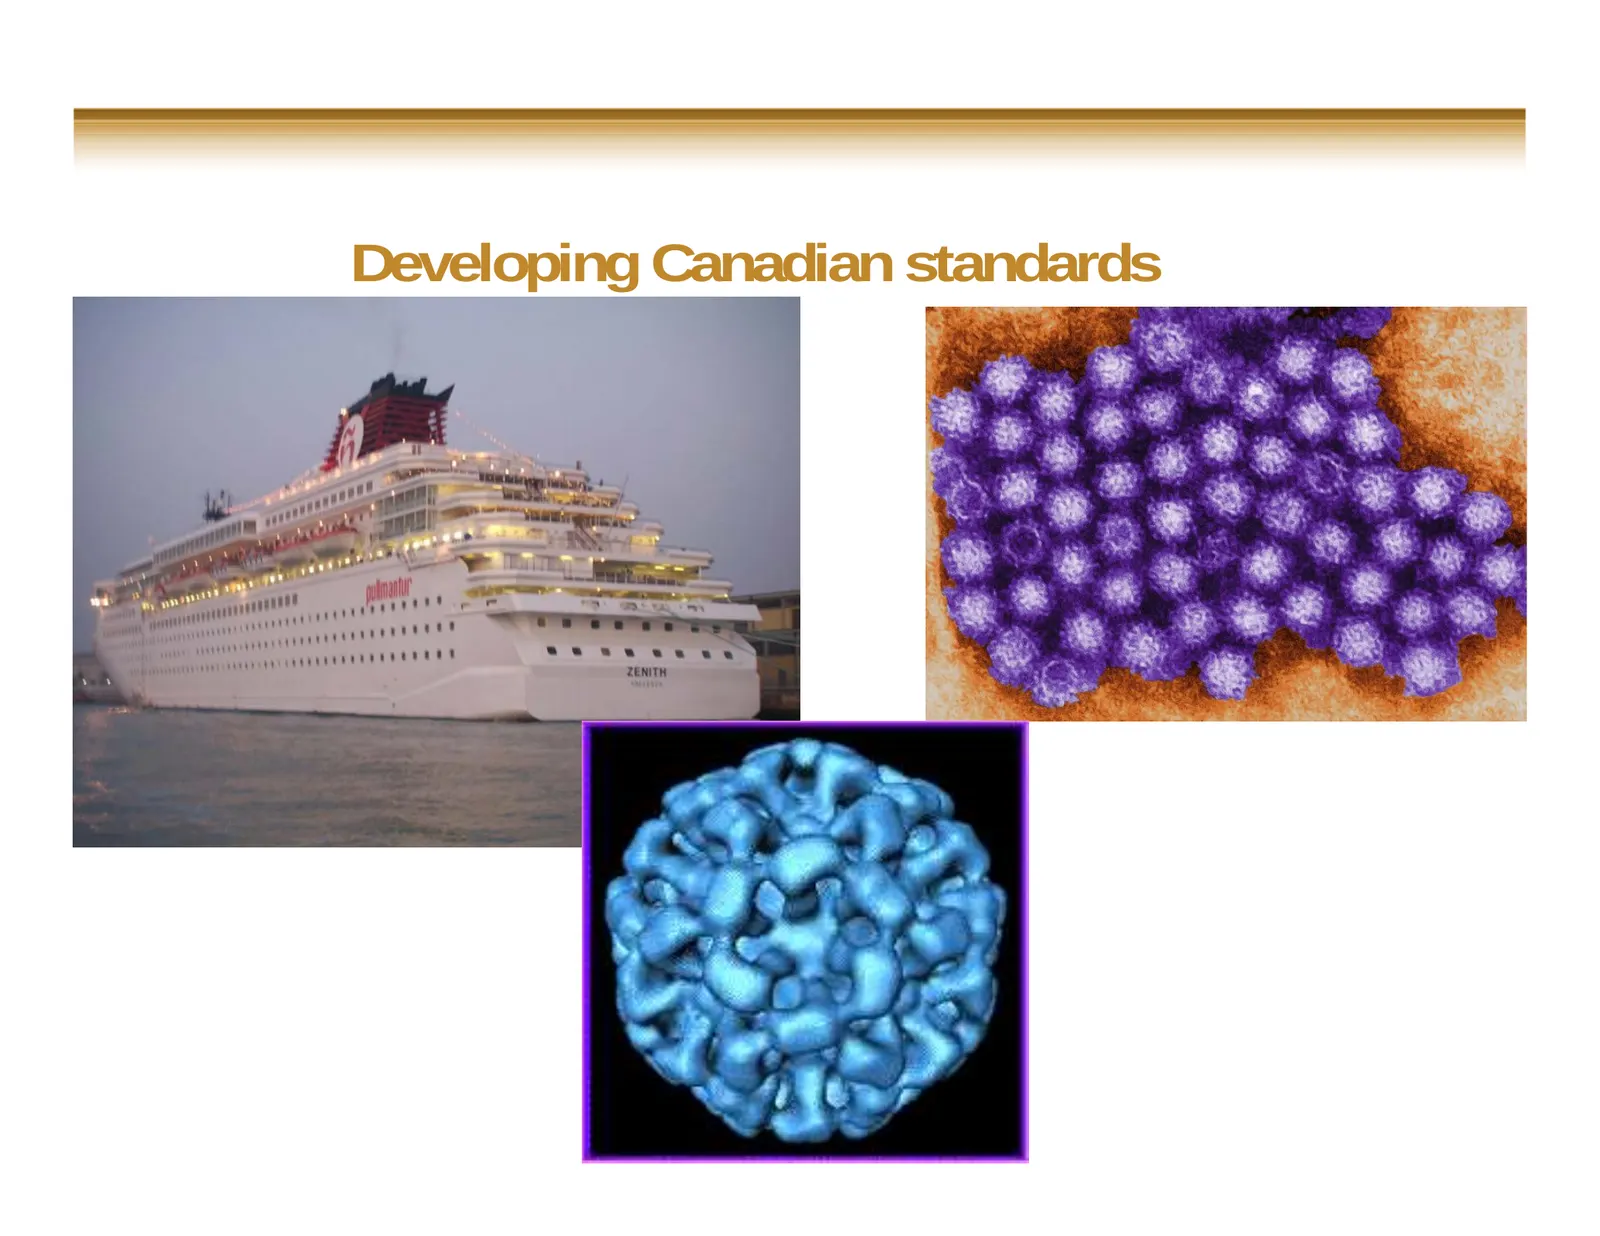
Developing Canadian standards
Slide 31: Food virology technical group
Food virology technical group 31
Slide 32: Food virology technical group
Food virology technical group Bring expertise together Development of standardized protocols (harmonization) Best method for particular matrix developed / agreed upon Consensus methodology and genome target (detection and molecular characterization) Development of centralized database Validati
Slide 33: FCV as sample processed control (SPC)
FCV as sample processed control (SPC) Feline calicivirus (FCV) NOT found in food or human stool samples Similar to NoV genetics Used as a QA/QC/Internal/External/Universal Control (SPC) viral particle prep nucleic acid isolation amplification assay detection control process efficie
Slide 34: Specific recommendations: examples
Specific recommendations: examples Sample size (analytical unit): 25 grams for most food commodities 1/2 dozen oysters (already validated) 250 ml for liquids (i.e., bottled water) 10 × 10 cm swab for Agri-food surface samples no pooling (versus bacteriological testing) Artificially ver
Slide 35: Artificial contamination
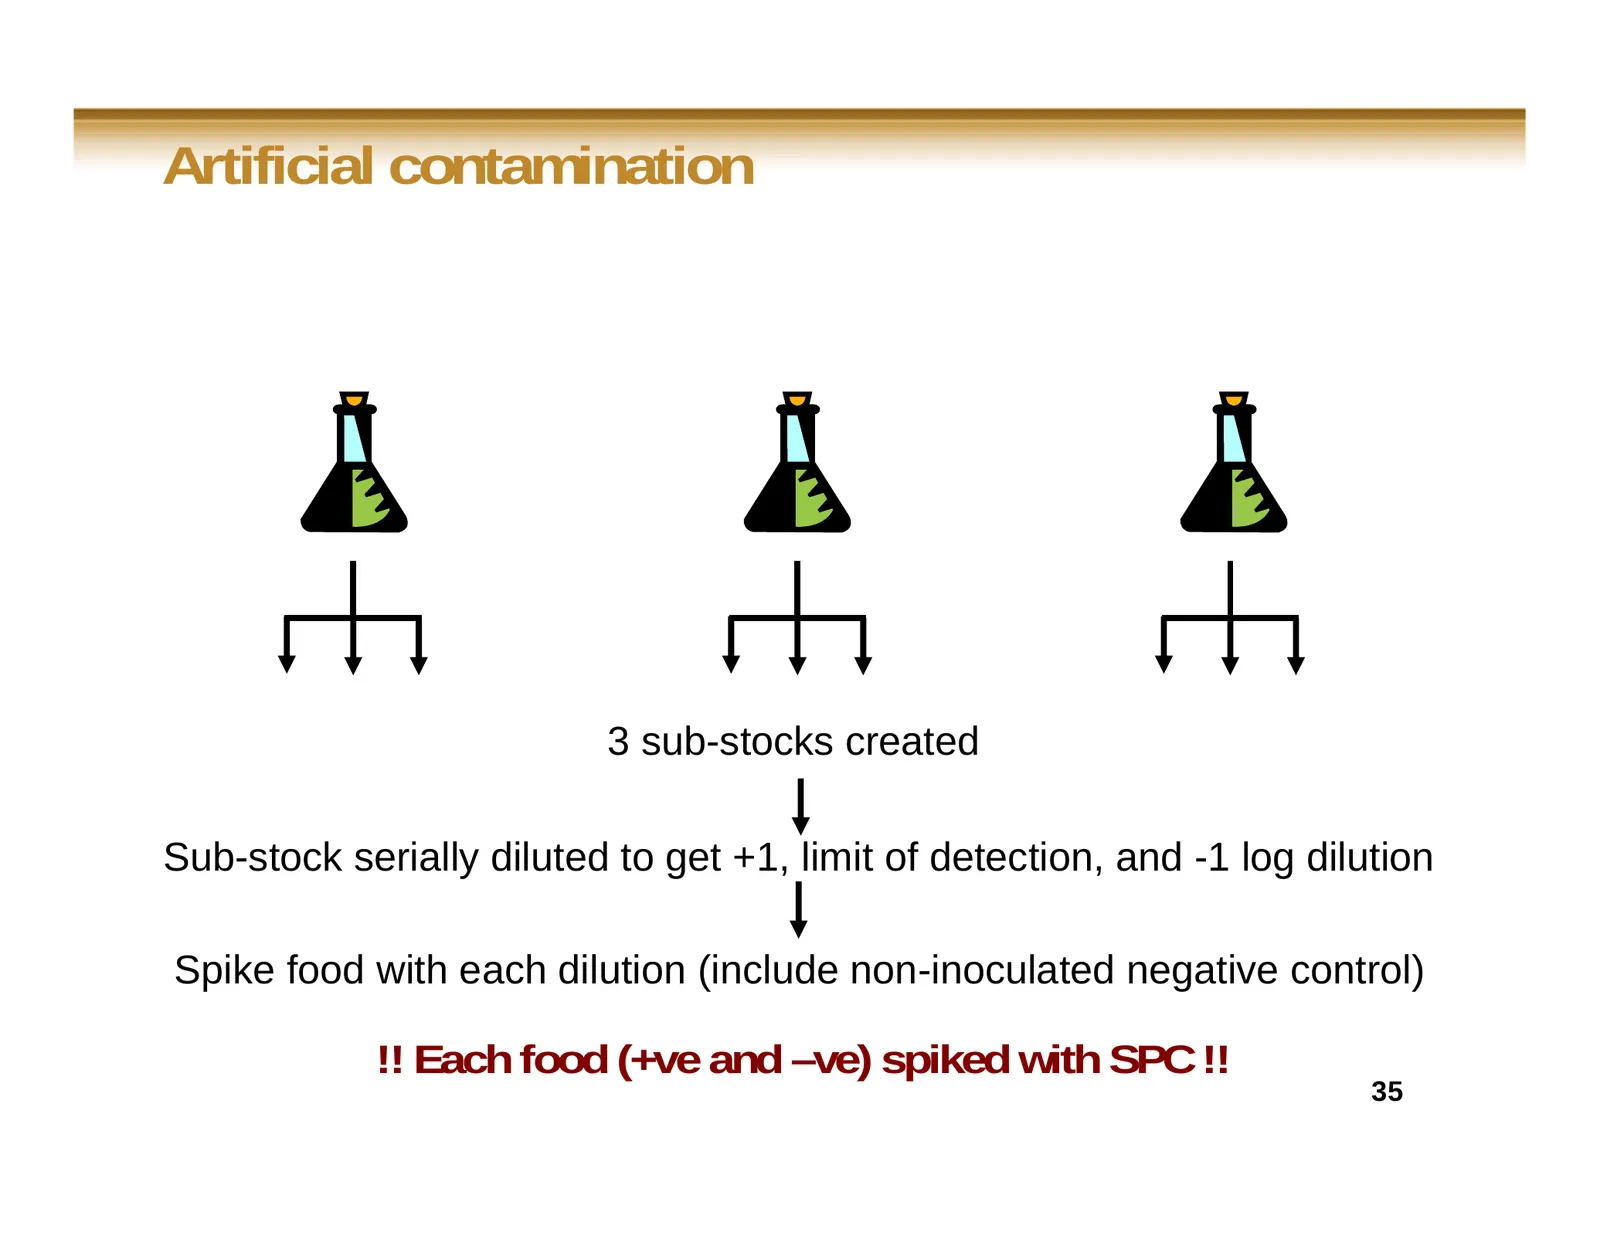
Artificial contamination 3 sub-stocks created Sub-stock serially diluted to get +1, limit of detection, and -1 log dilution Spike food with each dilution (include non-inoculated negative control) !! Each food (+ve and –ve) spiked with SPC !! 35
Slide 36: Standard curves of the multiplex HEV/FCV detection assay
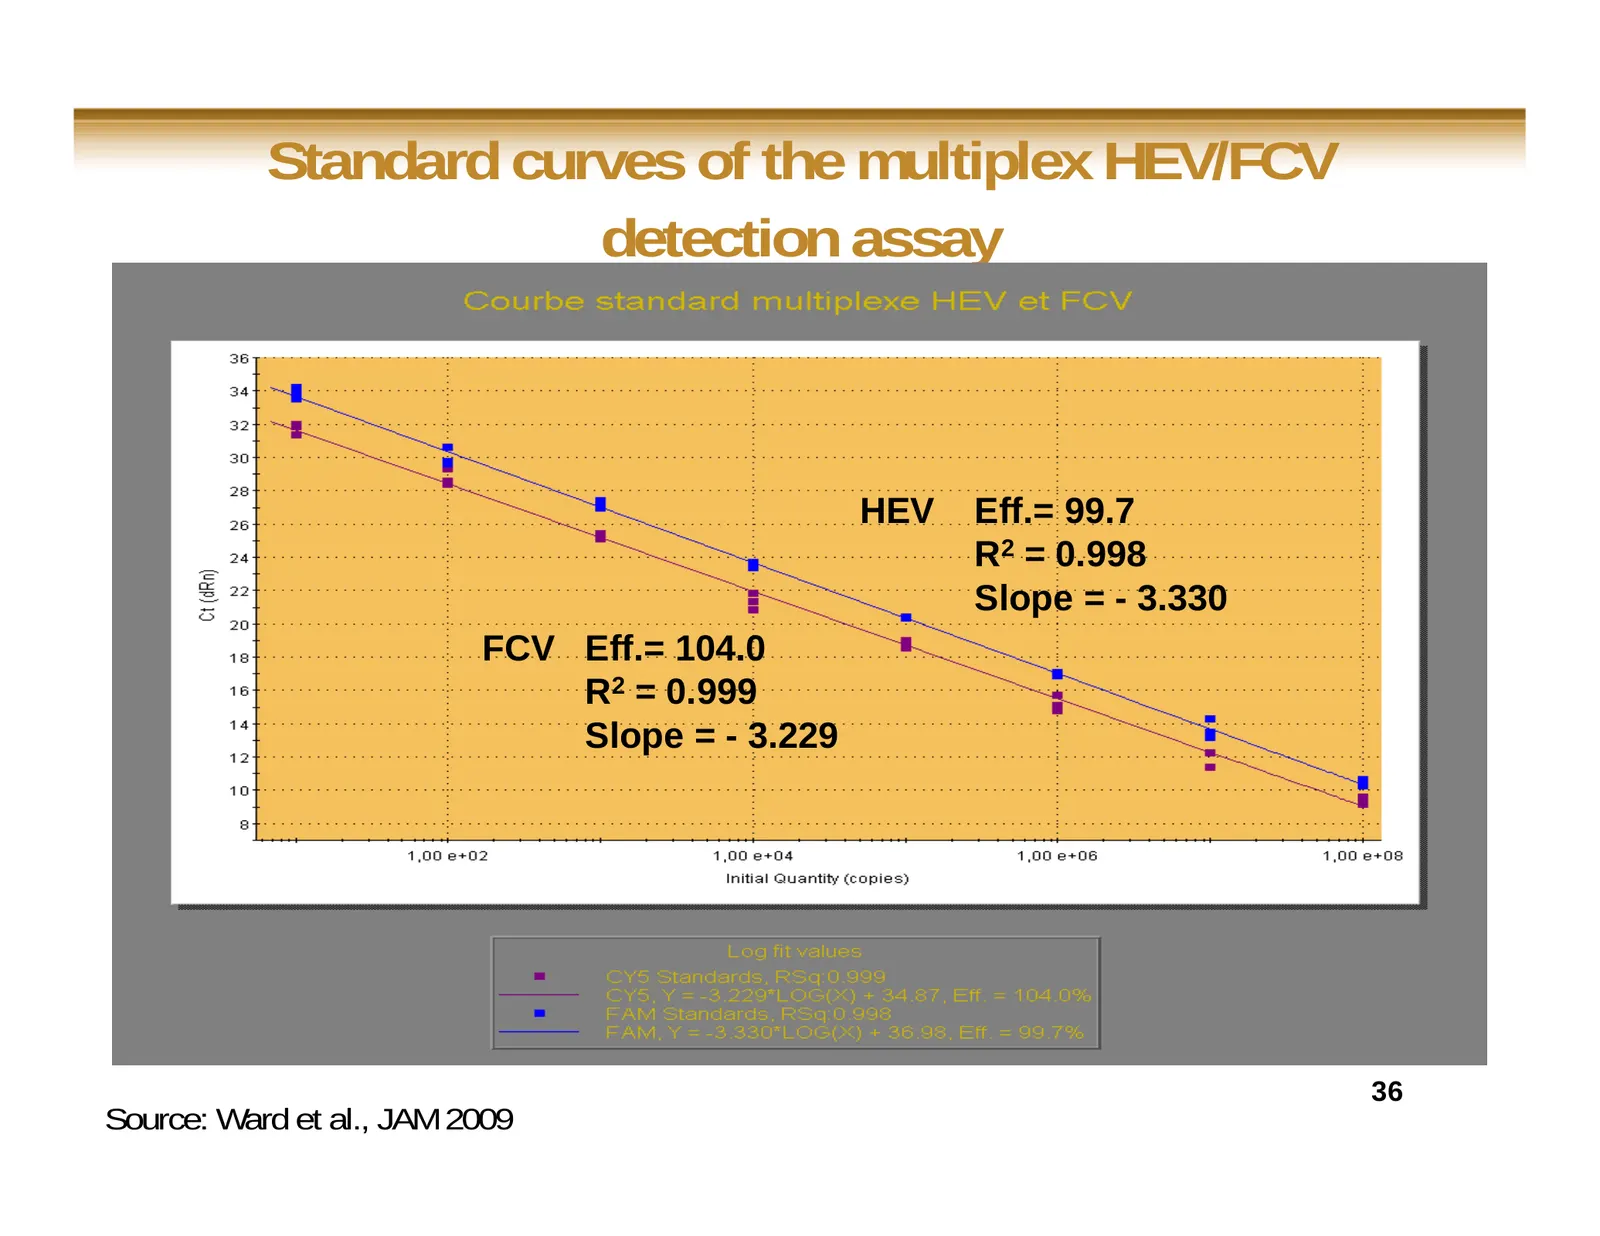
Standard curves of the multiplex HEV/FCV detection assay HEV Eff.= 99.7 R2 = 0.998 Slope = - 3.330 FCV Eff.= 104.0 R2 = 0.999 Slope = - 3.229 36 Source: Ward et al., JAM 2009
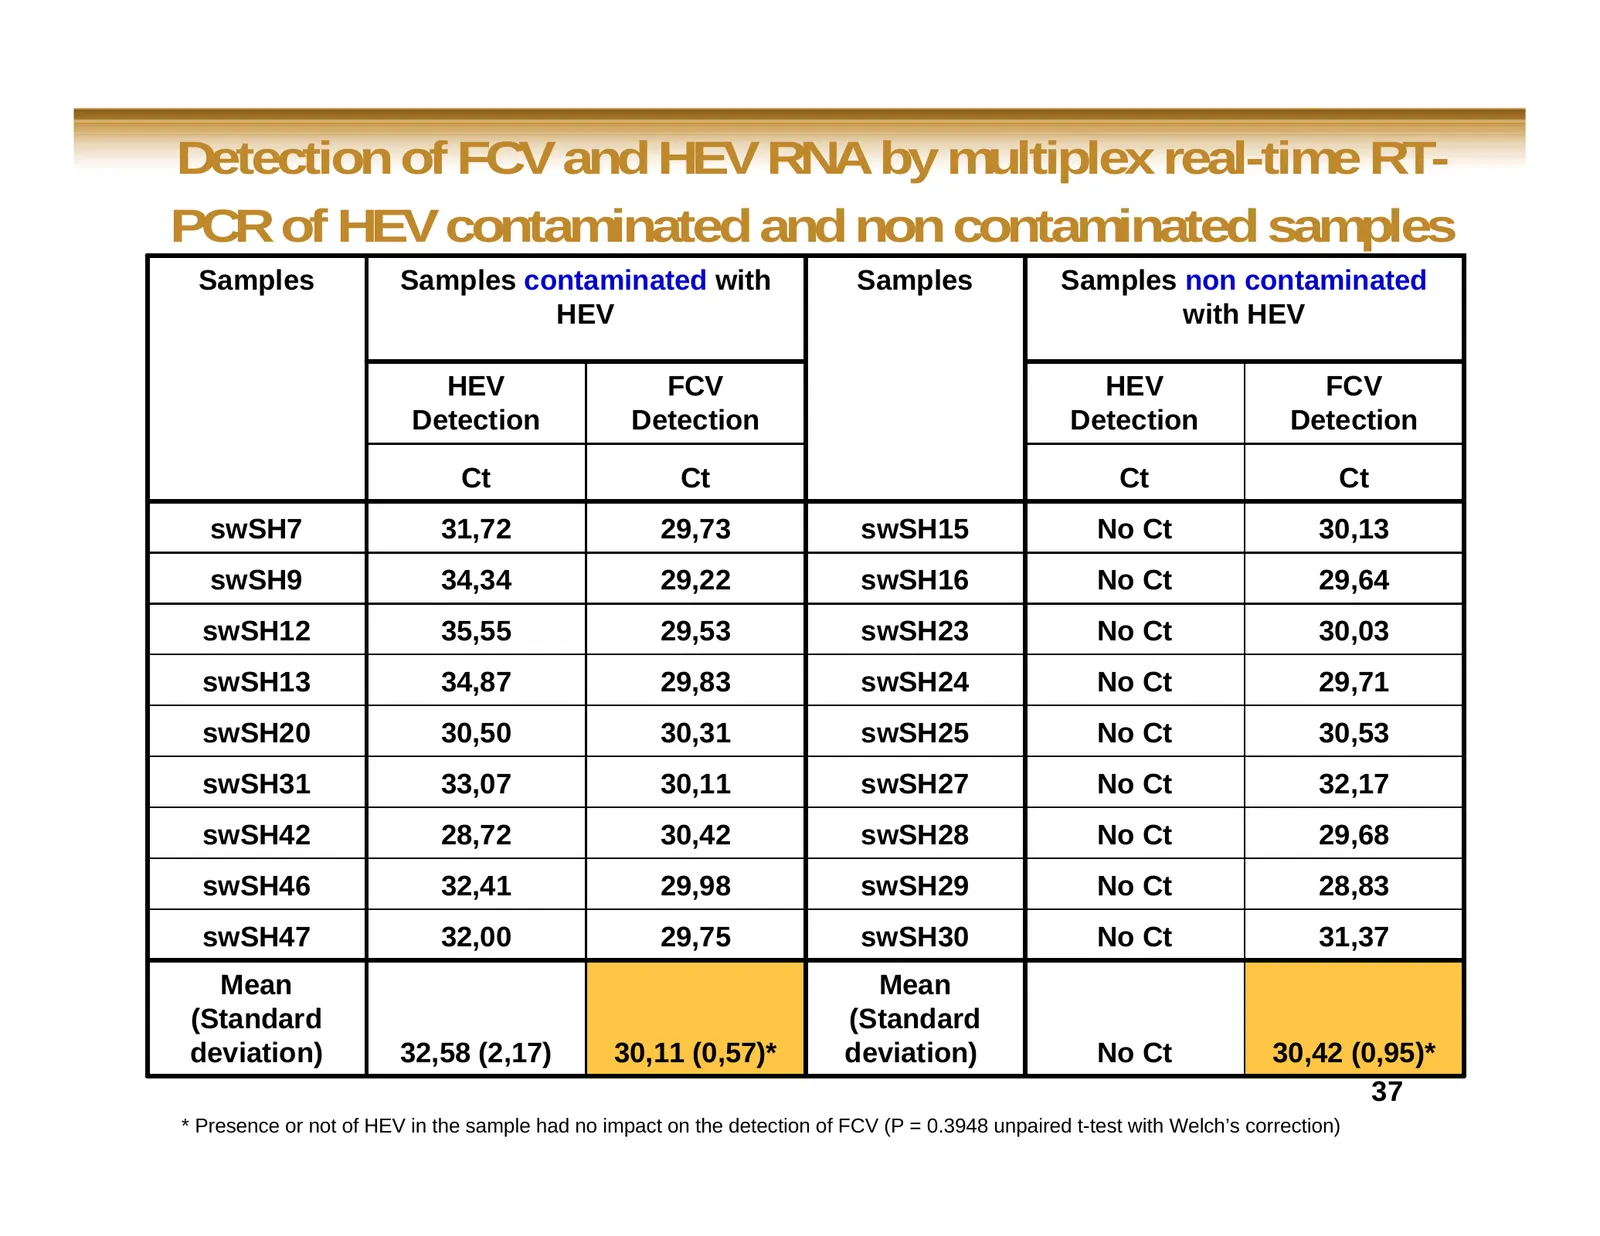
Slide 37: Detection of FCV and HEV RNA by multiplex real-time RT-PCR
Detection of FCV and HEV RNA by multiplex real-time RT- PCR of HEV contaminated and non contaminated samples Samples Samples contaminated with Samples Samples non contaminated HEV with HEV HEV FCV HEV FCV Detection Detection Detection Detection Ct Ct Ct Ct swSH7 31,72 29,73 swSH15 No Ct 30,13 swSH9
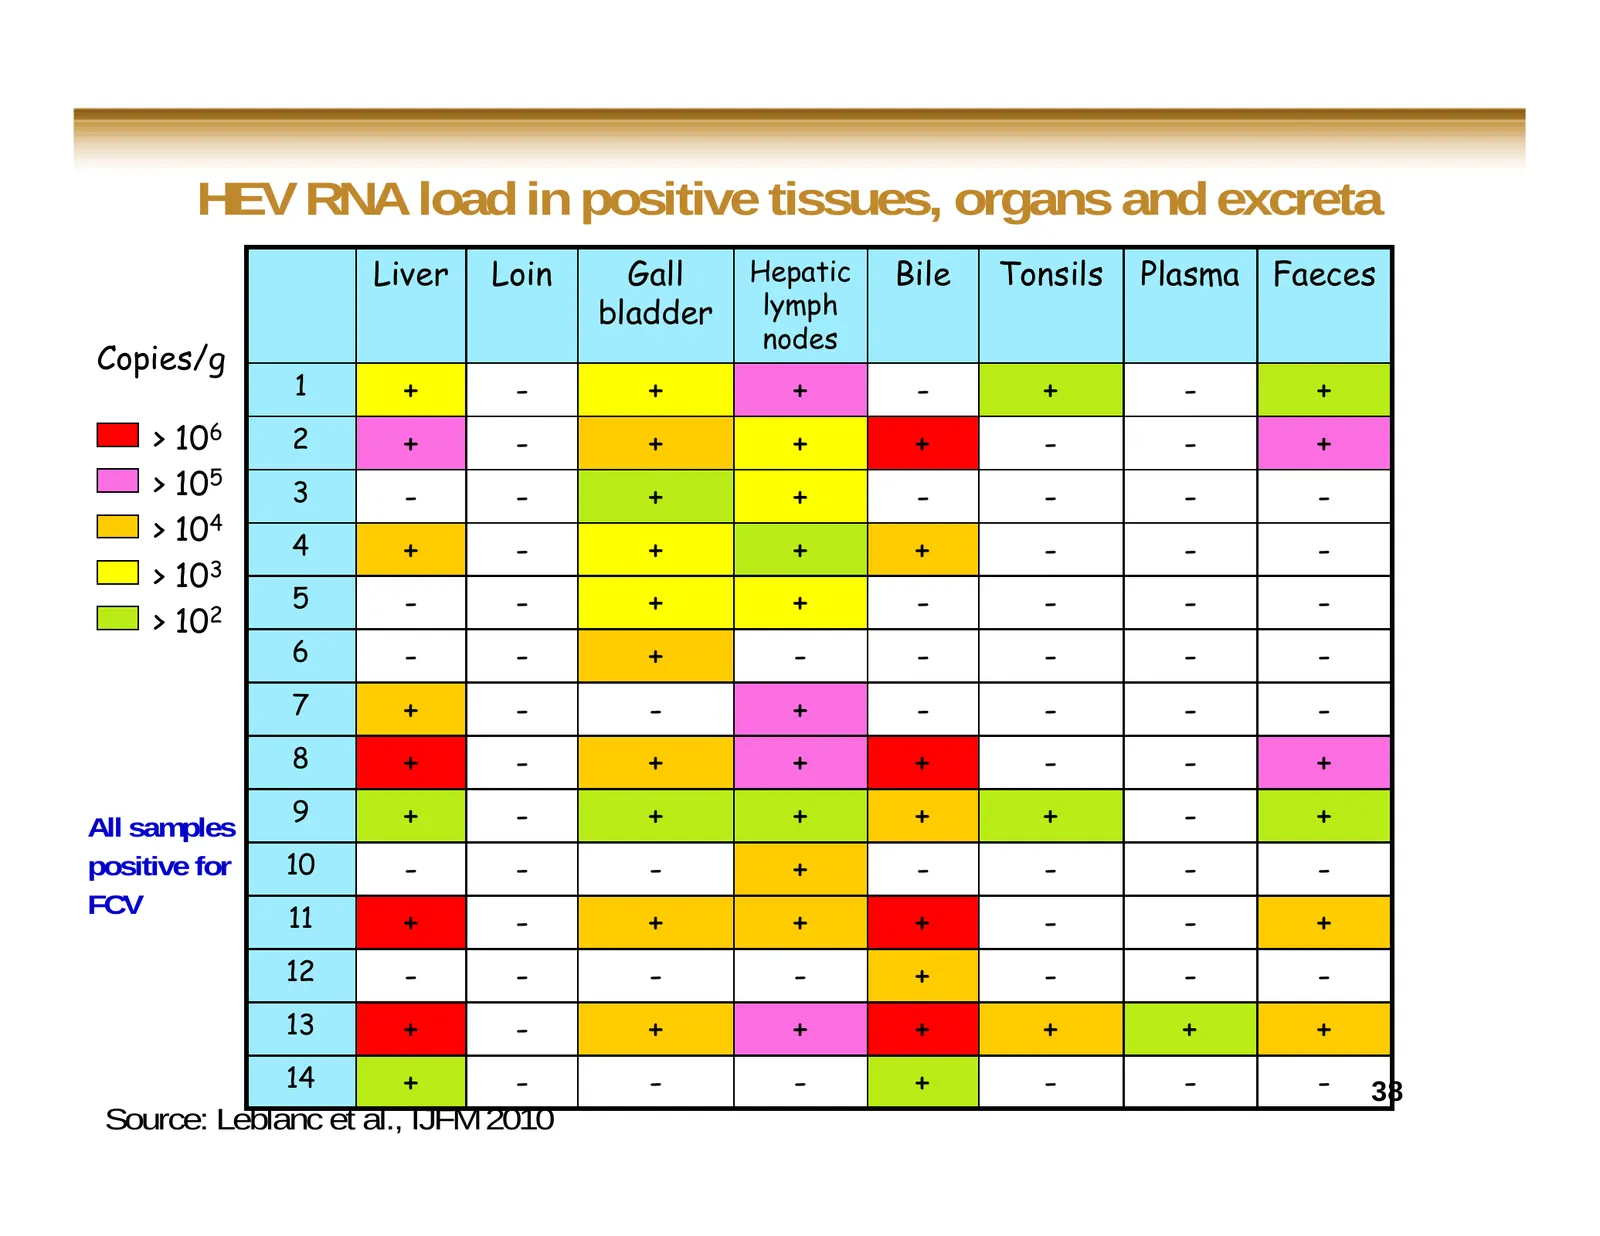
Slide 38: HEV RNA load in positive tissues, organs and excreta
HEV RNA load in positive tissues, organs and excreta Liver Loin Gall Hepatic Bile Tonsils Plasma Faeces bladder lymph nodes Copies/g 1 + - + + - + - + > 106 2 + - + + + - - + > 105 3 - - + + - - - - > 104 4 + - + + + - - - > 103 5 - - + + - - - - > 102 6 - - + - - - - - 7 + - - + - - - - 8 + - + + +
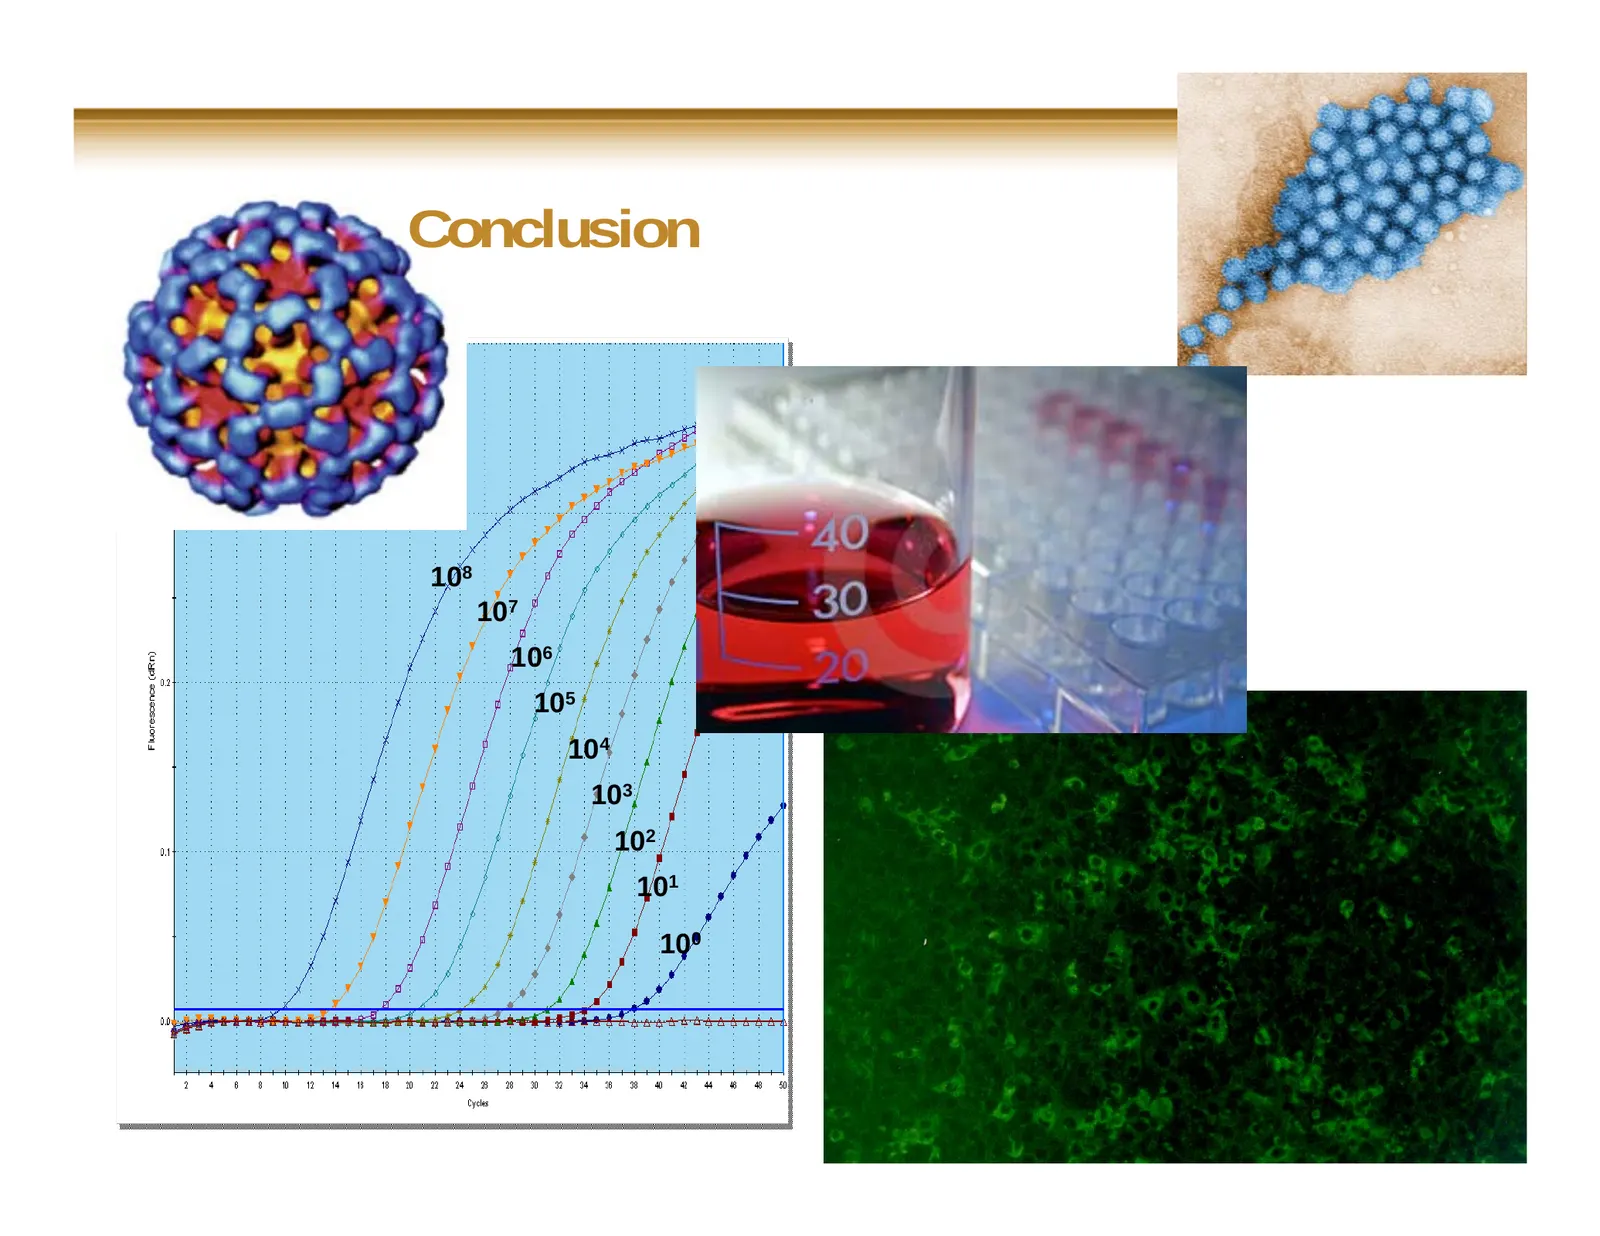
Slide 39: Conclusion
Conclusion 108 107 106 105 104 103 102 101 100
Slide 40: Conclusion
Conclusion Detection of viruses from food, water and/or environment samples includes different critical steps that all impact on the significance of results Efficiency/failure of these different steps must be monitored RT-PCR detection systems are not all equals 40
Slide 41: Conclusion
Conclusion Molecular biology detection tools are extremely useful in this field but do not answer to all questions The entire procedure (extraction and/or detection) must be thoroughly tested and validated There is an important need for harmonized methodologies 41

Slide 42
Source: Internet Archive copy of tecan.com
More decks from Tecan Group AG
 H1 2026 Earnings Presentation22 slides · Aug 11, 2026
 H1 2025 Earnings Presentation25 slides · Aug 12, 2025
 Mimetas — Technical Presentation (2023)20 slides · Apr 24, 2023
 Technical Presentation (2023)28 slides · Apr 24, 2023
 SLAS 202329 slides · Feb 27, 2023
 H1 2021 Earnings Presentation26 slides · Aug 18, 2021