Lighting Science Group Corp · OTC:LSCG
Lighting Science — Canaccord Genuity 30th Annual Growth Conference 2010
24 slides from Lighting Science's conference presentation, Aug 10, 2010
Slide 1: Canaccord Genuity 30th Annual Growth Conference
Canaccord Genuity 30th Annual Growth Conference InterContinental Boston August 10 th , 2010 Exhibit 99.1

Slide 2: Safe Harbor Statement
Certain statements in this presentation constitute “forward-looking statements” relating to Lighting Science Group Corporation (“LSG” or the “Company”) within the meaning of the Private Securities Litigation Reform Act of 1995. All statements regarding future events, our business strategy and our fi
Slide 3: Lighting Science Group Vision
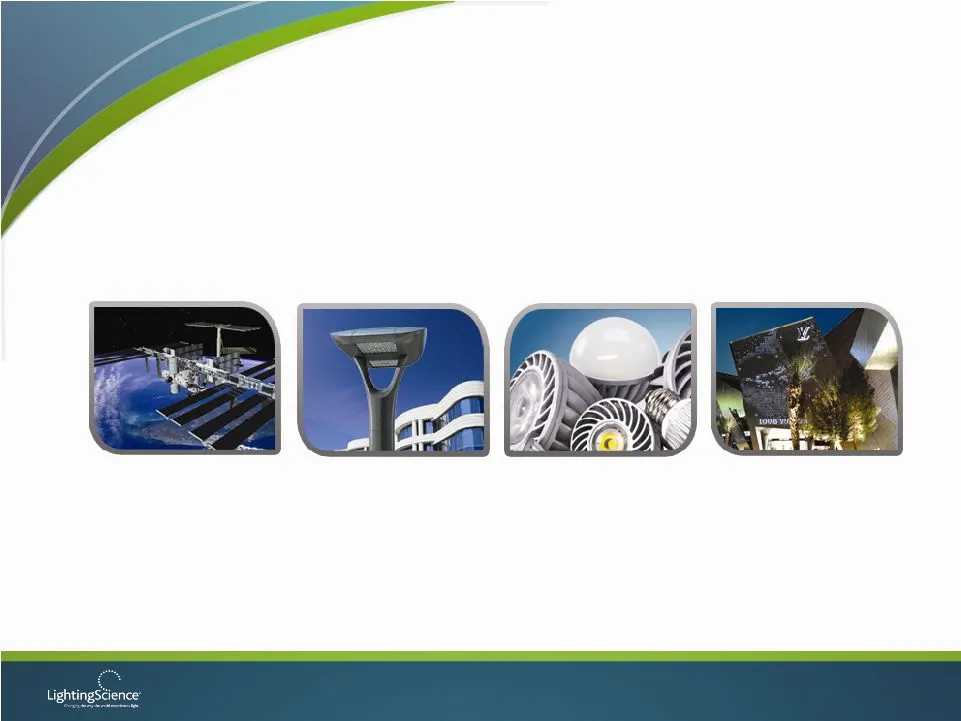
“I have to admit that it seems to be brighter than the 75W incandescent bulb I have in the utility room.” Lighting Science Group Corporation designs, develops, manufactures and markets LED lighting solutions. By applying the science of light, our team outperforms the competition and delivers on the

Slide 4: Lighting Science Group Overview
“I just wanted to say that I really like your Ecosmart bulb” Employees at Corporate Headquarters in Satellite Beach, FL: 300+ Staffed with industry leading experts in both lighting and Solid State Technology. Currently holds over US and international utility and design patents Lighting Science Group
Slide 5: Technology Leadership
Technology Leadership NASA Bayer Cypress University of Florida National Semiconductor Jefferson Harvard University University of Sydney University of Oxford Oak Ridge National Lab Military/Municipal

Slide 6: Areas of Focus
Lighting Design Thermal Management Optics Power Supplies Intelligent Controls Areas of Focus
Slide 7: Technology Integration
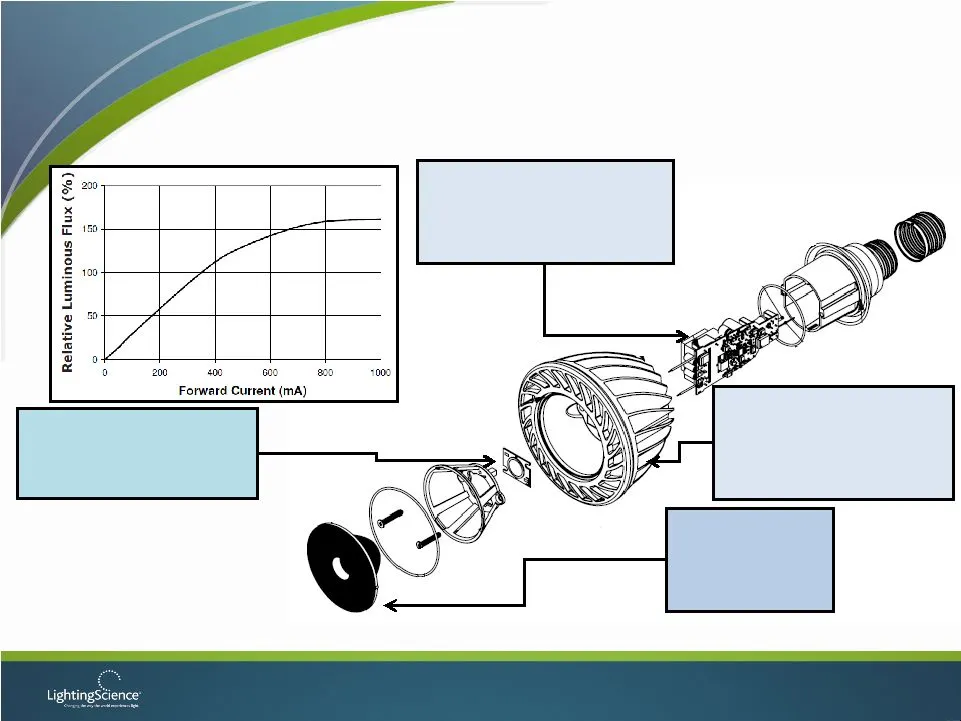
“I have one bulb in a ceiling fixture point down – works great!” Technology Integration Thermal Solution: • Function & Form • Convection & Conduction • Optimized for Tj model Optical System: • Design • Materials • Absorption Power Supply: • Optimized V f output • High Efficiency • Balanced component
Slide 8: Our Competitive Advantages
• System Optimization • Higher utilization of available chip lumens drives greater efficacy and lower first costs • Subcomponent Modularity • Economies of scale • Reduced complexity • Manufacturing Capability • Integrated development and early commercialization • Insourced and outsourced low cost pr
Slide 9: Demonstrated Advantage
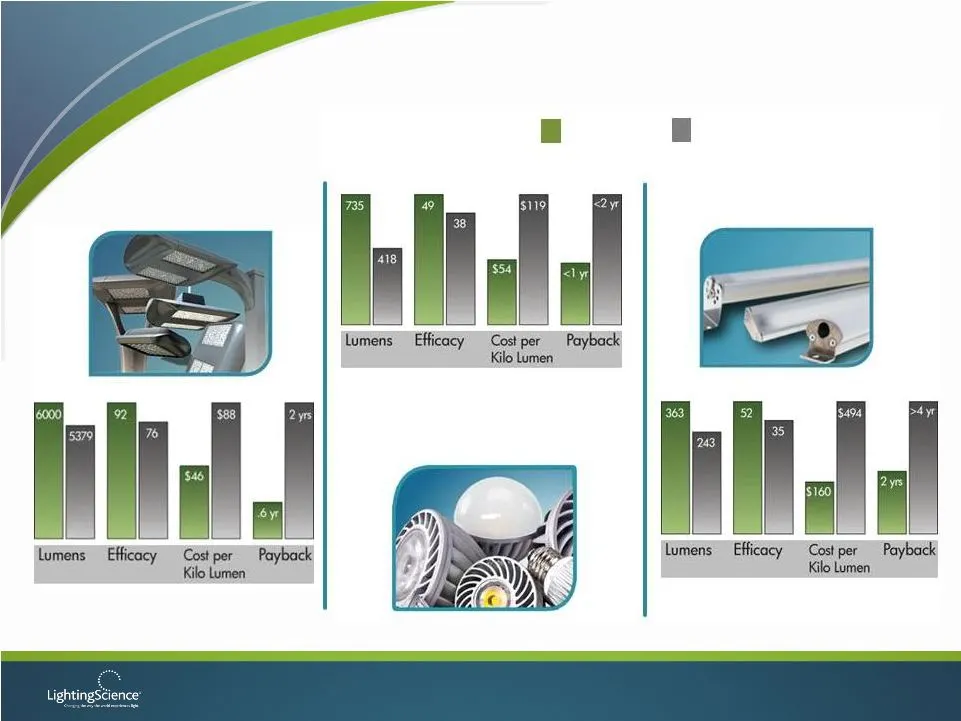
Demonstrated Advantage C2D Definity Symetrie *LSGC C2D compared LSGC Best in Class Competition *DFN 30 WW compared *CRD A WW compared
Slide 10
Slide 11

Slide 12

Slide 13
Slide 14
Slide 15
Slide 16: Customer Examples
Customer Examples Schools and Universities Government Infrastructure Retail and Hospitality Private Label & OEMs Mexico Salt Lake City LABSL and DPW NYC Design Competition Orlando Public Works University of Arizona Florida Internat’l University Tufts Dallas County Schools Starbucks AMC Theaters Hilt
Slide 17: Strategic Relationship with The Home Depot
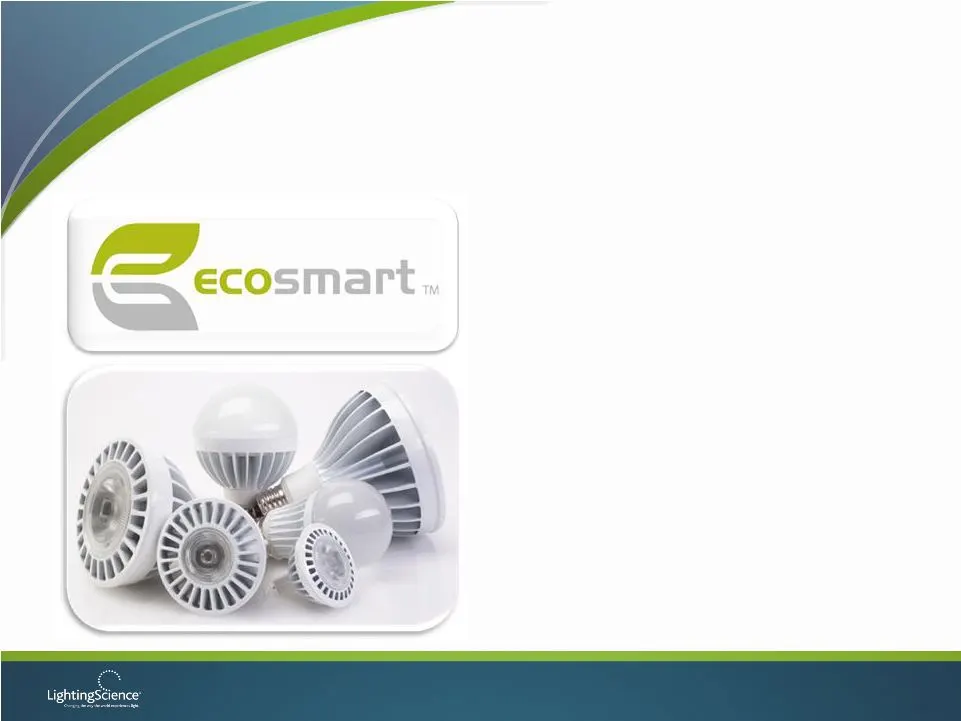
Strategic Relationship with The Home Depot • LSG is Home Depot’s preferred provider and product development partner with respect to LED lamps and fixtures • Full line of New EcoSmart LED Lamps available this year • LSG has the option to provide any of Home Depot’s branded LED lamps and fixtures
Slide 18: 2009 US Lamp Market
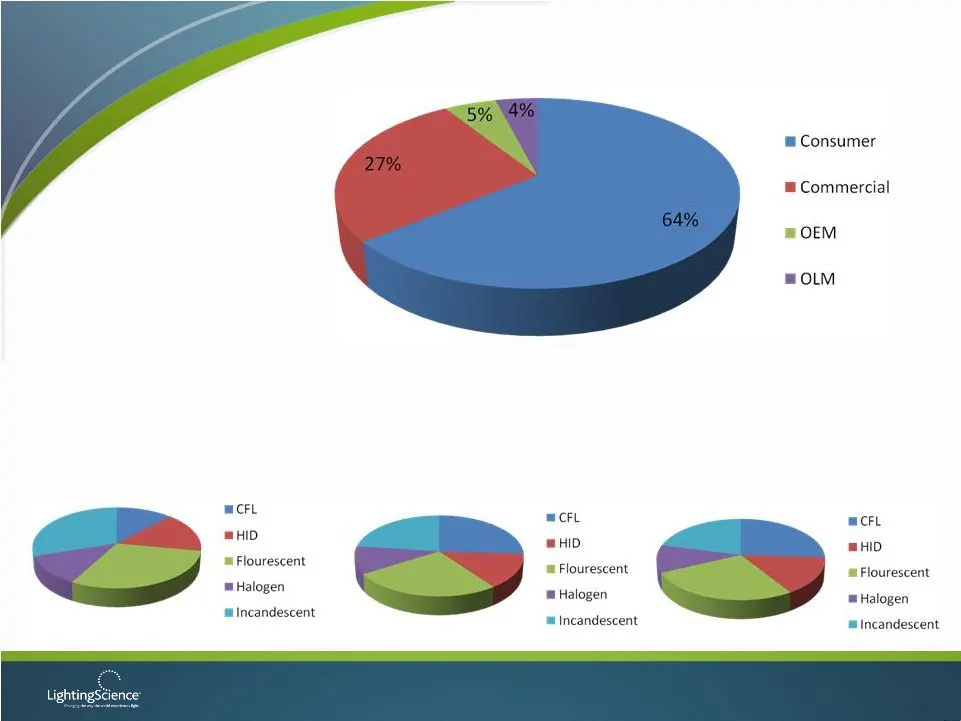
30% 12% 30% 16% 12% 2006 Overall Lighting Market - $2.7B 2007 Overall Lamp Market 14% increase in CFL 7% decrease in incandescent 23% 11% 26% 14% 26% 21% 11% 27% 15% 26% 2009 Overall Lamp Market - $2.4 B CFL maintains 26% share 2% decrease in incandescent 1% increase in linear fluorescent & HID Tota
Slide 19: LED Projected Market Elasticity
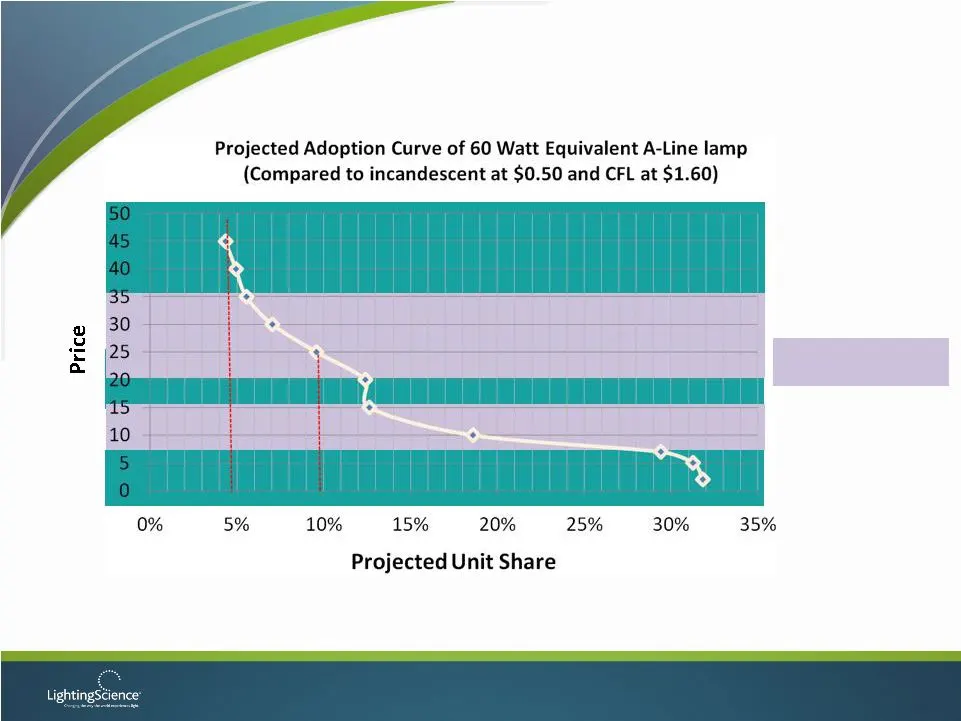
Inelastic – Price decrease hurts revenue Elastic – Price decrease improves revenue Inelastic – Price decrease hurts revenue LED Projected Market Elasticity Adoption curve was generated by using over 30 choice based questions to derive preference between unbranded Incandescent, CFL and LED offerings.
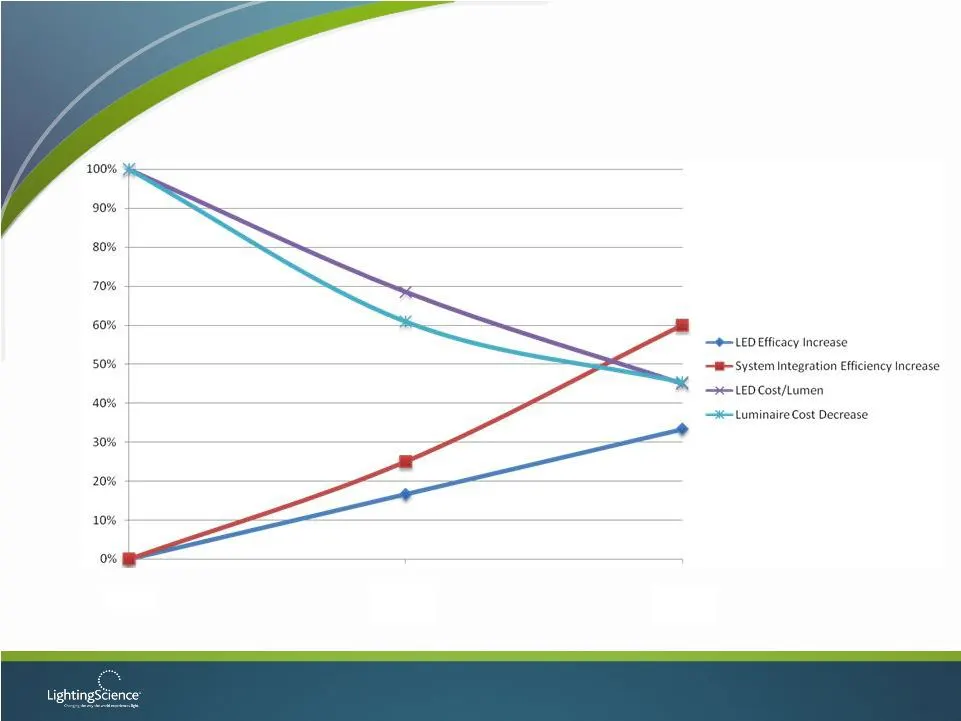
Slide 20: LSGC Projected Luminaire Performance/Cost Trajectories
Now Months Months LSGC Projected Luminaire Performance/Cost Trajectories
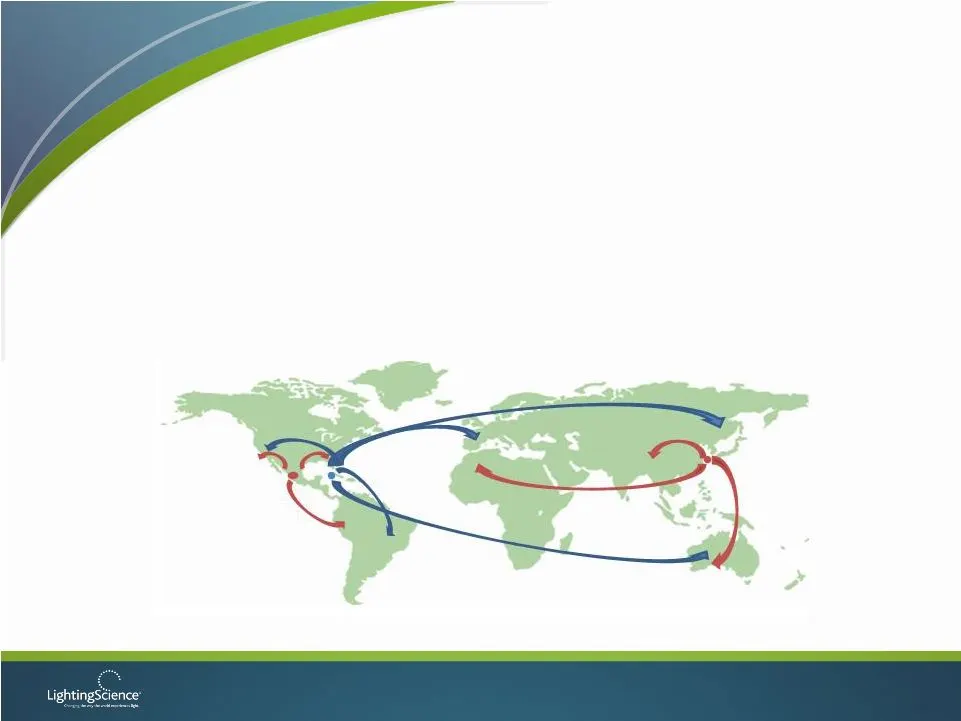
Slide 21: Production Strategy
Production Strategy Global Footprint • Footprint to service regional demand • SB attached to product development and R&D • SB to service initial product demand • China to service Europe, Asia & Australia • Near term support of US demand • SB and Mexico to support North & South America demand
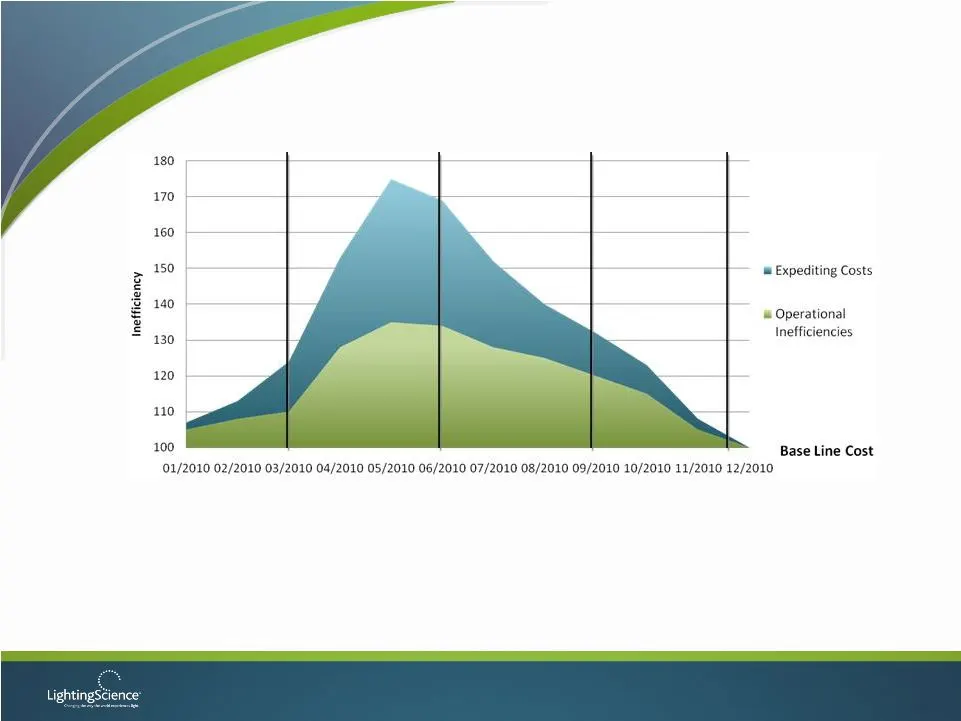
Slide 22: Projected Manufacturing Cost Improvement
50% 19% 2% Projected Manufacturing Cost Improvement • Expedited volume ramp caused deviations from baseline gross margins. • Expect to deliver product at baseline margins by Q1 2011 as a result of the following: Q1 Q2 Q3 Q4 • Ramp of fixed price Asian contract manufacturing – agreement in place and

Slide 23: Continued SG&A Rationalization
• Year-over-year 29% reduction in SG&A on increasing Sales • Cut General & Administrative Expense by 48% • Additional reduction in operating expenses through consolidation of California Design Works to headquarters • Completion of restructuring of European operations • Maintain R&D and product devel
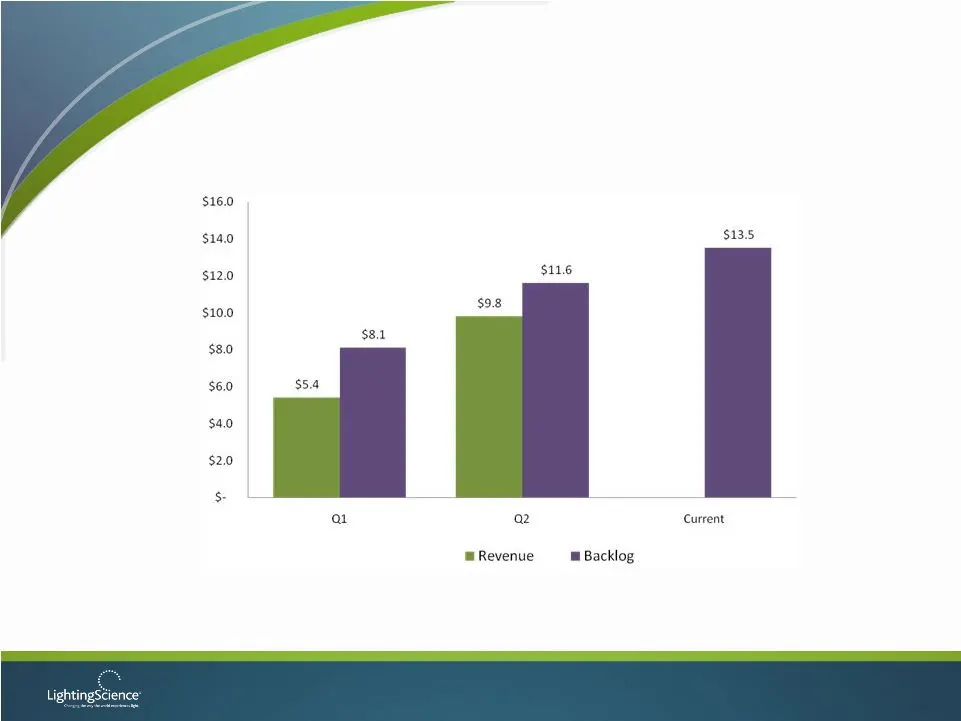
Slide 24: 2010 Revenue and Backlog
Backlog has grown to 300% Q4’09 Level 2010 Revenue and Backlog $MM
Source: SEC EDGAR · 8-K filed Aug 10, 2010