Quadient SA · EURONEXT:QDT
Quadient SA — H1 2022 Earnings Presentation
38 slides from Quadient SA's earnings presentation, Sep 26, 2022
Slide 1: Half-Year 2022 Results
Half-Year 2022 Results 26 September 2022
Slide 2: Disclaimer
Disclaimer FORWARD-LOOKING STATEMENT This presentation contains forward-looking statements (made pursuant to (i) the safe harbour provisions of the Private Securities Litigation Reform Act of 1995 and (ii) the principles of the French Autorité des Marchés Financiers' guide to periodical disclosures
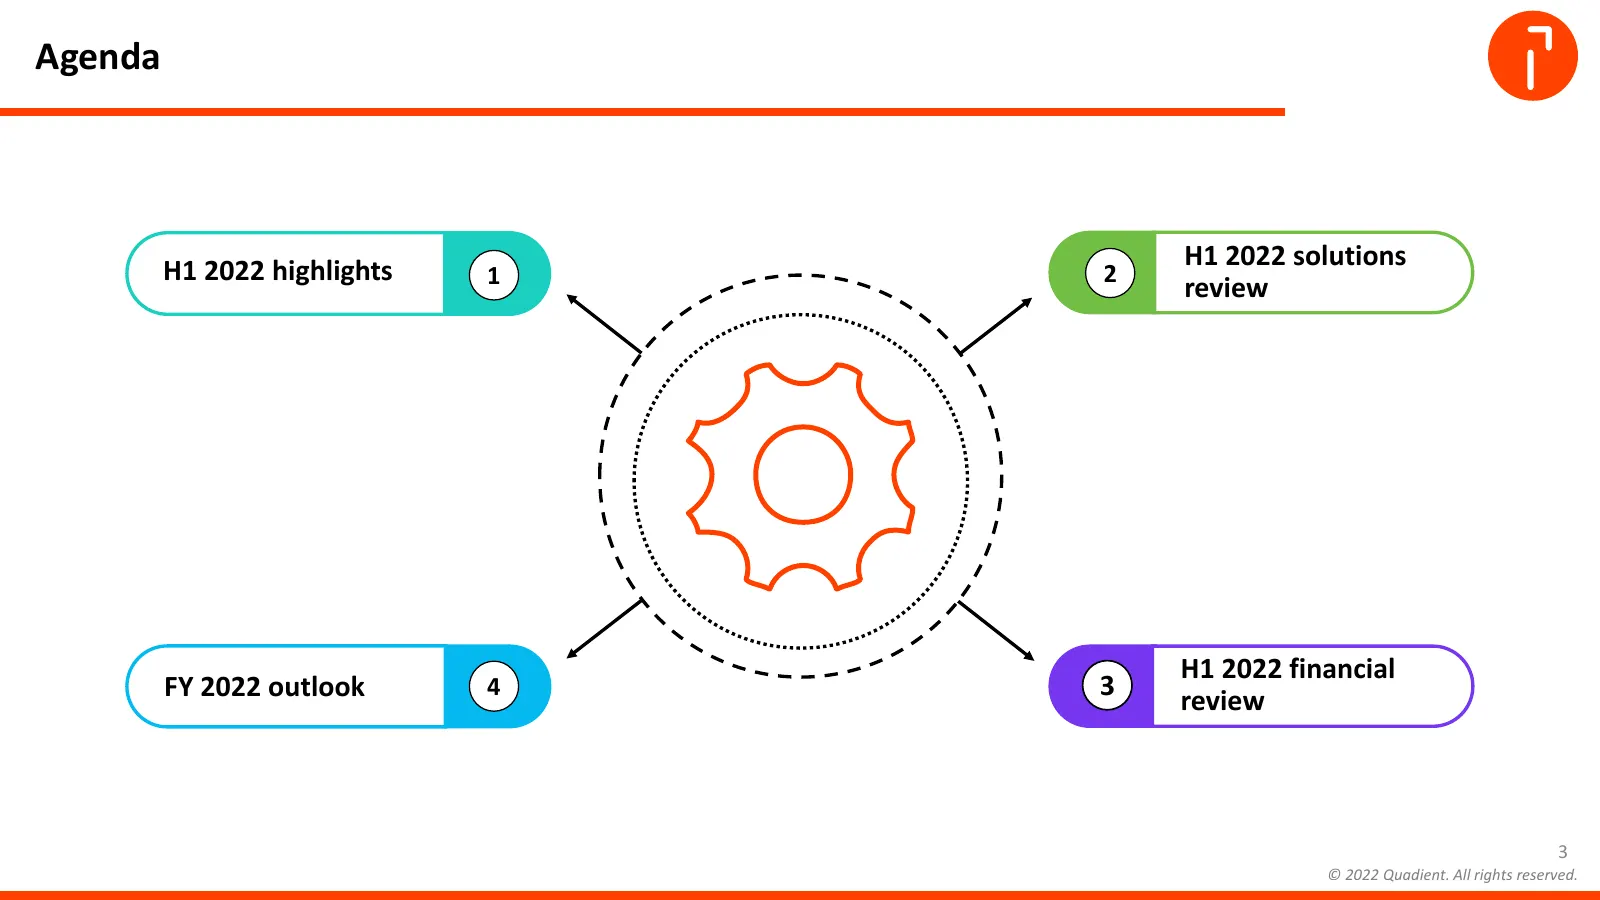
Slide 3: Agenda
Agenda H1 2022 solutions H1 2022 highlights 1 2 review H1 2022 financial FY 2022 outlook 4 3 review 3 © 2022 Quadient. All rights reserved.
Slide 4: H1 2022 Highlights
4 H1 2022 HIGHLIGHTS Geoffrey GODET CEO © Quadient 4 © 2022 Quadient. All rights reserved.
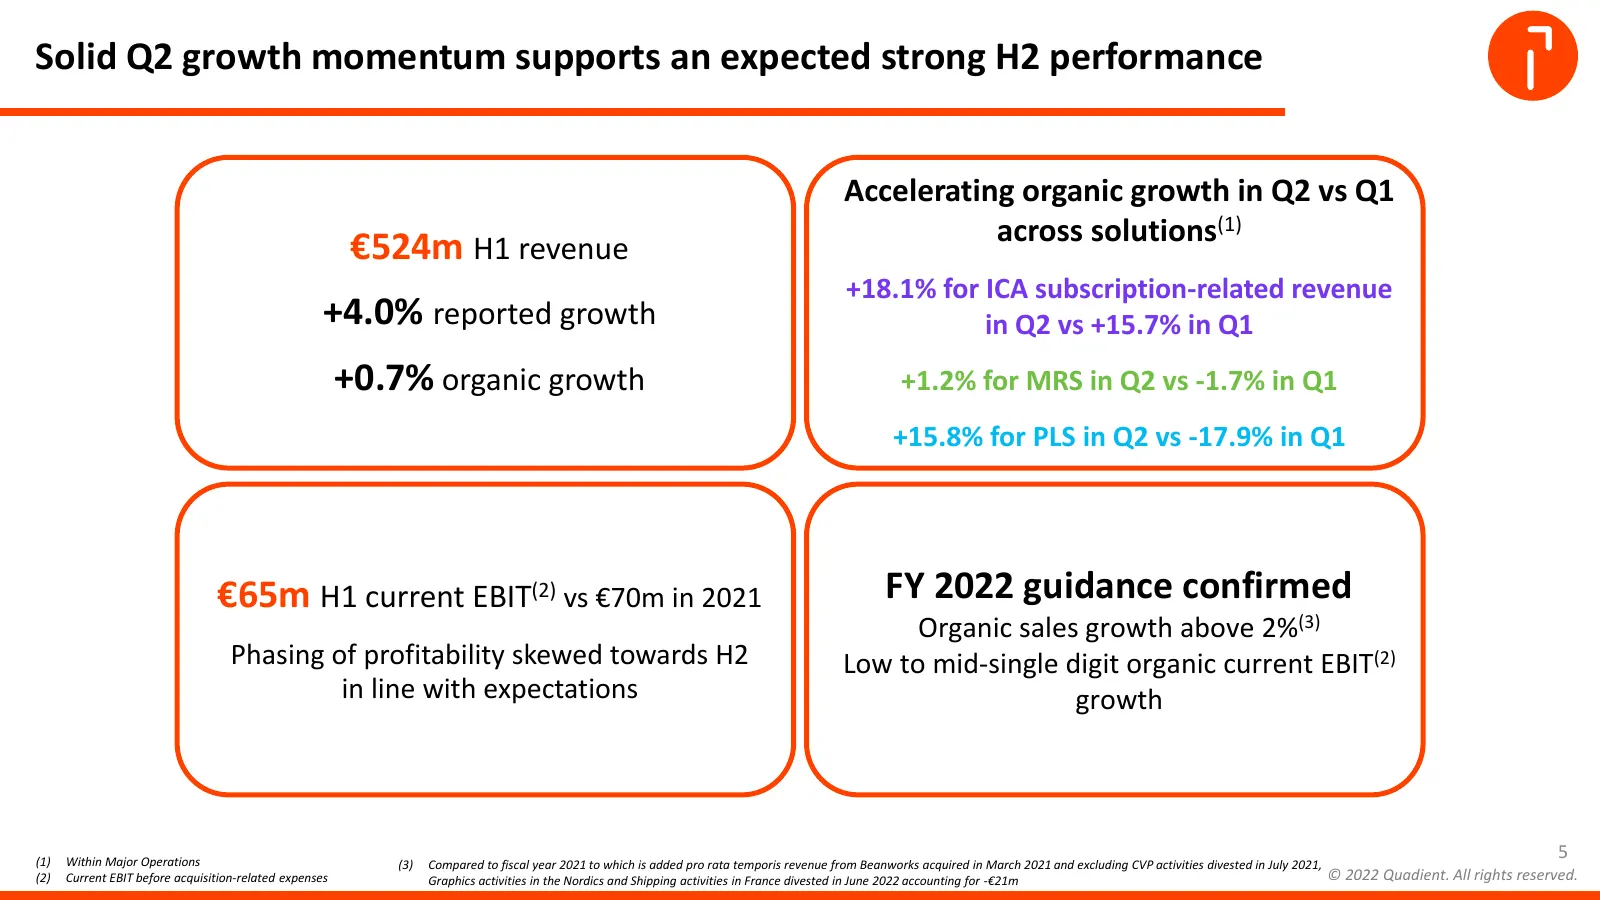
Slide 5: Solid Q2 growth momentum supports an expected strong H2 performance
Solid Q2 growth momentum supports an expected strong H2 performance Accelerating organic growth in Q2 vs Q1 across solutions(1) €524m H1 revenue +18.1% for ICA subscription-related revenue +4.0% reported growth in Q2 vs +15.7% in Q1 +0.7% organic growth +1.2% for MRS in Q2 vs -1.7% in Q1 +15.8% for
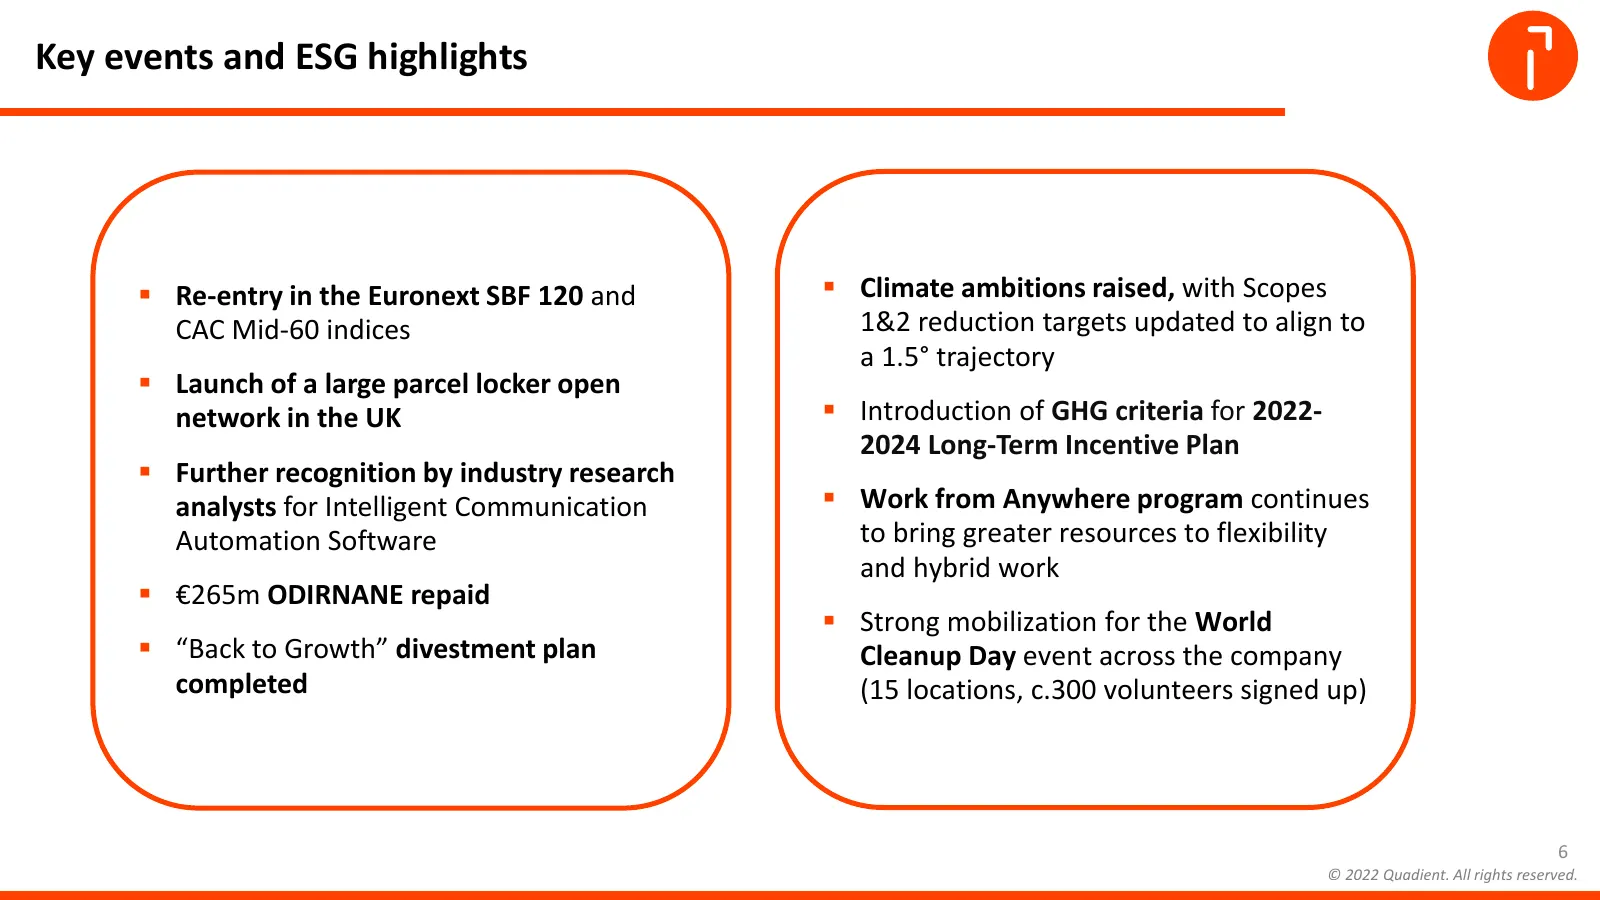
Slide 6: Key events and ESG highlights
Key events and ESG highlights ▪ Re-entry in the Euronext SBF 120 and ▪ Climate ambitions raised, with Scopes CAC Mid-60 indices 1&2 reduction targets updated to align to a 1.5° trajectory ▪ Launch of a large parcel locker open network in the UK ▪ Introduction of GHG criteria for 2022- 2024 Long-Term
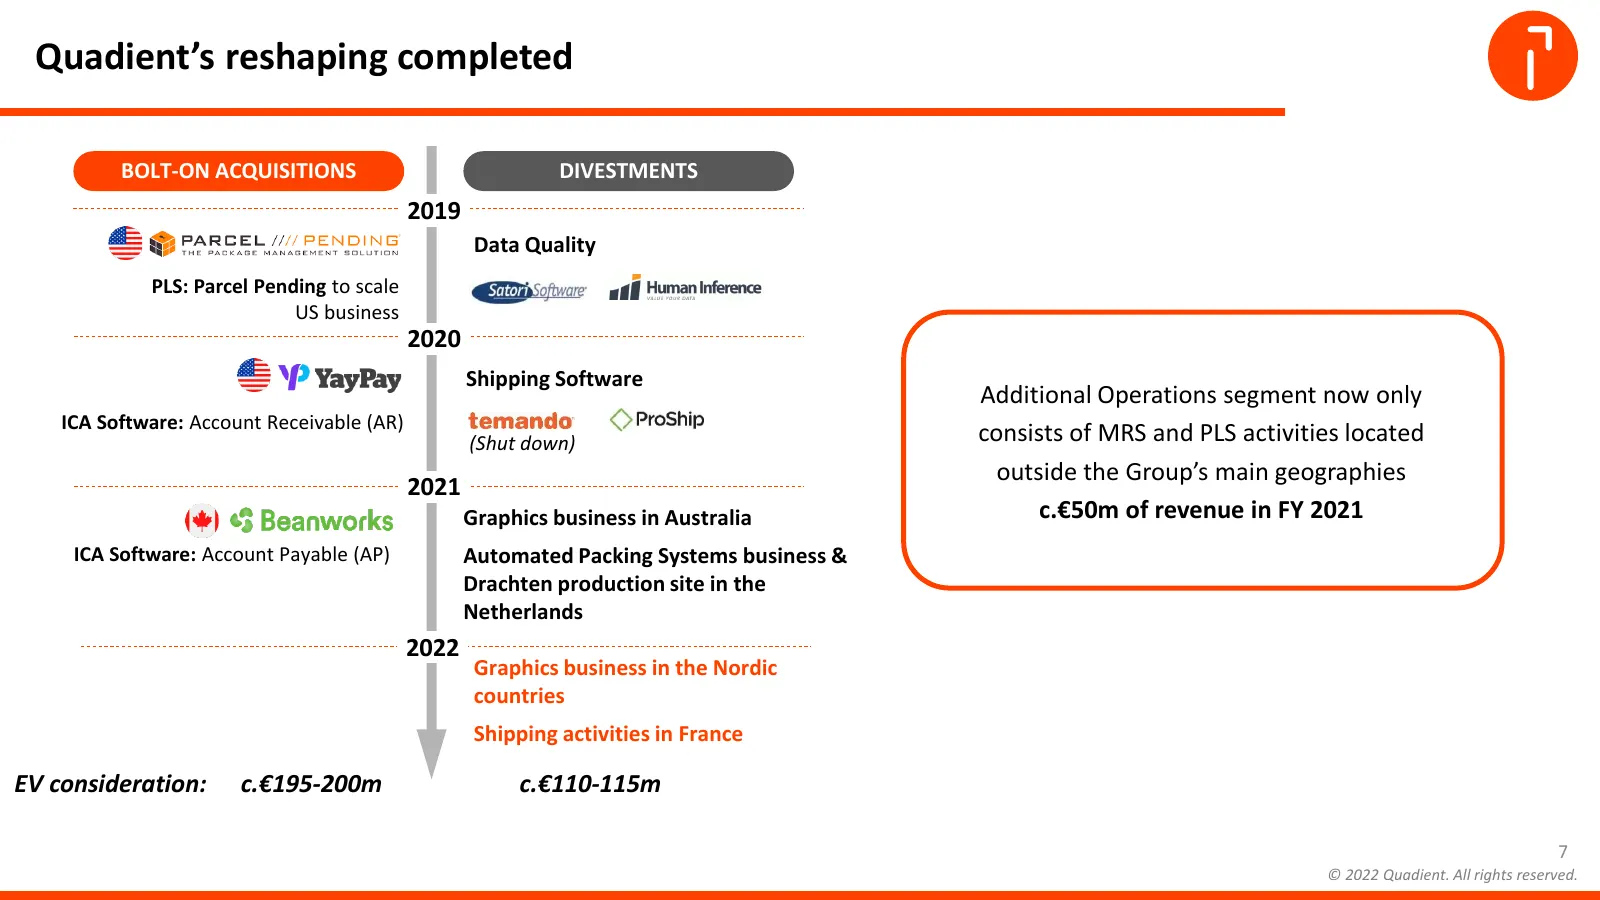
Slide 7: Quadient's reshaping completed
Quadient’s reshaping completed BOLT-ON ACQUISITIONS DIVESTMENTS 2019 Data Quality PLS: Parcel Pending to scale US business 2020 Shipping Software Additional Operations segment now only ICA Software: Account Receivable (AR) (Shut down) consists of MRS and PLS activities located outside the Group’s ma
Slide 8: H1 2022 Solutions Review
8 H1 2022 SOLUTIONS REVIEW Geoffrey GODET CEO Laurent du PASSAGE CFO 8 © 2022 Quadient. All rights reserved.
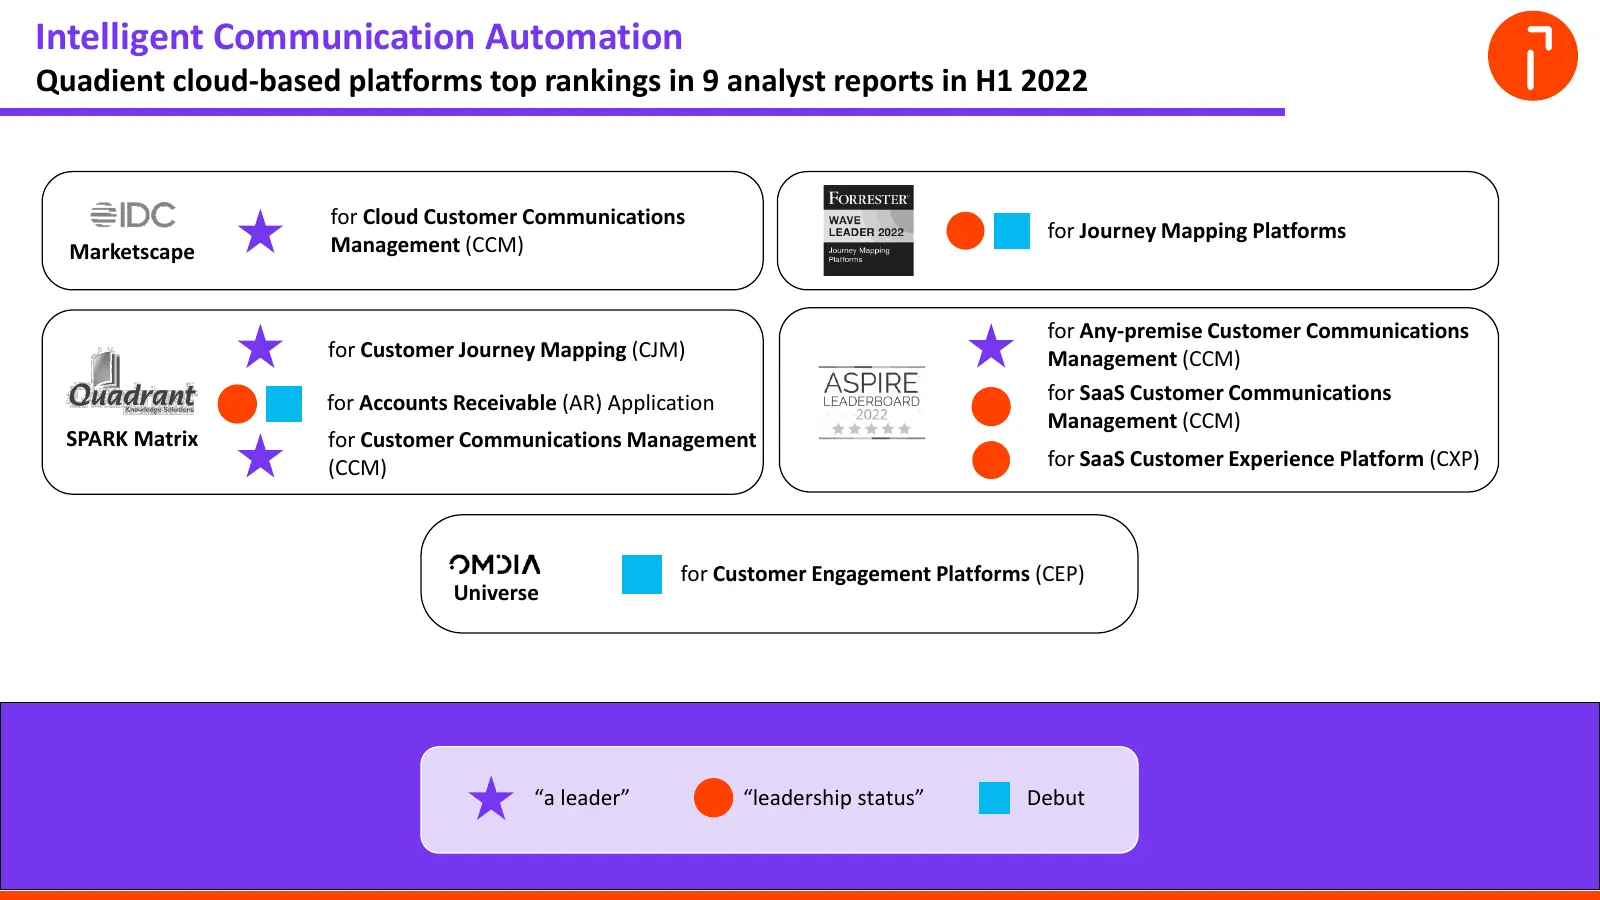
Slide 9: Intelligent Communication Automation
Intelligent Communication Automation Quadient cloud-based platforms top rankings in 9 analyst reports in H1 2022 for Cloud Customer Communications for Journey Mapping Platforms Marketscape Management (CCM) for Any-premise Customer Communications for Customer Journey Mapping (CJM) Management (CCM) fo
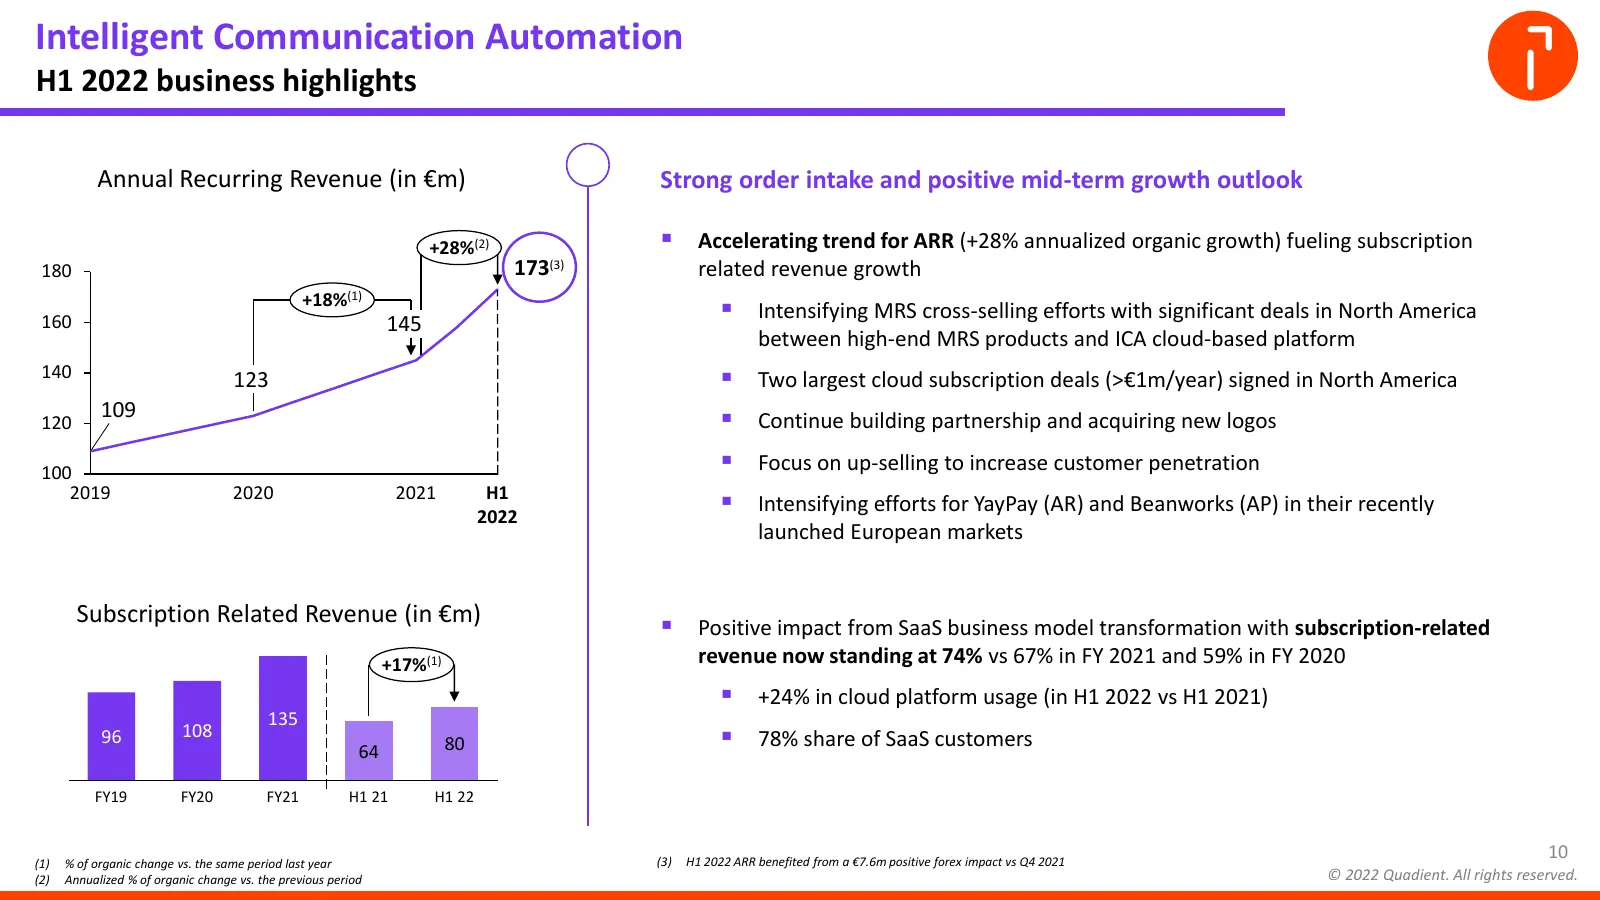
Slide 10: Intelligent Communication Automation: H1 2022 business highlights
Intelligent Communication Automation H1 2022 business highlights Annual Recurring Revenue (in €m) Strong order intake and positive mid-term growth outlook +28%(2) ▪ Accelerating trend for ARR (+28% annualized organic growth) fueling subscription 180 173 (3) related revenue growth +18%(1) 160 145 ▪ I
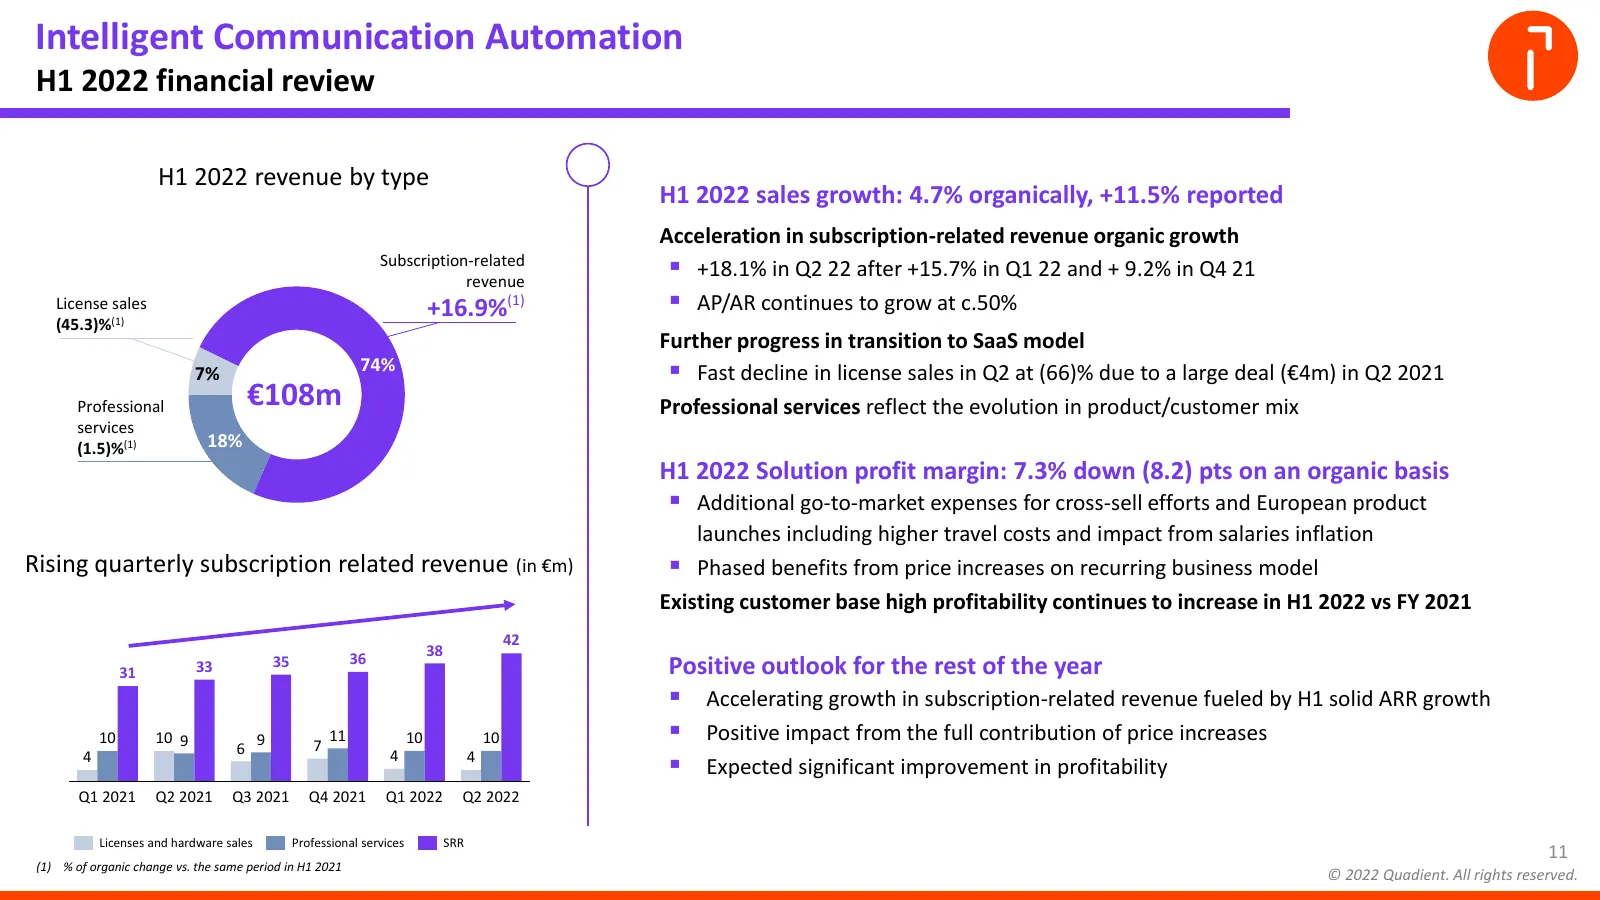
Slide 11: Intelligent Communication Automation: H1 2022 financial review
Intelligent Communication Automation H1 2022 financial review H1 2022 revenue by type H1 2022 sales growth: 4.7% organically, +11.5% reported Acceleration in subscription-related revenue organic growth Subscription-related revenue ▪ +18.1% in Q2 22 after +15.7% in Q1 22 and + 9.2% in Q4 21 License s
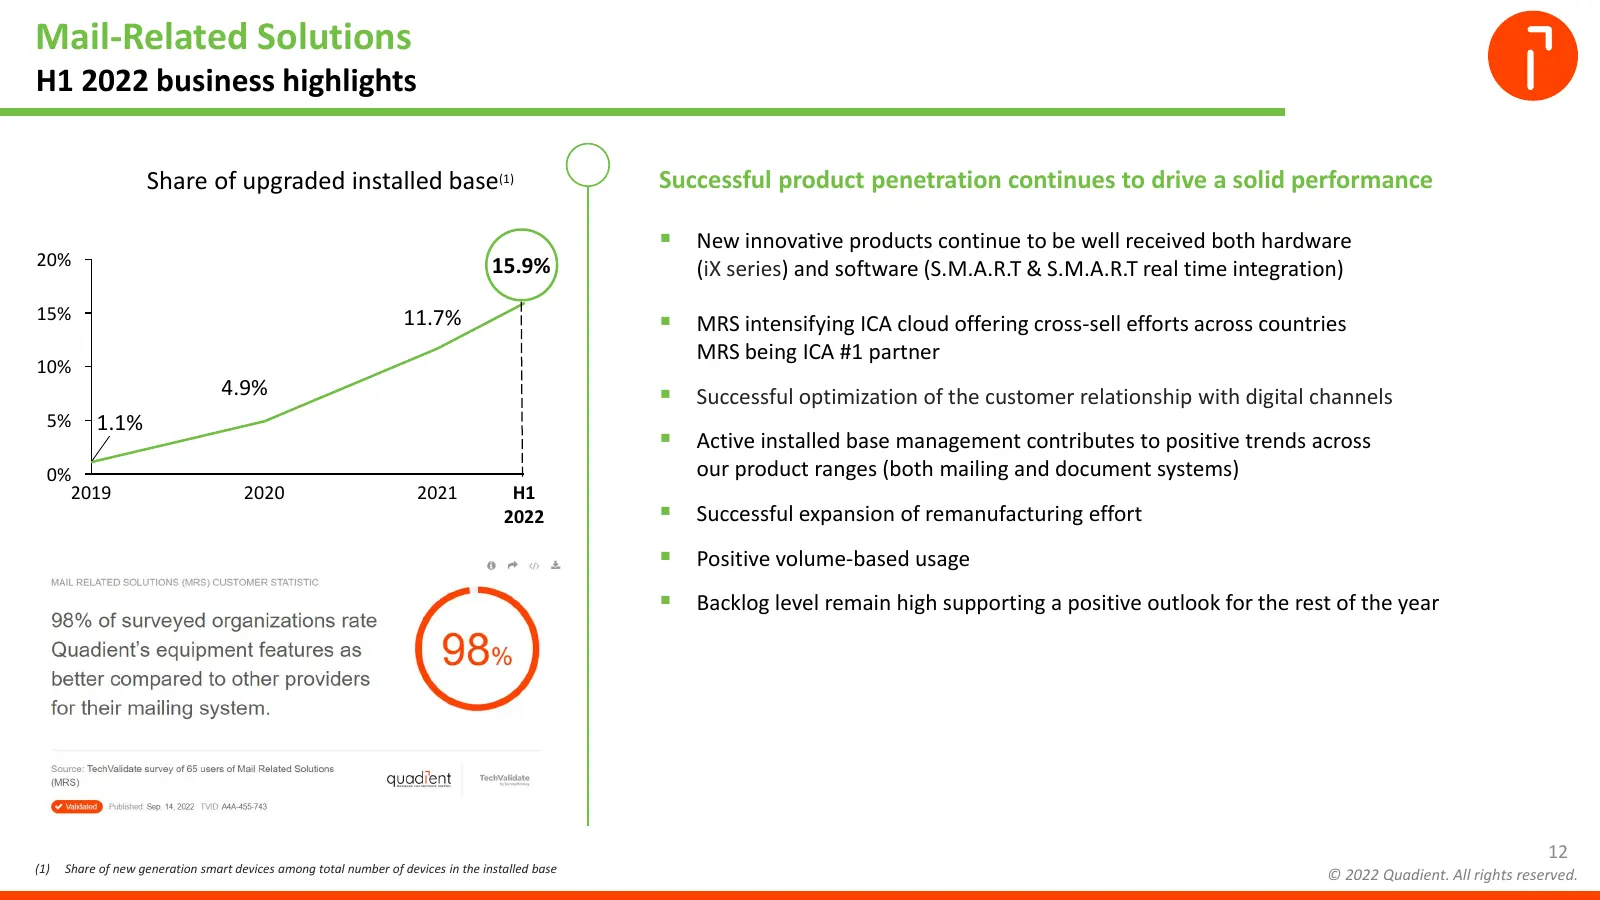
Slide 12: Mail-Related Solutions: H1 2022 business highlights
Mail-Related Solutions H1 2022 business highlights Share of upgraded installed base(1) Successful product penetration continues to drive a solid performance ▪ New innovative products continue to be well received both hardware 20% 15.9% (iX series) and software (S.M.A.R.T & S.M.A.R.T real time integr
Slide 13: Mail-Related Solutions: H1 2022 financial review
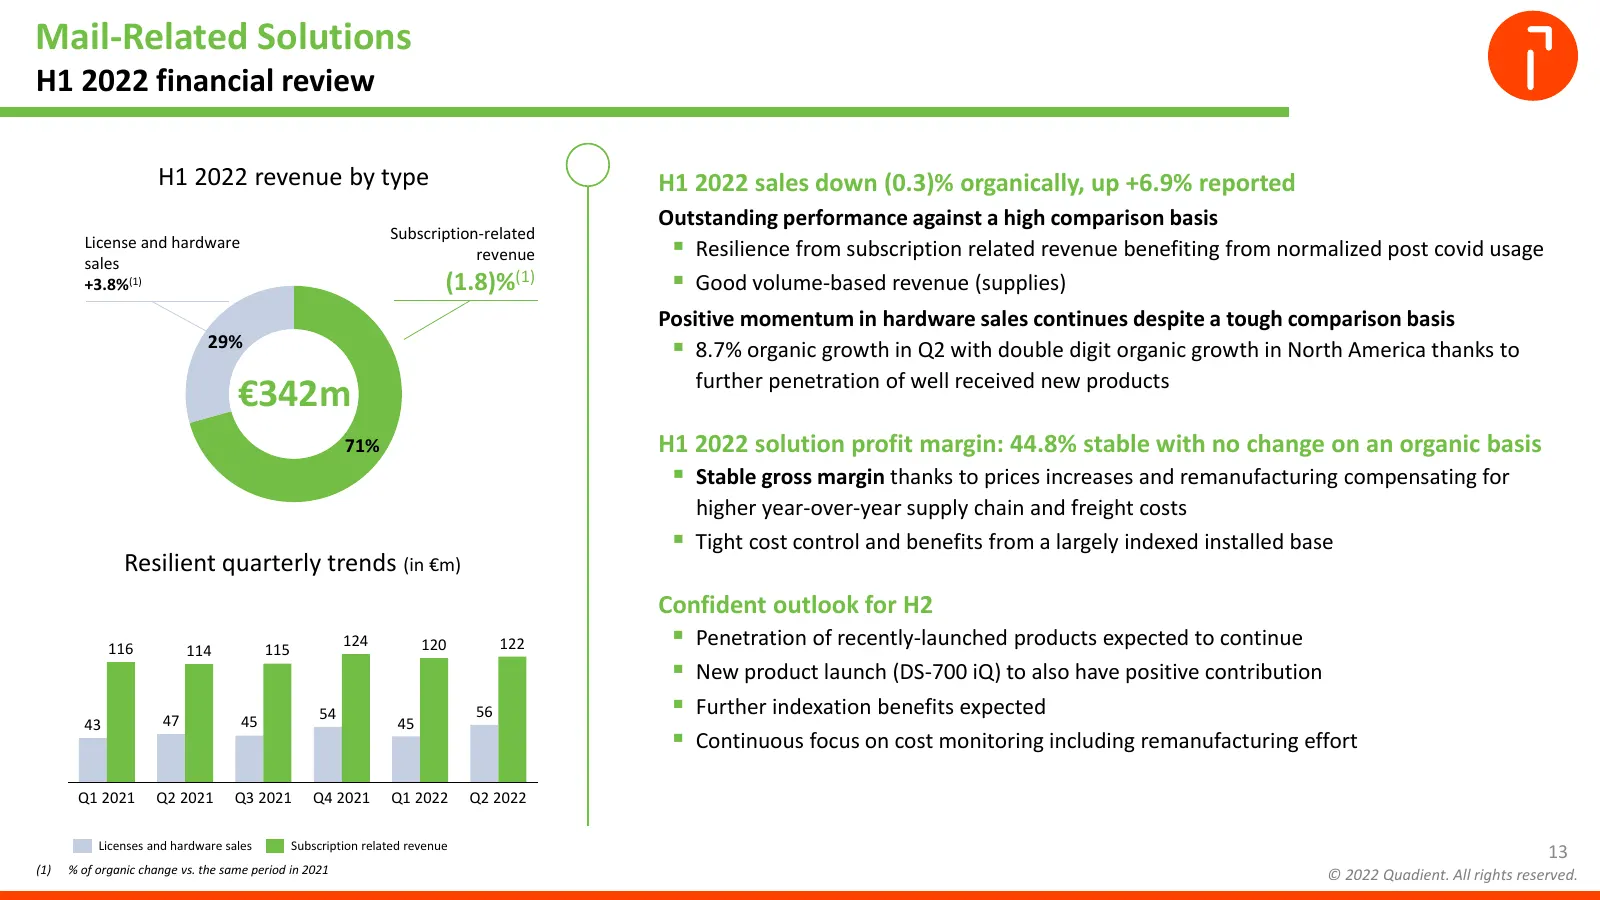
Mail-Related Solutions H1 2022 financial review H1 2022 revenue by type H1 2022 sales down (0.3)% organically, up +6.9% reported Outstanding performance against a high comparison basis Subscription-related License and hardware sales revenue ▪ Resilience from subscription related revenue benefiting f
Slide 14: Launch of the UK open network for Parcel Locker Solutions
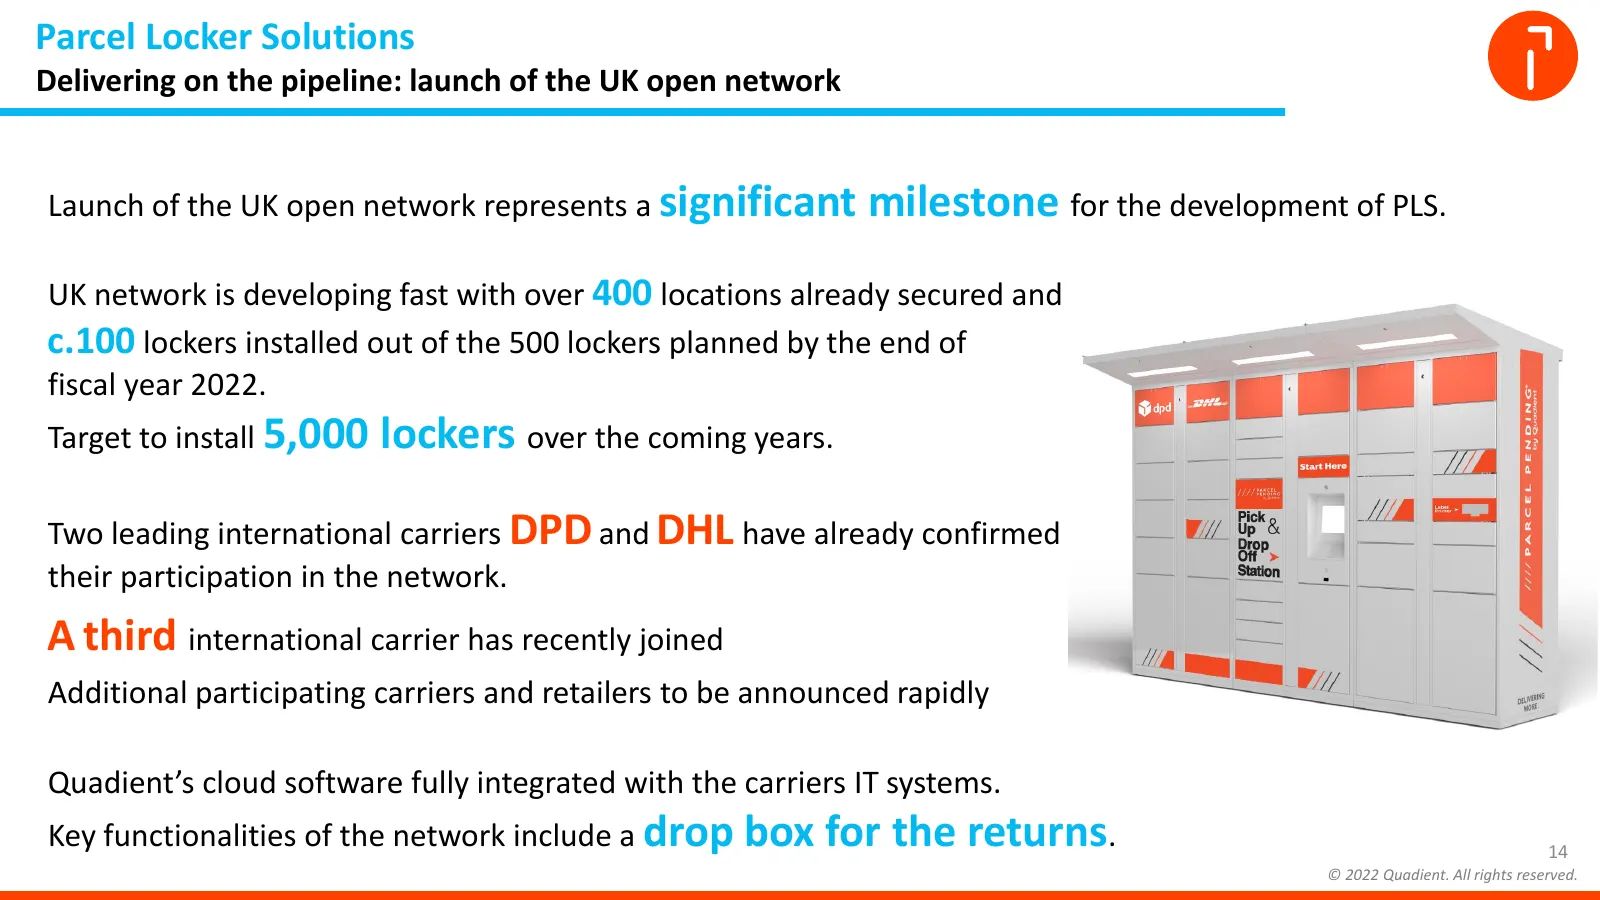
Parcel Locker Solutions Delivering on the pipeline: launch of the UK open network Launch of the UK open network represents a significant milestone for the development of PLS. UK network is developing fast with over 400 locations already secured and c.100 lockers installed out of the 500 lockers plan
Slide 15: Parcel Locker Solutions: H1 2022 business highlights
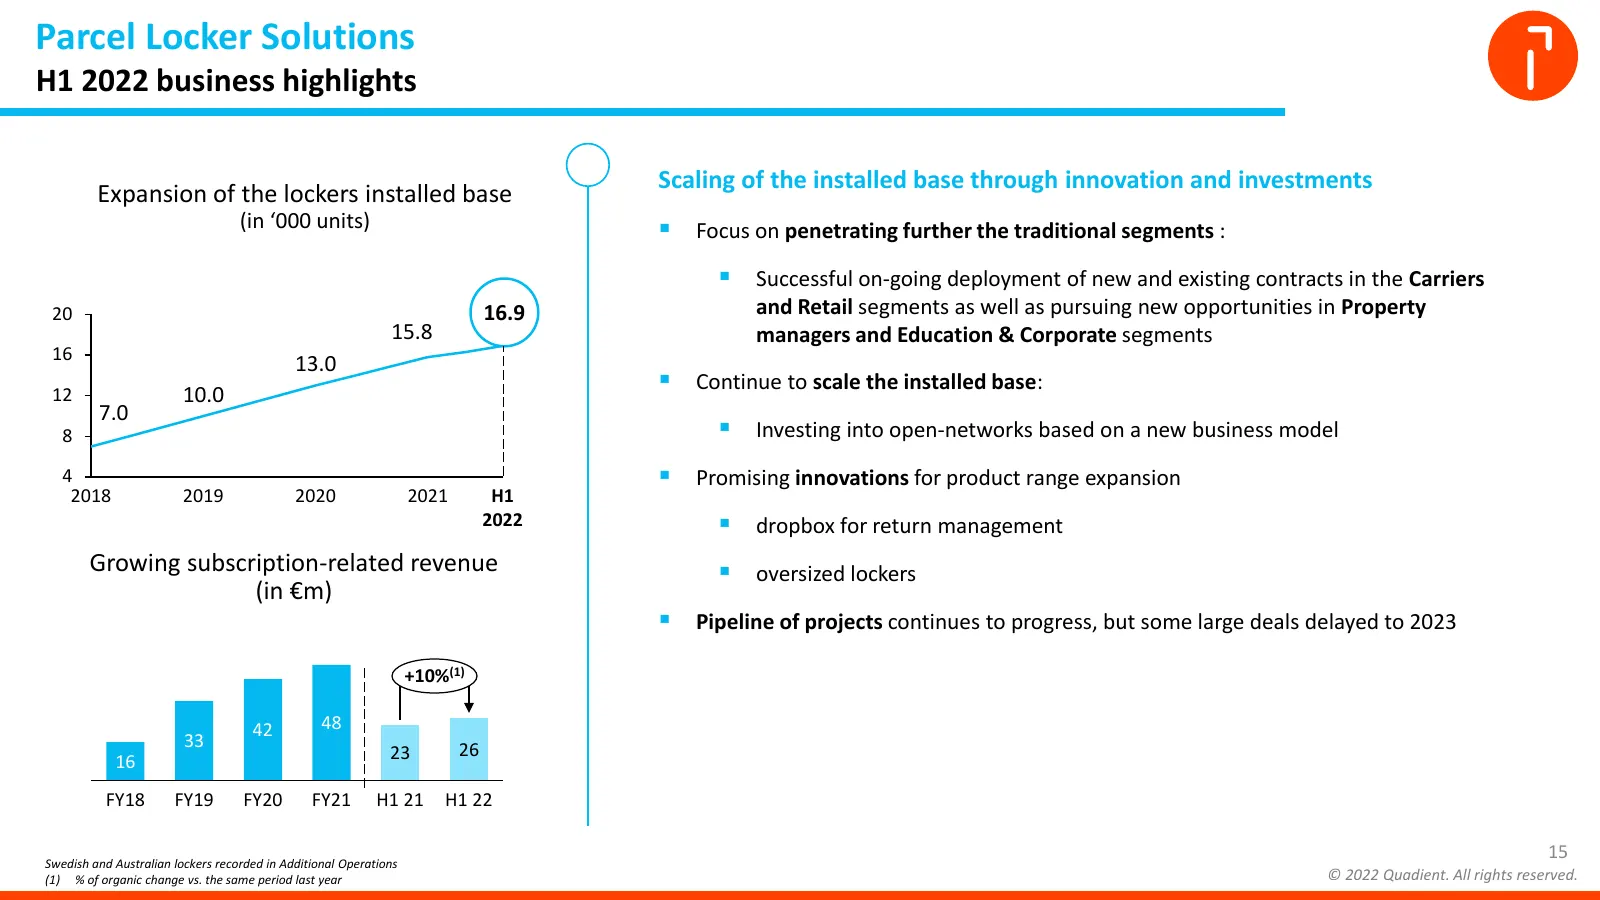
Parcel Locker Solutions H1 2022 business highlights Scaling of the installed base through innovation and investments Expansion of the lockers installed base (in ‘000 units) ▪ Focus on penetrating further the traditional segments : ▪ Successful on-going deployment of new and existing contracts in the
Slide 16: Parcel Locker Solutions: H1 2022 financial review
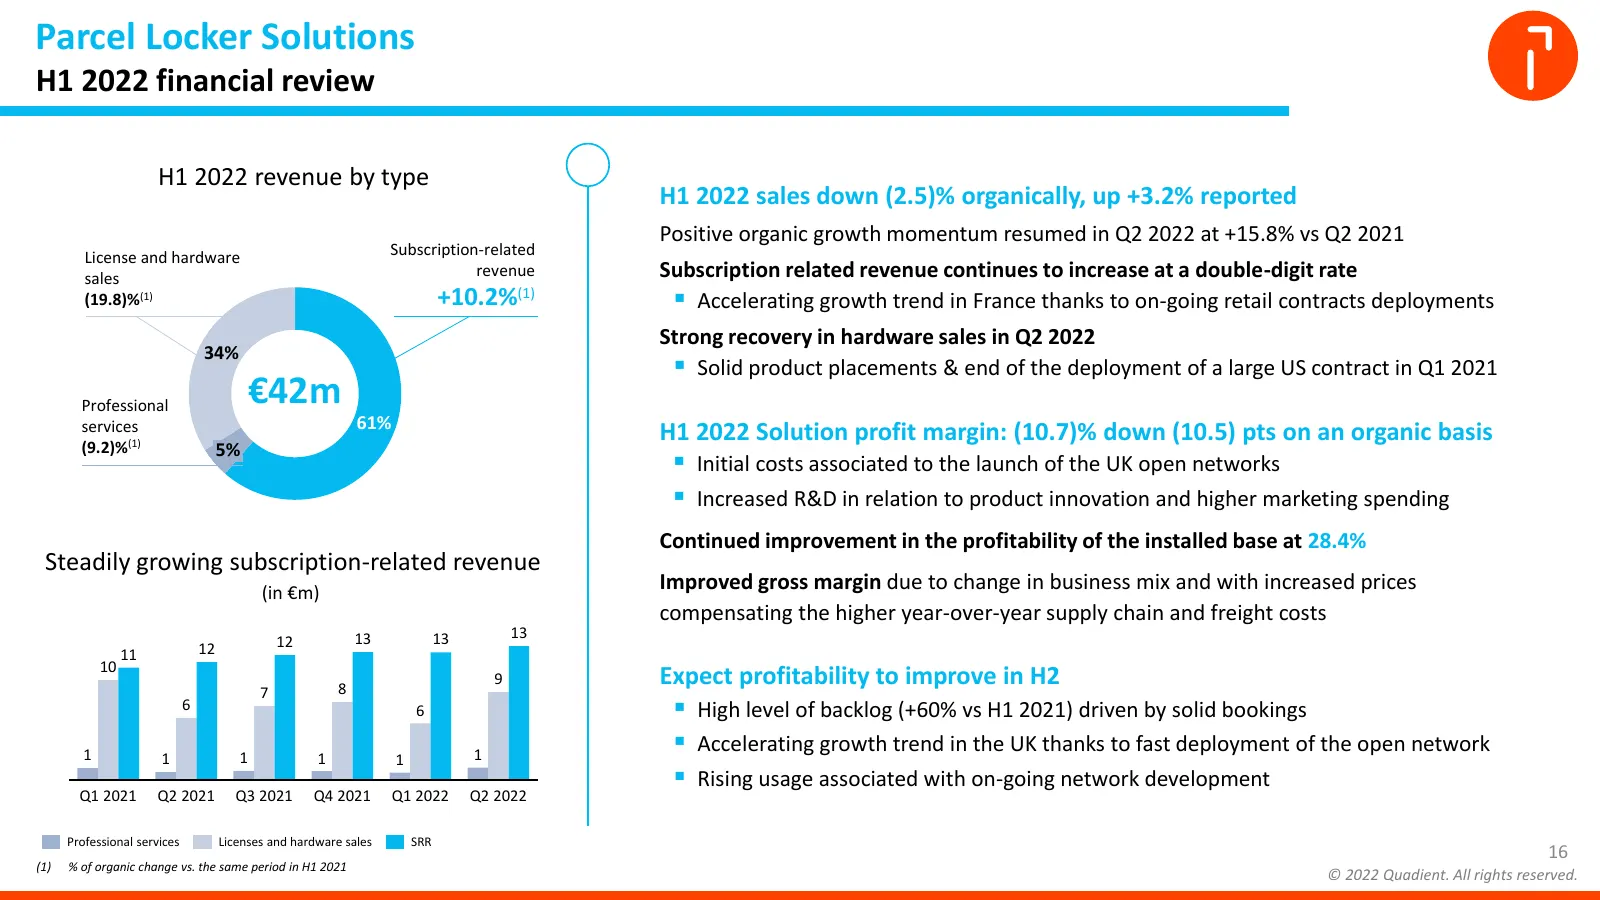
Parcel Locker Solutions H1 2022 financial review H1 2022 revenue by type H1 2022 sales down (2.5)% organically, up +3.2% reported Positive organic growth momentum resumed in Q2 2022 at +15.8% vs Q2 2021 License and hardware Subscription-related sales revenue Subscription related revenue continues to
Slide 17: Major Operations
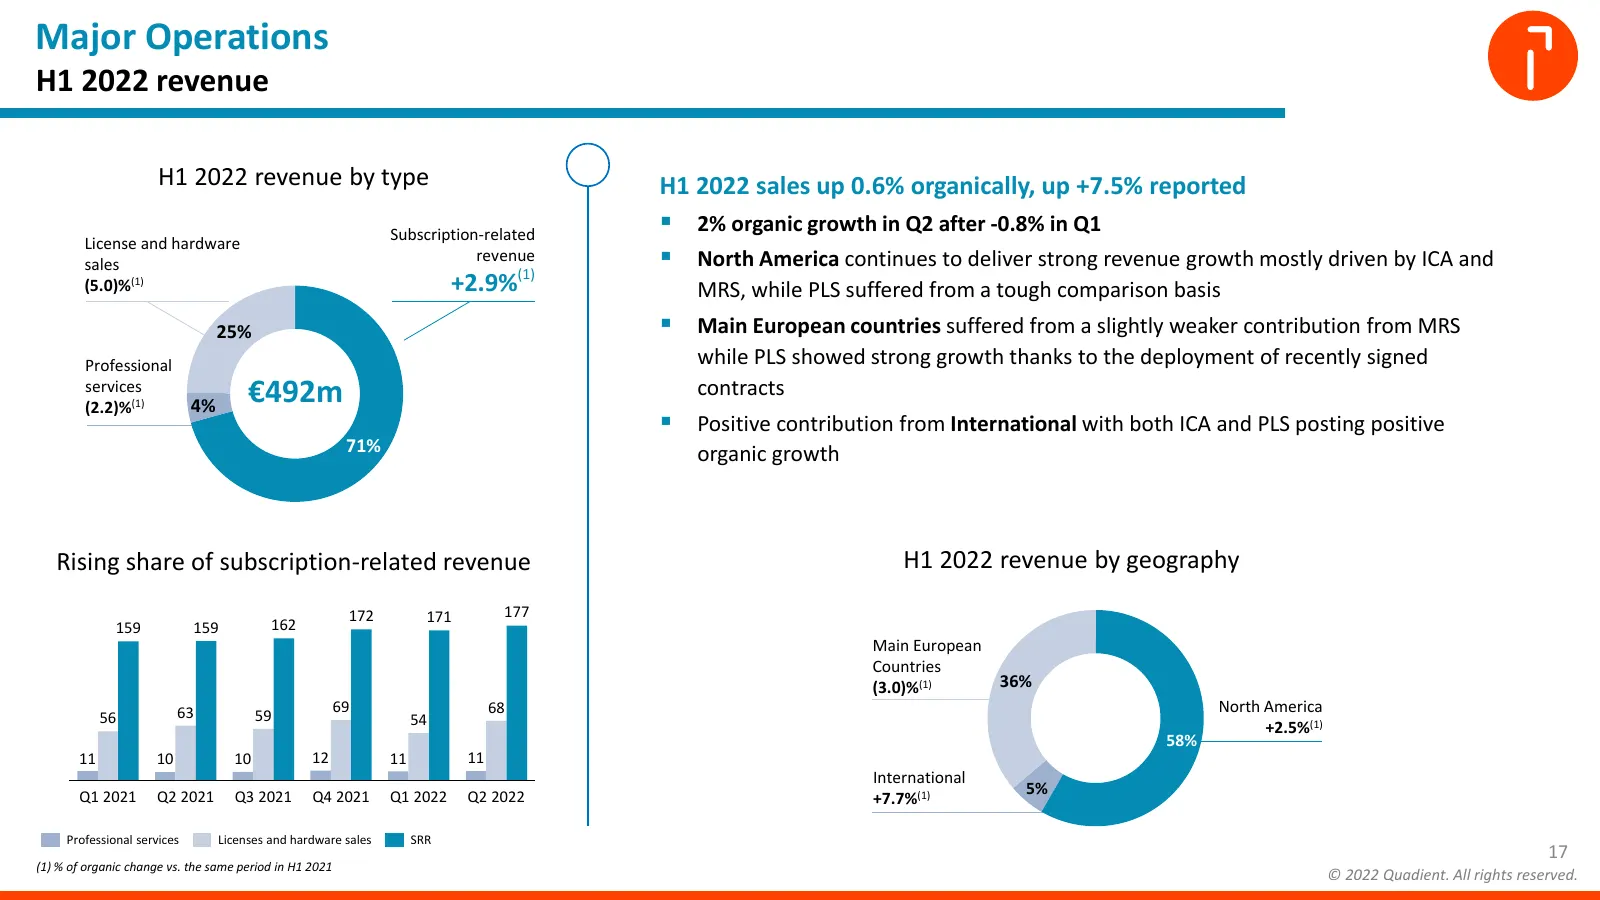
Major Operations H1 2022 revenue H1 2022 revenue by type H1 2022 sales up 0.6% organically, up +7.5% reported Subscription-related ▪ 2% organic growth in Q2 after -0.8% in Q1 License and hardware sales revenue ▪ North America continues to deliver strong revenue growth mostly driven by ICA and (5.0)%
Slide 18: H1 2022 Financial Review
18 H1 2022 FINANCIAL REVIEW Laurent du PASSAGE CFO © Quadient 18 © 2022 Quadient. All rights reserved.
Slide 19: H1 2022 results summary
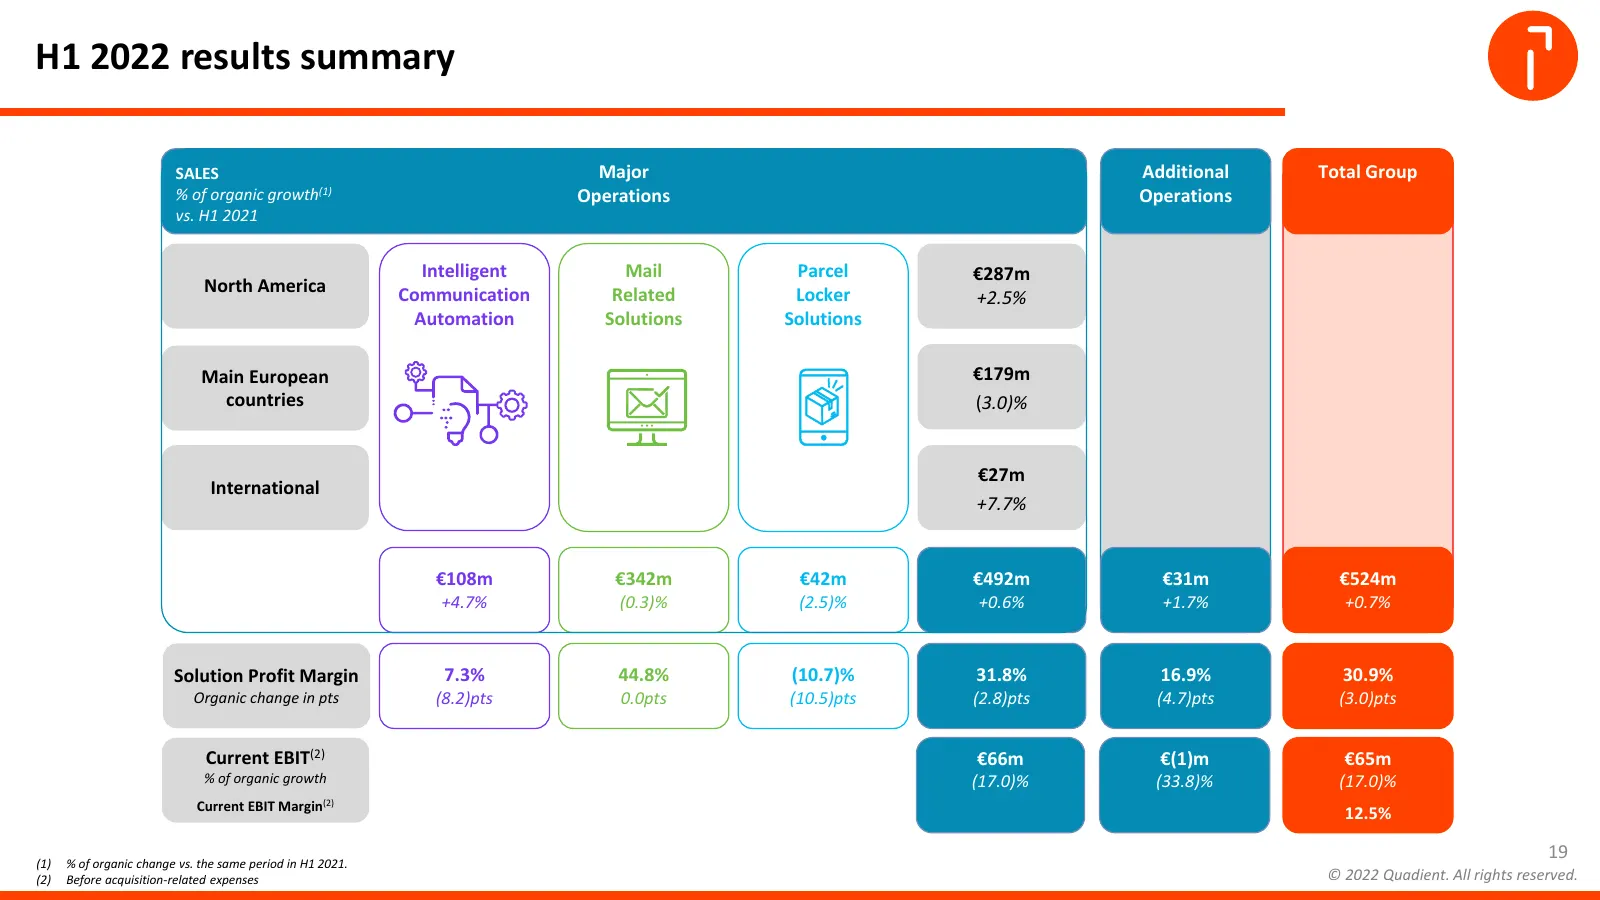
H1 2022 results summary SALES Major Additional Total Group % of organic growth(1) Operations Operations vs. H1 2021 Intelligent Mail Parcel €287m North America Communication Related Locker +2.5% Automation Solutions Solutions Main European €179m countries (3.0)% €27m International +7.7% €108m €342m
Slide 20: +4.0% reported revenue growth in H1, positive underlying trends confirmed
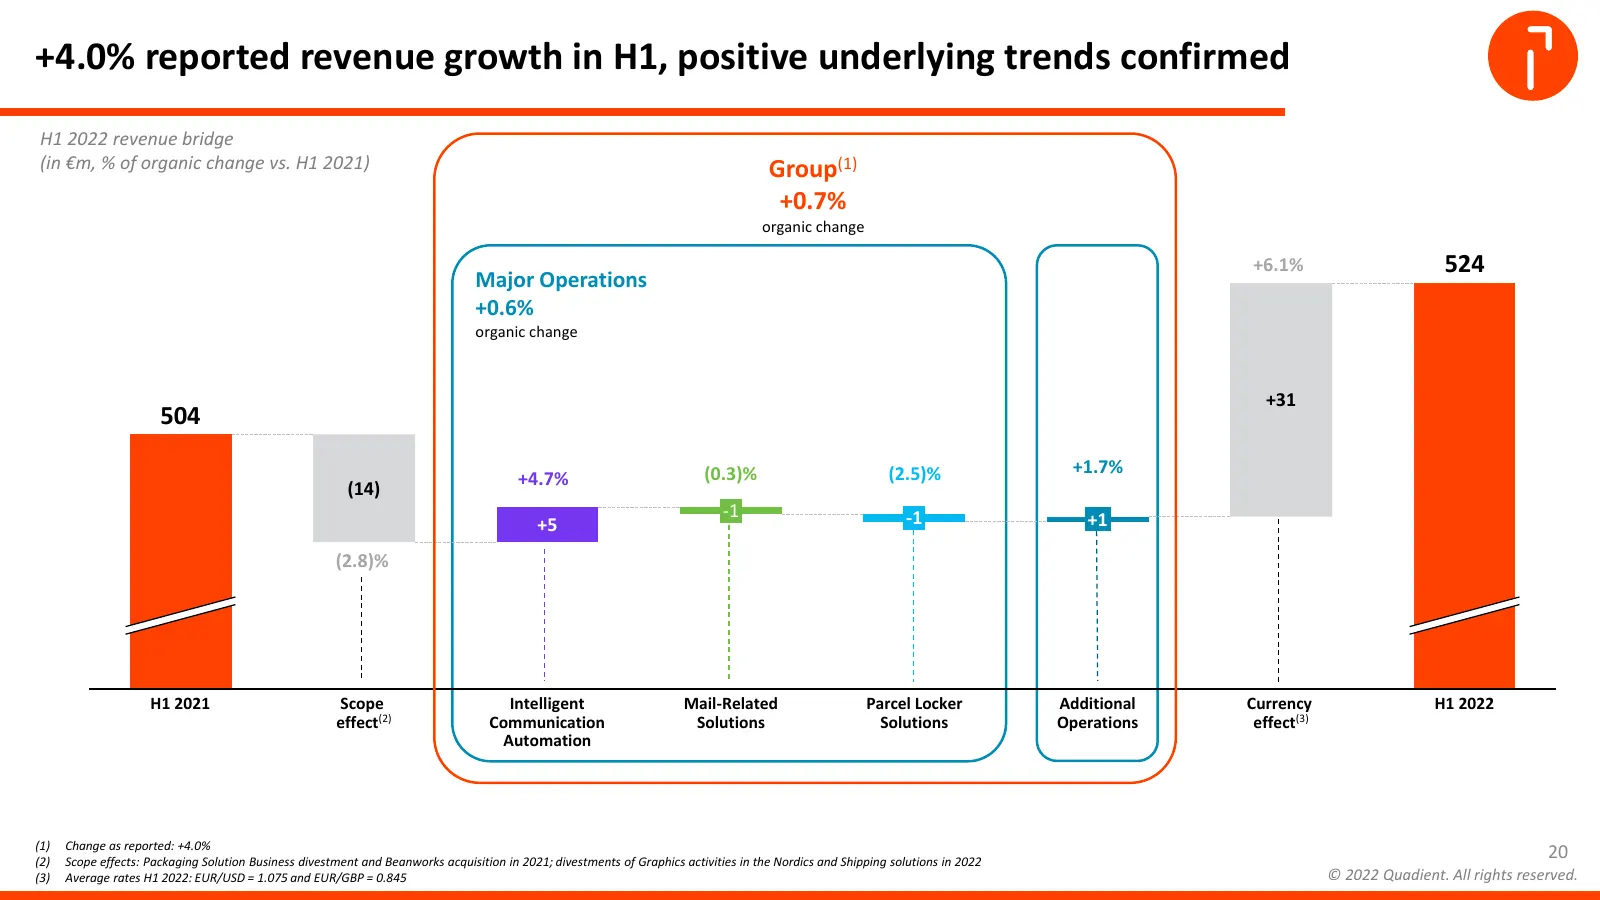
+4.0% reported revenue growth in H1, positive underlying trends confirmed H1 2022 revenue bridge (in €m, % of organic change vs. H1 2021) Group(1) +0.7% organic change +6.1% 524 Major Operations +0.6% organic change +31 504 (0.3)% (2.5)% +1.7% (14) +4.7% -1 -1 +1 +5 (2.8)% H1 2021 Scope Intelligent
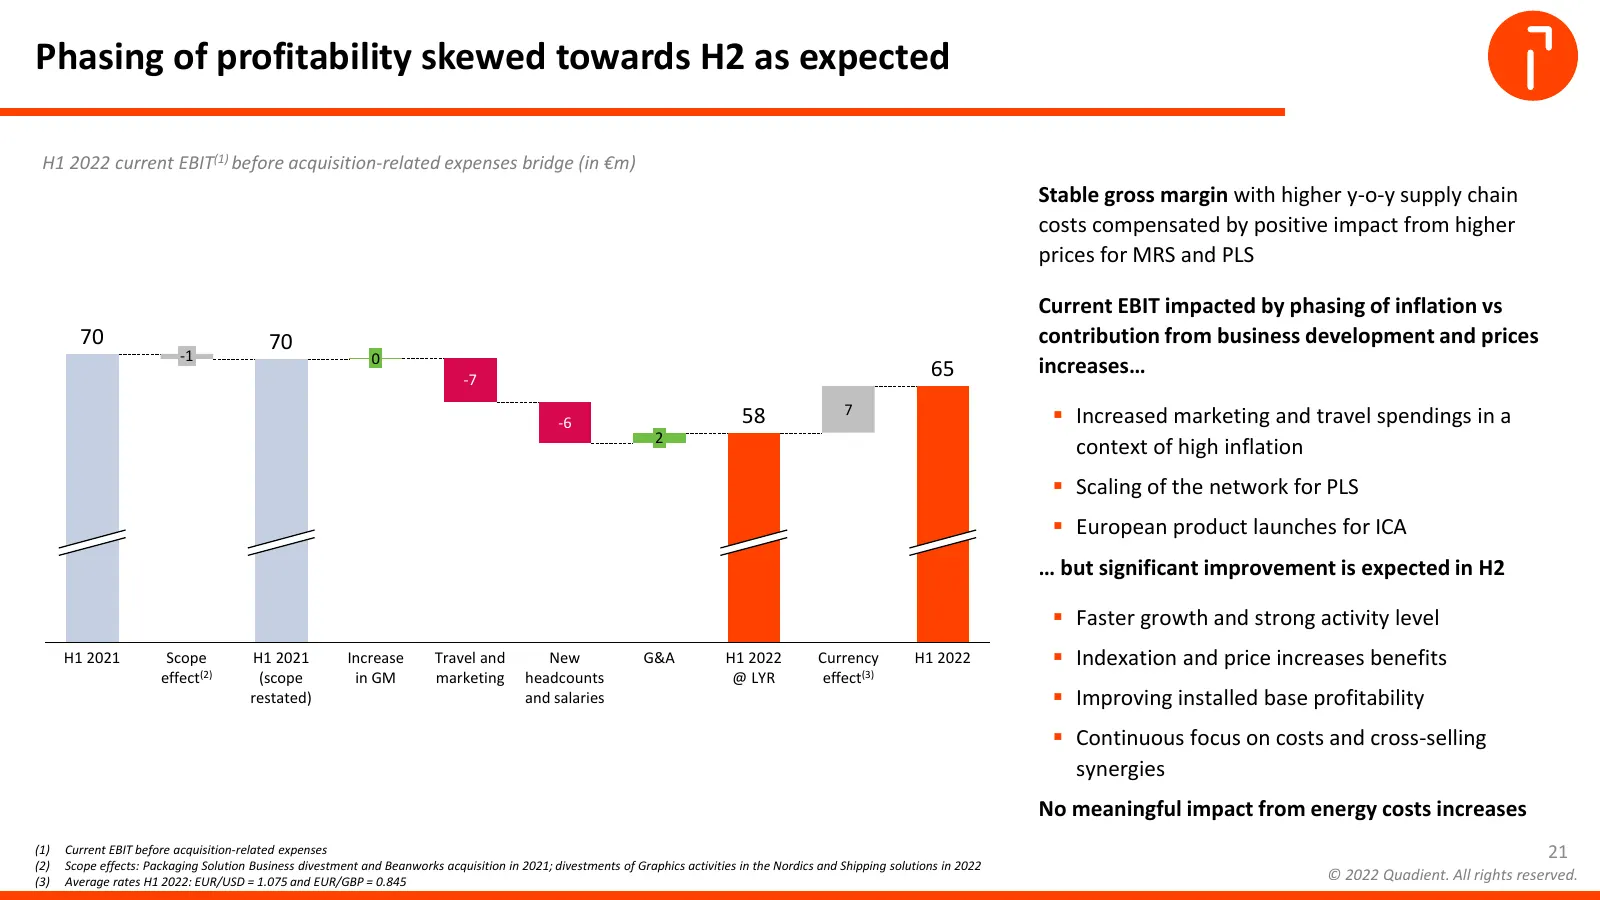
Slide 21: Phasing of profitability skewed towards H2 as expected
Phasing of profitability skewed towards H2 as expected H1 2022 current EBIT(1) before acquisition-related expenses bridge (in €m) Stable gross margin with higher y-o-y supply chain costs compensated by positive impact from higher prices for MRS and PLS Current EBIT impacted by phasing of inflation v
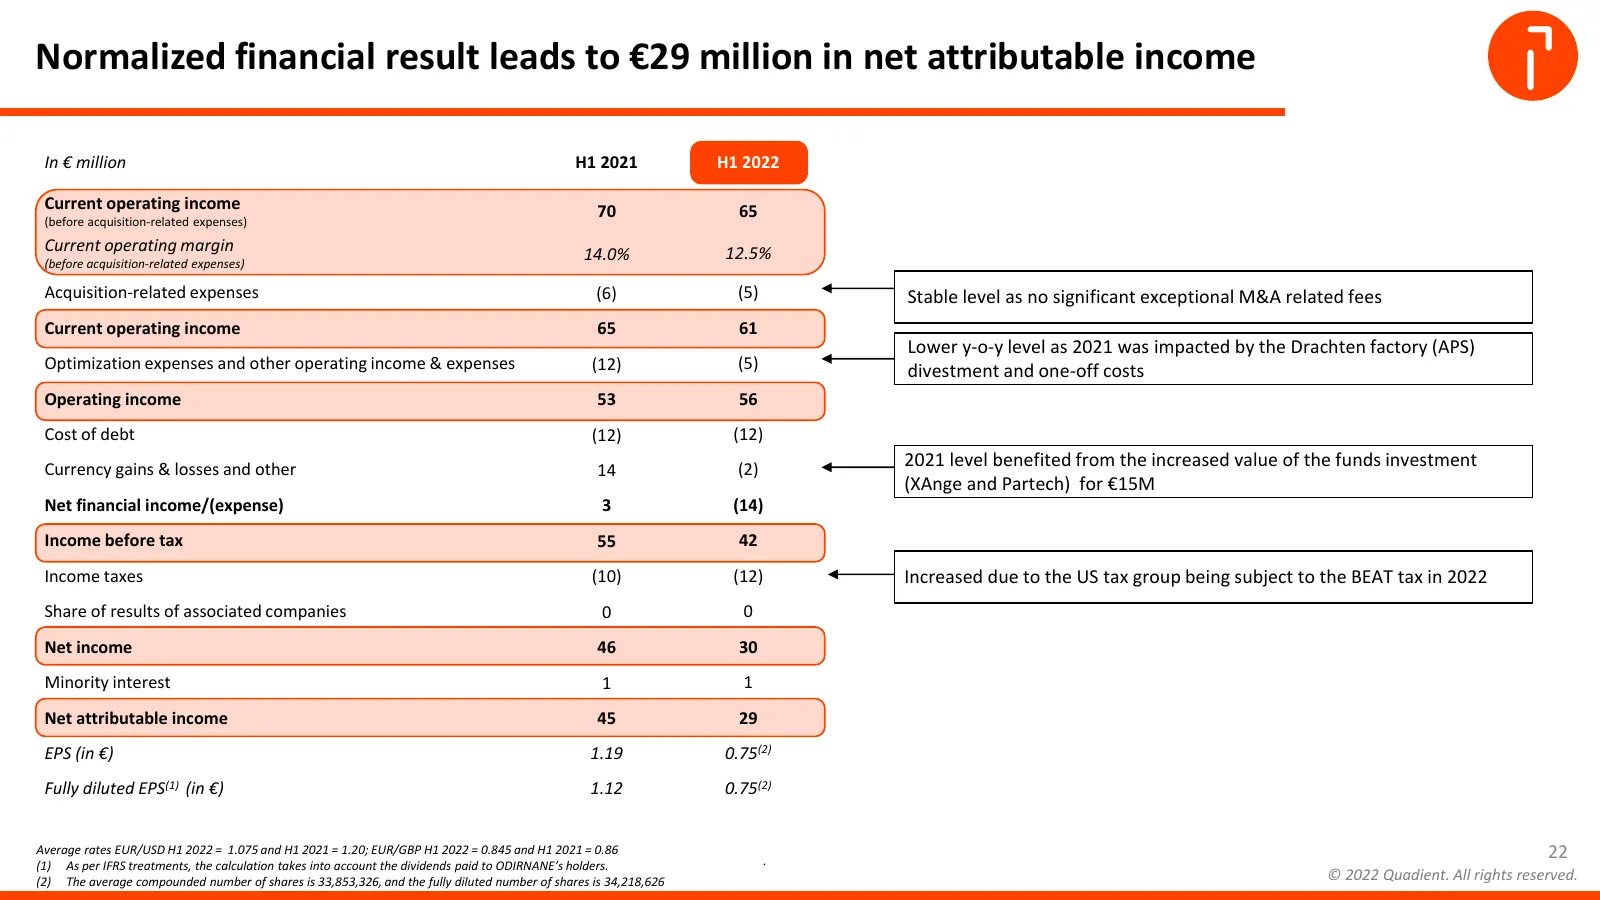
Slide 22: Normalized financial result leads to €29 million in net attributable income
Normalized financial result leads to €29 million in net attributable income In € million H1 2021 H1 2022 Current operating income 70 65 (before acquisition-related expenses) Current operating margin 14.0% 12.5% (before acquisition-related expenses) Acquisition-related expenses (6) (5) Stable level a
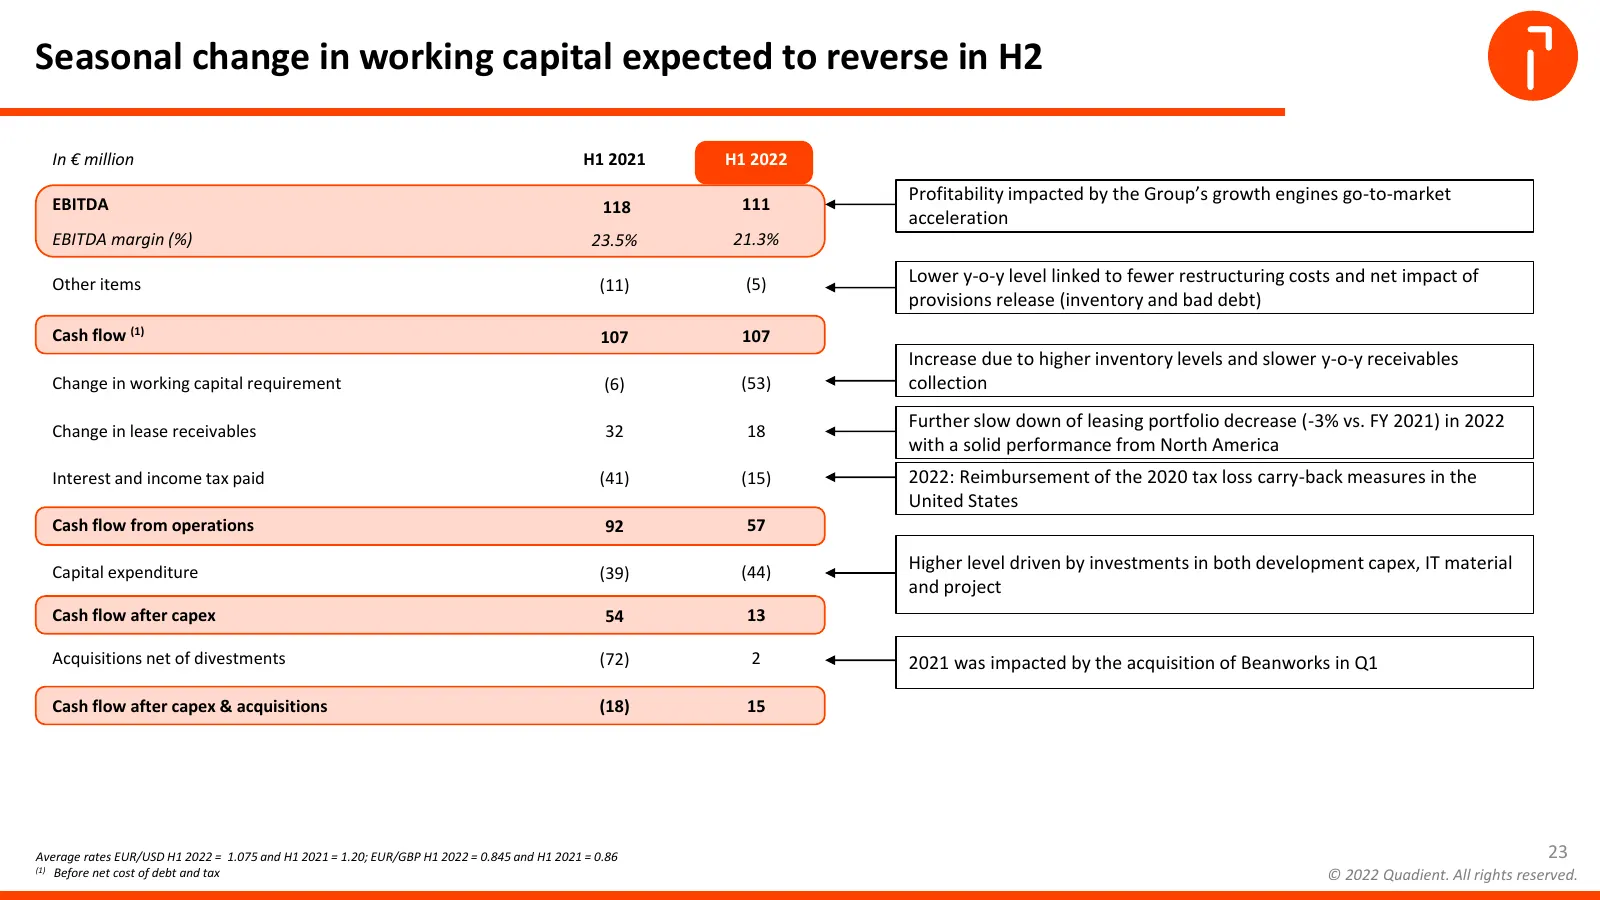
Slide 23: Seasonal change in working capital expected to reverse in H2
Seasonal change in working capital expected to reverse in H2 In € million H1 2021 H1 2022 EBITDA 111 Profitability impacted by the Group’s growth engines go-to-market 118 acceleration EBITDA margin (%) 23.5% 21.3% Other items (11) (5) Lower y-o-y level linked to fewer restructuring costs and net imp
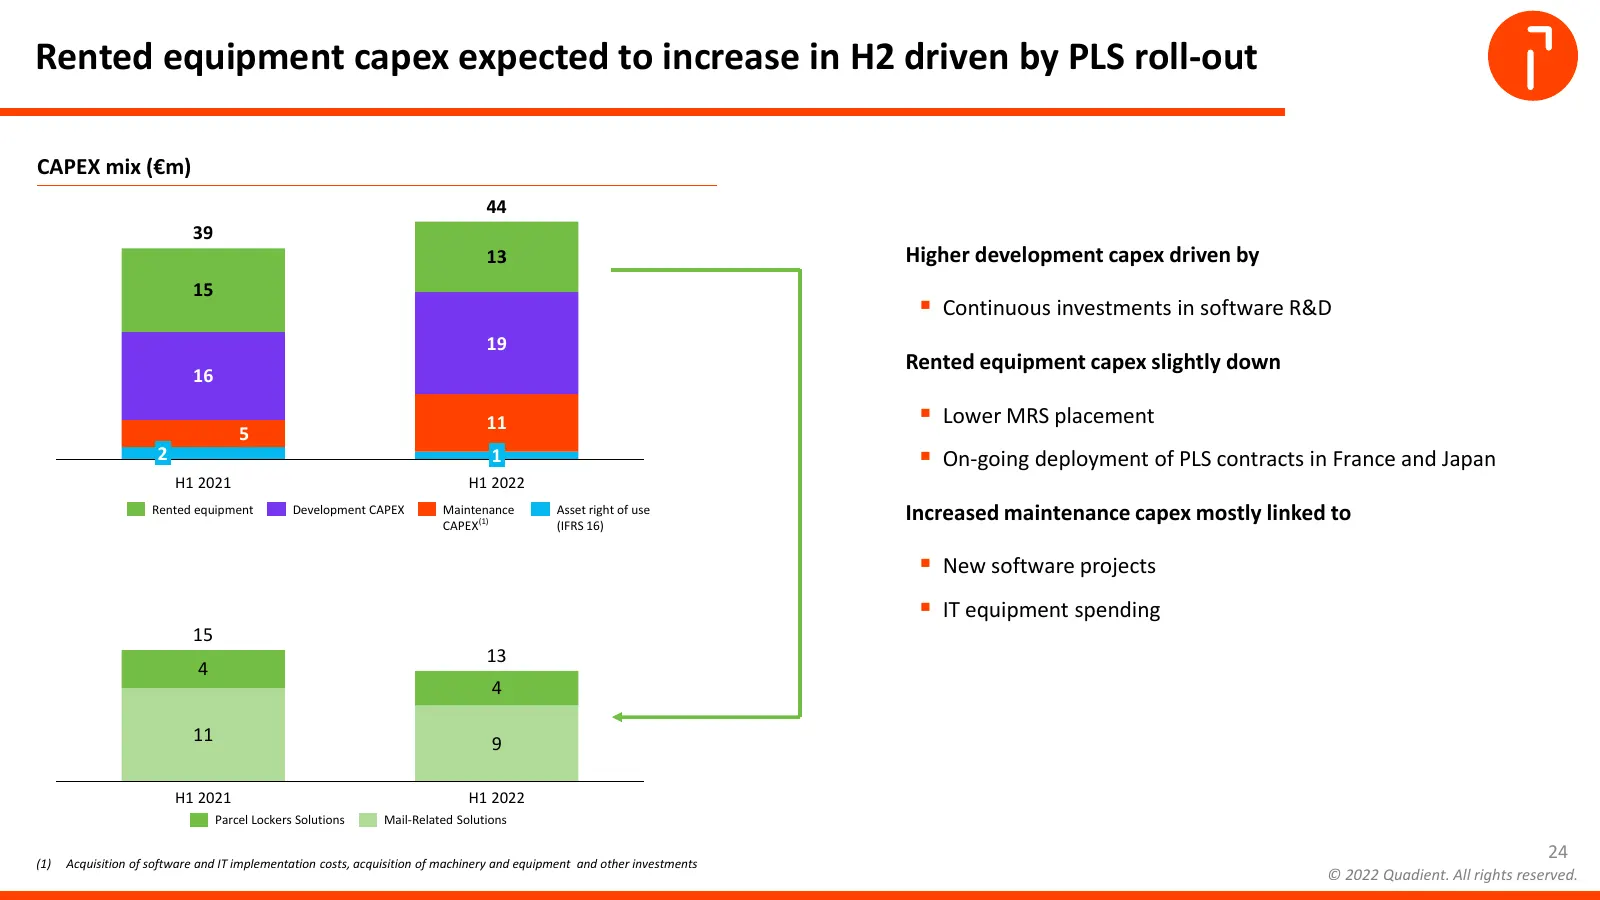
Slide 24: Rented equipment capex expected to increase in H2 driven by PLS roll-out
Rented equipment capex expected to increase in H2 driven by PLS roll-out CAPEX mix (€m) 44 39 13 Higher development capex driven by 15 ▪ Continuous investments in software R&D 19 Rented equipment capex slightly down 16 11 ▪ Lower MRS placement 5 2 1 ▪ On-going deployment of PLS contracts in France a
Slide 25: Stable financial structure, despite the ODIRNANE repayment in June
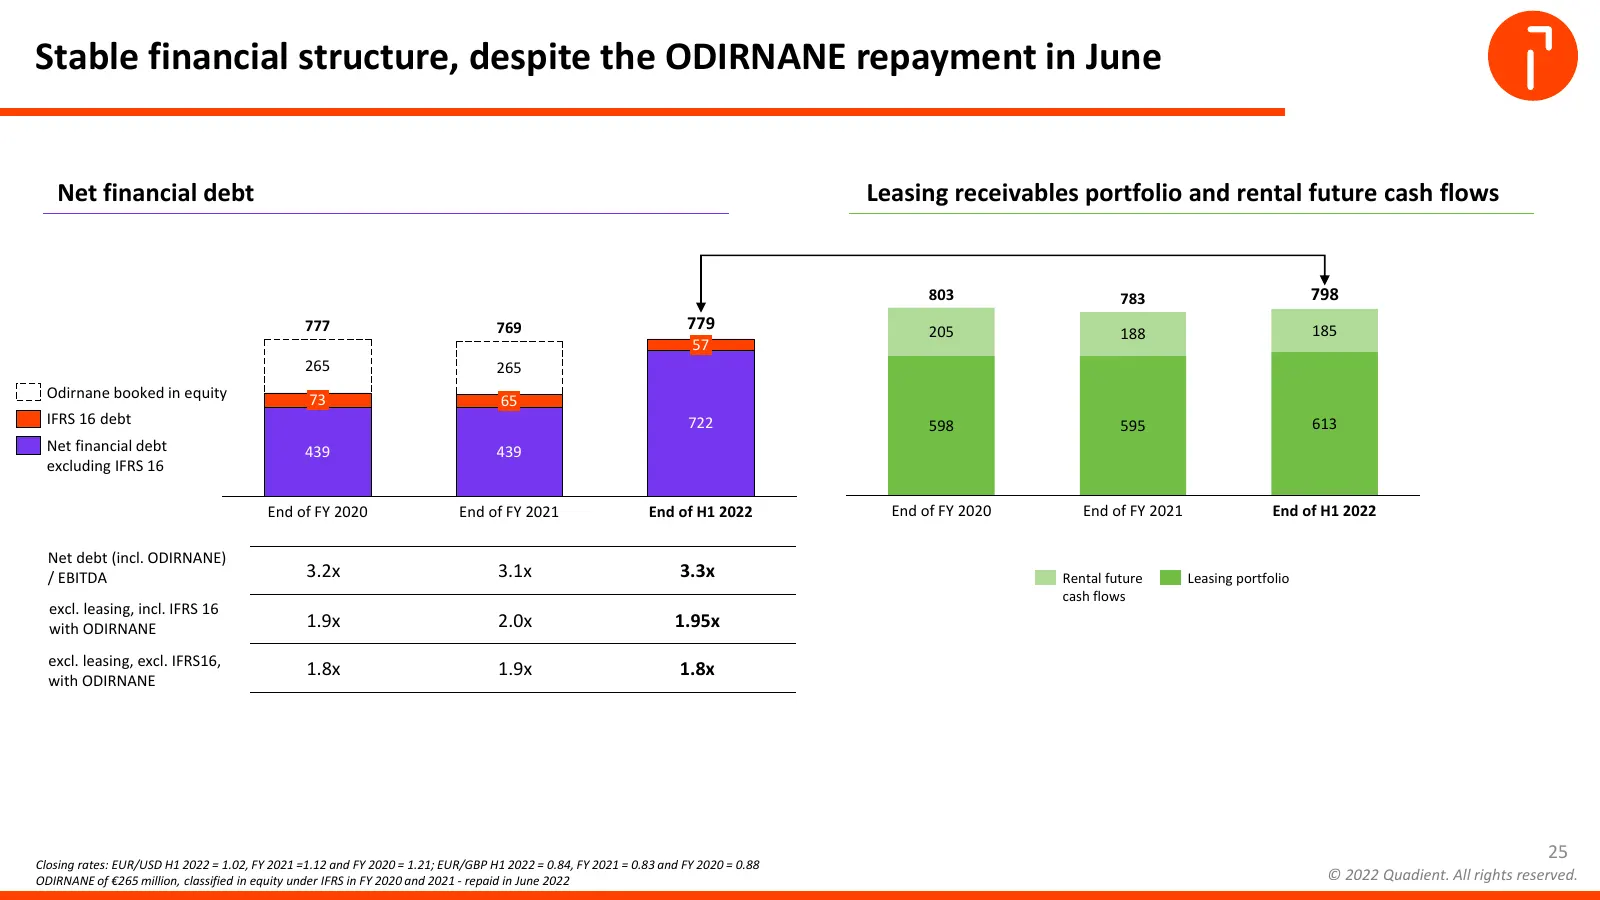
Stable financial structure, despite the ODIRNANE repayment in June Net financial debt Leasing receivables portfolio and rental future cash flows 803 783 798 777 769 779 205 185 188 57 265 265 Odirnane booked in equity 73 65 IFRS 16 debt 722 598 595 613 Net financial debt 439 439 excluding IFRS 16 En
Slide 26: Solid financial structure with no major refinancing before 2025
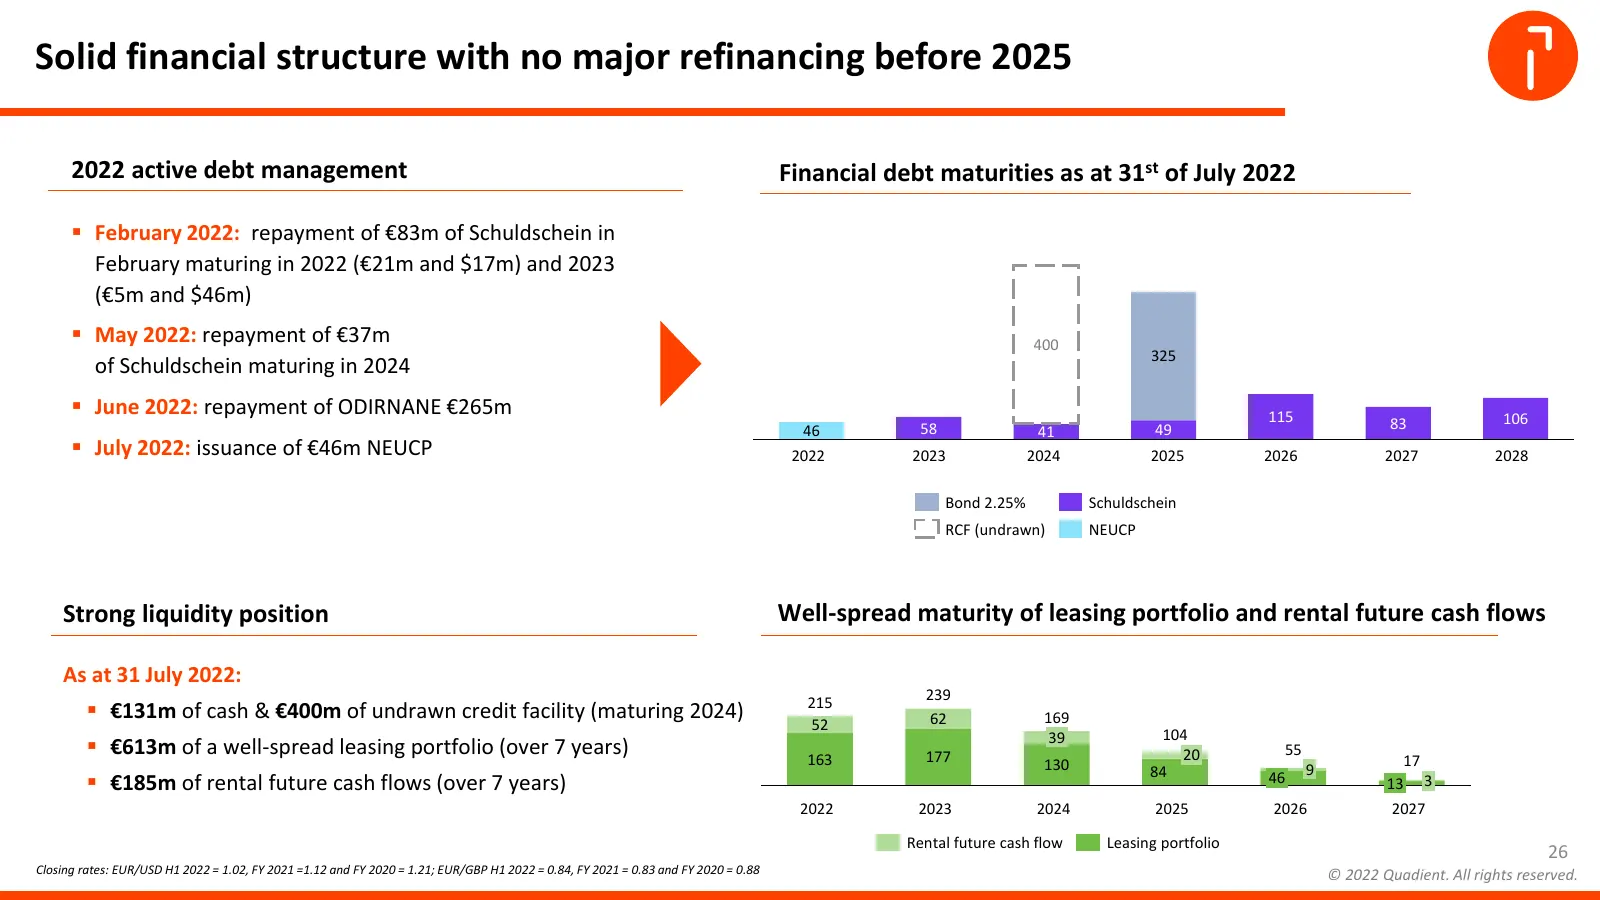
Solid financial structure with no major refinancing before 2025 2022 active debt management Financial debt maturities as at 31st of July 2022 ▪ February 2022: repayment of €83m of Schuldschein in February maturing in 2022 (€21m and $17m) and 2023 (€5m and $46m) ▪ May 2022: repayment of €37m 400 325

Slide 27: FY 2022 Outlook
27 FY 2022 OUTLOOK Geoffrey GODET CEO © Quadient 27 © 2022 Quadient. All rights reserved.
Slide 28: Solid Q2 growth momentum supports an expected strong H2 performance
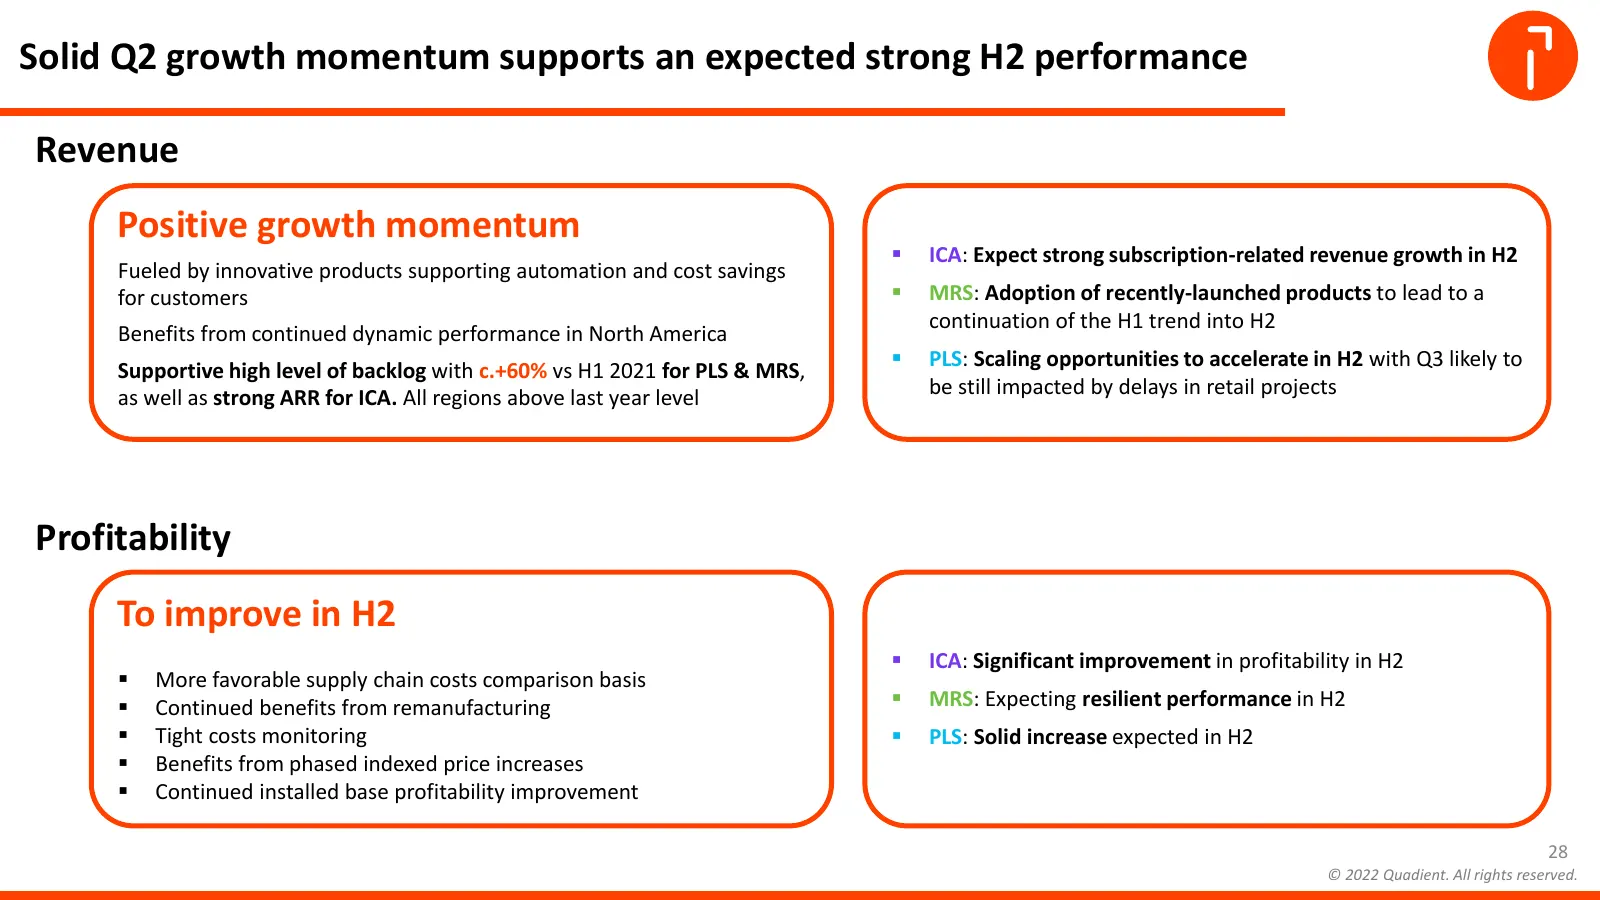
Solid Q2 growth momentum supports an expected strong H2 performance Revenue Positive growth momentum ▪ ICA: Expect strong subscription-related revenue growth in H2 Fueled by innovative products supporting automation and cost savings for customers ▪ MRS: Adoption of recently-launched products to lead
Slide 29: FY 2022 guidance and 2021-2023 outlook confirmed
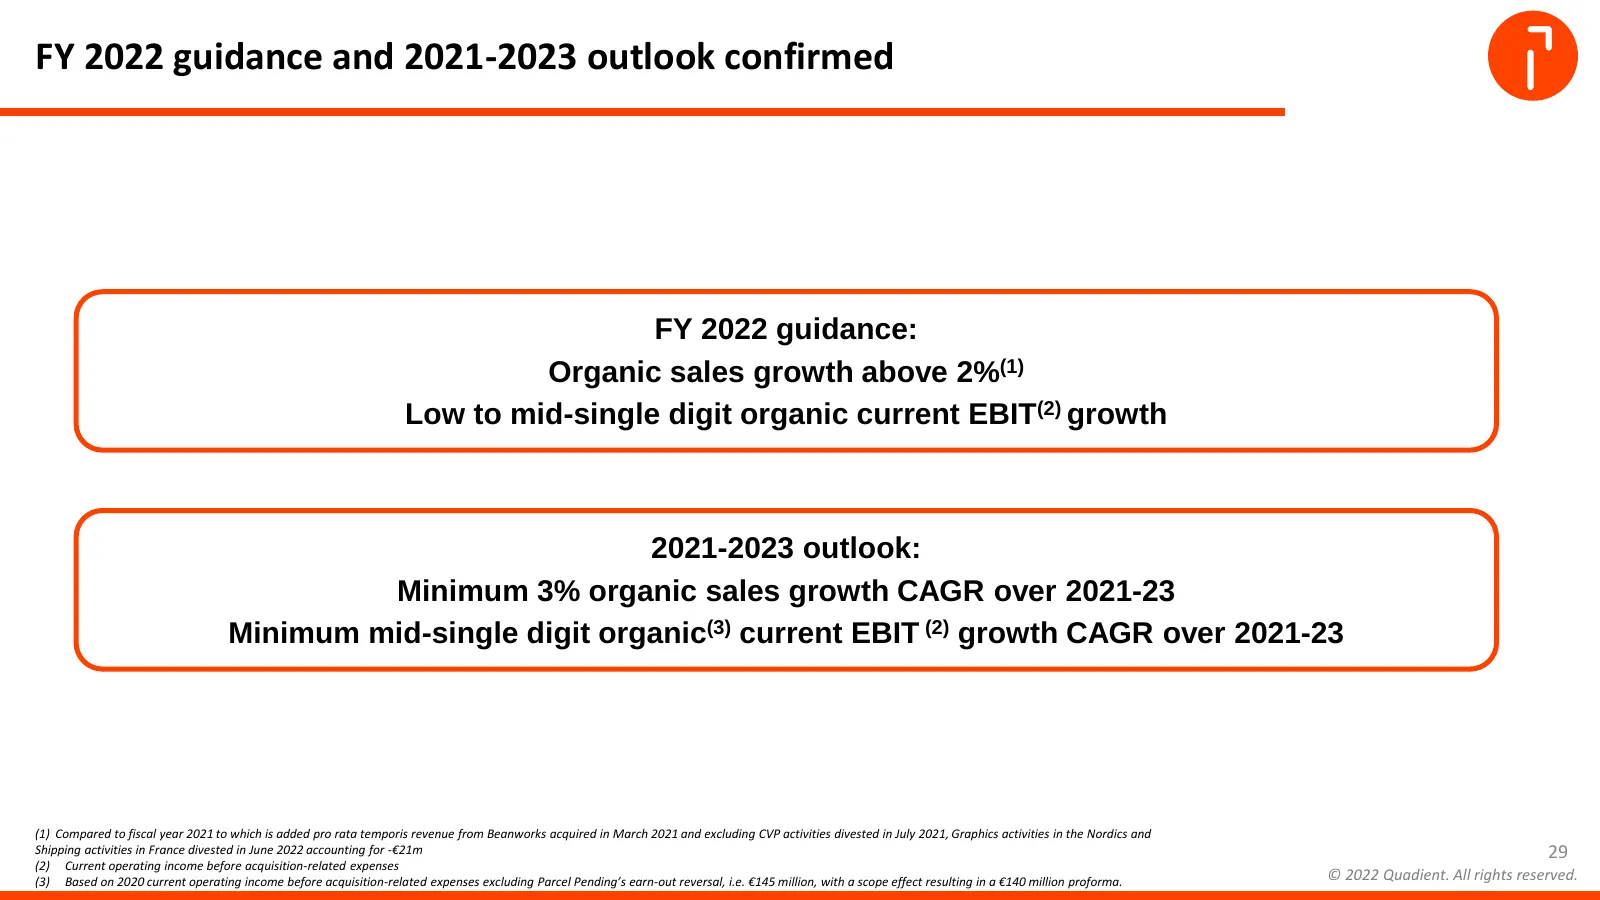
FY 2022 guidance and 2021-2023 outlook confirmed FY 2022 guidance: Organic sales growth above 2%(1) Low to mid-single digit organic current EBIT(2) growth 2021-2023 outlook: Minimum 3% organic sales growth CAGR over 2021-23 Minimum mid-single digit organic(3) current EBIT (2) growth CAGR over 2021-2
Slide 30: Q&A, Contacts, Next events
Q&A CONTACTS NEXT EVENTS financial-communication@quadient.com 5 December 2022: Third quarter 2022 Sales https://invest.quadient.com/
Slide 31: Appendices
31 APPENDICES © Quadient 31 © 2022 Quadient. All rights reserved.
Slide 32: Major Operations: Quarterly revenue evolution
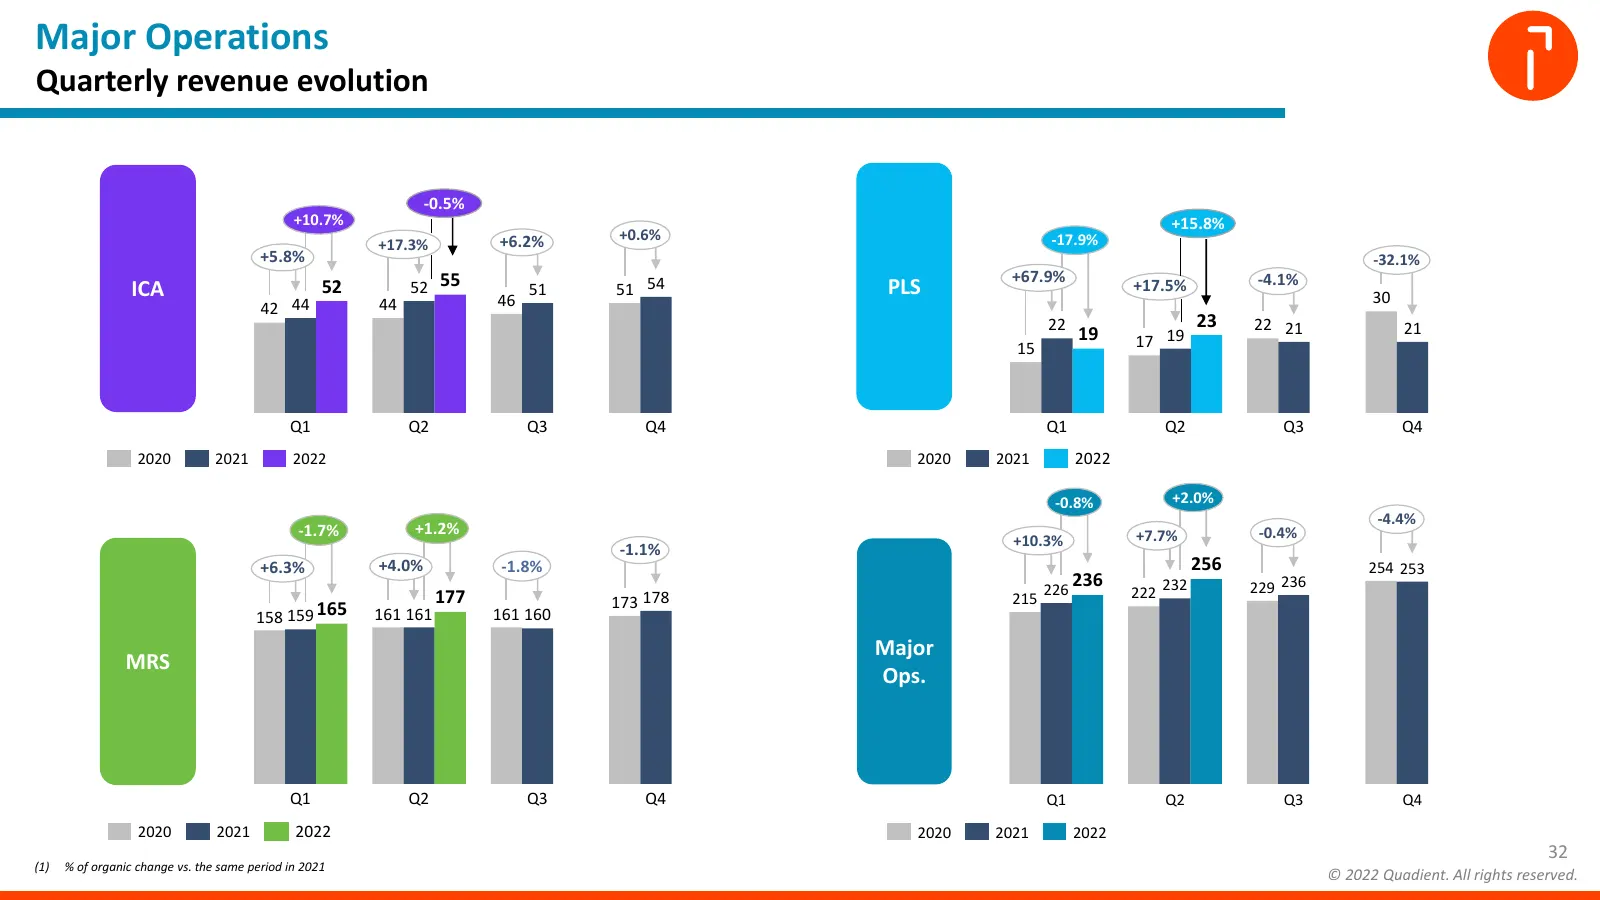
Major Operations Quarterly revenue evolution -0.5% +10.7% +15.8% +6.2% +0.6% -17.9% +17.3% +5.8% -32.1% +67.9% ICA 52 52 55 51 51 54 PLS +17.5% -4.1% 46 30 42 44 44 22 23 22 21 21 19 17 19 15 Q1 Q2 Q3 Q4 Q1 Q2 Q3 Q4 2020 2021 2022 2020 2021 2022 -0.8% +2.0% -4.4% -1.7% +1.2% +7.7% -0.4% +10.3% -1.1%
Slide 33: Q2 2022 revenue up 5.4% on a reported basis
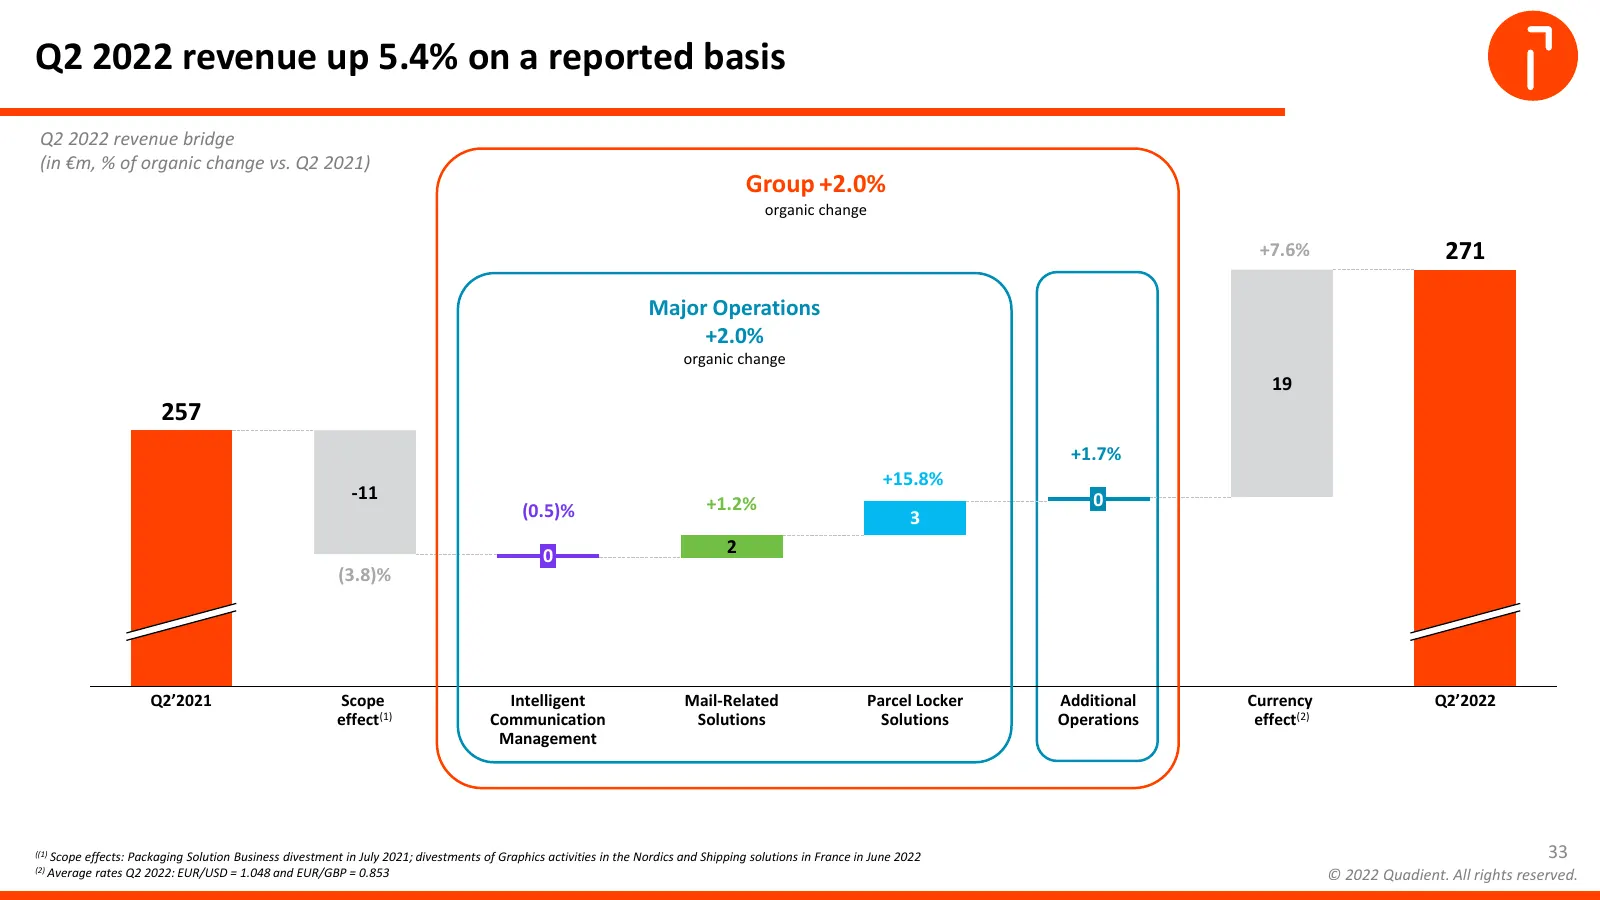
Q2 2022 revenue up 5.4% on a reported basis Q2 2022 revenue bridge (in €m, % of organic change vs. Q2 2021) Group +2.0% organic change +7.6% 271 Major Operations +2.0% organic change 19 257 +1.7% +15.8% -11 0 (0.5)% +1.2% 3 0 2 (3.8)% Q2’2021 Scope Intelligent Mail-Related Parcel Locker Additional C
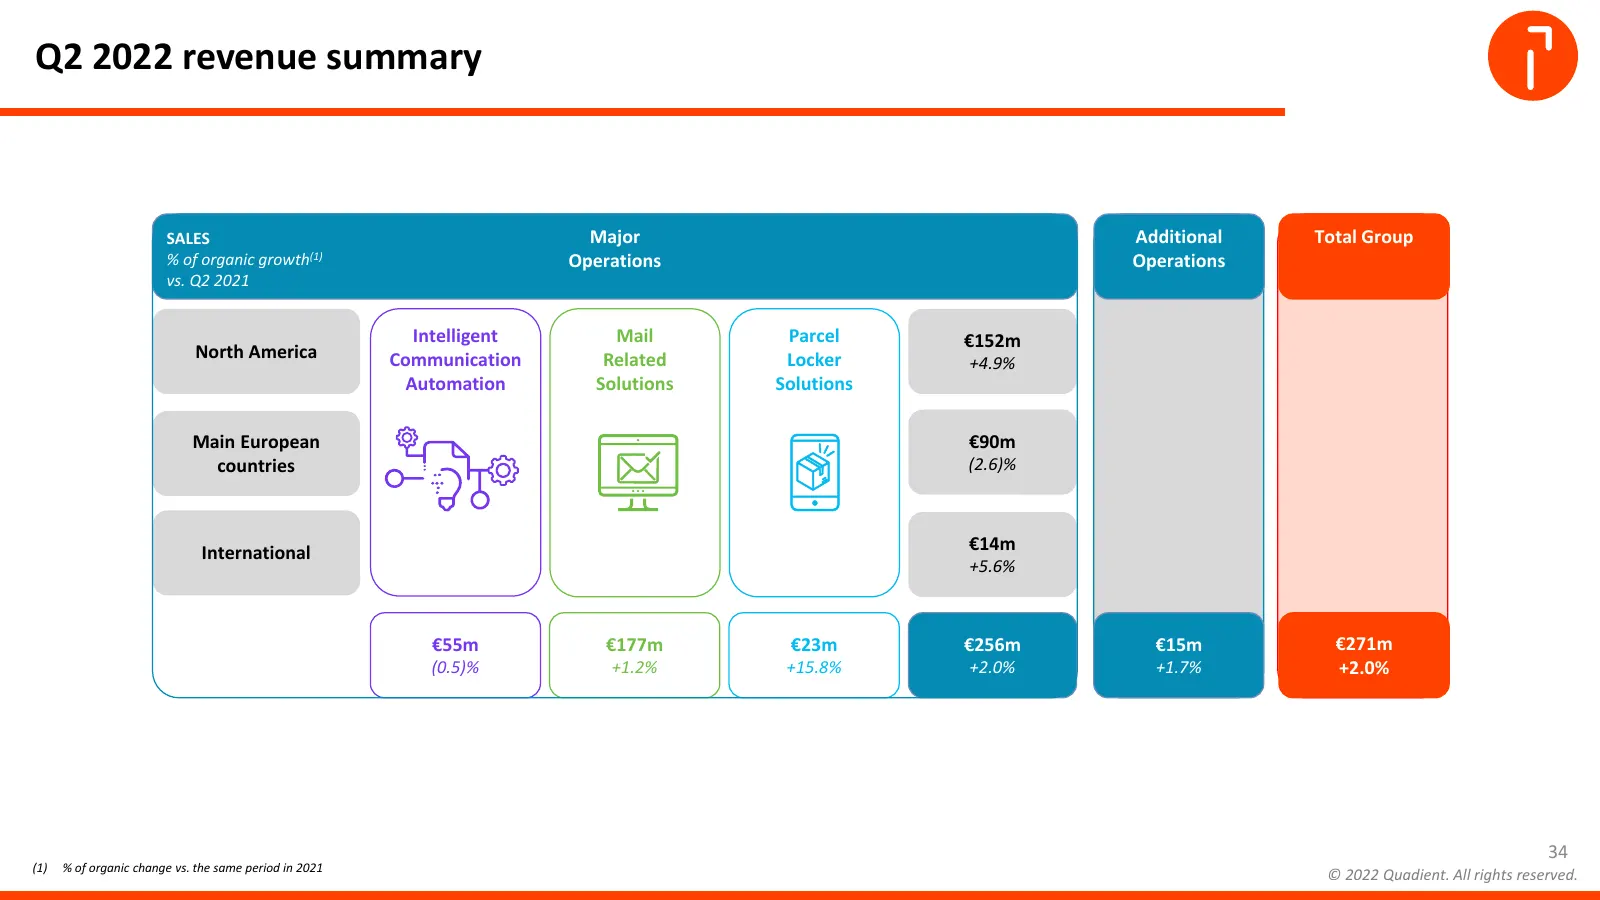
Slide 34: Q2 2022 revenue summary
Q2 2022 revenue summary SALES Major Additional Total Group % of organic growth(1) Operations Operations vs. Q2 2021 Intelligent Mail Parcel €152m North America Communication Related Locker +4.9% Automation Solutions Solutions Main European €90m countries (2.6)% International €14m +5.6% €55m €177m €2
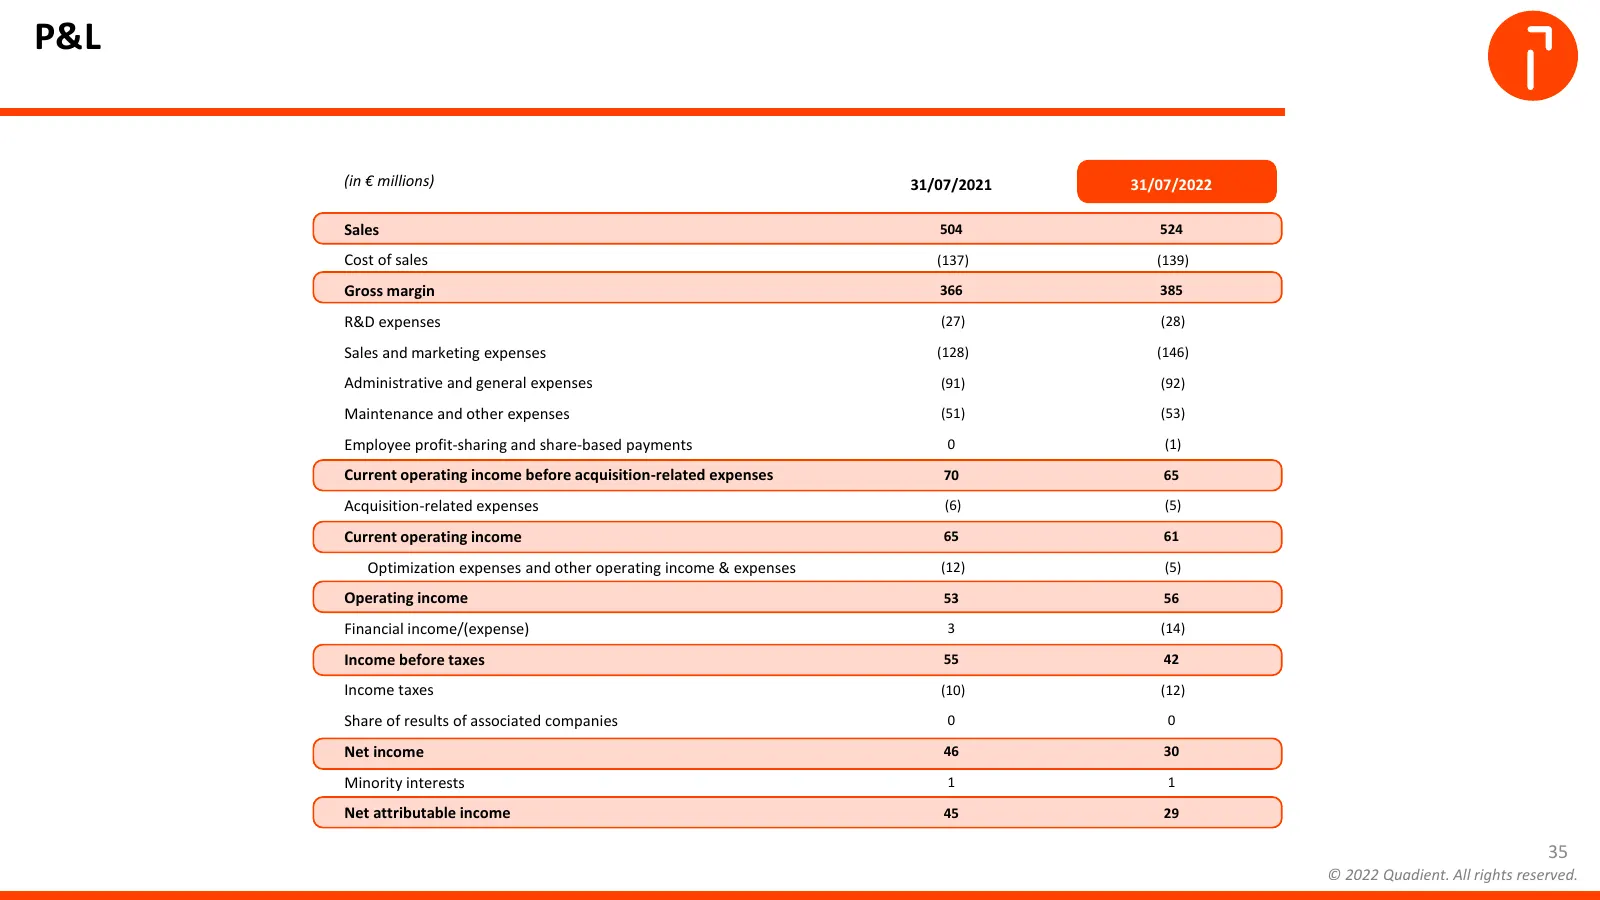
Slide 35: P&L
P&L (in € millions) 31/07/2021 31/07/2022 Sales 504 524 Cost of sales (137) (139) Gross margin 366 385 R&D expenses (27) (28) Sales and marketing expenses (128) (146) Administrative and general expenses (91) (92) Maintenance and other expenses (51) (53) Employee profit-sharing and share-based paymen
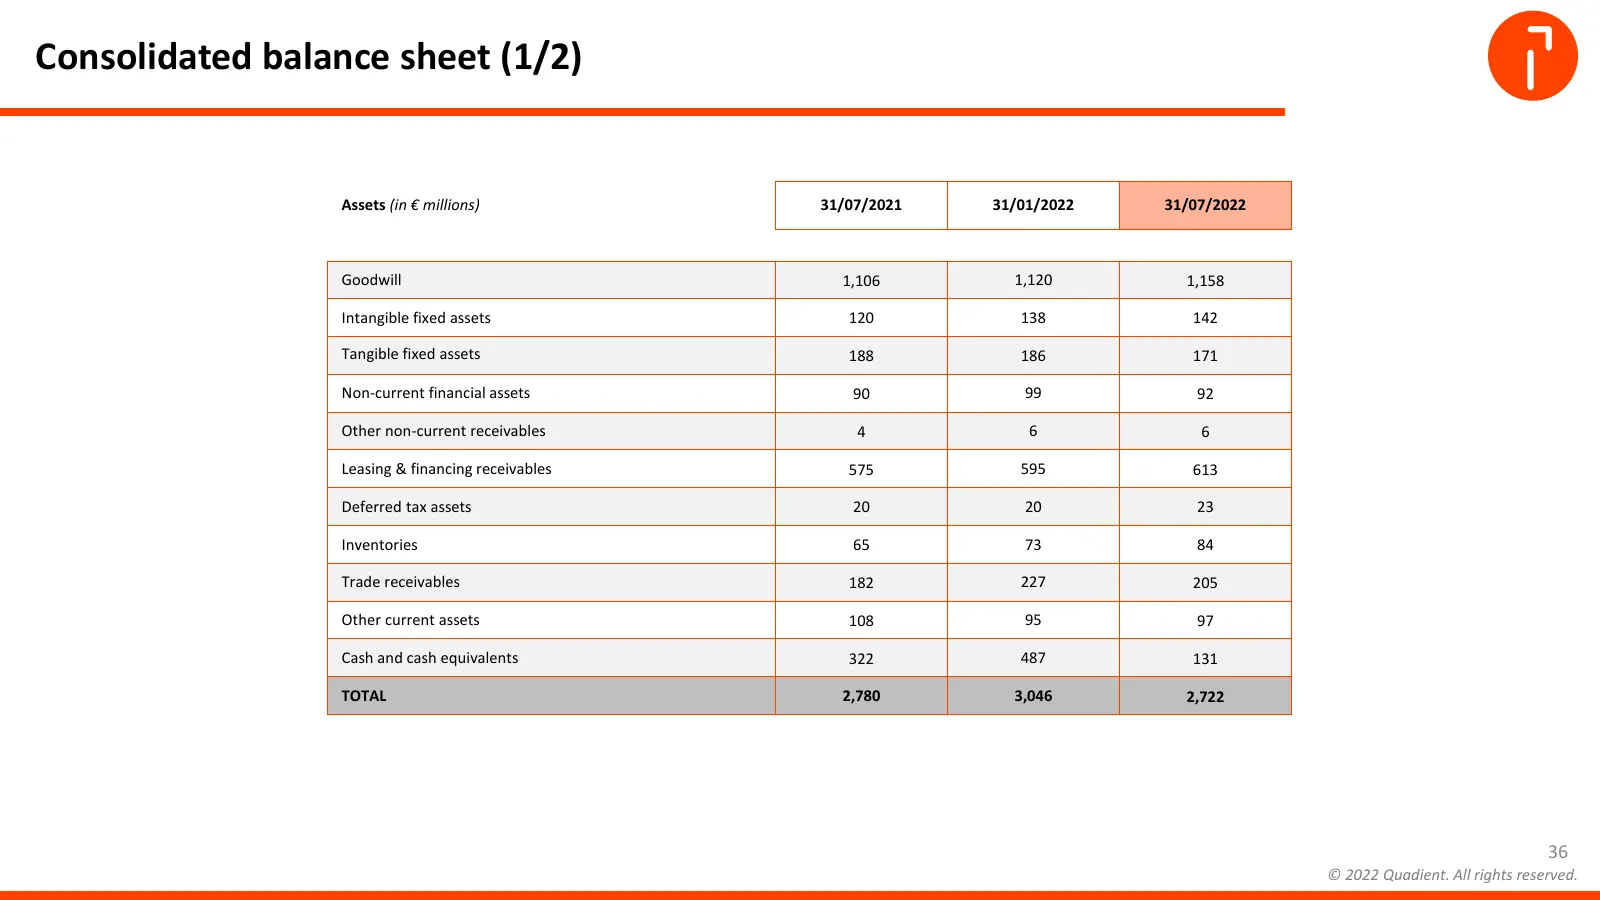
Slide 36: Consolidated balance sheet (1/2)
Consolidated balance sheet (1/2) Assets (in € millions) 31/07/2021 31/01/2022 31/07/2022 Goodwill 1,106 1,120 1,158 Intangible fixed assets 120 138 142 Tangible fixed assets 188 186 171 Non-current financial assets 90 99 92 Other non-current receivables 4 6 6 Leasing & financing receivables 575 595
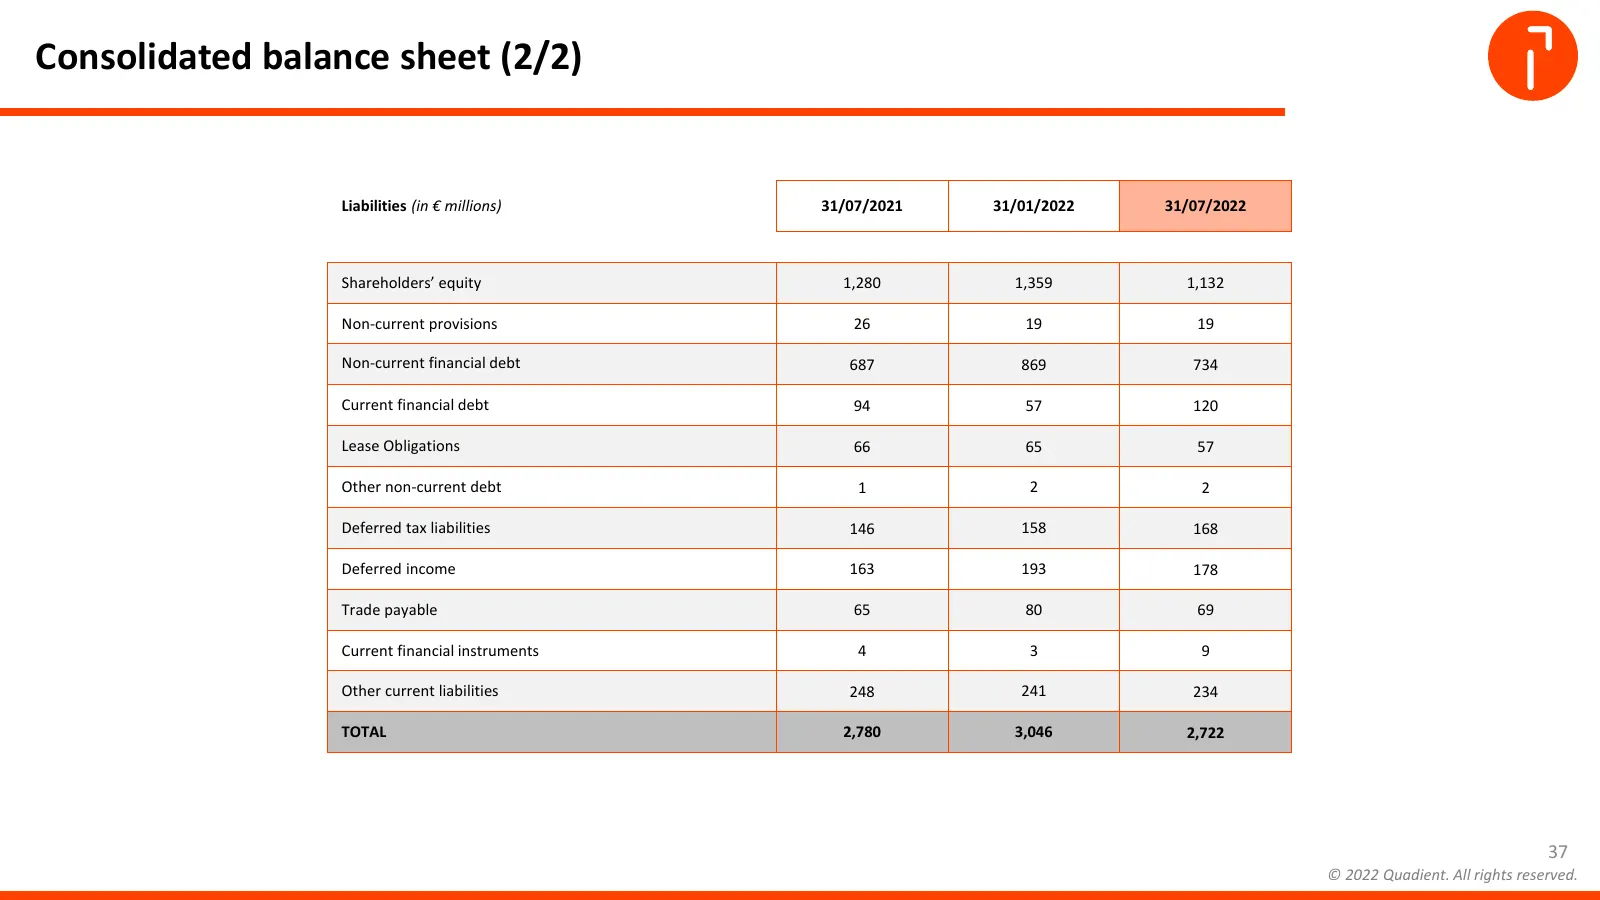
Slide 37: Consolidated balance sheet (2/2)
Consolidated balance sheet (2/2) Liabilities (in € millions) 31/07/2021 31/01/2022 31/07/2022 Shareholders’ equity 1,280 1,359 1,132 Non-current provisions 26 19 19 Non-current financial debt 687 869 734 Current financial debt 94 57 120 Lease Obligations 66 65 57 Other non-current debt 1 2 2 Deferre
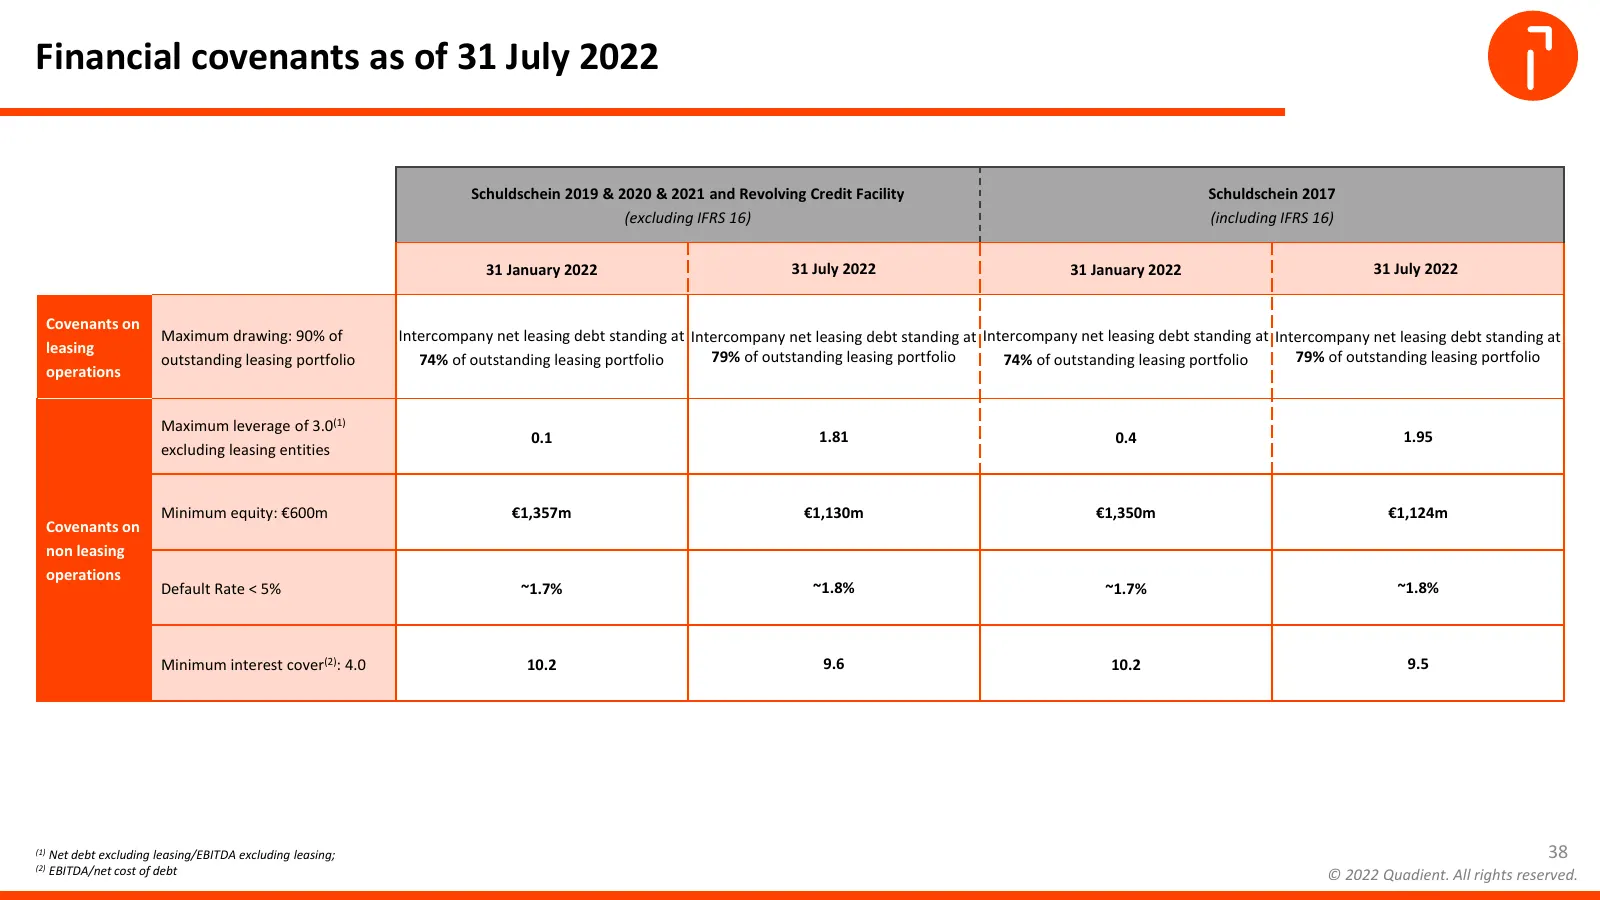
Slide 38: Financial covenants as of 31 July 2022
Financial covenants as of 31 July 2022 Schuldschein 2019 & 2020 & 2021 and Revolving Credit Facility Schuldschein 2017 (excluding IFRS 16) (including IFRS 16) 31 January 2022 31 July 2022 31 January 2022 31 July 2022 Covenants on Maximum drawing: 90% of Intercompany net leasing debt standing at Inte
Source: Internet Archive copy of resources.quadient.com
More decks from Quadient SA
 H1 2026 Earnings Presentation43 slides · Sep 23, 2026
 Shareholder Meeting (June 2026)41 slides · Jun 18, 2026
 FY2025 Earnings Presentation52 slides · Mar 25, 2026
 Q3 2025 Earnings Presentation31 slides · Dec 2, 2025
 H1 2025 Earnings Presentation40 slides · Sep 24, 2025
 Shareholder Meeting (June 2025)35 slides · Jun 13, 2025