American Railcar Industries Inc
American Railcar Industries — Investor Presentation (February 2014)
31 slides from American Railcar Industries's investor presentation, Feb 24, 2014
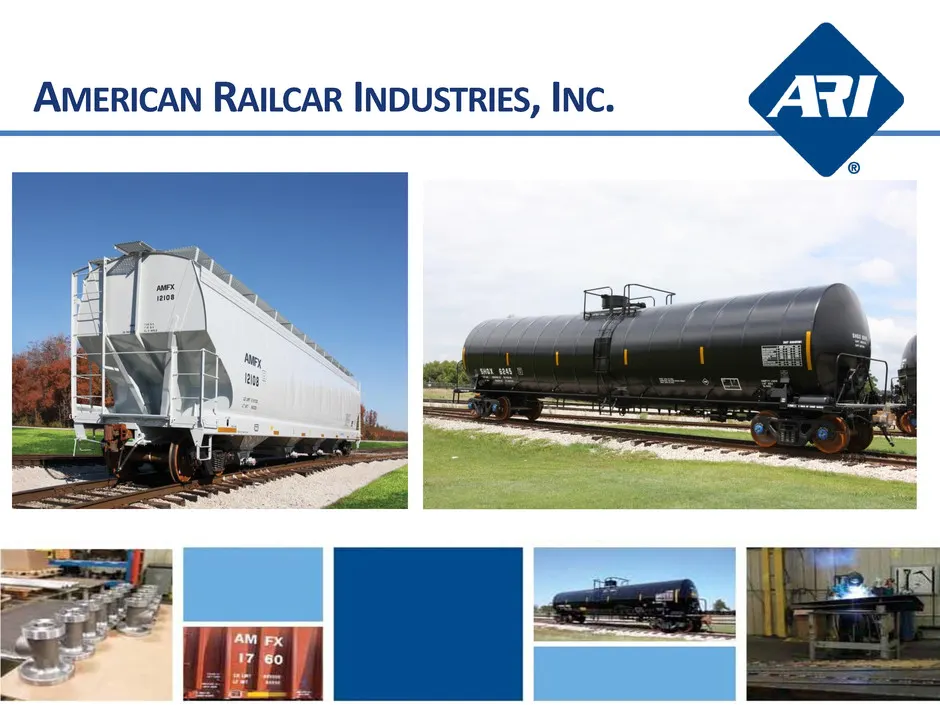
Slide 1: American Railcar Industries, Inc.
AMERICAN RAILCAR INDUSTRIES, INC.
Slide 2: Forward Looking Disclaimer
Forward Looking Disclaimer ‘Safe Harbor Statement bjecti ts and th th The payment of future dividends, if it licable | lcar leasing, and lear services, eah $6 health, safety, th may be to ‘Commission. information, future events or otherwise
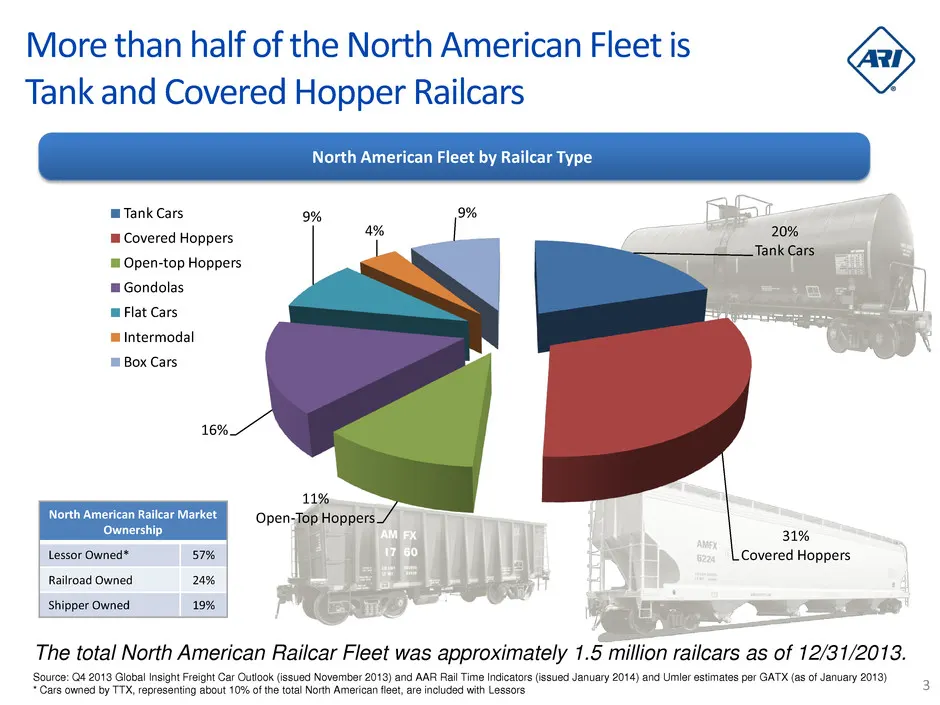
Slide 3: More than half of the North American Fleet is Tank and Covered Hopper Railcars
More than half of the North American Fleet is & Tank and Covered Hopper Railcars North American Fleet by Railcar Type Tank Cars m Covered Hoppers Open-top Hoppers = Intermodal = Box Cars Lessor Owned* ‘| j . Covered Hoppers Railroad Owned Shipper Owned Pe eal The tota ! North American Railcar Fleet
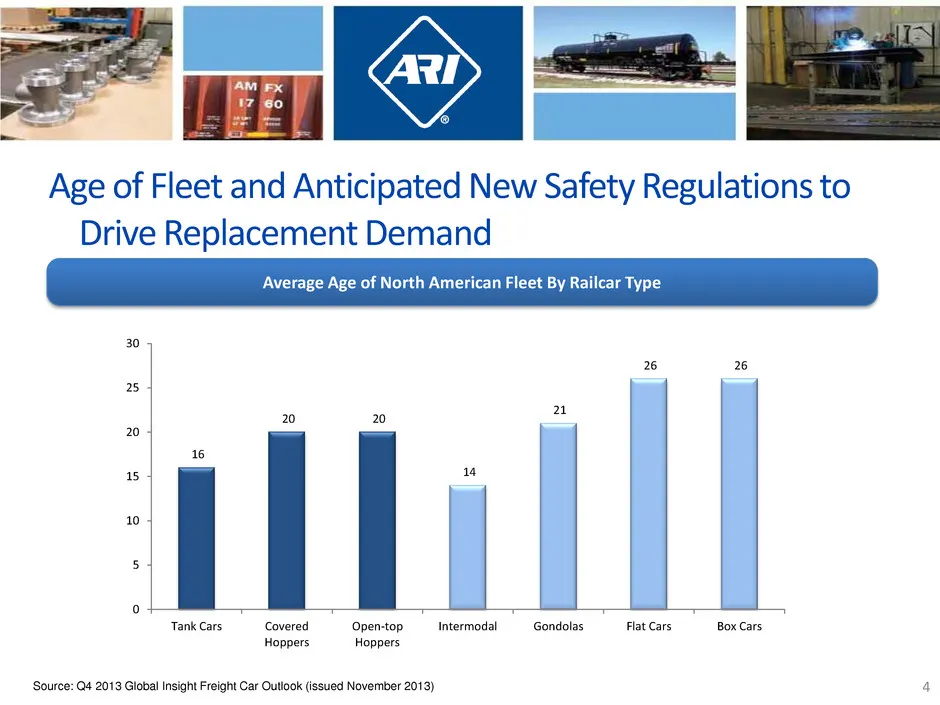
Slide 4: Age of Fleet and Anticipated New Safety Regulations to Drive Replacement Demand
— | Age of Fleet and Anticipated New Safety Regulations to Drive Replacement Demand Average Age of North American Fleet By Railcar Type 20 20 20 16 45 4 10 5 Tank Cars Covered Open-top Intermodal «Gondolas Flat Cars Box Cars Hoppers Hoppers
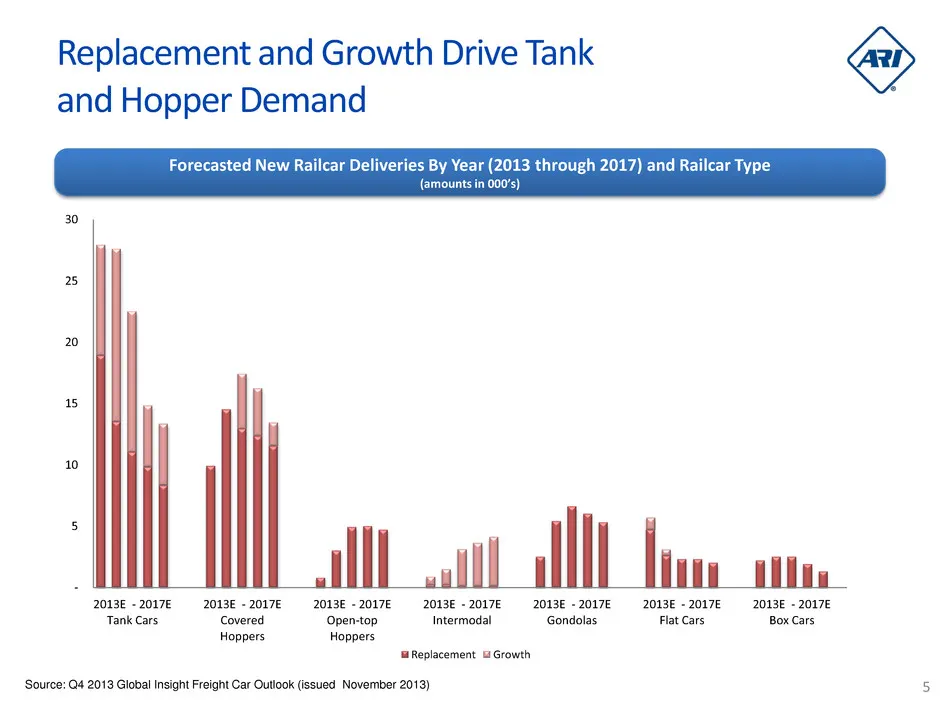
Slide 5: Replacement and Growth Drive Tank and Hopper Demand
Replacement and Growth Drive Tank and Hopper Demand Forecasted New Railcar Deliveries By Year (2013 through 2017) and Railcar Type (amounts in 000’s) 30 2O13E -2017E —-2013E -2017E—«-2013E - 2017E—«-2013E - 2017E «2013 - 2017E—«2013E - 2017E ——-2013E - 20176 Cars Covered Open-top Intermodal Gondolas
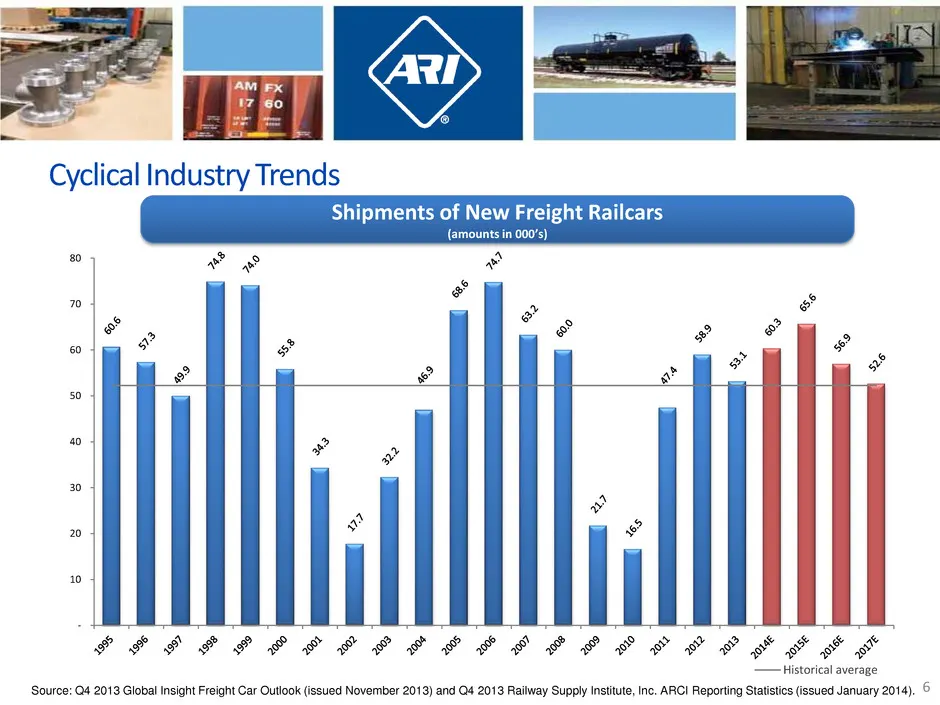
Slide 6: FES EE EEE ESE FES SIESEEPEP SE SF SS
FES EE EEE ESE FES SIESEEPEP SE SF SS — Historical average 14). ©
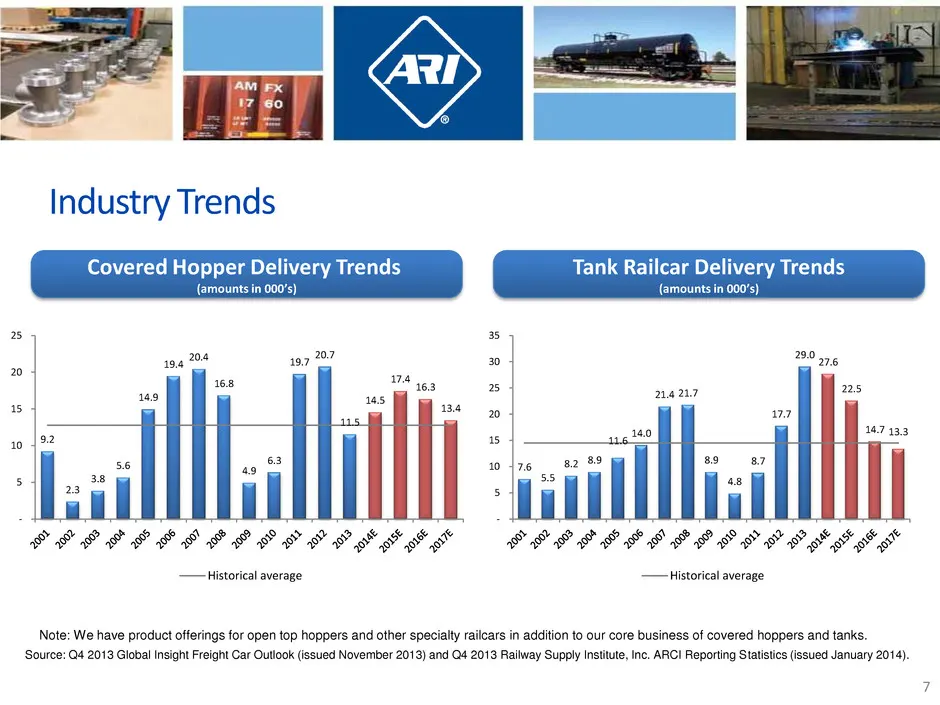
Slide 7: a us 2s 242.7 i
» 2» 19.4 te 19.7 207, 30 20 6 a 168 us 2s 242.7 i 5 ap Des m2 wo |e ii 140 | ee 63 wo fre 82 89 89 a7 ‘hal il STU ull | i | EF ESLEEEE LSE SIS Sh FI EIFIEEFS ILS SII MMS SK Se —Historical average —Historical average
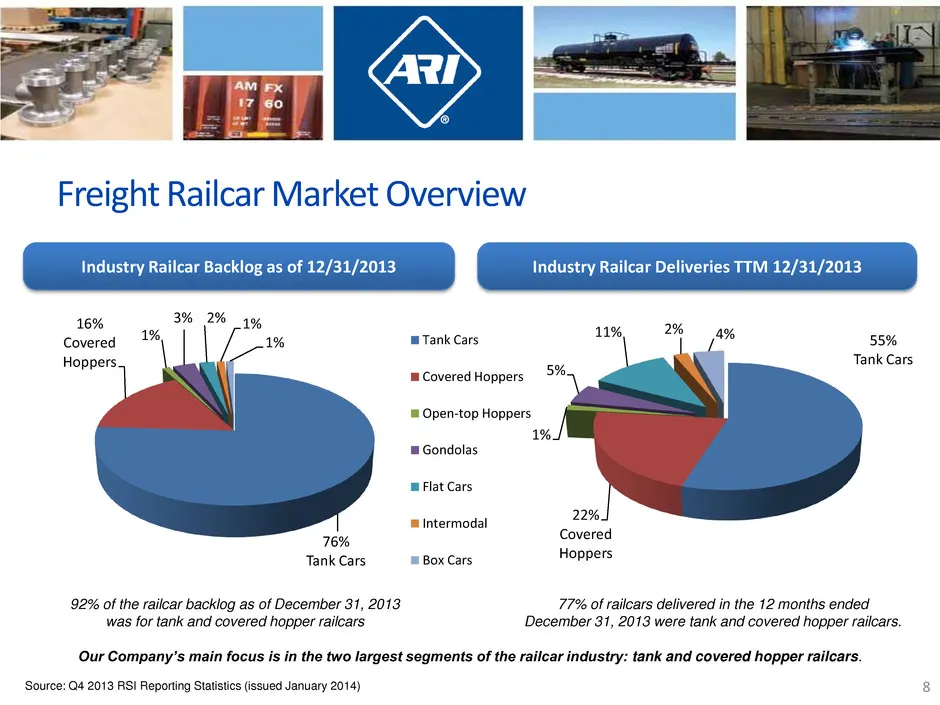
Slide 8: Tank and hopper share of backlog and deliveries
3% 2% 39 a m Tank Cars 55% Tank Cars m Covered Hoppers '™ Open-top Hoppers = Gondolas mFlat Cars = Intermodal 22h Covered Tank Cars Box Cars Hoppers 92% of the railcar backlog as of December 31, 2013 77% of railcars delivered in the 12 months ended was for tank and covered hopper railcars December 3
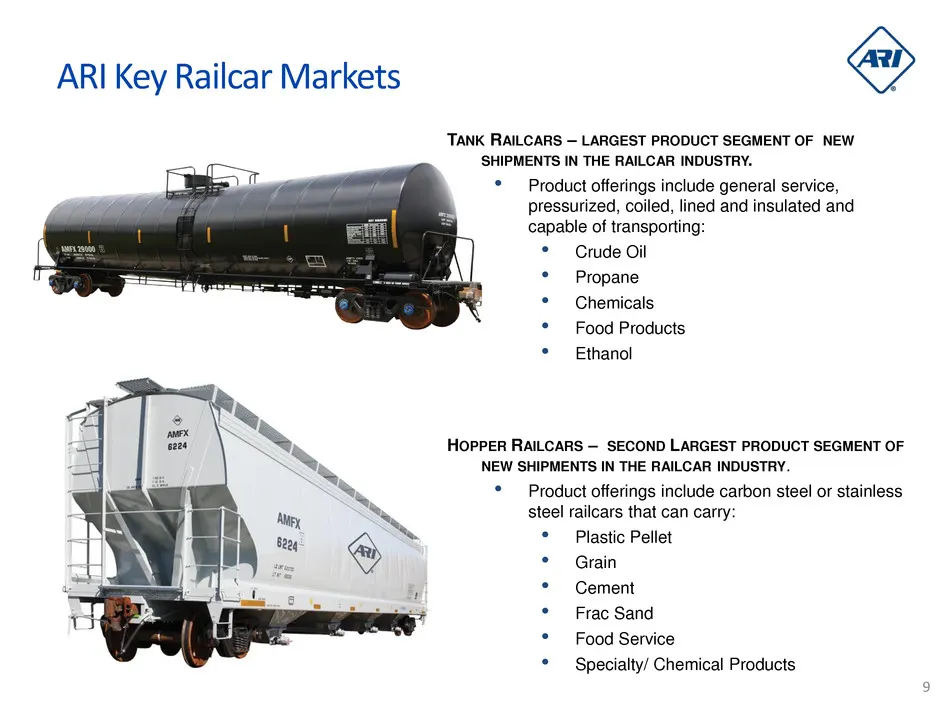
Slide 9: ARI Key Railcar Markets
ARI Key Railcar Markets TANK RAILCARS — LARGEST PRODUCT SEGMENT OF NEW SHIPMENTS IN THE RAILCAR INDUSTRY. Product offerings include general service, phere coiled, im tnd insulated and capable of transporti * Crude Oil * Propane * Chemicals * — Food Products * — Ethanol HOPPER RAILCARS — SECOND LARGE
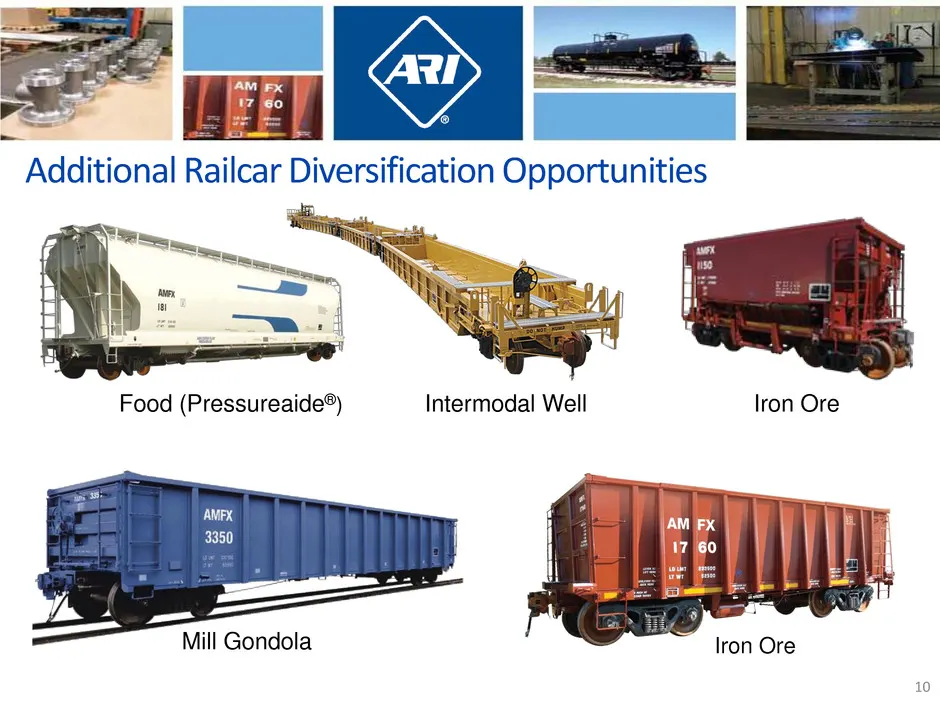
Slide 10: Additional Railcar Diversification Opportunities
Additional EEET| Railcar Diversification Opportunities Food (Pressureaide®) Intermodal Well Iron Ore
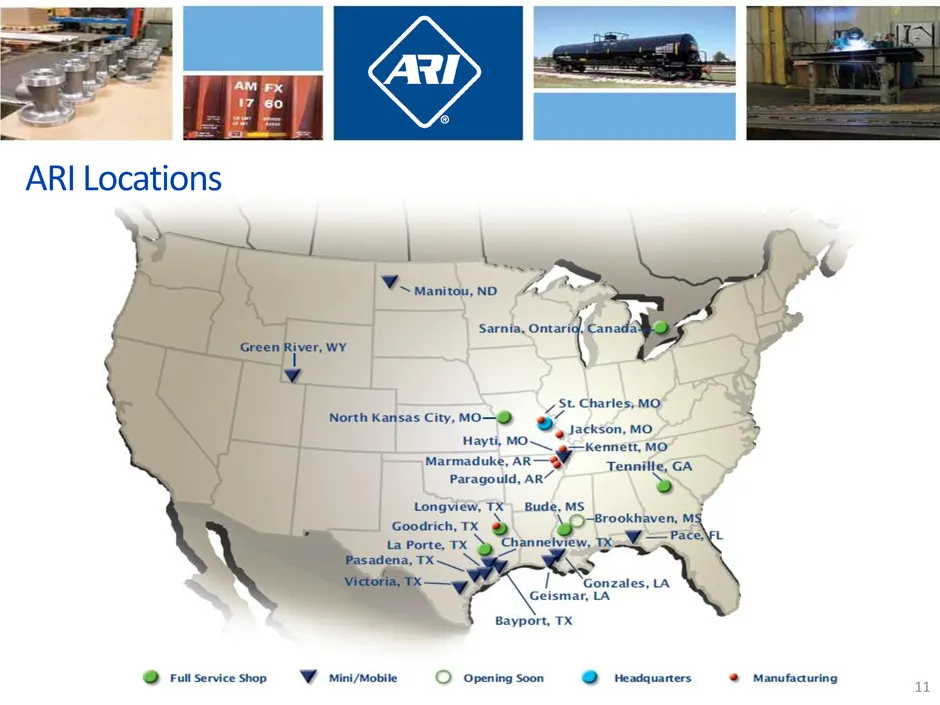
Slide 11: ARI Locations
ARI Locations y — — a rf h he Sarnia, Ontarid/€an Grean River, wy North Kansas City, MO=@ Hayti, MOW_ Marmaduke, AR—@ Paragould, AR” Longview, TX) Bude MS ; Goodrich, & je | La Porte, TX \p Channelview, raw Pacer : 2 oS 1a, TX _ SS —we | ~”“Gonzates, ta ¢ Geismar, LA Bayport, TX @ Fullservice shop =
Slide 12: Flexible Manufacturing
AM Fx 7 Go exible Manufactu Strategic locations Near customers and major rail lines Flexible and vertically integrated facilities * Produce multiple railcar types with minimal change-over time * Painting/lining capabilities * Rolling mill and fabrication plant + Non-union workforce at railcar manufa
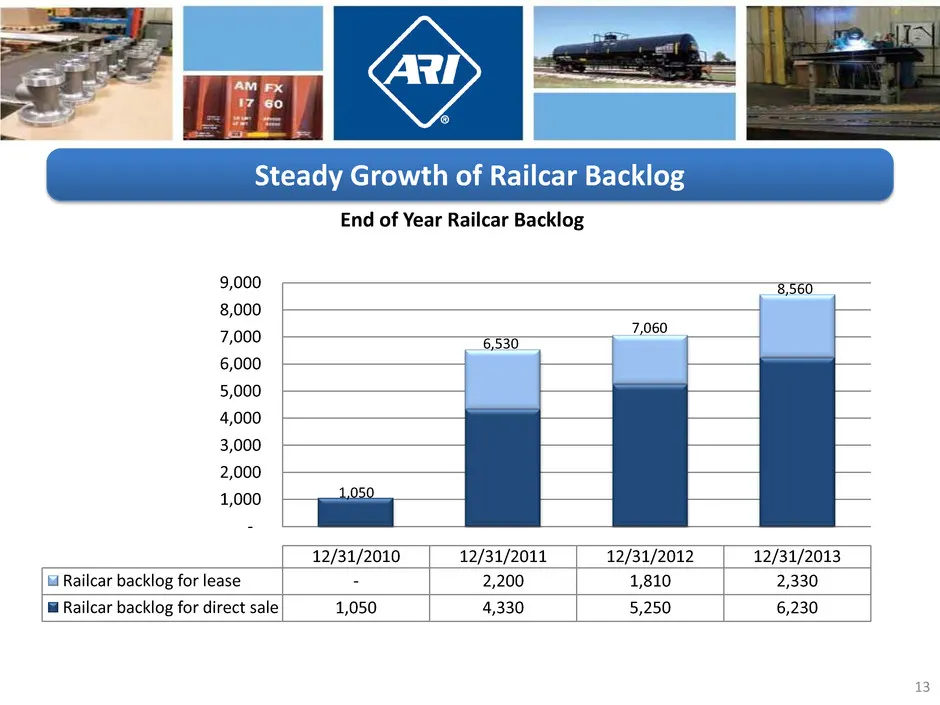
Slide 13: End of Year Railcar Backlog
9,000 8,000 7,000 6,000 5,000 4,000 3,000 2,000 1,000 End of Year Railcar Backlog 8,560 {El Railcar backlog for lease [ [2200 | 12/31/2010 | 12/31/2011__—*|~—:12/31/2012_—| ‘12/31/2013 1gi0 | | Railcar backlog for direct sale| 1,050 [ 4,330 [ 5,250 | 6,230 |
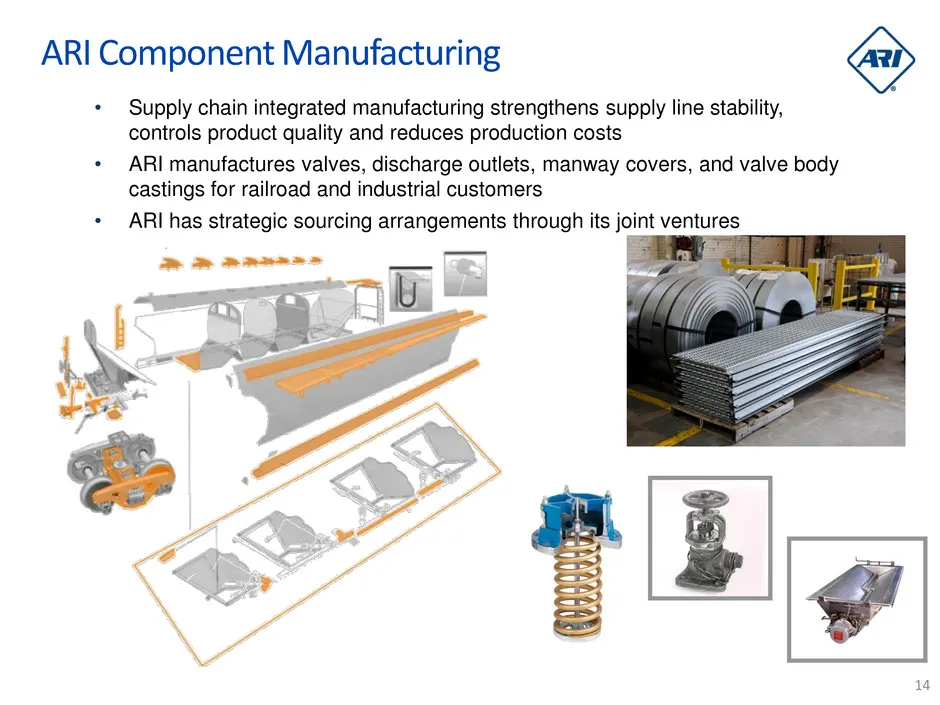
Slide 14: ARI Component Manufacturing
ARI Component Manufacturing Supply chain integrated manufacturing strengthens supply line stability, controls product quality and reduces production costs ARI manufactures valves, discharge outlets, manway covers, and valve body castings for railroad and industrial customers ARI has strategic sourci
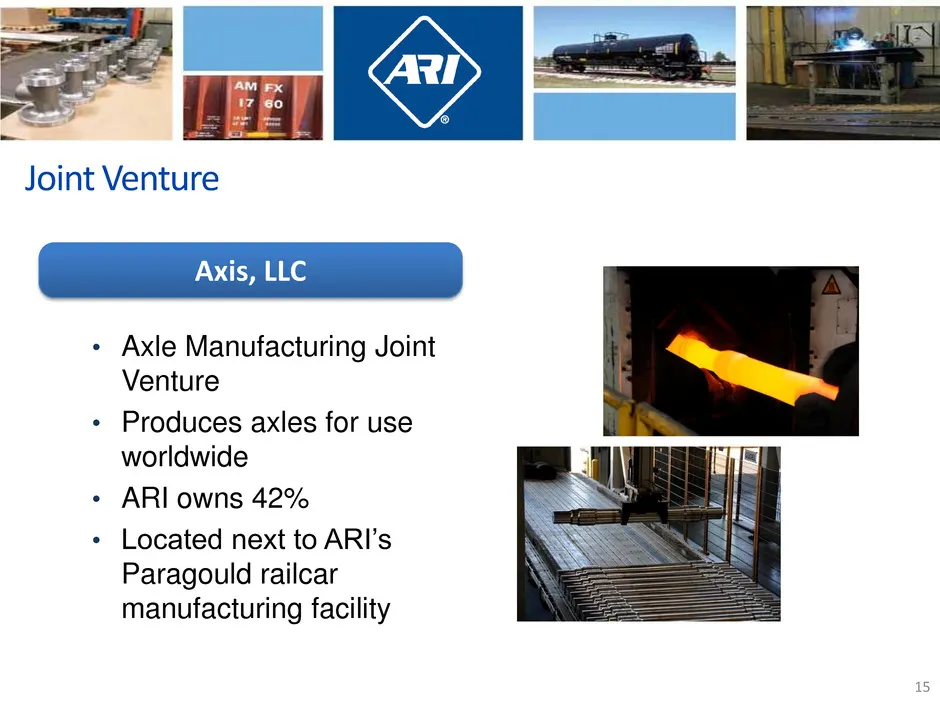
Slide 15: Axle Manufacturing Joint Venture
Axle Manufacturing Joint Venture Produces axles for use worldwide ARI owns 42% Located next to ARI’s Paragould railcar manufacturing facility
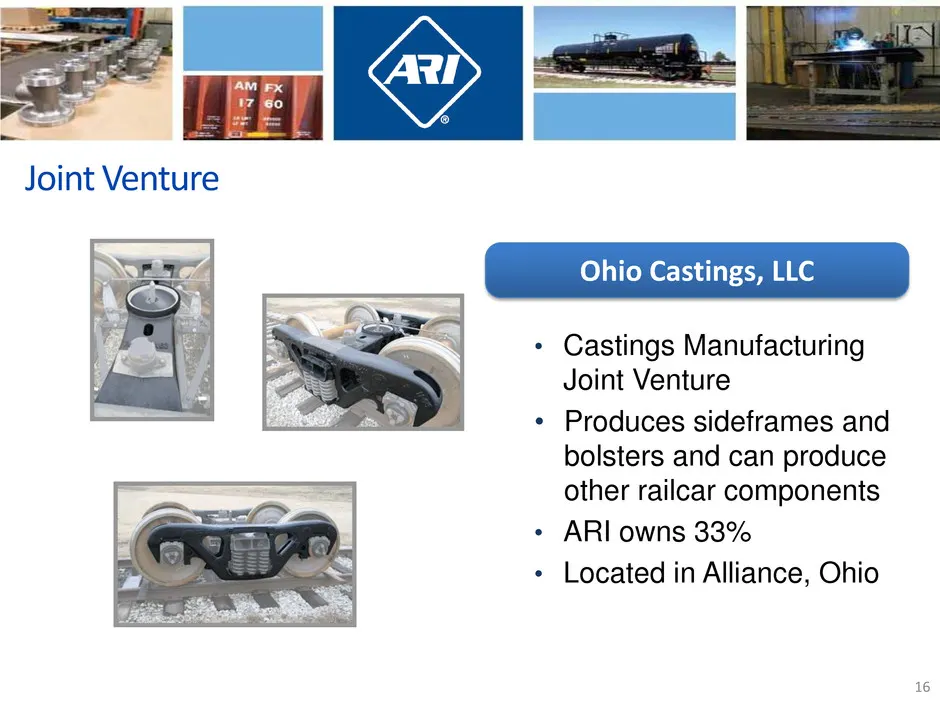
Slide 16: Castings Manufacturing Joint Venture
° Castings Manufacturing Joint Venture Produces sideframes and bolsters and can produce other railcar components ARI owns 33% Located in Alliance, Ohio
Slide 17: Railcar Leasing
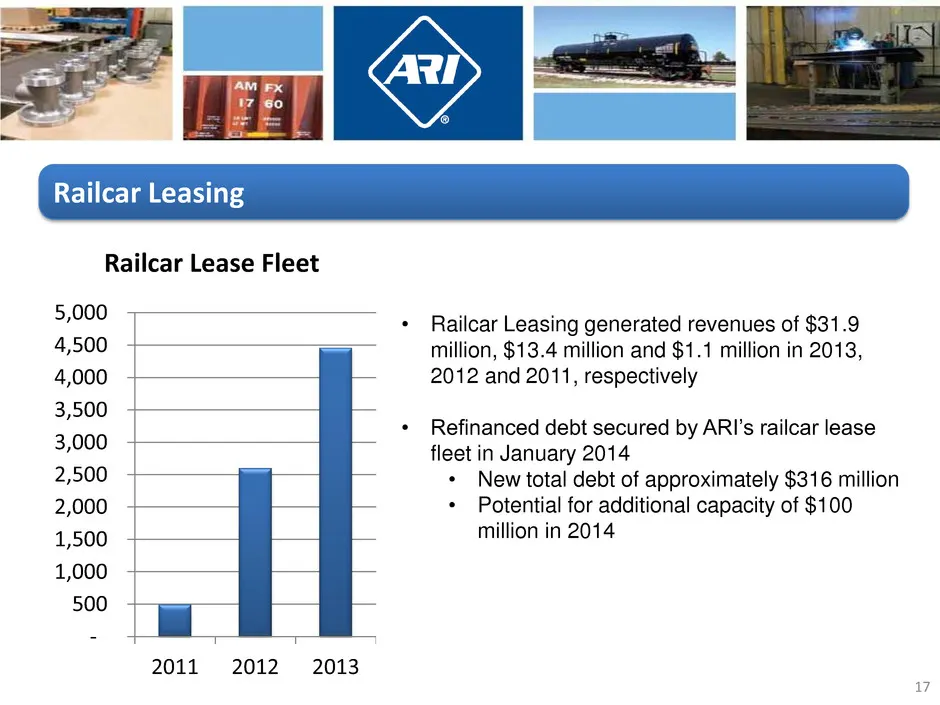
Railcar Leasing Railcar Lease Fleet 5,000 + Railcar Leasing generated revenues of $31.9 4,500 ~————~a— million, $13.4 million and $1.1 million in 2013, 4,000 + 2012 and 2011, respectively 3,500 - 3000 - + Refinanced debt secured by ARI’s railcar lease a fleet in January 2014 2,500 + New total debt o
Slide 18: Railcar Services Diversify Revenue
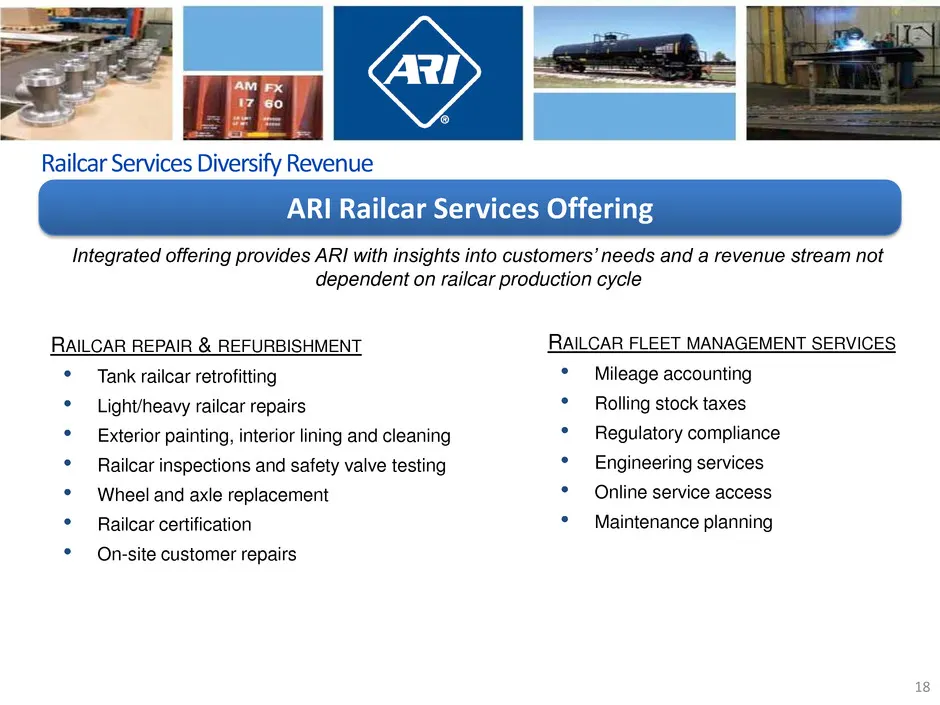
AM Fx 6 Railcar Services Diversify Revenue ARI Railcar Ser Integrated offering provides ARI with insights into customers’ needs and a revenue stream not dependent on railcar production cycle RAILCAR REPAIR & REFURBISHMENT ° . Tank railcar retrofitting Light/heavy railcar repairs Exterior painting, i
Slide 19: Railcar Services Rapid Revenue Growth
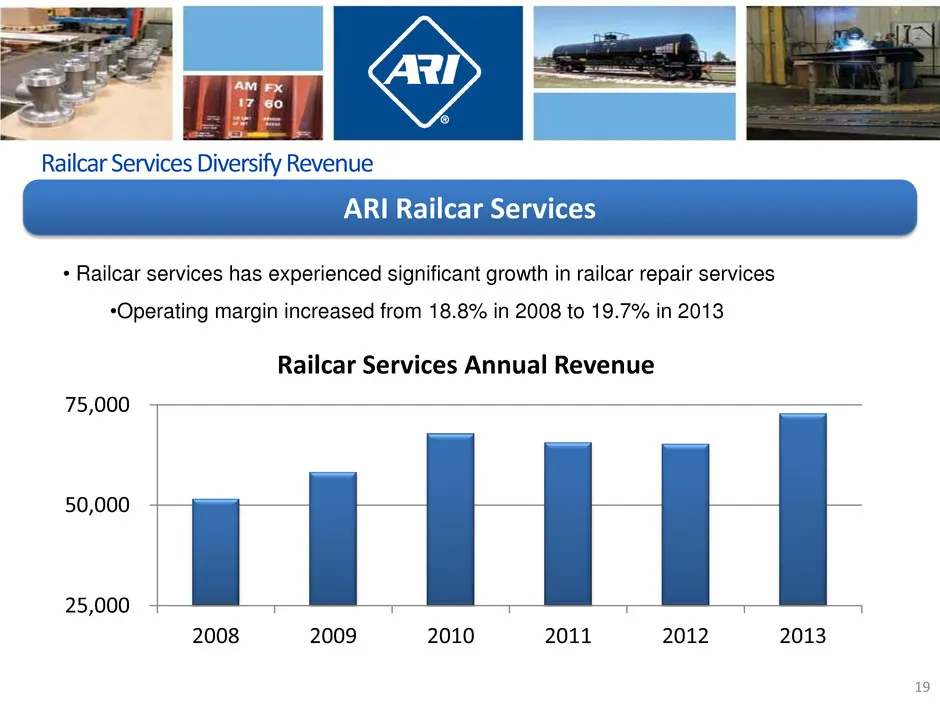
_Railcar Services Ia id Revenue + Railcar services has experienced significant growth in railcar repair services *Operating margin increased from 18.8% in 2008 to 19.7% in 2013 Railcar Services Annual Revenue 75,000 50,000 25,000 2008 2009 2010 2011 2012 2013
Slide 20: North American Tank Railcar Classification
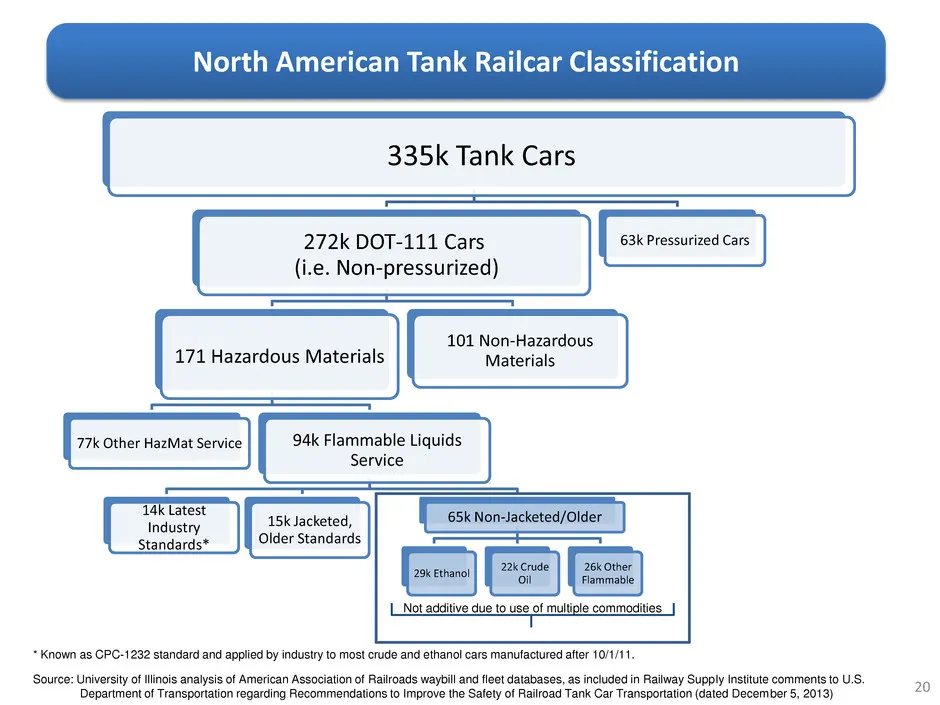
North American Tank Railcar Classification | 335k Tank Cars | 272k DOT-111 Cars { 63k Pressurized Cars (i.e. Non-pressurized) . 101 Non-Hazardous 171 Hazardous Materials Materials 77k Other HazMat Service 94k Flammable Liquids Service inal 15k Jacketed, ‘65k Non-Jacketed/Older Standards* Older Stand
Slide 21: Possible Upgrades for Older DOT-111 Tank Railcars
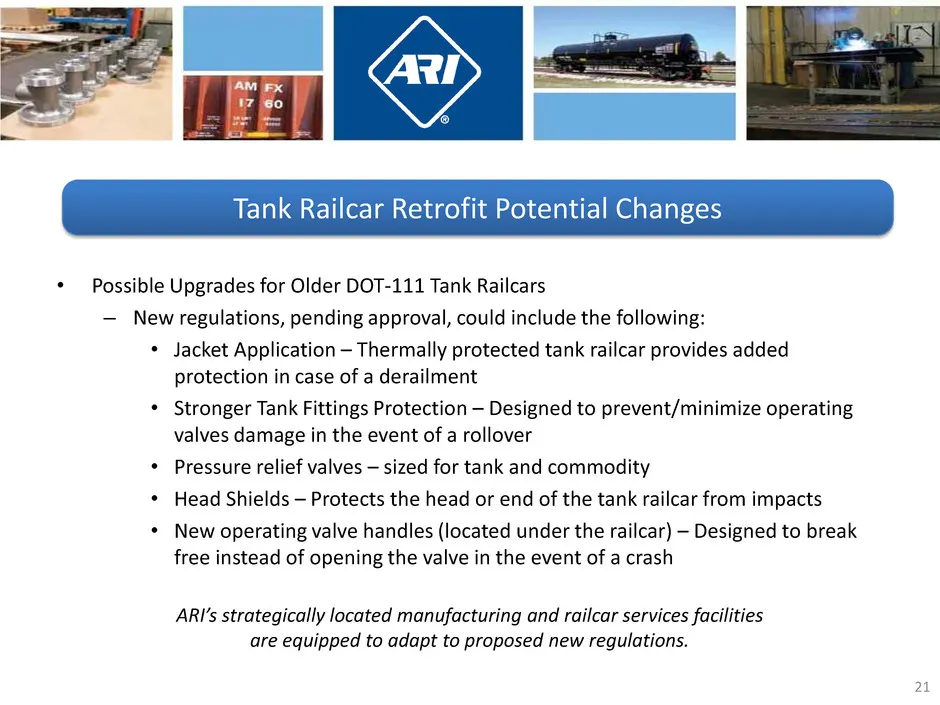
* Possible Upgrades for Older DOT-111 Tank Railcars — New regulations, pending approval, could include the following: Jacket Application - Thermally protected tank railcar provides added protection in case of a derailment Stronger Tank Fittings Protection — Designed to prevent/minimize operating val
Slide 22: Growth History
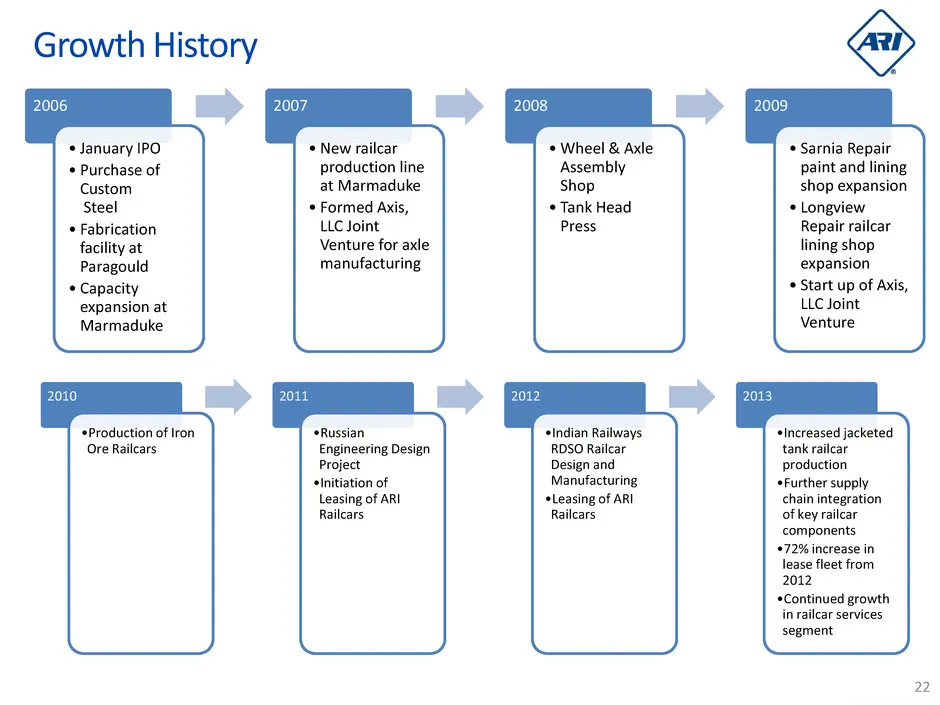
Growth History * January IPO = New railcar + Wheel & Axle * Sarnia Repair * Purchase of production ine Assembly paint and lining Custom at Mari shop sto ope expan ion +Formed cna + Tank Head * Fabrication Press LUC Joi “epaaar Venture for axle lining shop manufacturing Marmaduke ‘*Production of Iron
Slide 23: Major Historical Projects and Future Growth
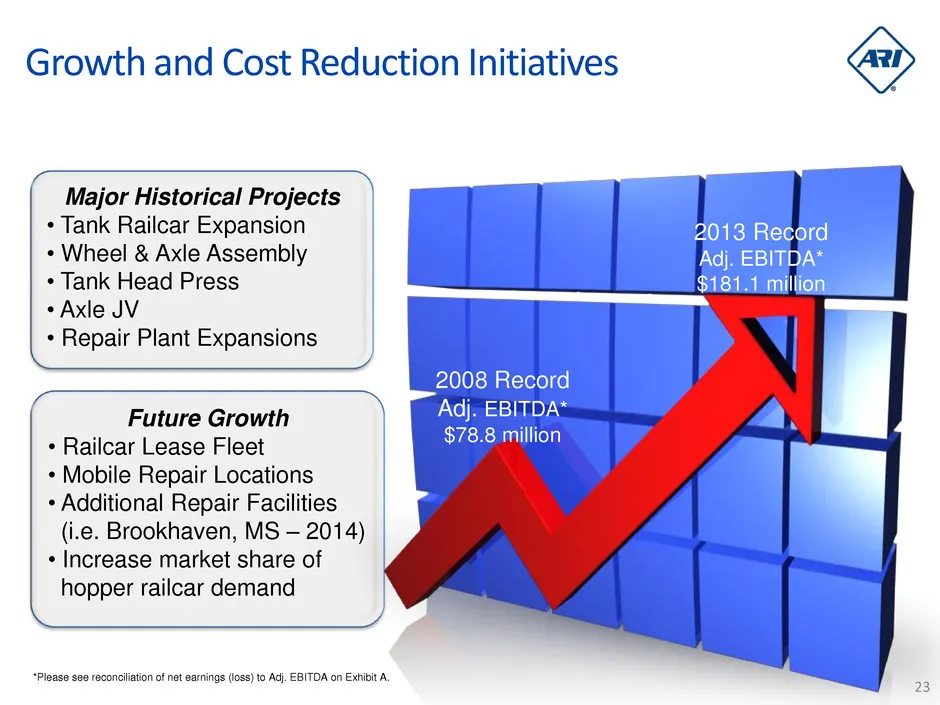
Major Historical Projects + Tank Railcar Expansion + Wheel & Axle Assembly + Tank Head Press + Axle JV \° Repair Plant Expansions = Future Growth + Railcar Lease Fleet + Mobile Repair Locations + Additional Repair Facilities (i.e. Brookhaven, MS — 2014) + Increase market share of hopper railcar dema
Slide 24: Objectives and Long-Term Strategies
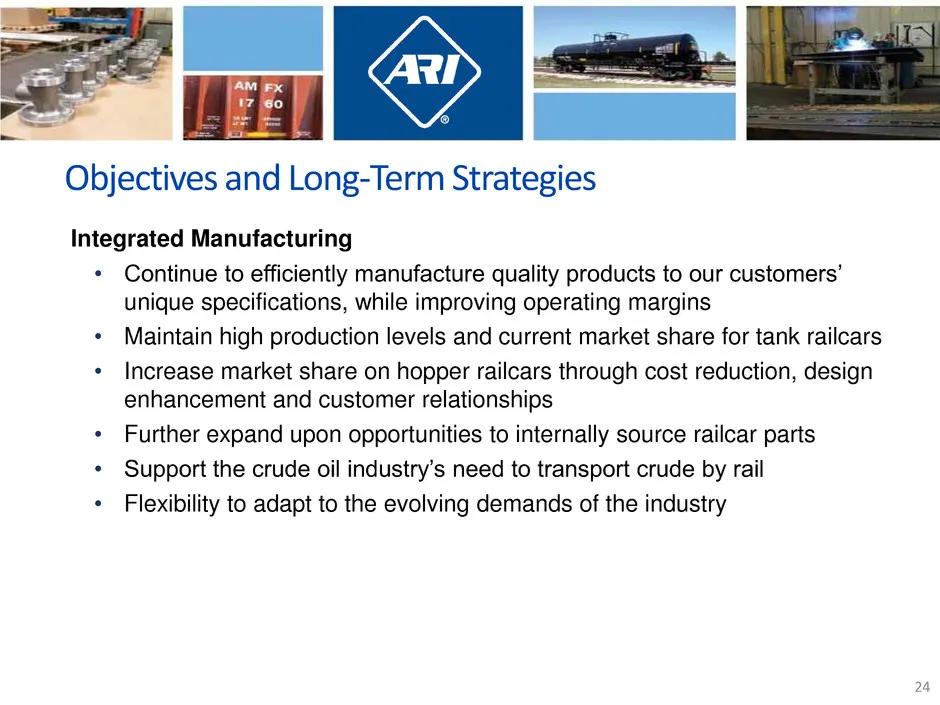
Objectives and Long-Term Strategies Integrated Manufacturing Continue to efficiently manufacture quality products to our customers’ unique specifications, while improving operating margins Maintain high production levels and current market share for tank railcars Increase market share on hopper rail
Slide 25: Objectives and Long-Term Strategies (continued)
Objectives and Long-Term Strategies (continued) Leasing * Add railcars to our domestic fleet targeting a balanced mix of railcar types + Backlog (as of December 31, 2013) includes 2,330 railcars to add to our lease fleet in 2014, growing our lease fleet to over 6,700 + Arranged financing in an effor
Slide 26: Strong Financial Profile
AM Fx 60 Strong Financial Profile Positive financial returns resulting from ARI’s participation in the strongest railcar markets: tank and hopper railcars Favorable growth/trends in both revenue and earnings Increasing railcar backlog, including railcars for lease Significant positive cash flow and
Slide 27: Our Financial History
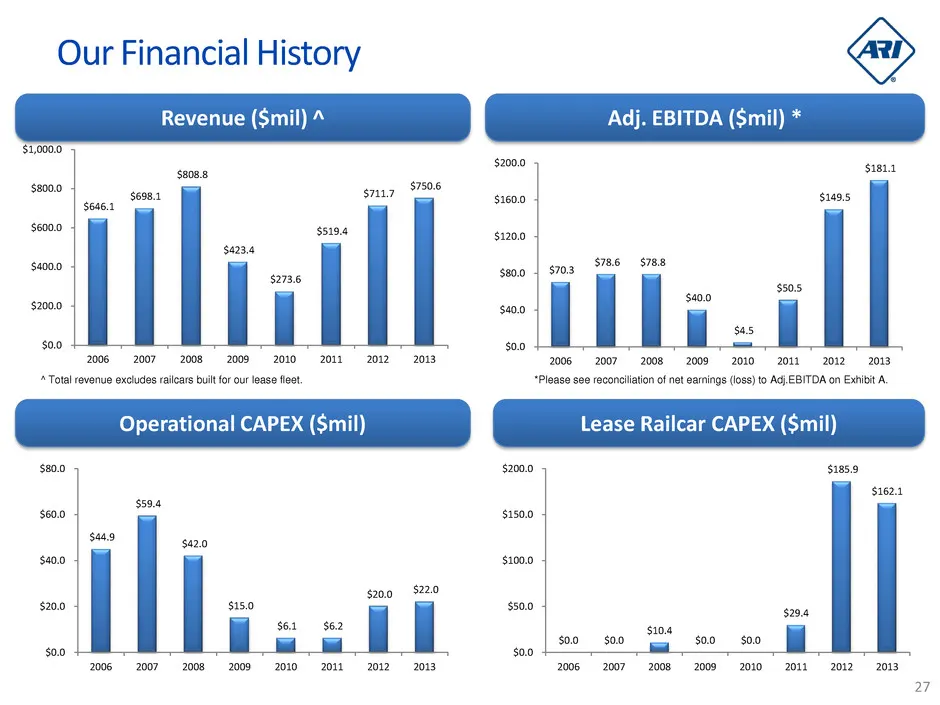
Our Financial History Revenue ($mil) * 2007 2008» 200920102011. 2012= 2013, "Total revenue excludes railcars built for our lease fleet. Operational CAPEX (Smil) Lease Railcar CAPEX (Smil) Adj. EBITDA ($mil) * $2000 sista $160.0 $149.5 2008 2007 200820092010 2011, 2000 $185.9 $1622 2006 20072008, 200
Slide 28: Quarterly Financial Comparison
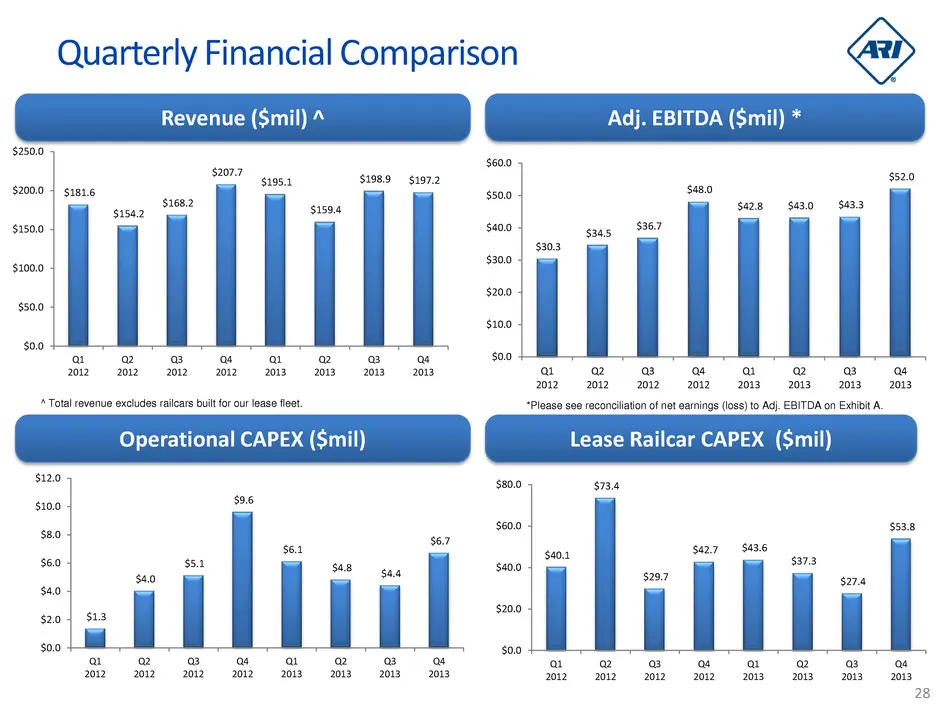
Quarterly Financial Comparison Revenue ($mil) * Adj. EBITDA (Smil) * $2500 , se00 $2077 505.4 $1989 $197.2 $52.0 $2000 | sisi ssoo | ssag 51682 ‘Sone $42.8 $43.0 sisoo | se00 gag (ie s303 300 $100.0 } % x00 | $500 sioo | soo oe soo | : . a2 wom wis 2a aa pa ofa fal ome je Gadi Ges ies Total revenue
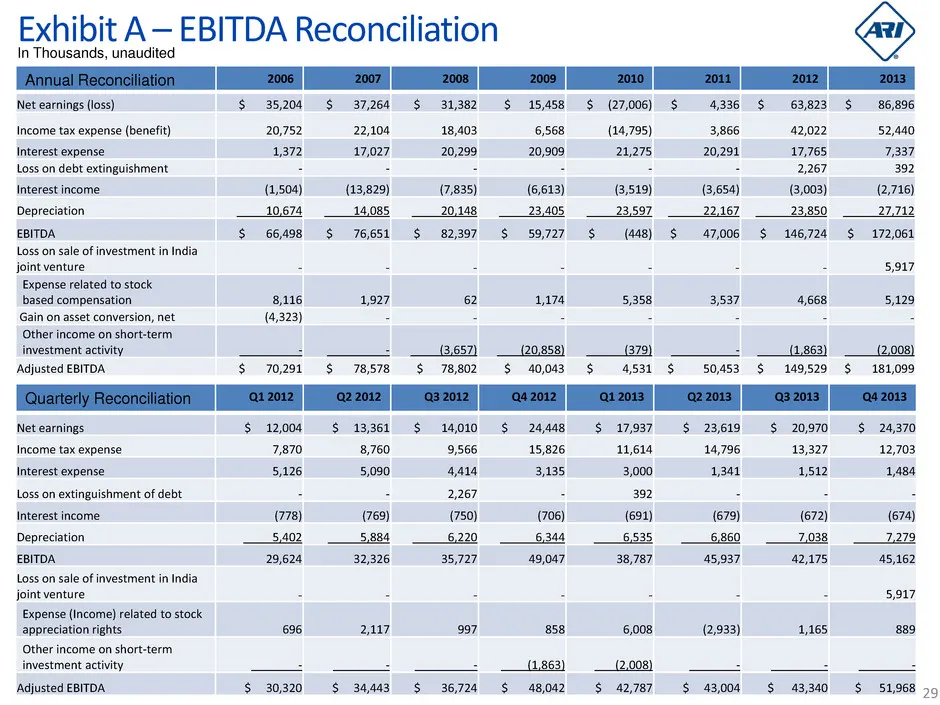
Slide 29: Exhibit A EBITDA Reconciliation
Exhibit A 7 EBITDA Reconciliation In Thousands, unaudite Net earnings (loss) Income tax expense (benefit) Interest e Sarena ae Interest income. Depreciation Loss on sale of investment in India joint venture Expense related to stock ased compensation canon wet conversion, net ou meres rane EBITDA Net
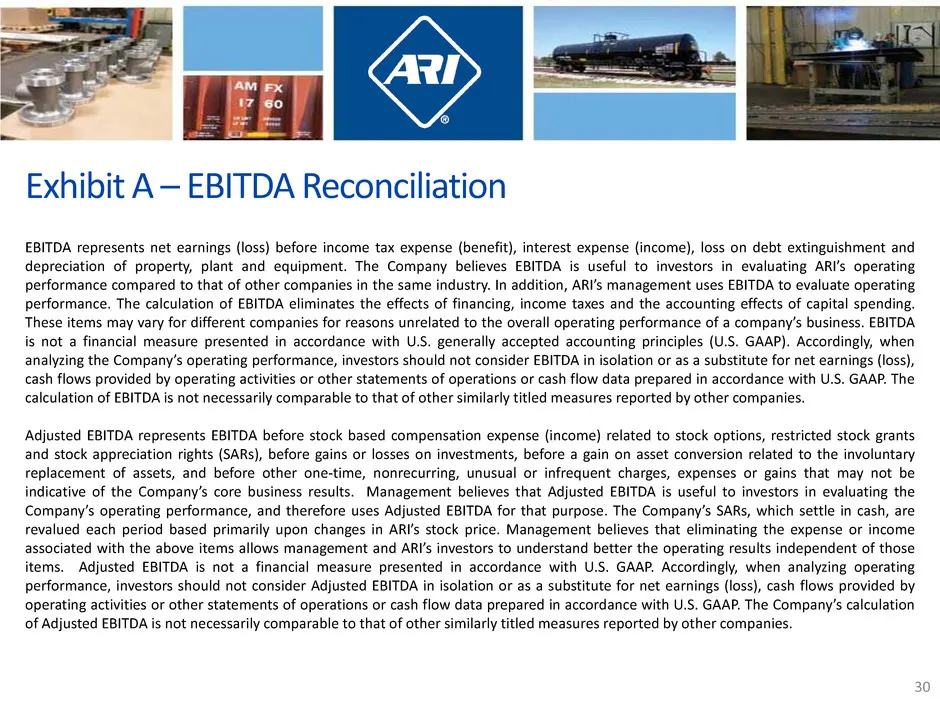
Slide 30: Exhibit A — EBITDA Reconciliation
Exhibit A — EBITDA Reconciliation EBITDA represents net comings (loss) es Rone estes (benef) ine erpense (income), loss on debt extinguishment and depreciation of property, plant and equipment. The y believe seful to investors in evaluating ARI's operating ese xy vary for differe anies for te ing pe
Slide 31: Agile Responsive Innovative
AGILE RESPONSIVE INNOVATIVE | > = en Ea ee, <I fi Ae A _ R _-asl és (apa SS a
Source: SEC EDGAR · 8-K filed Feb 24, 2014
More decks from American Railcar Industries Inc
 Q3 2018 Earnings Presentation19 slides · Oct 30, 2018
 Investor Presentation (August 2018)26 slides · Aug 24, 2018
 Q2 2018 Earnings Presentation19 slides · Aug 1, 2018
 Q1 2018 Earnings Presentation18 slides · May 1, 2018
 Q4 2017 Earnings Presentation19 slides · Feb 23, 2018
 Cowen conference 201824 slides · Feb 6, 2018