American Railcar Industries Inc
American Railcar Industries — Q3 2015 Earnings Presentation
14 slides from American Railcar Industries's earnings presentation, Oct 28, 2015
Slide 1: Q3 2015 Supplemental Information
American Railcar Industries, Inc. Q3 2015 SUPPLEMENTAL INFORMATION INVESTOR CONTACT: (636) 940-6000 WEBSITE: WWW.AMERICANRAILCAR.COM
Slide 2: Forward Looking Disclaimer
Forward Looking Disclaimer Sate Harbor Statement ‘This presentation contains statements relating to the Company's expected financial performance, objectives, long-term strategies and/or future business of the date of this presentation. Such statements include, without limitation, statements regardin
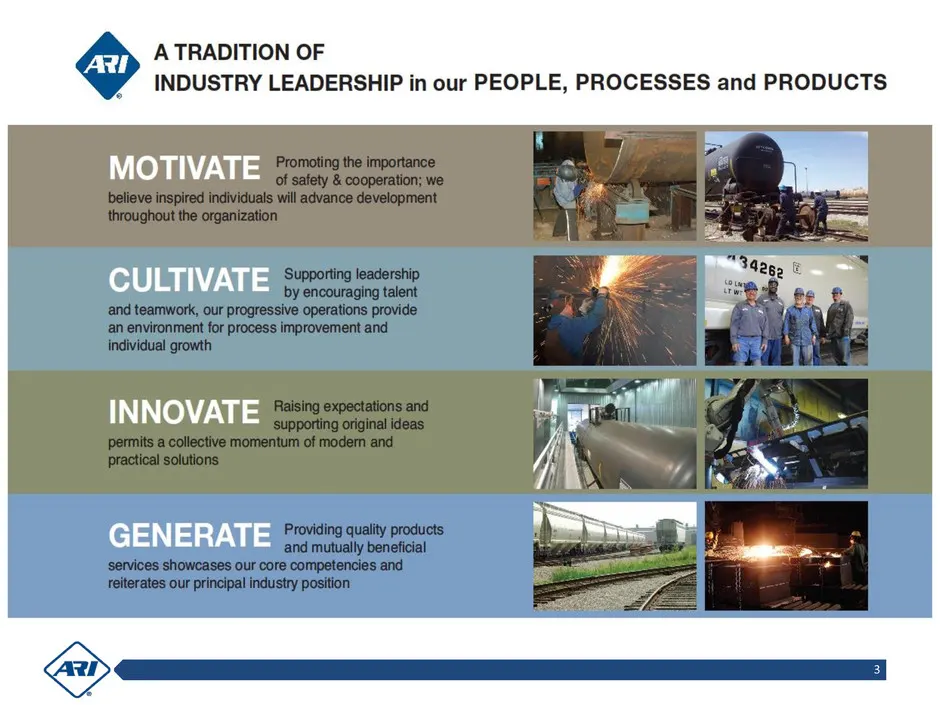
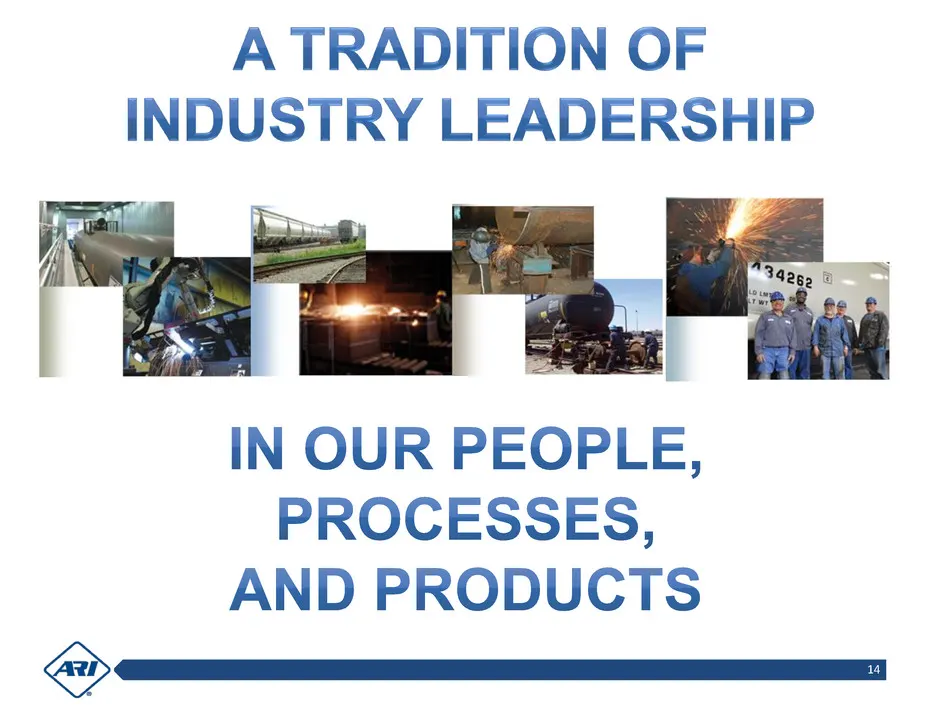
Slide 3: A Tradition of Industry Leadership in our People, Processes and Products
A TRADITION OF y \NDUSTRY LEADERSHIP in our PEOPLE, PROCESSES and PRODUCTS MOTIVATE CULTIVATE INNOVATE GENERATE
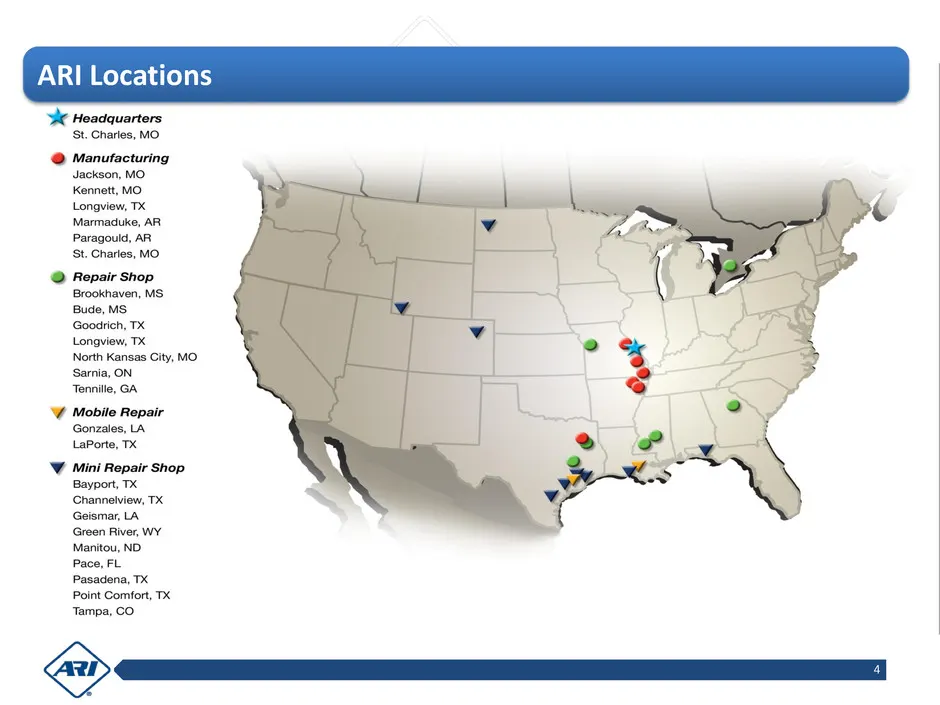
Slide 4: ARI Locations
ARI Locations We Headquarters St. Charles, MO @ Manufacturing A, MO Mini Repair Shop Bayport, TX
Slide 5: ARI Key Railcar Markets
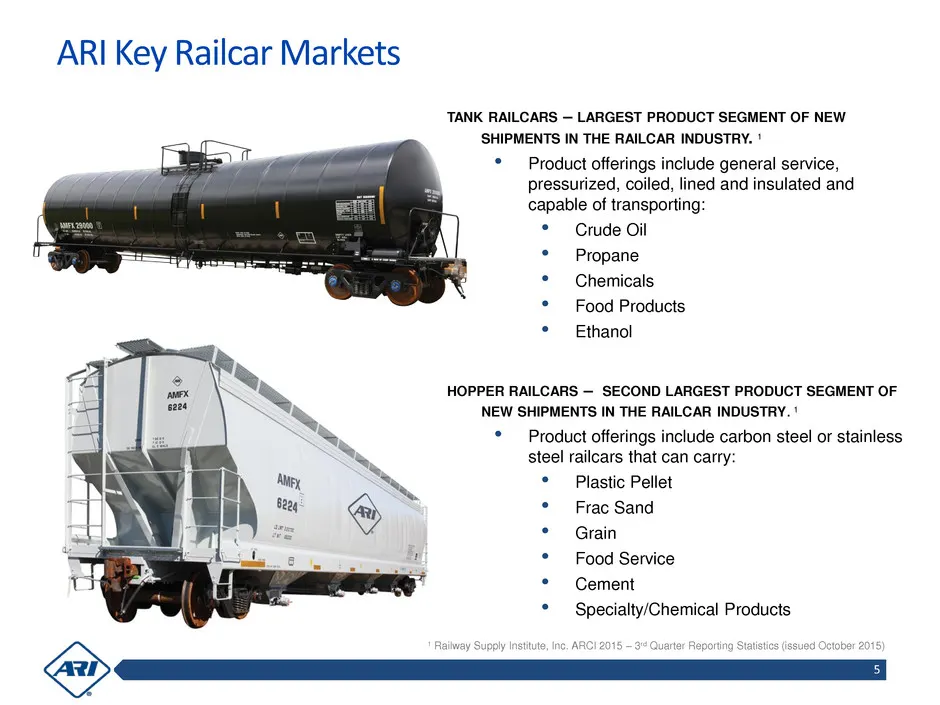
ARI Key Railcar Markets TANK RAILCARS ~ LARGEST PRODUCT SEGMENT OF NEW SHIPMENTS IN THE RAILCAR INDUSTRY. * Product offerings include general service, pressurized, coiled, lined and insulated and capable of transporting: * Crude Oil * Propane * Chemicals * — Food Products ° — Ethanol HOPPER RAILCARS
Slide 6: ARI's Railcar Backlog
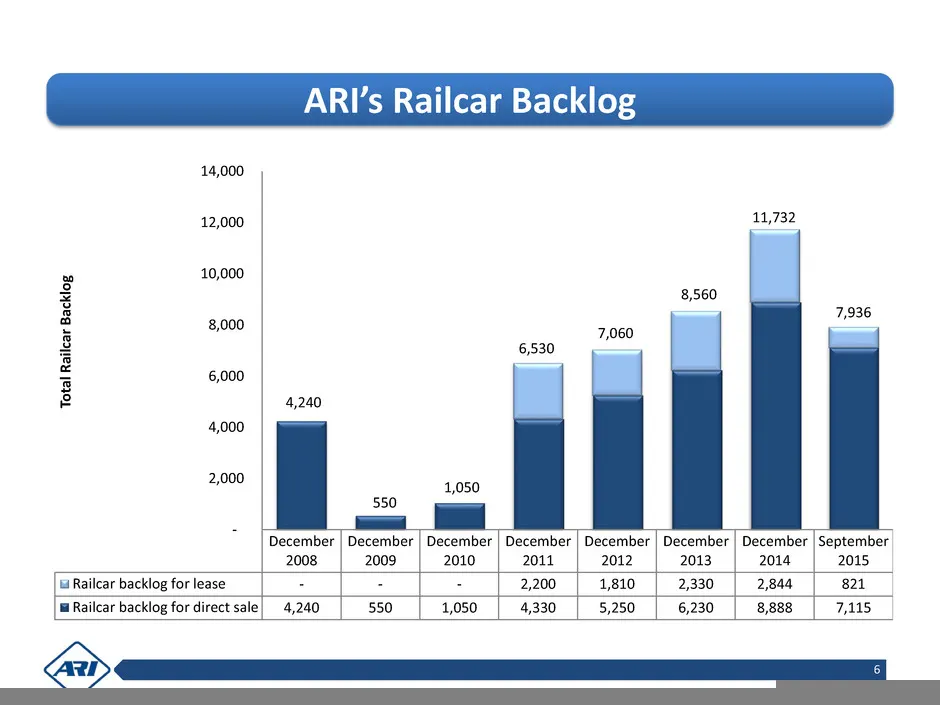
ARI’s Railcar Backlog 14,000 12,000 11,732 10,000 8,000 6,000 4,000 2,000 December | December | December | December | December | December | December | September 2008 2009 2010 2011 2012 2013 2014 2015 {wRailcar backlog for lease - | 2,200 | 1,810 | 2,330 | 2,844 821 [mRailcar backlog fordirect sale|
Slide 7: Manufacturing Segment
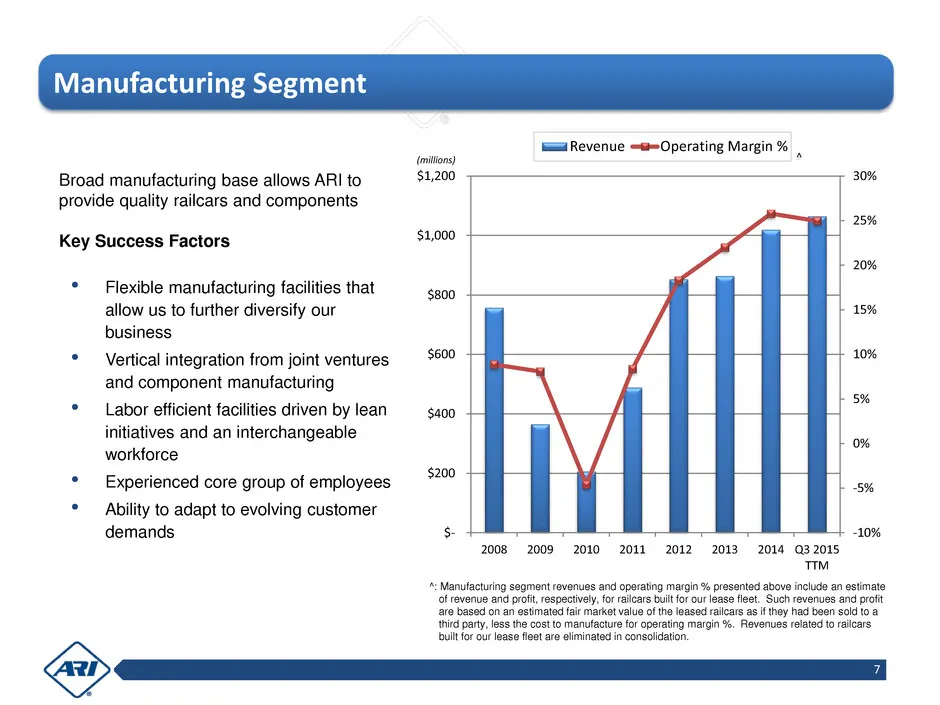
Manufacturing Seg limsd Revenue =tOperating Margin % Coton) Broad manufacturing base allows ARI to $1,200 30% provide quality railcars and components 25% Key Success Factors $1,000 + 20% * Flexible manufacturing facilities that $300 allow us to further diversify our 15% business * Vertical integrati
Slide 8: Railcar Leasing Segment
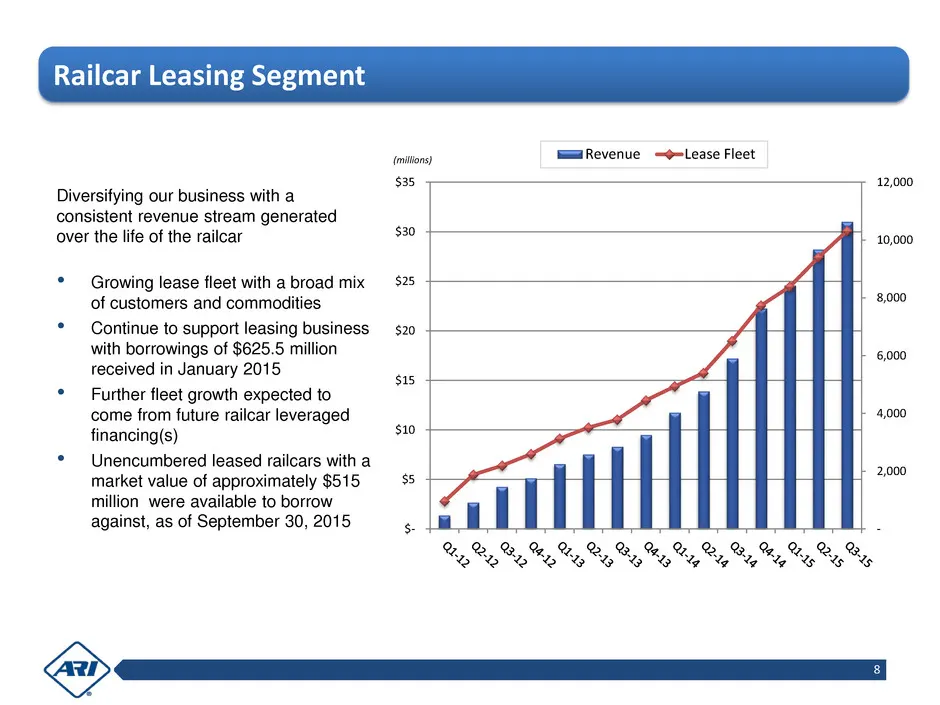
Railcar Leasing Segmen' ‘pinay tERevenue —Lease Fleet $35 12,000 Diversifying our business with a consistent revenue stream generated over the life of the railcar #0 10,000 $ cea lease fleet with a broad mix $25 f customers and commodities 2000 * — Continue to support leasing business $20 with borro
Slide 9: Railcar Services Segment
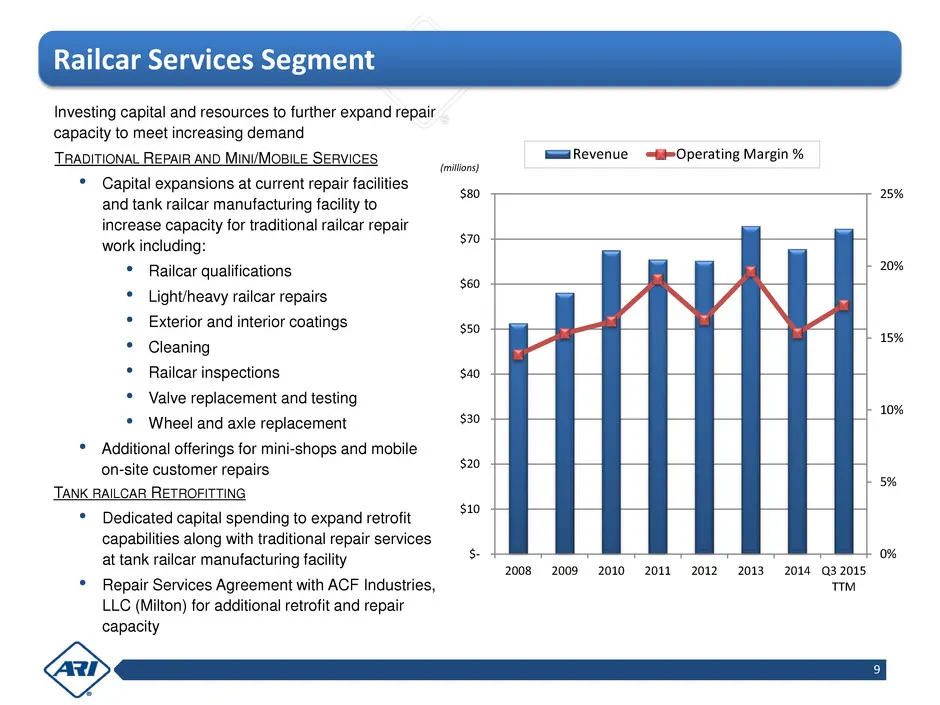
Railcar Services Segmen Investing capital and resources to further expand repair capacity to meet increasing demand L " E=aRevenue fil-Operating Margin % * Capital expansions at current repair facilt and tank railcar manufacturing facility to i ity for tradi ilear repair work including: * Railcar qu
Slide 10: Our Financial History
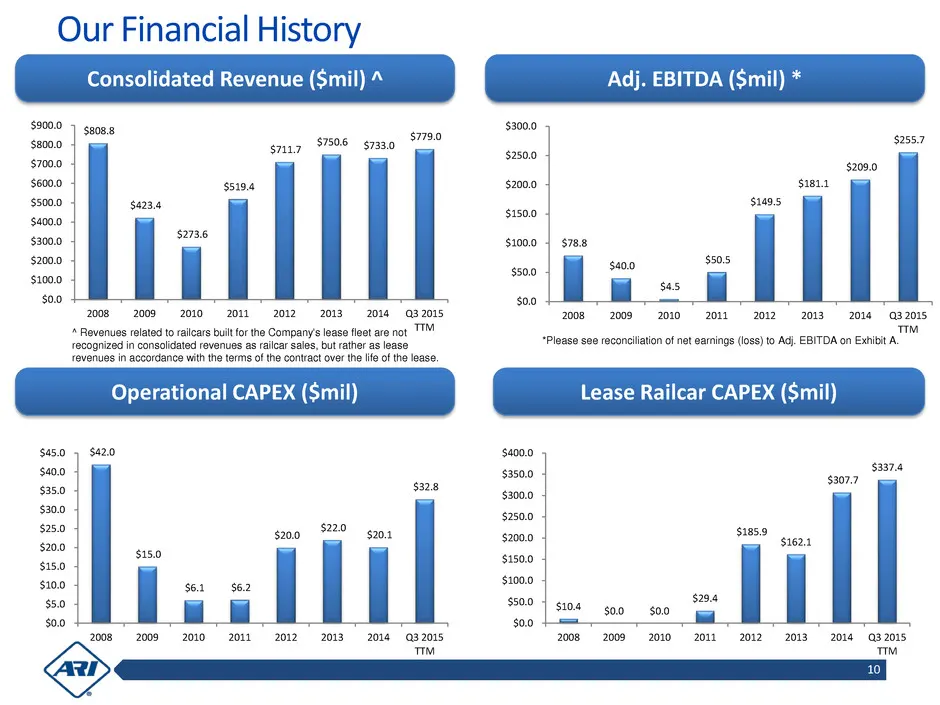
Our Financial History Consolidated Revenue ($mil) * Adj. EBITDA (Smil) * 3779.0 sniz $7506 $7330 2008 200920102011 —<2012”—«2013—«2034 a3 2015 008” 2009 201020112012 «2013-2014 Q32015, TM TIM Operational CAPEX (Smil) Lease Railcar CAPEX ($mil) sis) $120 sto $350 sa8 5300 3250 sx0 $20.0 $20.0 $20.1 $
Slide 11: Quarterly Financial Comparison
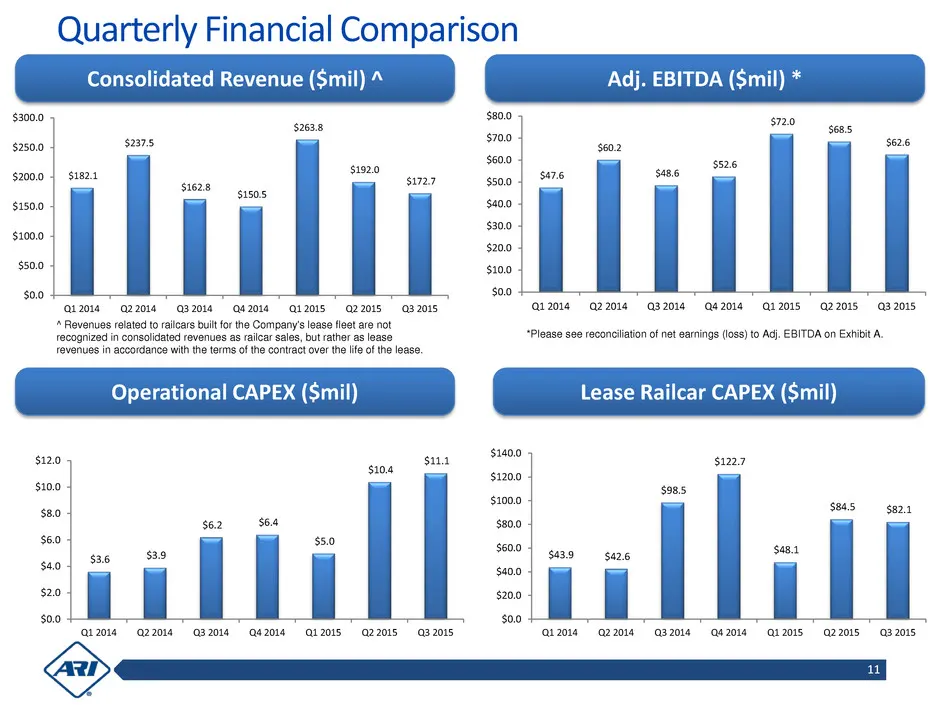
Consolidated Revenue ($mil) * Adj. EBITDA (Smil) * $300.0 $2500 $200.0 $180.0 $1000 $500 $00 Operational CAPEX ($mil) Quarterly Financial Comparison 52638 12014 02201432014 Qh2014 12015 22015 03.2015 but rather as ke $120 Suge i201 q2204 a32014 Qs2018 Qiz01s a22015 " a32015 sno 68s Sox $626 $526 | |
Slide 12: Exhibit A EBITDA Reconciliation
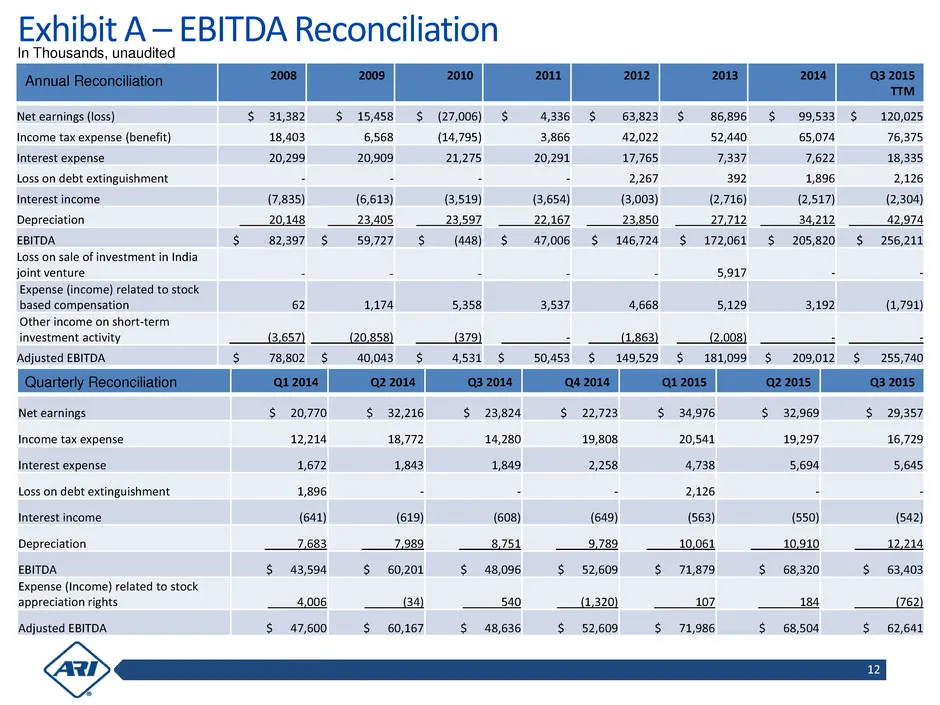
Exhibit A 7 EBITDA Reconciliation In Thousands, unaudite $ 15,458 $ (27,006) $ Net earnings (loss) Income tax expense (benefit) Interest expense Loss on debt extinguishment. Interest income Depreciation EBITDA Loss on sale of investment in India joint venture Expense iia) related to stock based comp
Slide 13: Exhibit A— EBITDA Reconciliation
Exhibit A— EBITDA Reconciliation EBITDA cworeoante net earnings (loss) before it ineome tax expense (benef, interest expense (income), loss on debt extinguishment and depreciation of property, plant and equipment. The Company believes EBITDA is useful to investors in evaluating ARTs operating Merefn
Slide 14: A Tradition of Industry Leadership in our People, Processes, and Products
A TRADITION OF INDUSTRY LEADERSHIP IN OUR PEOPLE, PROCESSES, AND PRODUCTS <>
Source: SEC EDGAR · 8-K filed Oct 28, 2015
More decks from American Railcar Industries Inc
 Q3 2018 Earnings Presentation19 slides · Oct 30, 2018
 Investor Presentation (August 2018)26 slides · Aug 24, 2018
 Q2 2018 Earnings Presentation19 slides · Aug 1, 2018
 Q1 2018 Earnings Presentation18 slides · May 1, 2018
 Q4 2017 Earnings Presentation19 slides · Feb 23, 2018
 Cowen conference 201824 slides · Feb 6, 2018