Westmoreland Resource Partners LP
Westmoreland Resource Partners LP — Oxford Resource Partners — Investor Presentation (November 2010)
21 slides from Westmoreland Resource Partners LP's investor presentation, Nov 10, 2010
Slide 1: Oxford Resource Partners, LP
Oxford Resource Partners, LP Chuck Ungurean, CEO & President Jeff Gutman, SVP, CFO & Treasurer Brian Meilton, Investor Relations November 11, 2010
Slide 2: Forward-Looking Statements, Risk Factors and Non-GAAP Financial Measures
2 Forward-Looking Statements, Risk Factors and Non-GAAP Financial Measures Some of the information in this presentation may contain forward-looking statements. These statements can be identified by the use of forward-looking terminology including "will," "may," "believe," "expect," "anticipate," "es
Slide 3: Oxford Investment Highlights
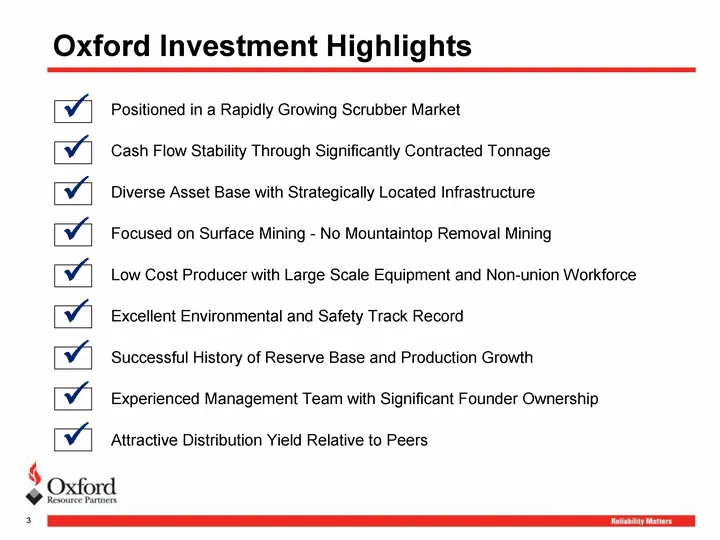
3 Oxford Investment Highlights ? Positioned in a Rapidly Growing Scrubber Market Cash Flow Stability Through Significantly Contracted Tonnage Diverse Asset Base with Strategically Located Infrastructure Focused on Surface Mining - No Mountaintop Removal Mining Low Cost Producer with Large Scale Equi
Slide 4: Leading Producer of Surface Mined Coal in NAPP / ILB
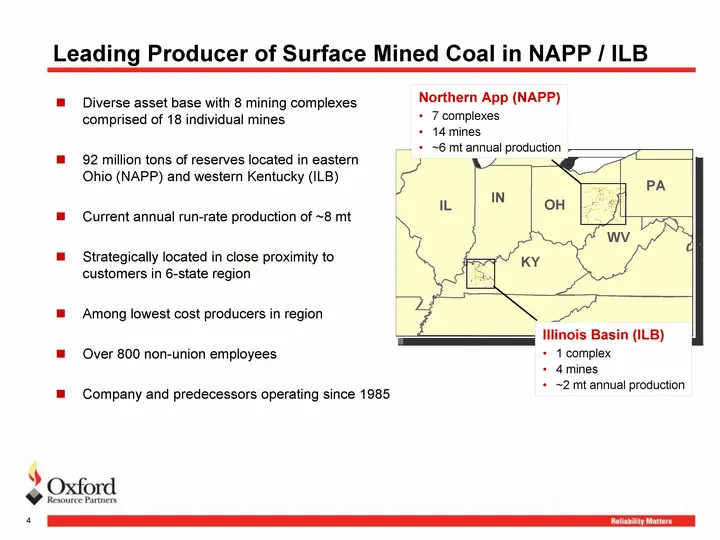
4 Leading Producer of Surface Mined Coal in NAPP / ILB Diverse asset base with 8 mining complexes comprised of 18 individual mines 92 million tons of reserves located in eastern Ohio (NAPP) and western Kentucky (ILB) Current annual run-rate production of ~8 mt Strategically located in close proximit
Slide 5: Top Domestic Coal Producer
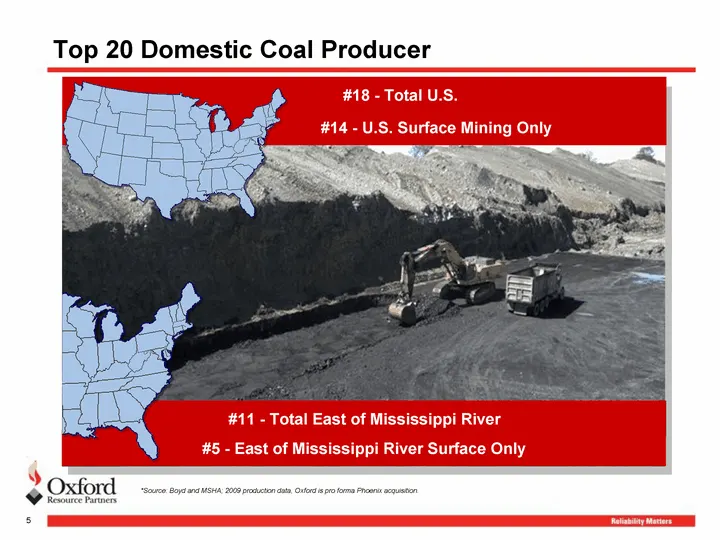
5 Top 20 Domestic Coal Producer *Source: Boyd and MSHA; 2009 production data, Oxford is pro forma Phoenix acquisition. #14 - U.S. Surface #18 - Total U.S. #14 - U.S. Surface Mining Only #11 - Total East of Mississippi River #5 - East of Mississippi River Surface Only
Slide 6: Strategic Regional System of Assets
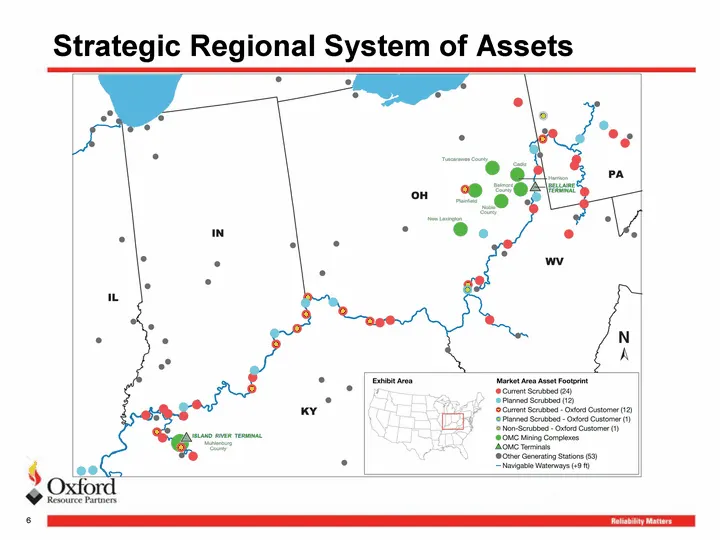
6 Strategic Regional System of Assets
Slide 7: Coal is the Dominant Fuel Source in our Market
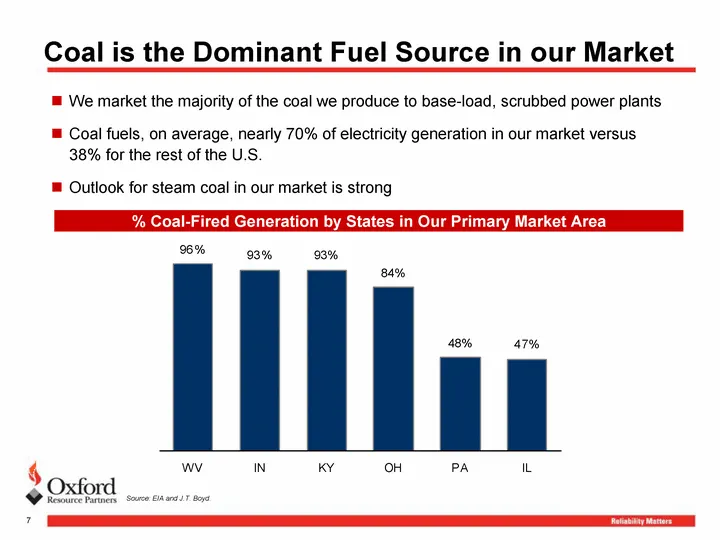
7 Coal is the Dominant Fuel Source in our Market Source: EIA and J.T. Boyd. We market the majority of the coal we produce to base-load, scrubbed power plants Coal fuels, on average, nearly 70% of electricity generation in our market versus 38% for the rest of the U.S. Outlook for steam coal in our m
Slide 8: Our Region Expected to Offset CAPP Declines
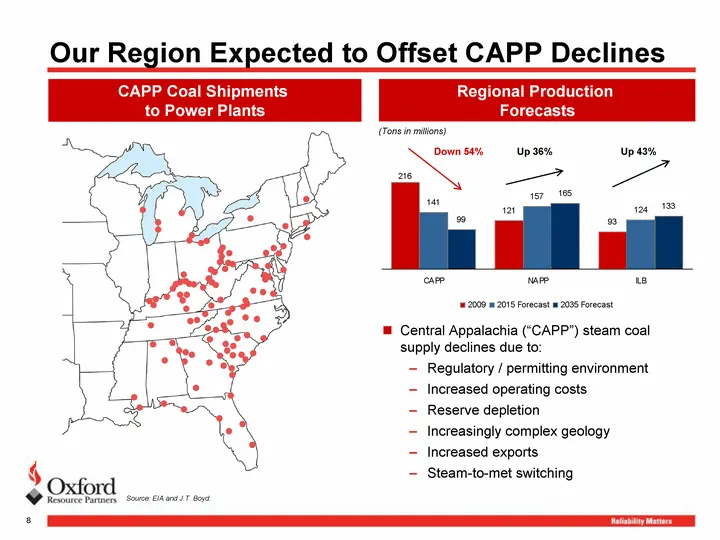
8 Our Region Expected to Offset CAPP Declines Central Appalachia ("CAPP") steam coal supply declines due to: Regulatory / permitting environment Increased operating costs Reserve depletion Increasingly complex geology Increased exports Steam-to-met switching Regional Production Forecasts CAPP Coal S
Slide 9: Lower Risk / Cost Surface Mining
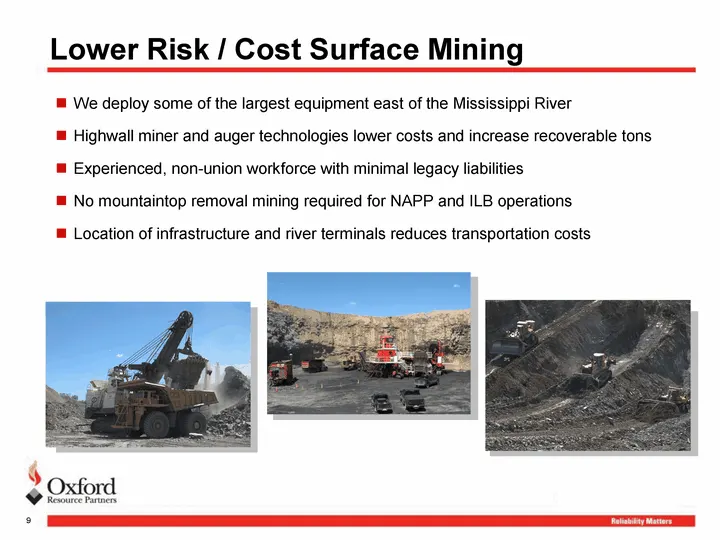
9 Lower Risk / Cost Surface Mining We deploy some of the largest equipment east of the Mississippi River Highwall miner and auger technologies lower costs and increase recoverable tons Experienced, non-union workforce with minimal legacy liabilities No mountaintop removal mining required for NAPP an
Slide 10: Excellent Environmental and Safety Record
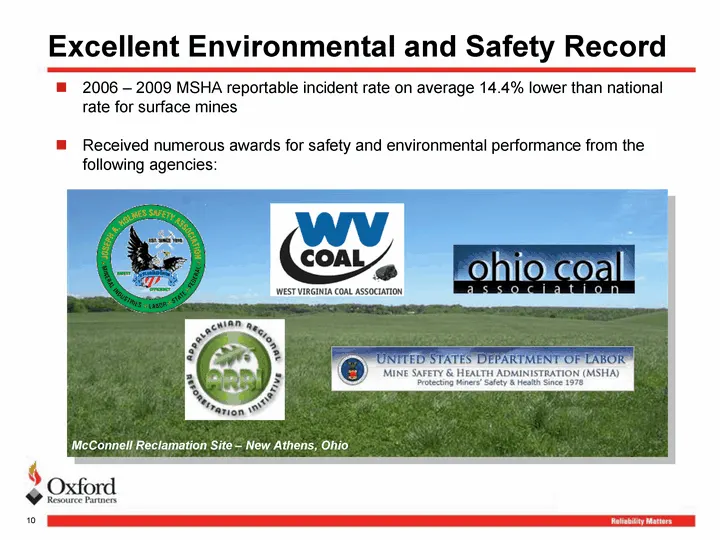
10 Excellent Environmental and Safety Record 2006 - 2009 MSHA reportable incident rate on average 14.4% lower than national rate for surface mines Received numerous awards for safety and environmental performance from the following agencies: McConnell Reclamation Site - New Athens, Ohio
Slide 11: Our Long-Term Growth Strategy
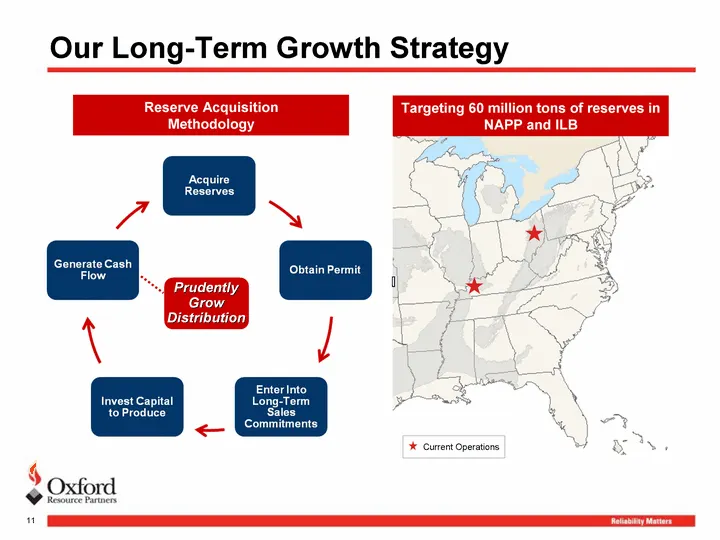
11 Our Long-Term Growth Strategy Current Operations Targeting 60 million tons of reserves in NAPP and ILB Reserve Acquisition Methodology Prudently Grow Distribution
Slide 12: History of Successful Reserve Acquisitions
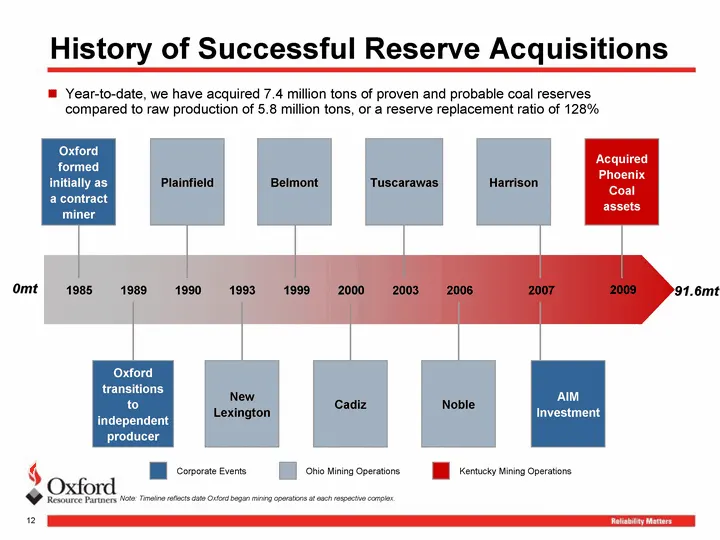
12 History of Successful Reserve Acquisitions Year-to-date, we have acquired 7.4 million tons of proven and probable coal reserves compared to raw production of 5.8 million tons, or a reserve replacement ratio of 128% 1985 1989 1990 1993 1999 2000 2003 2007 2009 Ohio Mining Operations Kentucky Minin
Slide 13: Phoenix Coal: Our Entry into ILB
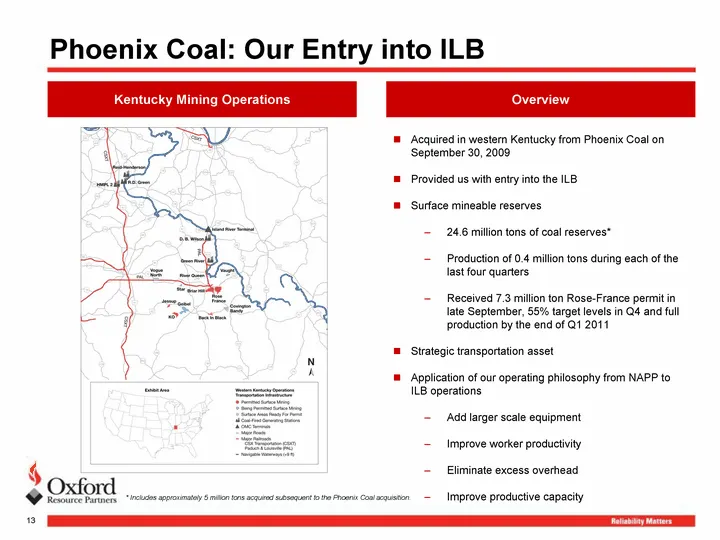
13 Phoenix Coal: Our Entry into ILB Acquired in western Kentucky from Phoenix Coal on September 30, 2009 Provided us with entry into the ILB Surface mineable reserves 24.6 million tons of coal reserves* Production of 0.4 million tons during each of the last four quarters Received 7.3 million ton Ros
Slide 14: Our Strong Financial Foundation is Key
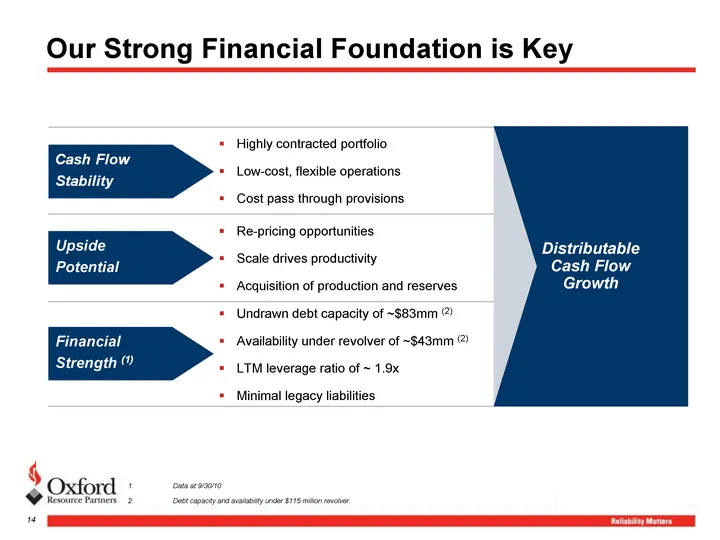
14 14 Our Strong Financial Foundation is Key Highly contracted portfolio Low-cost, flexible operations Cost pass through provisions Re-pricing opportunities Scale drives productivity Acquisition of production and reserves Undrawn debt capacity of ~$83mm (2) Availability under revolver of ~$43mm (2)
Slide 15: Contracted Sales Portfolio: Built-In Revenue Growth
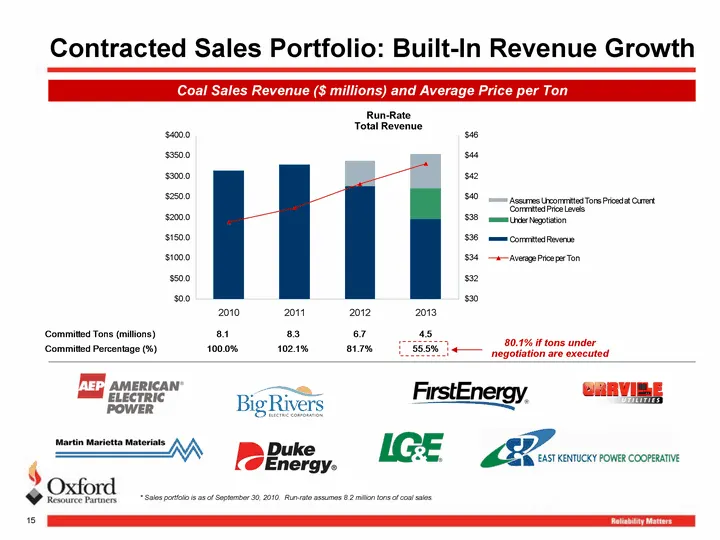
15 * Sales portfolio is as of September 30, 2010. Run-rate assumes 8.2 million tons of coal sales. Contracted Sales Portfolio: Built-In Revenue Growth Coal Sales Revenue ($ millions) and Average Price per Ton Run-Rate Total Revenue 80.1% if tons under negotiation are executed
Slide 16: Applying Contract Strategy to Kentucky Assets
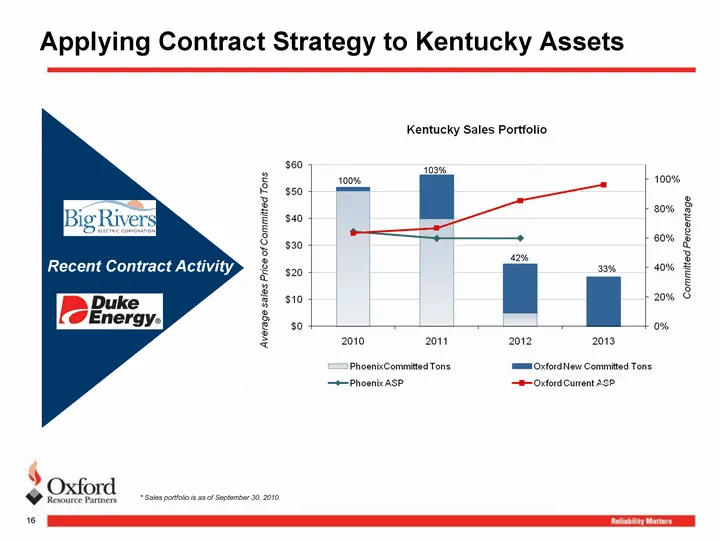
16 Applying Contract Strategy to Kentucky Assets 71% 98% Recent Contract Activity * Sales portfolio is as of September 30, 2010. 100% 103% 42% 33%
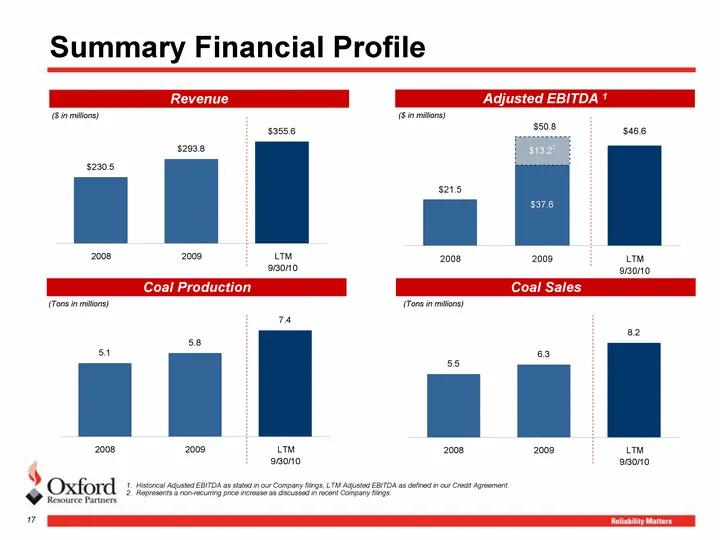
Slide 17: Summary Financial Profile
$50.8 17 Summary Financial Profile Revenue Coal Sales Coal Production 1. Historical Adjusted EBITDA as stated in our Company filings, LTM Adjusted EBITDA as defined in our Credit Agreement. 2. Represents a non-recurring price increase as discussed in recent Company filings. Adjusted EBITDA 1 ($ in m
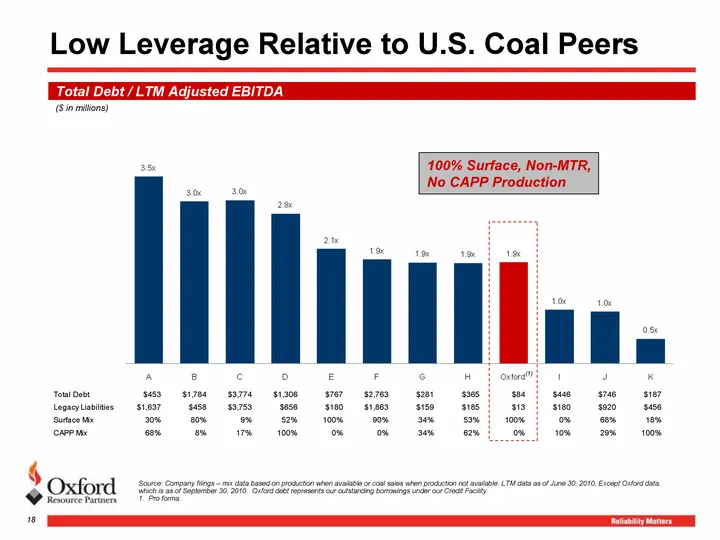
Slide 18: Low Leverage Relative to U.S. Coal Peers
Low Leverage Relative to U.S. Coal Peers Source: Company filings - mix data based on production when available or coal sales when production not available. LTM data as of June 30, 2010, Except Oxford data, which is as of September 30, 2010. Oxford debt represents our outstanding borrowings under our
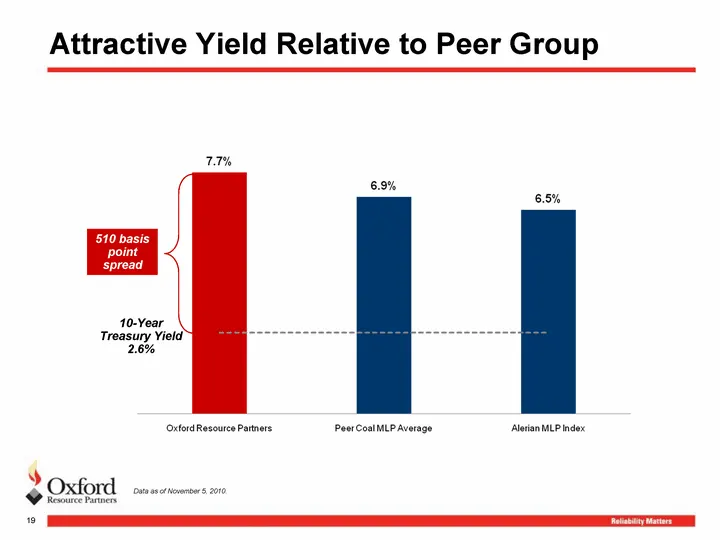
Slide 19: Attractive Yield Relative to Peer Group
Attractive Yield Relative to Peer Group Data as of November 5, 2010. 19 10-Year Treasury Yield 2.6% 510 basis point spread
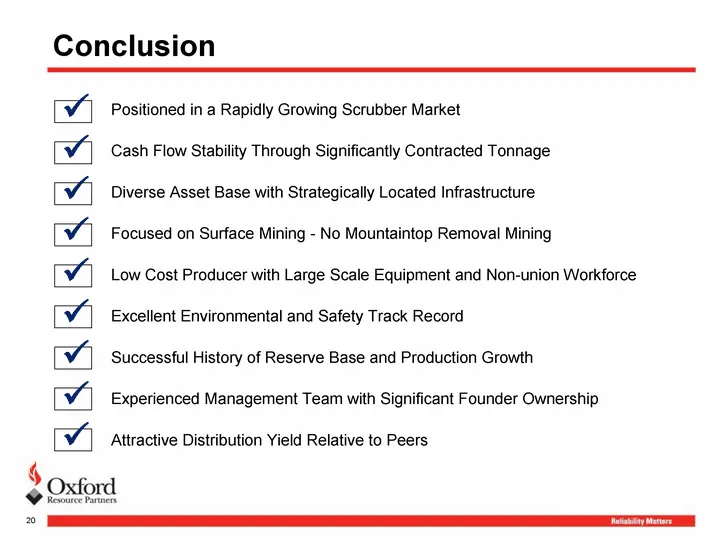
Slide 20: Conclusion
20 Conclusion ? Positioned in a Rapidly Growing Scrubber Market Cash Flow Stability Through Significantly Contracted Tonnage Diverse Asset Base with Strategically Located Infrastructure Focused on Surface Mining - No Mountaintop Removal Mining Low Cost Producer with Large Scale Equipment and Non-uni
Slide 21: Questions?
QUESTIONS? Oxford Resource Partners, LP NYSE: OXF www.oxfordresources.com
Source: SEC EDGAR · 8-K filed Nov 10, 2010
More decks from Westmoreland Resource Partners LP
 BMO Capital Markets 25th Global Metals and Mining Conference 201620 slides · Feb 29, 2016
 Citi 2015 MLP / Midstream Infrastructure Conference19 slides · Aug 26, 2015
 Oxford Resource Partners — 2011 Wells Fargo Securities 10th Annual Pipeline, MLP, and E&P, Services, & Utility Sympos17 slides · Dec 6, 2011
 Oxford Resource Partners — 2011 RBC Capital Markets' MLP Conference8 slides · Nov 17, 2011
 Oxford Resource Partners — 2011 Citigroup MLP/Midstream Infrastructure Conference18 slides · Aug 25, 2011
 Oxford Resource Partners — National Association of Publicly-Traded Partnerships' Master Limited Partnerships Investor (May 2011)18 slides · May 25, 2011