Allegiance Bancshares — Q1 2018 Earnings Presentation
13 slides from Allegiance Bancshares's earnings presentation, Apr 26, 2018

Slide 1: First Quarter 2018 Earnings Presentation
First Quarter 2018 Earnings Presentation
Slide 2: Safe Harbor Statement
2 Safe Harbor Statement “Safe Harbor” Statement under the Private Securities Litigation Reform Act of 1995: This presentation may contain forward-looking statements within the meaning of the securities laws that are based on various facts and derived utilizing important assumptions, present expectat
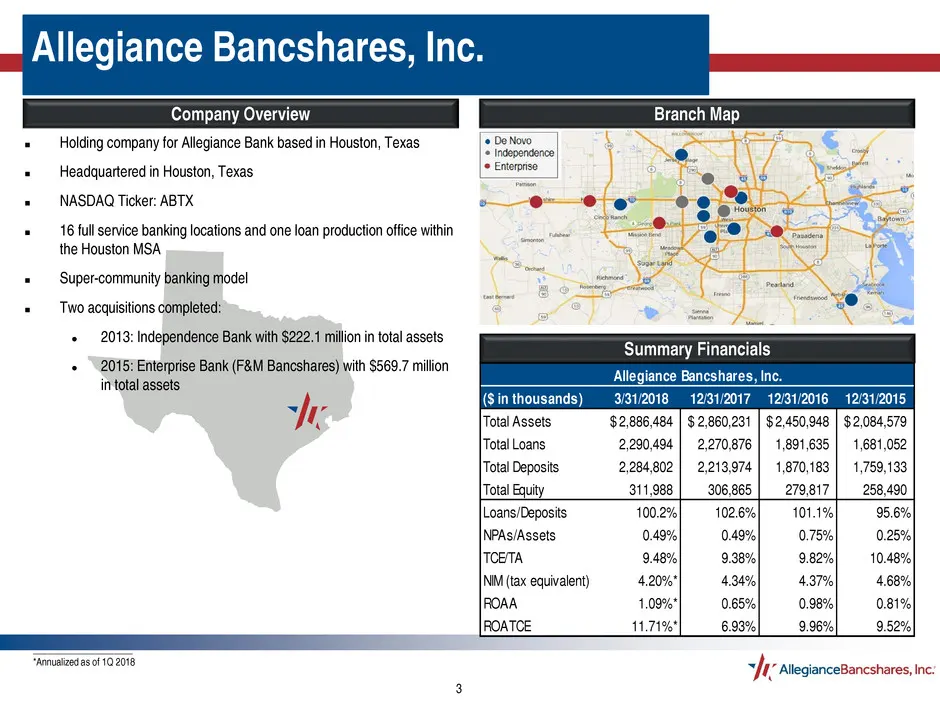
Slide 3: Company Overview
3 Holding company for Allegiance Bank based in Houston, Texas Headquartered in Houston, Texas NASDAQ Ticker: ABTX 16 full service banking locations and one loan production office within the Houston MSA Super-community banking model Two acquisitions completed: 2013: Independence Bank wi
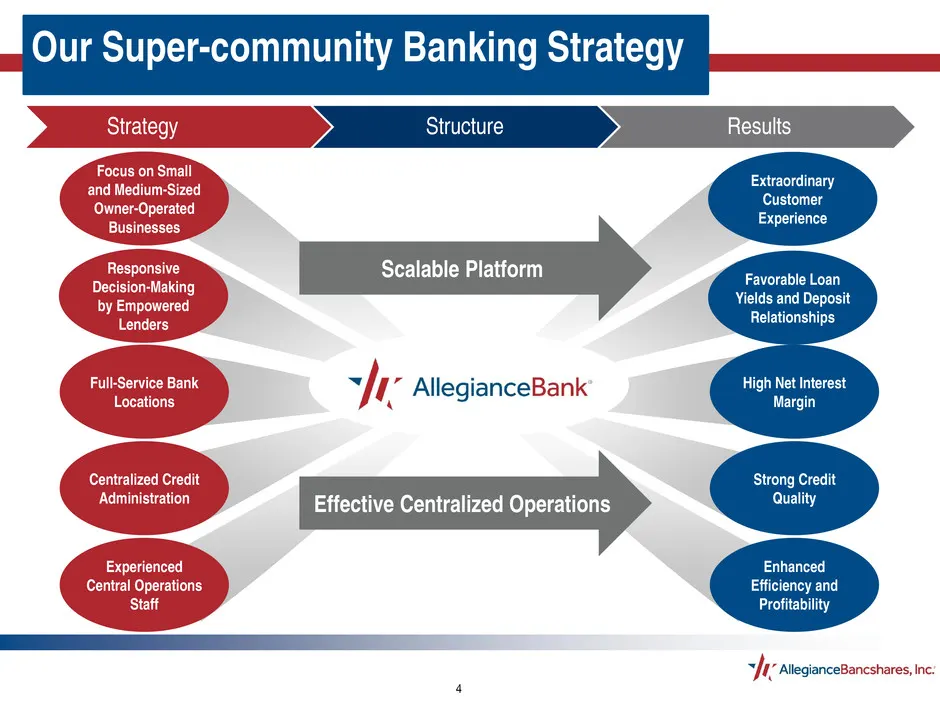
Slide 4: Our Super-community Banking Strategy
4 Our Super-community Banking Strategy High Net Interest Margin Strong Credit Quality Centralized Credit Administration Focus on Small and Medium-Sized Owner-Operated Businesses Full-Service Bank Locations Favorable Loan Yields and Deposit Relationships Effective Centralized Operations Scalable Plat
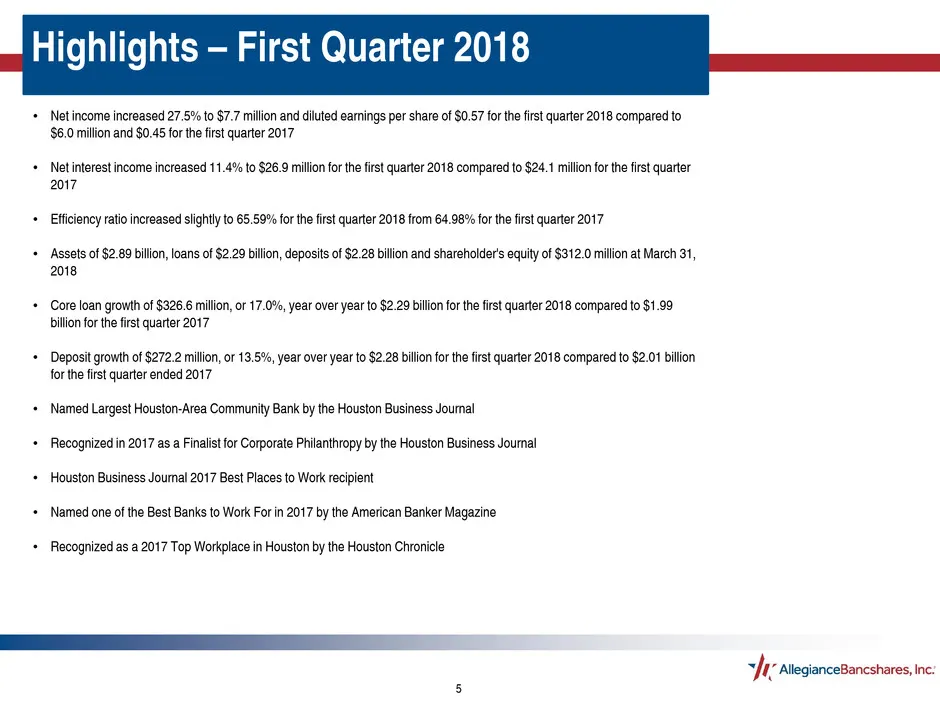
Slide 5: Highlights – First Quarter 2018
5 Highlights – First Quarter 2018 • Net income increased 27.5% to $7.7 million and diluted earnings per share of $0.57 for the first quarter 2018 compared to $6.0 million and $0.45 for the first quarter 2017 • Net interest income increased 11.4% to $26.9 million for the first quarter 2018 compared t
Slide 6: Historical Growth
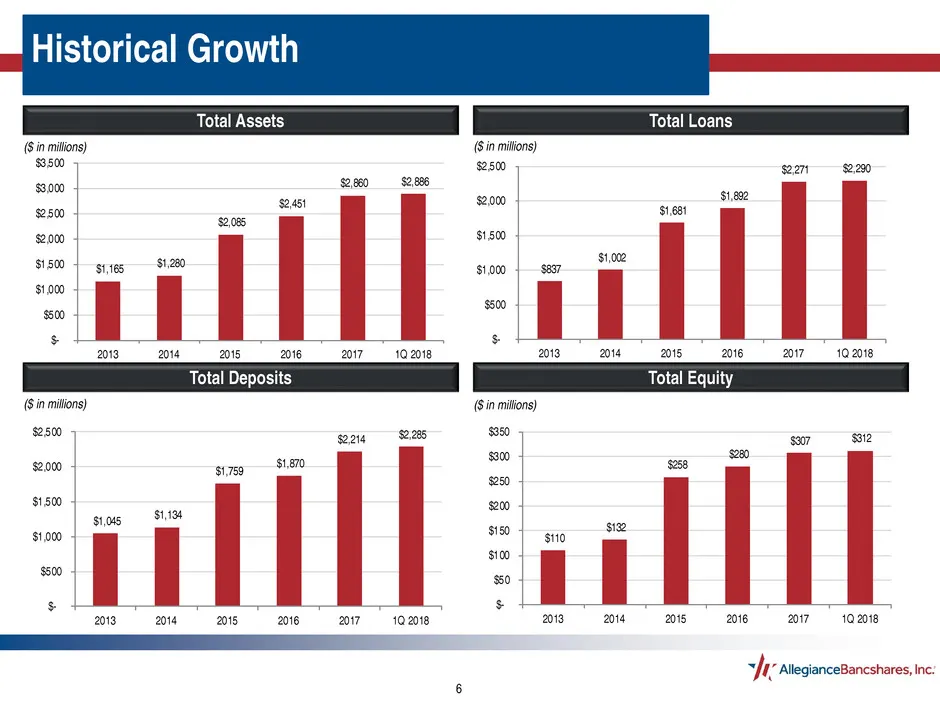
6 Historical Growth Total Loans ($ in millions) Total Assets Total Equity ($ in millions) Total Deposits ($ in millions) ($ in millions) $1,045 $1,134 $1,759 $1,870 $2,214 $2,285 $- $500 $1,000 $1,500 $2,000 $2,500 2013 2014 2015 2016 2017 1Q 2018 $837 $1,002 $1,681 $1,892 $2,271 $2,290 $- $500 $1,0
Slide 7: Net Income Growth
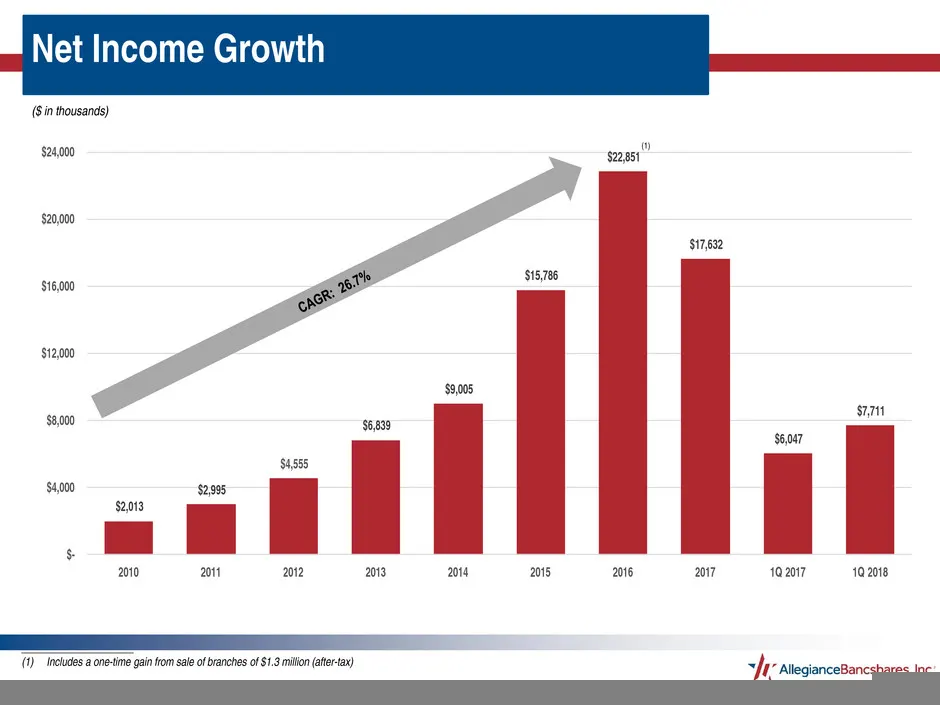
7 Net Income Growth * ($ in thousands) _____________________ (1) Includes a one-time gain from sale of branches of $1.3 million (after-tax) * $2,013 $2,995 $4,555 $6,839 $9,005 $15,786 $22,851 $17,632 $6,047 $7,711 $- $4,000 $8,000 $12,000 $16,000 $20,000 $24,000 2010 2011 2012 2013 2014 2015 2016 2
Slide 8: Diluted EPS Growth
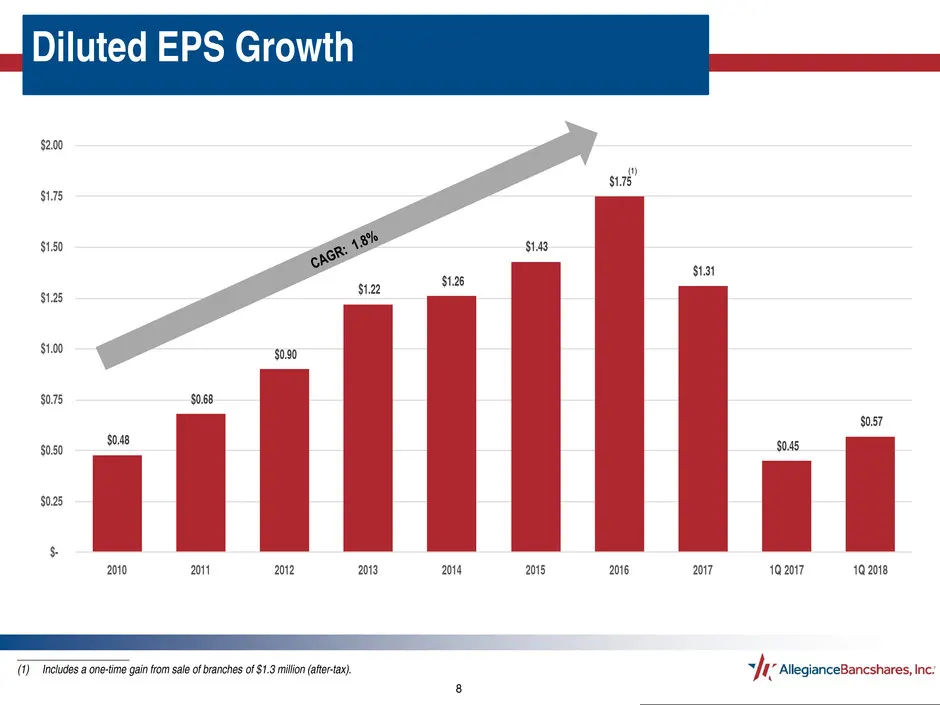
8 Diluted EPS Growth * _____________________ (1) Includes a one-time gain from sale of branches of $1.3 million (after-tax). $0.48 $0.68 $0.90 $1.22 $1.26 $1.43 $1.75 $1.31 $0.45 $0.57 $- $0.25 $0.50 $0.75 $1.00 $1.25 $1.50 $1.75 $2.00 2010 2011 2012 2013 2014 2015 2016 2017 1Q 2017 1Q 2018 (1)
Slide 9: Net Interest Income and Margin
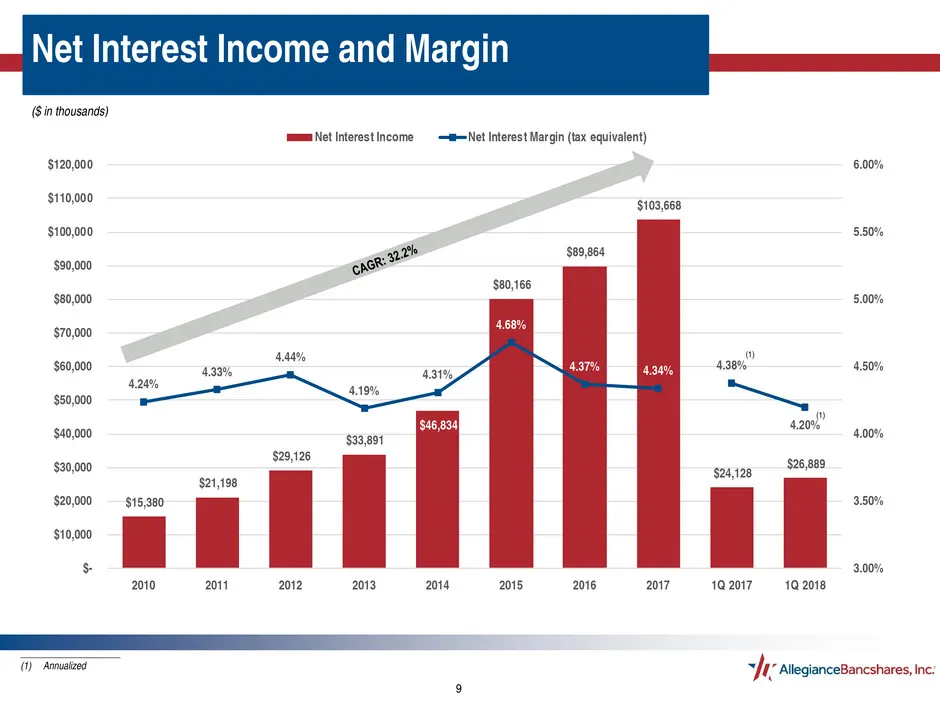
9 Net Interest Income and Margin ($ in thousands) $15,380 $21,198 $29,126 $33,891 $46,834 $80,166 $89,864 $103,668 $24,128 $26,889 4.24% 4.33% 4.44% 4.19% 4.31% 4.68% 4.37% 4.34% 4.38% 4.20% 3.00% 3.50% 4.00% 4.50% 5.00% 5.50% 6.00% $- $10,000 $20,000 $30,000 $40,000 $50,000 $60,000 $70,000 $80,000
Slide 10: Performance Metrics
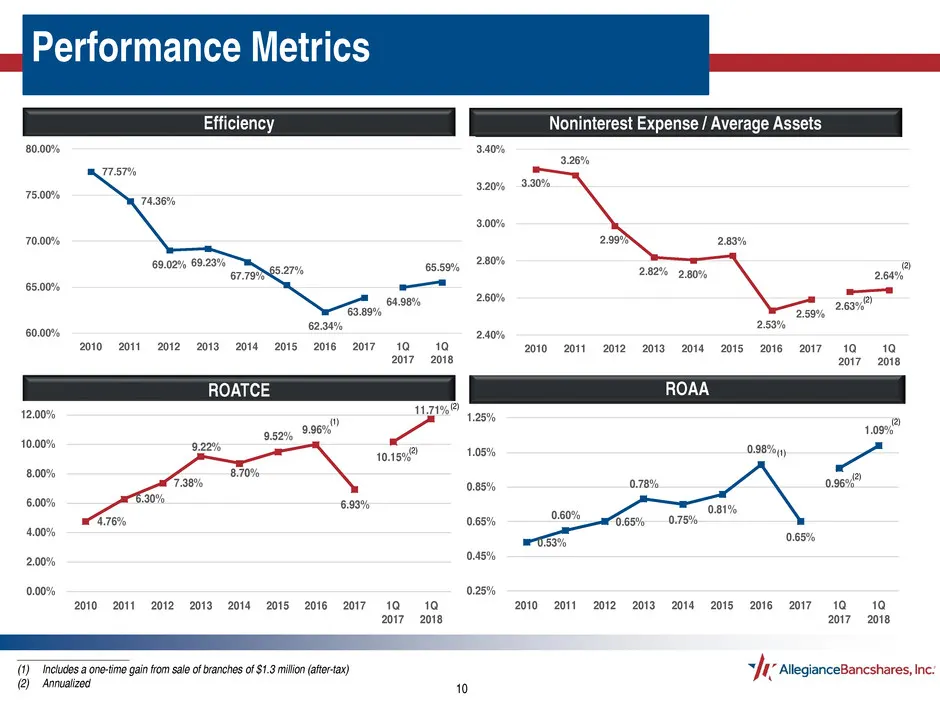
10 Performance Metrics ROAA Efficiency _____________________ (1) Includes a one-time gain from sale of branches of $1.3 million (after-tax) (2) Annualized Noninterest Expense / Average Assets ROATCE 77.57% 74.36% 69.02% 69.23% 67.79% 65.27% 62.34% 63.89% 64.98% 65.59% 60.00% 65.00% 70.00% 75.00% 80.
Slide 11: Loan Portfolio Composition
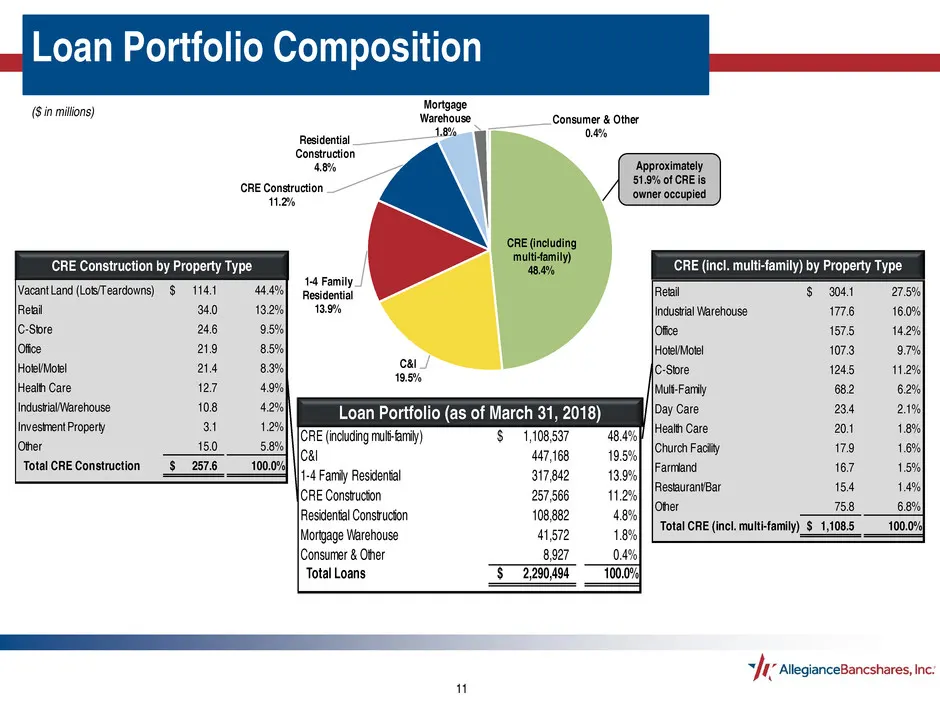
11 Loan Portfolio Composition Loan Portfolio (as of March 31, 2018) ($ in millions) CRE Construction by Property Type CRE (incl. multi-family) by Property Type CRE (including multi-family) 1,108,537$ 48.4% C&I 447,168 19.5% 1-4 Family Residential 317,842 13.9% CRE Construction 257,566 11.2% Resident
Slide 12: Strong Credit Quality
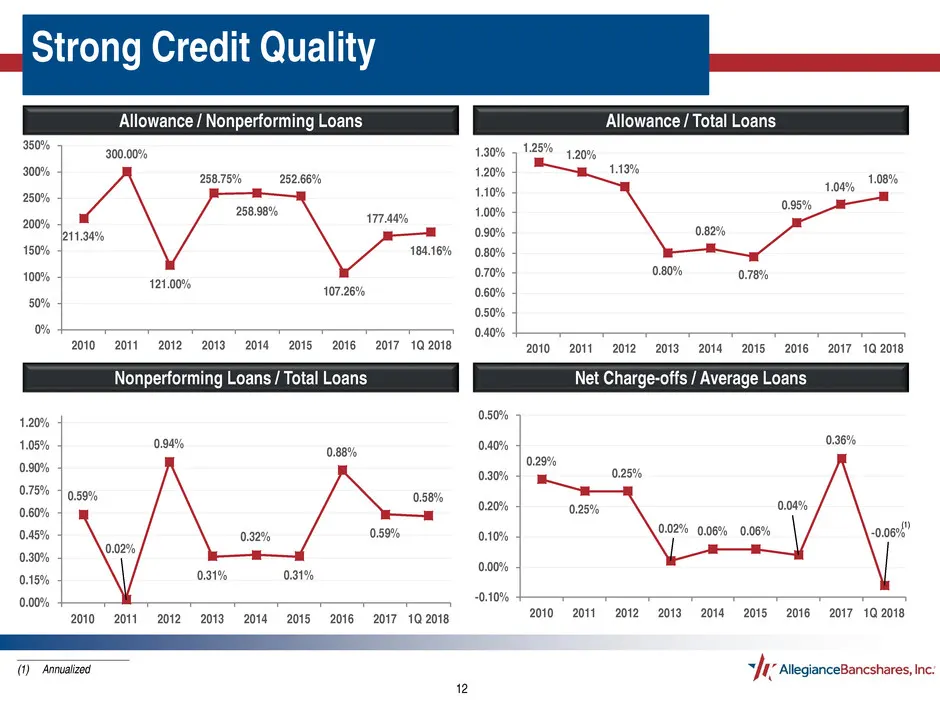
12 Strong Credit Quality Net Charge-offs / Average LoansNonperforming Loans / Total Loans Allowance / Nonperforming Loans Allowance / Total Loans 211.34% 300.00% 121.00% 258.75% 258.98% 252.66% 107.26% 177.44% 184.16% 0% 50% 100% 150% 200% 250% 300% 350% 2010 2011 2012 2013 2014 2015 2016 2017 1Q 20
Slide 13: Deposit Growth and Composition
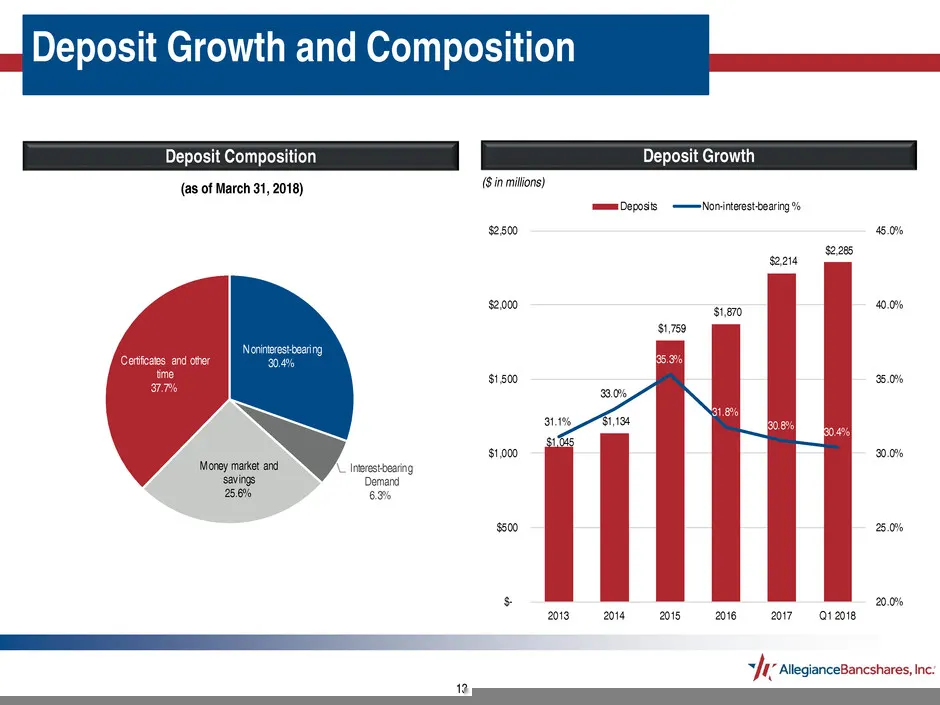
13 Deposit Growth and Composition Deposit Composition ($ in millions) Deposit Growth (as of March 31, 2018) $1,045 $1,134 $1,759 $1,870 $2,214 $2,285 31.1% 33.0% 35.3% 31.8% 30.8% 30.4% 20.0% 25.0% 30.0% 35.0% 40.0% 45.0% $- $500 $1,000 $1,500 $2,000 $2,500 2013 2014 2015 2016 2017 Q1 2018 Deposits
Source: SEC EDGAR · 8-K filed Apr 26, 2018
More decks from Allegiance Bancshares Inc
 Q2 2022 Earnings Presentation16 slides · Jul 29, 2022
 Q1 2022 Earnings Presentation19 slides · Apr 28, 2022
 FY2021 Earnings Presentation18 slides · Jan 28, 2022
 Q4 2021 Earnings Presentation19 slides · Jan 28, 2022
 Merger or Acquisition (November 2021)28 slides · Nov 8, 2021
 Q3 2021 Earnings Presentation17 slides · Oct 28, 2021