United Financial Bancorp — Rockville Financial — Stifel Nicolaus Global Select Conference 2012
39 slides from United Financial Bancorp's conference presentation, May 8, 2012
Slide 1: Stifel Nicolaus Global Select Conference
Exhibit 99.1 Transition NASDAQ Stifel May 8,Nicolaus 2012 Values Global Investor Success SelectConference Market RCKB
Slide 2: Forward-Looking Statements
Forward This expectations looking conditional Actual include forward-looking disclosures OCFC, sourced 2 Presentation conditions, ESBF, without statements. from Looking of verbs, ofSNL aUBNK, our forward-looking limitation statements contains Statements such events Financial management Forward-looki
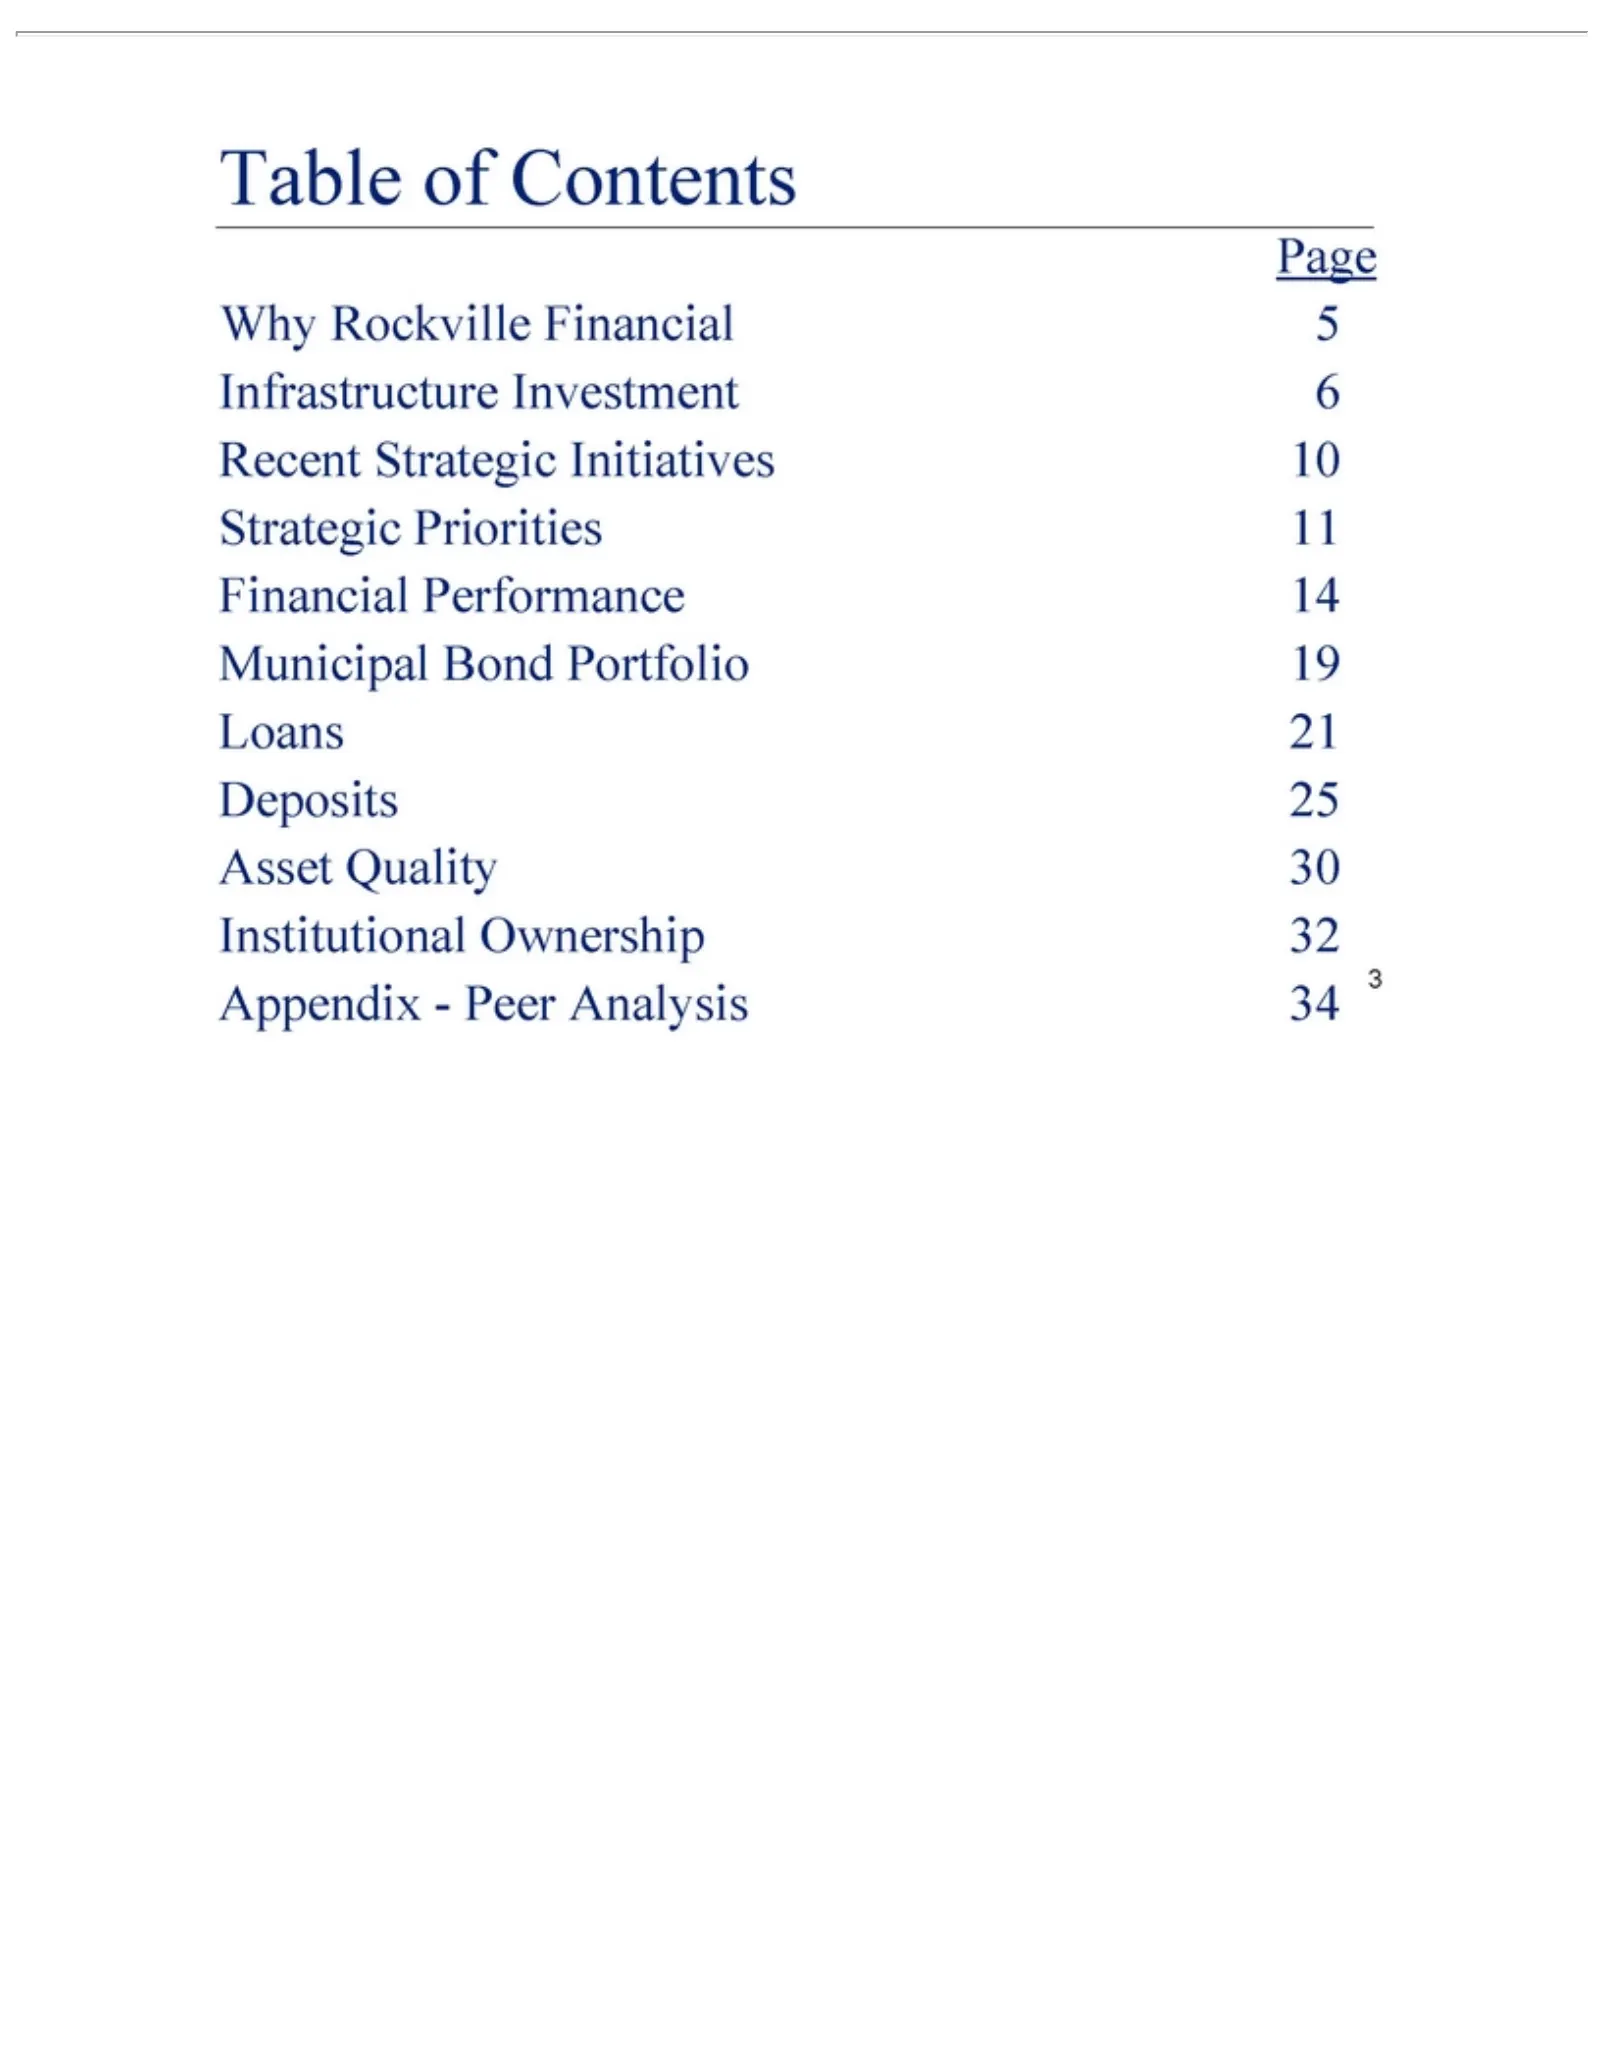
Slide 3: Table of Contents
TableRockville Why Page Infrastructure Recent Strategic Financial Municipal Loans Deposits Asset Institutional Appendix—Peer of Quality 21Strategic Contents 25 Priorities Performance Bond Ownership Investment 30Financial Portfolio Initiatives Analysis 11 14325619 34 103
Slide 4: Corporate and Investor Contacts
Corporate William President Scott John Mark Executive Eric Investor Senior 4 R. T. C. A.Vice Newell Lund Bechtle H. Information: Kucia &Vice Contacts W. President, Chief Crawford, President, Executive Marliese Director Investor IV Chief Commercial Officer L. Relations of Risk Financial Shaw Treasury
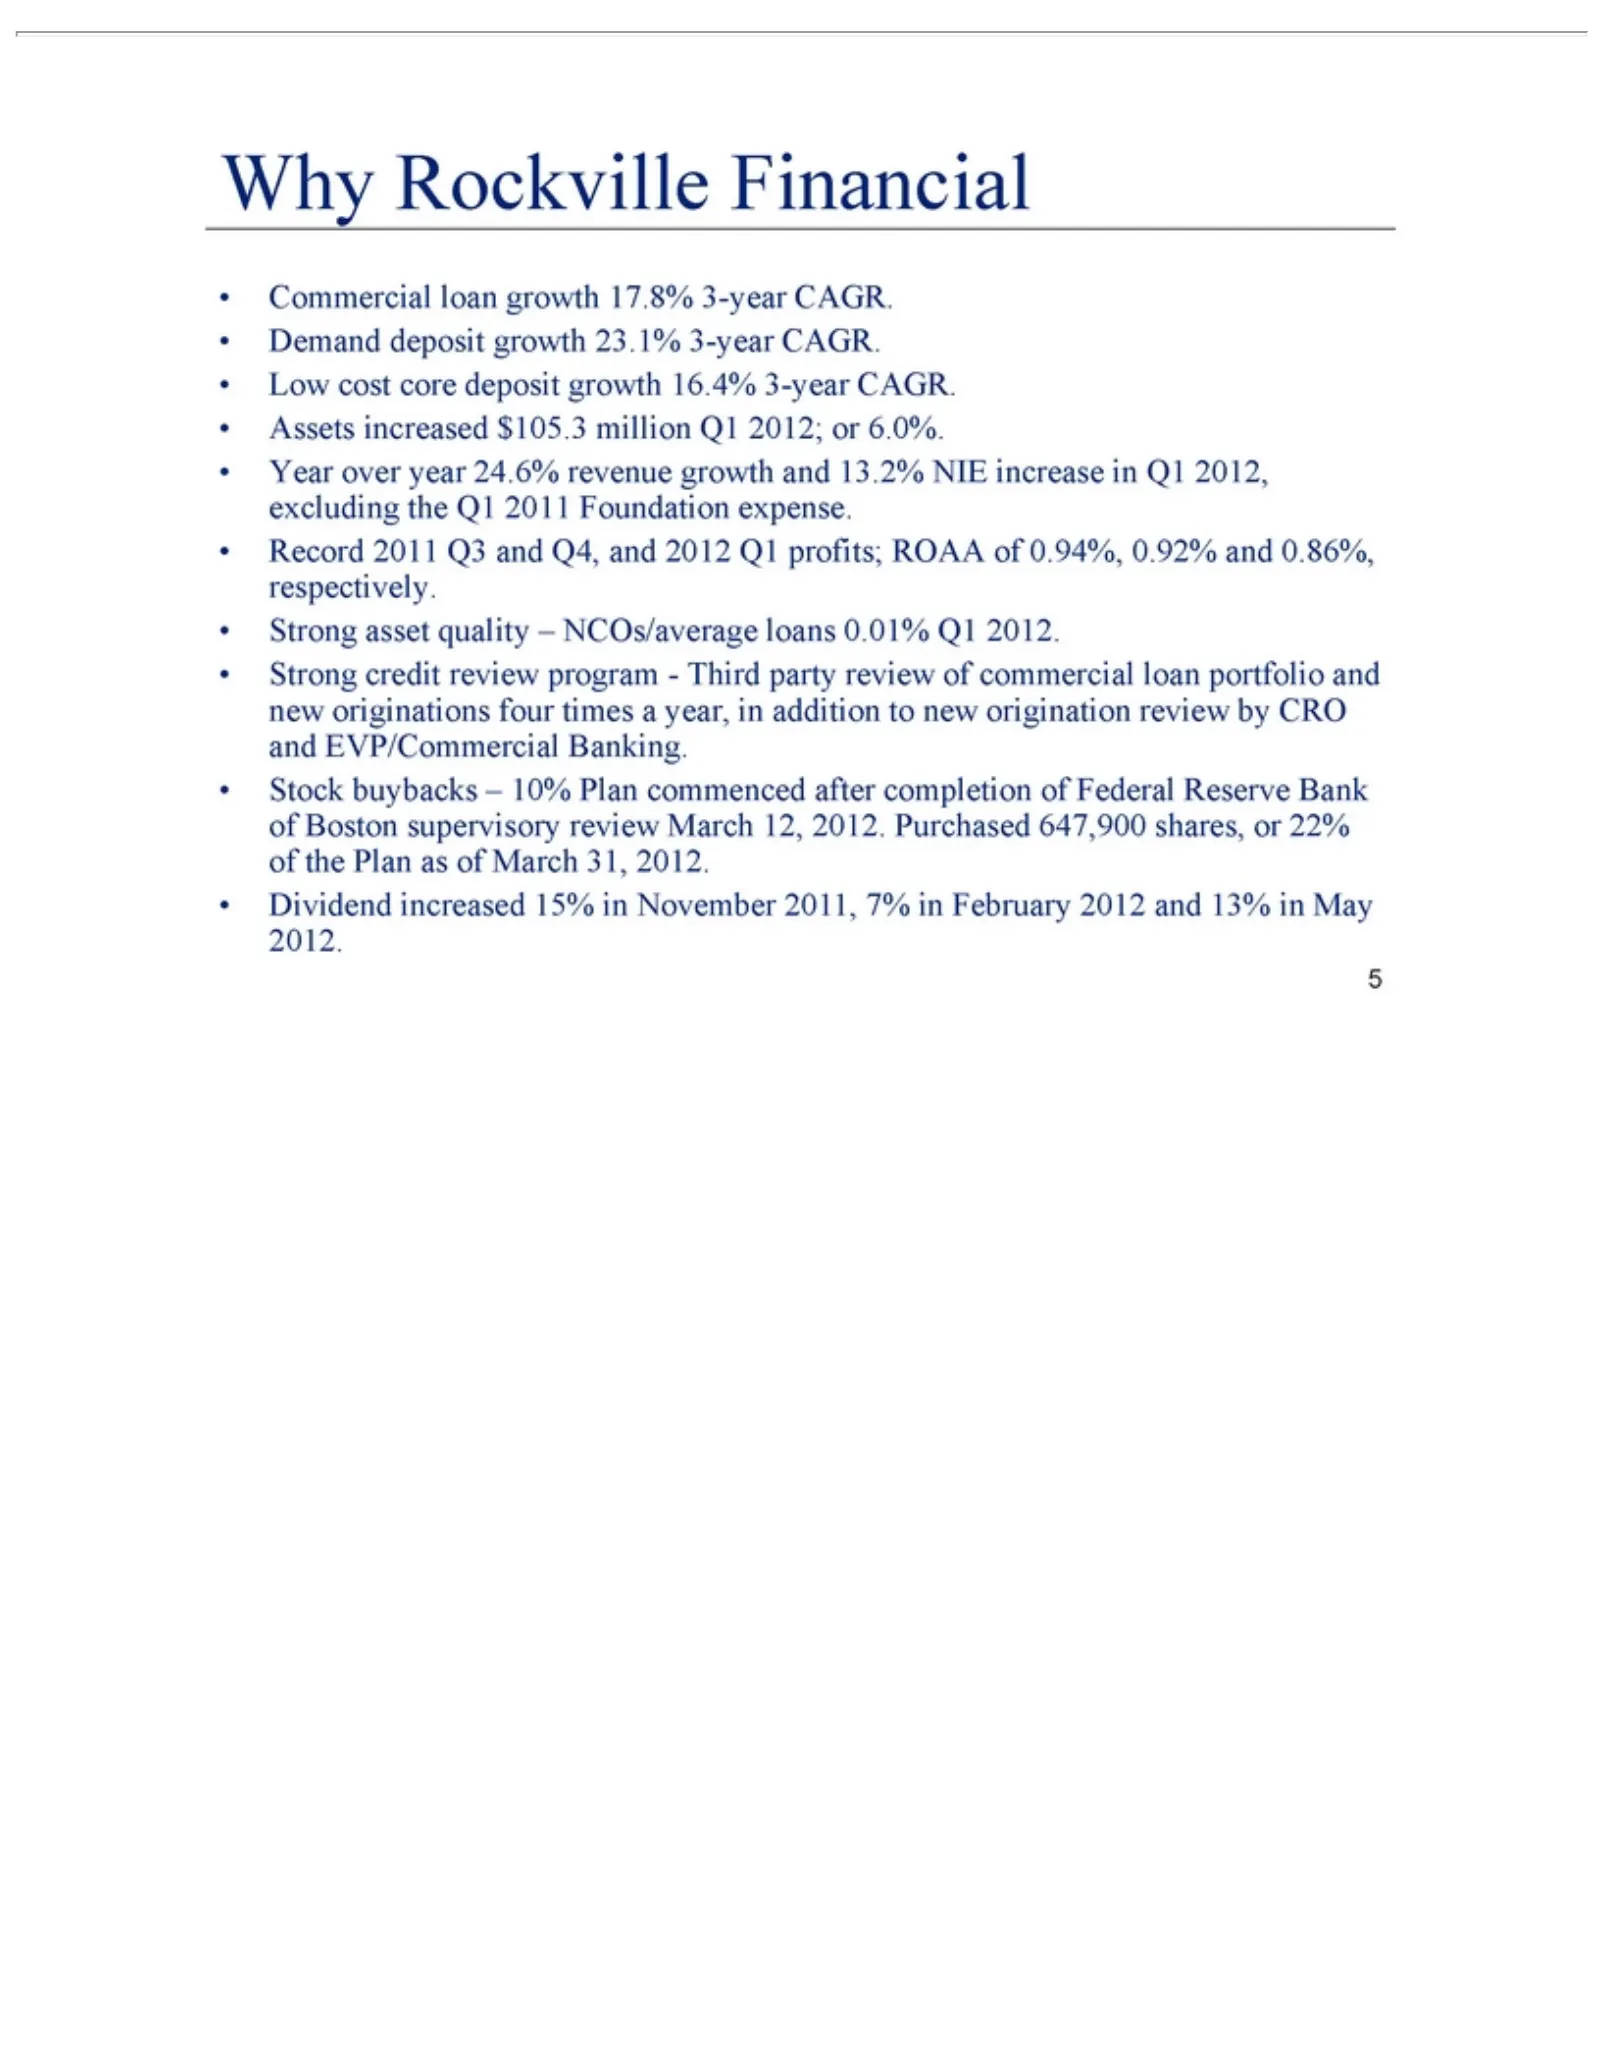
Slide 5: Why Rockville Financial
Why over Commercial Year Record Strong Stock Dividend 5 Rockville buybacks asset credit 2011 increased year quality loan Q3 review 24.6% Financial ±and growth 10% 15% ±program—Third Q4, revenue NCOs/average Plan in and 17.8% November commenced 2012 growth 3-year Q1loans party and 2011, profits; CAGR
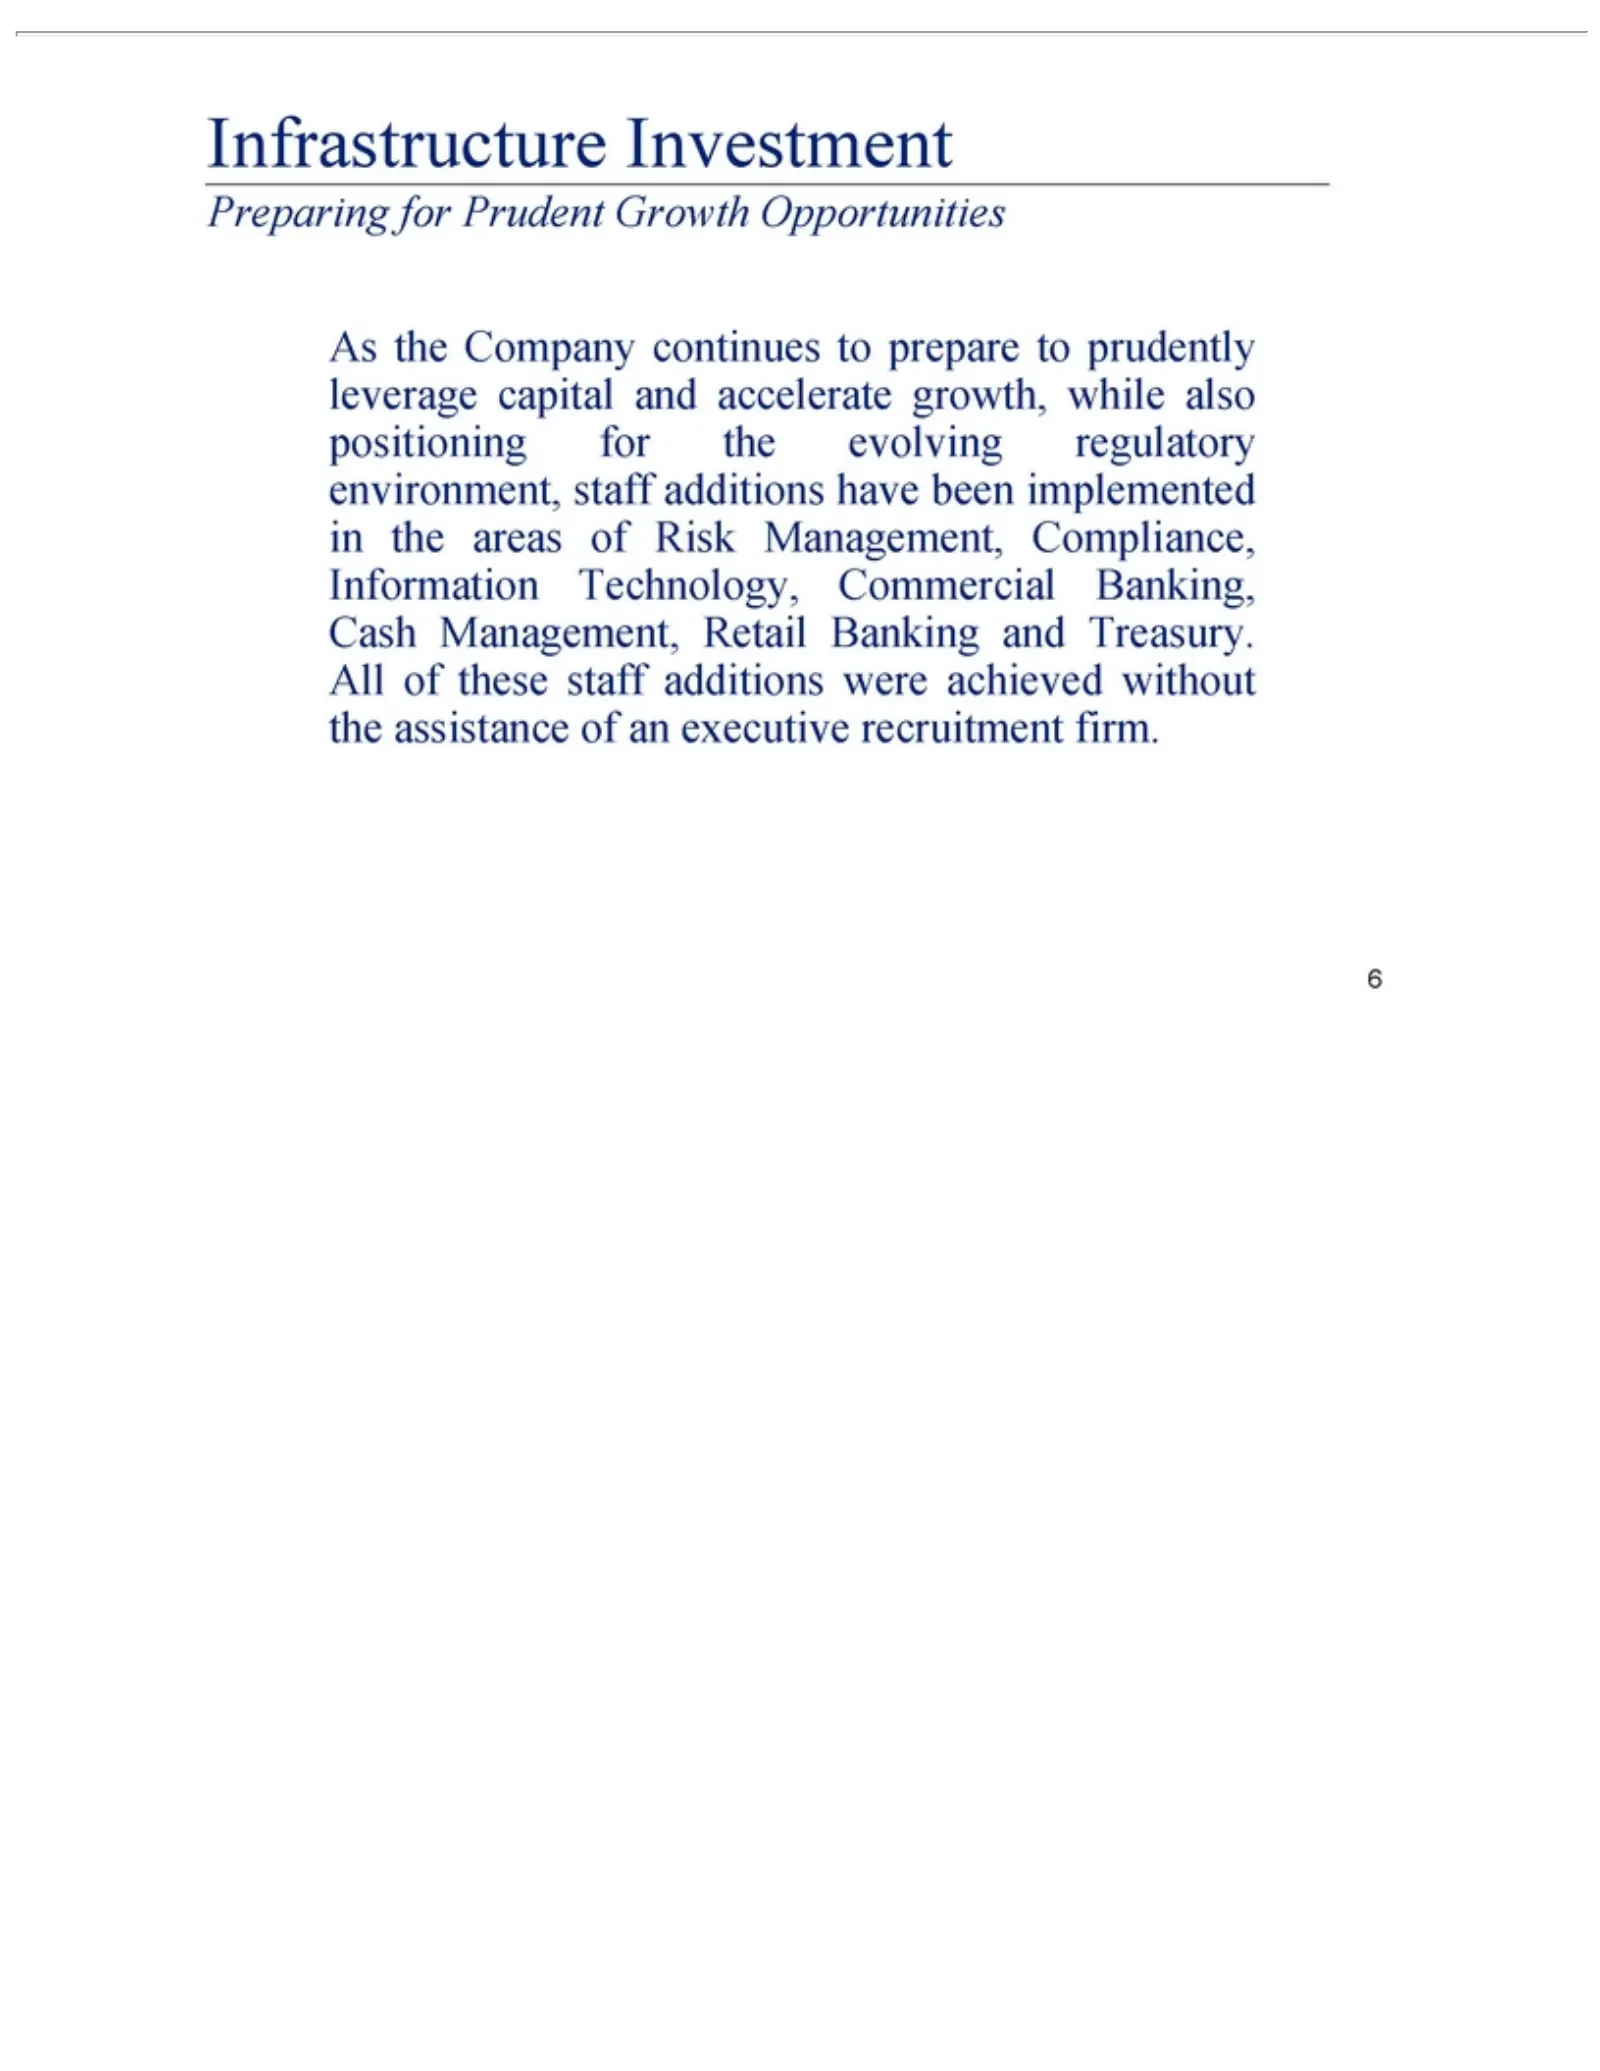
Slide 6: Infrastructure: Preparing for Prudent Growth
Infrastructure Preparing As areas assistance 6 theofCompany Risk for of an Management, Prudent Investment executive continues Growth recruitment to Compliance, prepare Opportunities to firm. prudently Information leverage Technology, capitalCommercial and accelerate Banking, growth,Cash whileManagem
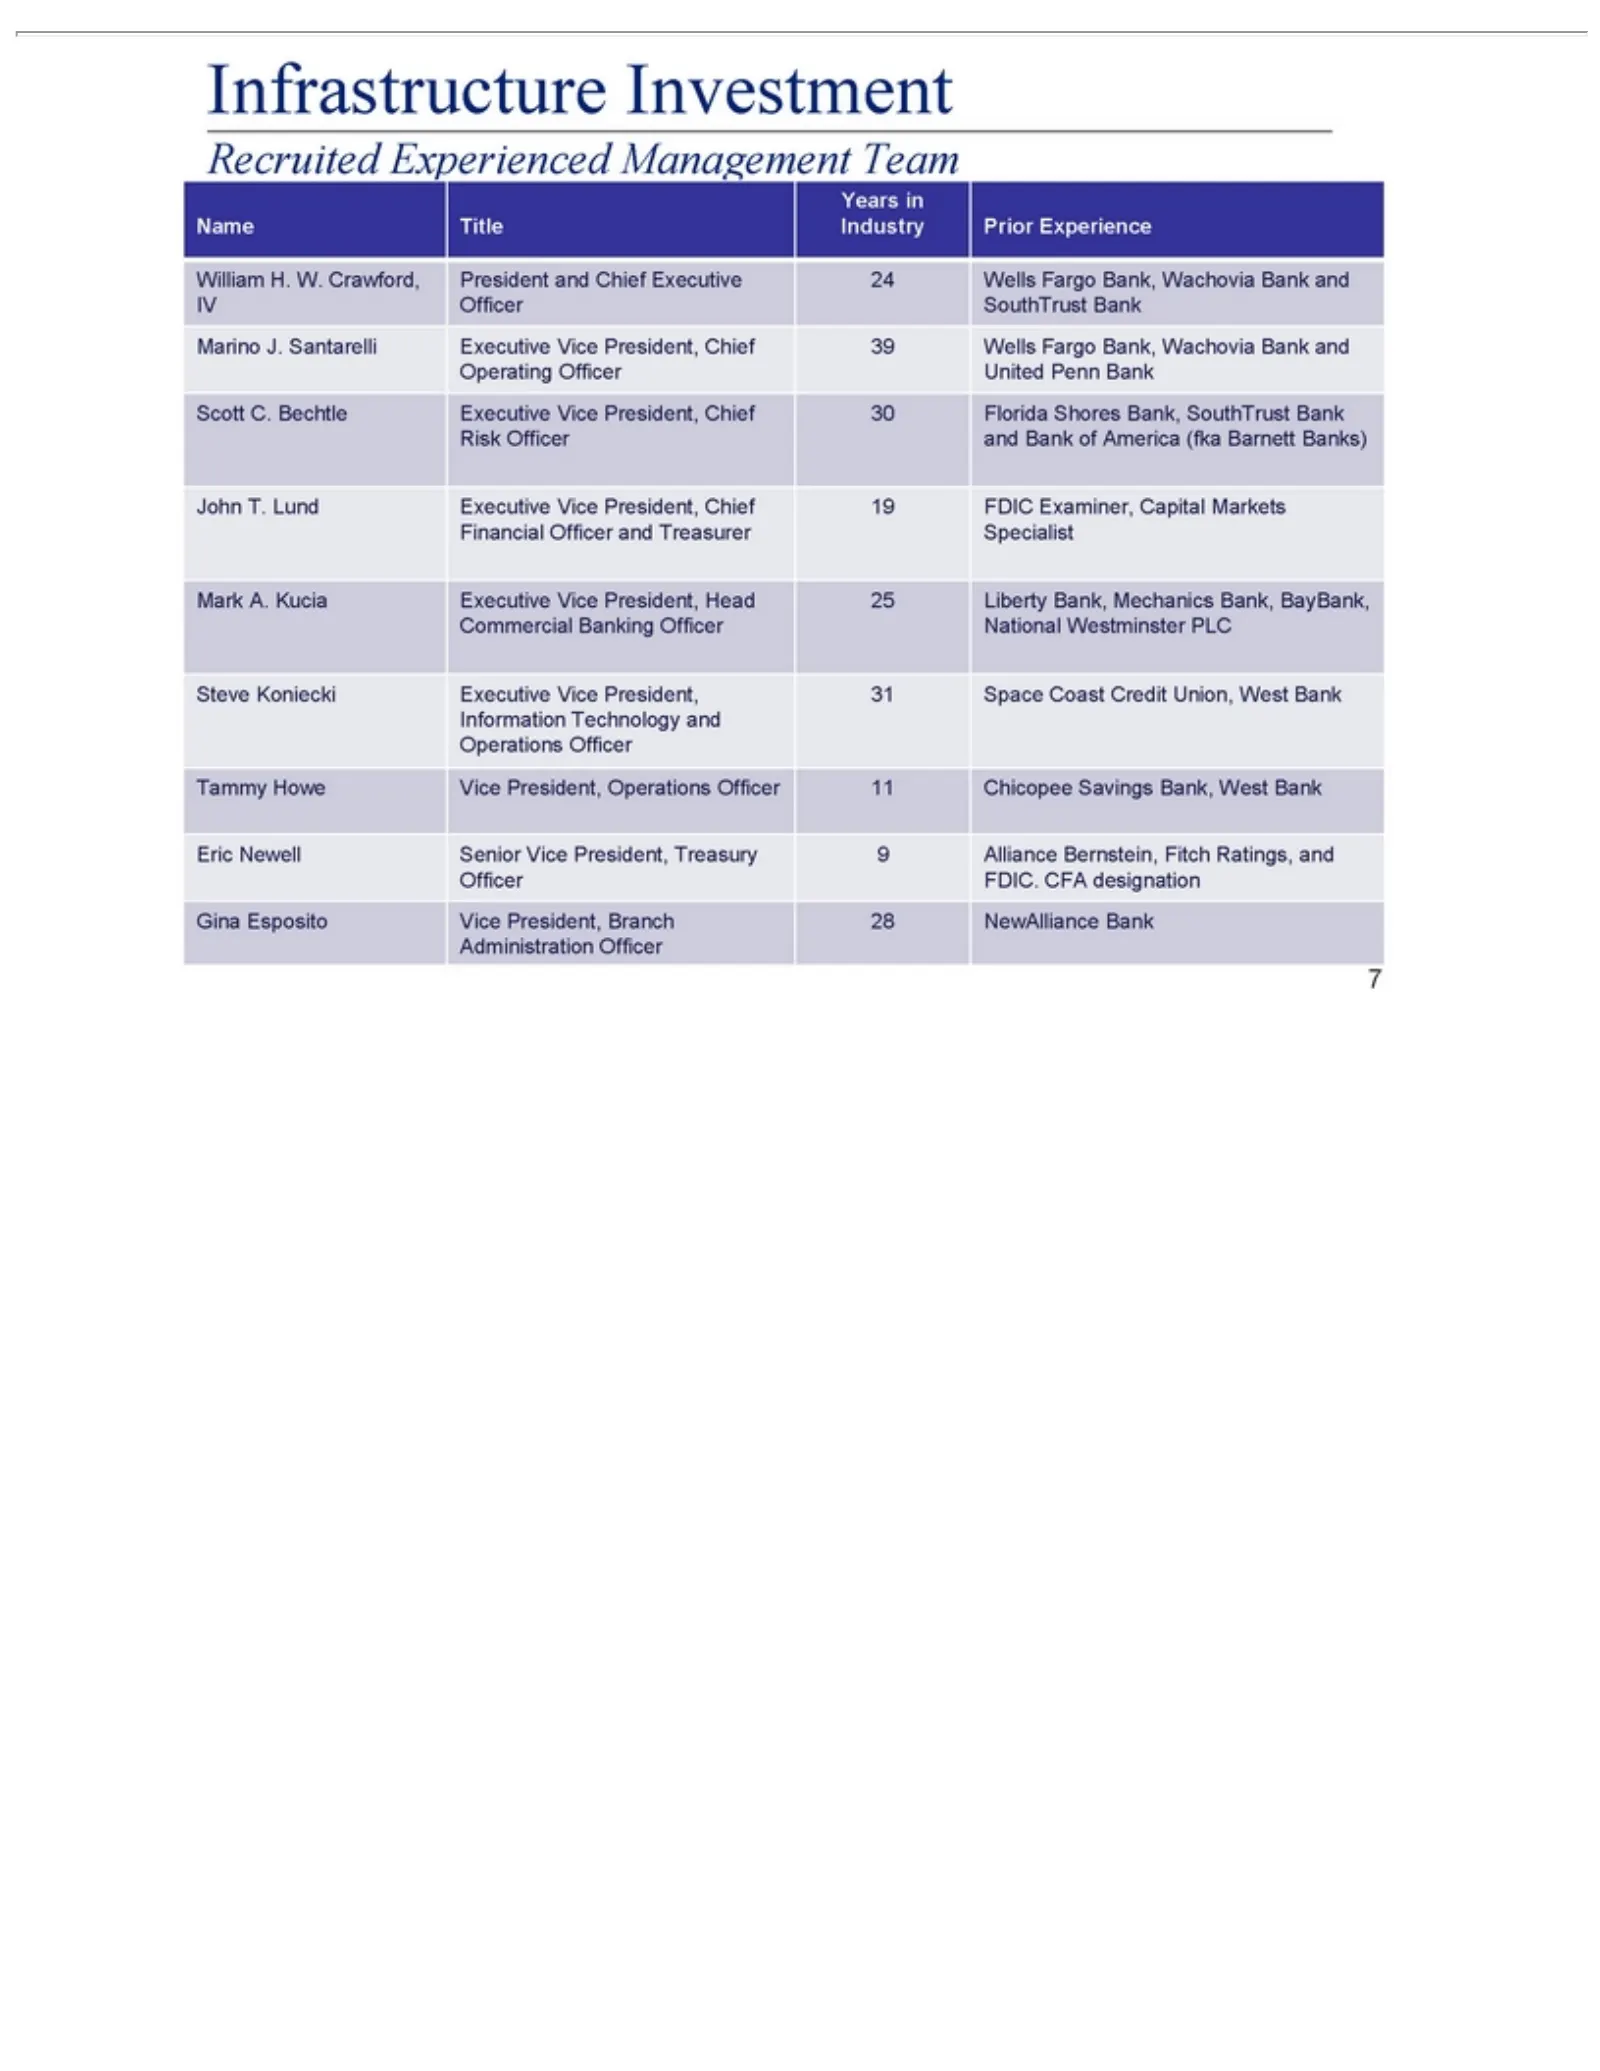
Slide 7: Infrastructure: Recruited Executive Team
Infrastructure Recruited Years Name William IV Marino Operating Scott Risk John Financial Mark Commercial Steve Information Operations Tammy Eric Officer Gina Administration 7 Officer Newell Officer T. Esposito C. A. Koniecki in Title FDIC. Lund J. Howe Bechtle H. Kucia Officer Santarelli Experience
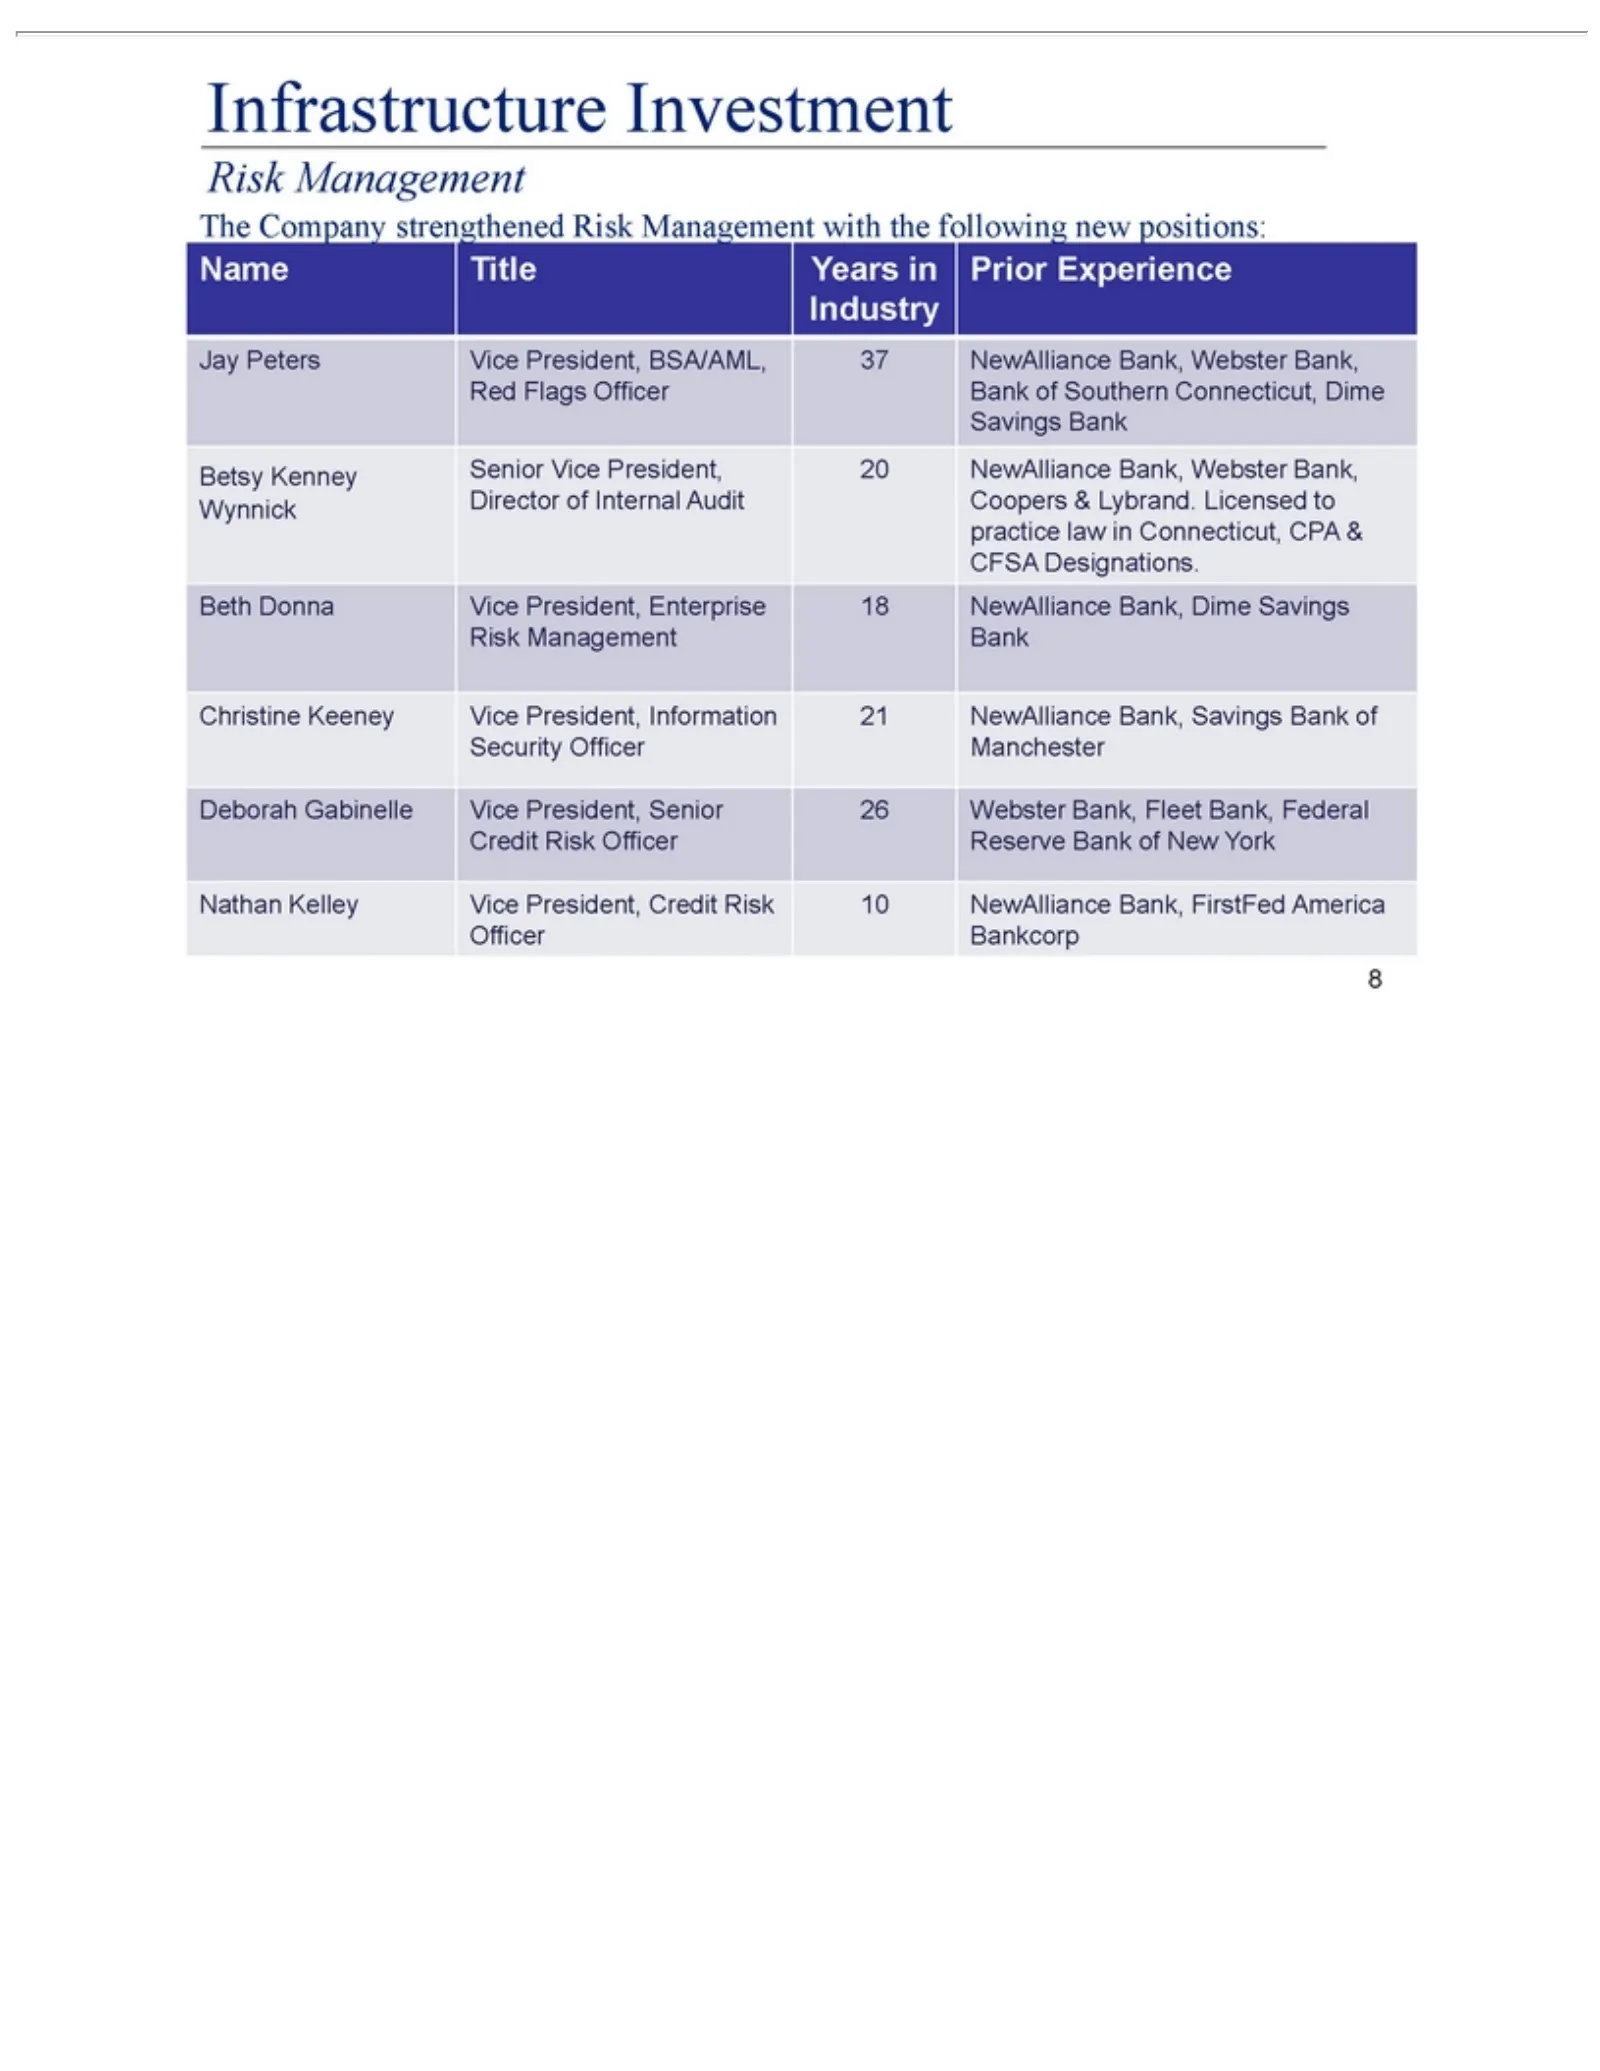
Slide 8: Infrastructure: Risk Management
Infrastructure Risk The Name Jay Betsy Beth Designations. Christine Deborah Nathan 8 Peters Company Management Donna Kenney Title Kelley Gabinelle Keeney Vice Years Vice Investment Senior strengthened Vice President, President, in Vice Vice President, Prior Vice President, President, Experience BSA/
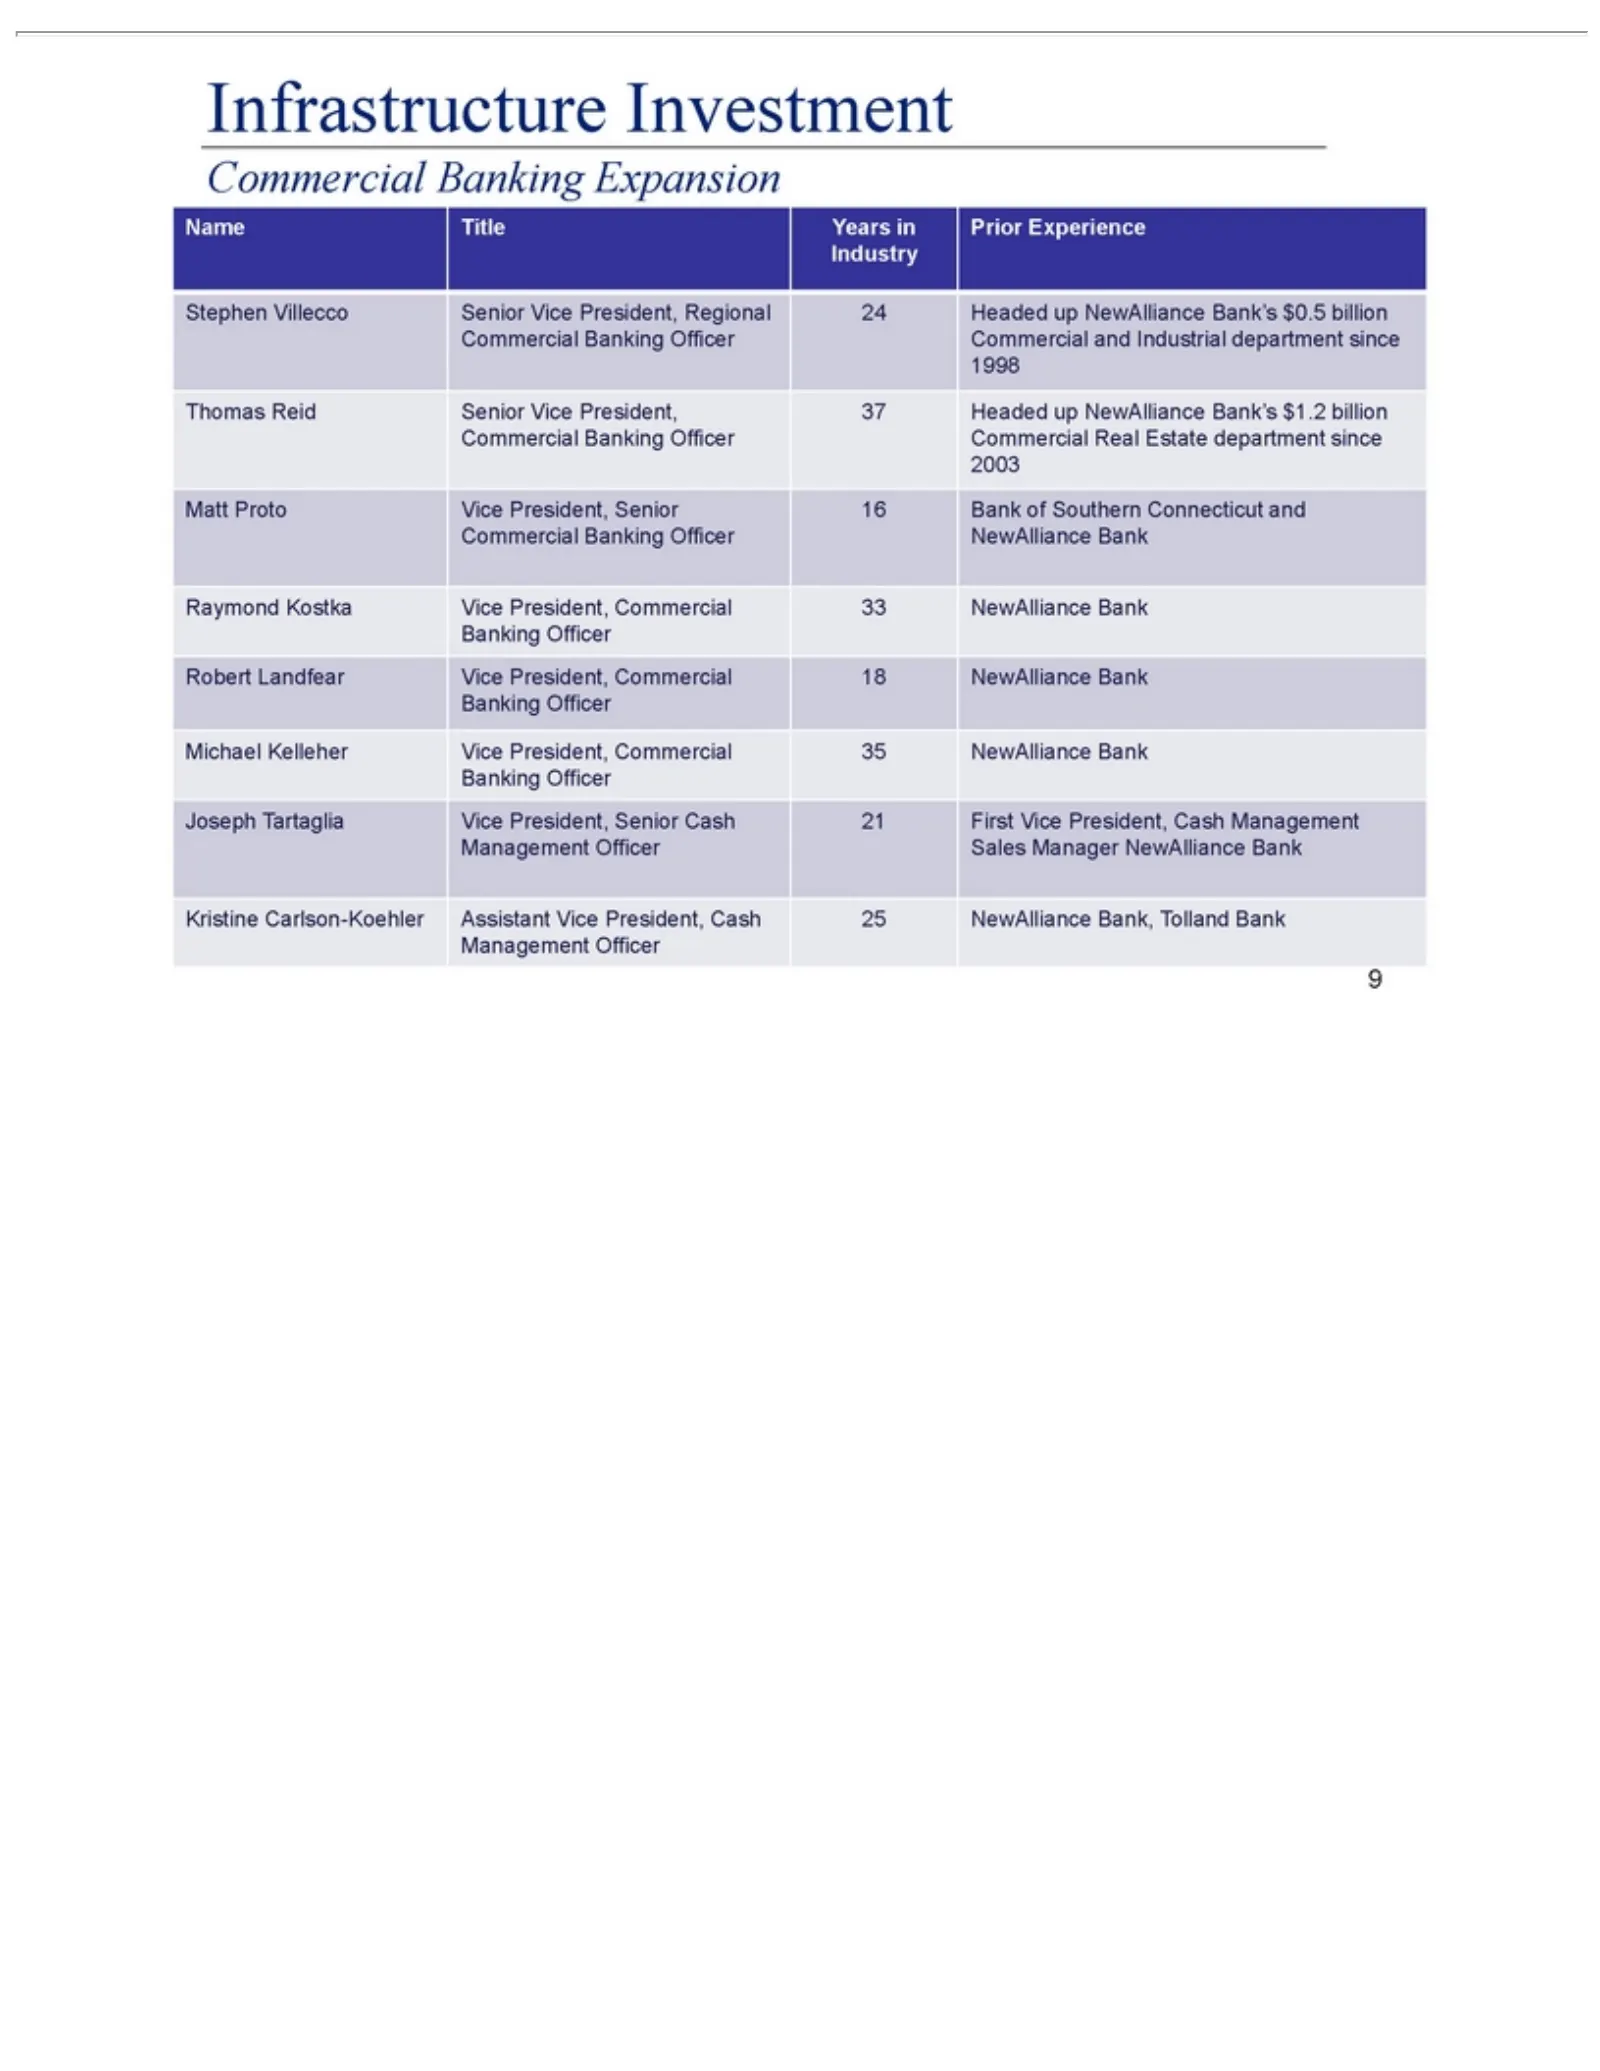
Slide 9: Infrastructure: Commercial Banking
Infrastructure Name Stephen Industry Thomas Matt Commercial Raymond Robert Michael Banking Joseph Kristine Management Proto Title Tartaglia Landfear Villecco Reid Carlson-Koehler Kelleher Officer Kostka Vice Years Banking Officer Senior Investment President, Vice Senior in Vice Prior Vice Sales Pres
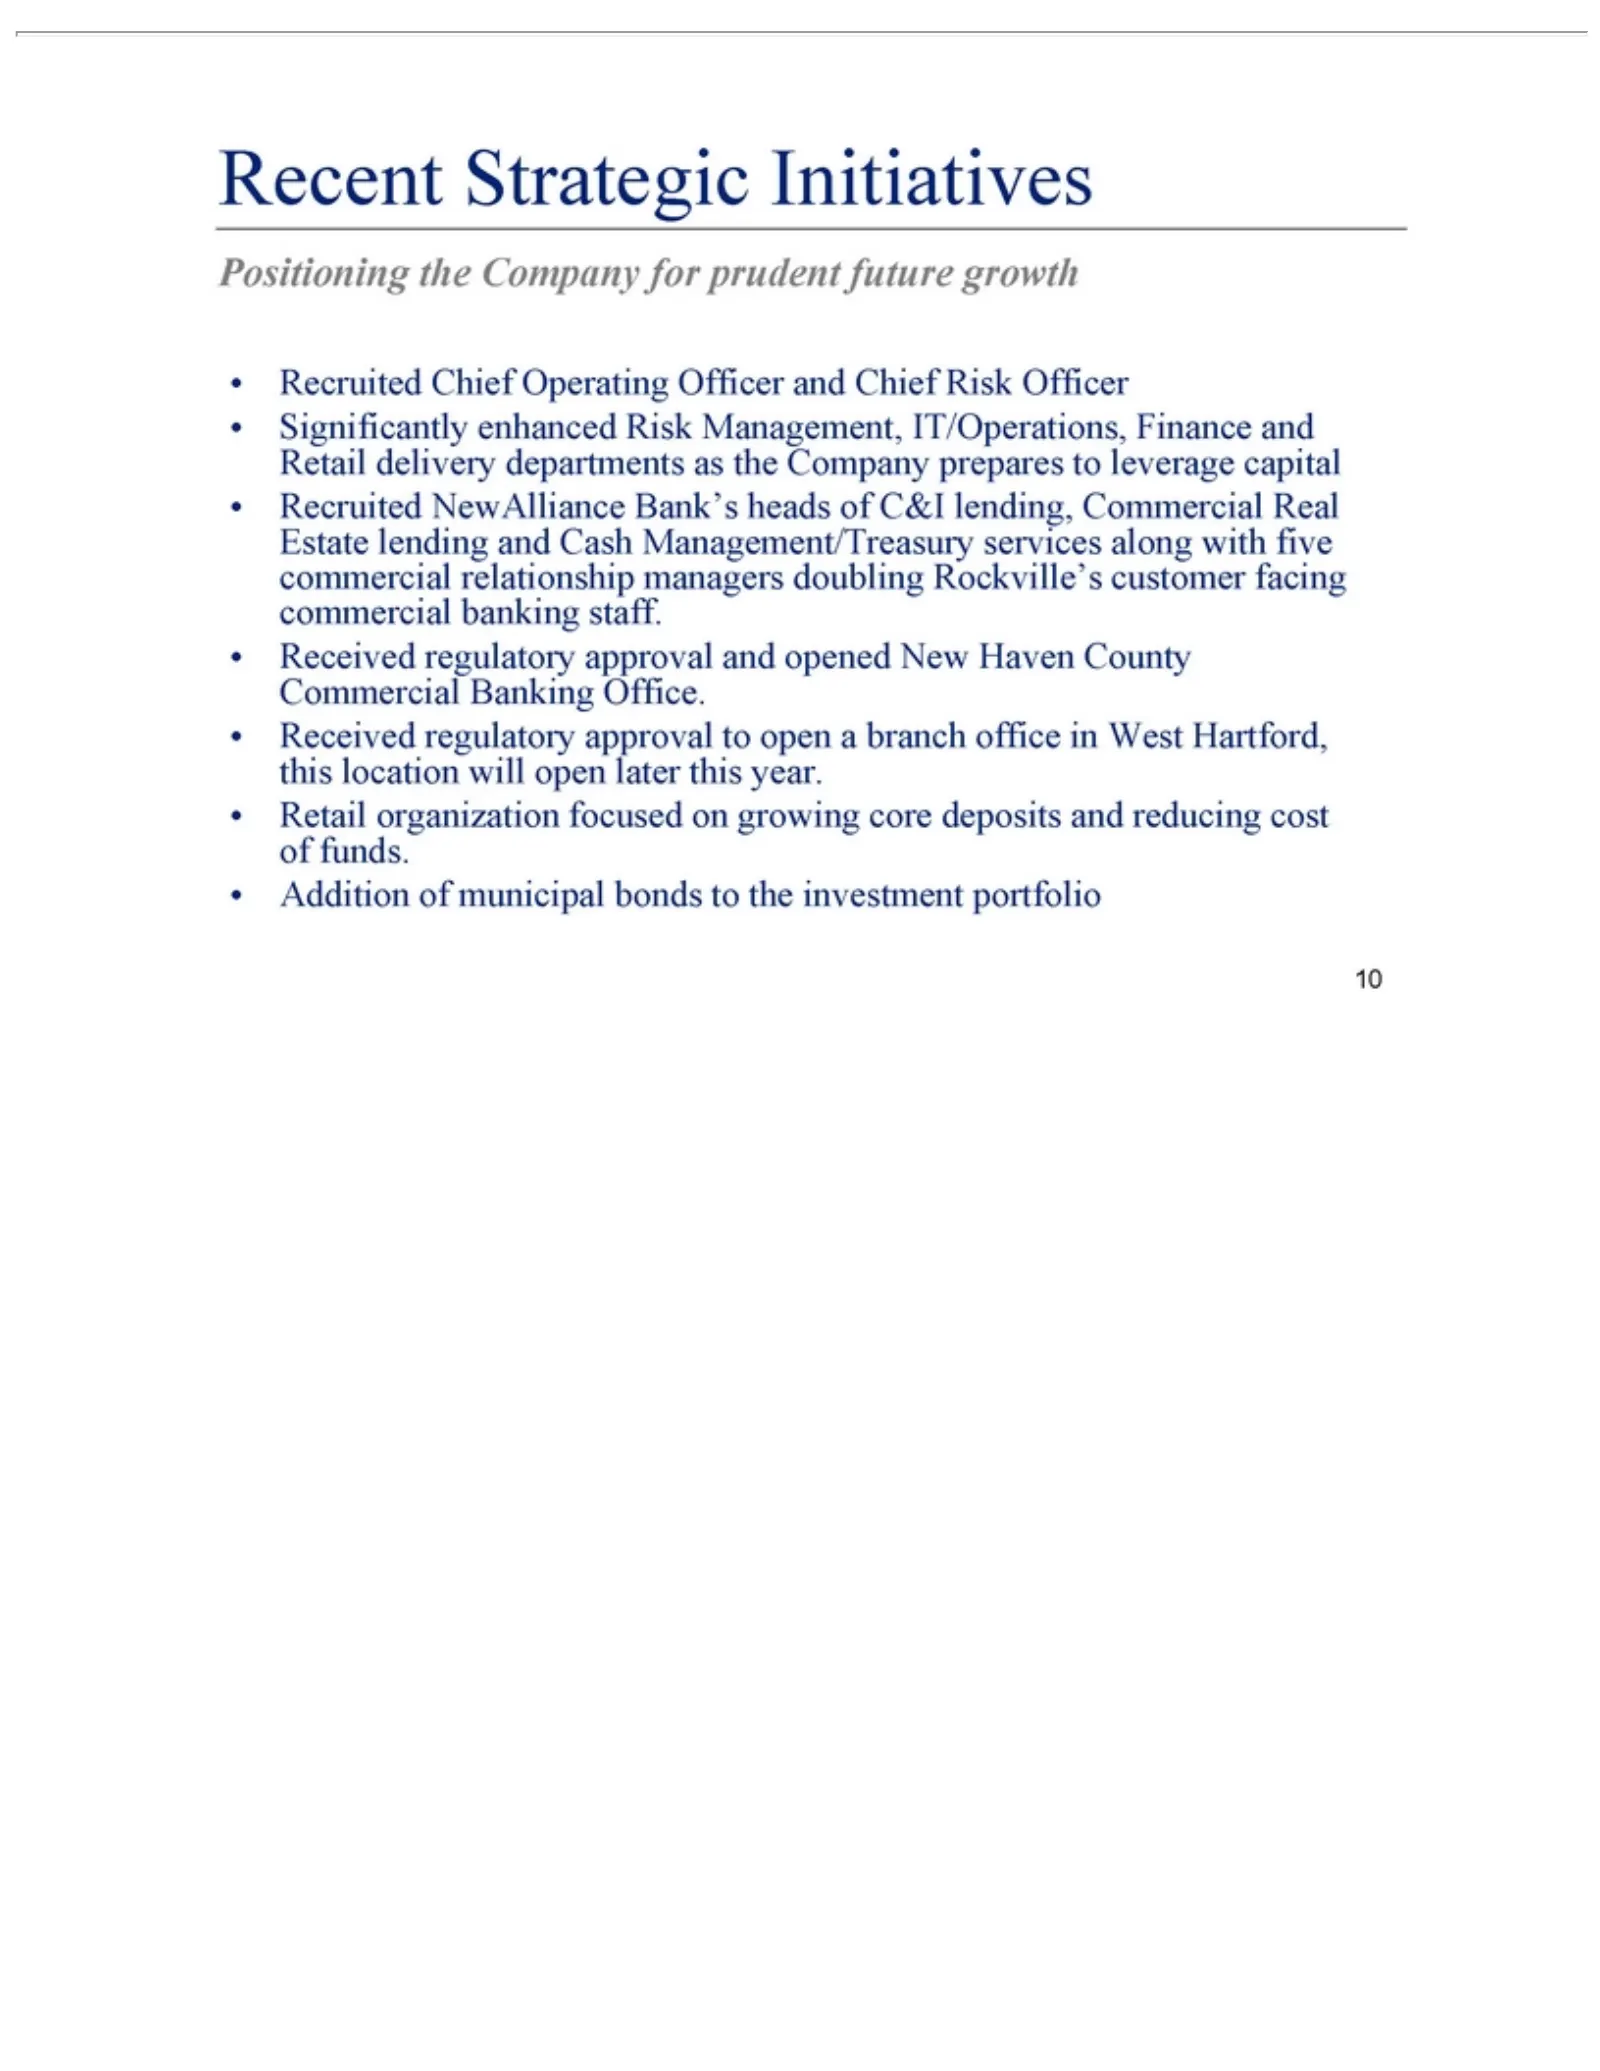
Slide 10: Recent Strategic Initiatives
Recent Recruited Positioning Recruited capital Commercial reducing 10 Strategic cost Chief the Banking ofCompany Operating funds. Initiatives NewAlliance Office. Addition for Officer prudent Received Estate ofand municipal future lending Chief regulatory growth Risk bonds and approval Cash Officer t
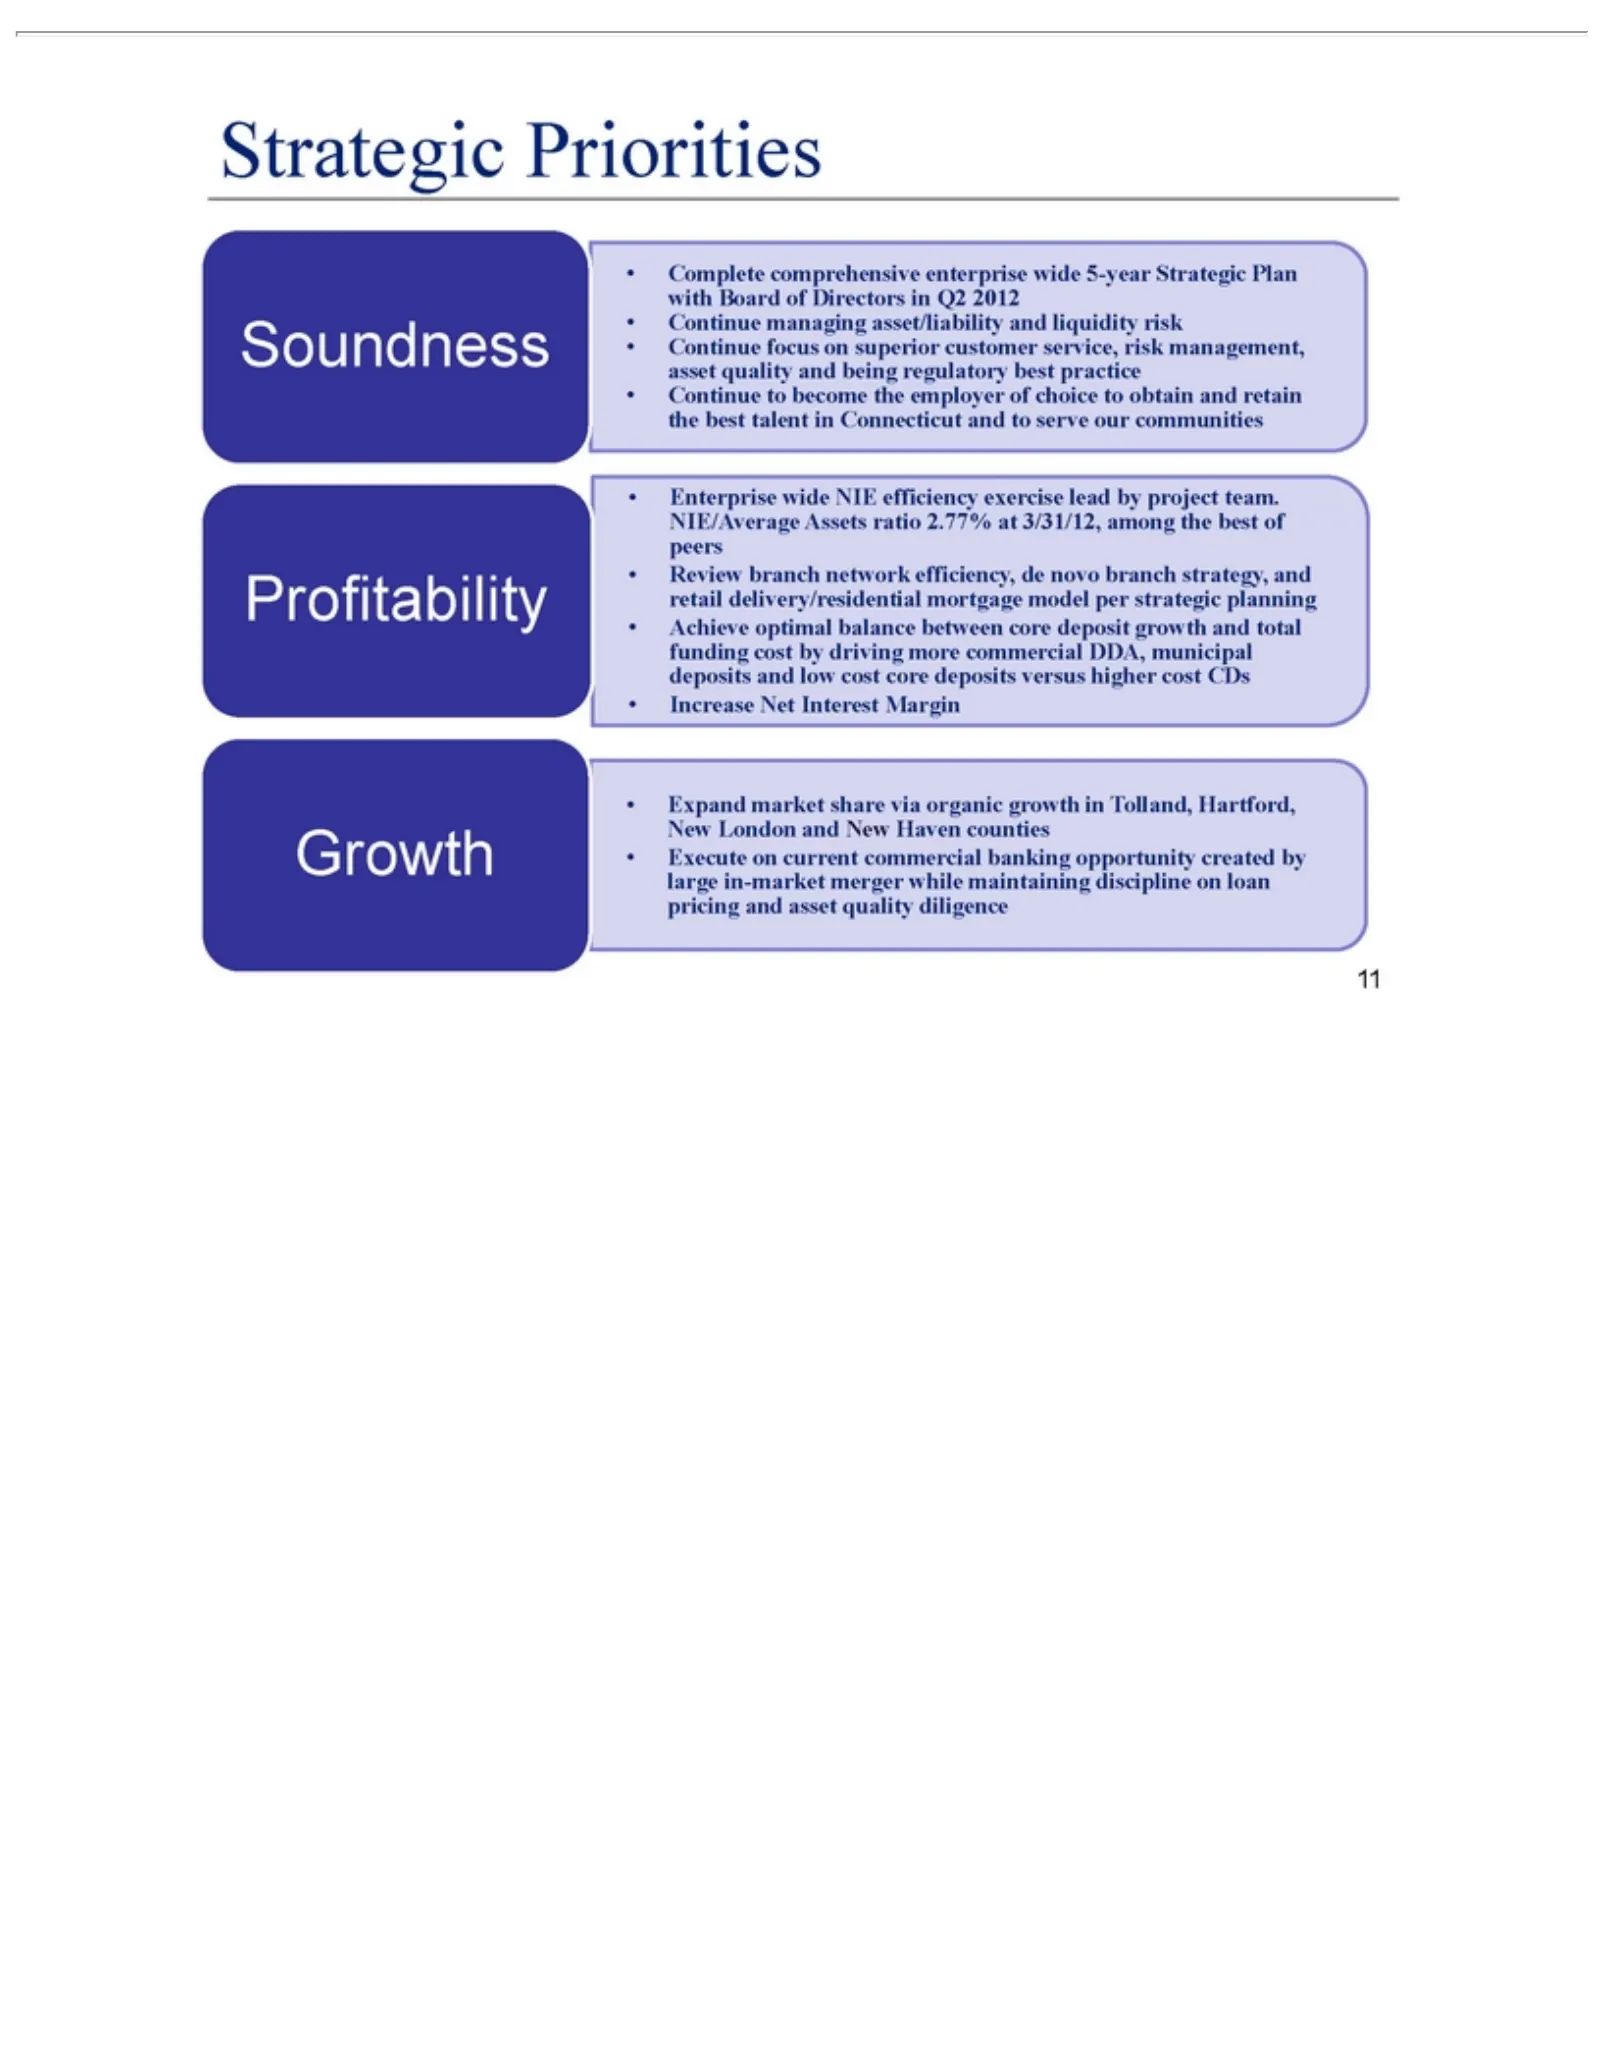
Slide 11: Strategic Priorities
Strategic Complete Soundness risk Enterprise Profitability retail and Expand Growth maintaining 11 low management, delivery/residential market cost Priorities comprehensive wide discipline core share NIE deposits asset efficiency via on quality organic mortgage loan enterprise versus pricing and exe
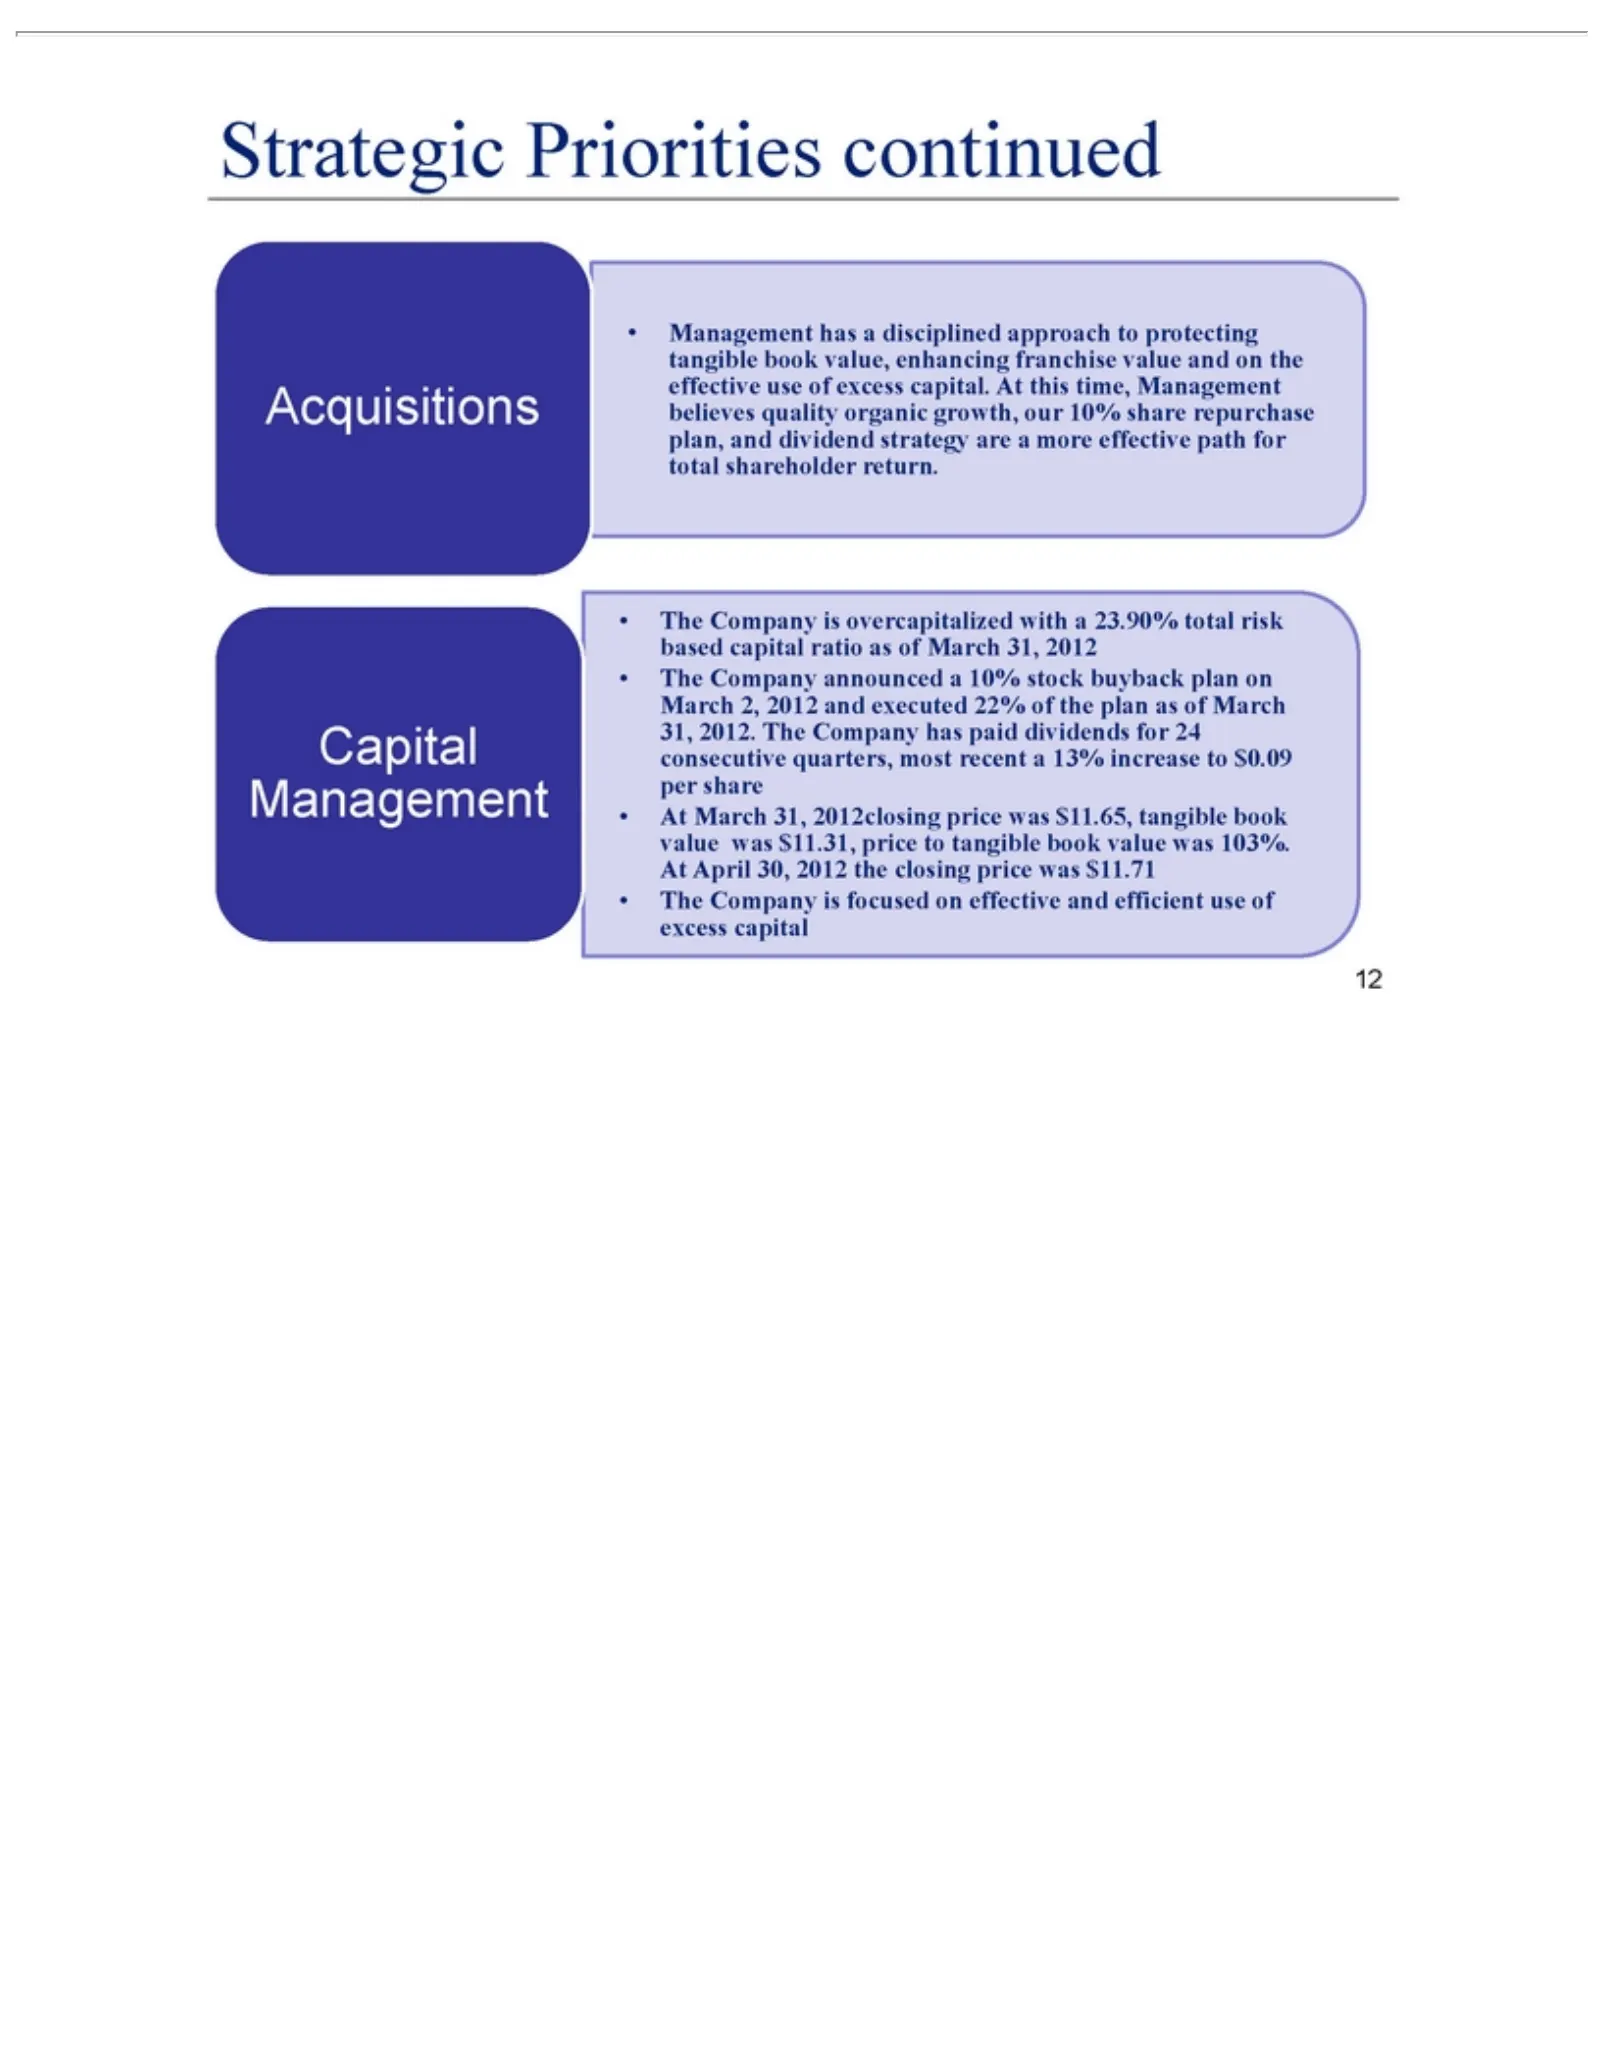
Slide 12: Strategic Priorities: Capital Management
Strategic Management Acquisitions growth, Capital The as was 12 ofCompany $11.31, March Management our Priorities 10% price 31, has is2012. overcapitalized share atocontinued disciplined tangible The repurchase Company book approach with plan, value has a 23.90% and to was paid protecting dividend 1
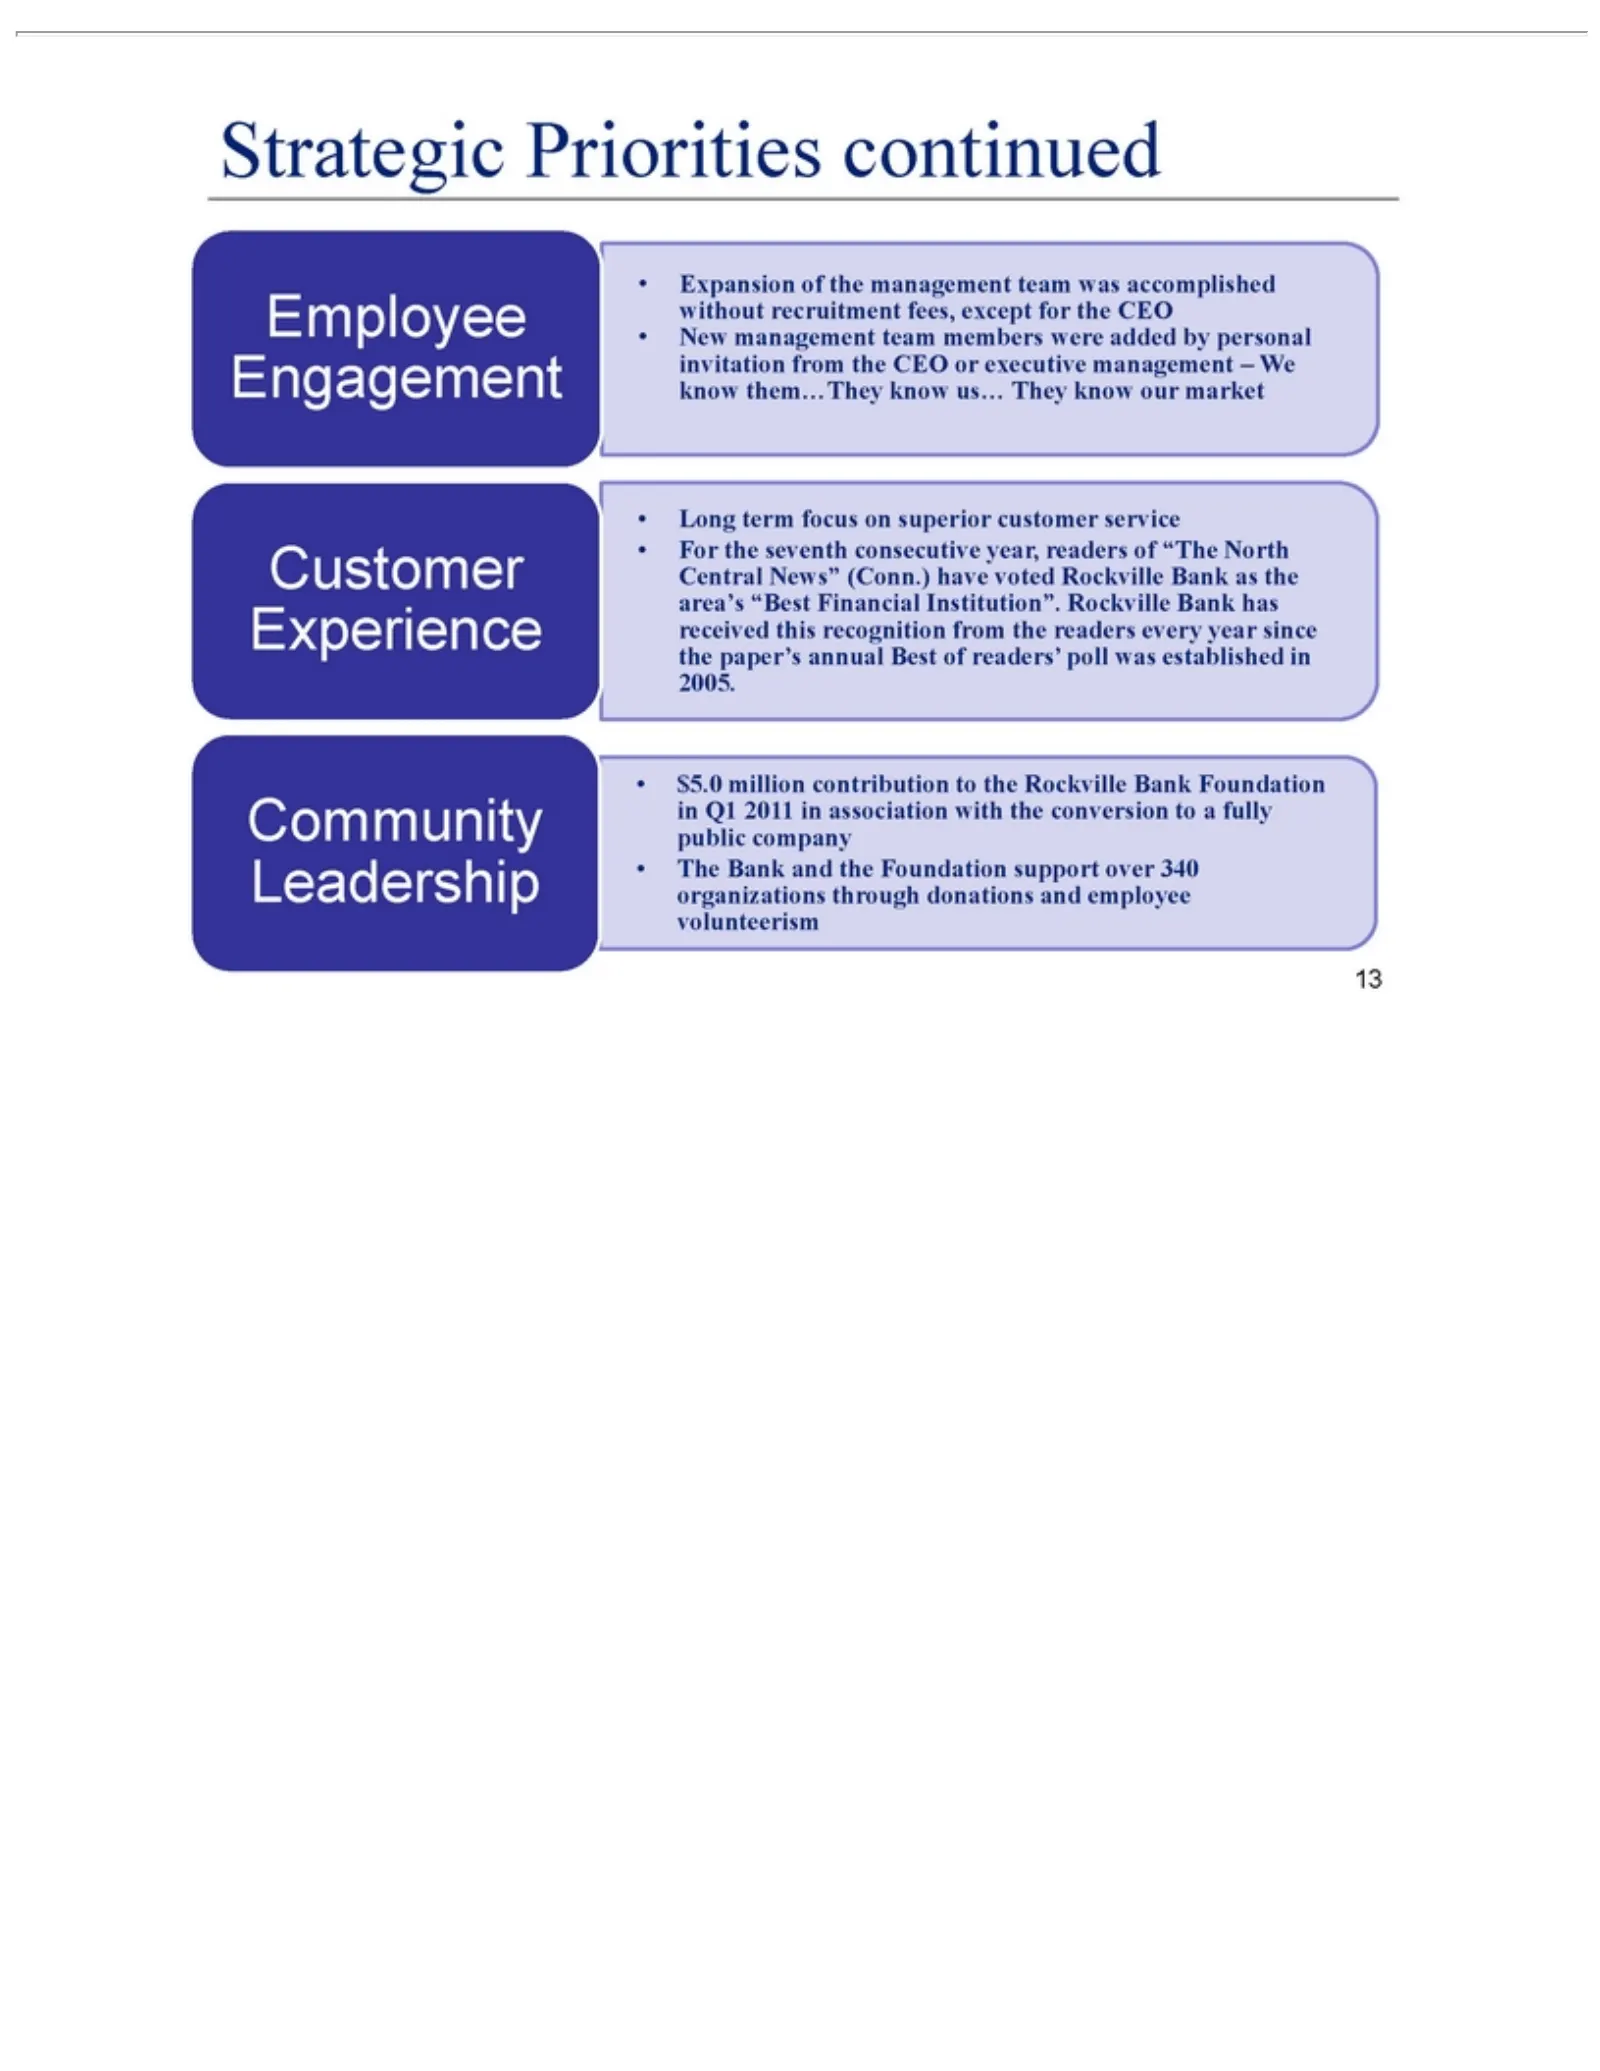
Slide 13: Strategic Priorities: Employee and Customer Engagement
Strategic Employee Expansion management Customer Long Community $5.0 through 13 million term donations Priorities Experience Engagement focus ofLeadership contribution We the on management and continued superior employee to the customer team Rockville volunteerism was service accomplished Bankreceiv
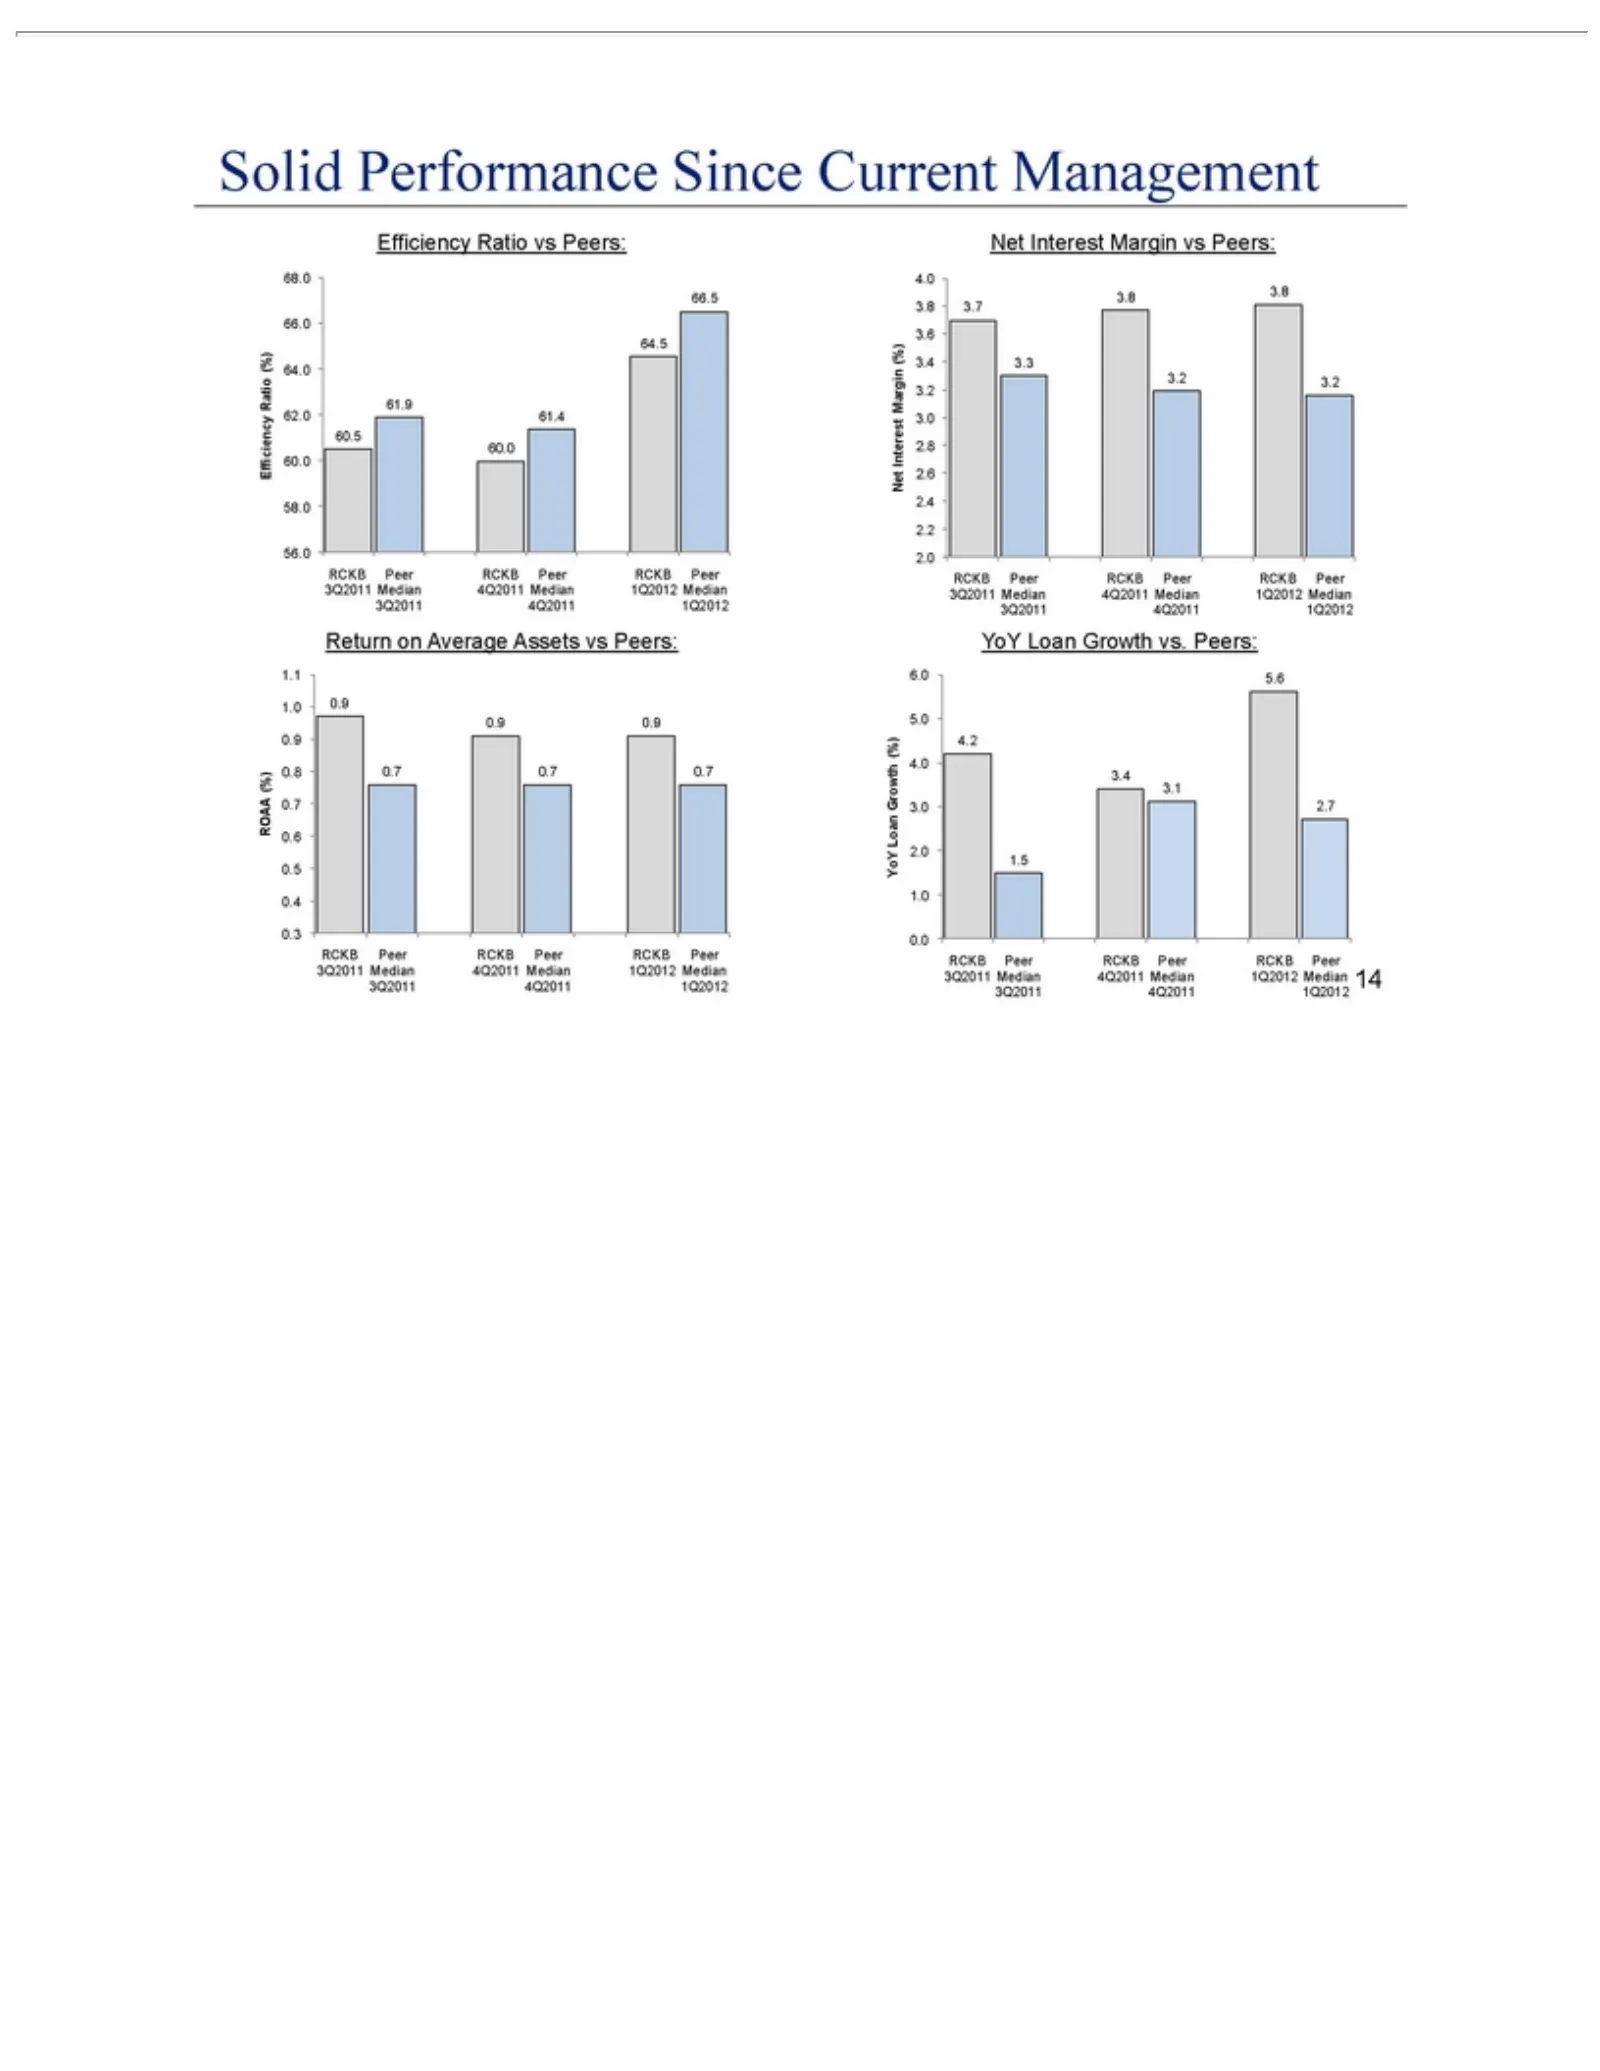
Slide 14: Solid Performance vs Peers
Solid Performance Efficiency Return RCKB 3Q2011 14 on Peer Median Average Ratio RCKB4Q2011 vsAssets Since Peers: Peer RCKB Median Current vs NetPeers: Interest Peer 1Q2012 Management YoYMargin Loan Median Growth vs Peers: RCKBvs. Peer Peers: RCKB Peer RCKB Peer 3Q2011 4Q2011 1Q2012 3Q2011 Median 4Q2
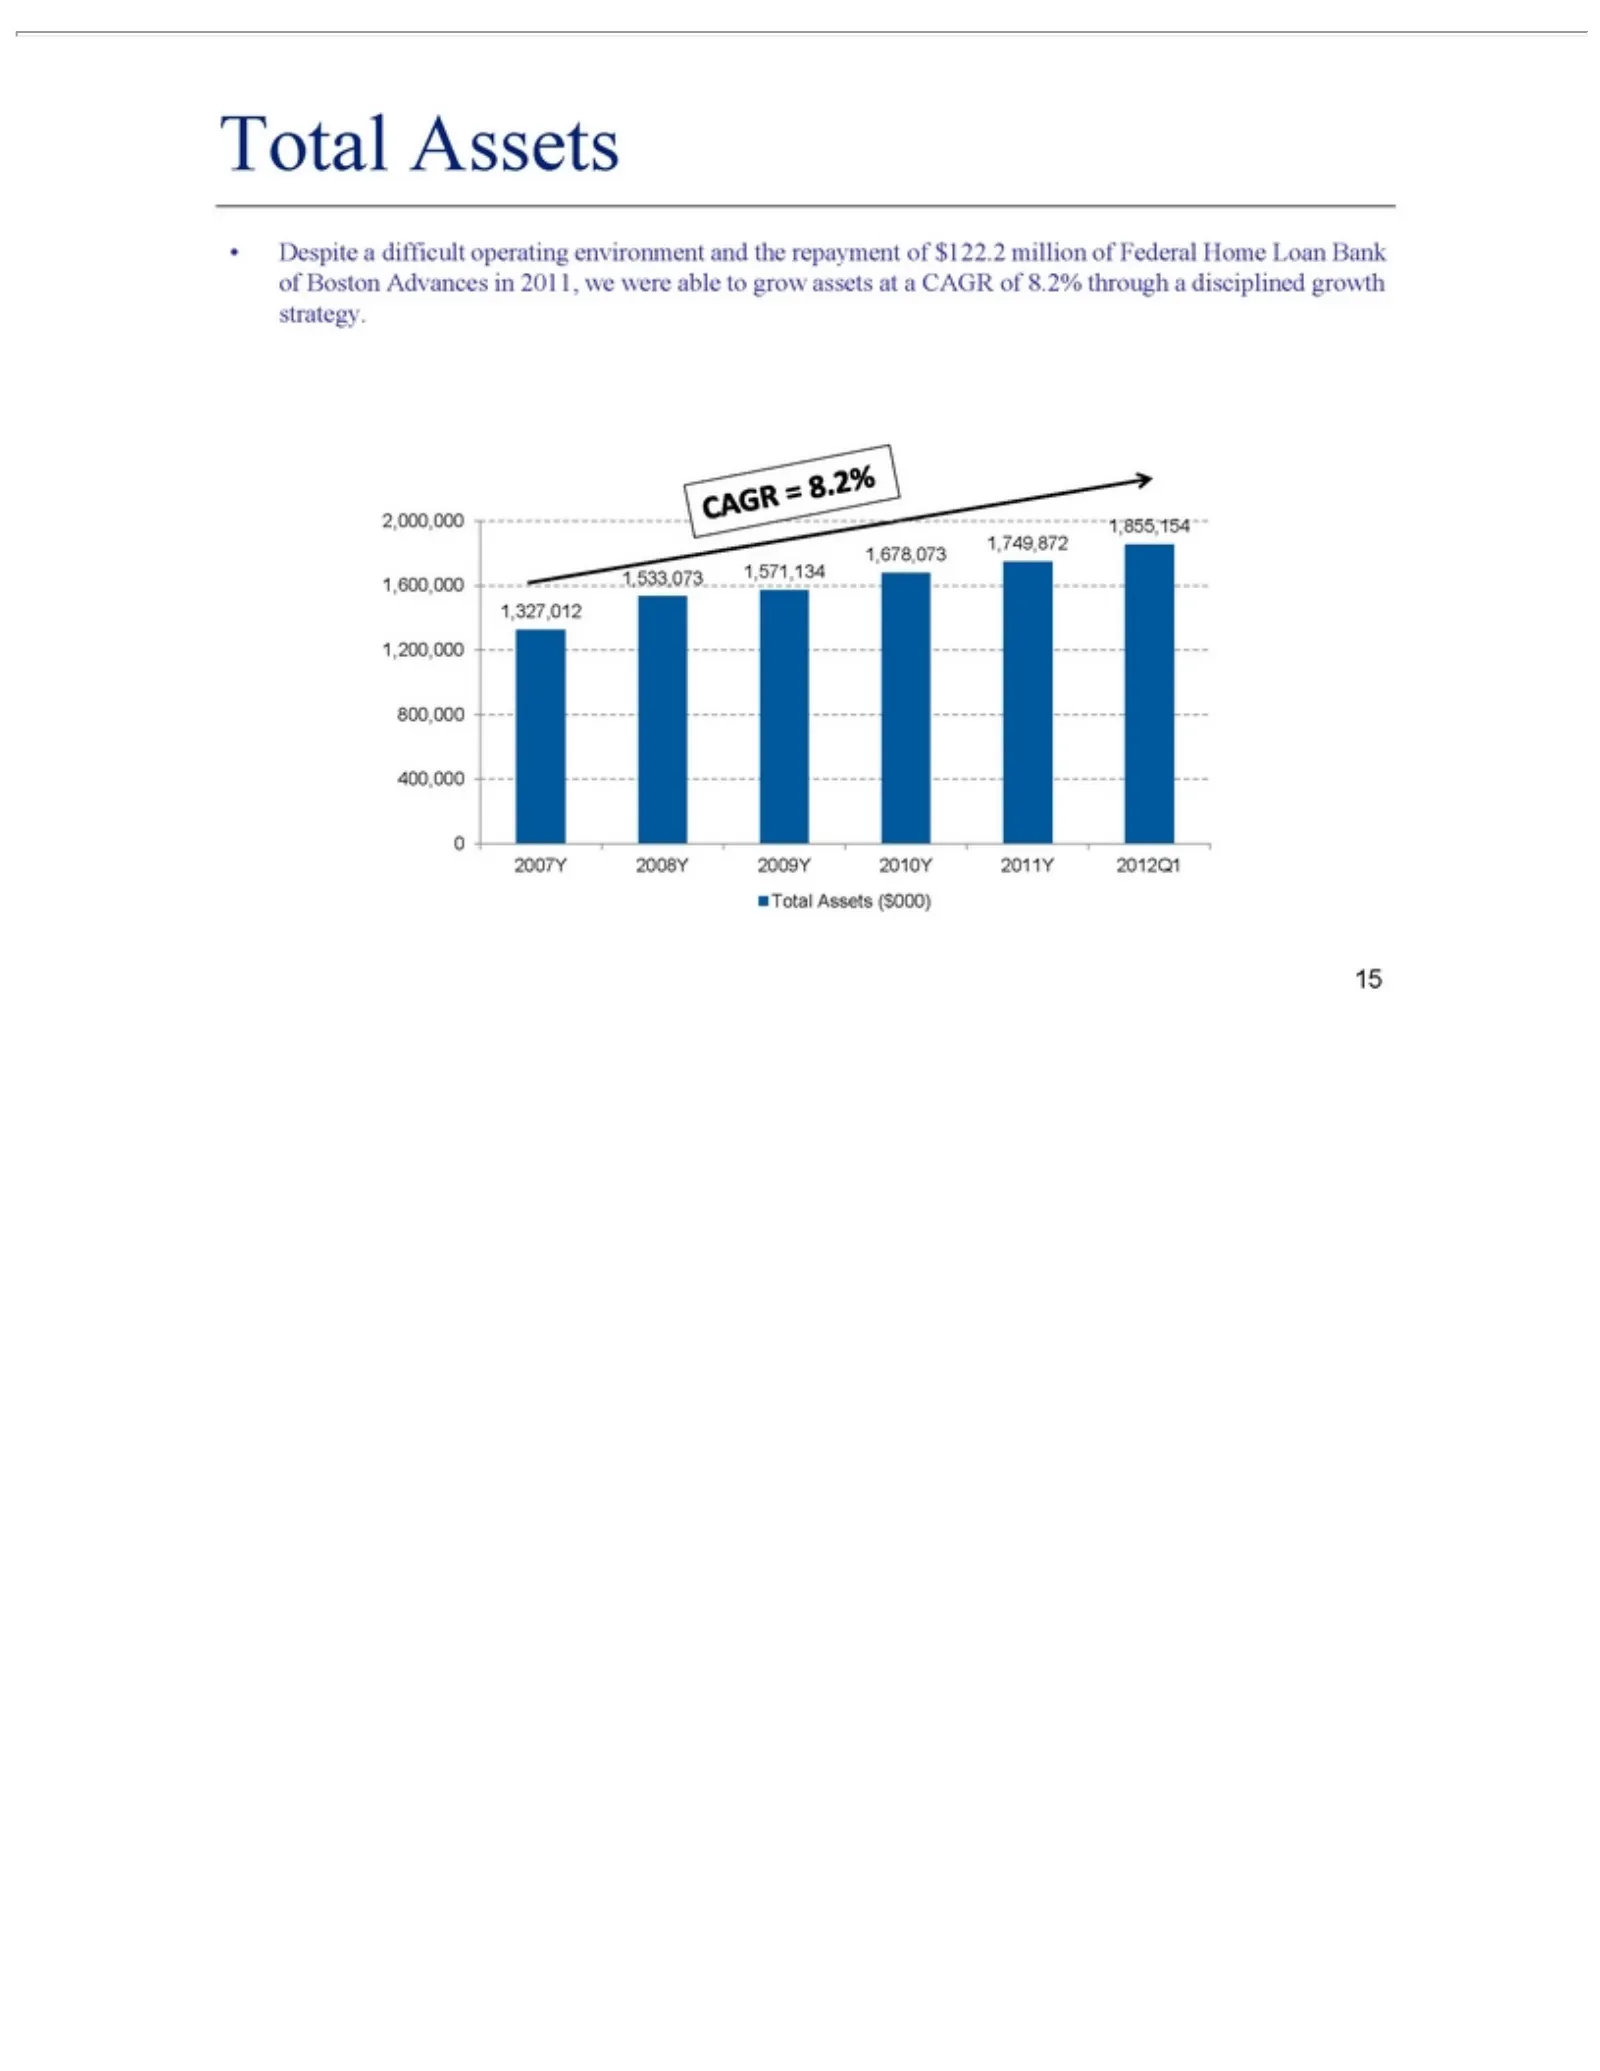
Slide 15: Total Assets Growth
Despite disciplined 2,000,000 2007Y Total 15 Assets 2008Y a difficult 1,600,000 growth ($000) 2009Yoperating strategy. 1,200,000 2010Yenvironment 2011Y 800,000 2012Q1 400,000 and the 0repayment of $122.2 million of Federal Home Loan Bank of Boston Advances in 2011, we were able to grow assets at a C
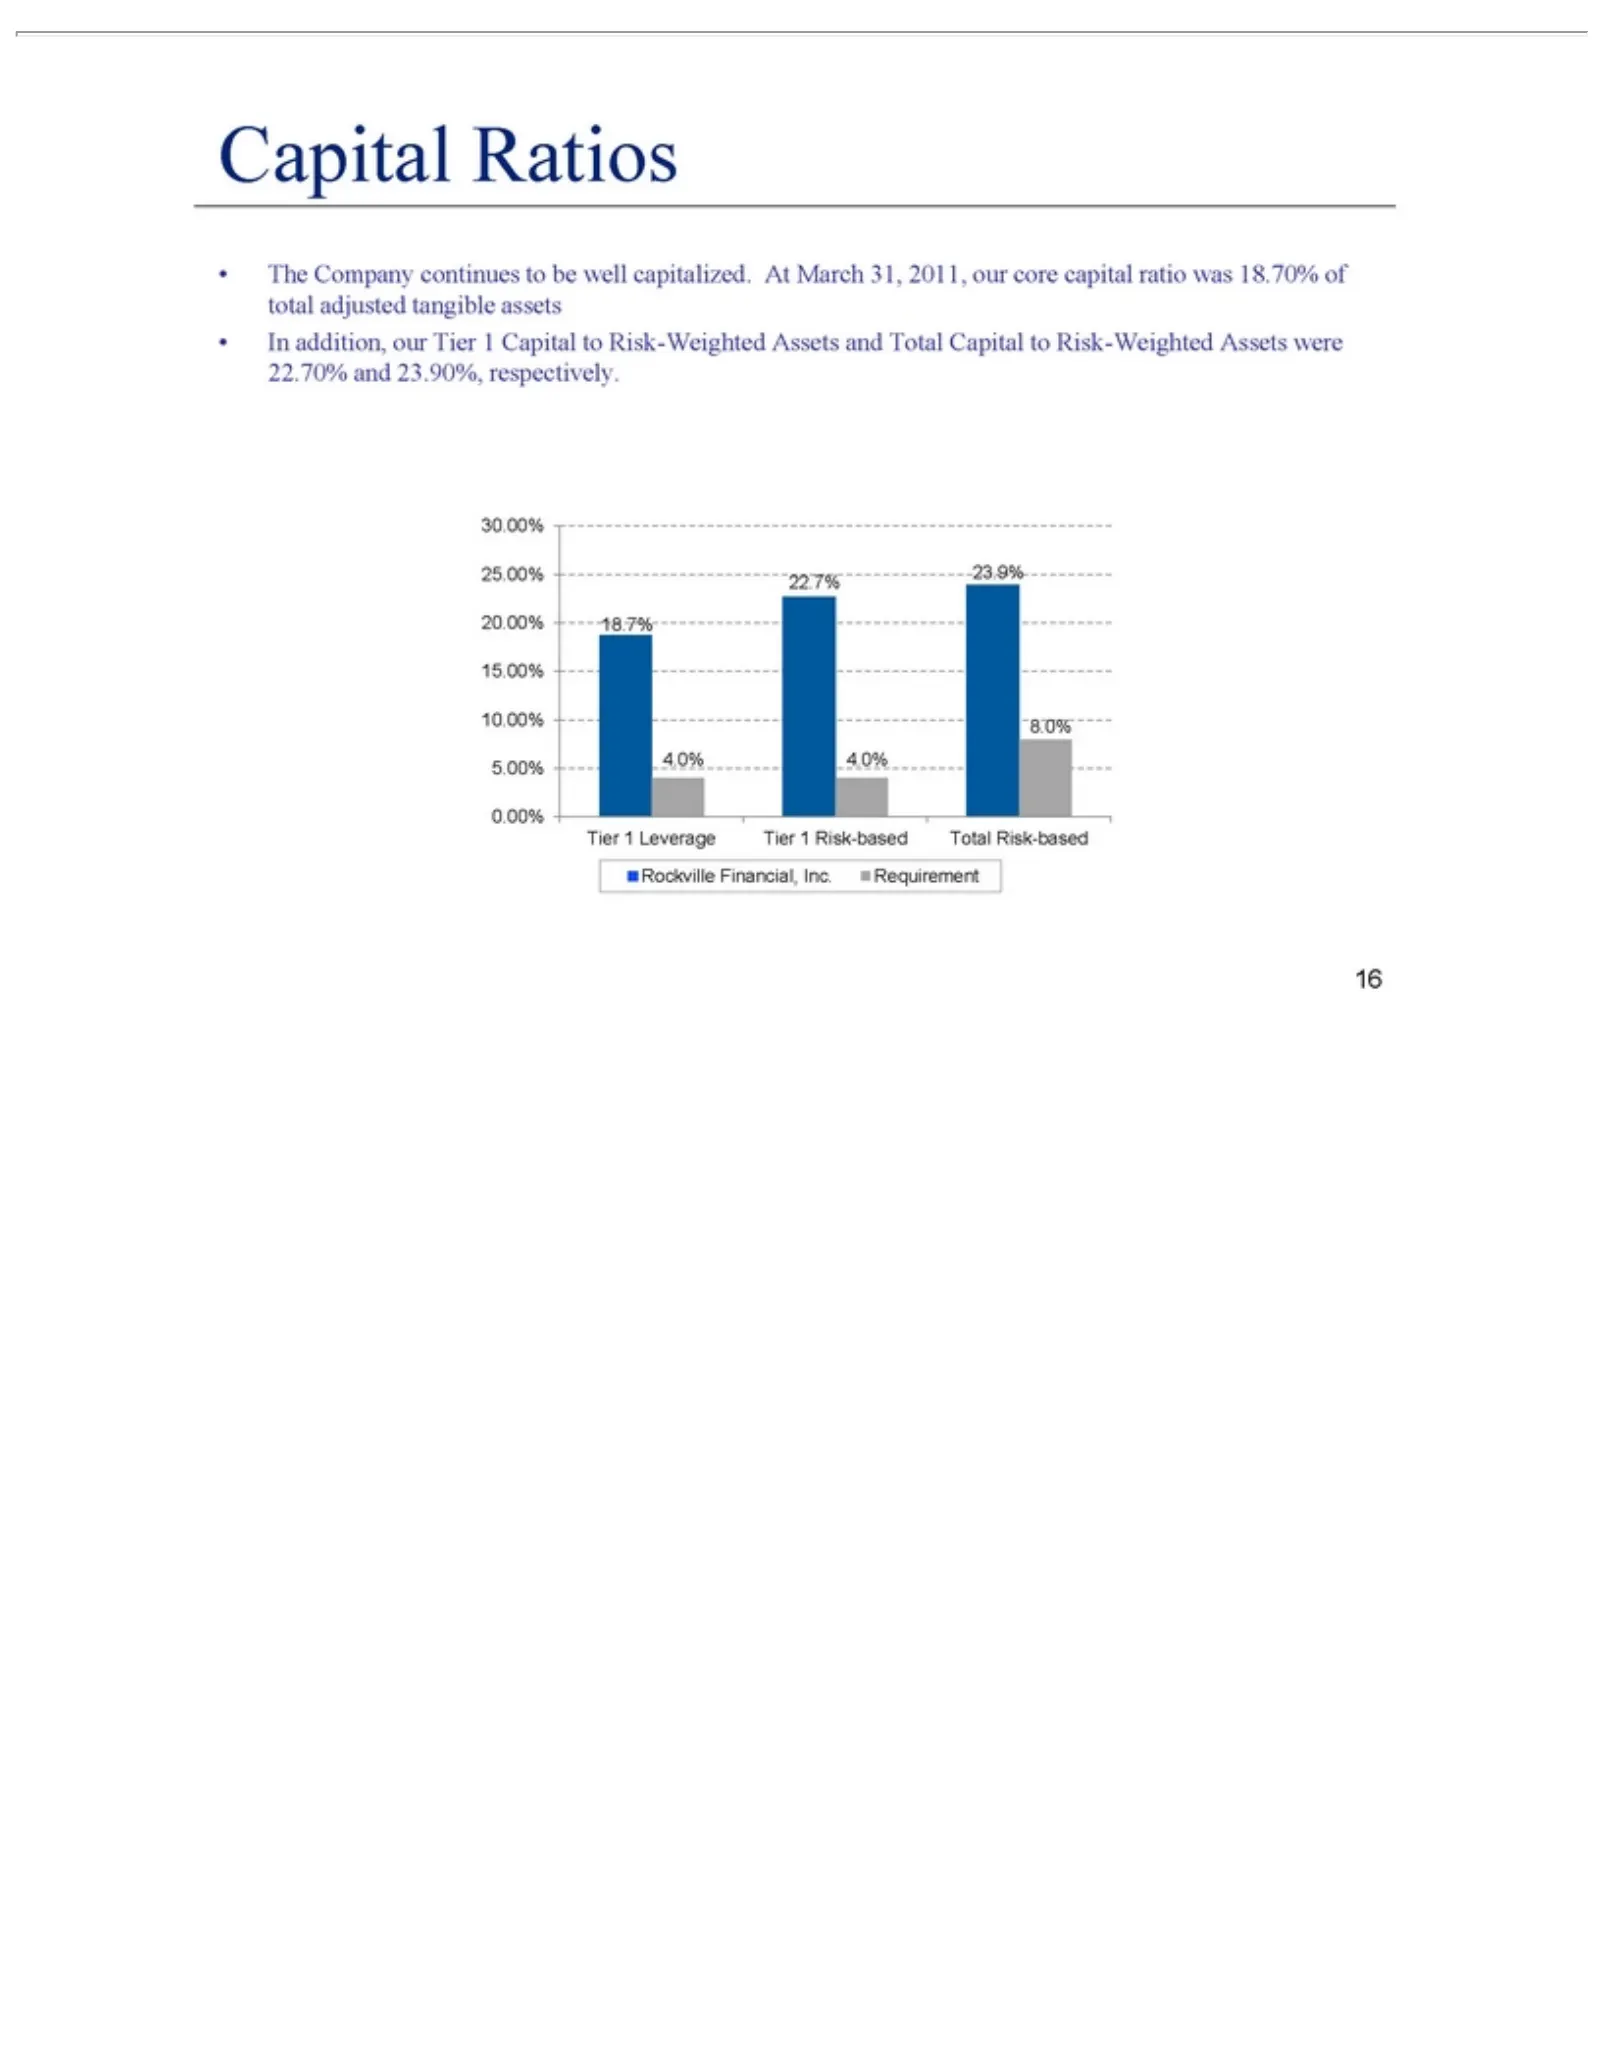
Slide 16: The Company Continues to Be Well Capitalized
The Company Capital 30.00% Tier Rockville 16 1 Leverage Ratios to 25.00% Financial, Risk-Weighted continues Tier 20.00% Inc. 1 Risk-based 15.00% to Requirement Assets be well were 10.00% Total capitalized. 22.70% Risk-based 5.00% and At0.00% March 23.90%, 31,respectively. 2011, our core capital rati
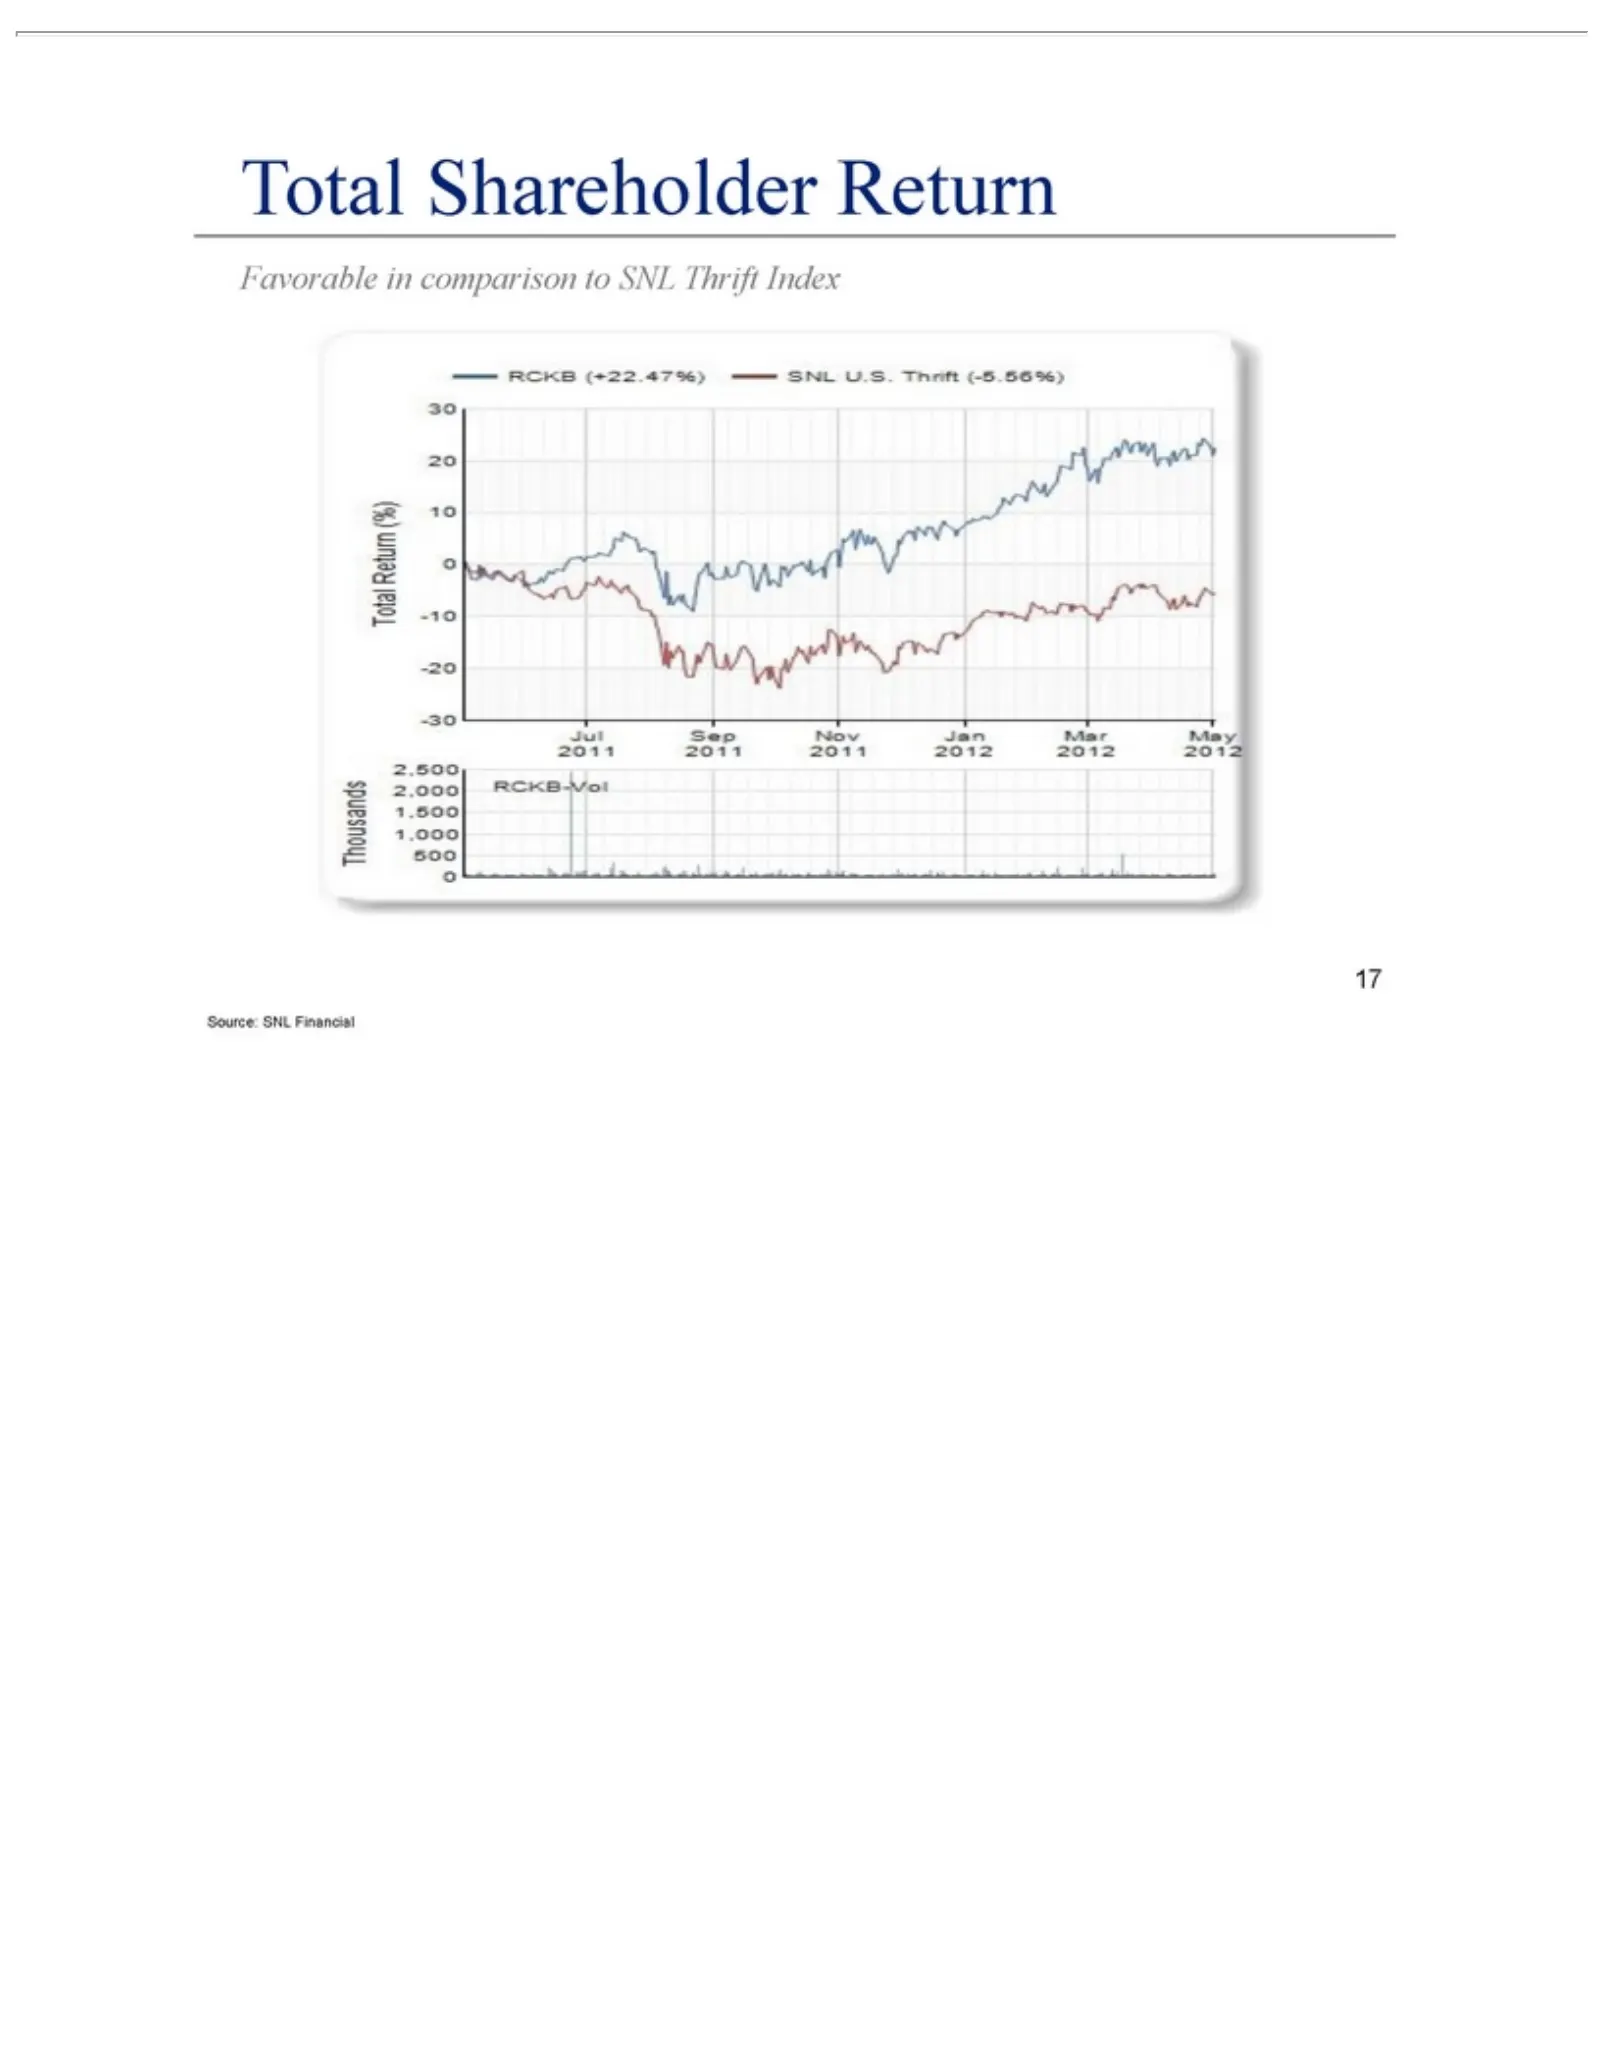
Slide 17: Total Shareholder Return vs SNL Thrift Index
Total Shareholder Favorable Source: 17 SNL in comparison Financial Return to SNL Thrift Index
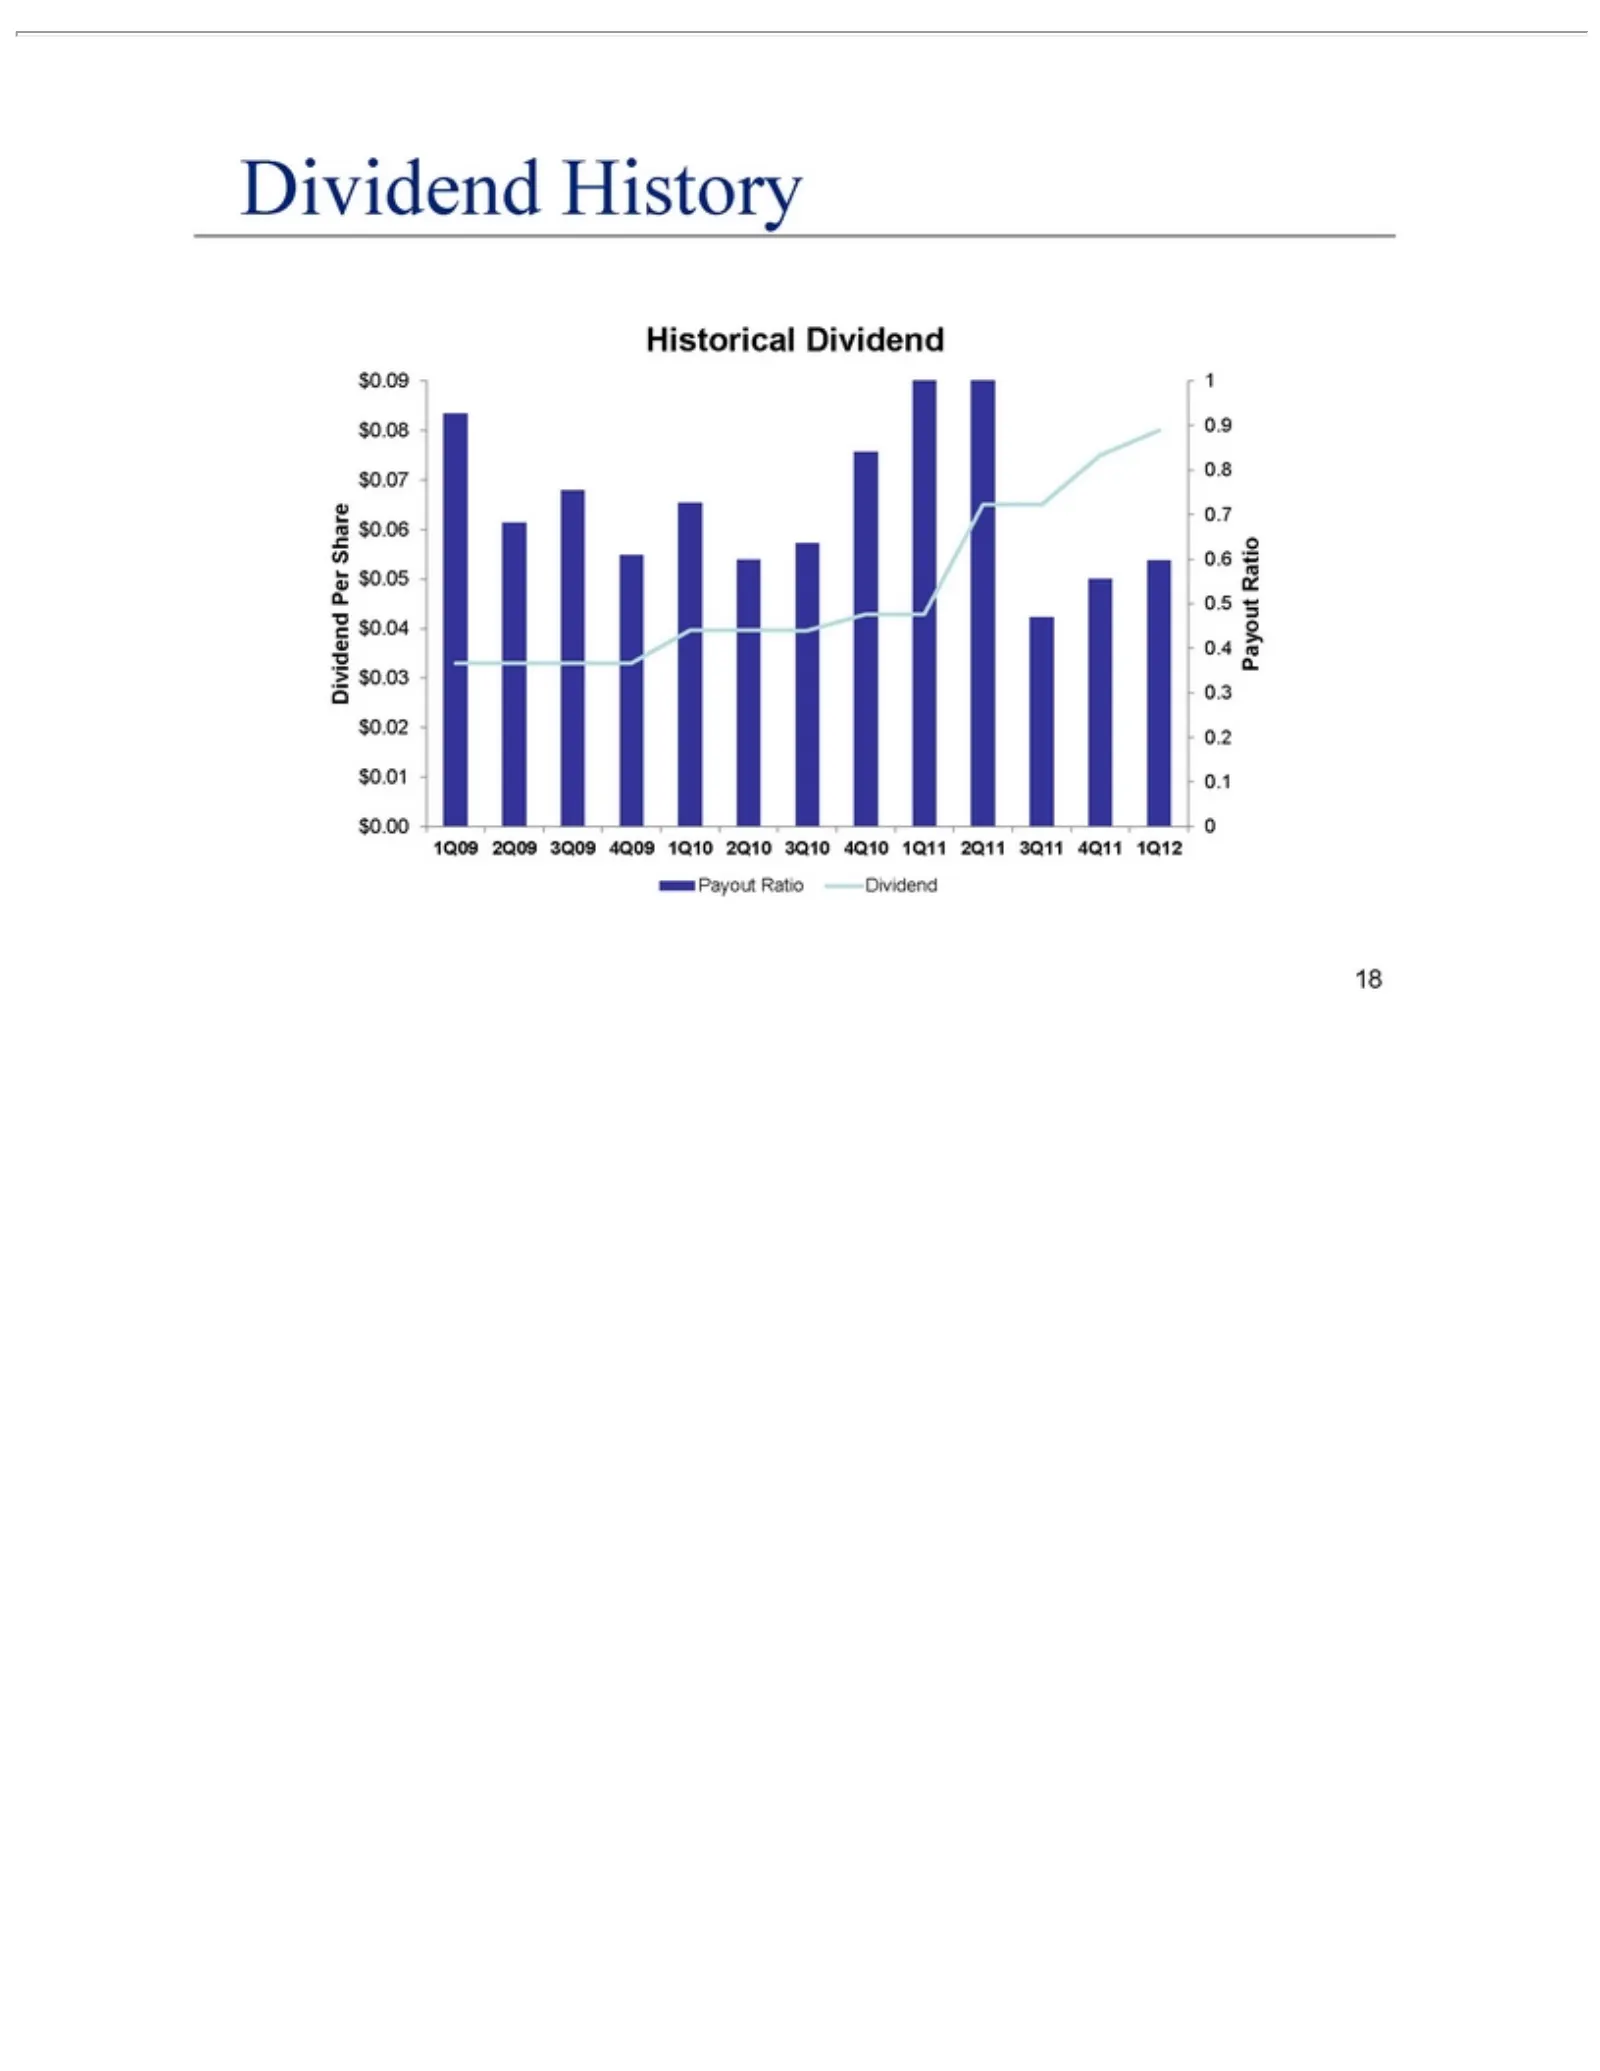
Slide 18: Dividend History
Dividend Historical Share $0.07 $0.08 $0.09 Per $0.03 1Q09 Payout 1 18 0.7 0.4 $0.05 2Q09 0.6 0.3$0.02 $0.06 0.9History Dividend Dividend 0.8 Ratio 0.2 3Q09 $0.01 Dividend 0.1 0.5 4Q09 $0.00 $0.041Q10 2Q10 3Q10 4Q10 1Q11 2Q11 3Q11 4Q11 1Q12 0 Payout
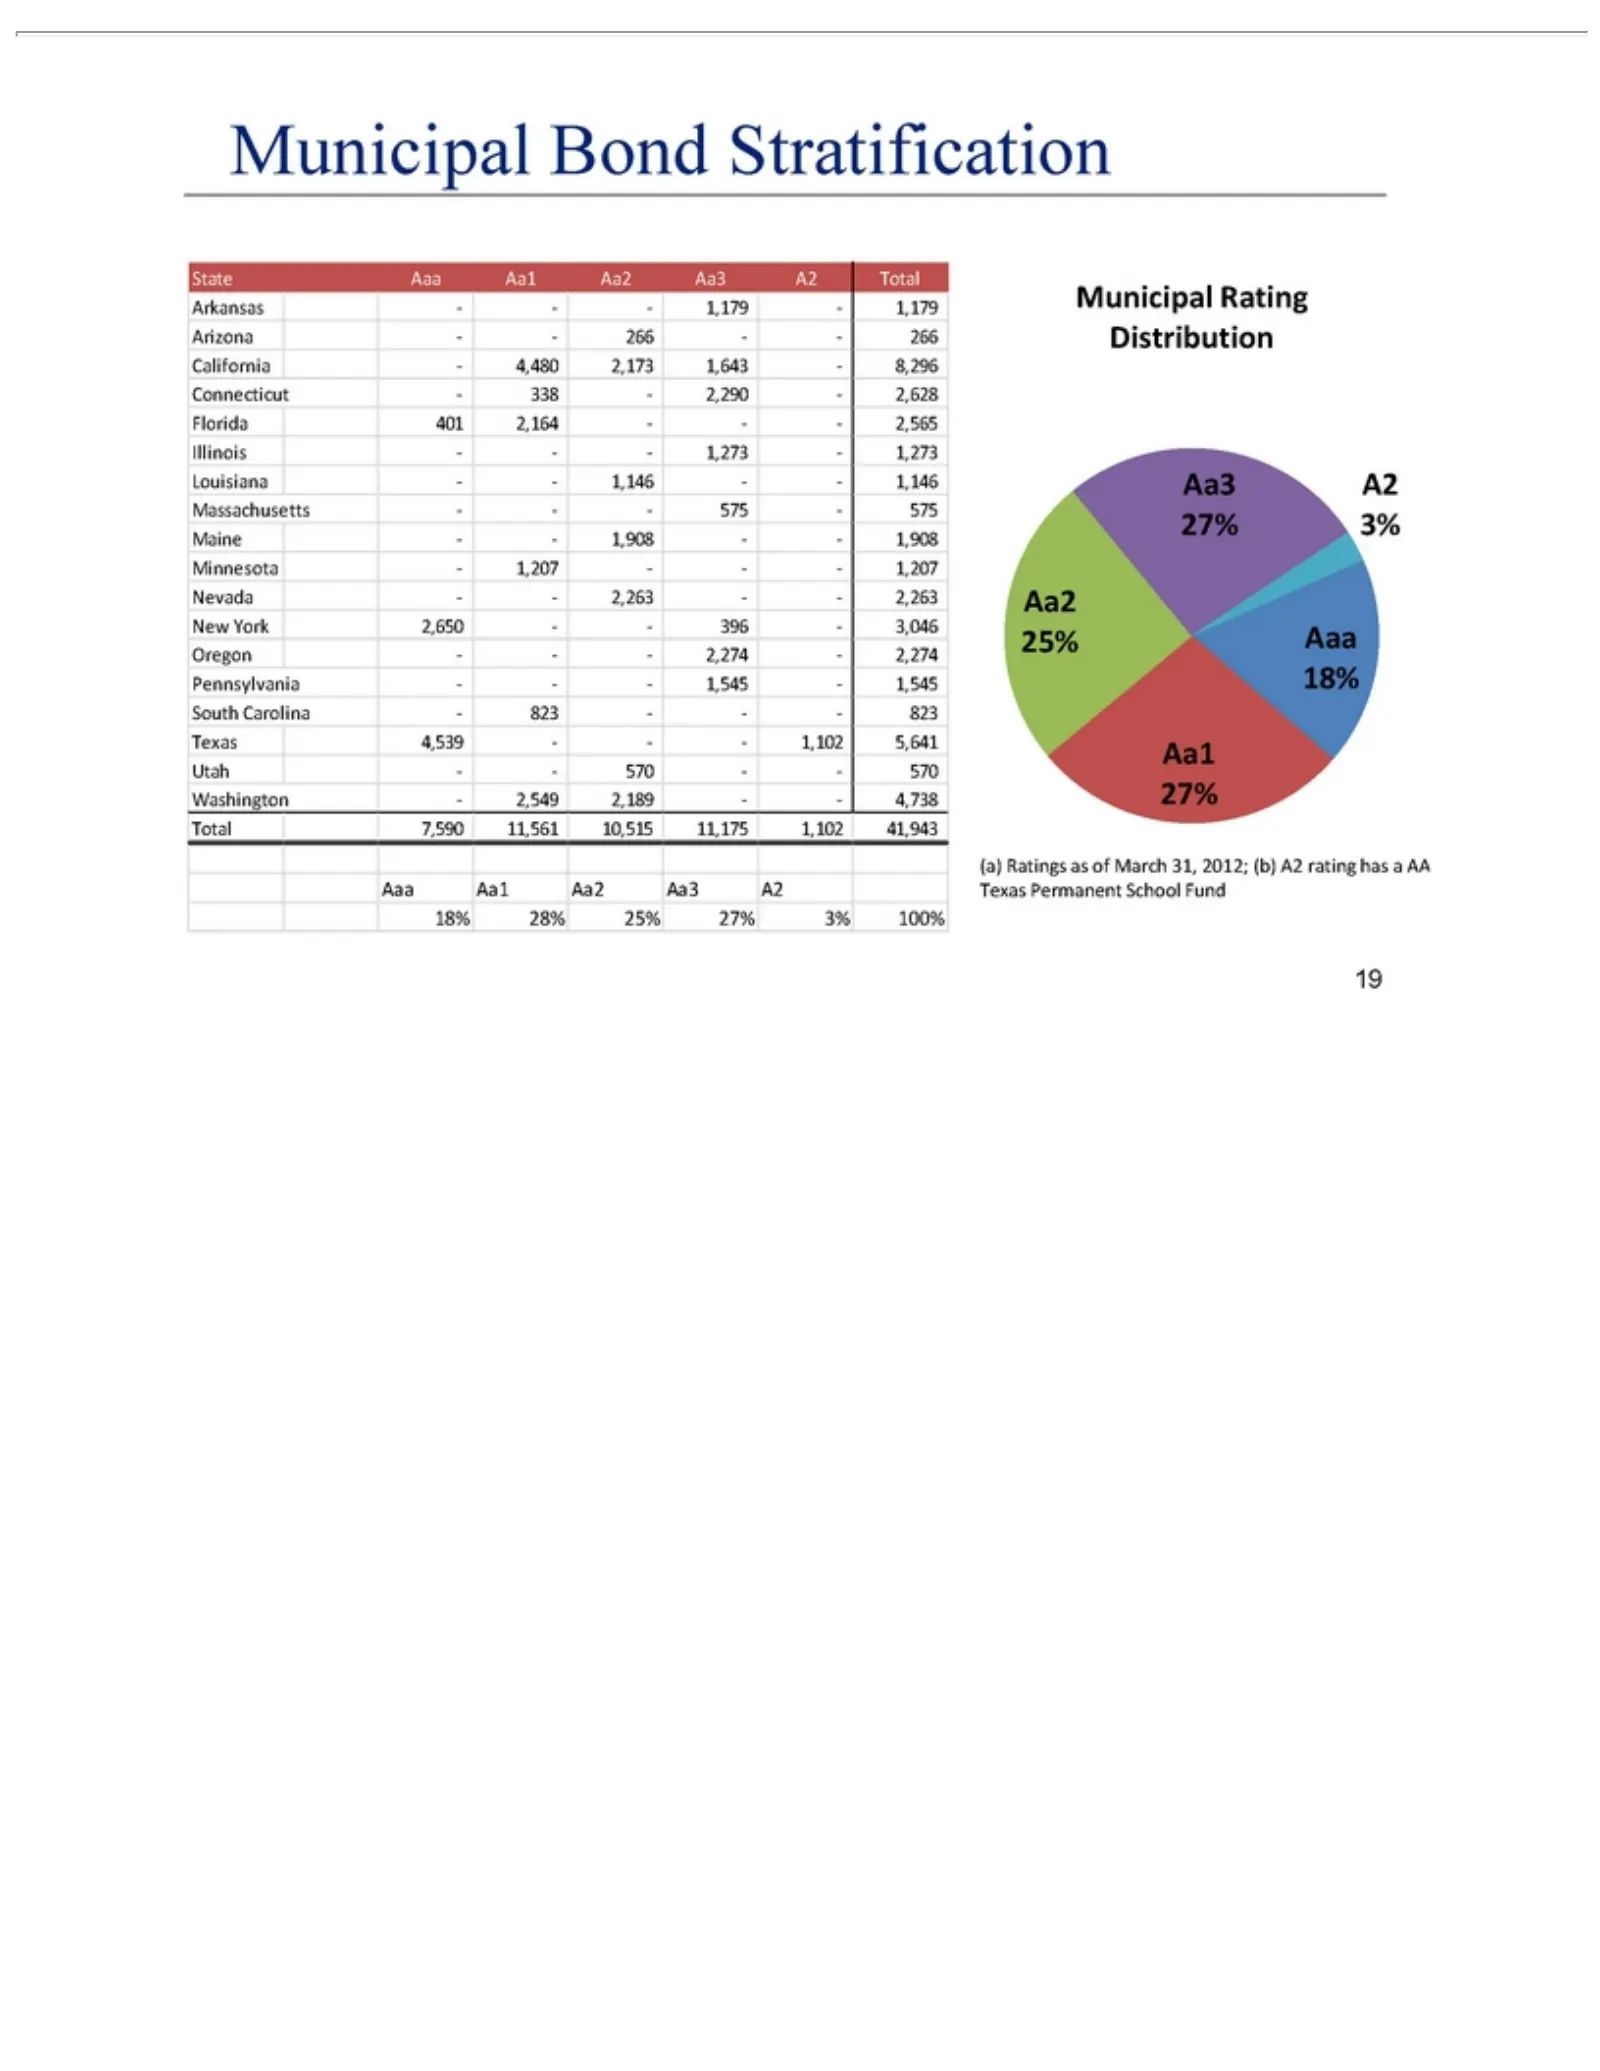
Slide 19: Municipal Bond Ratings and State Stratification
StateAa1 —— Oregon—— 10,515 Aaa 18% Municipal Aa3 25% Aa2 Aa1 (a) 19 A2 27% Aaa 28% Aaa 1,273—1,273 11,175 Ratings 27% Aa2 18% Aa1 25% Bond Rating 2,274—2,274 3% Aa3 Aa2 1,102 27% as Stratification Distribution A2 of Aa3 Louisiana—- 3% 41,943 March A2 100% Pennsylvania—— Total 31, 2012; Arkansas—— 1
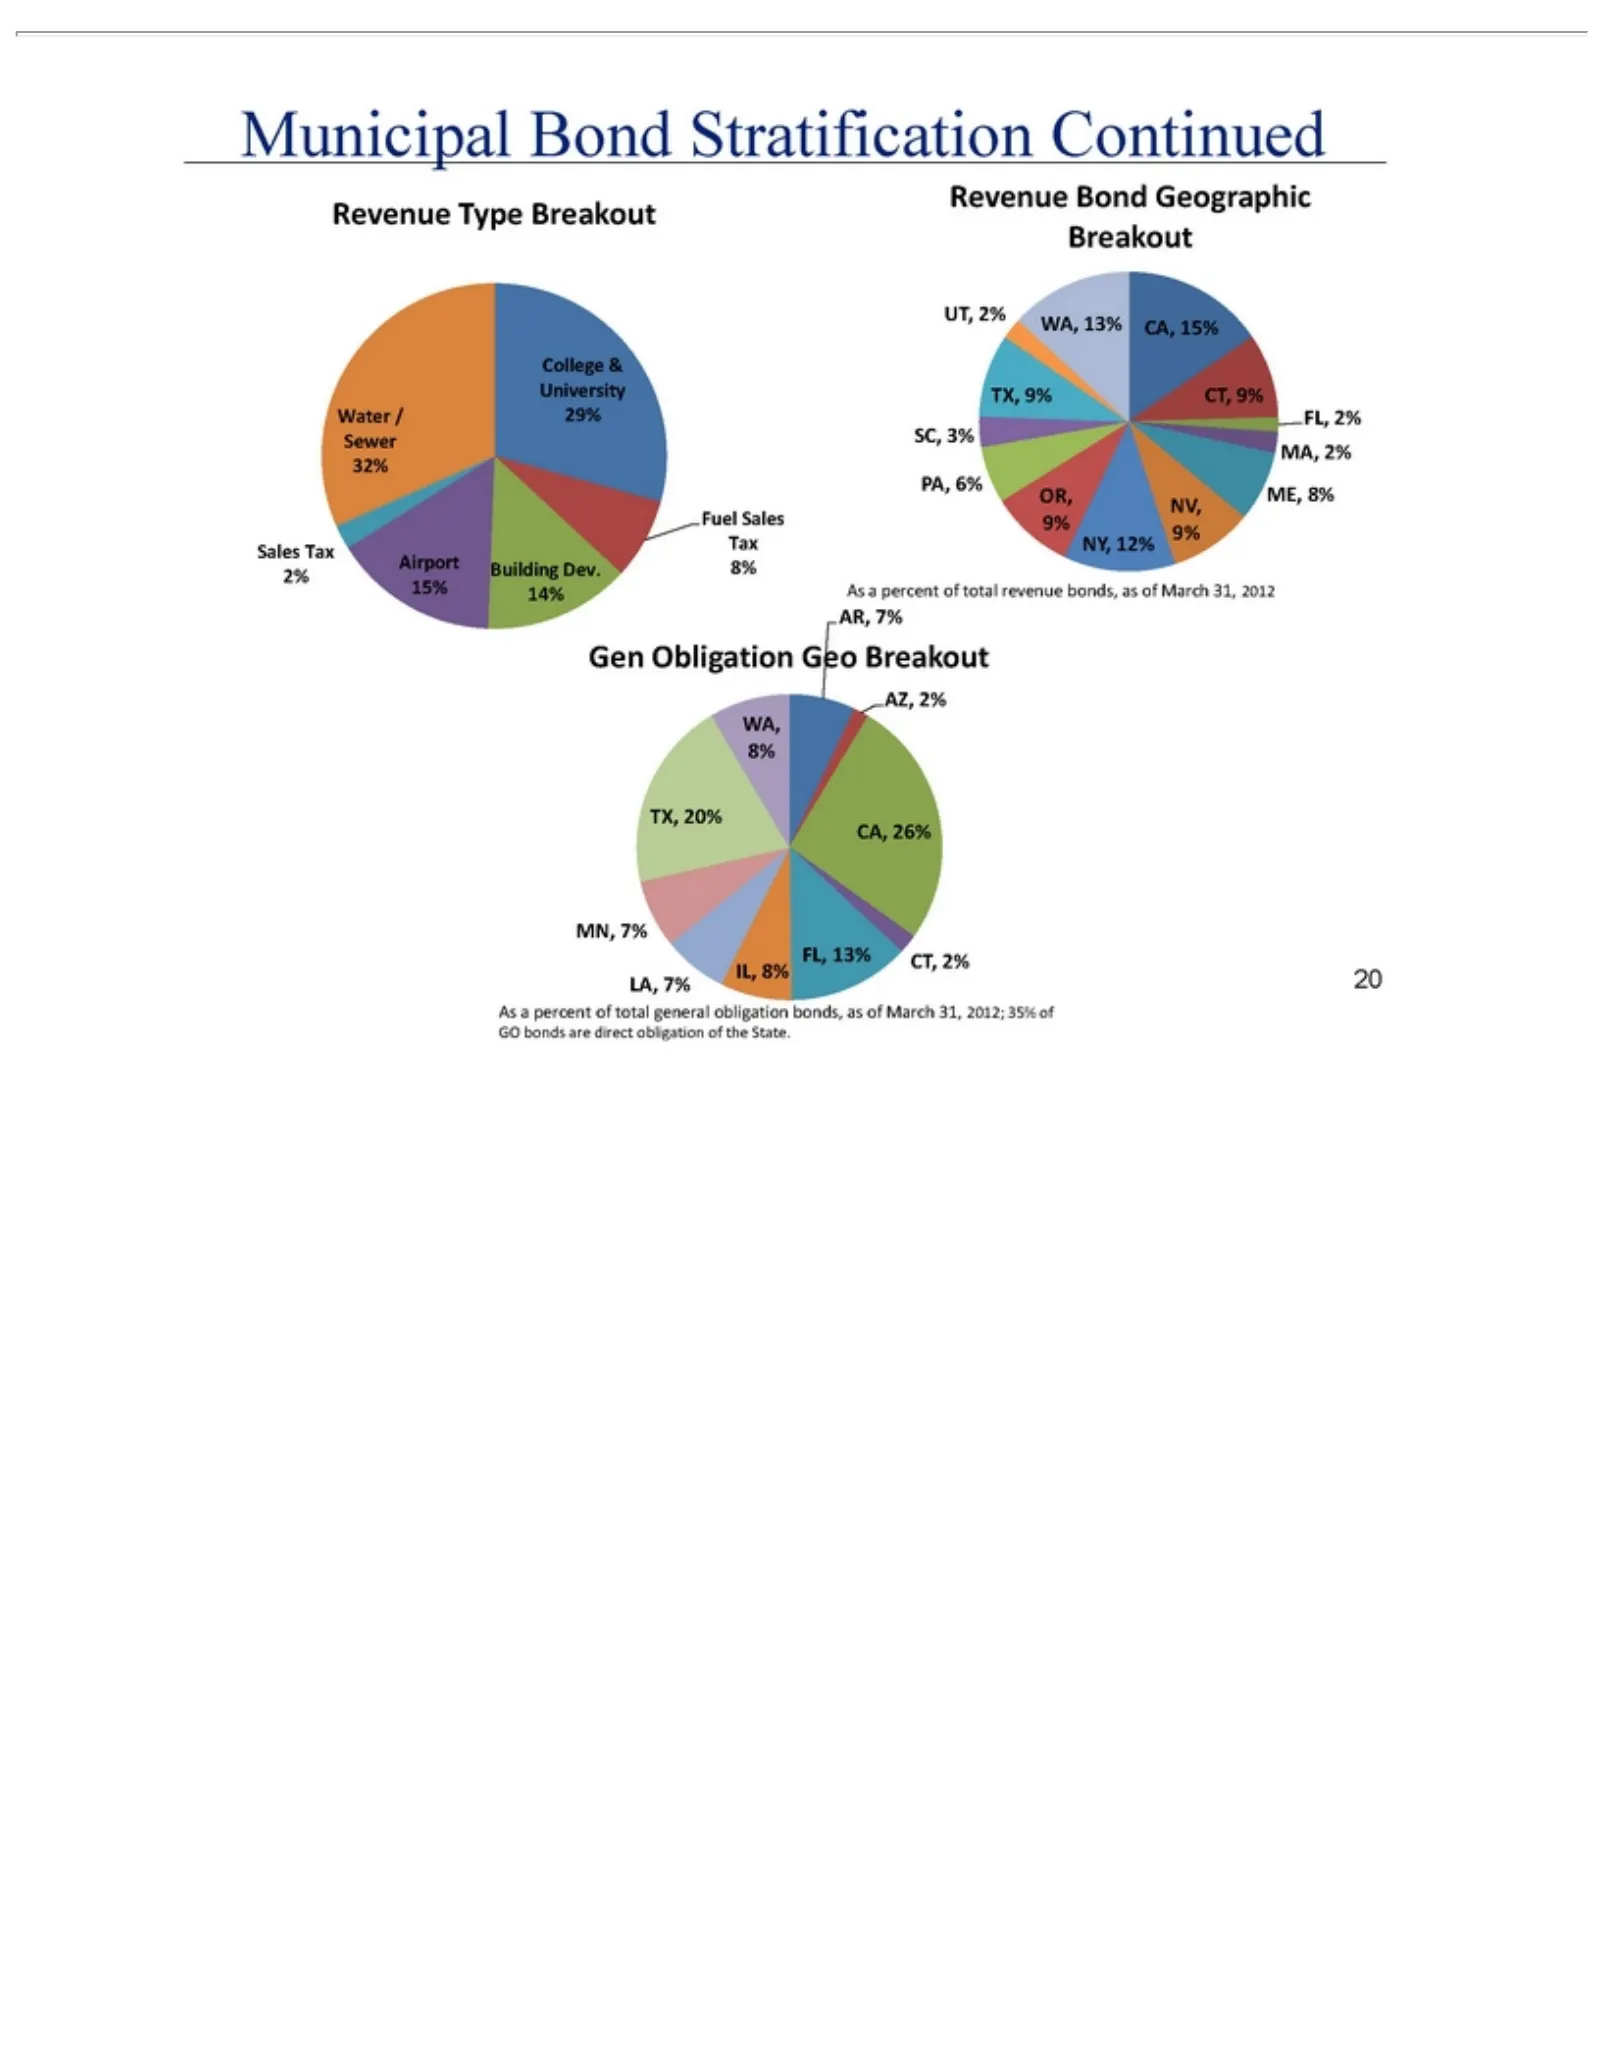
Slide 20: Municipal Bond Portfolio Breakout
Municipal Revenue College Fuel 2% UT, 9% AR, Gen AZ, TX, CA, MN, FL, As aNY, 15% 13% 2% 9% 20% 15% 7% 26% Obligation Sales percent 7%WA, & 12% CT, Building Bond CT, Bond University Sales 9% of 13% 8% 2% 9%Geographic total Geo FL, Tax Stratification IL, Dev. revenue general Breakout 2% Airport 8% Wat
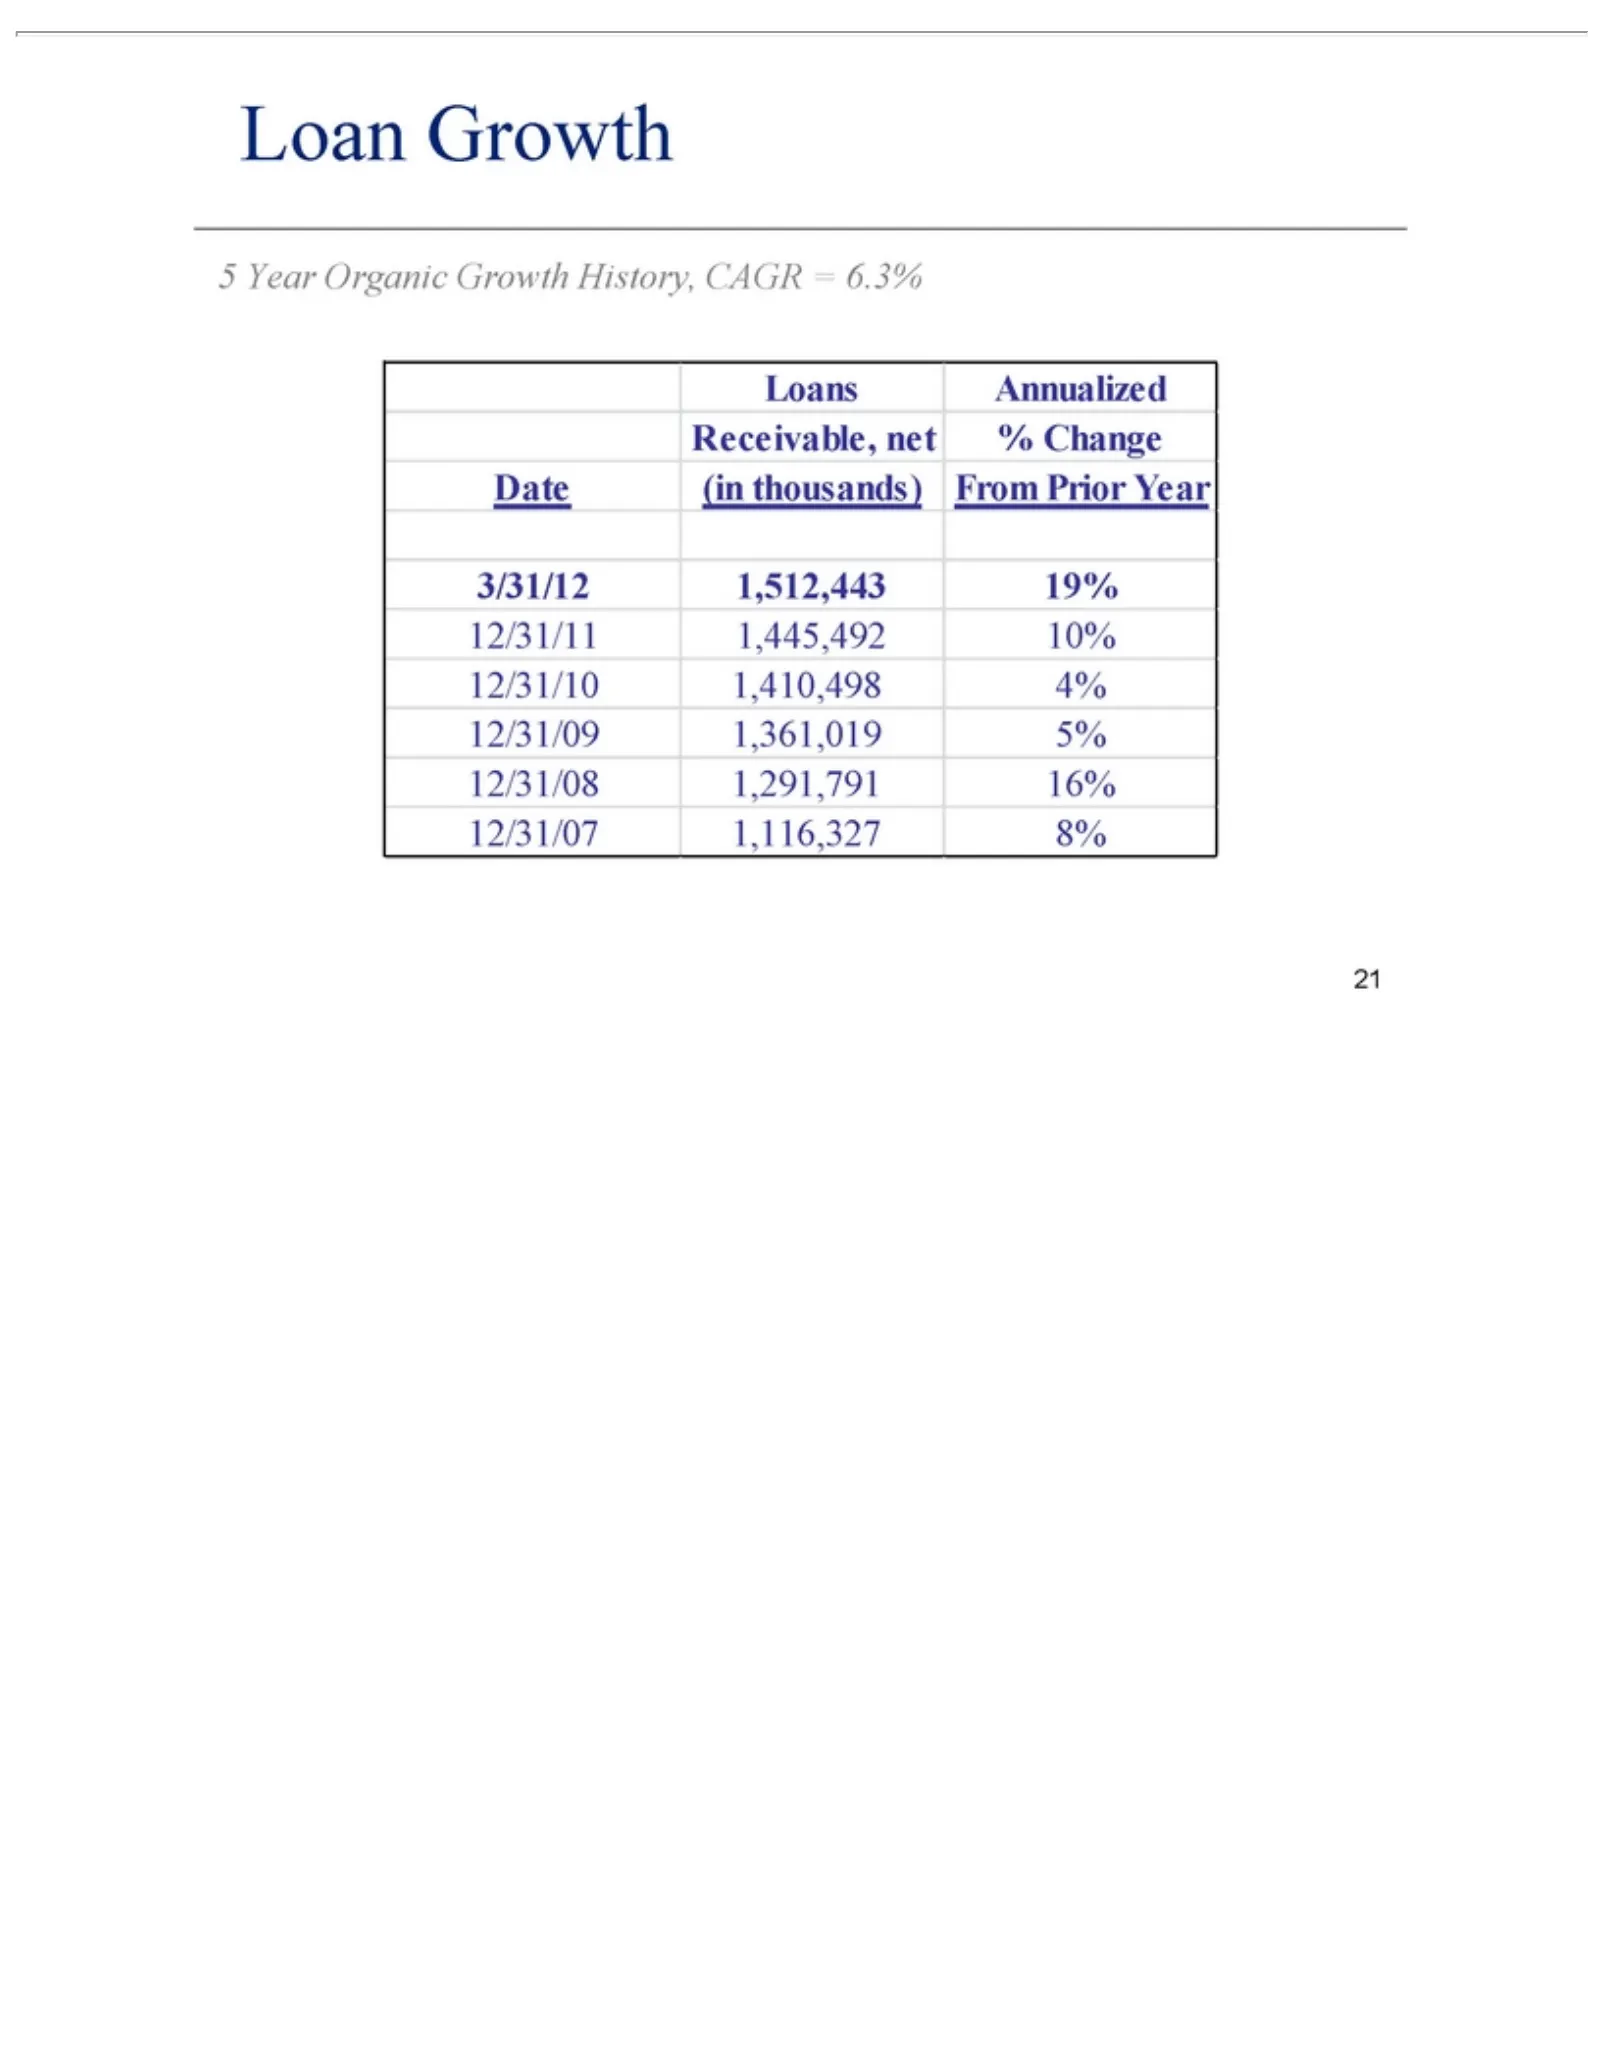
Slide 21: Loan Growth
Loan 5 LoansGrowth 3/31/12 12/31/11 21 Year Organic Annualized 1,512,443 1,445,492 Growth History, Receivable, 19% 10% 12/31/10 CAGR4% net 1,410,498 % Change = 6.3% Date 12/31/09 (in thousands) 1,361,019 From 5%Prior 12/31/08 Year 1,291,791 16% 12/31/07 1,116,327 8%
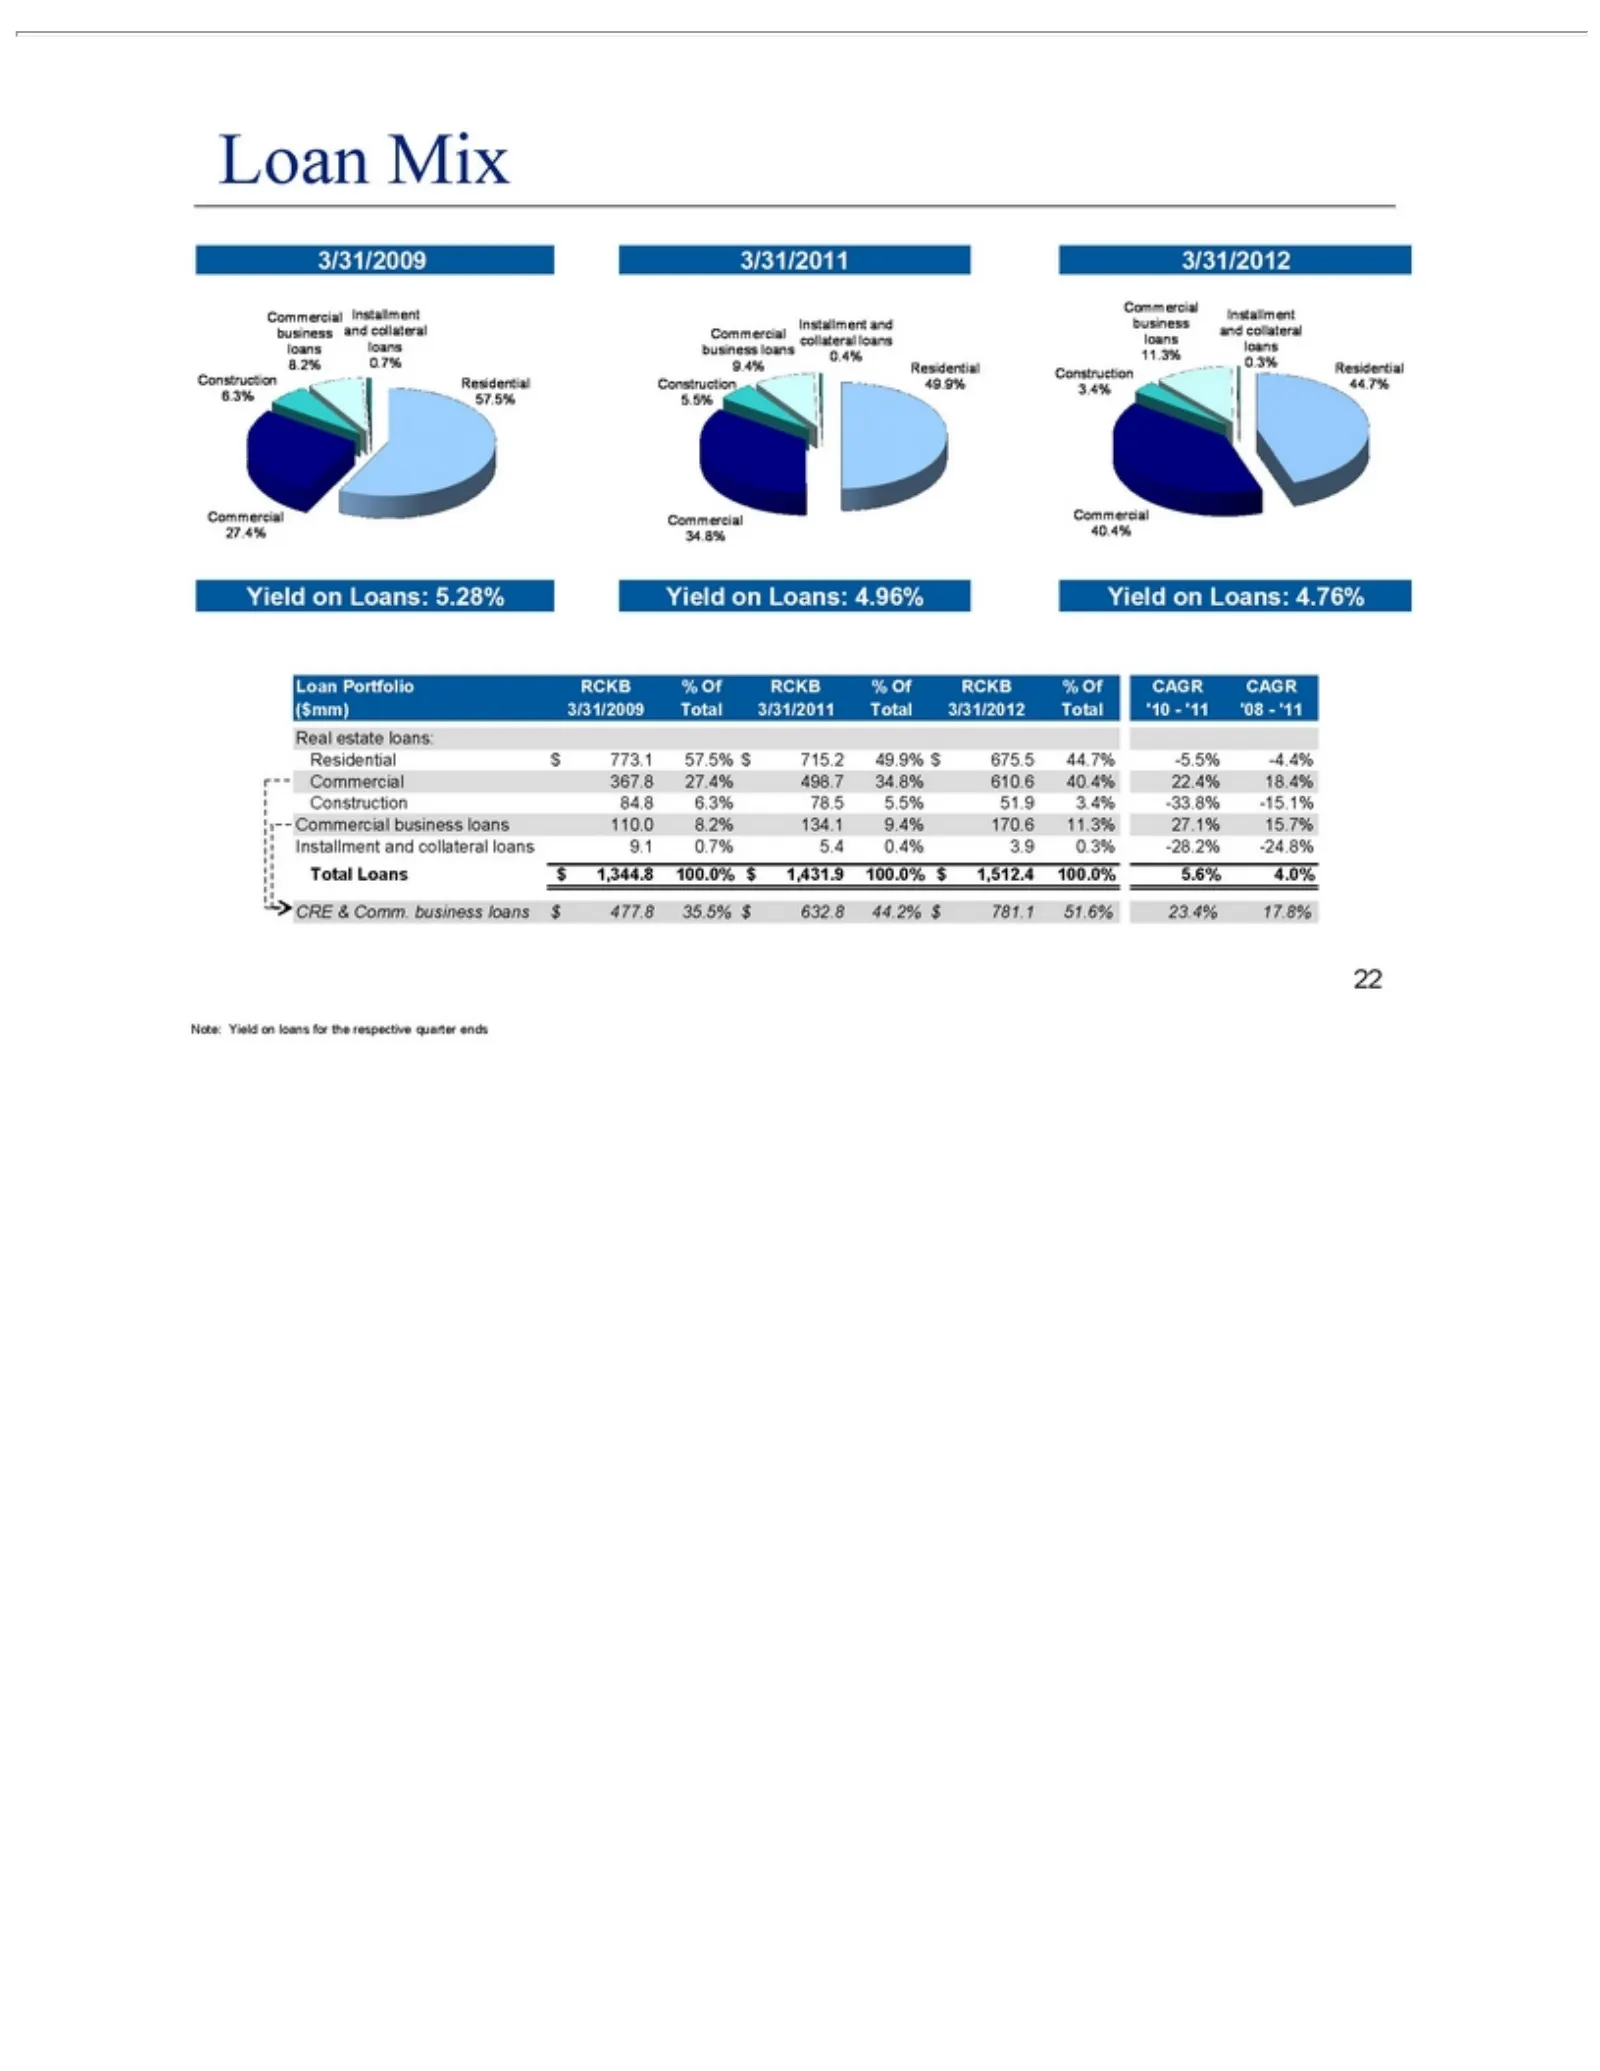
Slide 22: Loan Portfolio Mix
Loanestate Real Residential Commercial Total CRE Note: 22 & Loans Mix Portfolio Yield Comm. loans: $on $business 773.1 1,344.8 loans RCKB business 57.5% for loans 100.0% %the loans Of$110.0 respective RCKB 715.2 $$ 1,431.9 477.8 8.2% 49.9% % Of quarter 35.5% 134.1 100.0% RCKB $ 675.5 9.4% $ends 632.
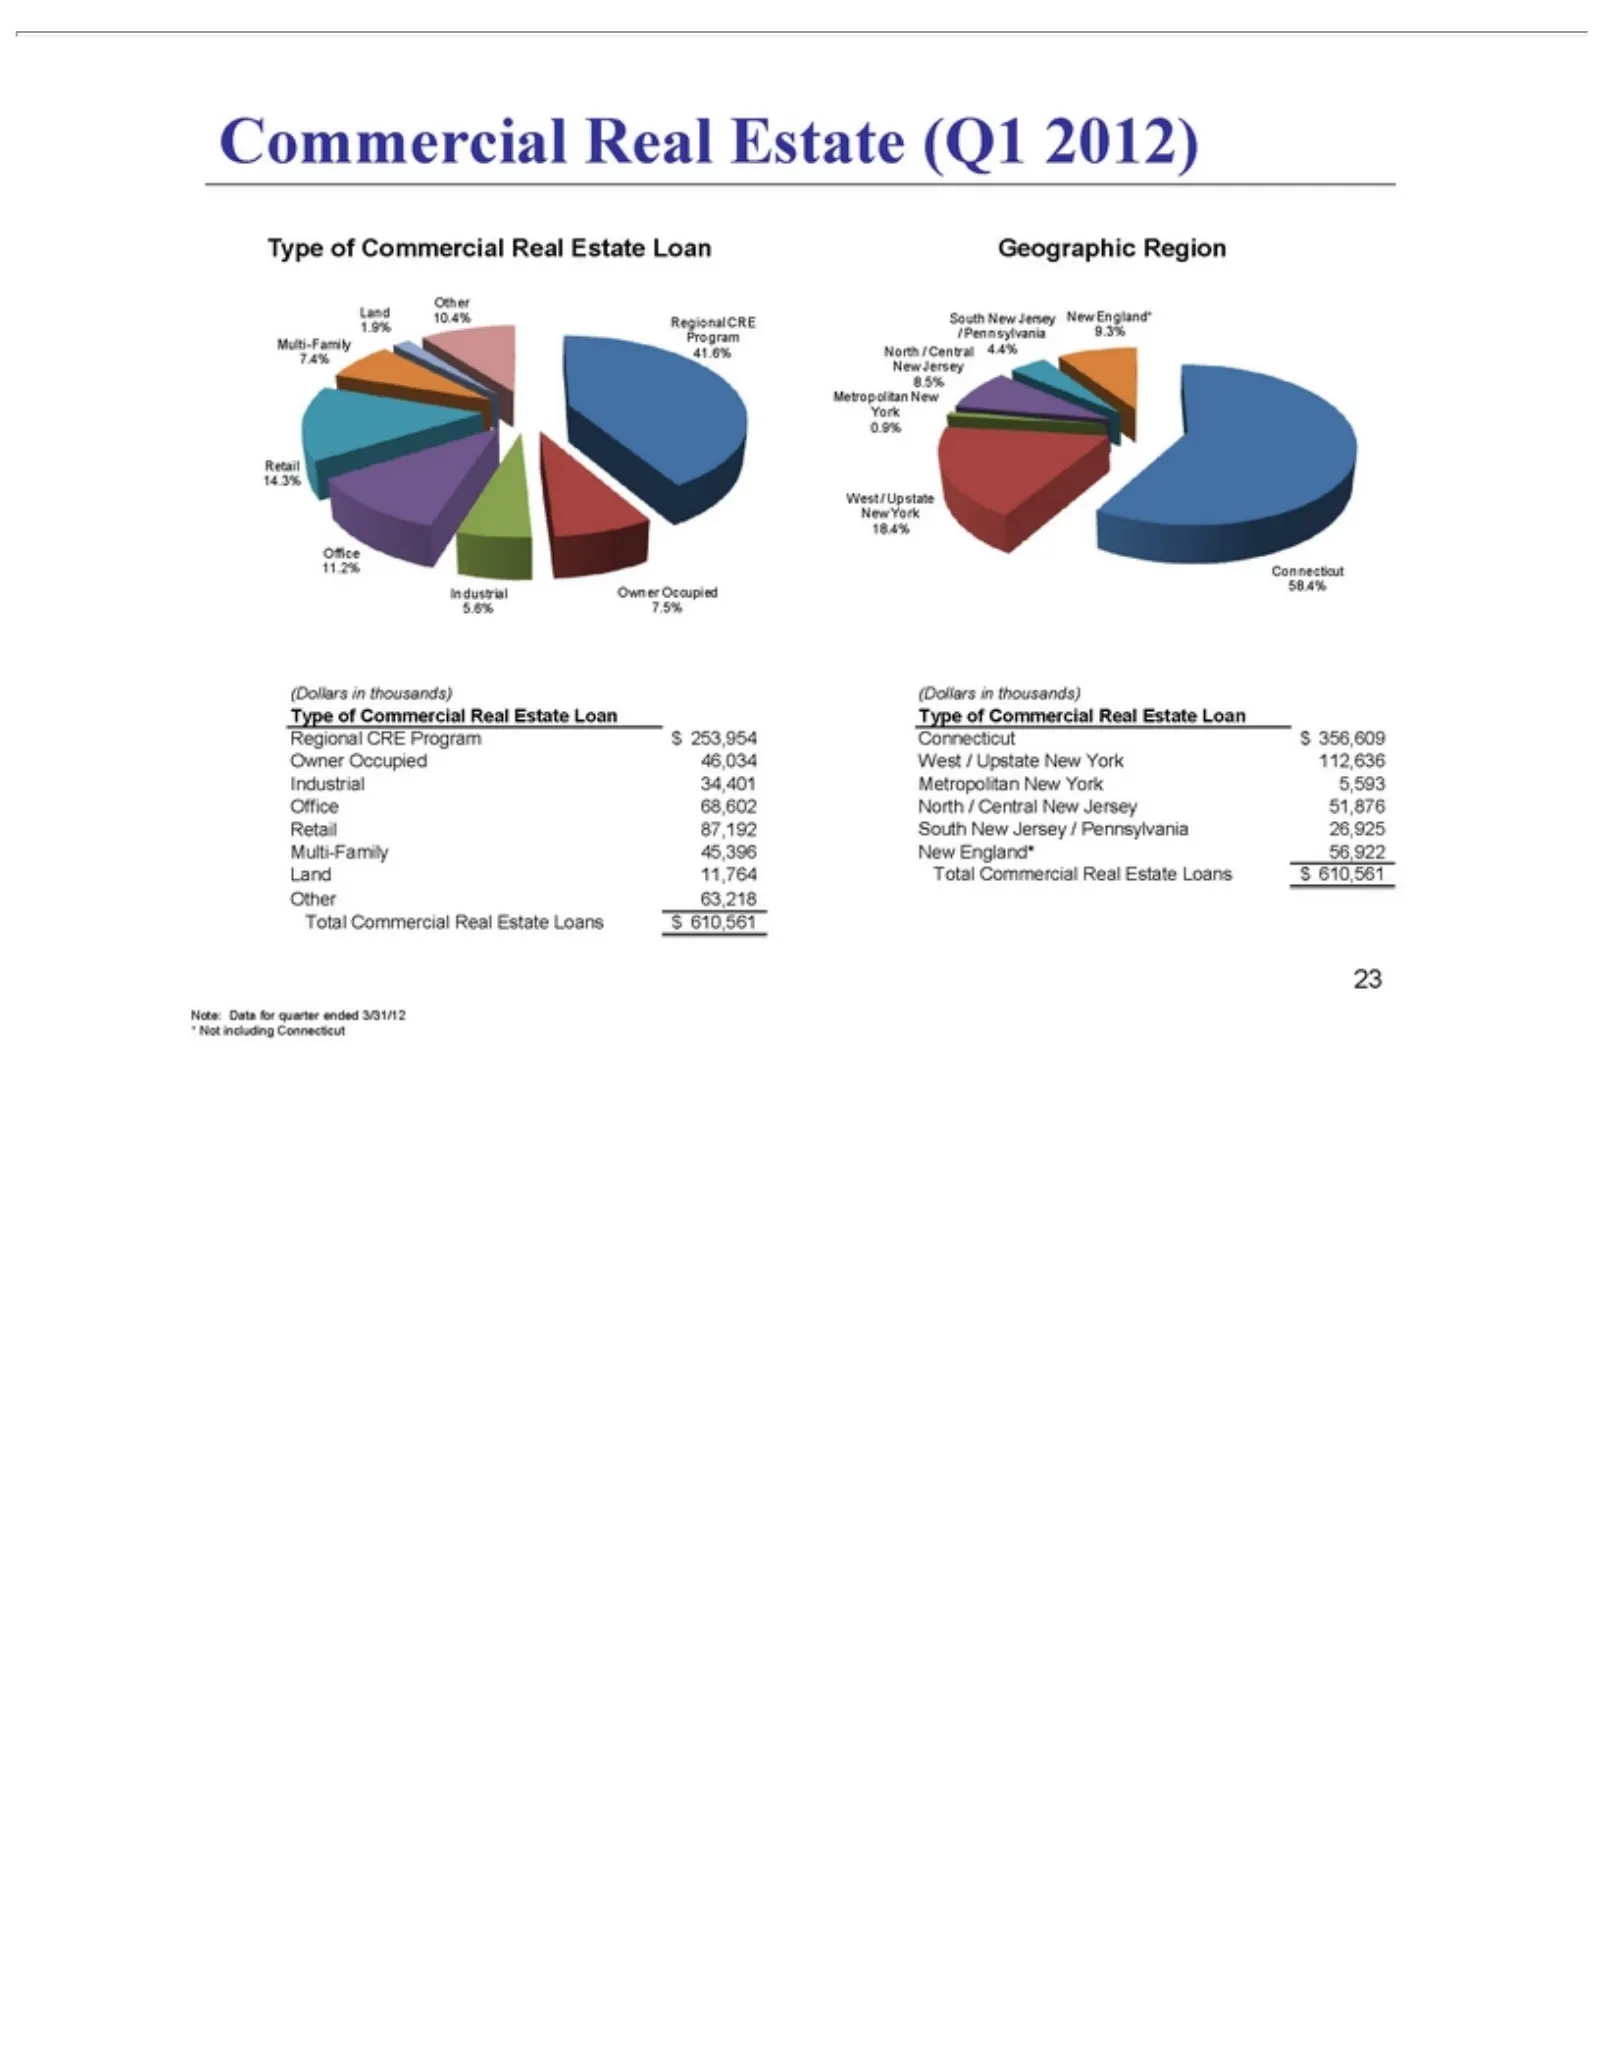
Slide 23: Commercial Real Estate Portfolio by Type and Region
Land /of 10.4% 1.9% Retail West 11.2% Office Regional (Dollars 610,561 Type Connecticut Commercial Note: * 23 Other 9.3% Data 14.3% Upstate Connecticut South Not Commercial inCRE thousands) for Program including $Real New 356,609 quarter Program NewEstate Jersey 58.4% York /Real Pennsylvania Connect
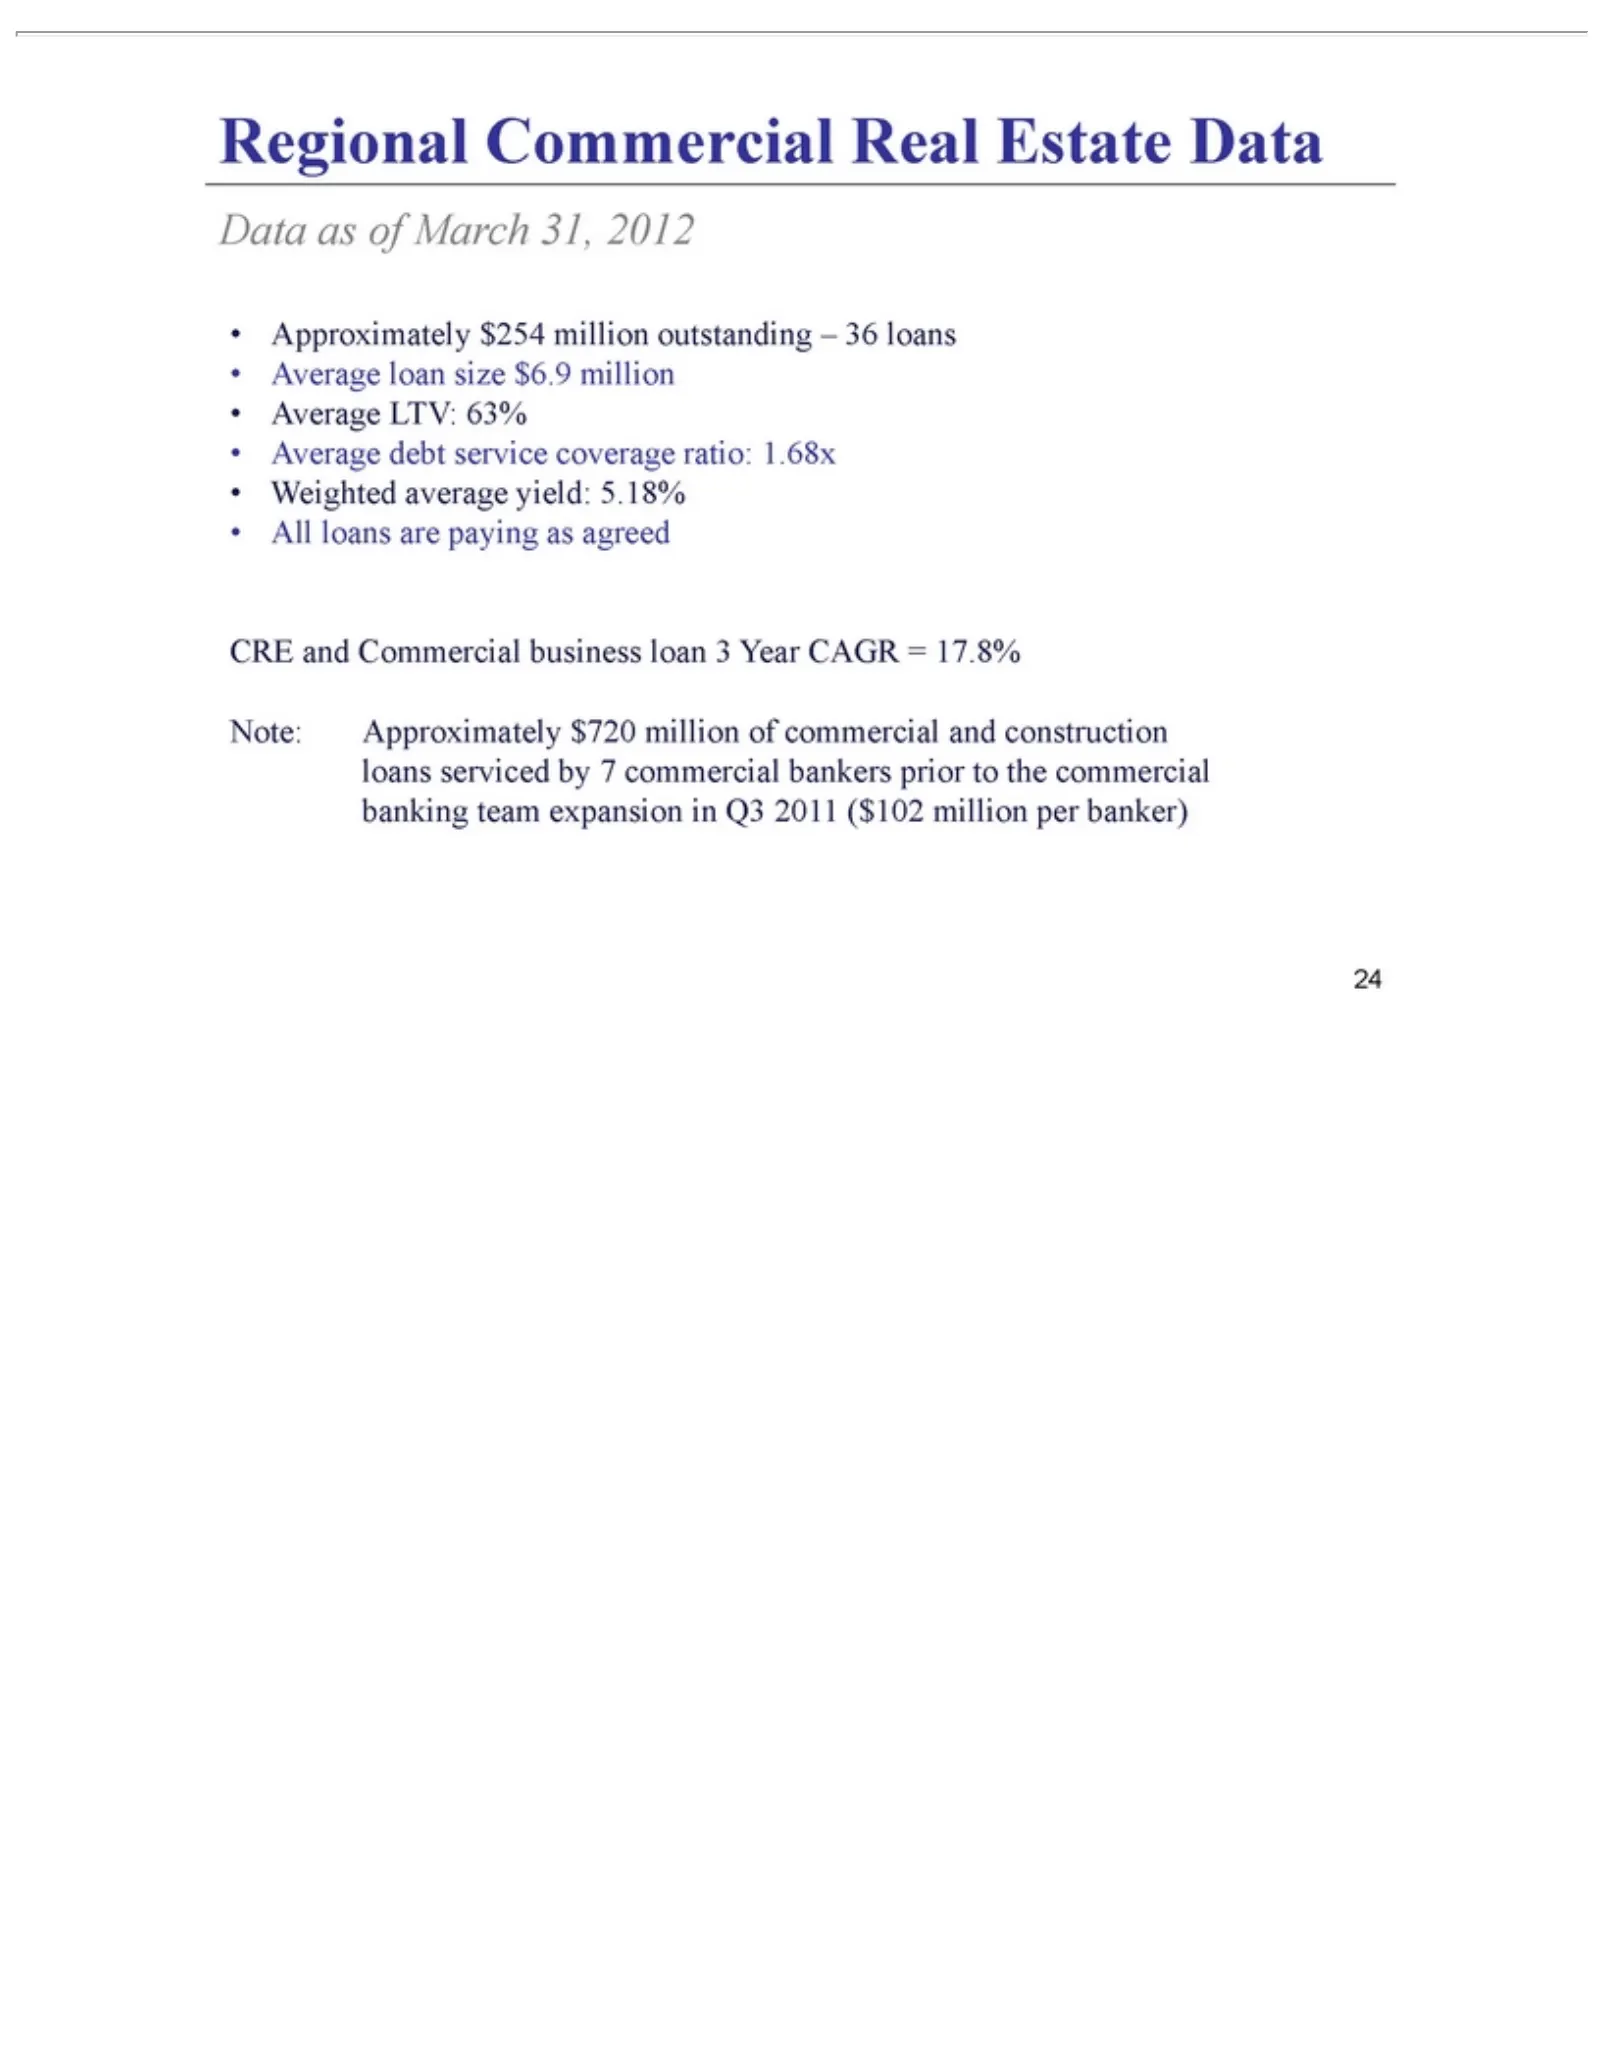
Slide 24: Regional Commercial Loan Data
Regional Data Approximately as CRE Note: 24 agreed as and Approximately ofCommercial March $254 31, million 2012 $720 Real business million Estate outstanding loan Data of3commercial Year ± 36 CAGR loans and =Average 17.8% construction loan size loans $6.9 serviced millionby Average 7 commercial LTV
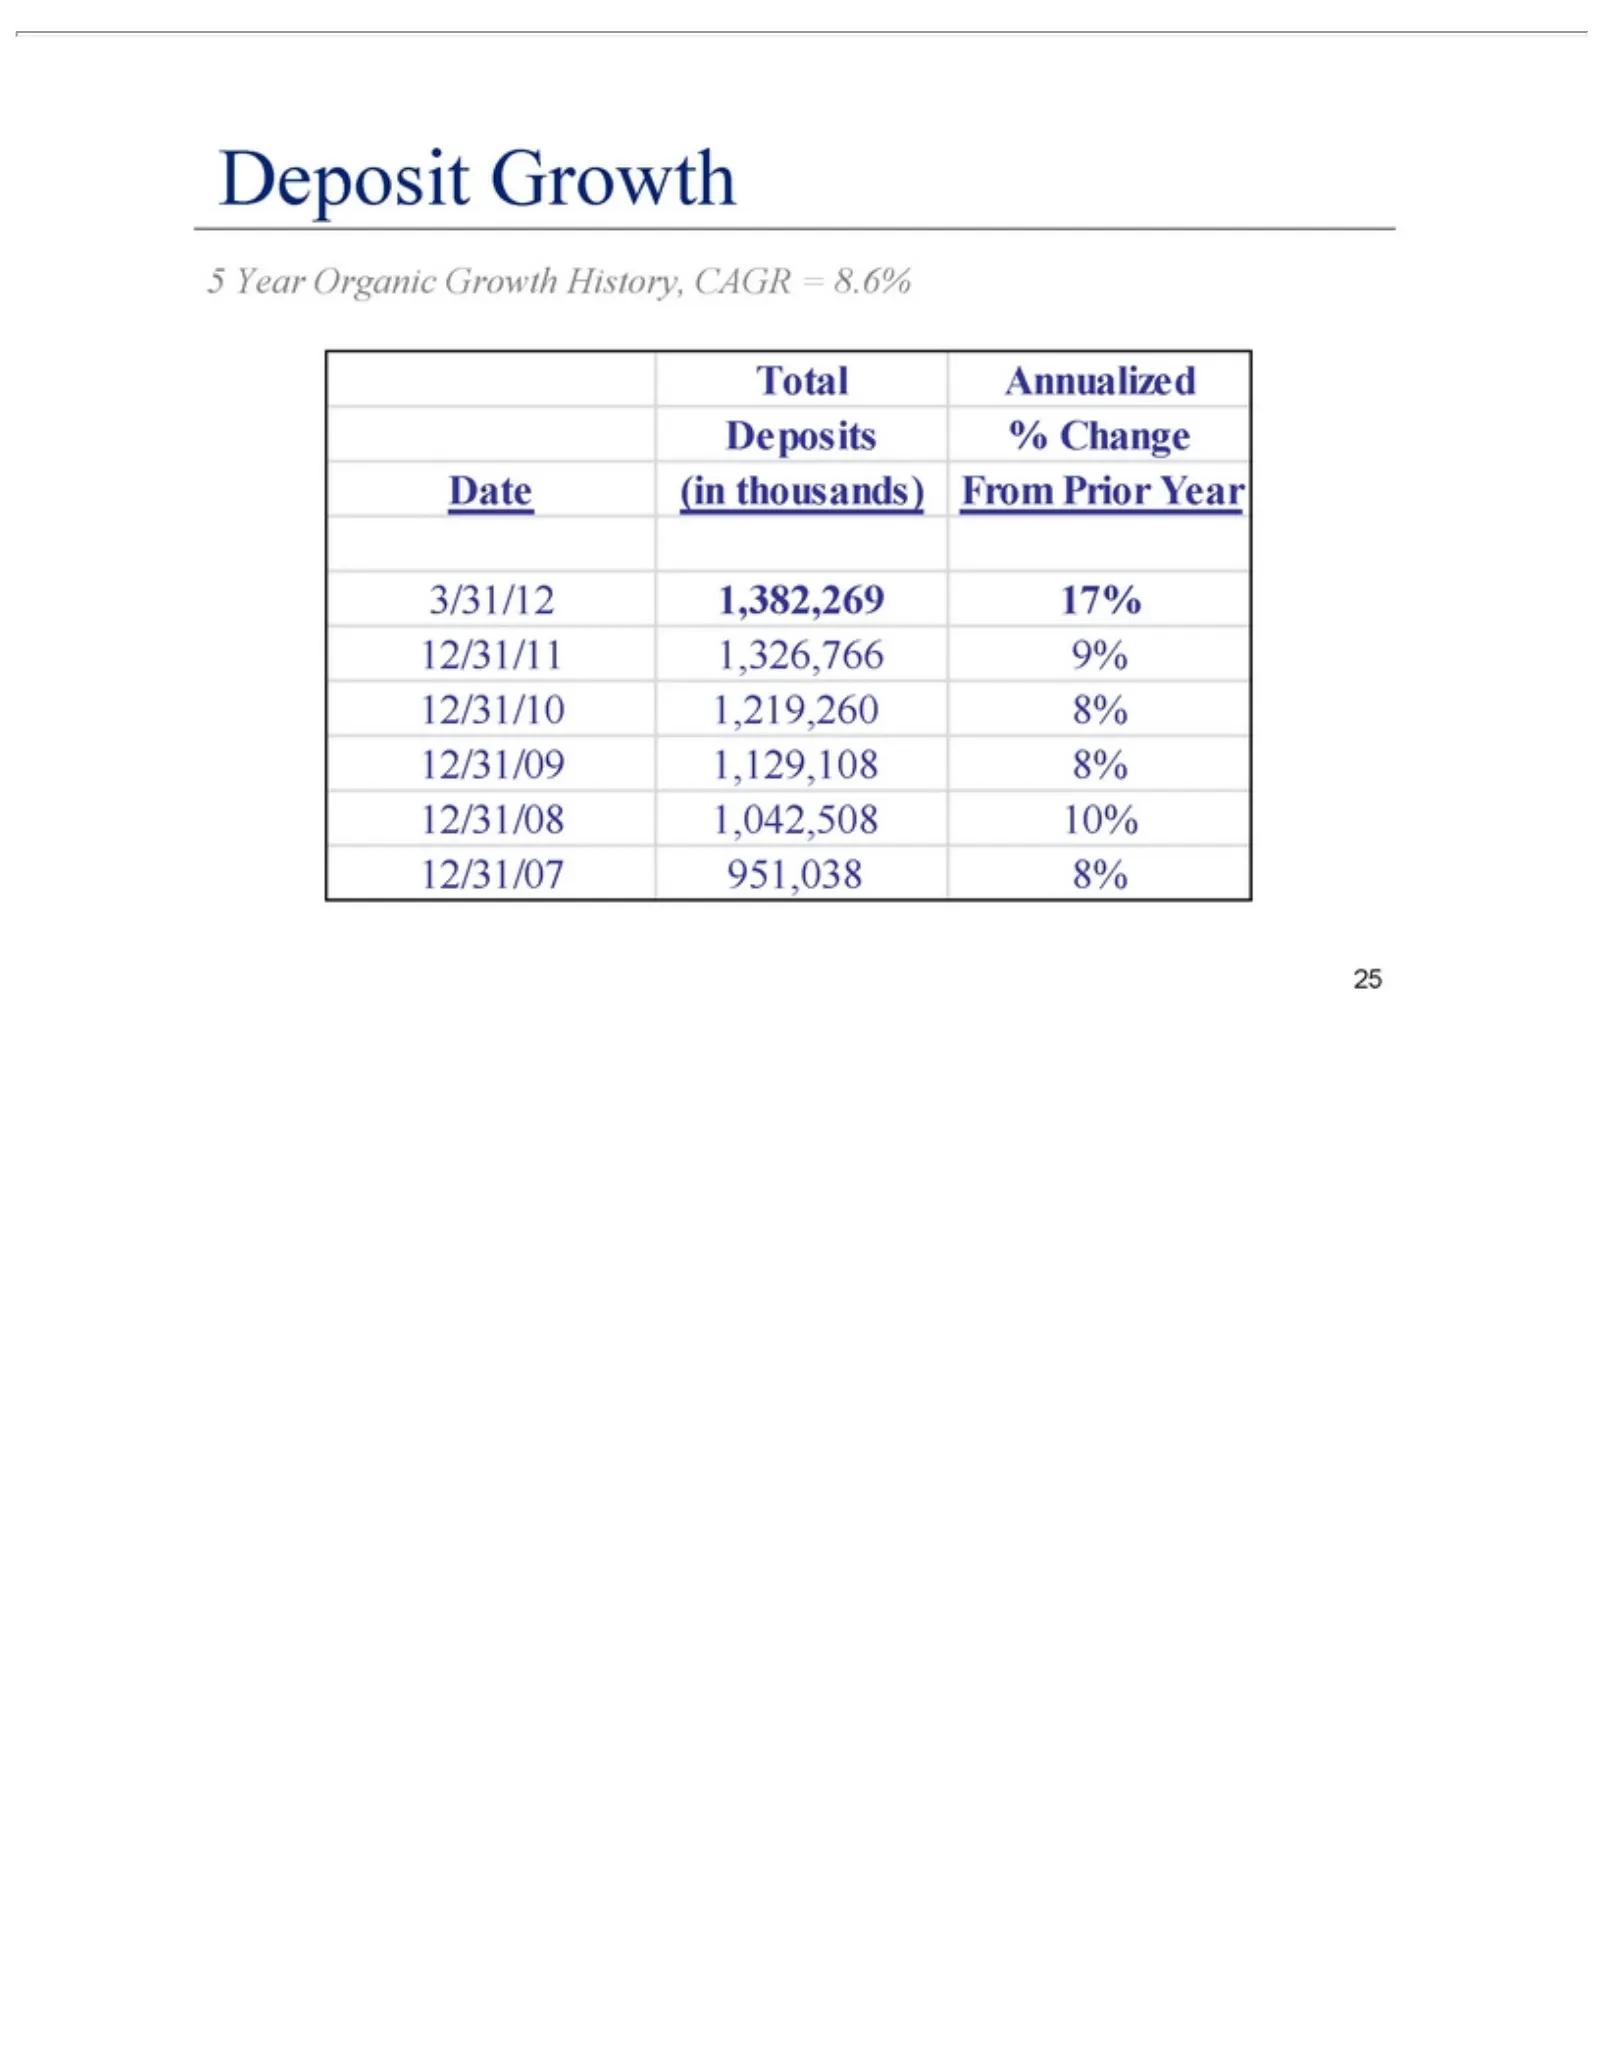
Slide 25: Deposit Growth
Deposit 5 Year Growth Organic Total Annualized 3/31/12 12/31/11 25 1,382,269 1,326,766 Growth Deposits 17% 9% History, 12/31/10 % Change CAGR 1,219,260 Date 8%=thousands) (in 8.6% 12/31/09 1,129,108 From Prior8% Year 12/31/08 1,042,508 10% 12/31/07 951,038 8%
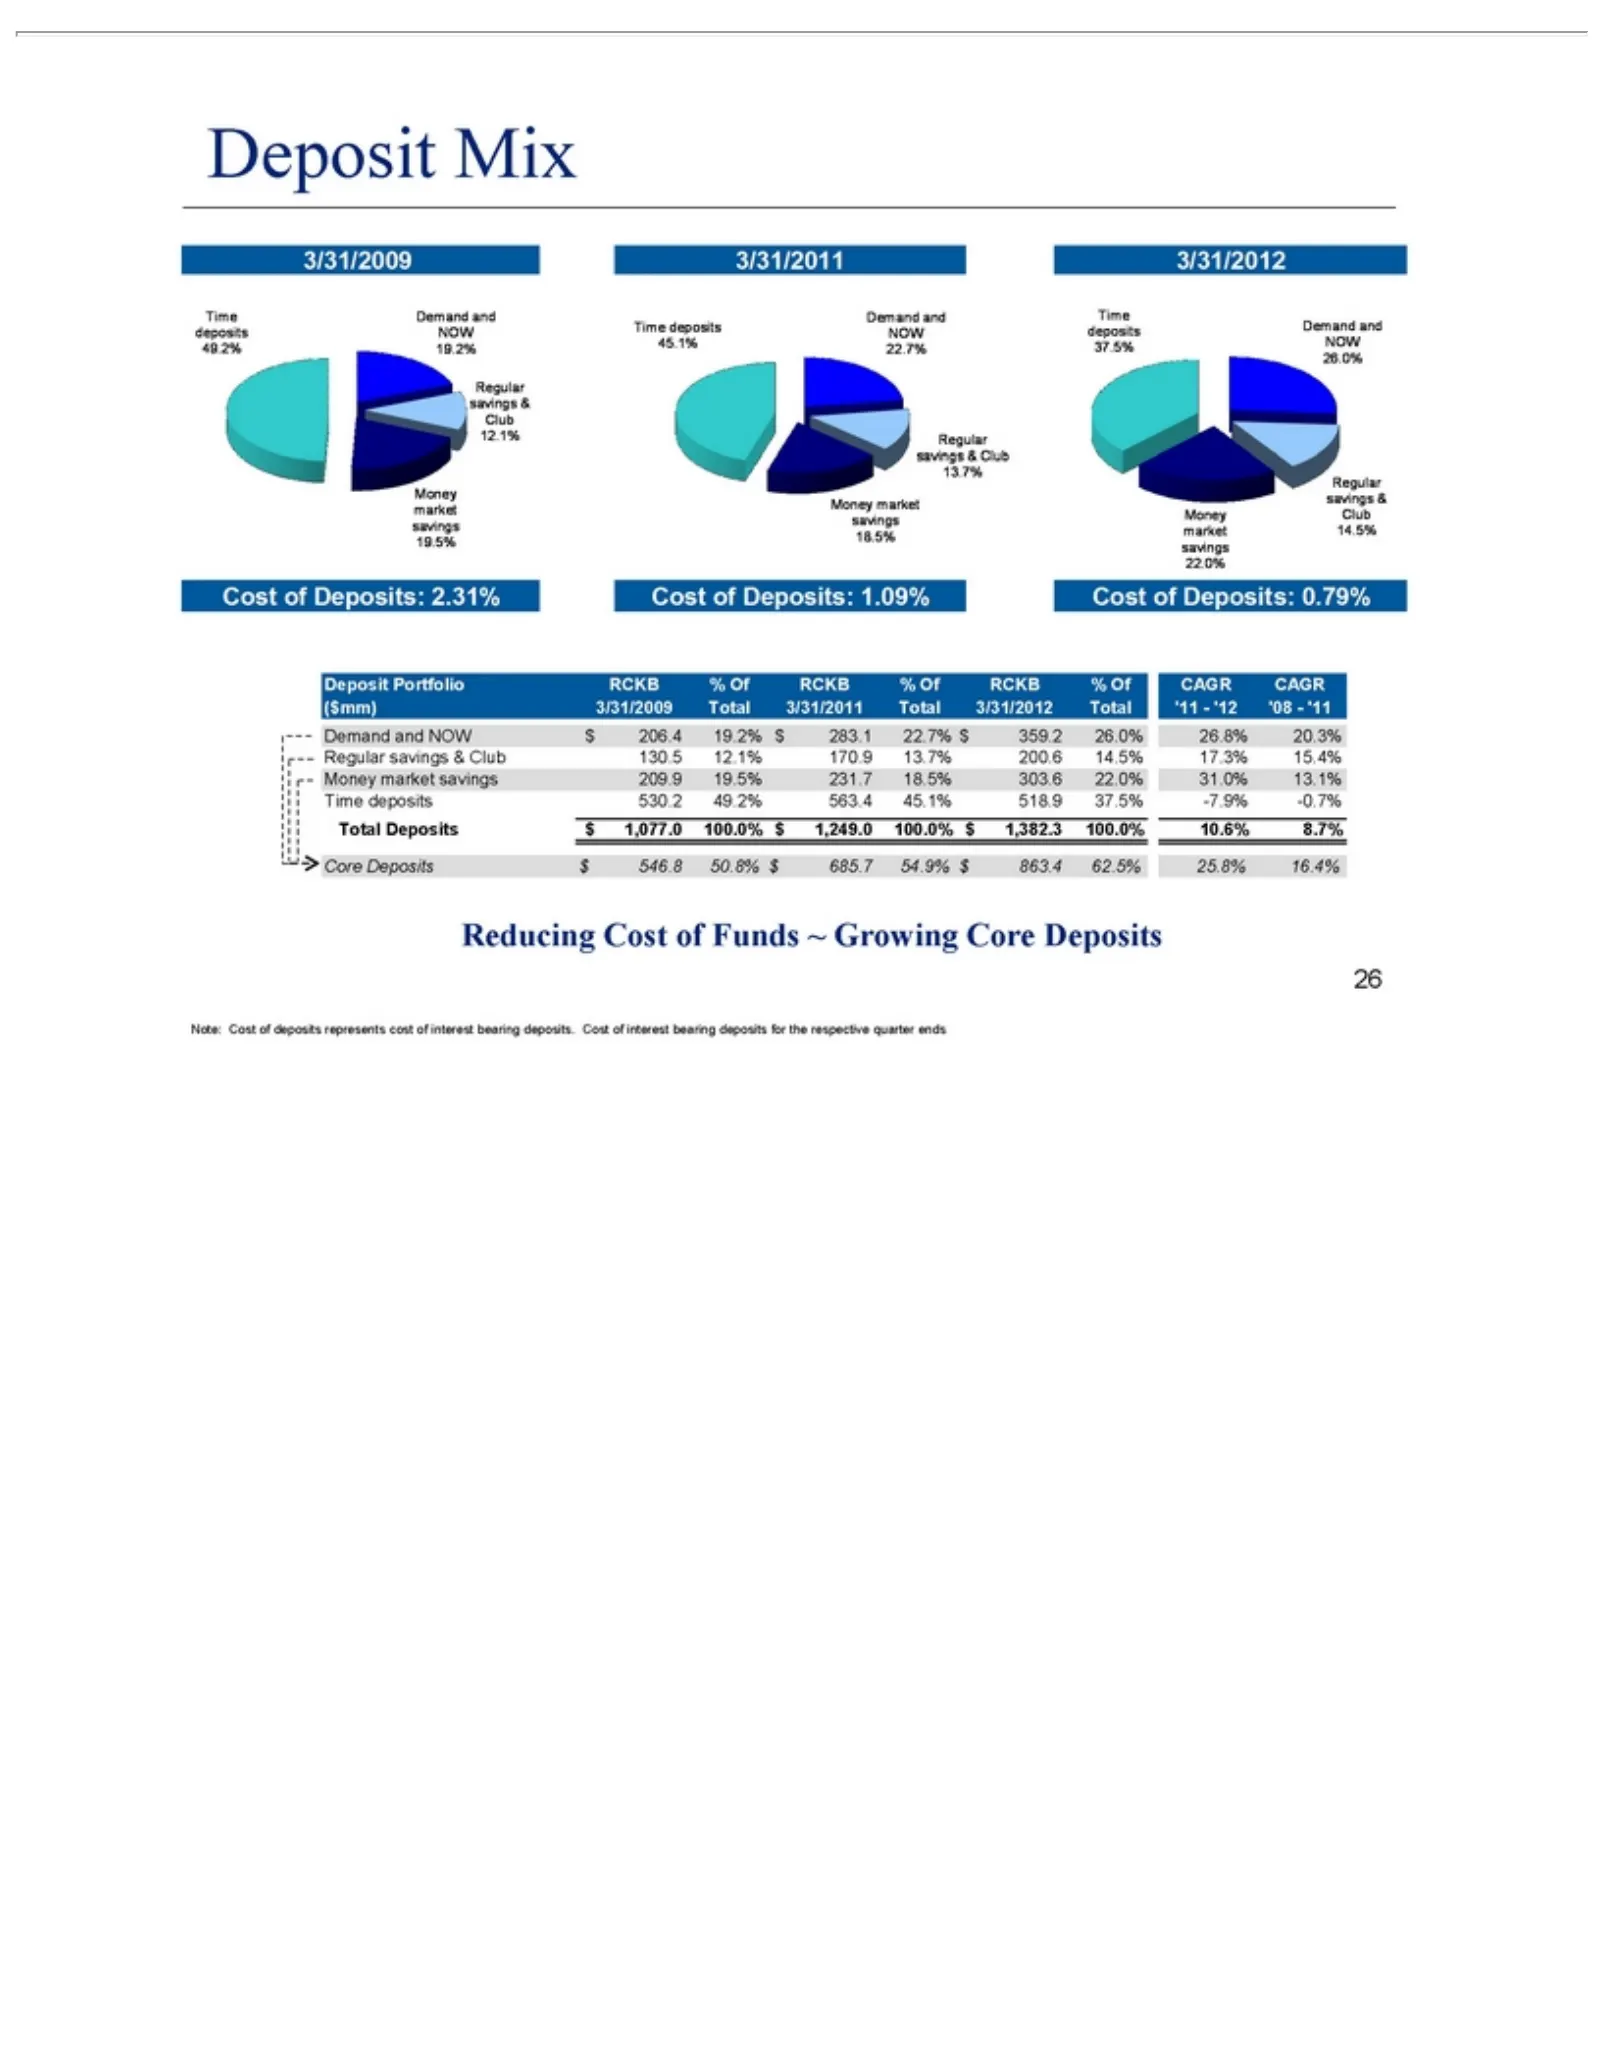
Slide 26: Deposit Portfolio Mix and Cost
Deposit Demand 231.7 Total Core Reducing Note: 26 Deposits Cost 18.5% Mix Portfolio and Cost ofNOW 303.6 deposits $of546.8 1,077.0 RCKB Funds 22.0% $ 206.4 represents 50.8% ~100.0% %31.0% Growing 19.2% Of$RCKB 685.7 $cost 13.1% $1,249.0 Core 283.1 54.9% of %Time interest Of Deposits 22.7% 100.0% RCK
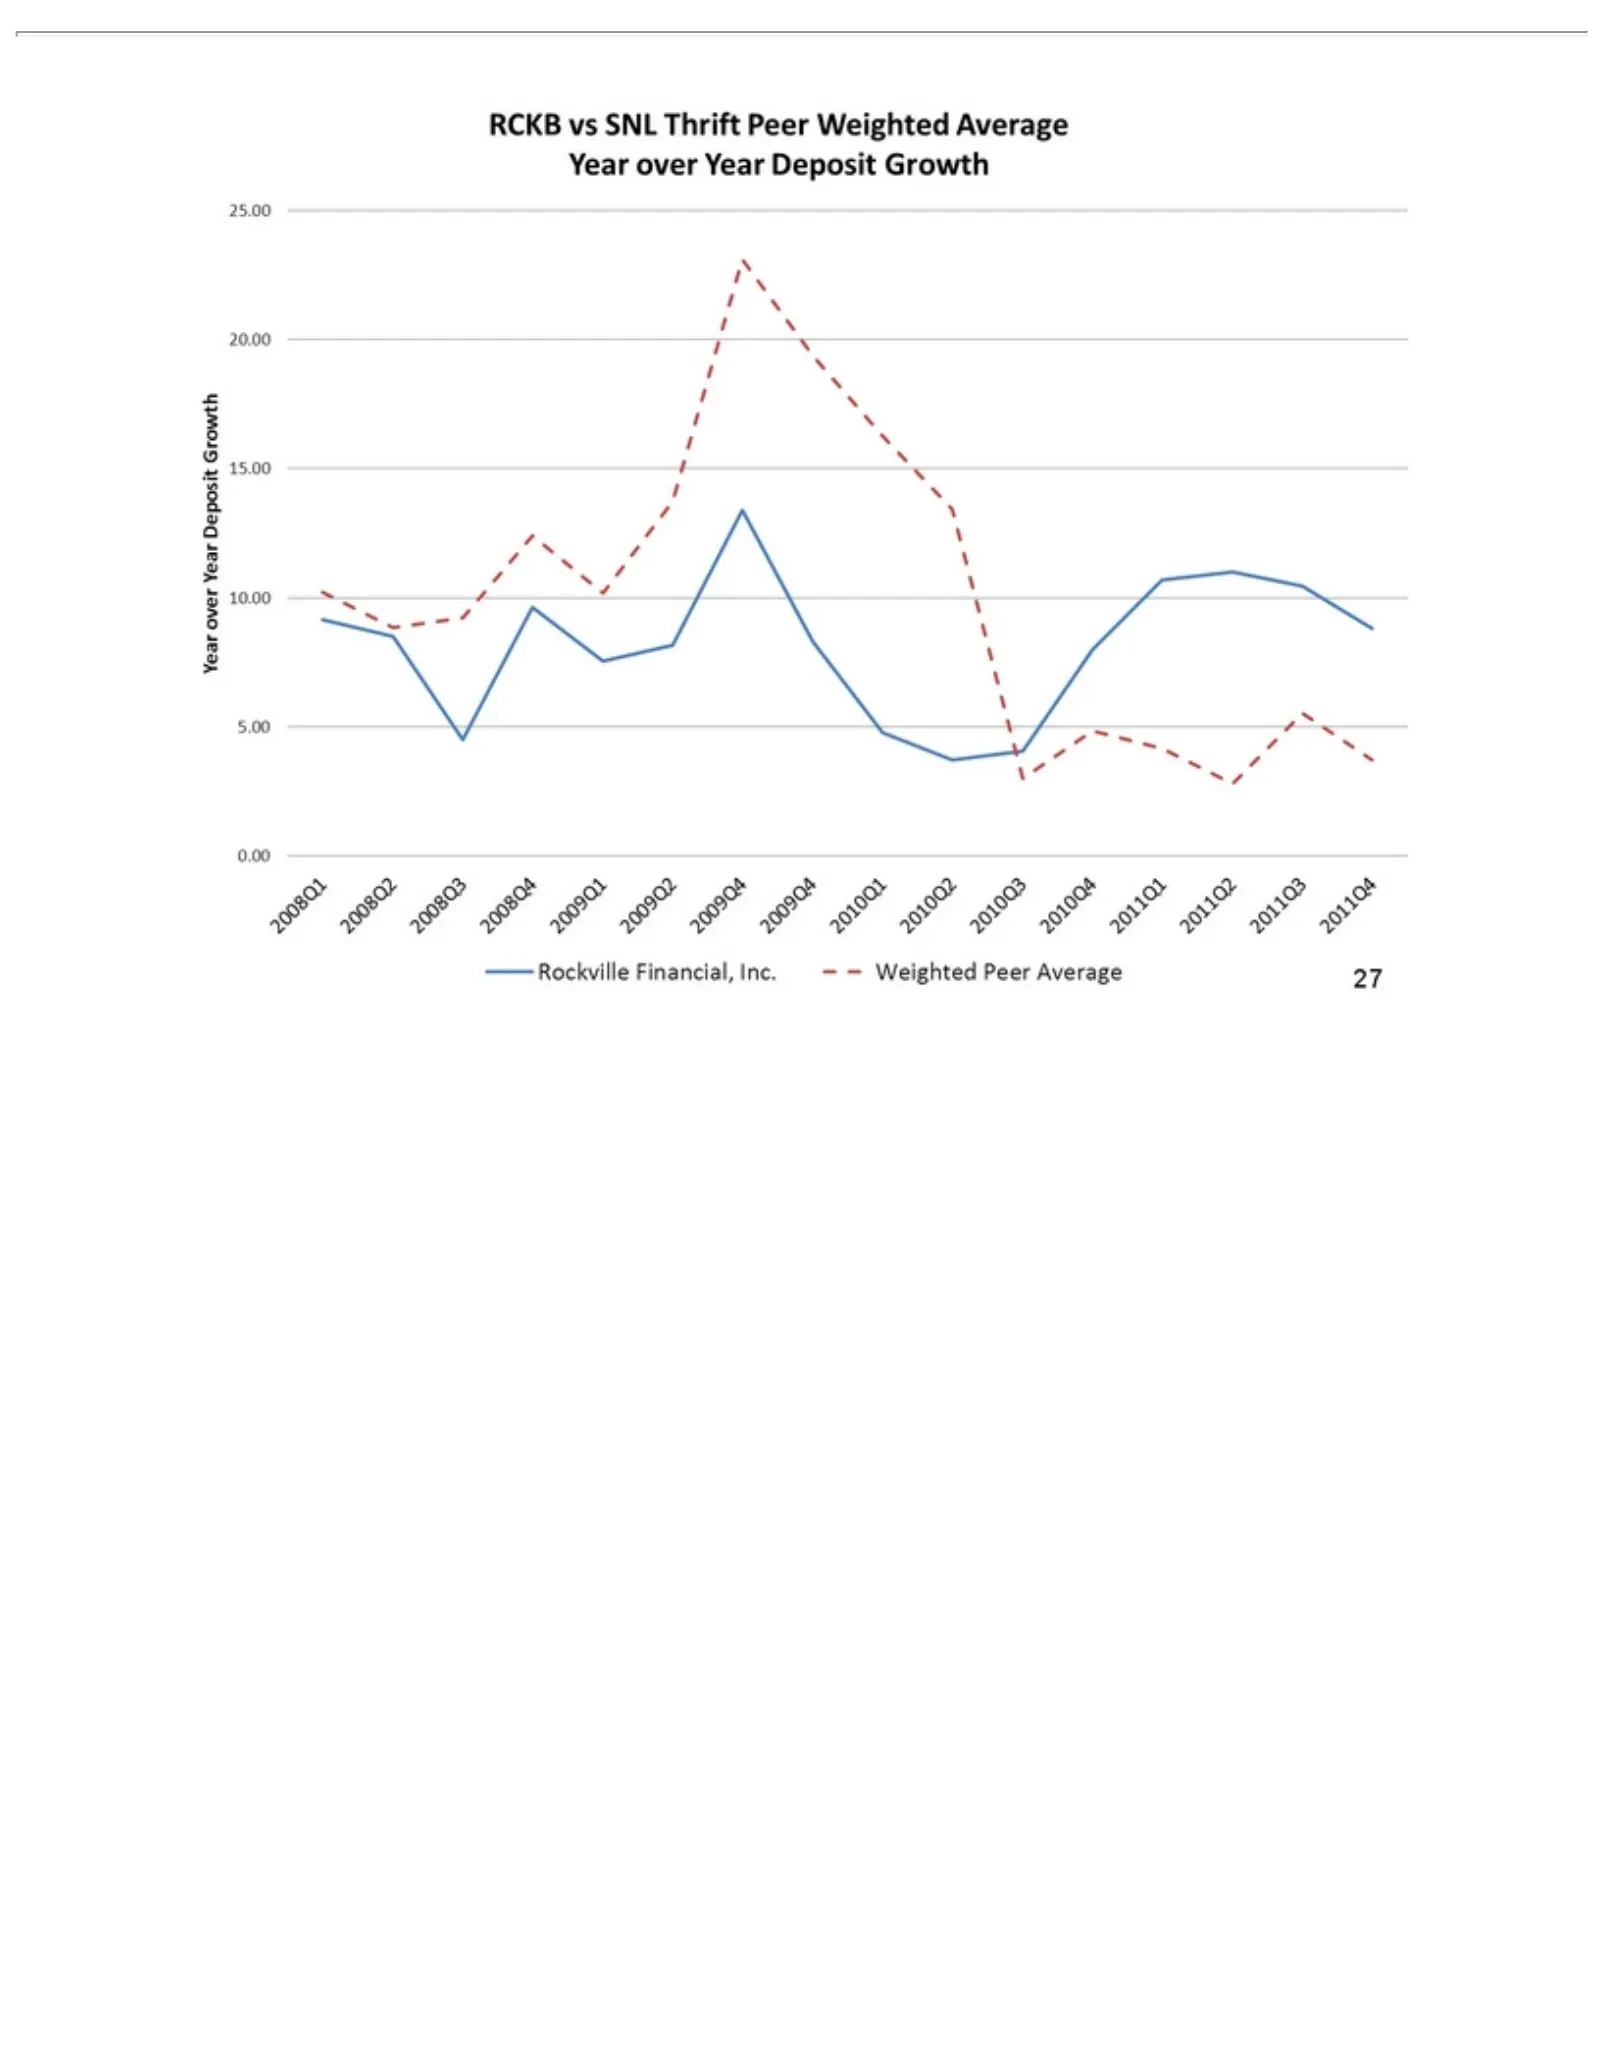
Slide 27: Deposit Growth vs SNL Thrift Peers
RCKB vs SNL THRIFT Peer weighted average year over yeardeposit growth 27
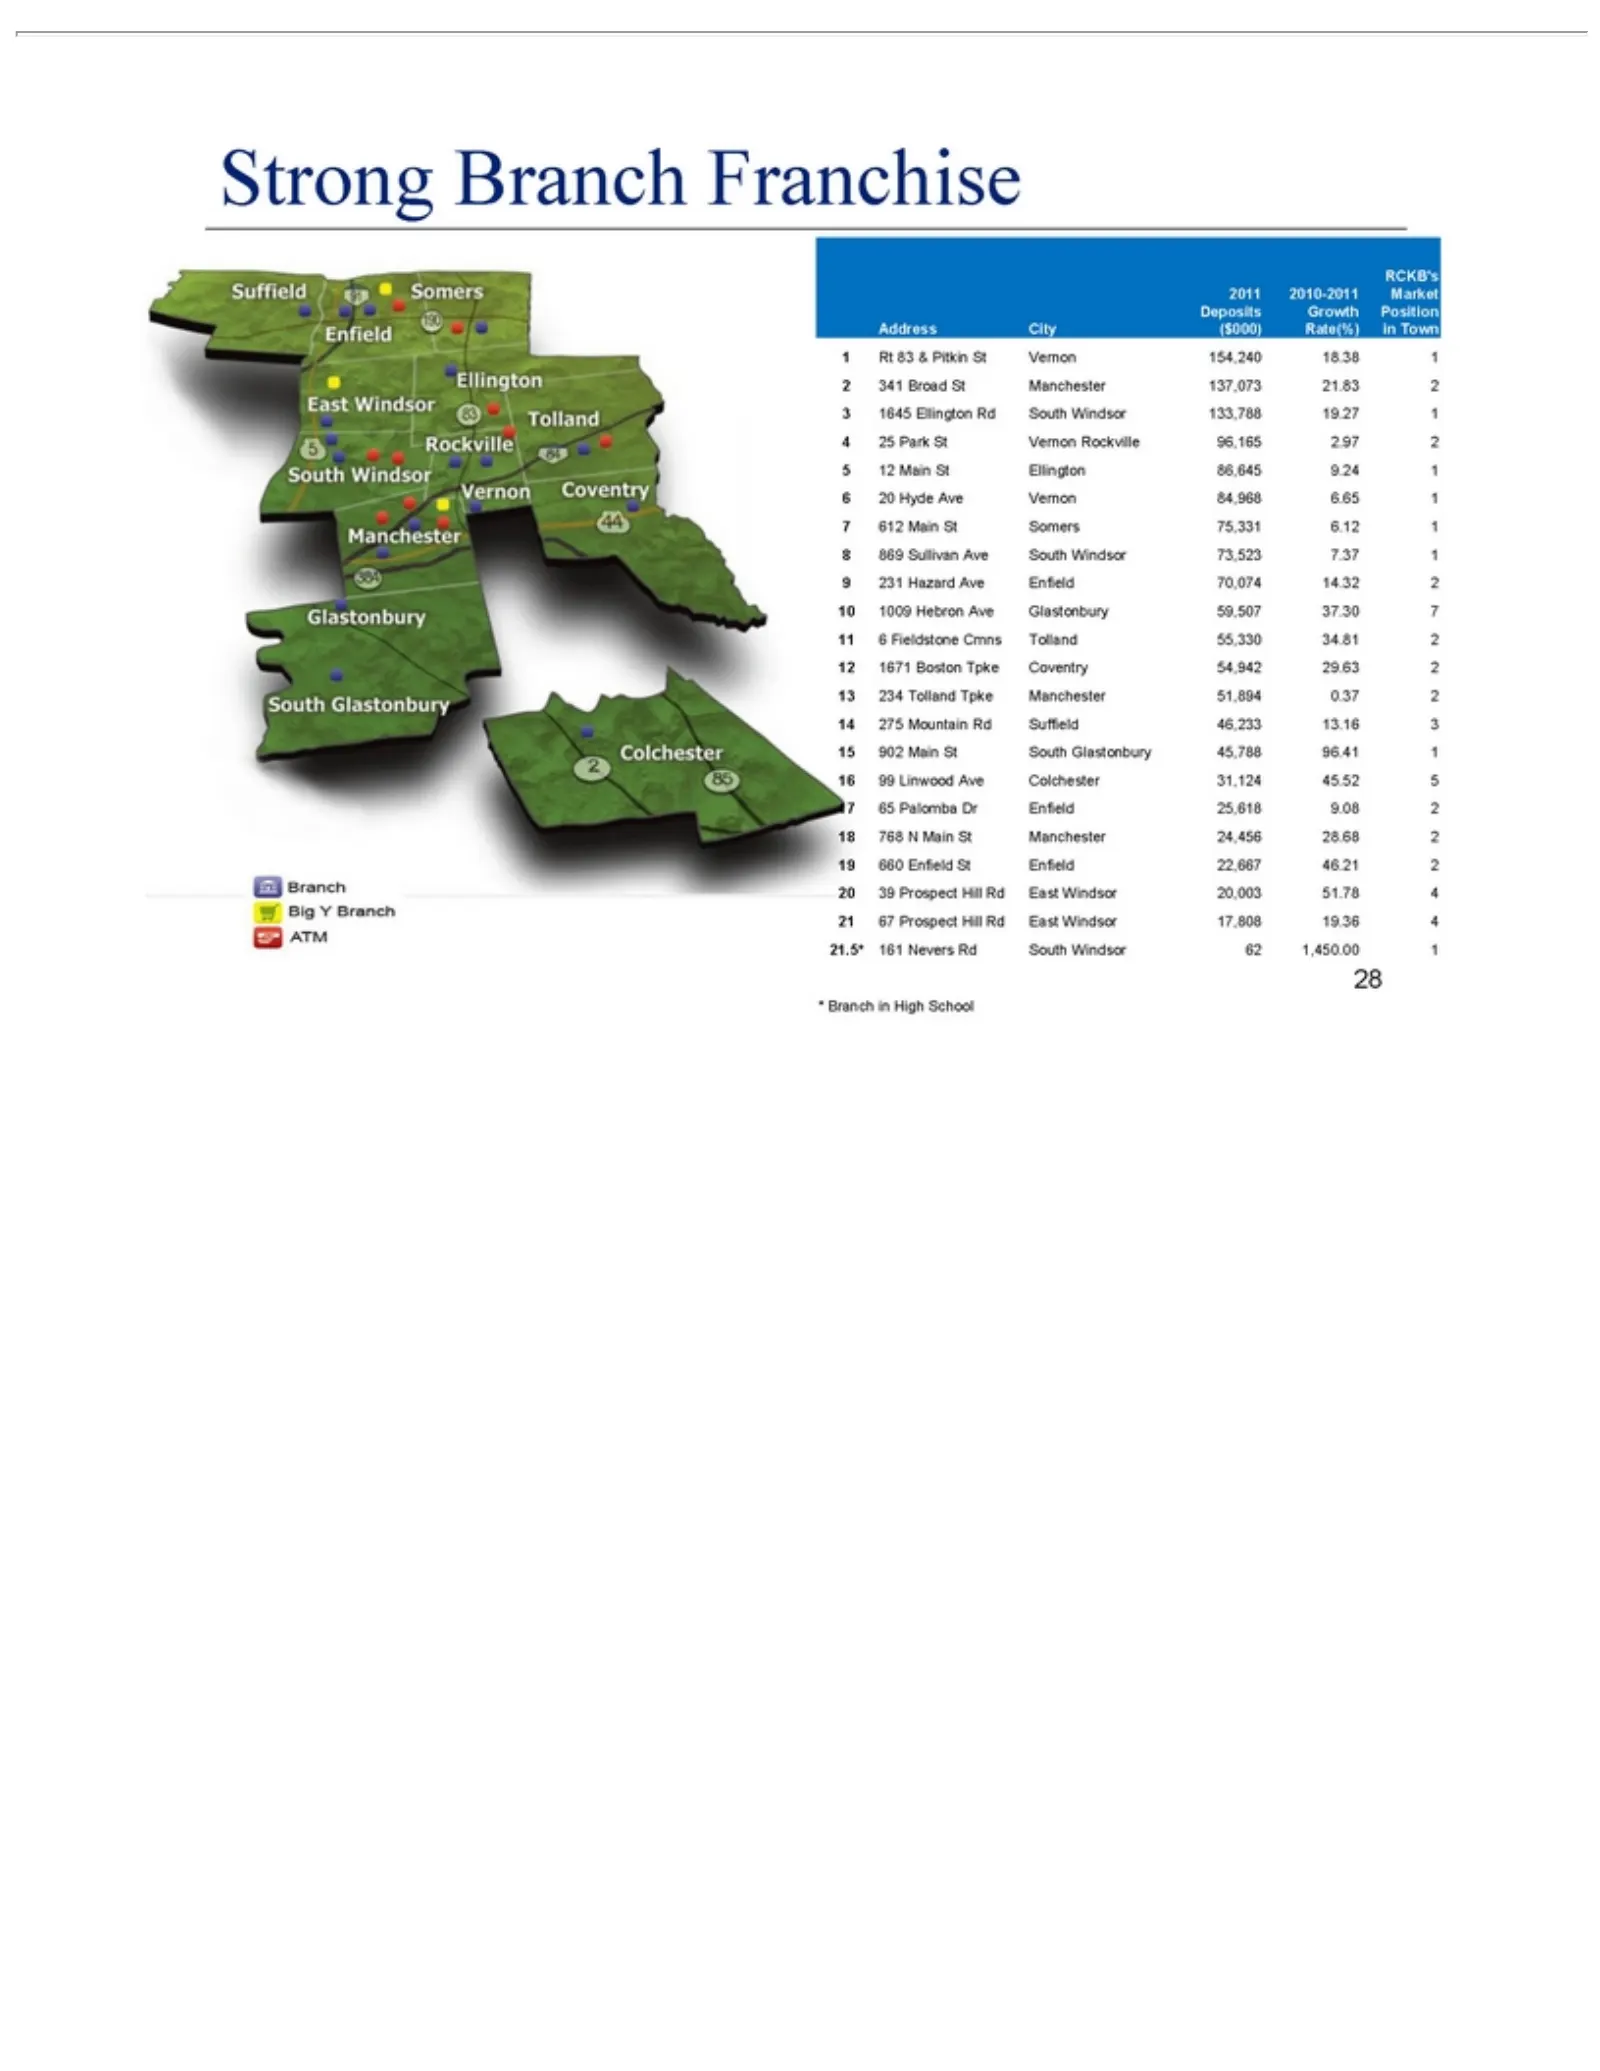
Slide 28: Strong Branch Franchise and Market Position
Strong 2011 RCKB’s Deposits Address 1 2 3 2010-2011 Branch Rt City Growth 34183 1645 ($000) &Franchise BroadPitkin Market Position St EllingtonRate(%) St RdVernon in Town Manchester South 154,240 137,073 Windsor 18.38 2.9717.37 21.83 22 19.27 1 4 5 6 7 8 9 231 10 11 12 13 14 15 16 17 18 19 20 21 21.
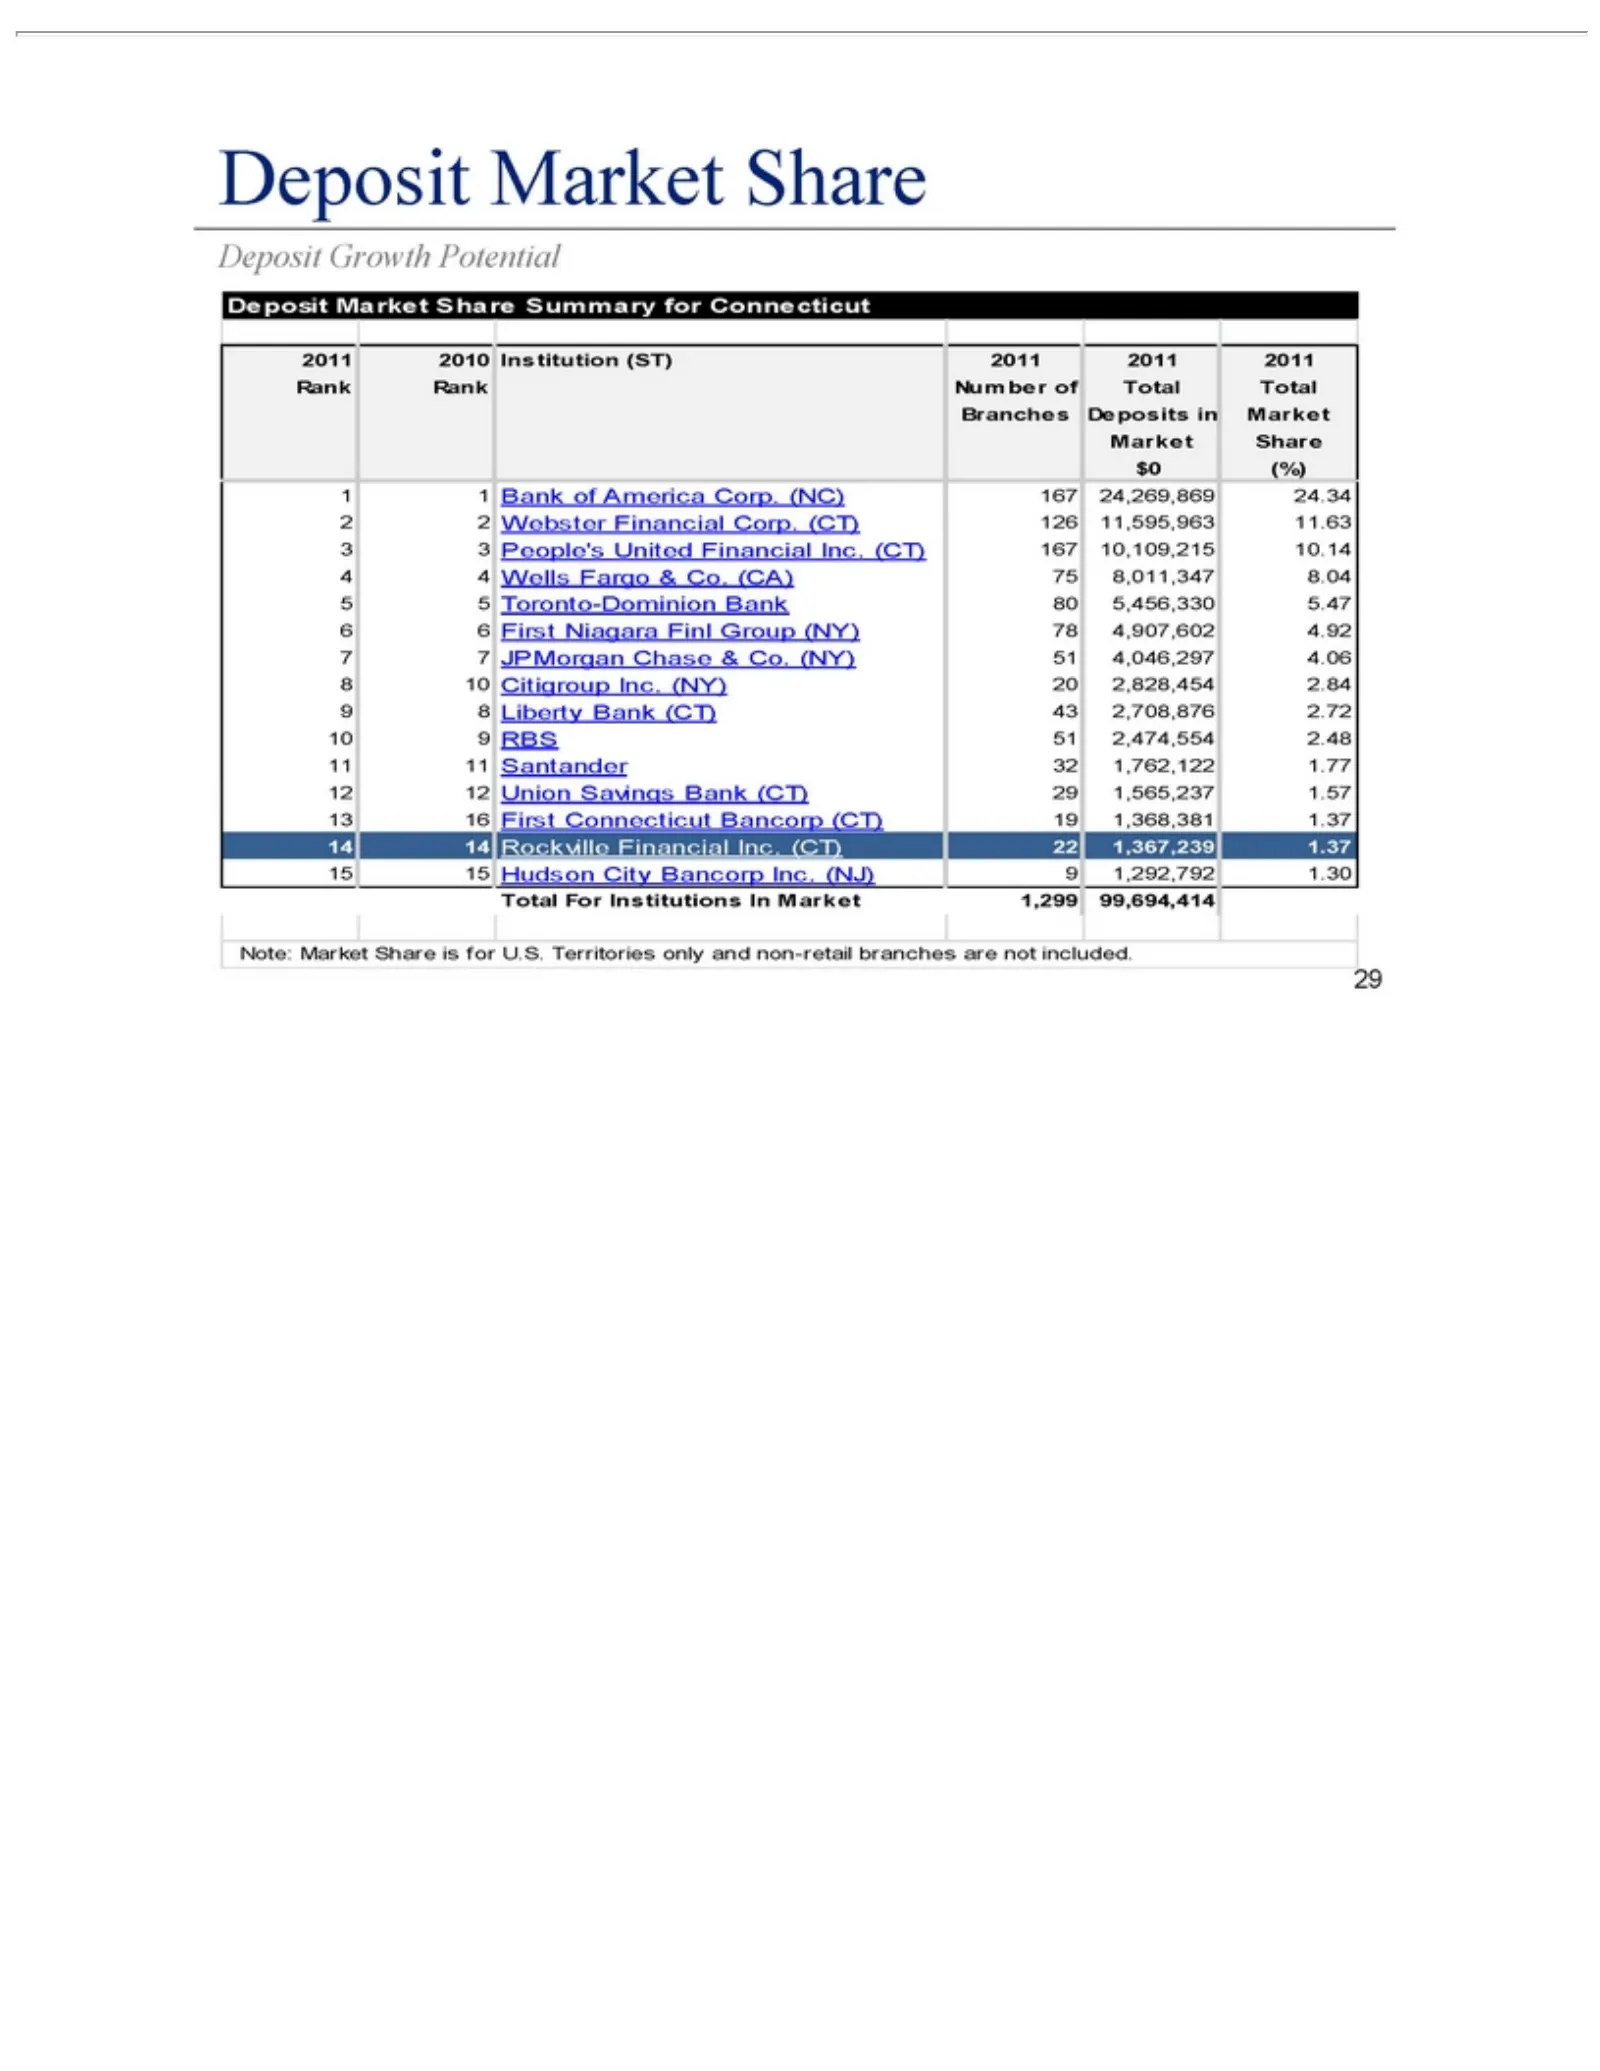
Slide 29: Deposit Market Share in Connecticut
Deposit 2011 $0 1 2 3 4 5 (%)2010 3217654Market Growth Bank Institution Websterof People’s Wells Share Potential America (ST) Summary Financial United Fargo Toronto-Dominion& Co.2011 Corp. Corp.2011 for Financial (CA) Bank (NC) Connecticut (CT) 75 2011 Inc. 80 167 126 (CT)Rank 24,269,869 8,011,347 R
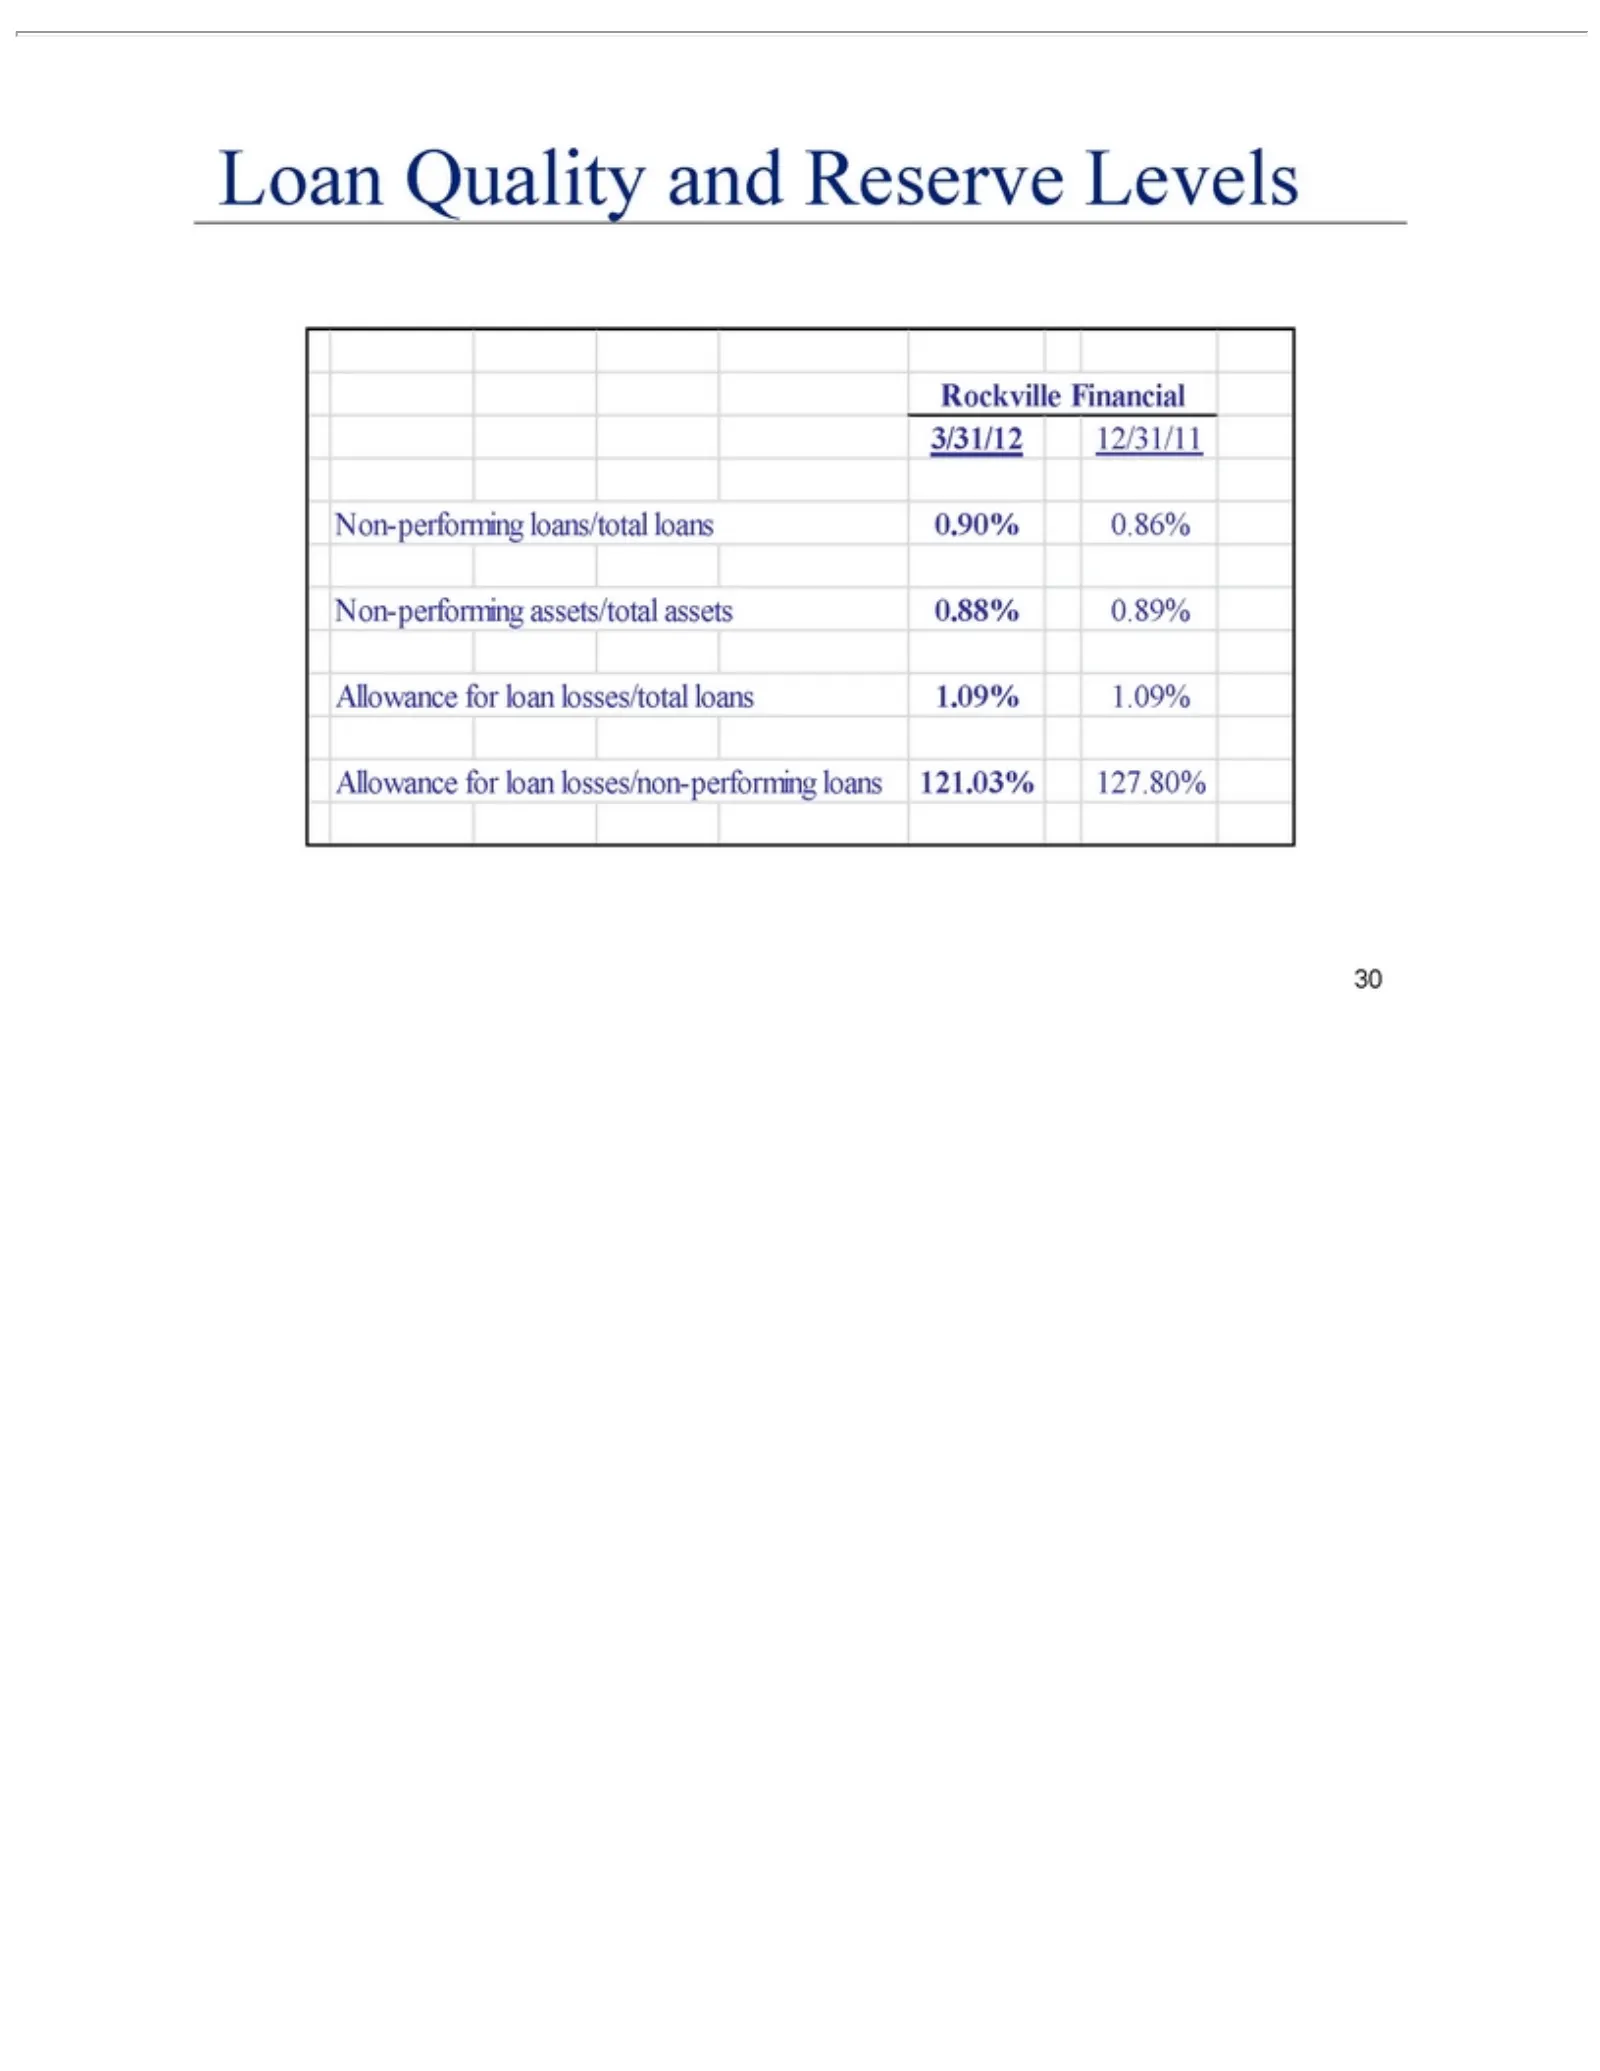
Slide 30: Loan Quality and Reserve Levels
Loan Quality Rockville Non-performing 121.03% 30 127.80% Financial andloans/total Reserve 3/31/12Levels loans 12/31/11 0.90% 0.86% Non-performing assets/total assets 0.88% 0.89% Allowance for loan losses/total loans 1.09% 1.09% Allowance for loan losses/non-performing loans
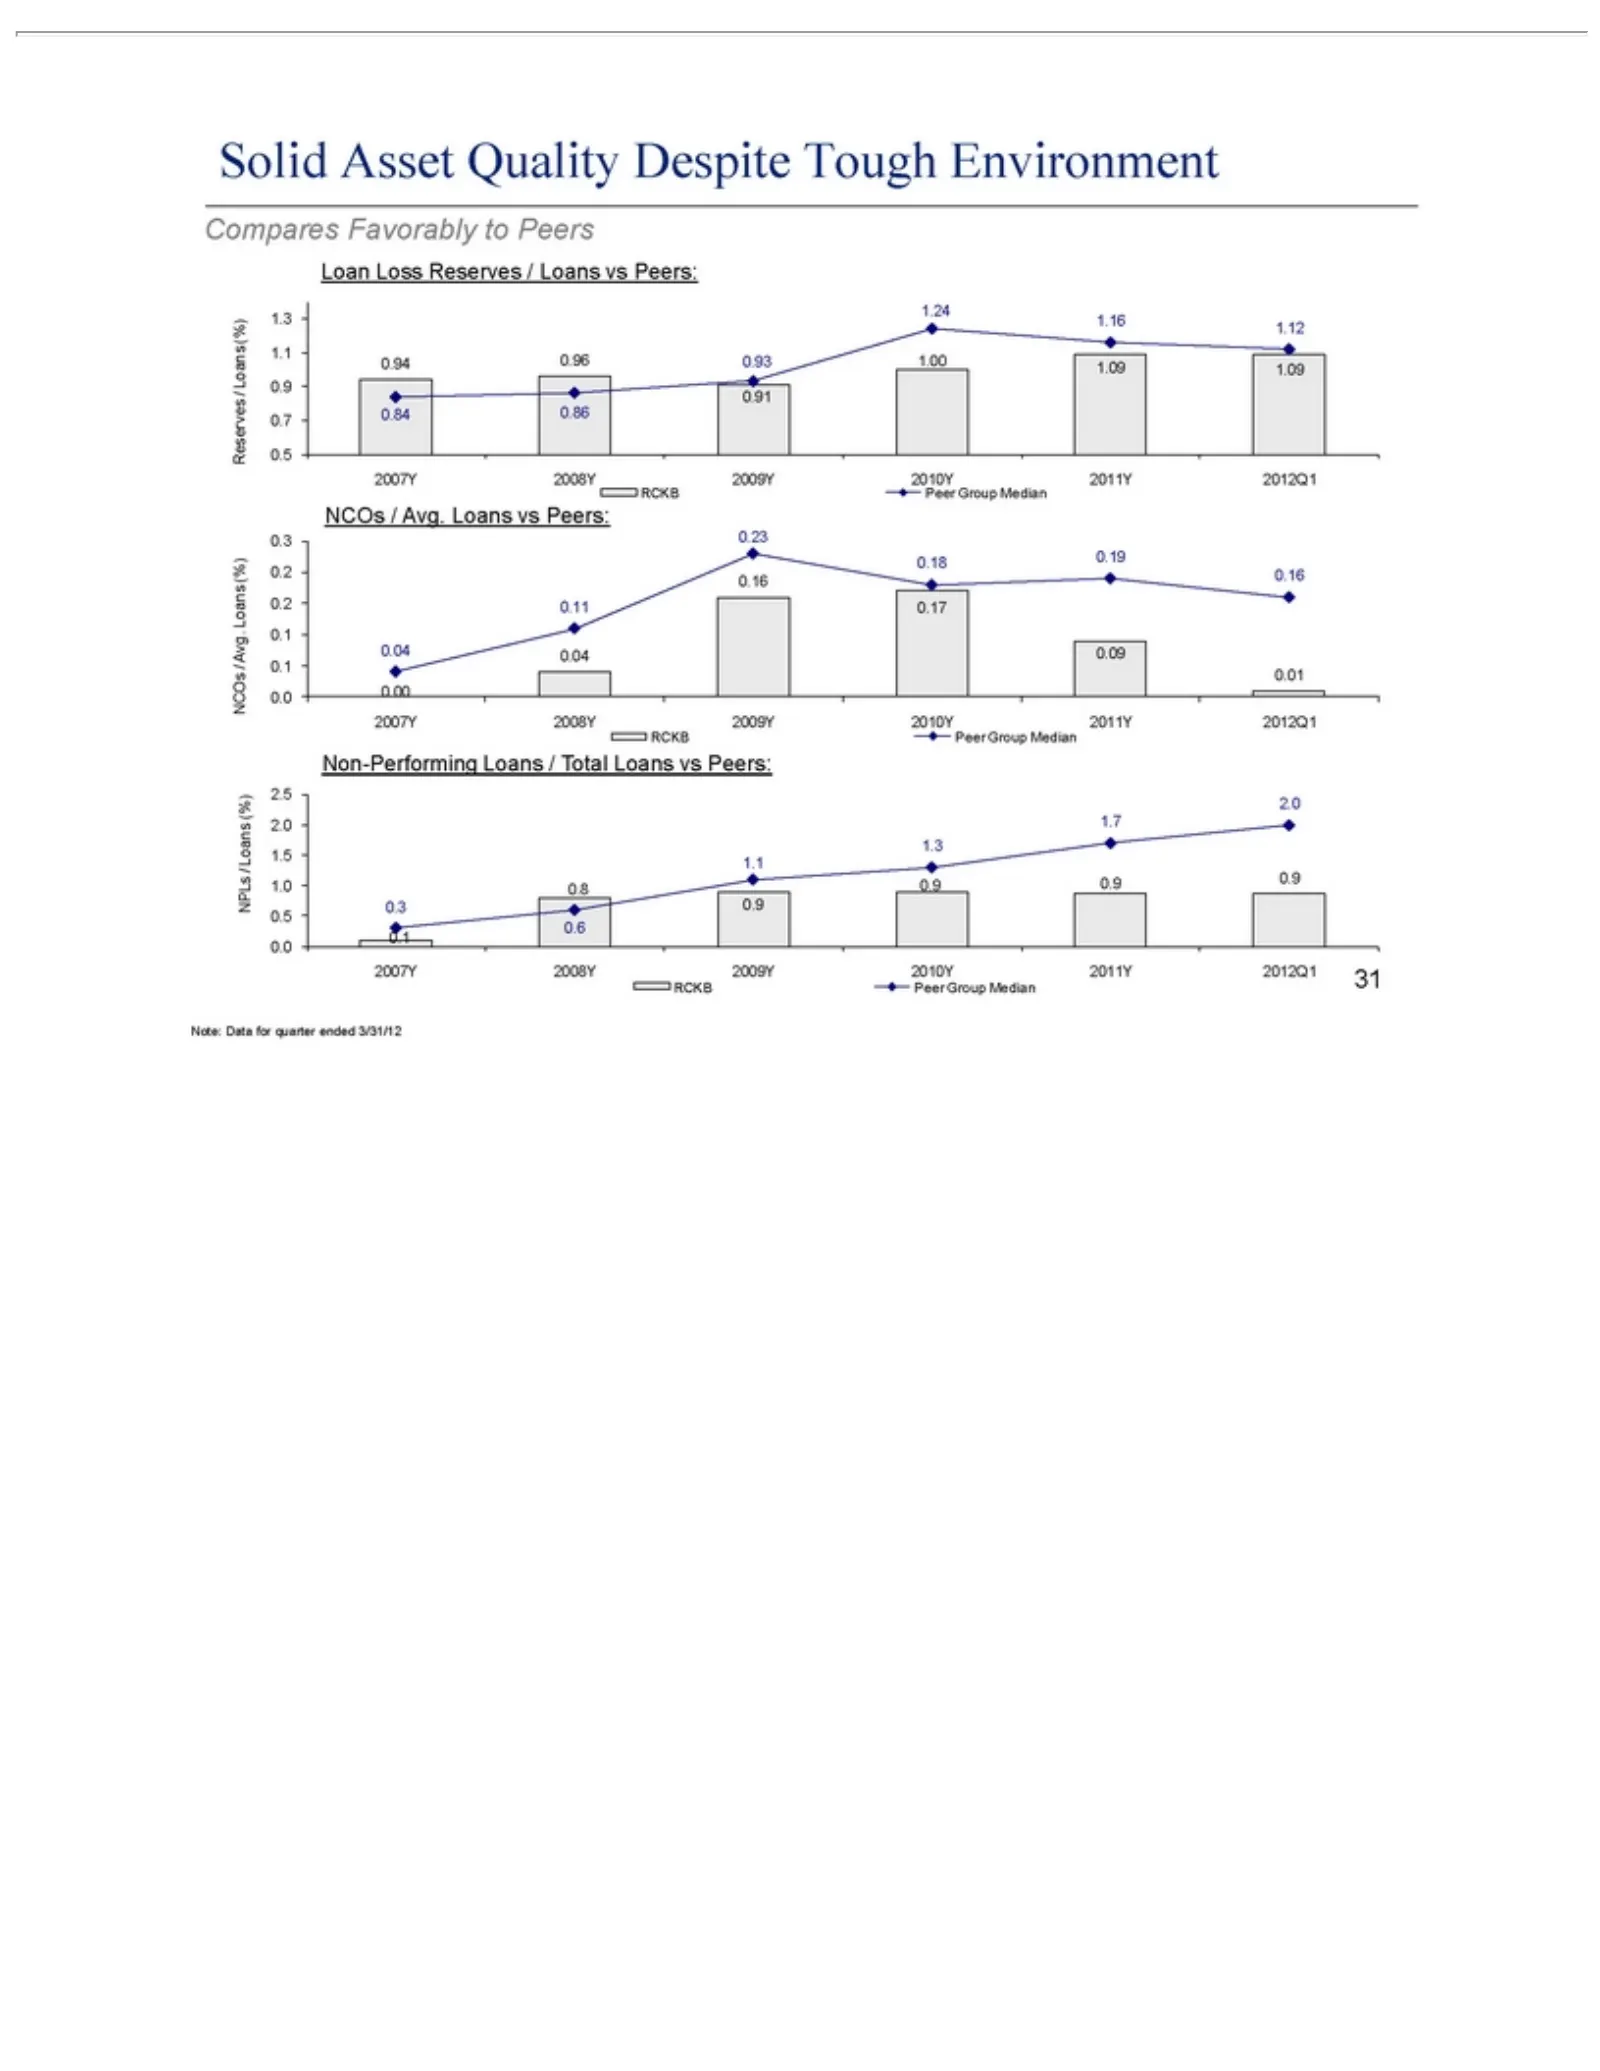
Slide 31: Solid Loan Quality Compares Favorably vs Peers
Solid Loss Compares Loan NCOs Non-Performing Note: 31 Asset Data / Avg. Favorably Reserves for Quality Loans quarter Loans Despite vs /to Loans ended Peers: /Peers Total Tough vs 3/31/12 Loans Peers: Environment vs Peers:
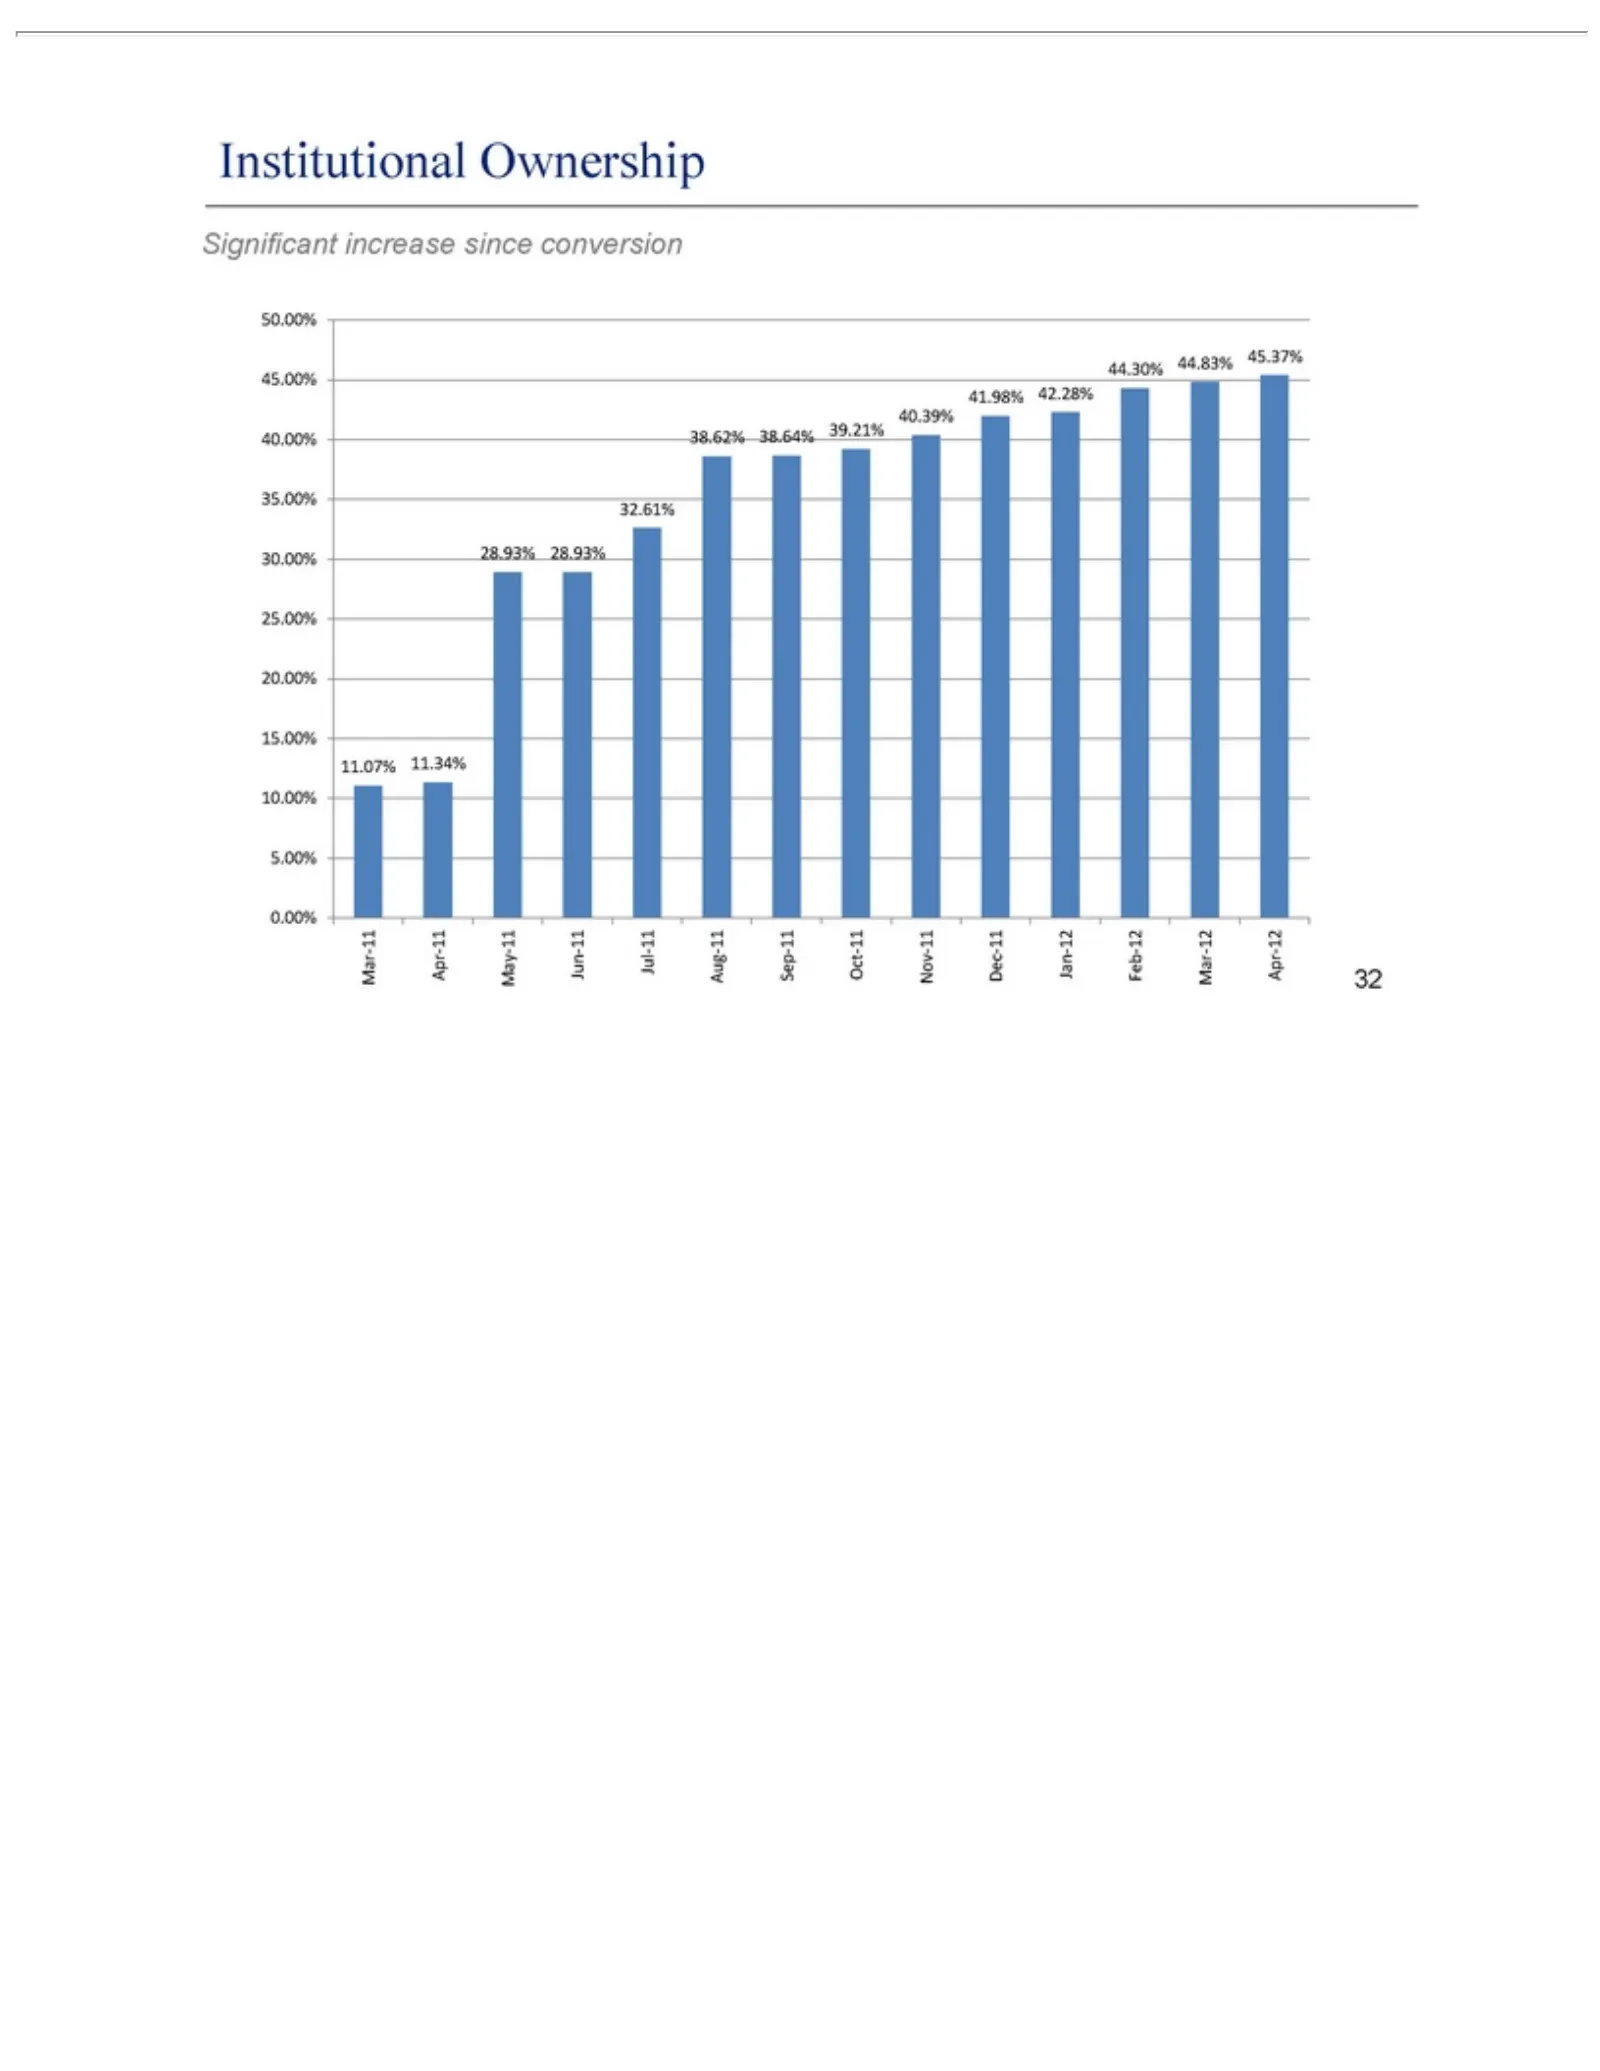
Slide 32: Significant Institutional Ownership Increase
Institutional Significant 50.00% 44.83% 28.93% 32.61% 11.07% Mar-11 32 Apr-11 11.34% 45.00% 45.37% 28.93% increase Ownership May-11 40.00% 44.30% since Jun-11 35.00% 41.98% conversion Jul-11 30.00% 42.28% Aug-11 25.00% 40.39% Sep-11 20.00% 38.62% Oct-11 15.00% 38.64% Nov-11 10.00% 39.21% Dec-11 5.00
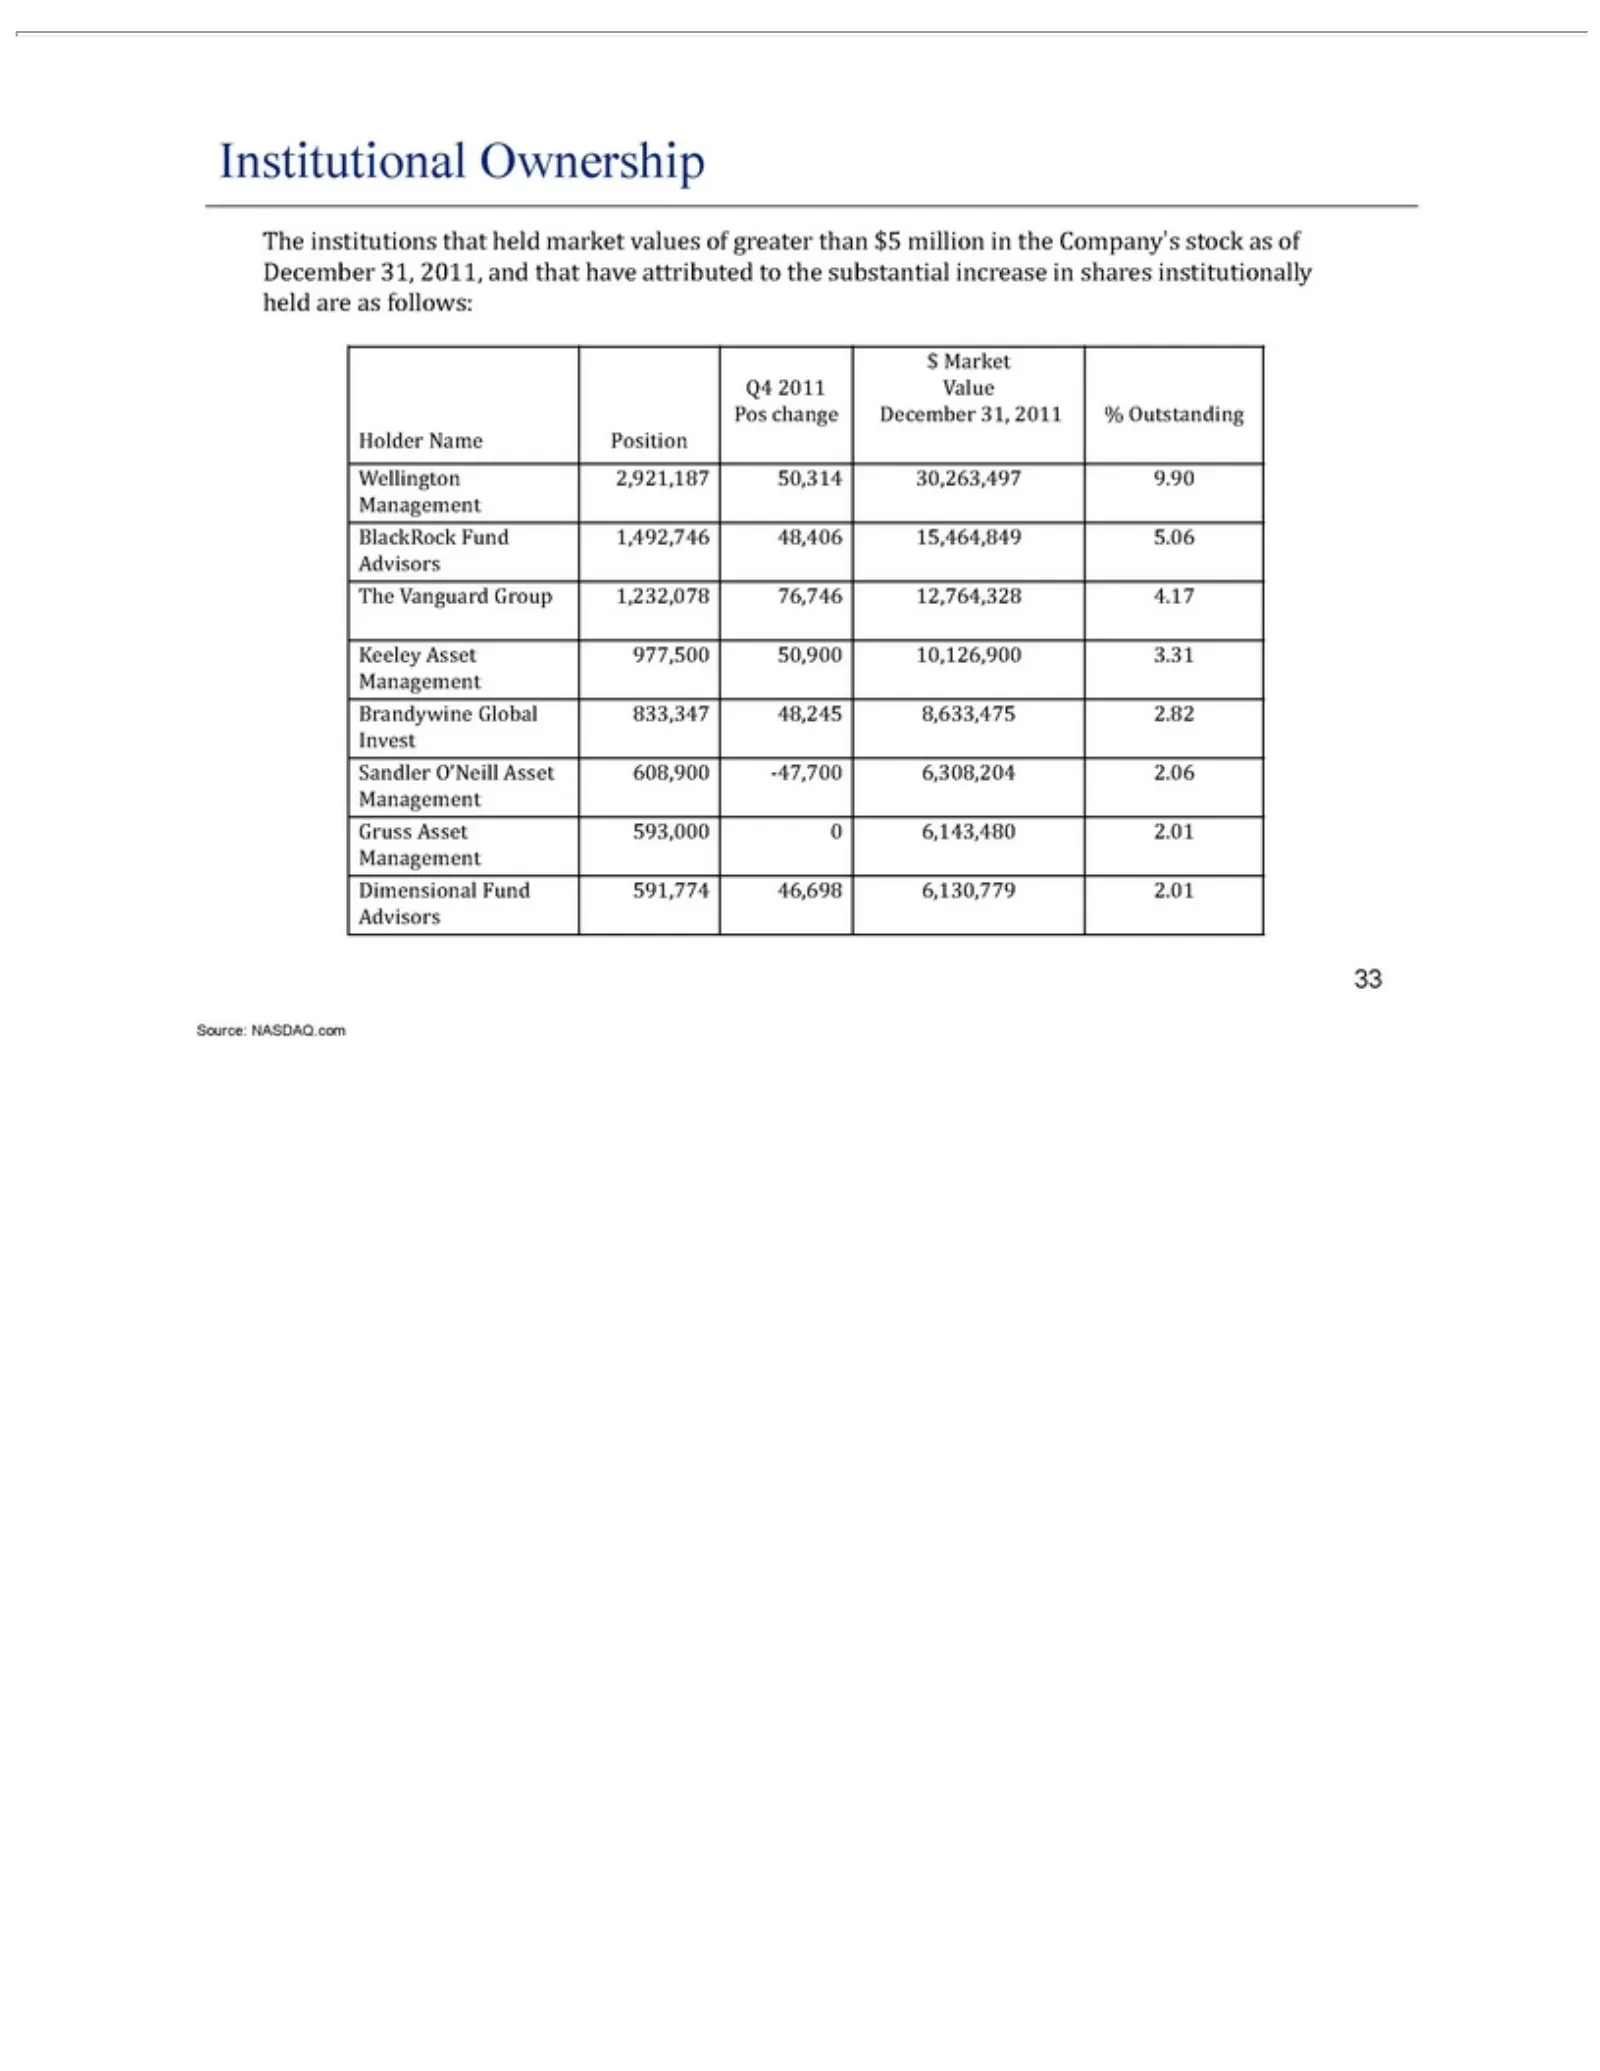
Slide 33: Institutional Ownership Holders
Institutional The are $ Wellington Keeley 593,000 Source: 33Market asinstitutions follows: Asset NASDAQ.com 0Q4 6,143,480 2,921,187 Ownership 2011 977,500 thatValue held 2.01 50,314 50,900 Pos market Management change 30,263,497 10,126,900 values December Dimensional of9.90 3.31 greater Management 3
Slide 34: Appendix
34 APPENDIX

Slide 35: Non-Interest Expense to Average Assets Peer Comparison
Non-Interest NIE 3/31/2012 Fairfield 3.71 Financial, United New Source: 35 /3.45 England Average Financial SNL County 3.20 Inc 12/31/2011 Expense Financial; Bank (PBCT) Assets 3.23 Bank Bancorp, Dime CT(Quarterly)—Peers to 9/30/2011 CT 2.48 FDIC Average Bank 3.04 3.80 Inc. 2.51 Call (UBNK) 3.18 3.78
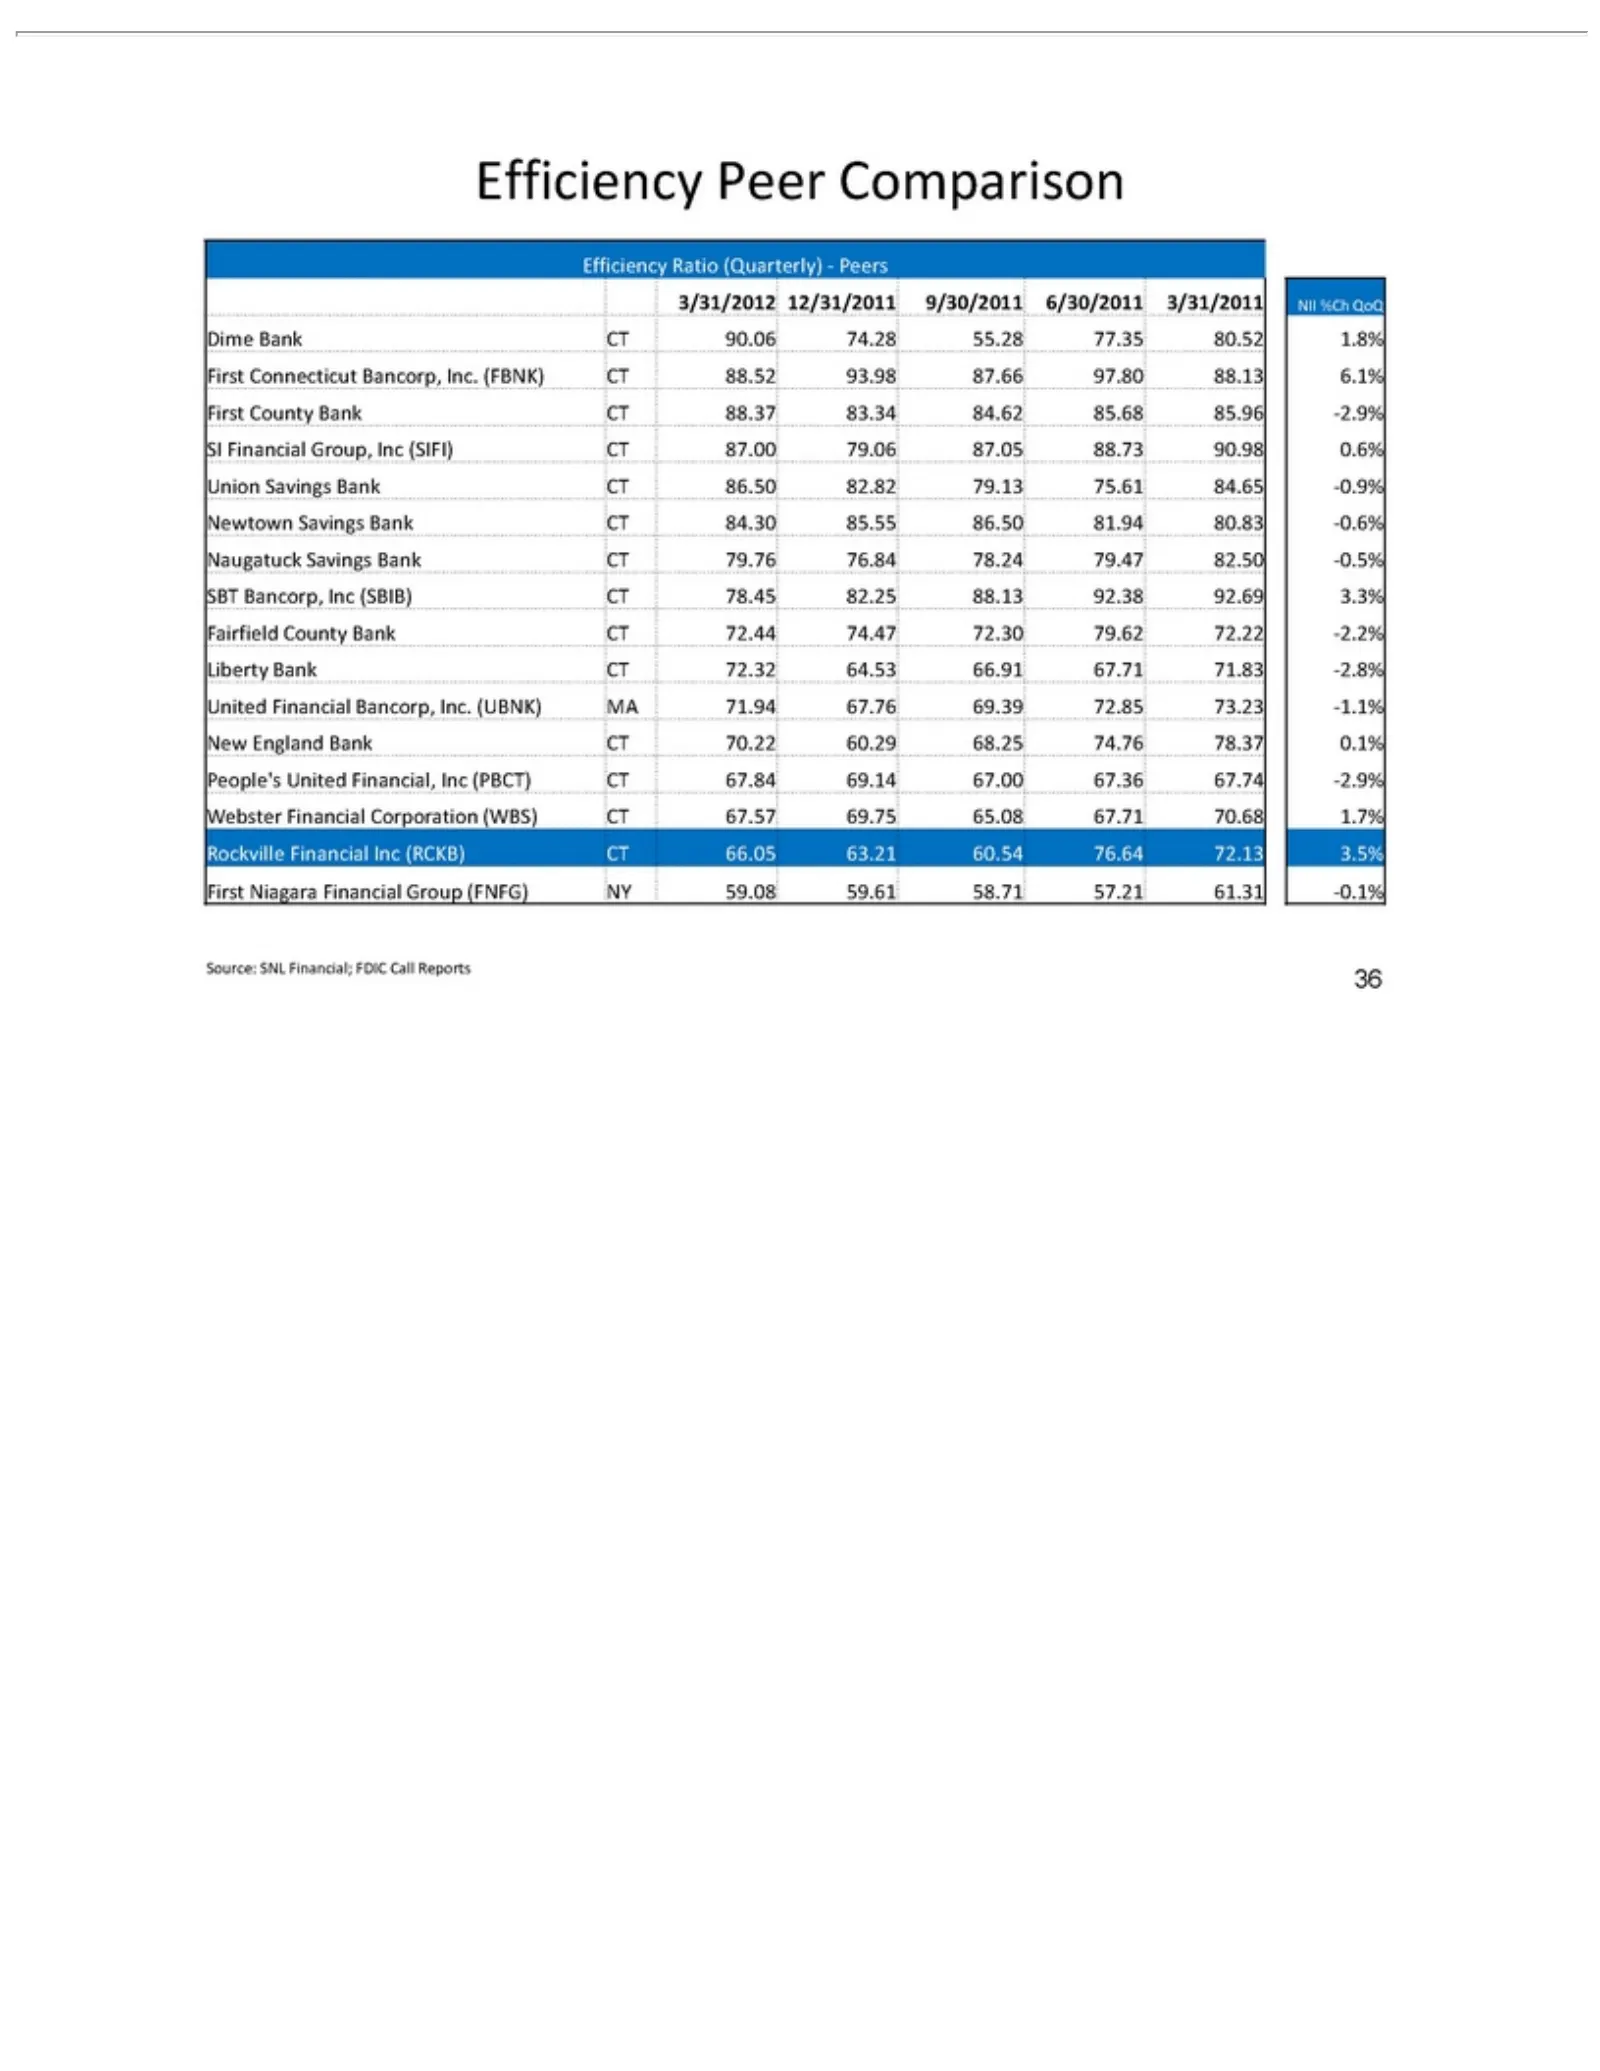
Slide 36: Efficiency Ratio Peer Comparison
Efficiency 3/31/2012 6.1% -0.9% 92.69 72.85 CT Source: 36 67.57 First 3.3% 73.23 Newtown SNL 69.75 12/31/2011 Peer Ratio County Fairfield -1.1% Financial; Comparison 65.08 Savings (Quarterly)—Peers Bank New County 67.71 9/30/2011 FDIC England CT Bank 88.37 70.68 Bank Call CT6/30/2011 Bank 83.34 1.7%
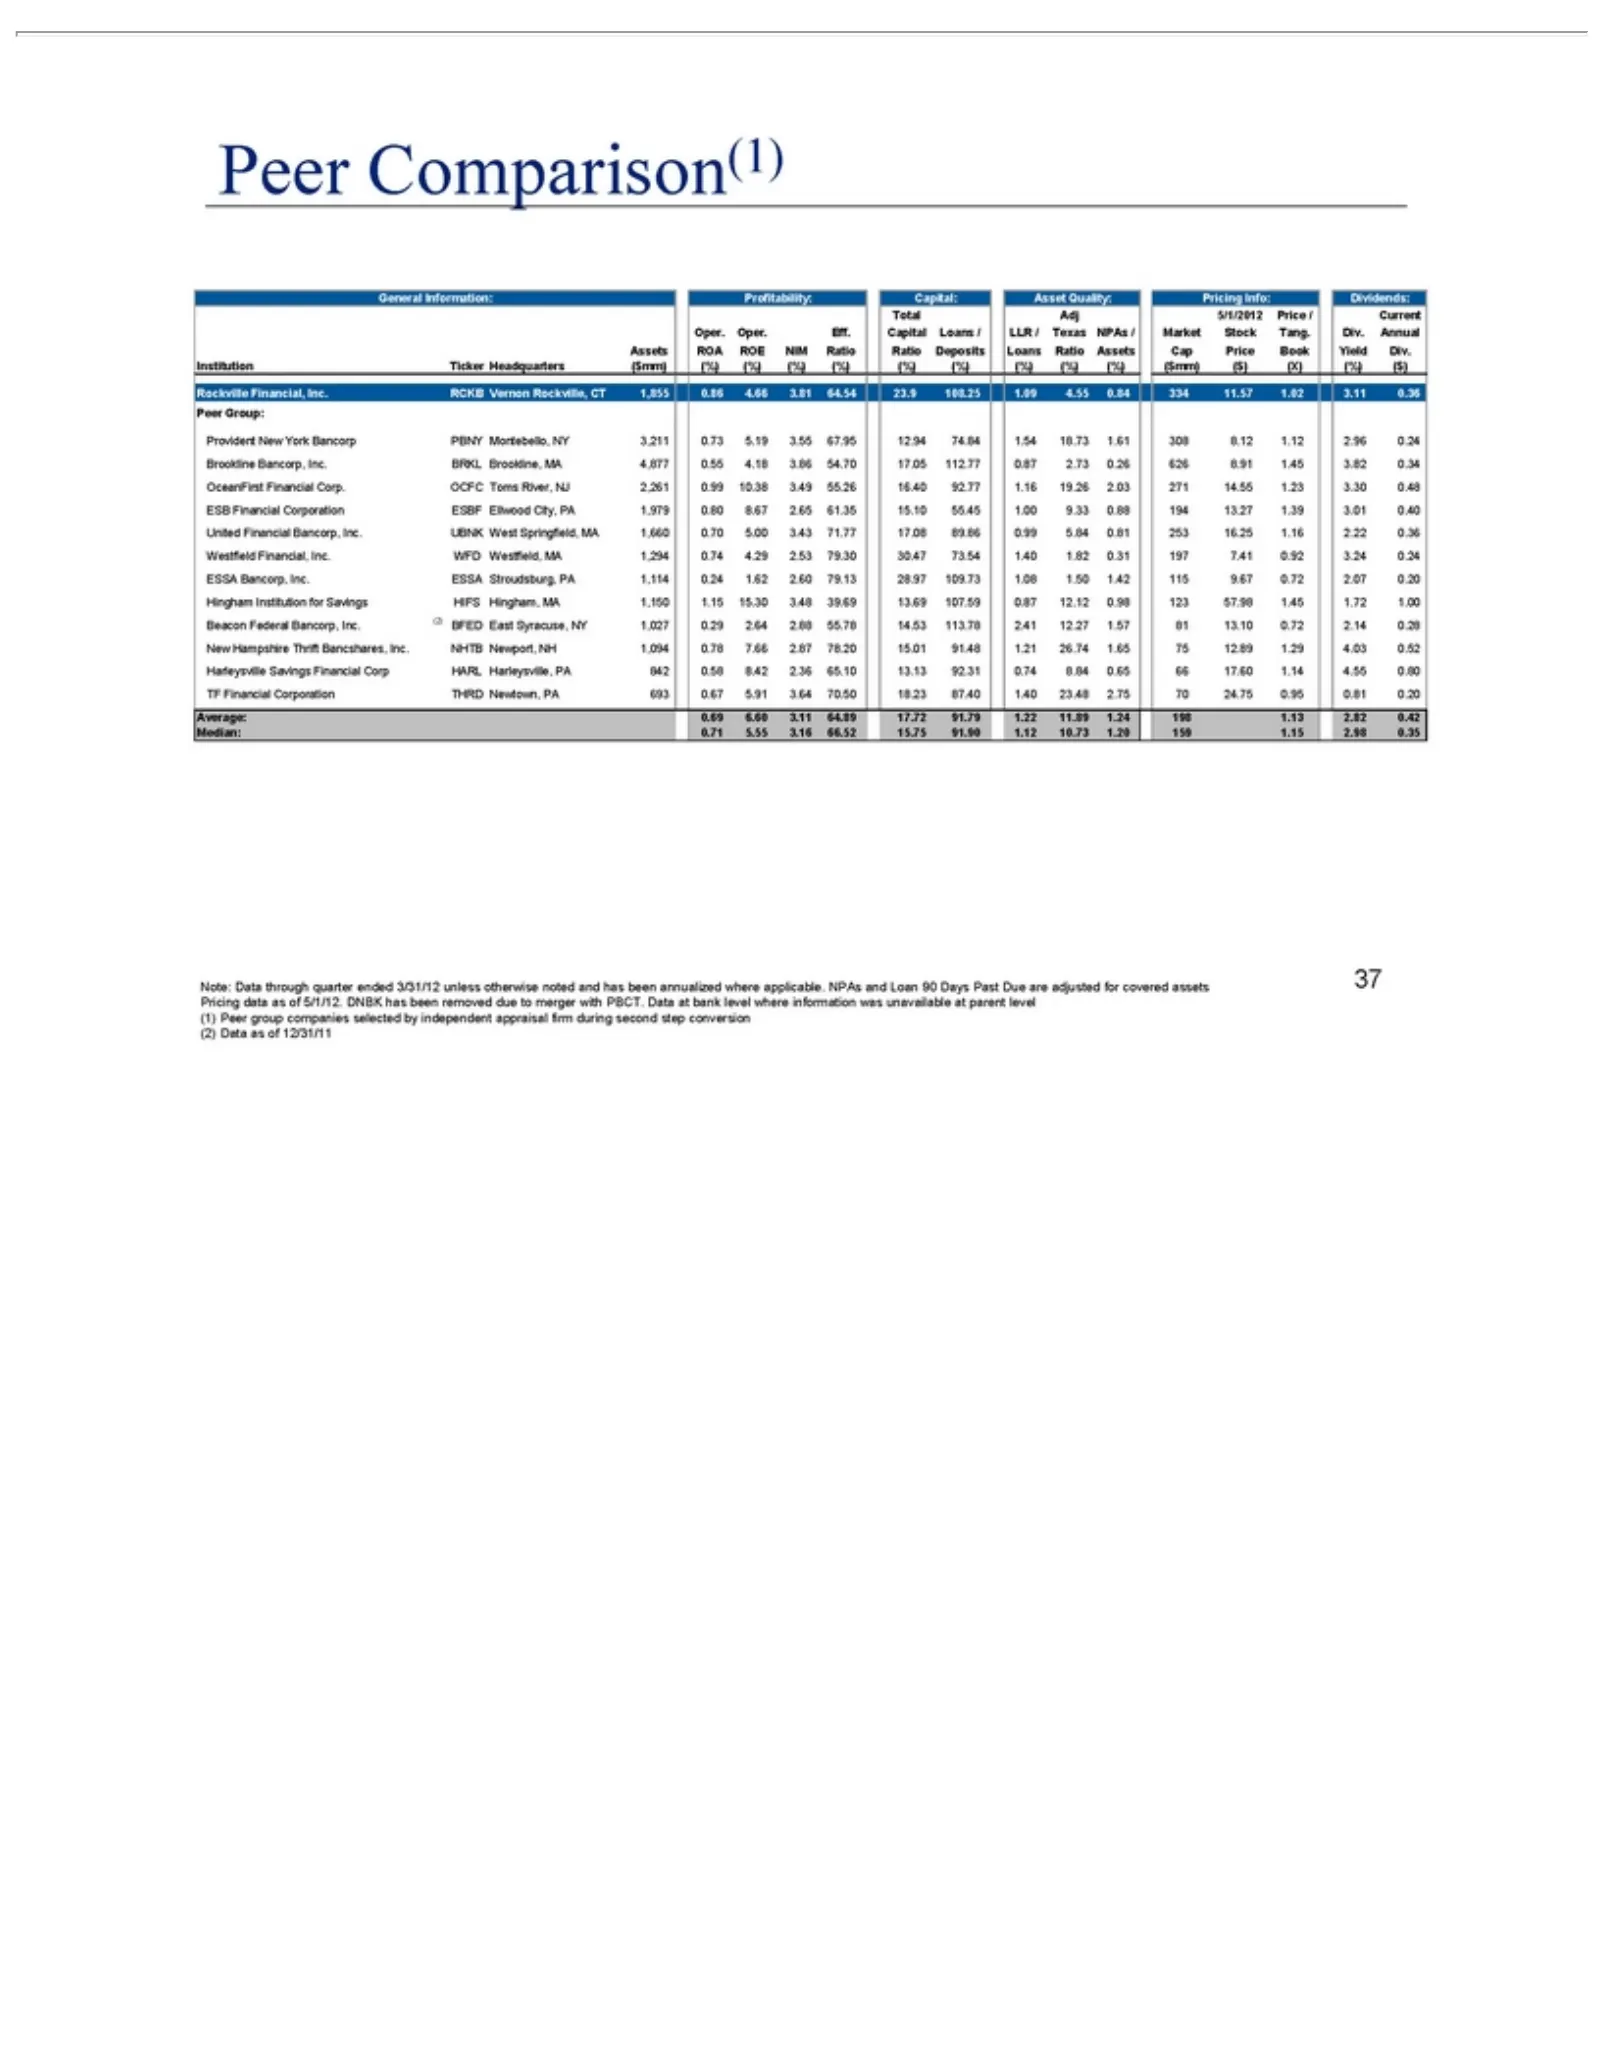
Slide 37: Peer Group General Information
General Total Oper. Assets Institution Rockville Peer Provident Brookline OceanFirst ESB United Westfield ESSA Hingham (2) 37 Beacon New Comparison(1) Group: Financial Adj Oper. Bancorp, ROA Financial Information: Harleysville TF Average: Median: Note: 5/1/12. during Institution 5/1/2012 Financial,
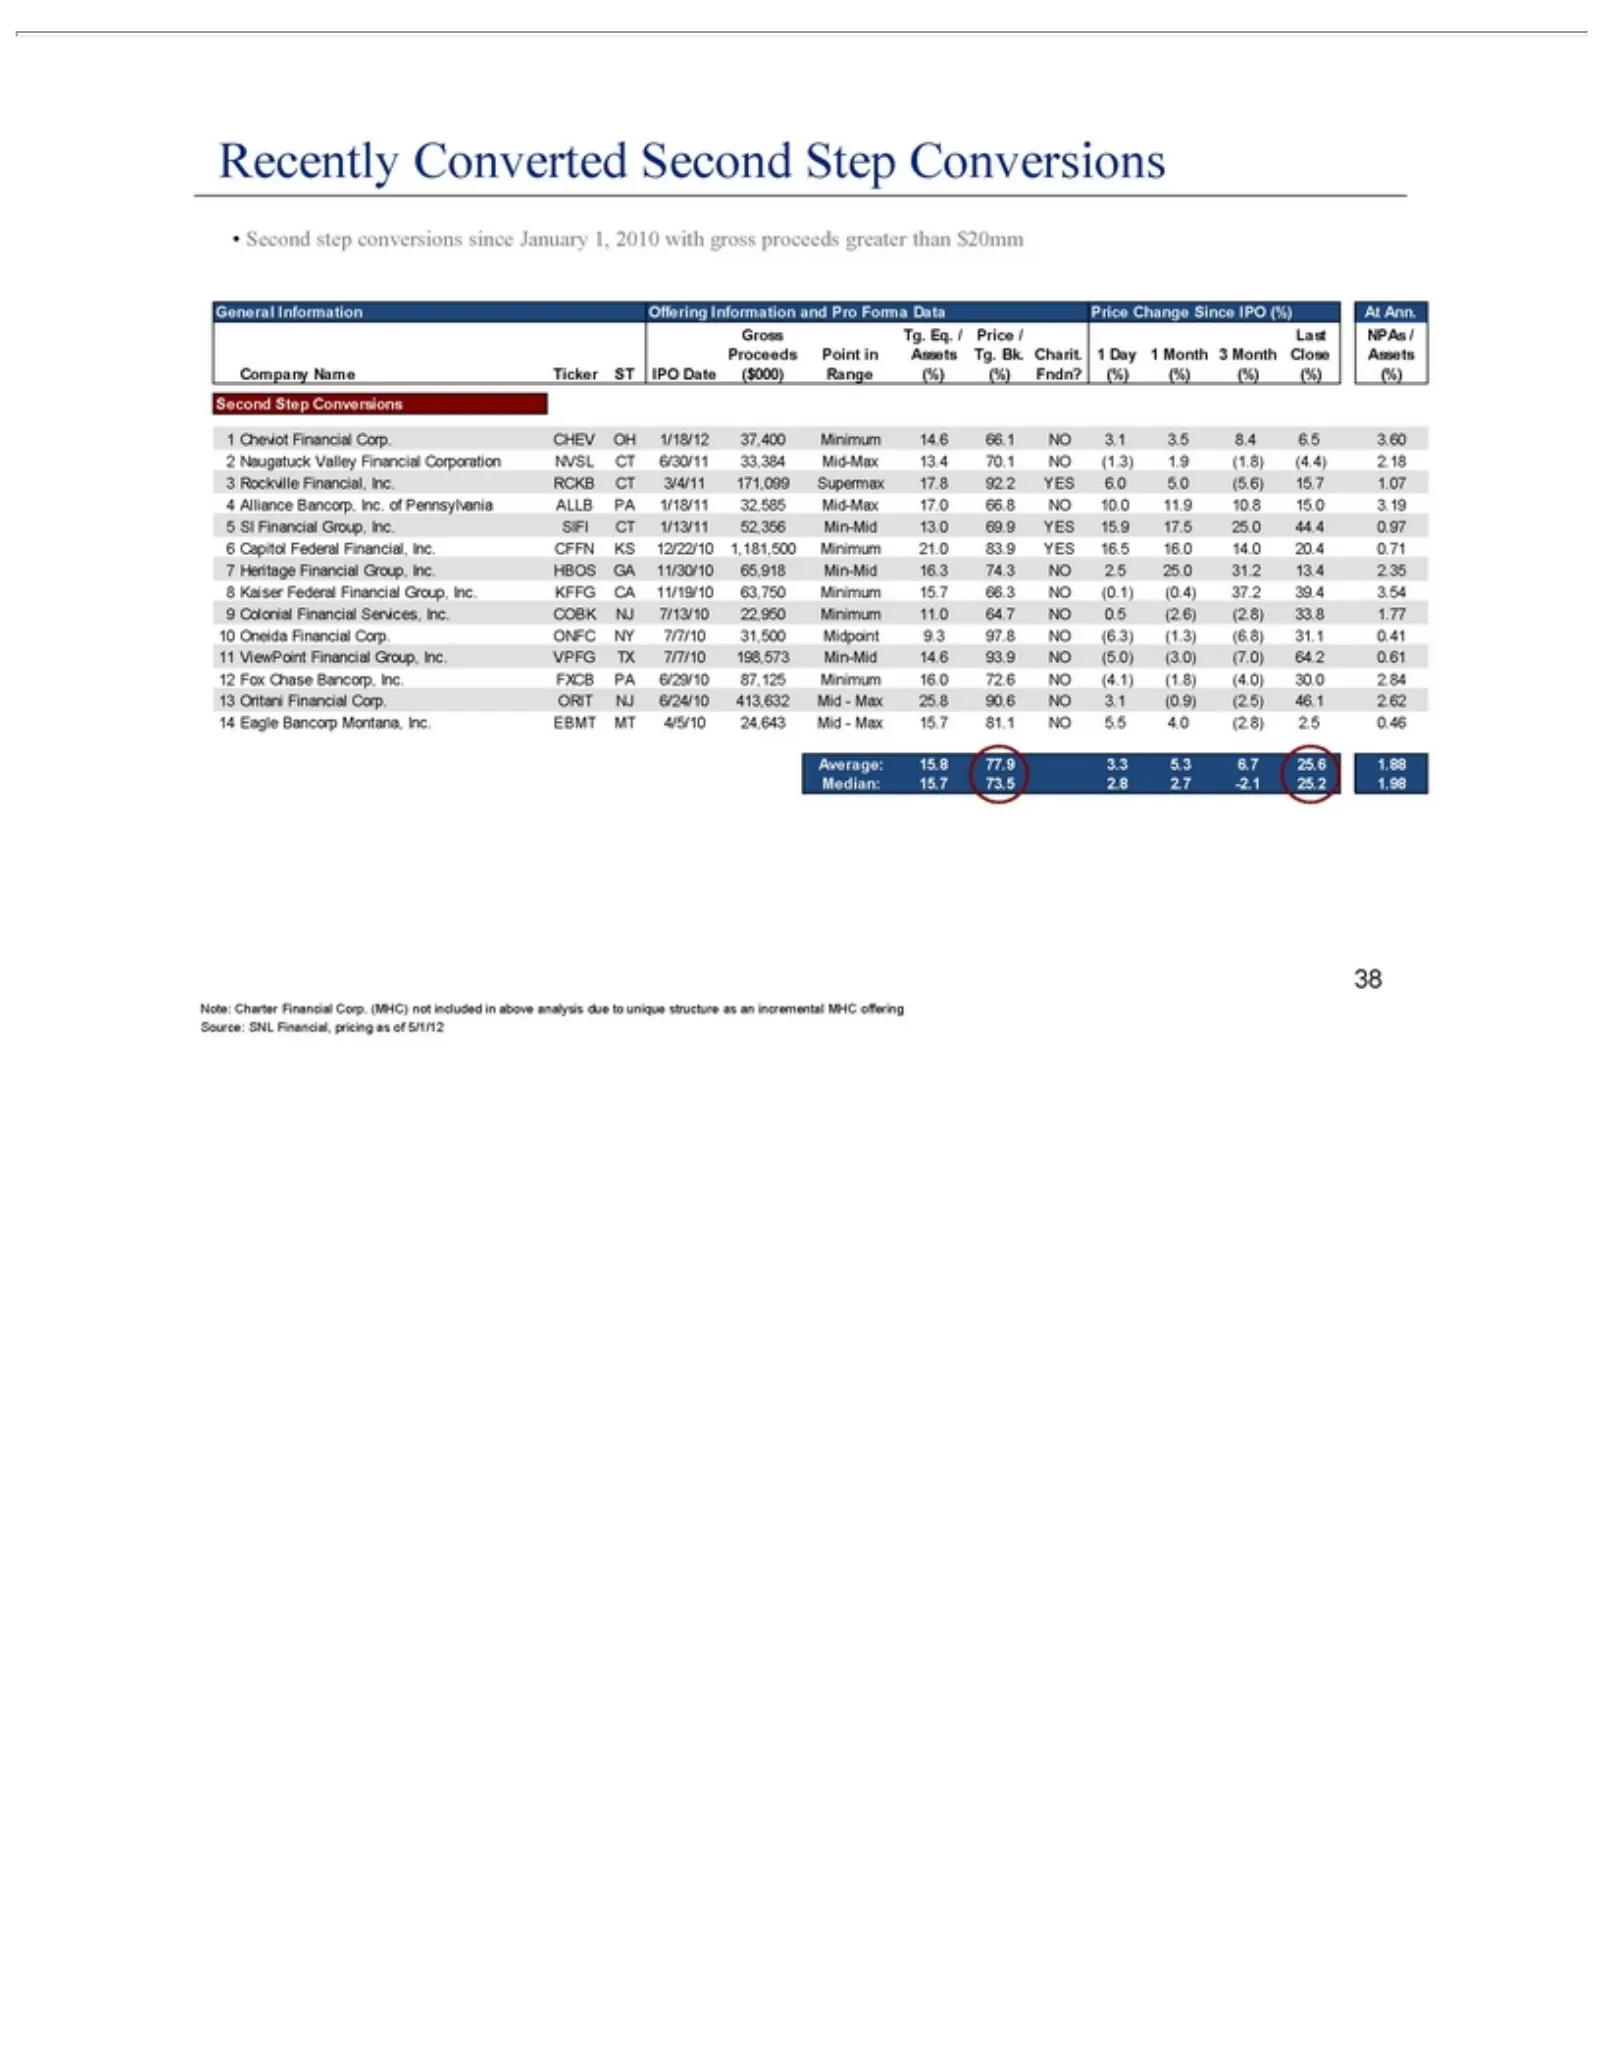
Slide 38: Recently Converted Second Step Conversions
Recently General Month Second 1 2 3 4 5 Close step Step Cheviot Information Converted conversions Conversions Assets Naugatuck Rockville Alliance SI Financial Second Company Offering Valley Bancorp, Financial since Group,Corp. Step Information January Name CHEV Financial Financial, Inc. Inc. Inc.of
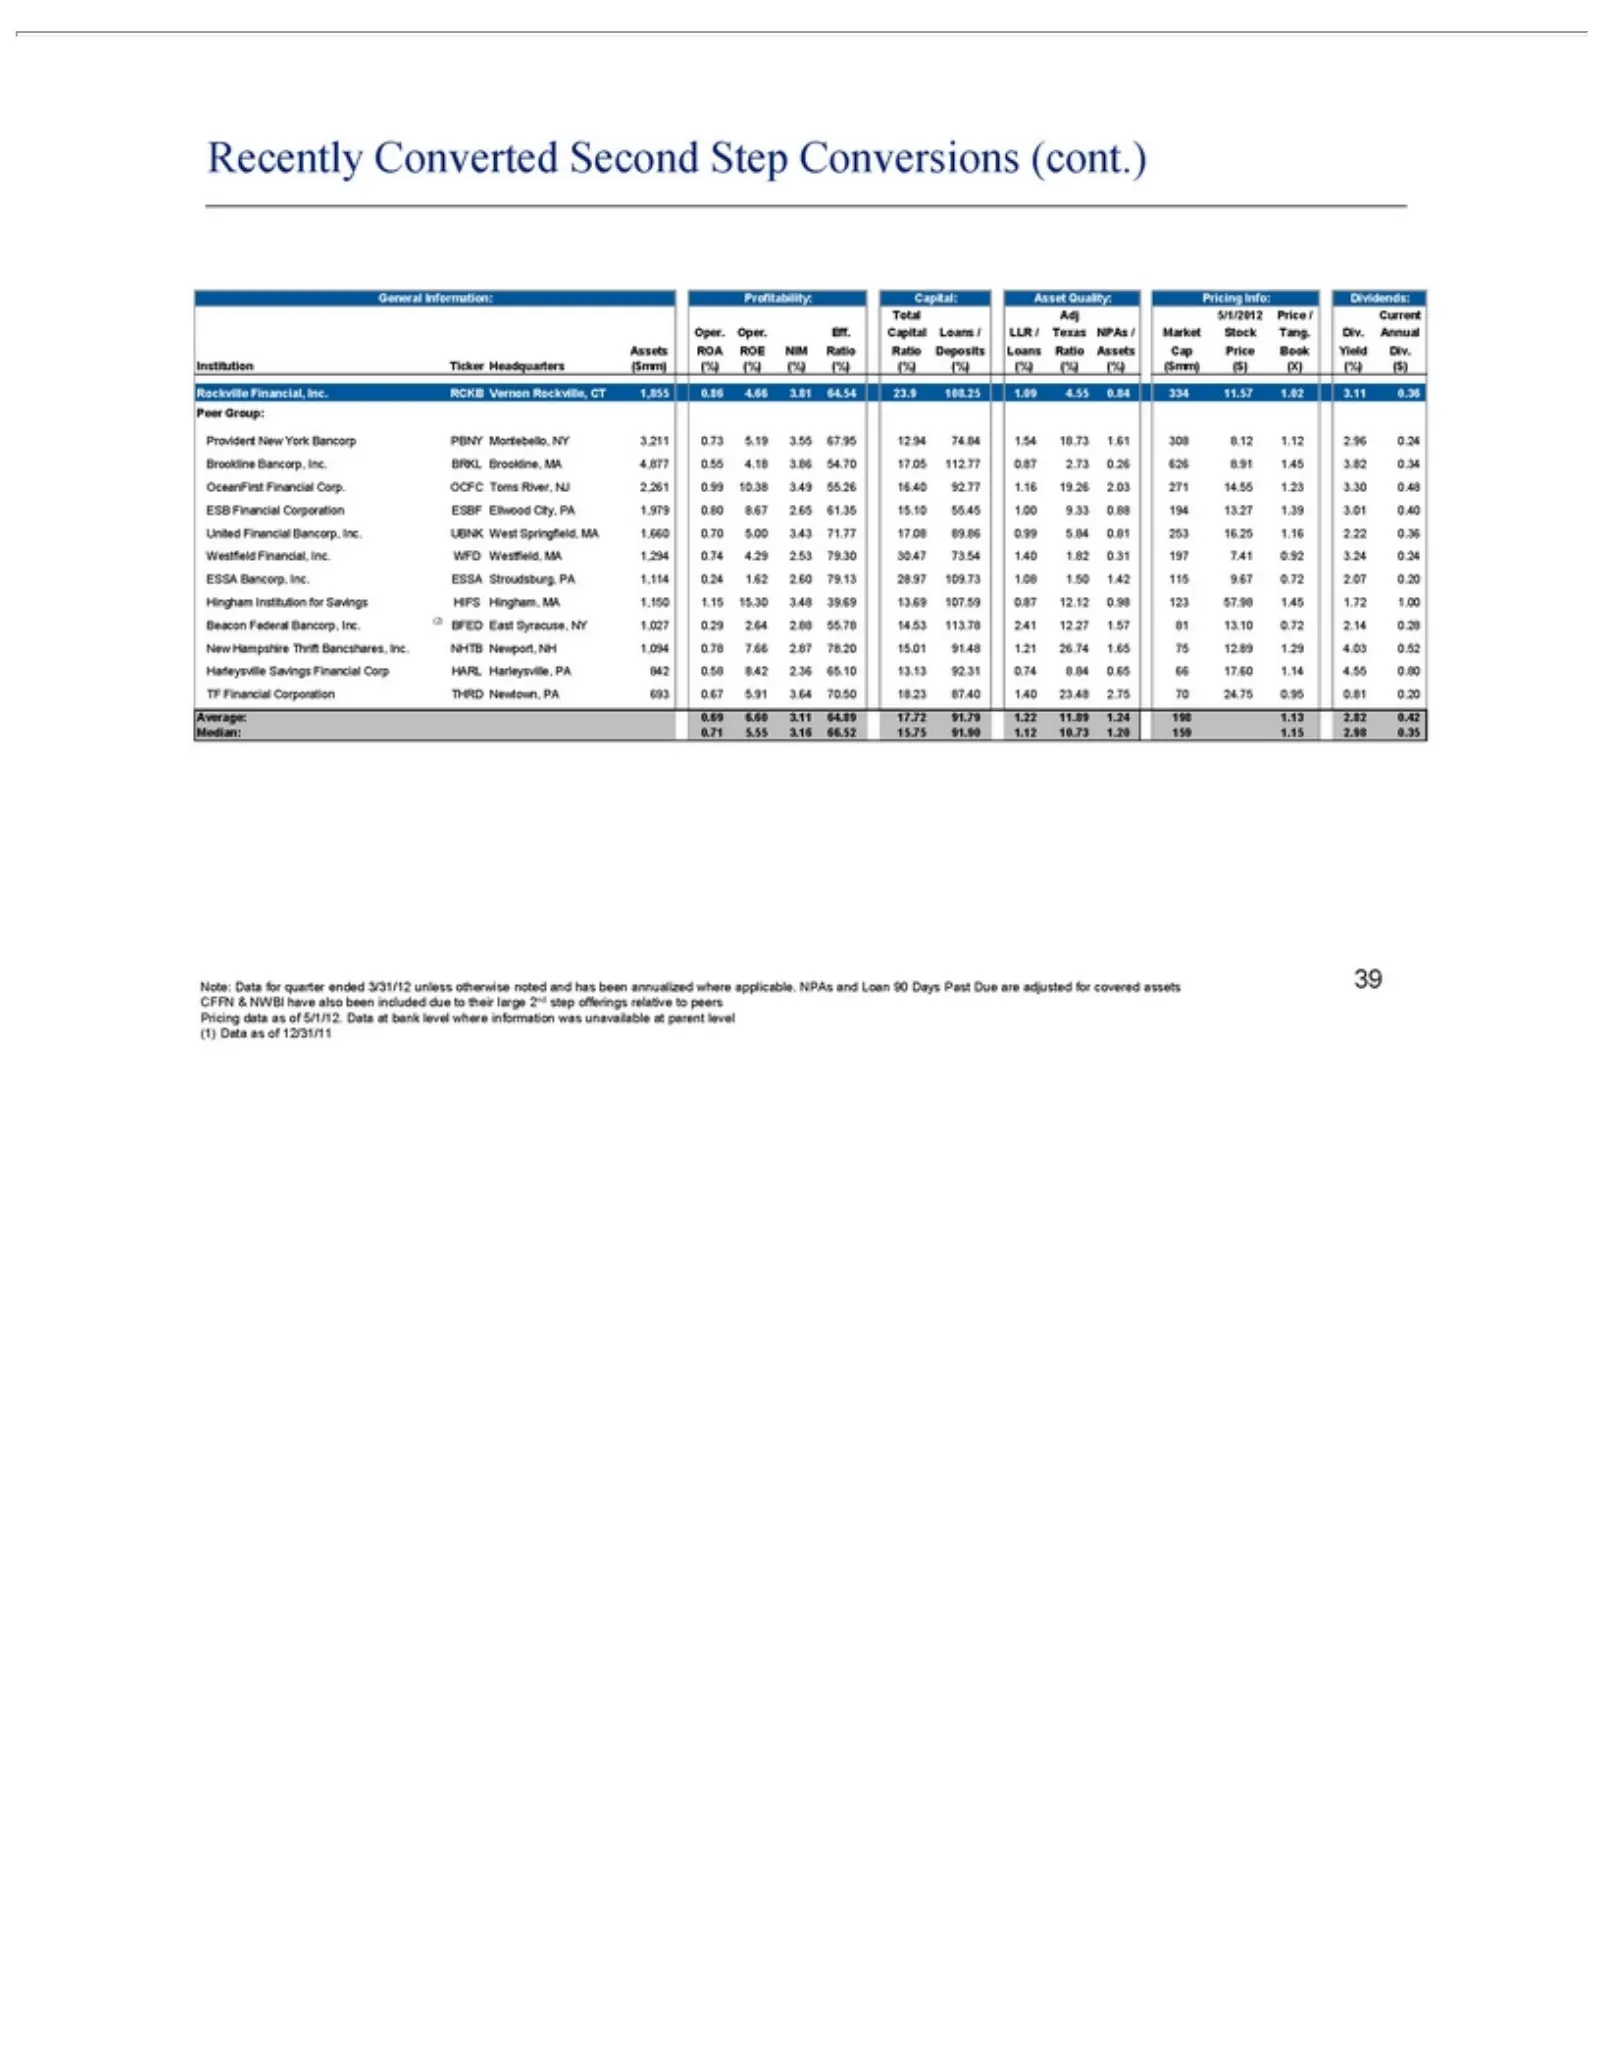
Slide 39: Recently Converted Second Step Conversions (cont.)
Recently General Annual Institution Rockville Peer Provident 3.86 ESB 1,660 3.24 15.30 (2) 39 Beacon NH 66 54.70 0.24 Group: Financial 0.70 3.48 Average: Note: been17.60Assets 1,094Information: Converted ESSA Financial, New Ticker 17.05 5.00 39.69 included Data Federal 1.14 0.69 0.78 ROA Corporation
Source: SEC EDGAR · 8-K filed May 8, 2012
More decks from United Financial Bancorp Inc
 Merger or Acquisition (July 2019)10 slides · Jul 15, 2019
 Shareholder Meeting (May 2019)14 slides · May 13, 2019
 Q1 2019 Earnings Presentation27 slides · Apr 16, 2019
 Q4 2018 Earnings Presentation26 slides · Jan 22, 2019
 Q3 2018 Earnings Presentation25 slides · Oct 16, 2018
 Q2 2018 Earnings Presentation25 slides · Jul 17, 2018