Markwest Energy Partners LP — Investor Presentation (November 2013)
22 slides from Markwest Energy Partners LP's investor presentation, Nov 15, 2013
Slide 1: MarkWest Energy Partners, LP - November 2013
MARKWEST Energy Partners, LP. DUG EAST PTL Sa |) NOVEMBER 2013 4 % 2 y ie “4 , ~\
Slide 2: Forward-Looking Statements
Forward-Looking Statements This presentation contains forward-looking statements and information. These forward-looking statements, which in many instances can be identified by words like “could,” “may,” “will,” “should,” “expects,” “plans,” “project,” “anticipates,” “believes,” “planned,” “proposed
Slide 3: Non-GAAP Measures
Non-GAAP Measures Distributable Cash Flow, Adjusted EBITDA, and Net Operating Margin are not measures of performance calculated in accordance with GAAP, and should not be considered separately from or as a substitute for net income, income from operations, or cash flow as reflected in our financial
Slide 4: Key Investment Considerations
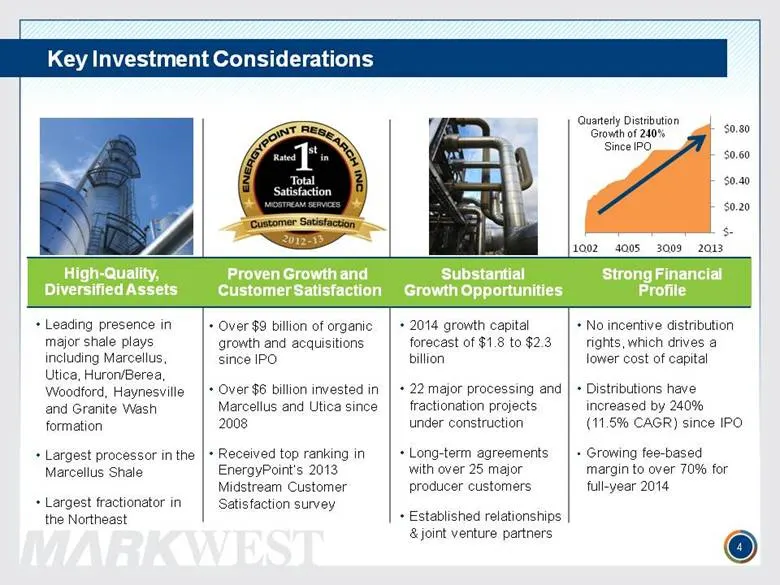
Key Investment Considerations 4 High-Quality, Diversified Assets Proven Growth and Customer Satisfaction Substantial Growth Opportunities Strong Financial Profile Leading presence in major shale plays including Marcellus, Utica, Huron/Berea, Woodford, Haynesville and Granite Wash formation Largest p
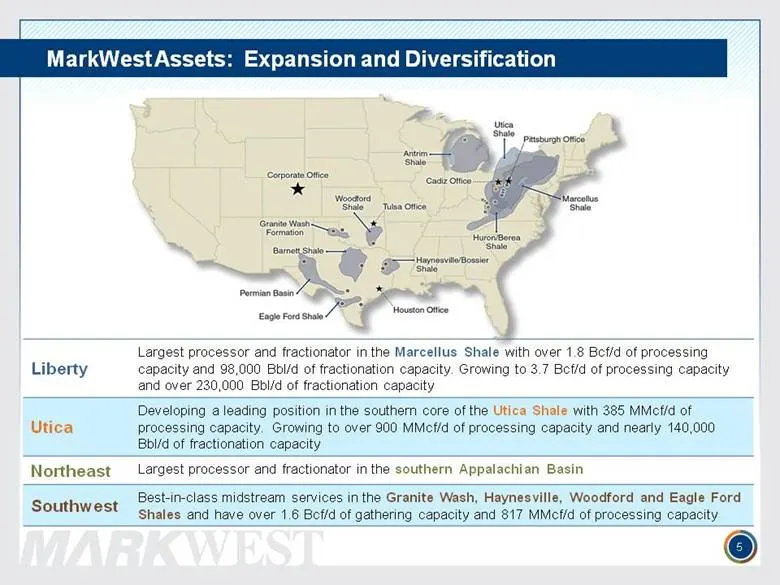
Slide 5: MarkWest Assets: Expansion and Diversification
MarkWest Assets: Expansion and Diversification 5 Liberty Largest processor and fractionator in the Marcellus Shale with over 1.8 Bcf/d of processing capacity and 98,000 Bbl/d of fractionation capacity. Growing to 3.7 Bcf/d of processing capacity and over 230,000 Bbl/d of fractionation capacity Utica
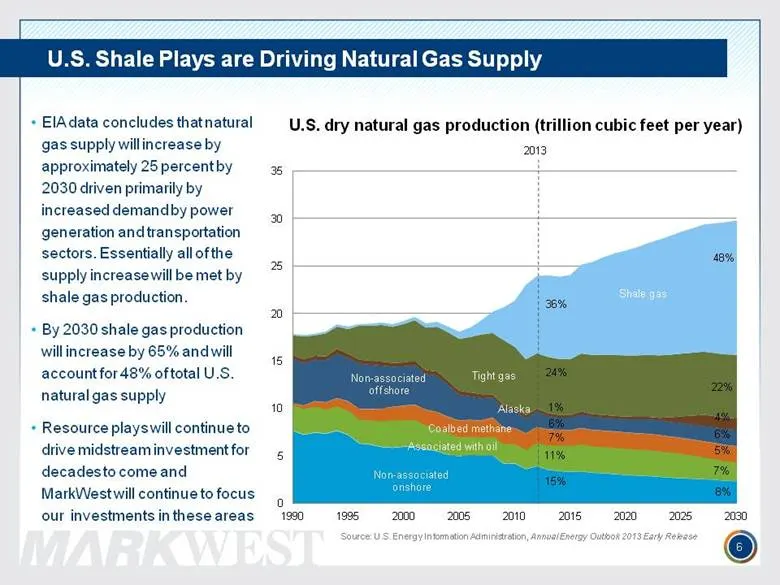
Slide 6: U.S. Shale Plays are Driving Natural Gas Supply
U.S. Shale Plays are Driving Natural Gas Supply 6 EIA data concludes that natural gas supply will increase by approximately 25 percent by 2030 driven primarily by increased demand by power generation and transportation sectors. Essentially all of the supply increase will be met by shale gas producti
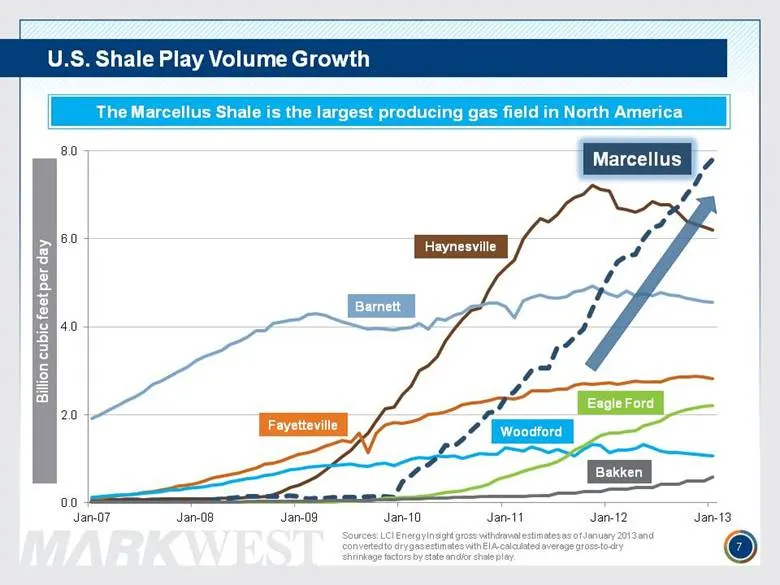
Slide 7: U.S. Shale Play Volume Growth
U.S. Shale Play Volume Growth 7 The Marcellus Shale is the largest producing gas field in North America Barnett Haynesville Marcellus Sources: LCI Energy Insight gross withdrawal estimates as of January 2013 and converted to dry gas estimates with EIA-calculated average gross-to-dry shrinkage factor
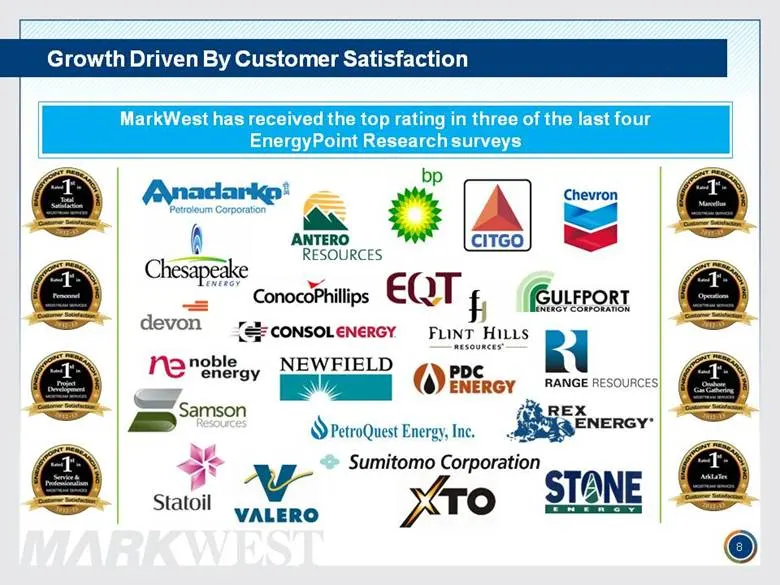
Slide 8: Growth Driven By Customer Satisfaction
Growth Driven By Customer Satisfaction 8 MarkWest has received the top rating in three of the last four EnergyPoint Research surveys
Slide 9: Marcellus Segment
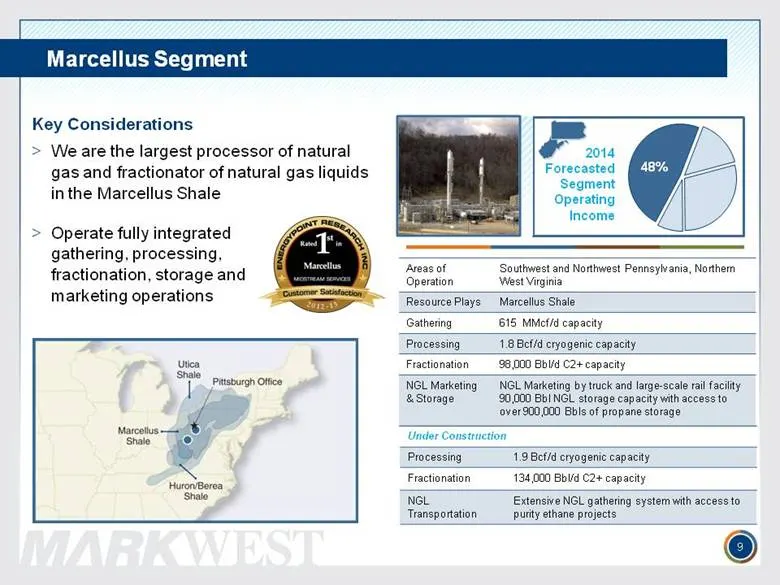
Marcellus Segment 2014 Forecasted Segment Operating Income Key Considerations We are the largest processor of natural gas and fractionator of natural gas liquids in the Marcellus Shale Areas of Operation Southwest and Northwest Pennsylvania, Northern West Virginia Resource Plays Marcellus Shale Gath
Slide 10: Marcellus: Current Processing Capacity of 1.8 Bcf/d
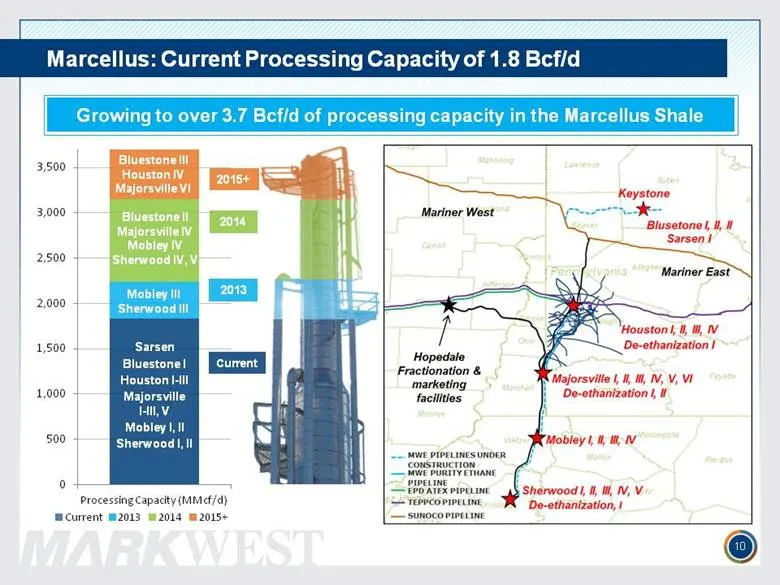
Marcellus: Current Processing Capacity of 1.8 Bcf/d 10 Growing to over 3.7 Bcf/d of processing capacity in the Marcellus Shale 2014 2013 Current Bluestone II Majorsville IV Mobley IV Sherwood IV, V Mobley III Sherwood III Sarsen Bluestone I Houston I-III Majorsville I-III, V Mobley I, II Sherwood I,
Slide 11: Utica Segment: Areas of Operation
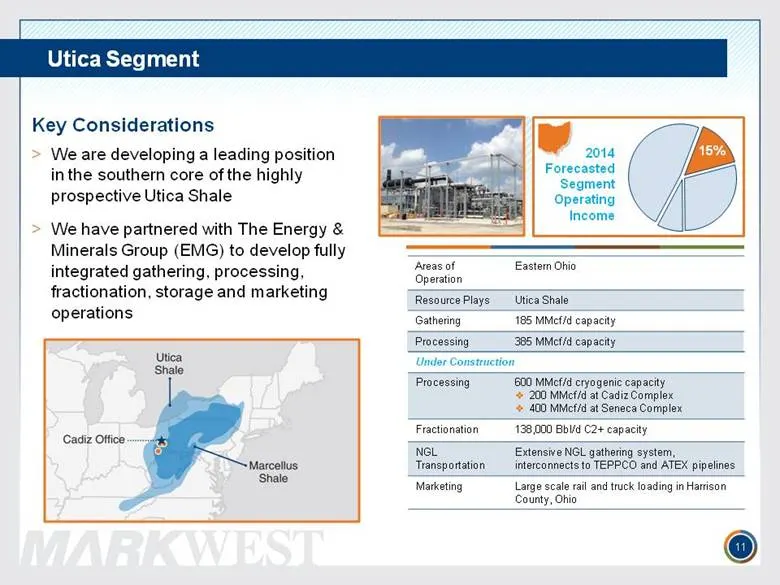
Areas of Operation Eastern Ohio Resource Plays Utica Shale Gathering 185 MMcf/d capacity Processing 385 MMcf/d capacity Utica Segment 11 Key Considerations We are developing a leading position in the southern core of the highly prospective Utica Shale We have partnered with The Energy & Minerals Gro
Slide 12: Utica Processing Capacity
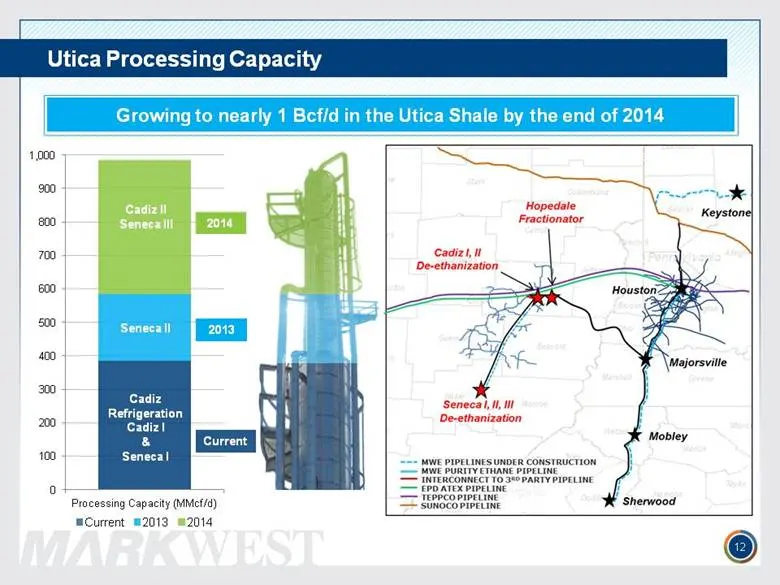
Utica Processing Capacity 12 Cadiz Refrigeration Cadiz I & Seneca I Seneca II Cadiz II Seneca III 2014 2013 Current Growing to nearly 1 Bcf/d in the Utica Shale by the end of 2014
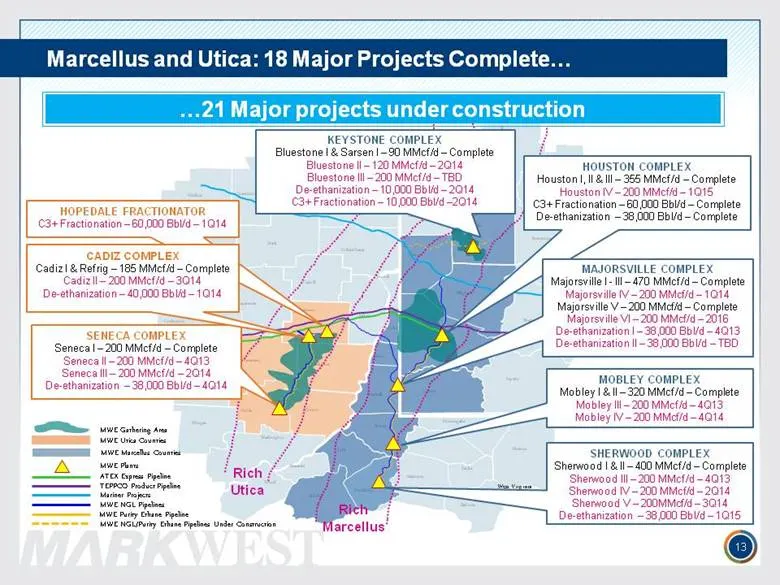
Slide 13: MWE NGL Pipelines
MWE NGL Pipelines Barbour Brooke Doddridge Hancock Harrison Marion Marshall Monongalia Ohio Pleasants Preston Ritchie Taylor Tyler Wetzel Wood Belmont Carroll Columbiana Coshocton Guernsey Harrison Holmes Mahoning Medina Monroe Morgan Muskingum Noble Portage Stark Summit Trumbull Tuscarawas Washingt
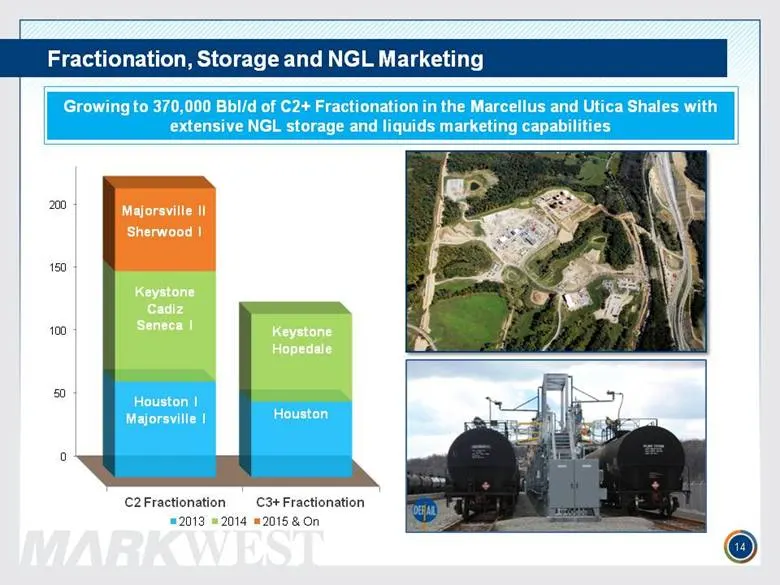
Slide 14: Fractionation, Storage and NGL Marketing
Fractionation, Storage and NGL Marketing Keystone Cadiz Seneca I Majorsville II Sherwood I Keystone Hopedale Growing to 370,000 Bbl/d of C2+ Fractionation in the Marcellus and Utica Shales with extensive NGL storage and liquids marketing capabilities 14
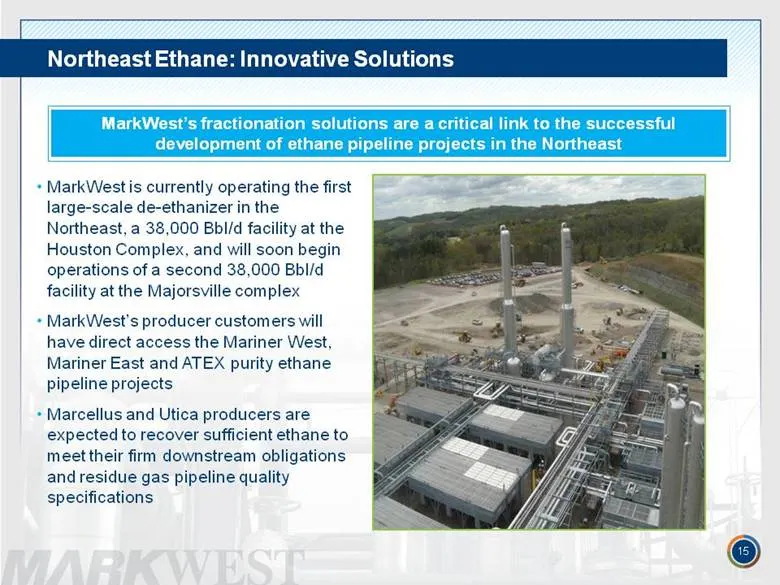
Slide 15: Northeast Ethane: Innovative Solutions
Northeast Ethane: Innovative Solutions MarkWest is currently operating the first large-scale de-ethanizer in the Northeast, a 38,000 Bbl/d facility at the Houston Complex, and will soon begin operations of a second 38,000 Bbl/d facility at the Majorsville complex MarkWest’s producer customers will h
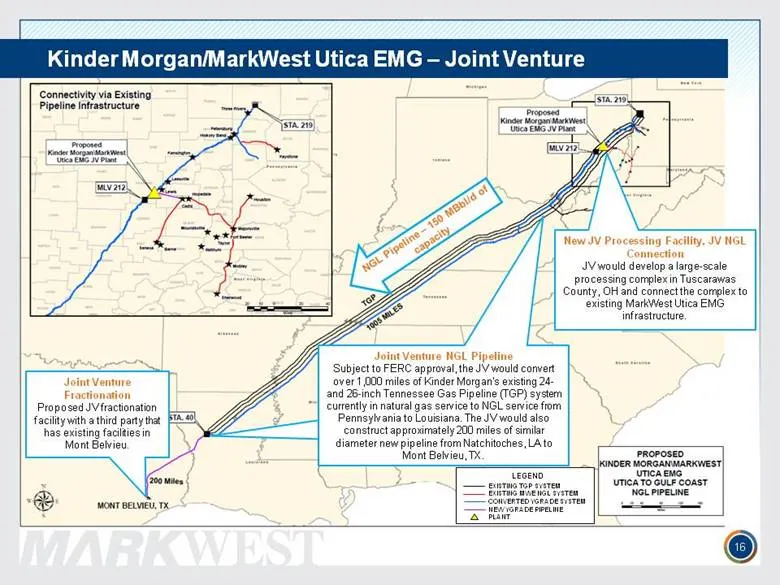
Slide 16: Kinder Morgan/MarkWest Utica EMG Joint Venture
16 Kinder Morgan/MarkWest Utica EMG – Joint Venture Joint Venture NGL Pipeline Subject to FERC approval, the JV would convert over 1,000 miles of Kinder Morgan’s existing 24- and 26-inch Tennessee Gas Pipeline (TGP) system currently in natural gas service to NGL service from Pennsylvania to Louisian
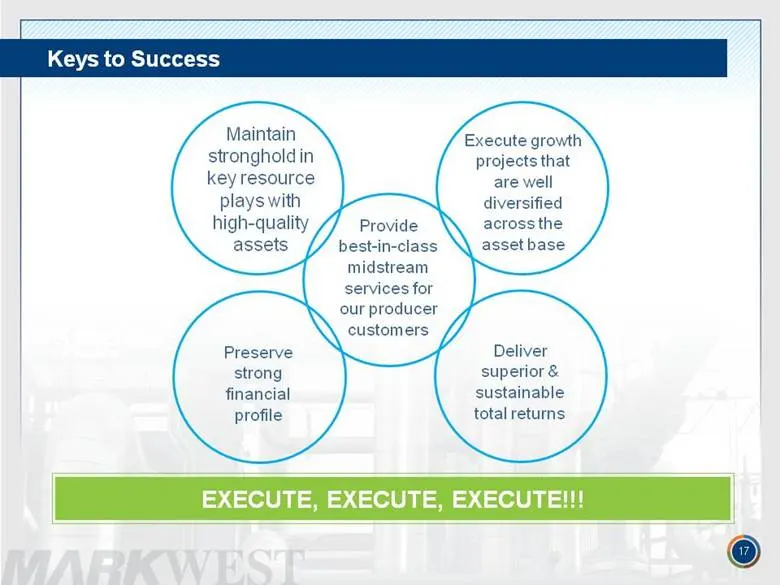
Slide 17: Keys to Success
Keys to Success EXECUTE, EXECUTE, EXECUTE!!! 17
Slide 18: Appendix
APPENDIX
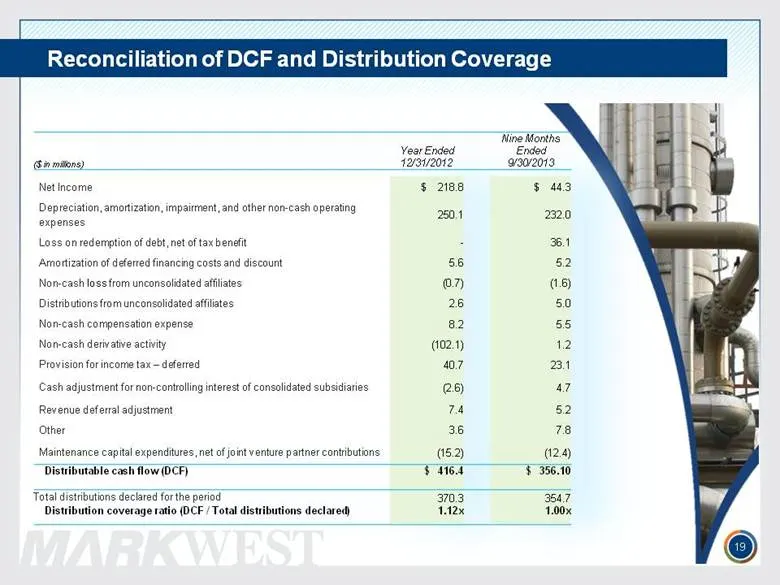
Slide 19: Reconciliation of DCF and Distribution Coverage
Reconciliation of DCF and Distribution Coverage 19
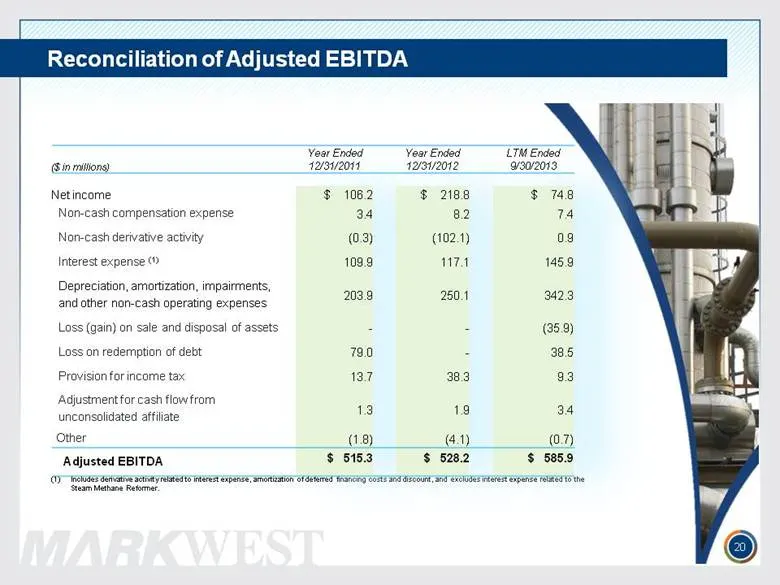
Slide 20: Reconciliation of Adjusted EBITDA
Reconciliation of Adjusted EBITDA 20 Includes derivative activity related to interest expense, amortization of deferred financing costs and discount, and excludes interest expense related to the Steam Methane Reformer.
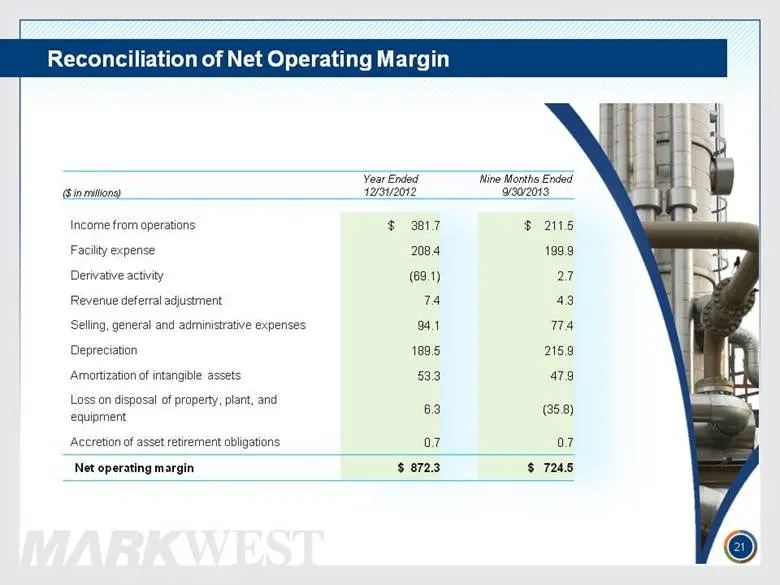
Slide 21: Reconciliation of Net Operating Margin
Reconciliation of Net Operating Margin 21
Slide 22: Contact and Investor Relations
1515 Arapahoe Street Tower 1, Suite 1600 Denver, Colorado 80202 Phone: 303-925-9200 Investor Relations: 866-858-0482 Email: investorrelations@markwest.com Website: www.markwest.com
Source: SEC EDGAR · 8-K filed Nov 15, 2013
More decks from Markwest Energy Partners LP
 Fact Sheet (July 2017)1 slide · July 2017
 Fact Sheet (July 2017)1 slide · July 2017
 Fact Sheet (July 2017)1 slide · July 2017
 Markwest Energy Partners L P — Investor Day (December 2015)116 slides · Dec 3, 2015
 Merger or Acquisition (November 2015)17 slides · Nov 13, 2015
 Merger or Acquisition (November 2015)17 slides · Nov 12, 2015