Washington Group International Inc
Washington Group International — Merger or Acquisition (May 2007)
18 slides from Washington Group International's merger presentation, May 29, 2007
Slide 1: Investor Conference Call May 29, 2007
Investor Conference Call May 29, 2007
Slide 2: Forward Looking Statement
Forward Looking Statement Statements contained in this press release that are not historical facts may constitute forward-looking statements, including statements relating to timing of and satisfaction of conditions to the merger, whether any of the anticipated benefits of the merger will be realize
Slide 3: Additional Information and Where to Find It
Additional Information and Where to Find It In connection with the proposed transaction, URS and Washington Group will be filing documents with the Securities and Exchange Commission (the “SEC”), including the filing by URS of a registration statement on Form S-4, and URS and Washington Group intend
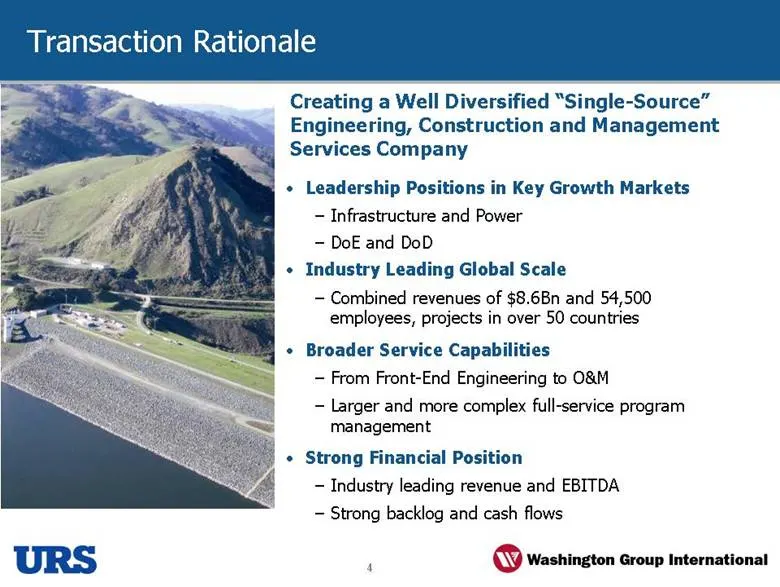
Slide 4: Transaction Rationale
Transaction Rationale Leadership Positions in Key Growth Markets Infrastructure and Power DoE and DoD Industry Leading Global Scale Combined revenues of $8.6Bn and 54,500 employees, projects in over 50 countries Broader Service Capabilities From Front-End Engineering to O&M Larger and more complex f
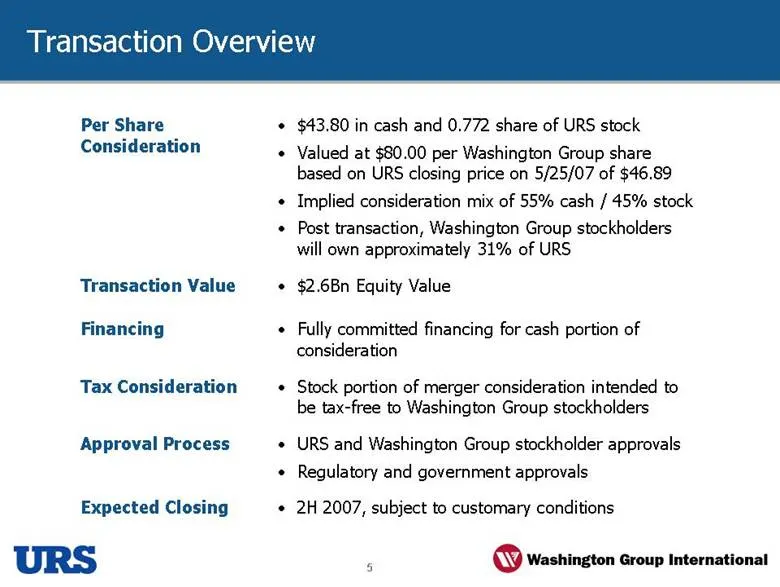
Slide 5: Transaction Overview
Transaction Overview 2H 2007, subject to customary conditions Expected Closing URS and Washington Group stockholder approvals Regulatory and government approvals Approval Process Stock portion of merger consideration intended to be tax-free to Washington Group stockholders Tax Consideration Fully co
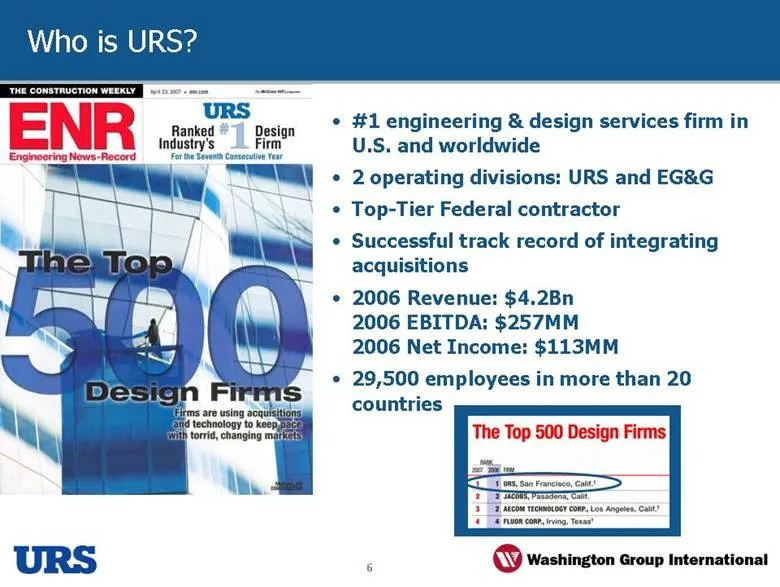
Slide 6: Who is URS?
Who is URS? #1 engineering & design services firm in U.S. and worldwide 2 operating divisions: URS and EG&G Top-Tier Federal contractor Successful track record of integrating acquisitions 2006 Revenue: $4.2Bn 2006 EBITDA: $257MM 2006 Net Income: $113MM 29,500 employees in more than 20 countries
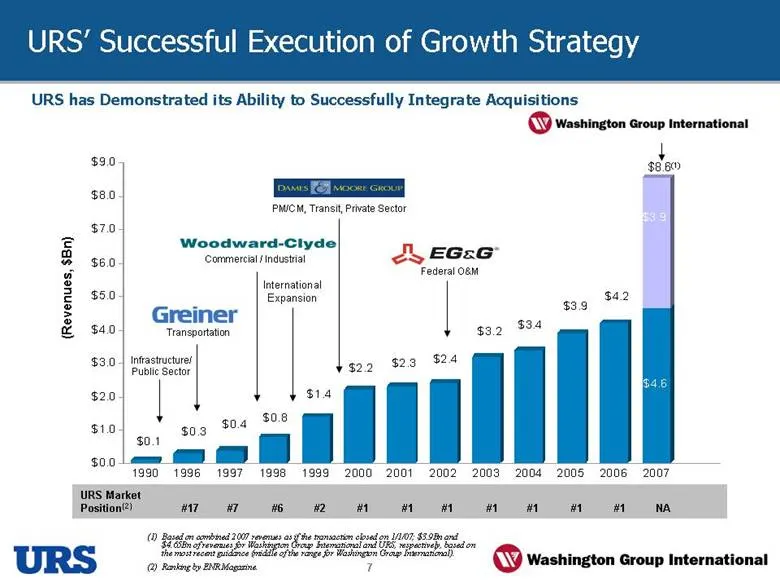
Slide 7: URS has Demonstrated its Ability to Successfully Integrate Acquisitions
URS has Demonstrated its Ability to Successfully Integrate Acquisitions Based on combined 2007 revenues as if the transaction closed on 1/1/07; $3.9Bn and $4.65Bn of revenues for Washington Group International and URS, respectively, based on the most recent guidance (middle of the range for Washingt
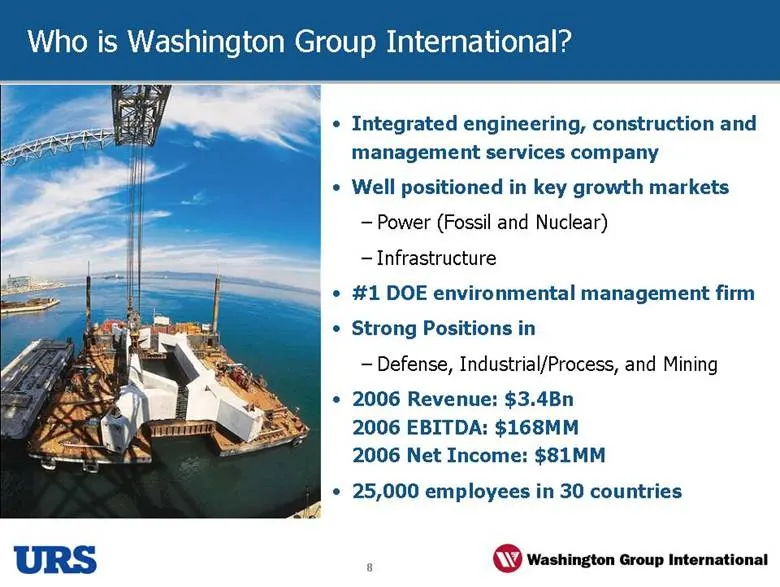
Slide 8: Who is Washington Group International?
Who is Washington Group International? Integrated engineering, construction and management services company Well positioned in key growth markets Power (Fossil and Nuclear) Infrastructure #1 DOE environmental management firm Strong Positions in Defense, Industrial/Process, and Mining 2006 Revenue: $
Slide 9: Washington Group Business Segments
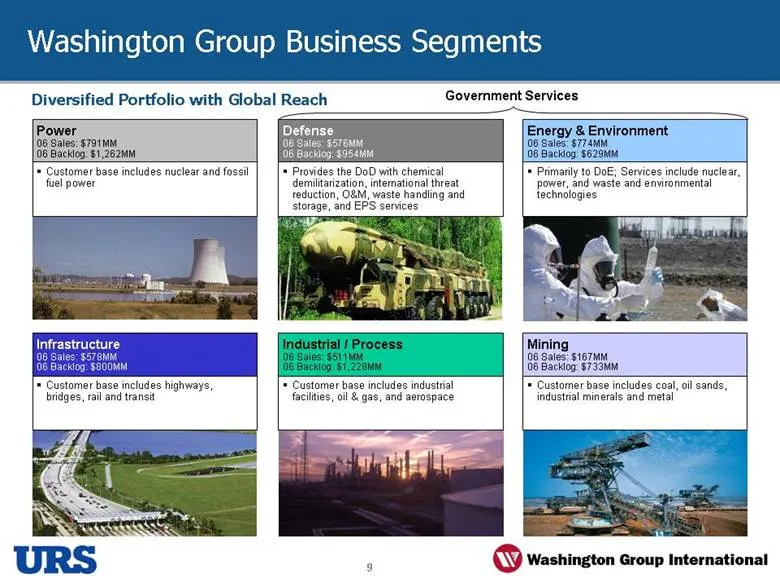
Washington Group Business Segments Power 06 Sales: $791MM 06 Backlog: $1,262MM Defense 06 Sales: $576MM 06 Backlog: $954MM Energy & Environment 06 Sales: $774MM 06 Backlog: $629MM Diversified Portfolio with Global Reach Government Services Customer base includes nuclear and fossil fuel power Provide
Slide 10: Washington Group International's Fast Growing Global Markets
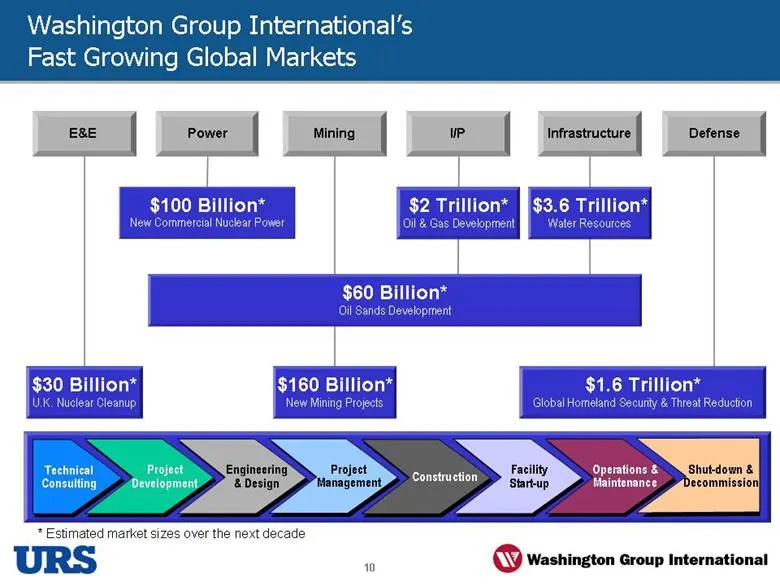
Washington Group International’s Fast Growing Global Markets Technical Consulting Engineering & Design Construction Facility Start-up Operations & Maintenance Shut-down & Decommission Project Development Project Management $60 Billion* Oil Sands Development $2 Trillion* Oil & Gas Development $3.6 Tr
Slide 11: NewCo Summary
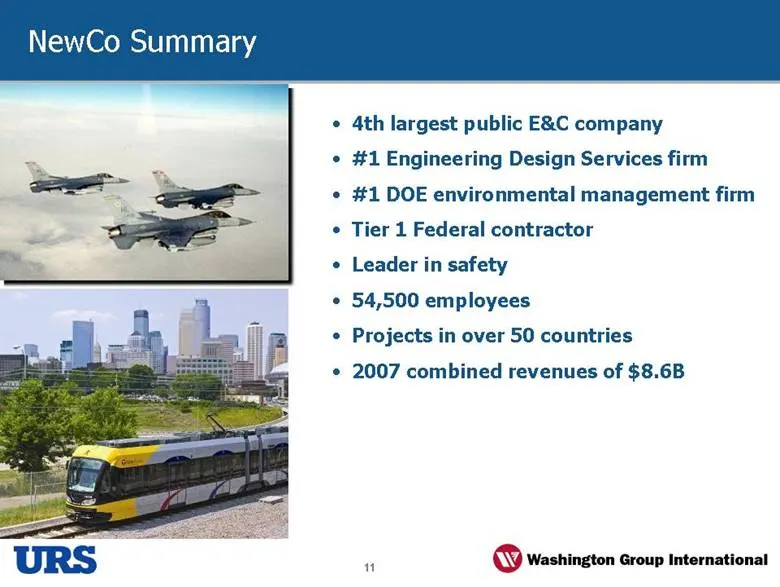
NewCo Summary 4th largest public E&C company #1 Engineering Design Services firm #1 DOE environmental management firm Tier 1 Federal contractor Leader in safety 54,500 employees Projects in over 50 countries 2007 combined revenues of $8.6B
Slide 12: Industry Leading Scale
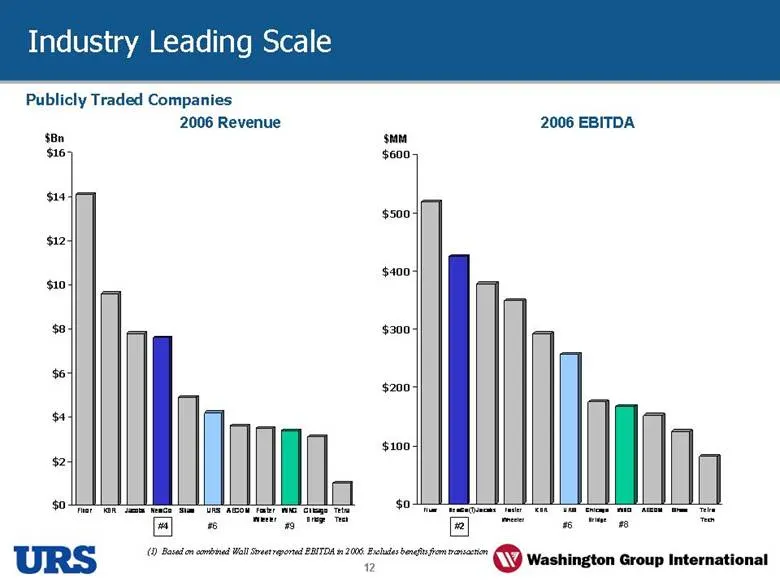
Industry Leading Scale Publicly Traded Companies 2006 Revenue $Bn 2006 EBITDA $MM #4 #6 #9 #2 #6 #8 (1) Based on combined Wall Street reported EBITDA in 2006. Excludes benefits from transaction $0 $100 $200 $300 $400 $500 $600 Fluor NewCo Jacobs Foster Wheeler KBR URS Chicago Bridge WNG AECOM Shaw T
Slide 13: Expanded Capabilities In High-Growth Markets
Expanded Capabilities In High-Growth Markets Total Delivery From Front-End Engineering to Operations and Maintenance Capitalize on increased market demand for a single source supplier Higher Growth Potential Infrastructure and transportation Power DoD/DoE Oil & Gas
Slide 14: Capital Structure
Capital Structure Estimated debt at closing: $1.5Bn Consideration includes 45% equity to optimize capital structure Estimated Debt/Total Cap of 37% at Closing Estimated Debt/EBITDA of 3.2x is very manageable and lower than in past transactions Committed to deleveraging and maintaining a strong balan
Slide 15: Integration Strategy and Synergies
Integration Strategy and Synergies Integration Plan Jointly developed, rapid integration plan New division of URS based in Boise, ID Emphasis on continuity with customers Best practices to be taken from both companies Cost synergies of $50MM-55MM in 2008
Slide 16: Financial Benefits
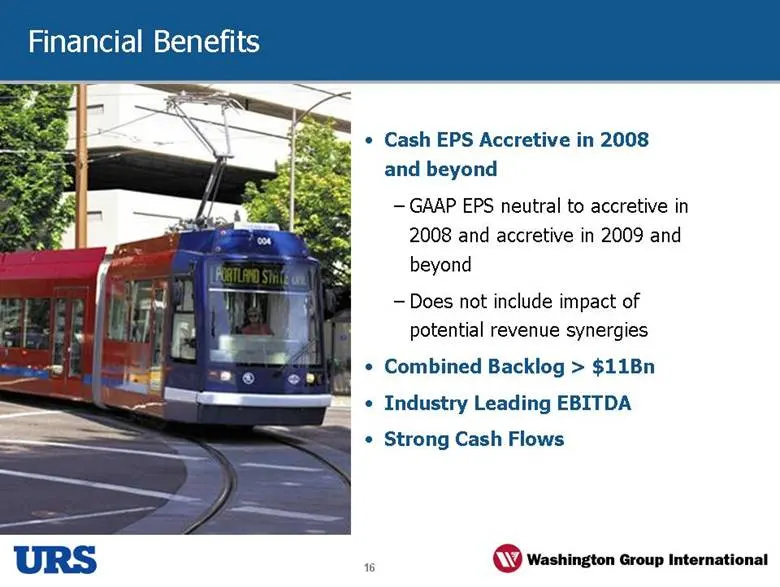
Financial Benefits Cash EPS Accretive in 2008 and beyond GAAP EPS neutral to accretive in 2008 and accretive in 2009 and beyond Does not include impact of potential revenue synergies Combined Backlog > $11Bn Industry Leading EBITDA Strong Cash Flows
Slide 17: Transaction Rationale
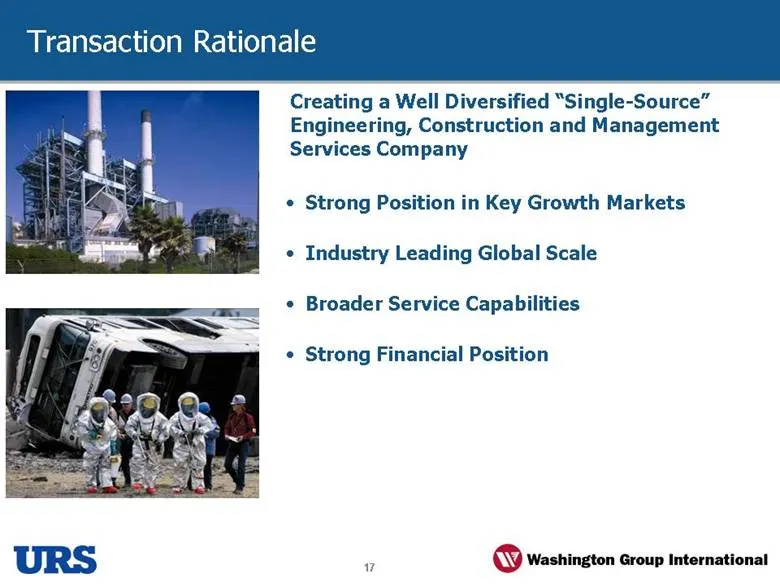
Transaction Rationale Creating a Well Diversified “Single-Source” Engineering, Construction and Management Services Company Strong Position in Key Growth Markets Industry Leading Global Scale Broader Service Capabilities Strong Financial Position
Slide 18: EBITDA Reconciliation
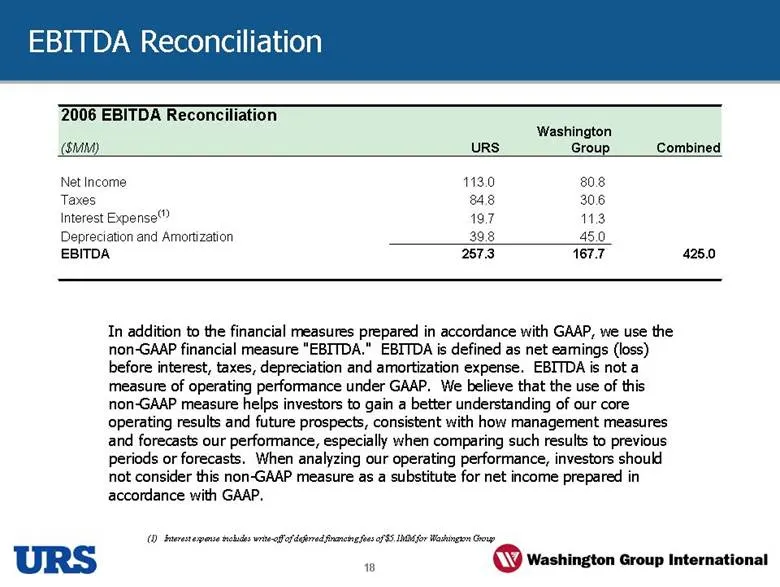
EBITDA Reconciliation (1) Interest expense includes write-off of deferred financing fees of $5.1MM for Washington Group In addition to the financial measures prepared in accordance with GAAP, we use the non-GAAP financial measure "EBITDA." EBITDA is defined as net earnings (loss) before interest, ta
Source: SEC EDGAR · 425 filed May 29, 2007
More decks from Washington Group International Inc
 Merger or Acquisition (October 2007)23 slides · Oct 15, 2007
 Washington Group International — Merger or Acquisition (September 2007)24 slides · Sep 20, 2007
 Washington Group International — Merger or Acquisition (August 2007)30 slides · Aug 22, 2007
 Credit Suisse Engineering and Environmental Services Conference 200729 slides · Jun 7, 2007