Forestar Group Inc · NYSE:FOR
Forestar — Investor Presentation (December 2018)
29 slides from Forestar's investor presentation, Dec 12, 2018
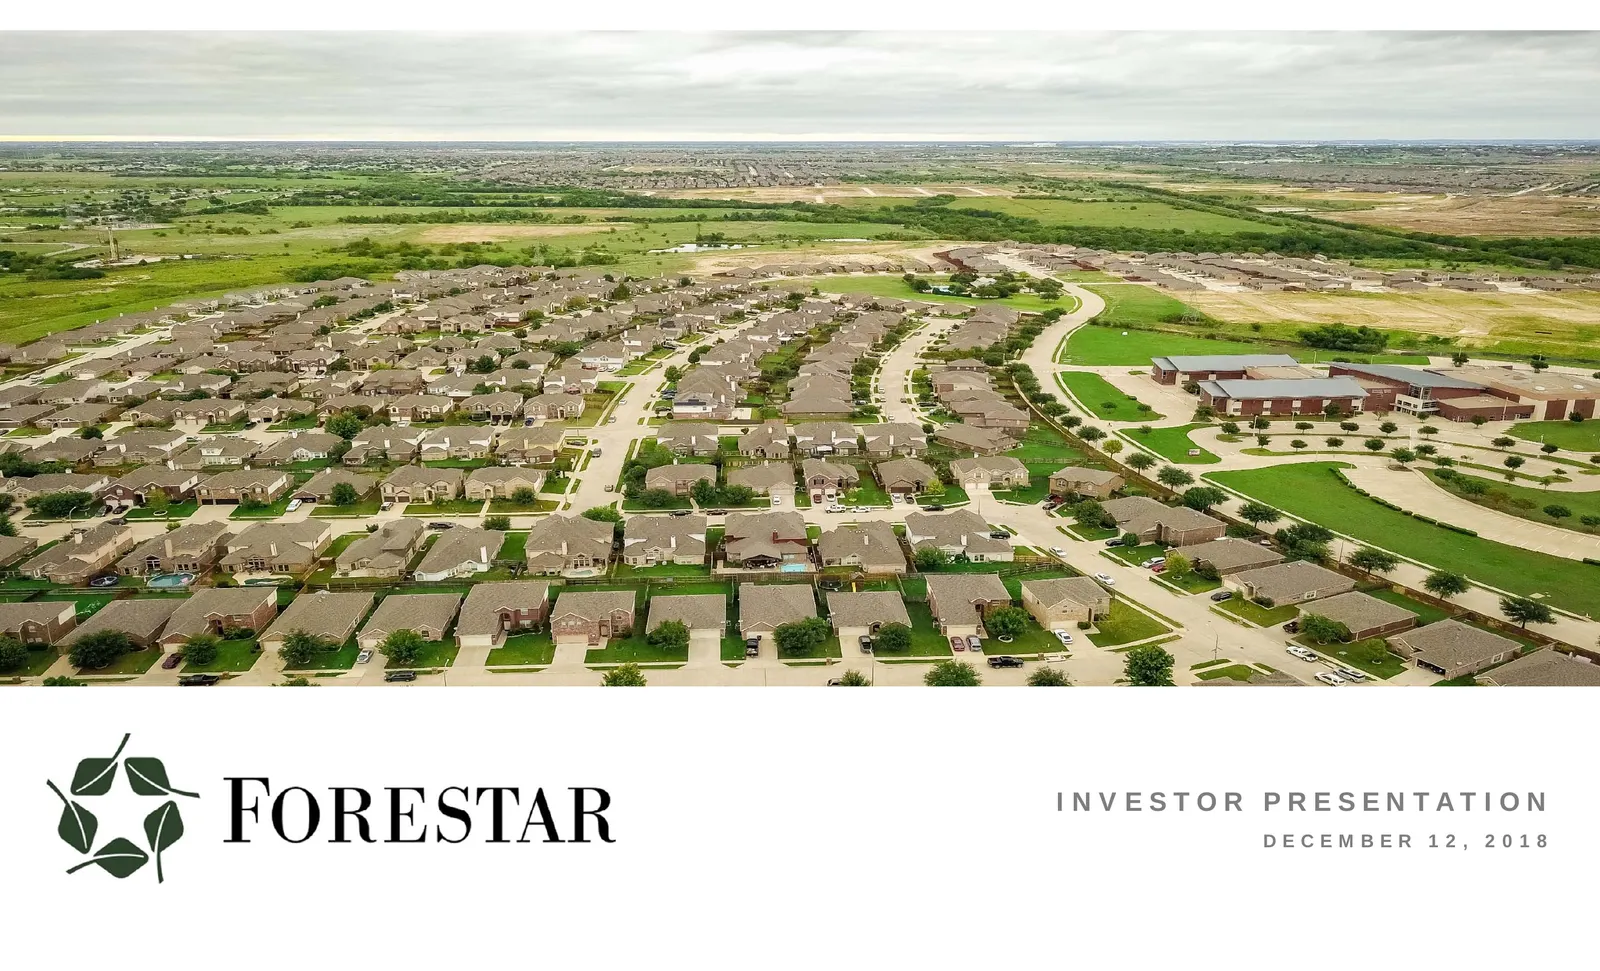
Slide 1: Investor Presentation December 12, 2018
I N V E S T O R P R E S E N TAT I O N DECEMBER 12, 2018 1
Slide 2: Forward-Looking Statements
F O R W A R D - L O O K I N G S TAT E M E N T S This presentation may include “forward‐looking statements” as defined by the Private Securities Litigation Reform Act of 1995. Although Forestar believes any such statements are based on reasonable assumptions, there is no assurance that actual outcome
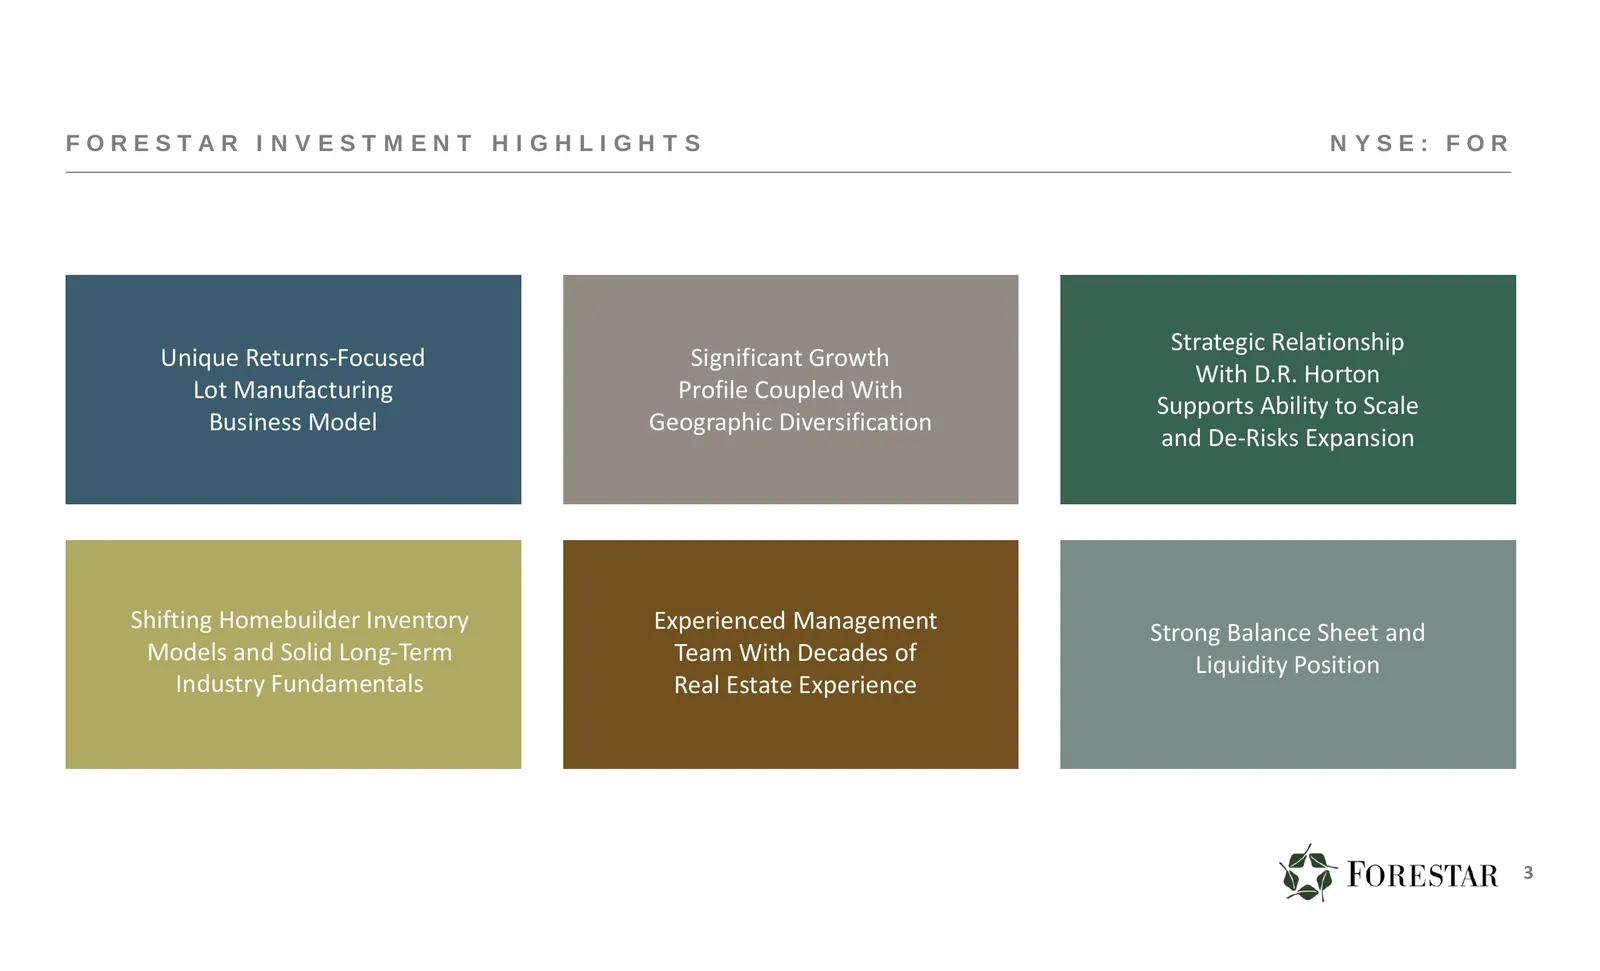
Slide 3: Forestar Investment Highlights
F O R E S TA R I N V E S T M E N T H I G H L I G H T S NYSE: FOR Strategic Relationship Unique Returns‐Focused Significant Growth With D.R. Horton Lot Manufacturing Profile Coupled With Supports Ability to Scale Business Model Geographic Diversification and De‐Risks Expansion Shifting Homebuilder In
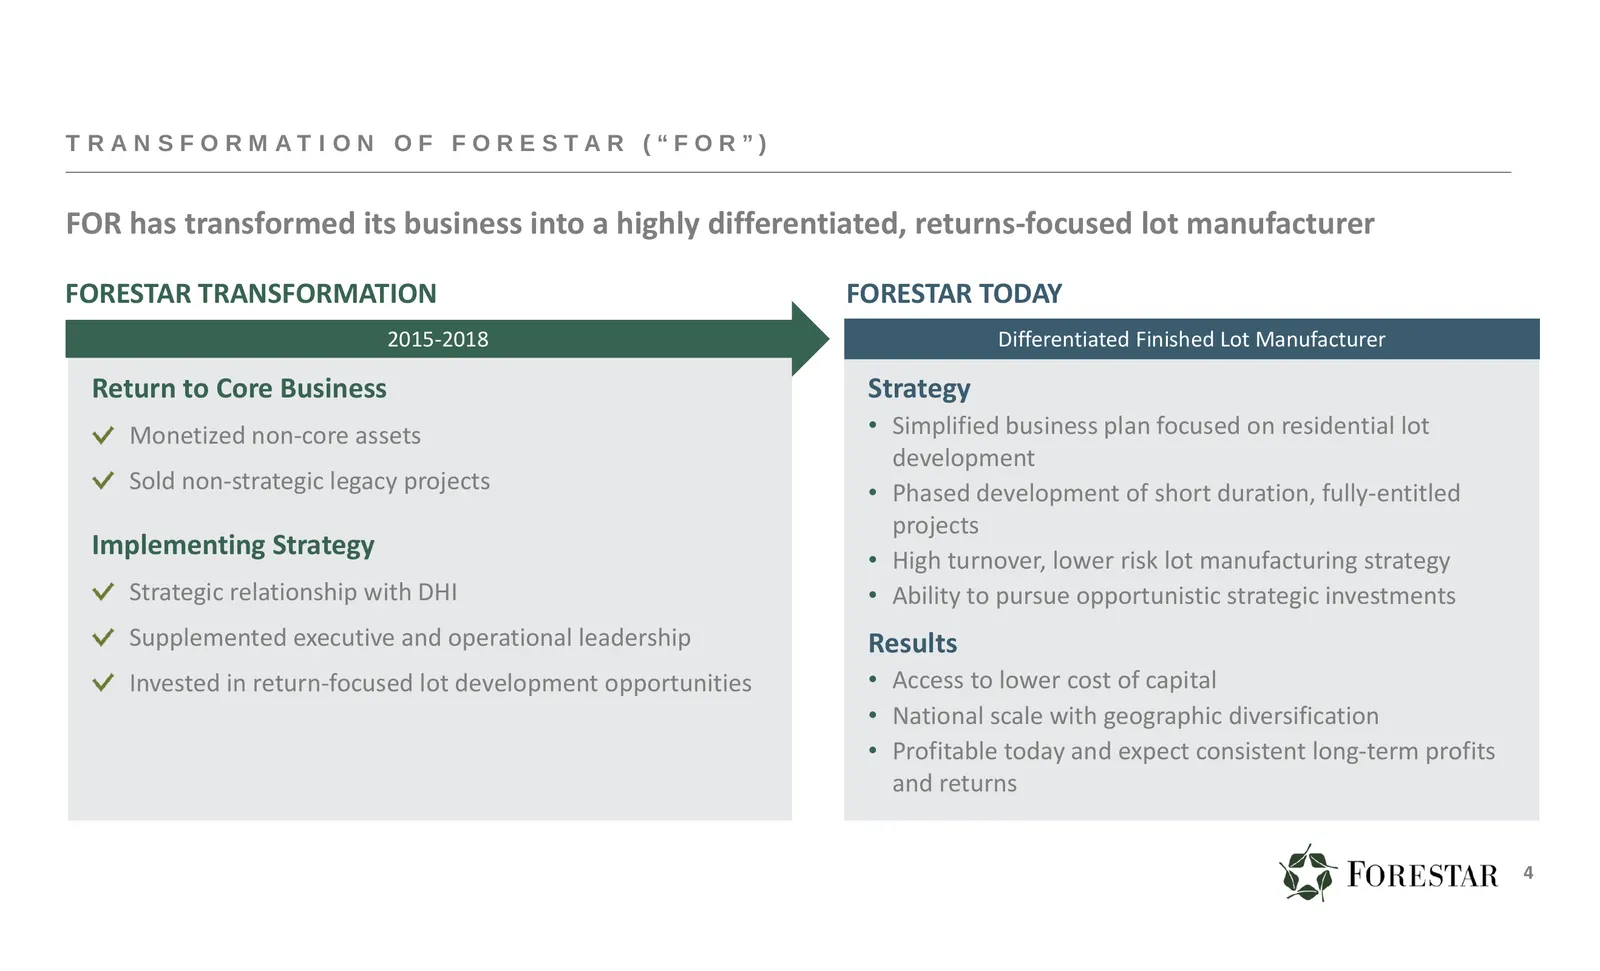
Slide 4: Transformation of Forestar ("FOR")
T R A N S F O R M AT I O N O F F O R E S TA R ( “ F O R ” ) FOR has transformed its business into a highly differentiated, returns‐focused lot manufacturer FORESTAR TRANSFORMATION FORESTAR TODAY 2015‐2018 Differentiated Finished Lot Manufacturer Return to Core Business Strategy Monetized non‐core as
Slide 5: Unique Lot Manufacturer Business Model
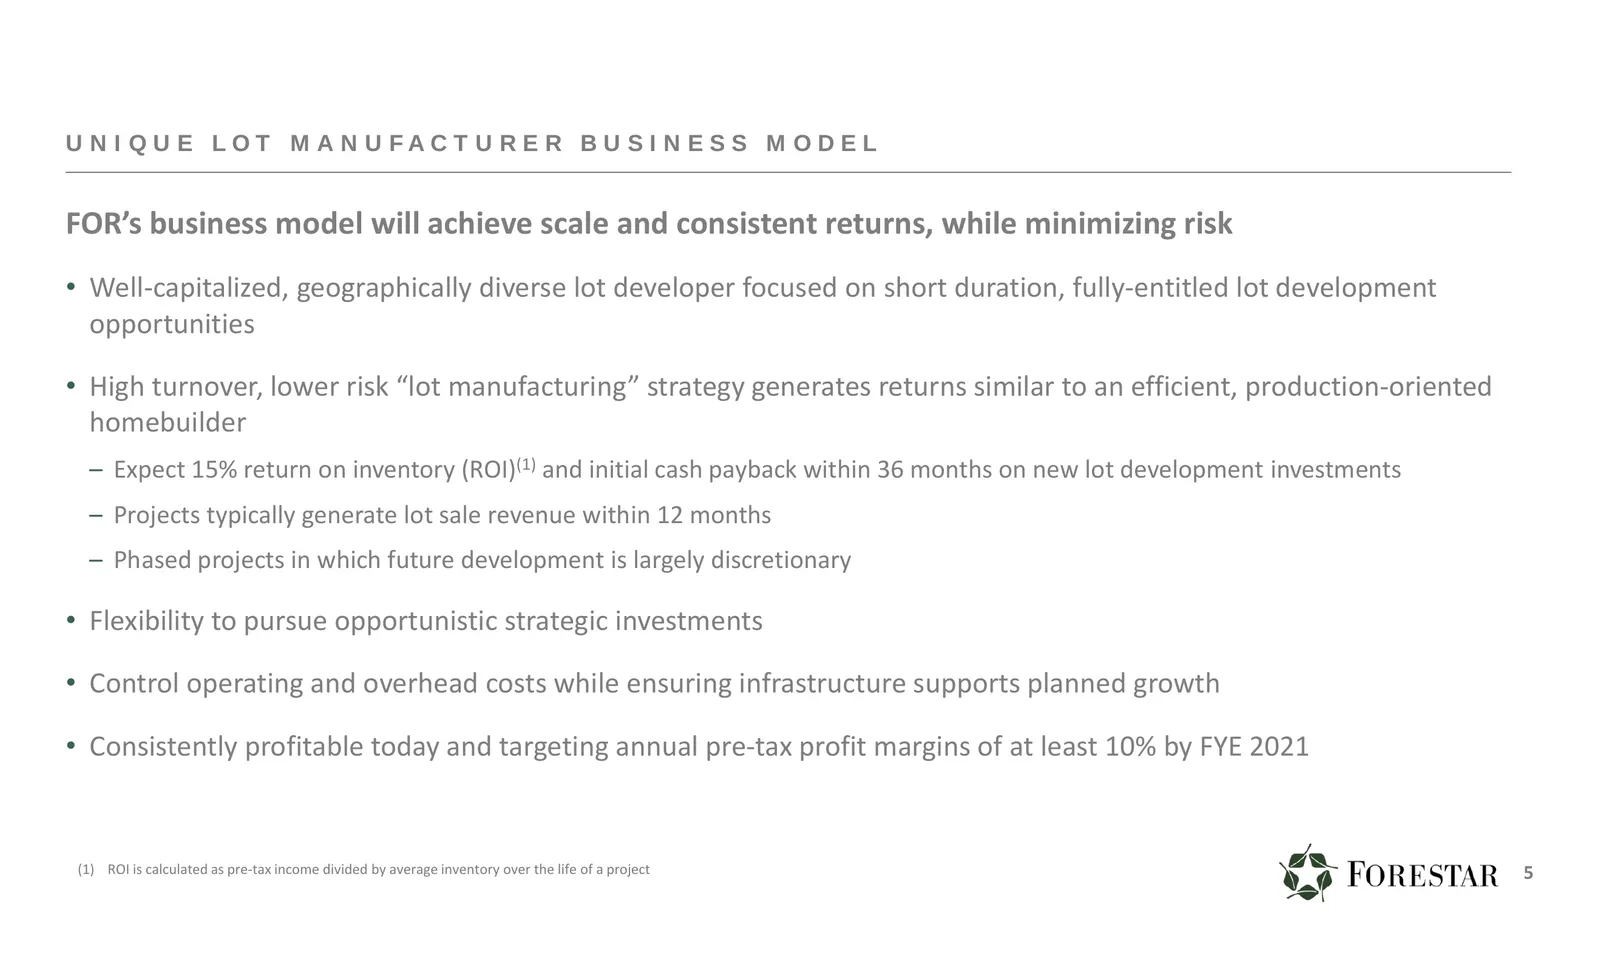
U N I Q U E L O T M A N U FA C T U R E R B U S I N E S S M O D E L FOR’s business model will achieve scale and consistent returns, while minimizing risk • Well‐capitalized, geographically diverse lot developer focused on short duration, fully‐entitled lot development opportunities • High turnover, l
Slide 6: Focused on Consistent Returns Through Lot Manufacturing
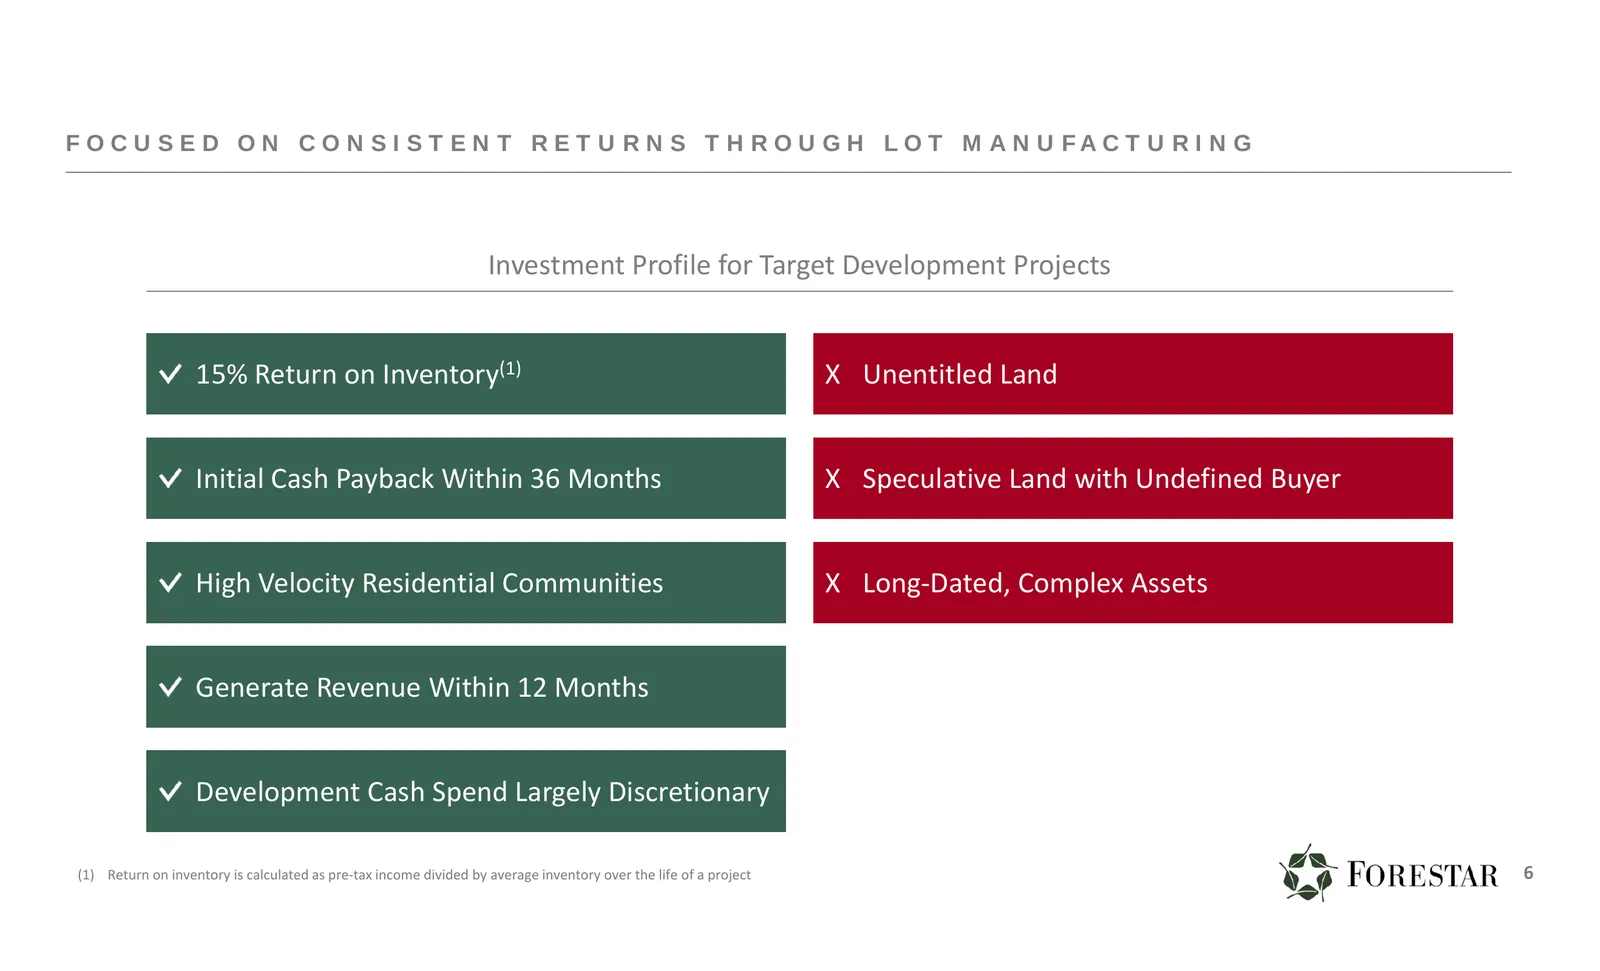
F O C U S E D O N C O N S I S T E N T R E T U R N S T H R O U G H L O T M A N U FA C T U R I N G Investment Profile for Target Development Projects 15% Return on Inventory(1) X Unentitled Land Initial Cash Payback Within 36 Months X Speculative Land with Undefined Buyer High Velocity Residential Com
Slide 7: Competitive Advantages
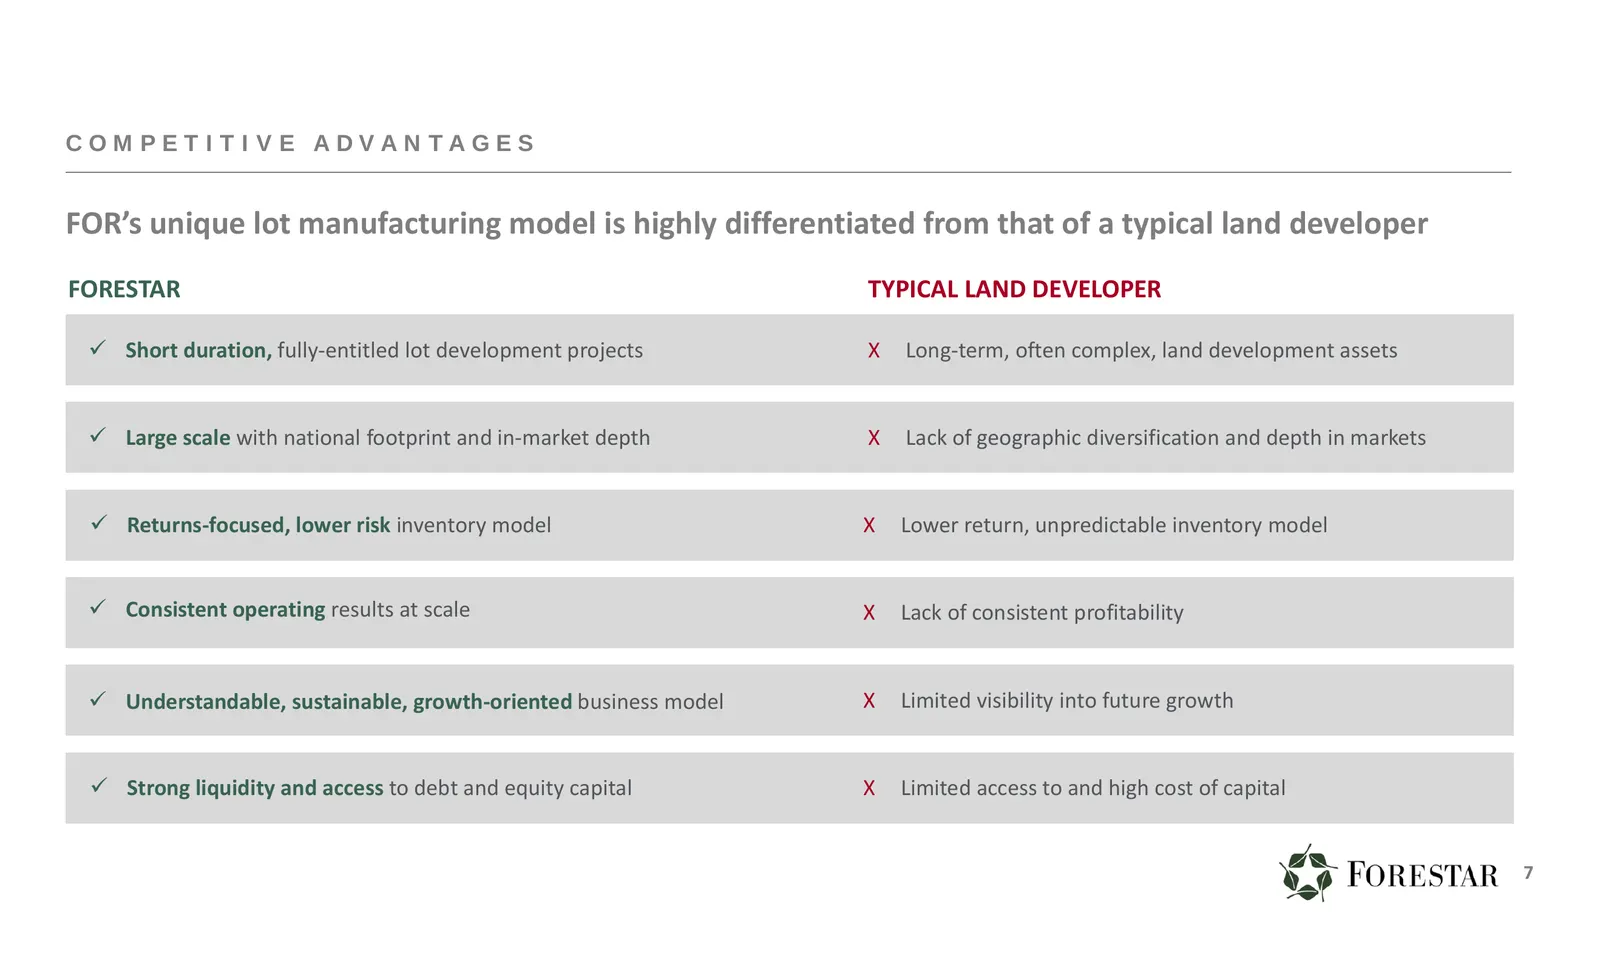
C O M P E T I T I V E A DVA N TA G E S FOR’s unique lot manufacturing model is highly differentiated from that of a typical land developer FORESTAR TYPICAL LAND DEVELOPER Short duration, fully‐entitled lot development projects X Long‐term, often complex, land development assets Large scale with
Slide 8: Significant Near-Term Growth
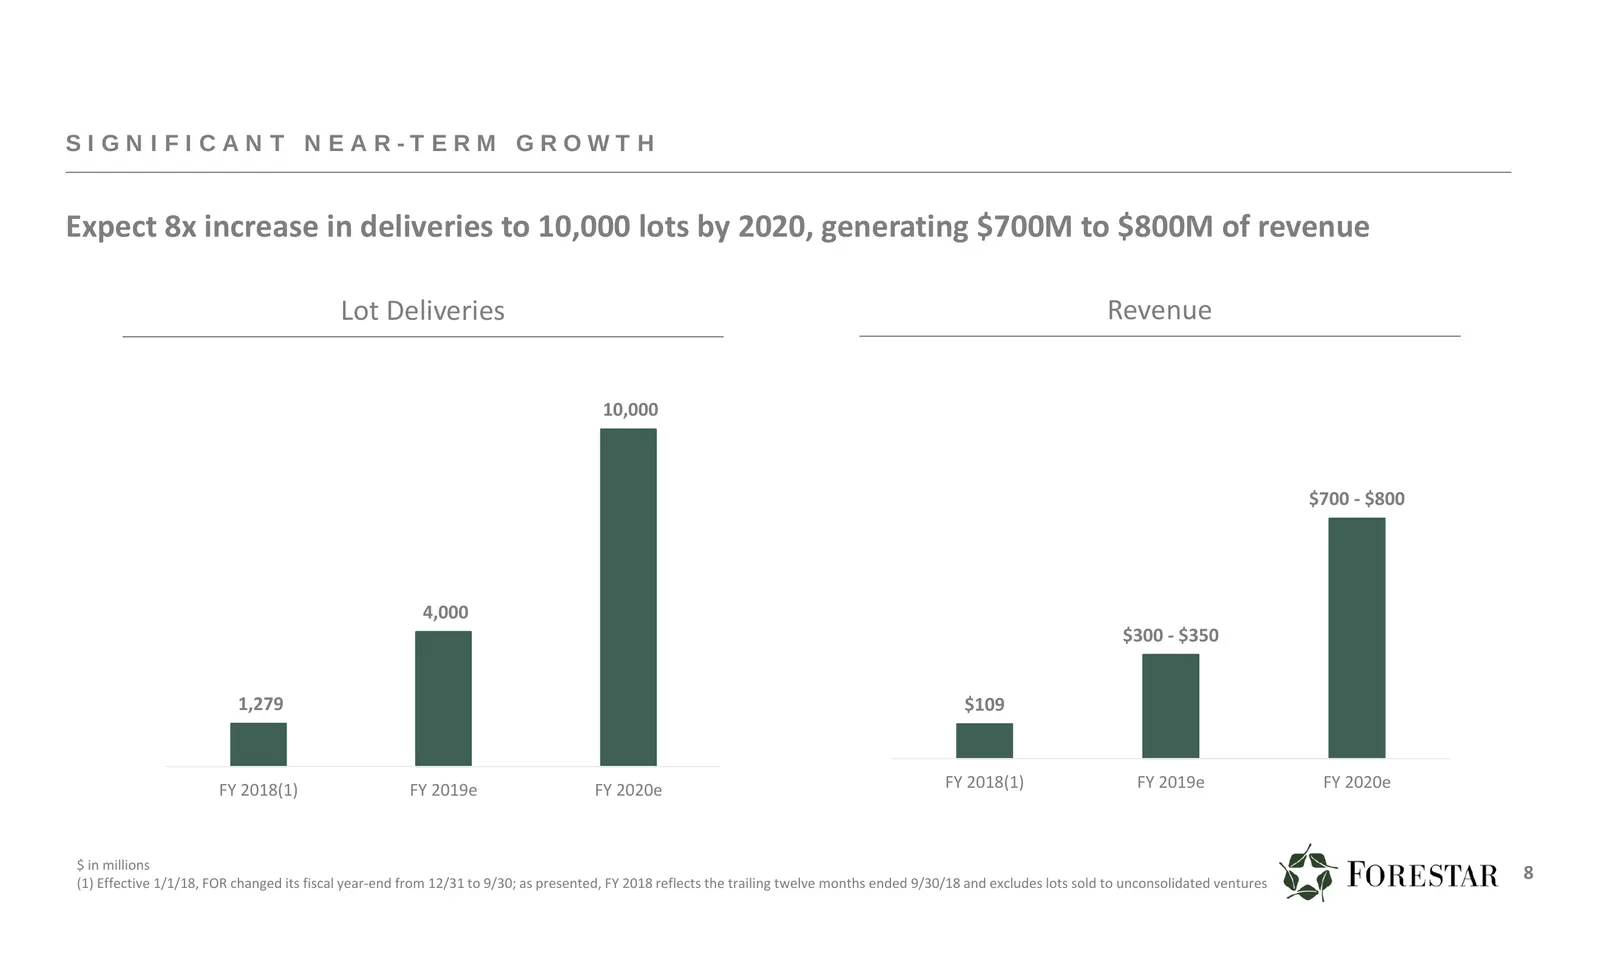
SIGNIFICANT NEAR-TERM GROWTH Expect 8x increase in deliveries to 10,000 lots by 2020, generating $700M to $800M of revenue Lot Deliveries Revenue 10,000 $700 ‐ $800 4,000 $300 ‐ $350 1,279 $109 FY 2018(1) FY 2019e FY 2020e FY 2018(1) FY 2019e FY 2020e $ in millions (1) Effective 1/1/18, FOR changed
Slide 9: Accelerating FOR's Growth Trajectory
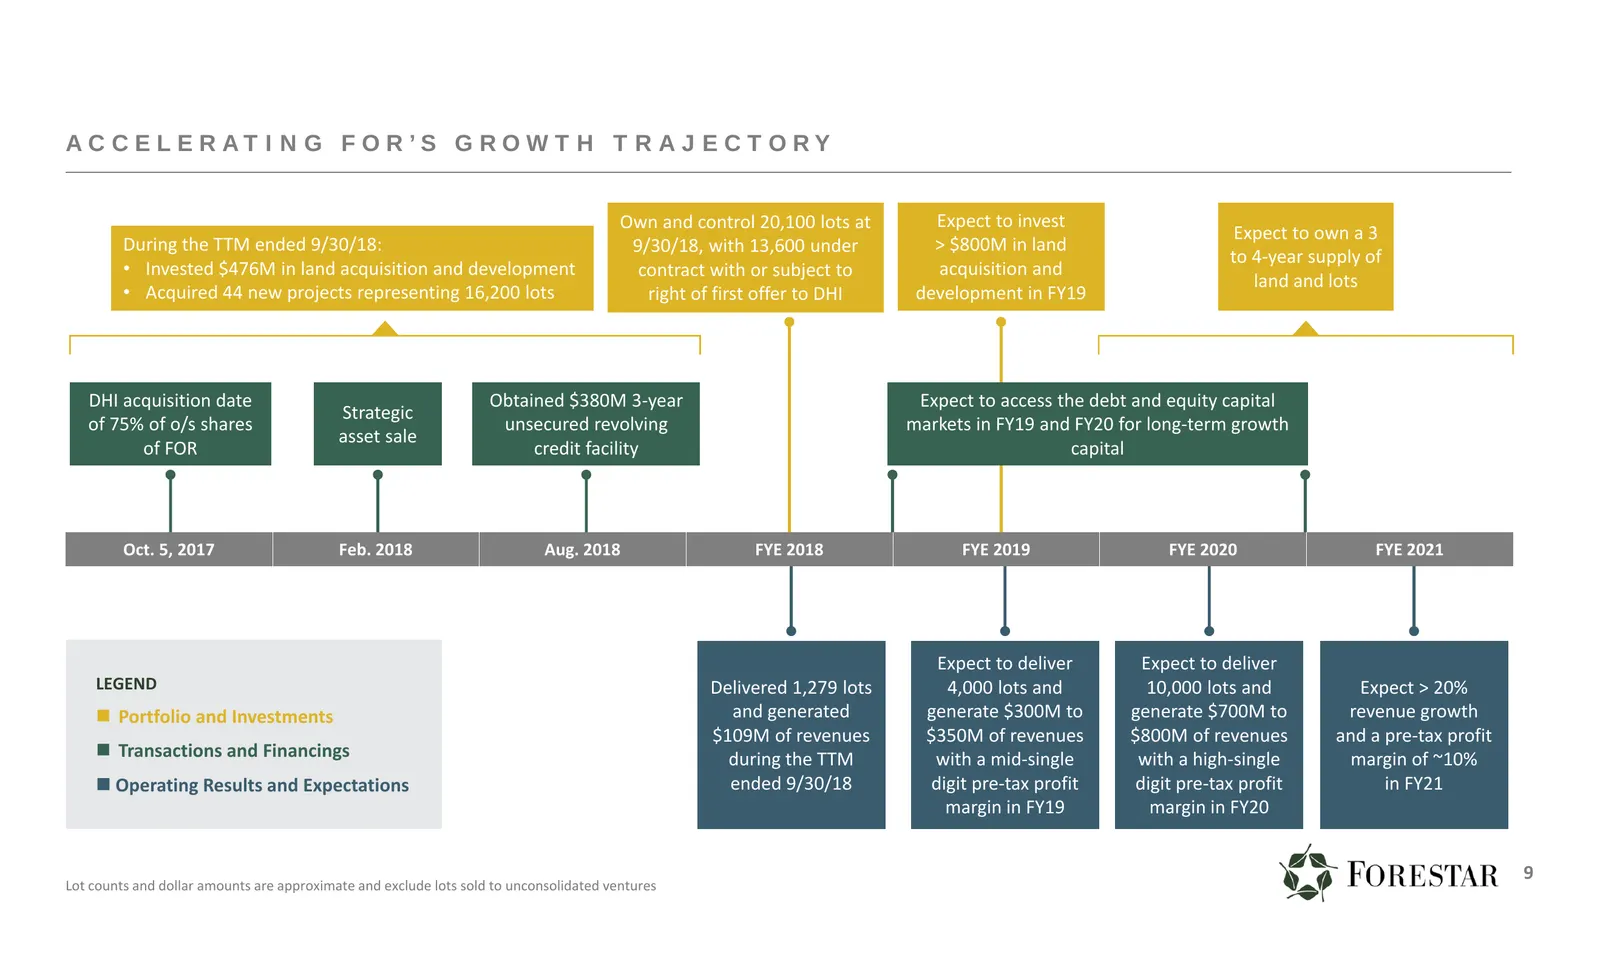
A C C E L E R AT I N G F O R ’ S G R O W T H T R A J E C TO RY Own and control 20,100 lots at Expect to invest Expect to own a 3 During the TTM ended 9/30/18: 9/30/18, with 13,600 under > $800M in land to 4‐year supply of • Invested $476M in land acquisition and development contract with or subject
Slide 10: Diversified and Growing Footprint
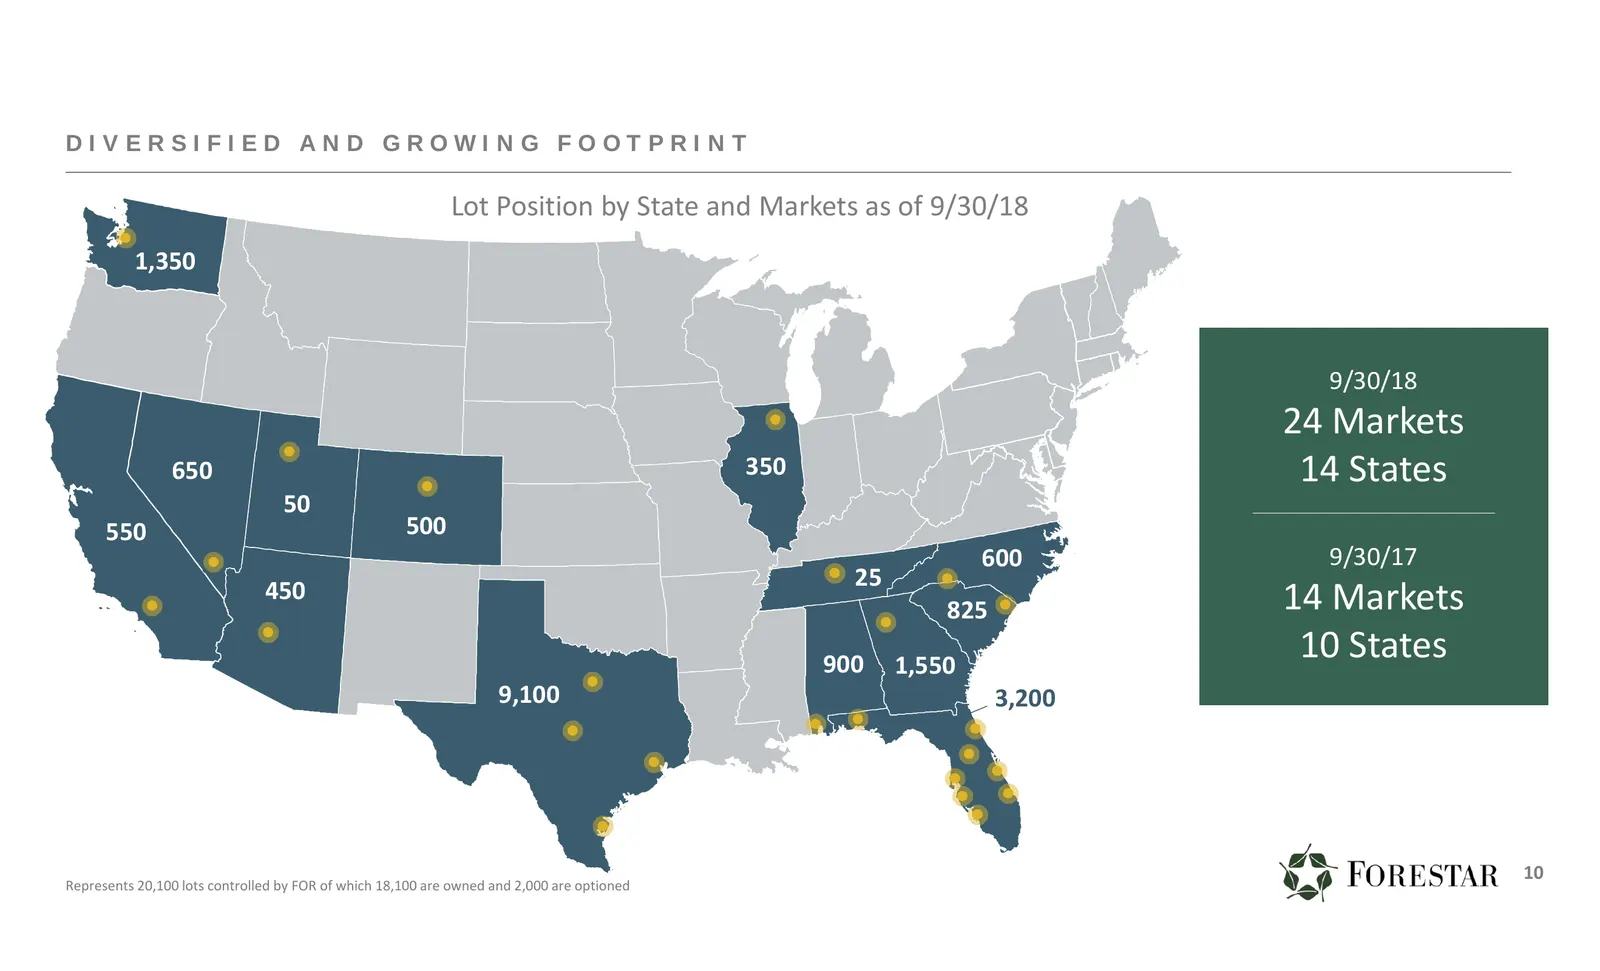
DIVERSIFIED AND GROWING FOOTPRINT Lot Lot Position Position by by State State and Markets as of 9/30/18 1,350 9/30/18 24 Markets 650 350 14 States 50 550 500 600 9/30/17 450 25 825 14 Markets 900 1,550 10 States 9,100 3,200 10 Represents 20,100 lots controlled by FOR of which 18,100 are owned and 2,
Slide 11: Investment Portfolio Today
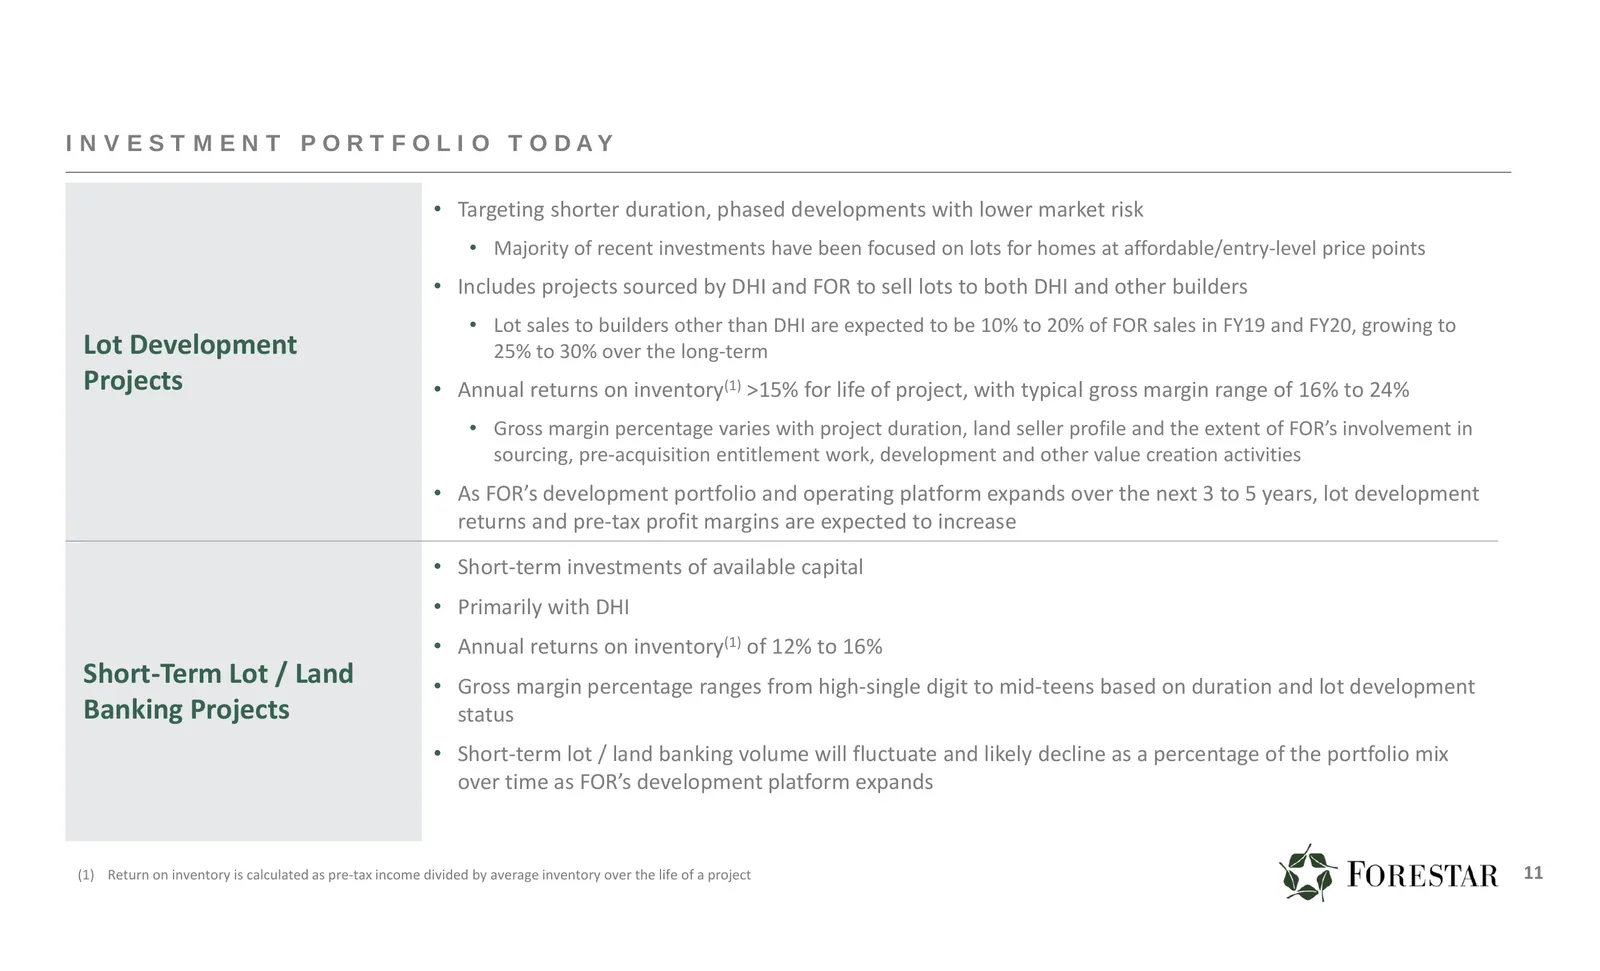
I N V E S T M E N T P O R T F O L I O T O D AY • Targeting shorter duration, phased developments with lower market risk • Majority of recent investments have been focused on lots for homes at affordable/entry‐level price points • Includes projects sourced by DHI and FOR to sell lots to both DHI and
Slide 12: Highly Strategic Benefits of FOR & DHI Alignment
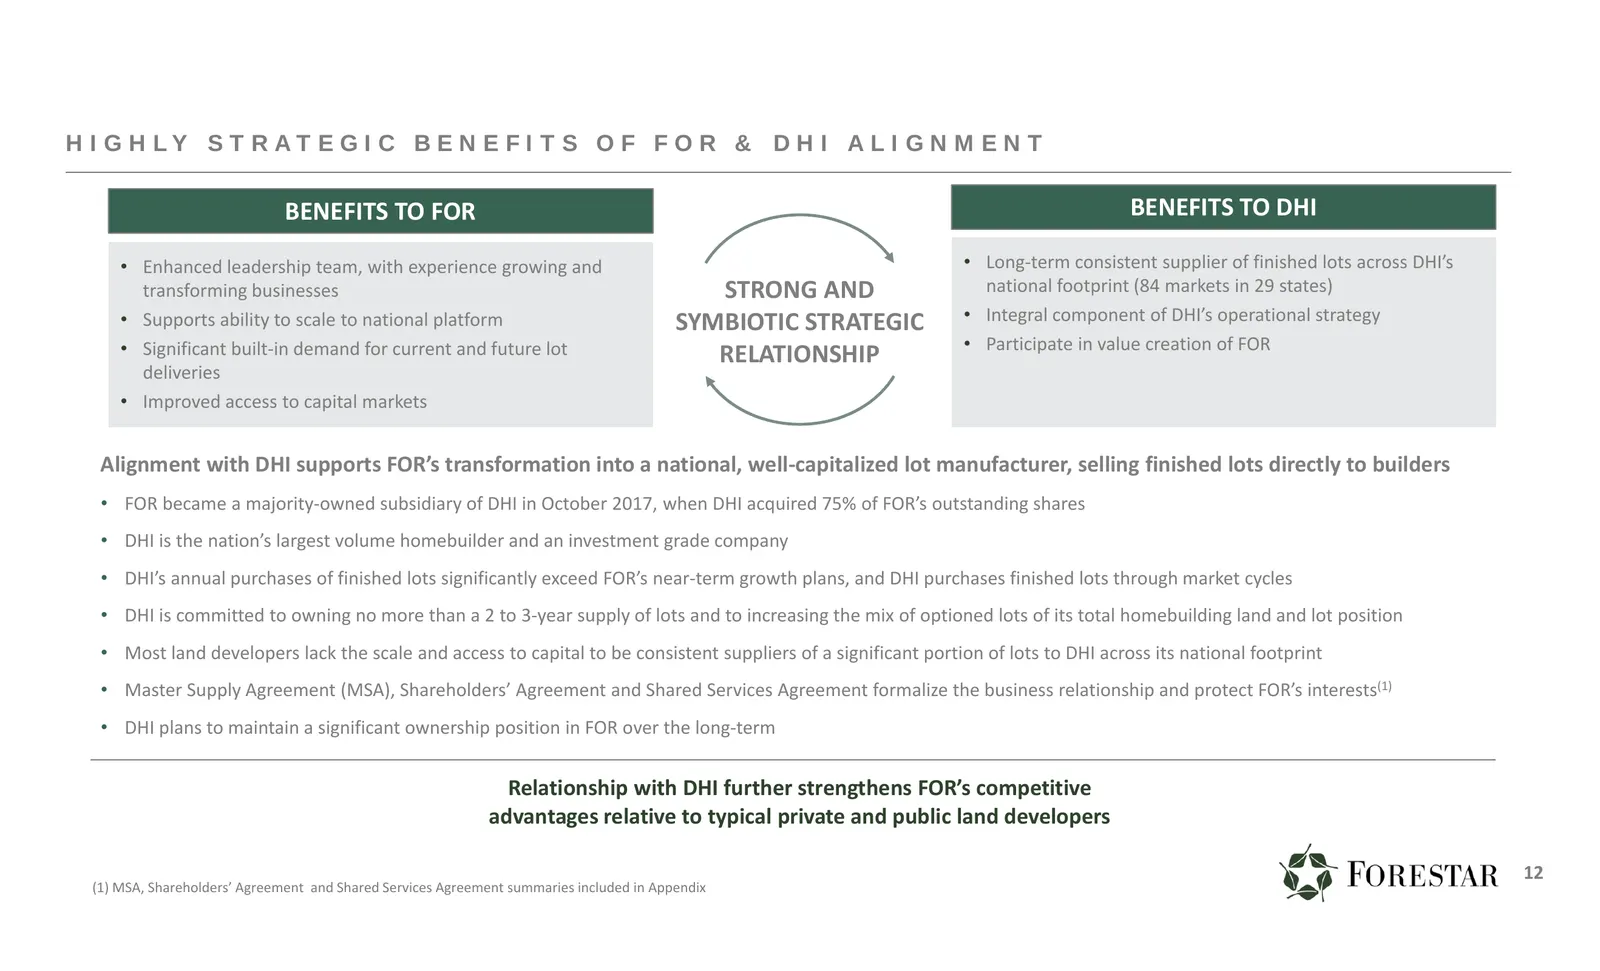
H I G H LY S T R AT E G I C B E N E F I T S O F F O R & D H I A L I G N M E N T BENEFITS TO FOR BENEFITS TO DHI • Enhanced leadership team, with experience growing and • Long‐term consistent supplier of finished lots across DHI’s transforming businesses STRONG AND national footprint (84 markets in 2
Slide 13: Builders' Shift to 'Land Lighter' Strategy Creates Opportunity
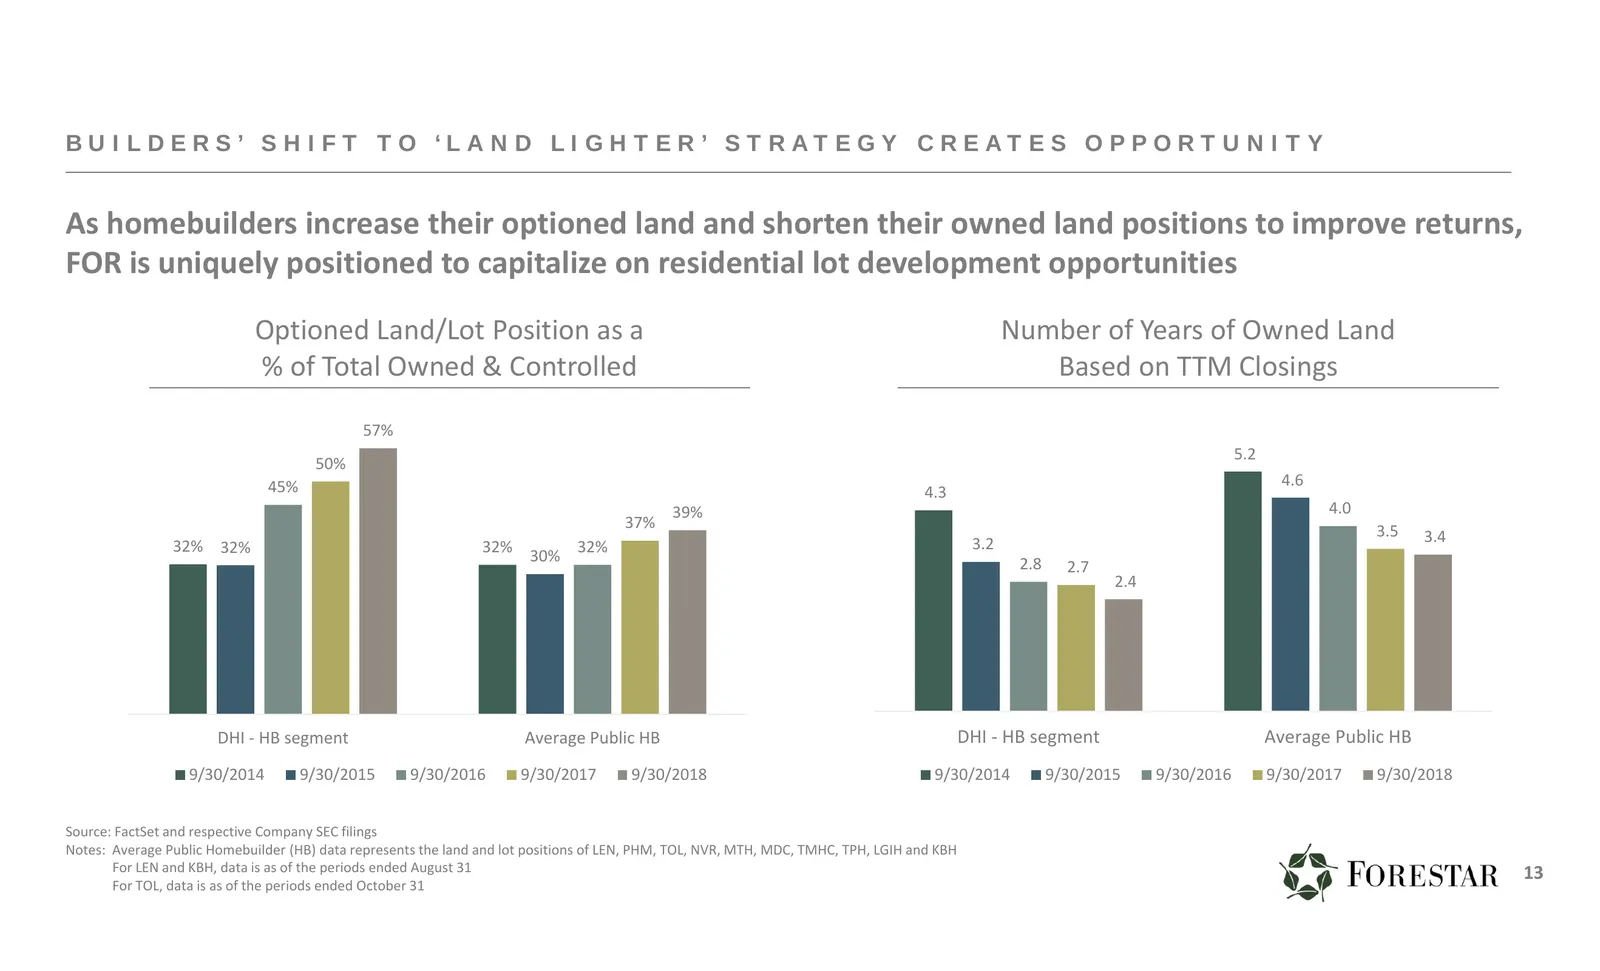
B U I L D E R S ’ S H I F T TO ‘ L A N D L I G H T E R ’ S T R AT E G Y C R E AT E S O P P O R T U N I T Y As homebuilders increase their optioned land and shorten their owned land positions to improve returns, FOR is uniquely positioned to capitalize on residential lot development opportunities Opt
Slide 14: Solid Long-Term Industry Fundamentals
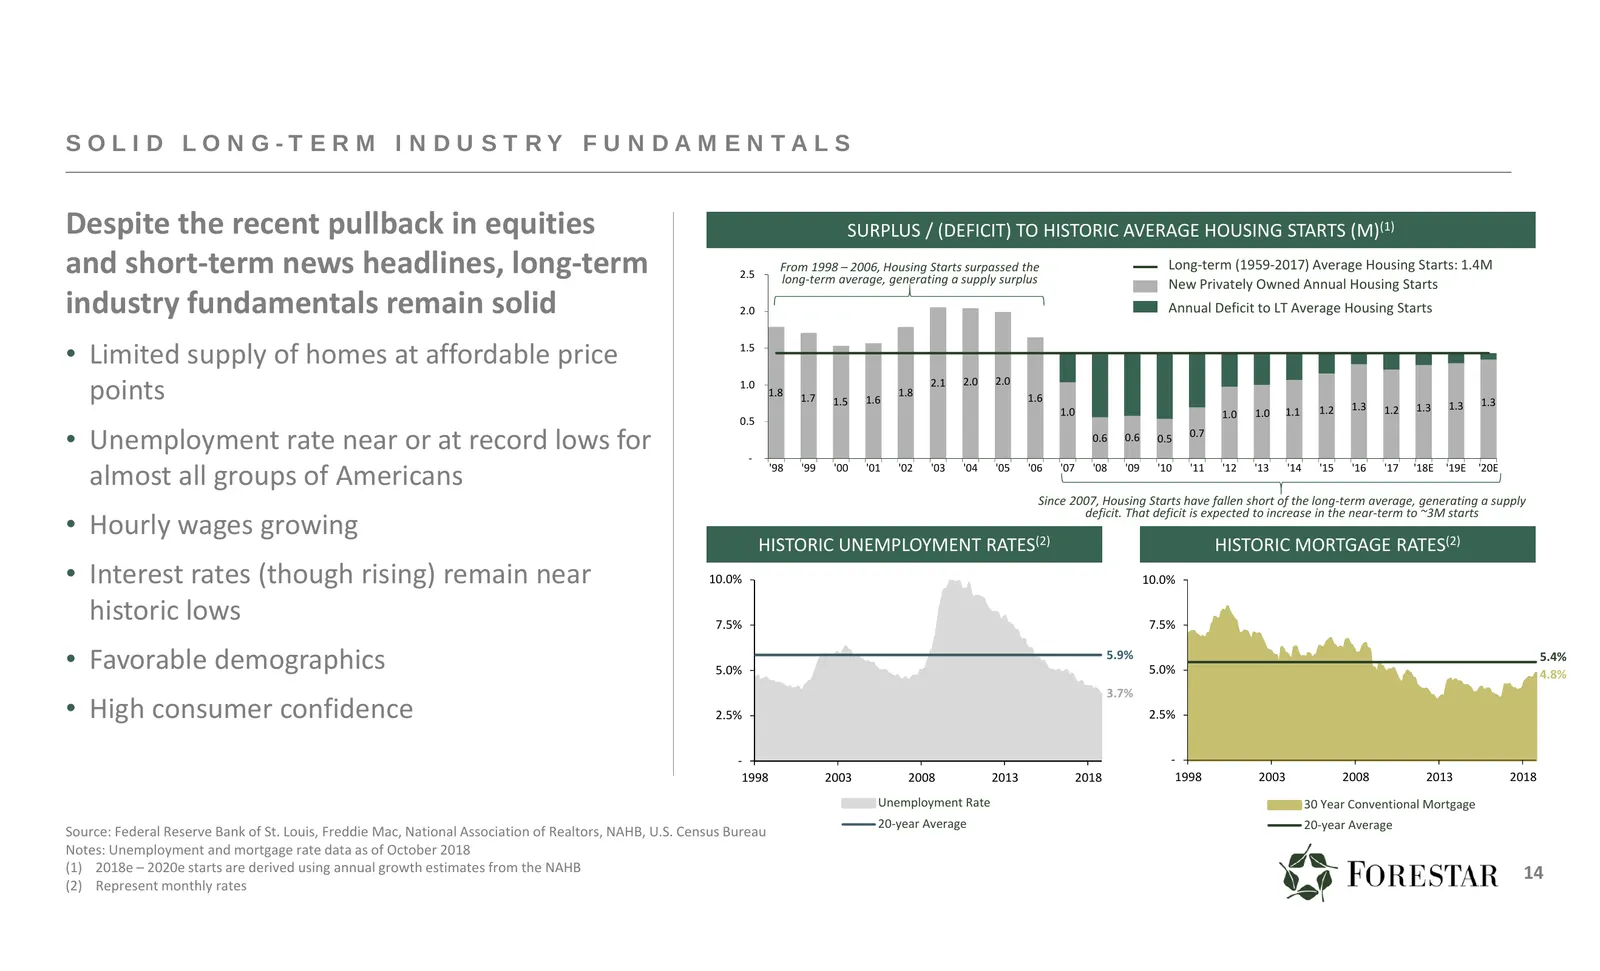
S O L I D L O N G - T E R M I N D U S T RY F U N DA M E N TA L S Despite the recent pullback in equities SURPLUS / (DEFICIT) TO HISTORIC AVERAGE HOUSING STARTS (M)(1) and short‐term news headlines, long‐term 2.5 From 1998 – 2006, Housing Starts surpassed the long‐term average, generating a supply su
Slide 15: Seasoned Leaders with Decades of Land Development Experience
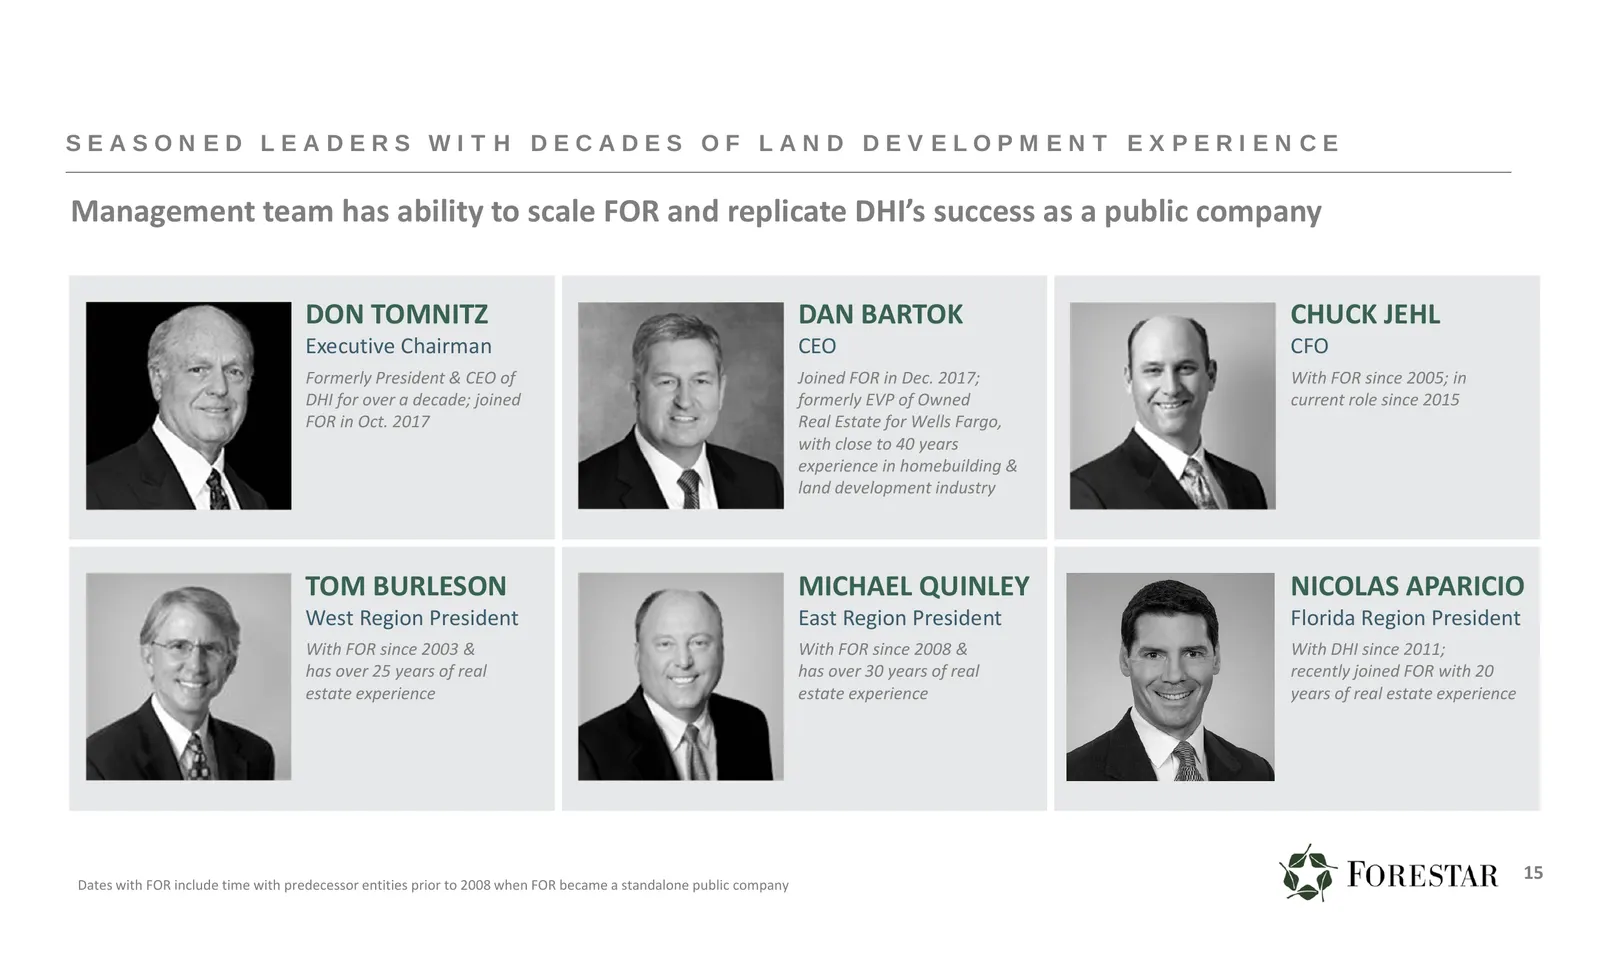
SEASONED LEADERS WITH DECADES OF LAND DEVELOPMENT EXPERIENCE Management team has ability to scale FOR and replicate DHI’s success as a public company DON TOMNITZ DAN BARTOK CHUCK JEHL Executive Chairman CEO CFO Formerly President & CEO of Joined FOR in Dec. 2017; With FOR since 2005; in DHI for over
Slide 16: Financial Position and Policy
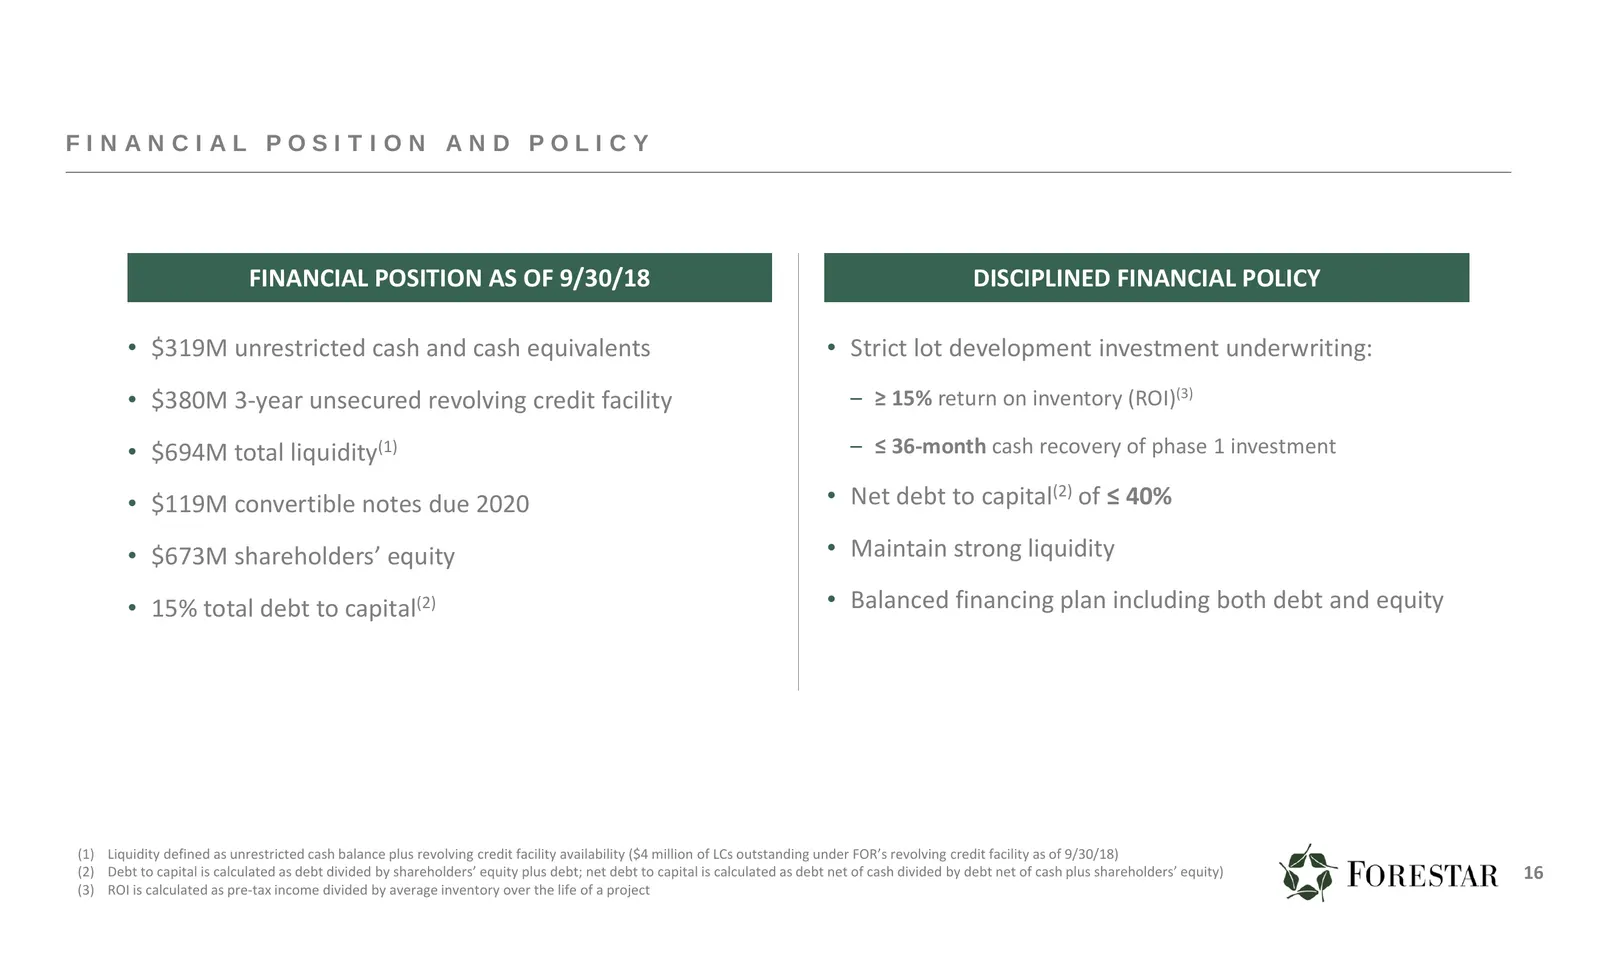
FINANCIAL POSITION AND POLICY FINANCIAL POSITION AS OF 9/30/18 DISCIPLINED FINANCIAL POLICY • $319M unrestricted cash and cash equivalents • Strict lot development investment underwriting: • $380M 3‐year unsecured revolving credit facility – ≥ 15% return on inventory (ROI)(3) • $694M total liquidity
Slide 17: Positive Outlook and Capital Markets Plans
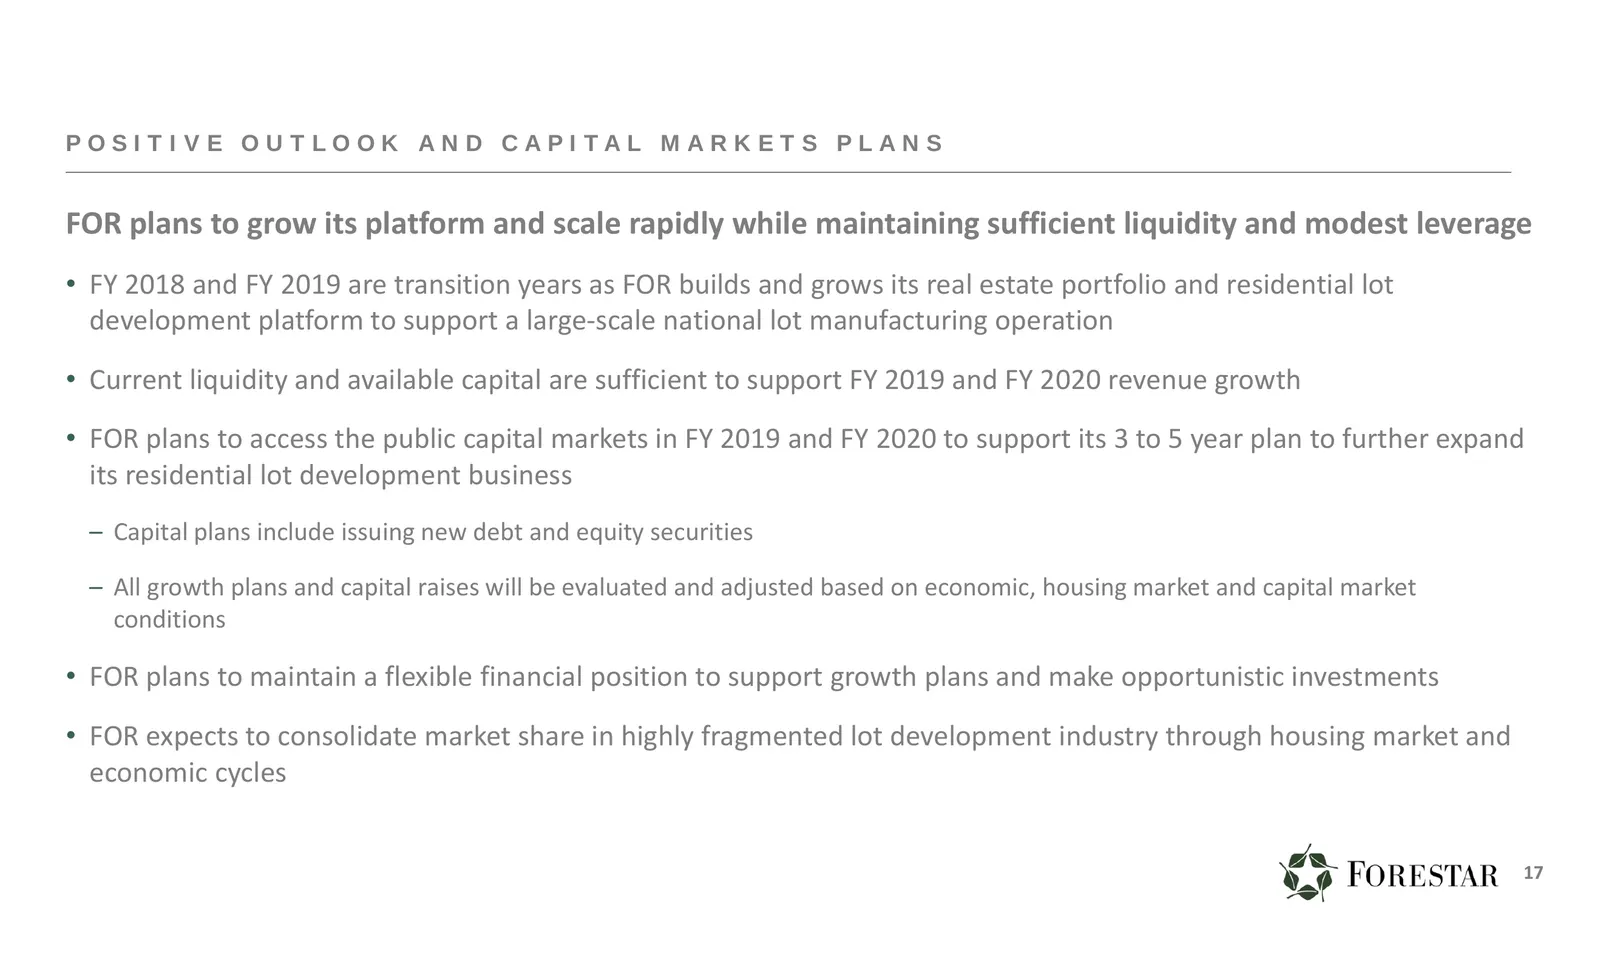
P O S I T I V E O U T L O O K A N D C A P I TA L M A R K E T S P L A N S FOR plans to grow its platform and scale rapidly while maintaining sufficient liquidity and modest leverage • FY 2018 and FY 2019 are transition years as FOR builds and grows its real estate portfolio and residential lot develo
Slide 18: Forestar Investment Highlights
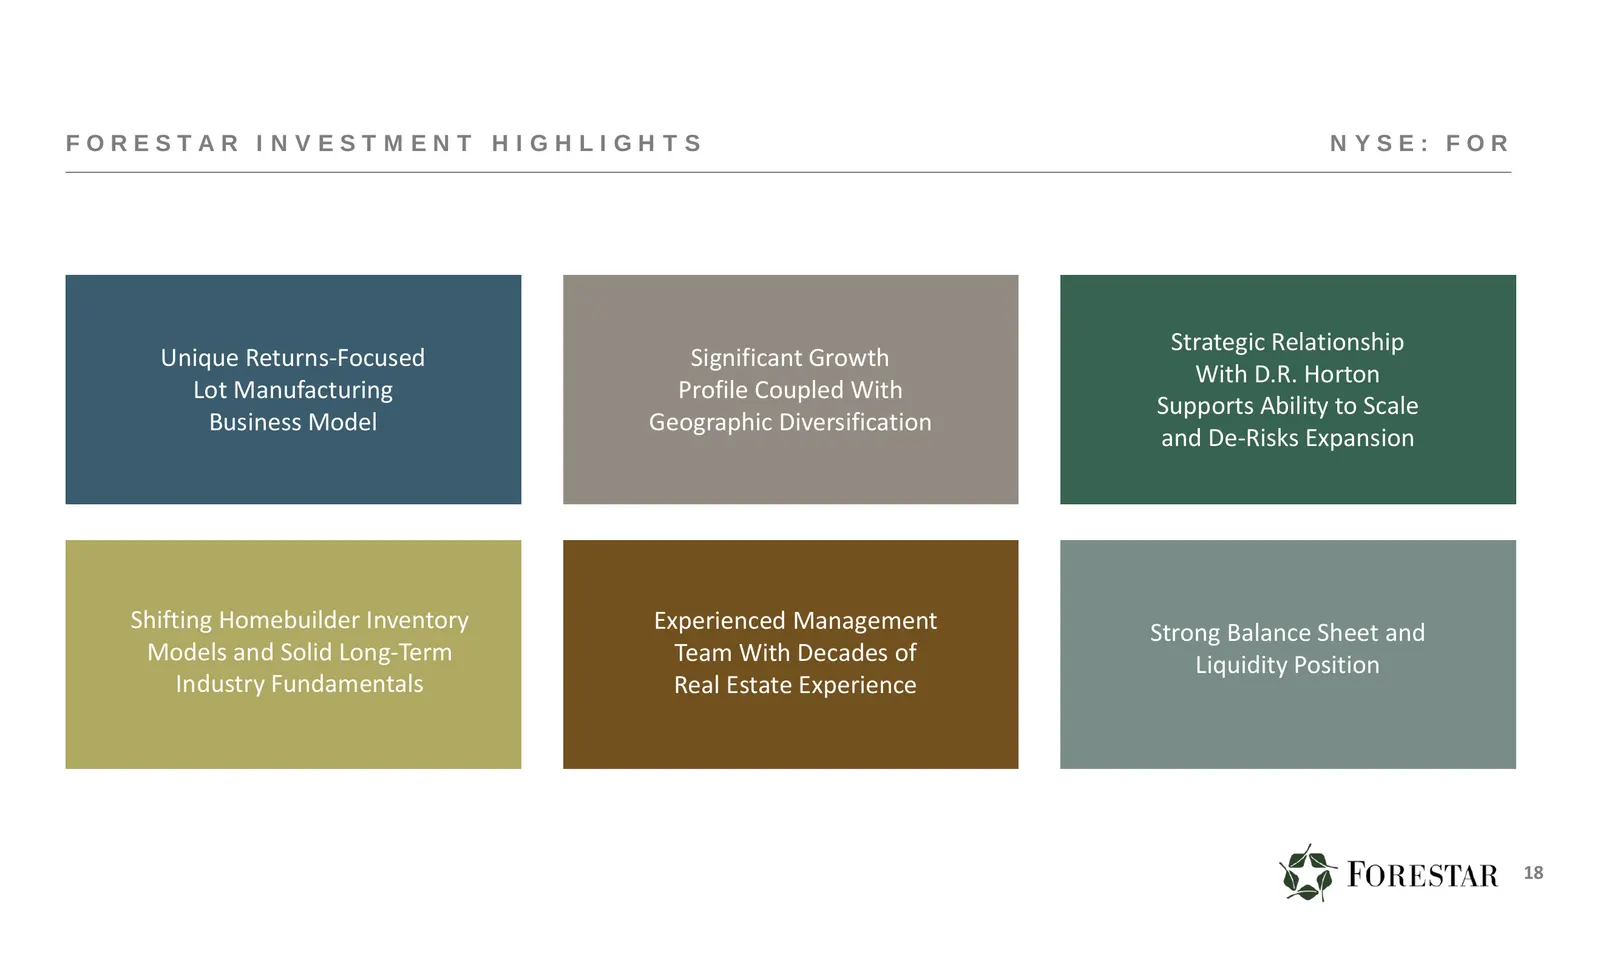
F O R E S TA R I N V E S T M E N T H I G H L I G H T S NYSE: FOR Strategic Relationship Unique Returns‐Focused Significant Growth With D.R. Horton Lot Manufacturing Profile Coupled With Supports Ability to Scale Business Model Geographic Diversification and De‐Risks Expansion Shifting Homebuilder In
Slide 19: Appendix
APPENDIX Wp FORESTAR »
Slide 20: Illustrative Lot Development Project
ILLUSTRATIVE LOT DEVELOPMENT PROJECT And Homebuilder vs. Lot Manufacturer Project Economics 20
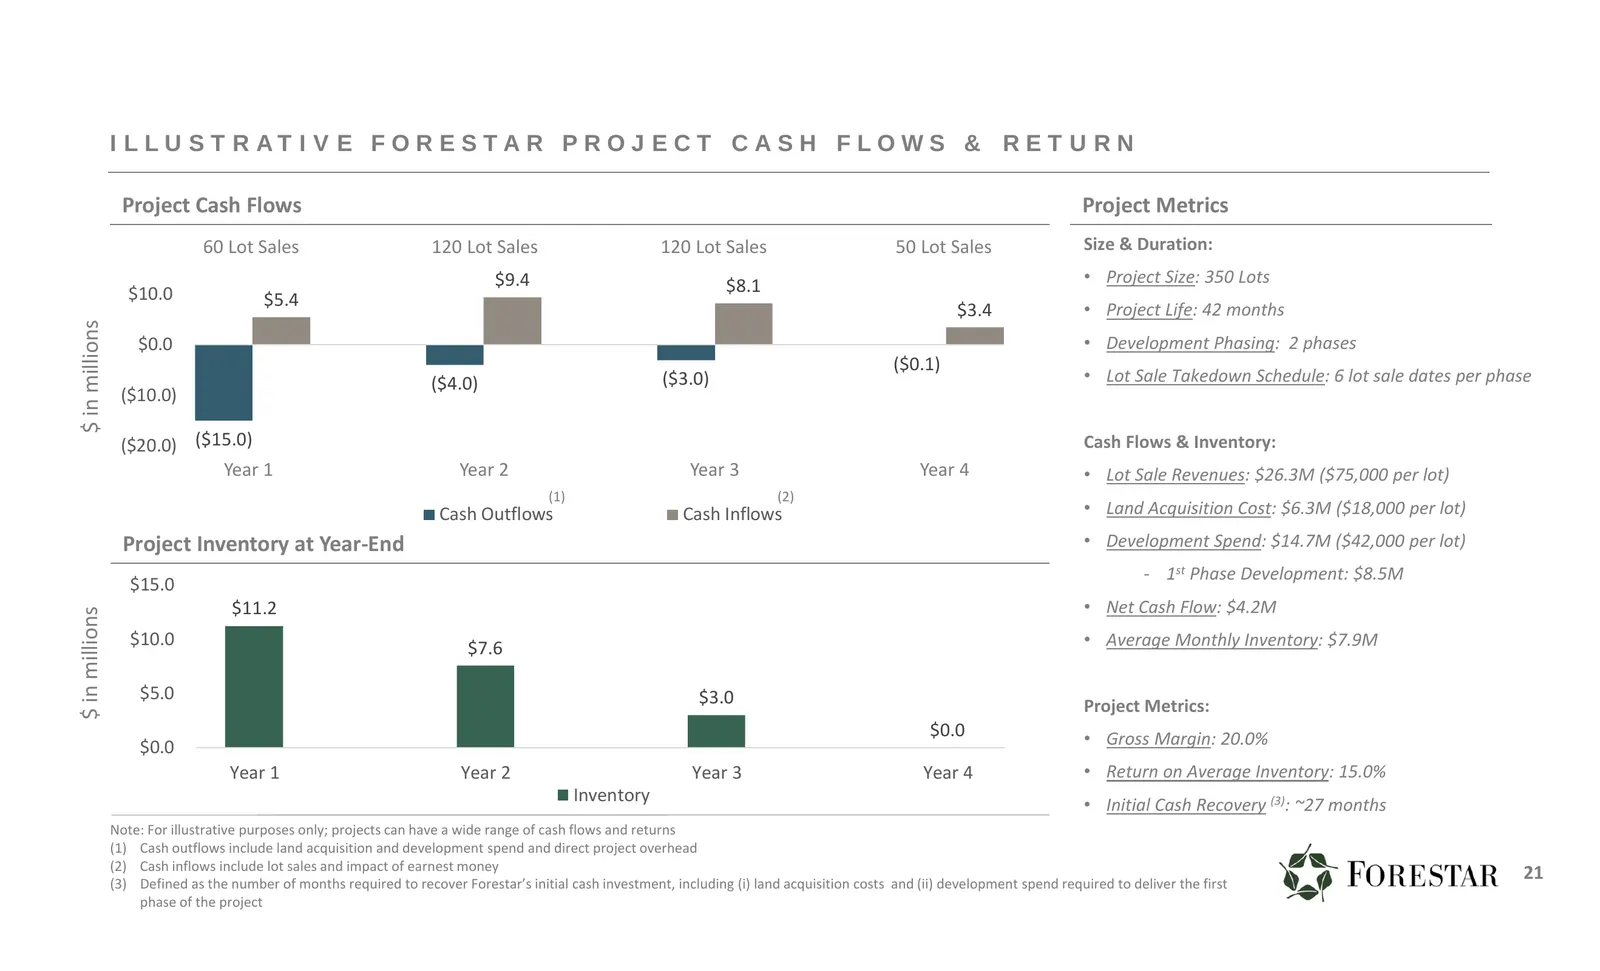
Slide 21: Illustrative Forestar Project Cash Flows & Return
I L LU S T R AT I V E F O R E S TA R P R O J E C T C A S H F L O W S & R E T U R N Project Cash Flows Project Metrics 60 Lot Sales 120 Lot Sales 120 Lot Sales 50 Lot Sales Size & Duration: $9.4 $8.1 • Project Size: 350 Lots $10.0 $5.4 $3.4 • Project Life: 42 months $ in millions $0.0 • Development P
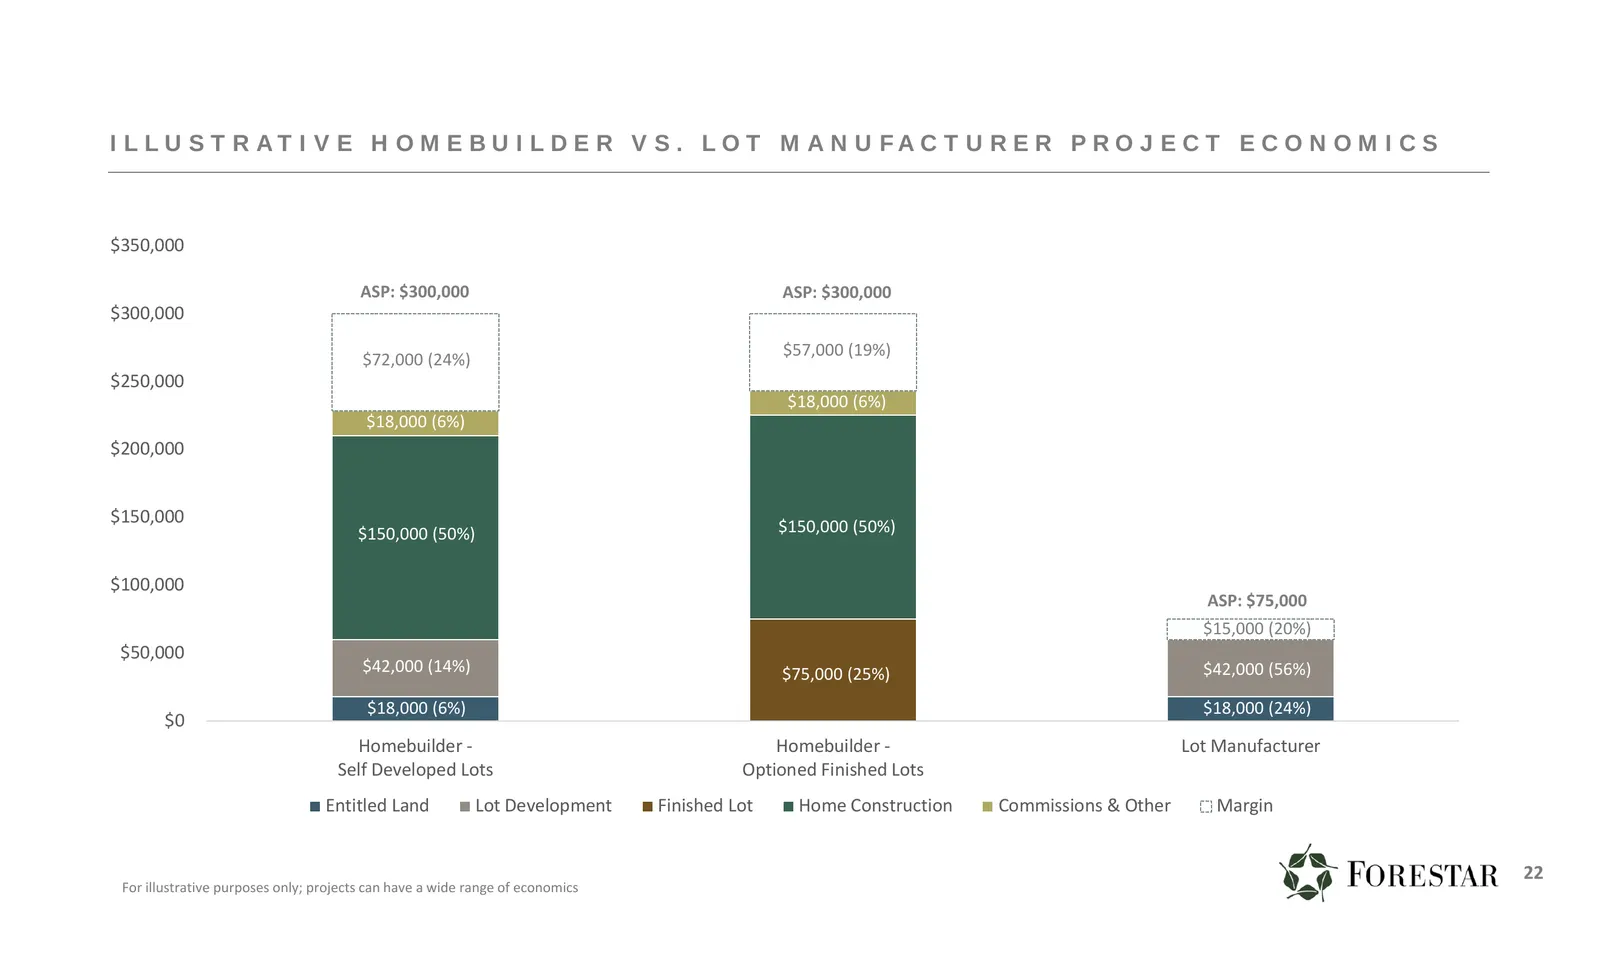
Slide 22: Illustrative Homebuilder vs. Lot Manufacturer Project Economics
I L L U S T R AT I V E H O M E B U I L D E R V S . L O T M A N U FA C T U R E R P R O J E C T E C O N O M I C S $350,000 ASP: $300,000 ASP: $300,000 $300,000 $57,000 (19%) $72,000 (24%) $250,000 $18,000 (6%) $18,000 (6%) $200,000 $150,000 $150,000 (50%) $150,000 (50%) $100,000 ASP: $75,000 $15,000 (
Slide 23: FOR & DHI Relationship Overview
FOR & DHI RELATIONSHIP OVERVIEW And Agreement Summaries 23
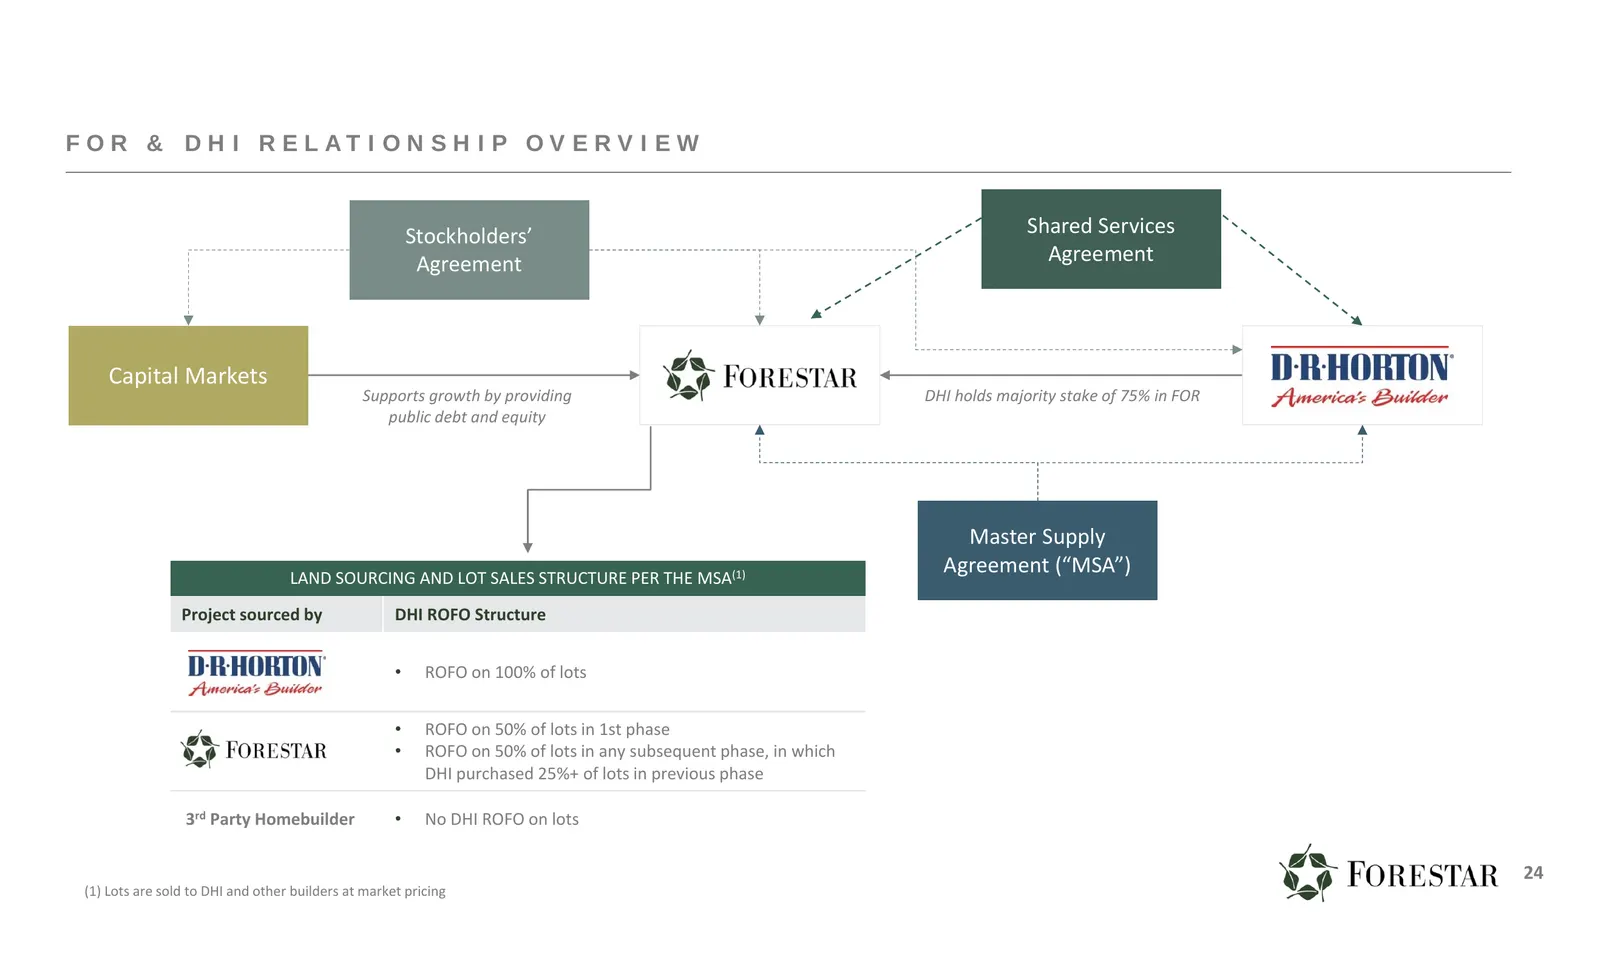
Slide 24: FOR & DHI Relationship Overview
F O R & D H I R E L AT I O N S H I P OV E R V I E W Stockholders’ Shared Services Agreement Agreement Capital Markets Supports growth by providing DHI holds majority stake of 75% in FOR public debt and equity Master Supply Agreement (“MSA”) LAND SOURCING AND LOT SALES STRUCTURE PER THE MSA(1) Projec
Slide 25: Master Supply Agreement (MSA)
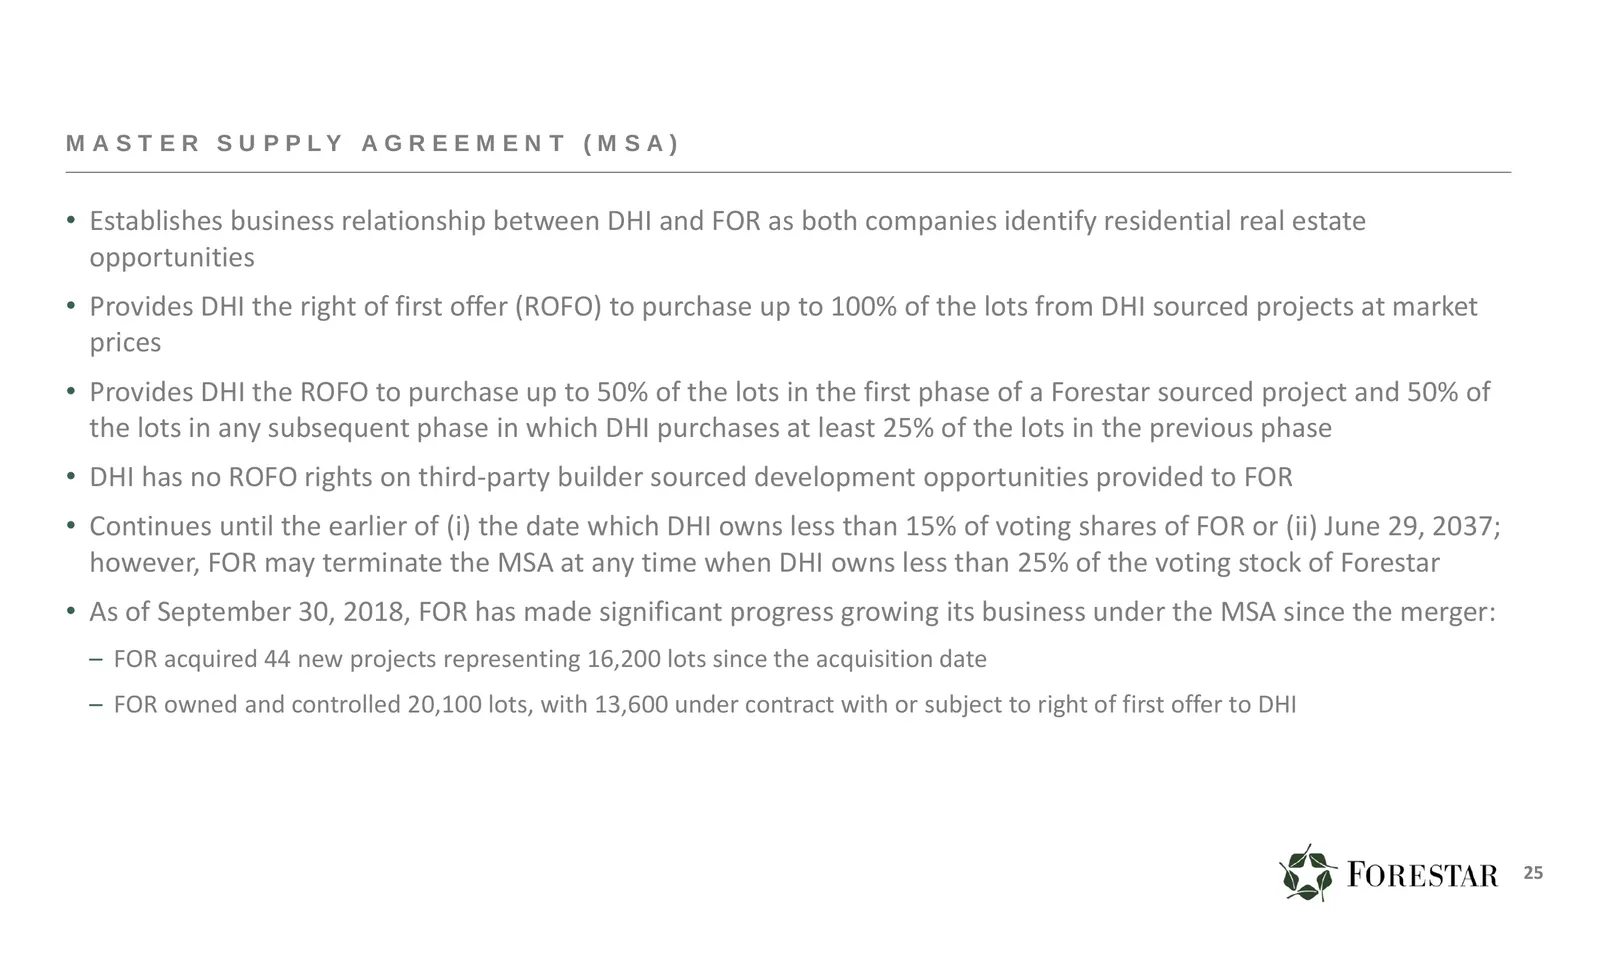
M A S T E R S U P P LY A G R E E M E N T ( M S A ) • Establishes business relationship between DHI and FOR as both companies identify residential real estate opportunities • Provides DHI the right of first offer (ROFO) to purchase up to 100% of the lots from DHI sourced projects at market prices • P
Slide 26: Shareholders' Agreement
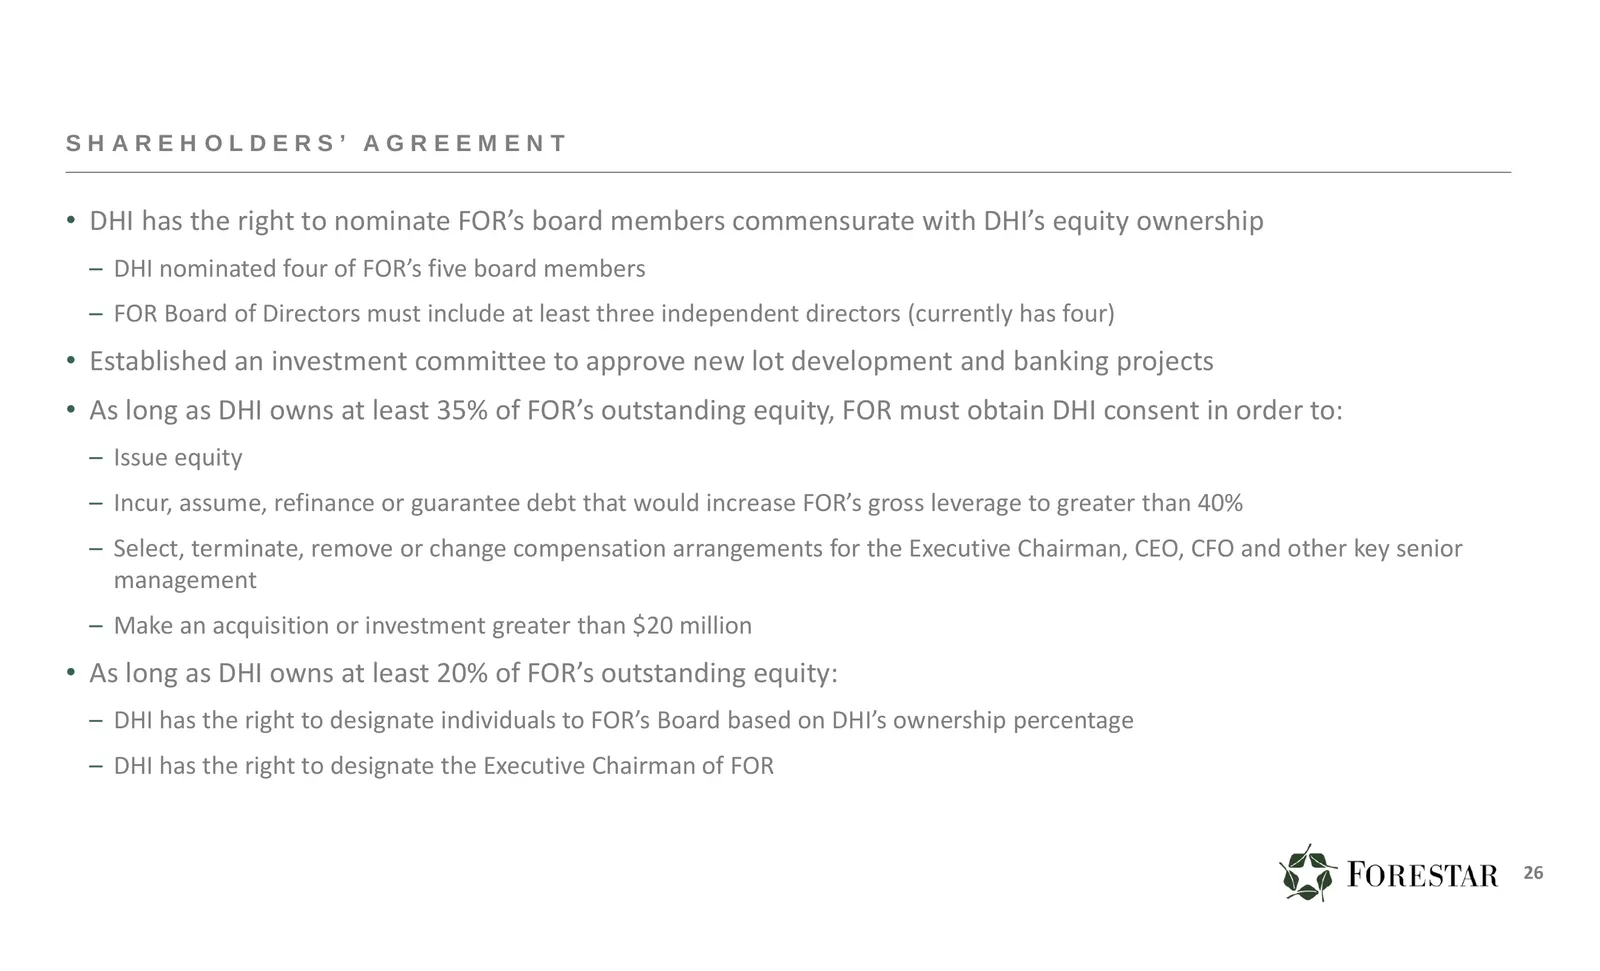
SHAREHOLDERS’ AGREEMENT • DHI has the right to nominate FOR’s board members commensurate with DHI’s equity ownership – DHI nominated four of FOR’s five board members – FOR Board of Directors must include at least three independent directors (currently has four) • Established an investment committee
Slide 27: Shared Services Agreement
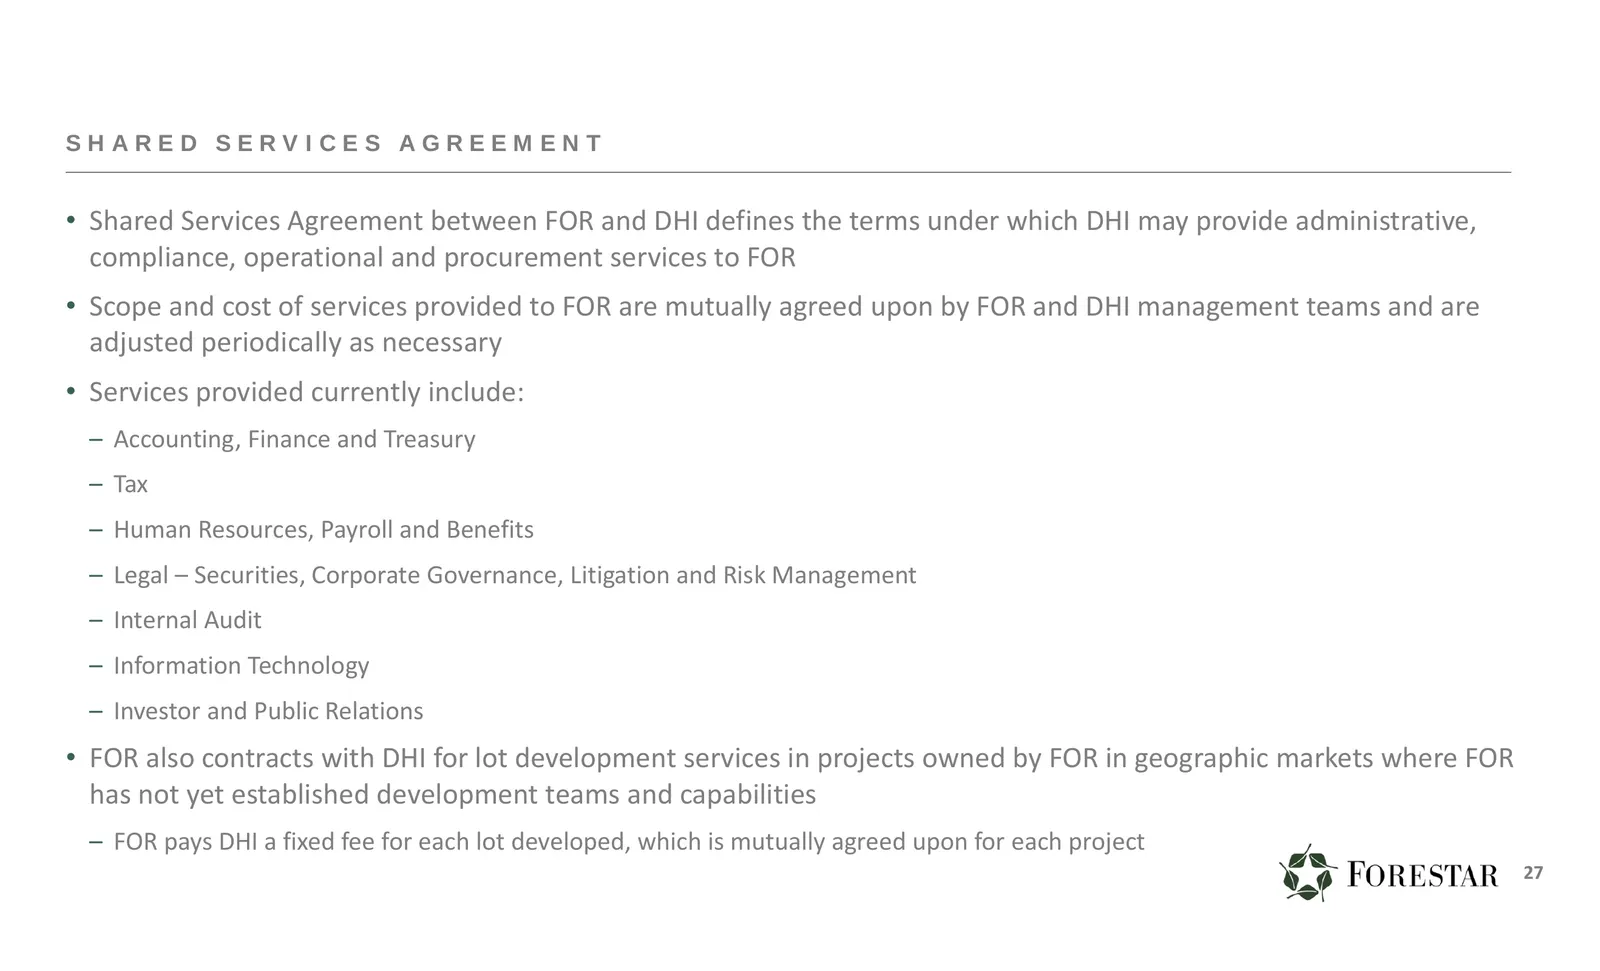
SHARED SERVICES AGREEMENT • Shared Services Agreement between FOR and DHI defines the terms under which DHI may provide administrative, compliance, operational and procurement services to FOR • Scope and cost of services provided to FOR are mutually agreed upon by FOR and DHI management teams and ar
Slide 28: Revolving Credit Facility
REVOLVING CREDIT FACILITY Summary of Terms 28
Slide 29: Revolving Credit Facility Summary Terms
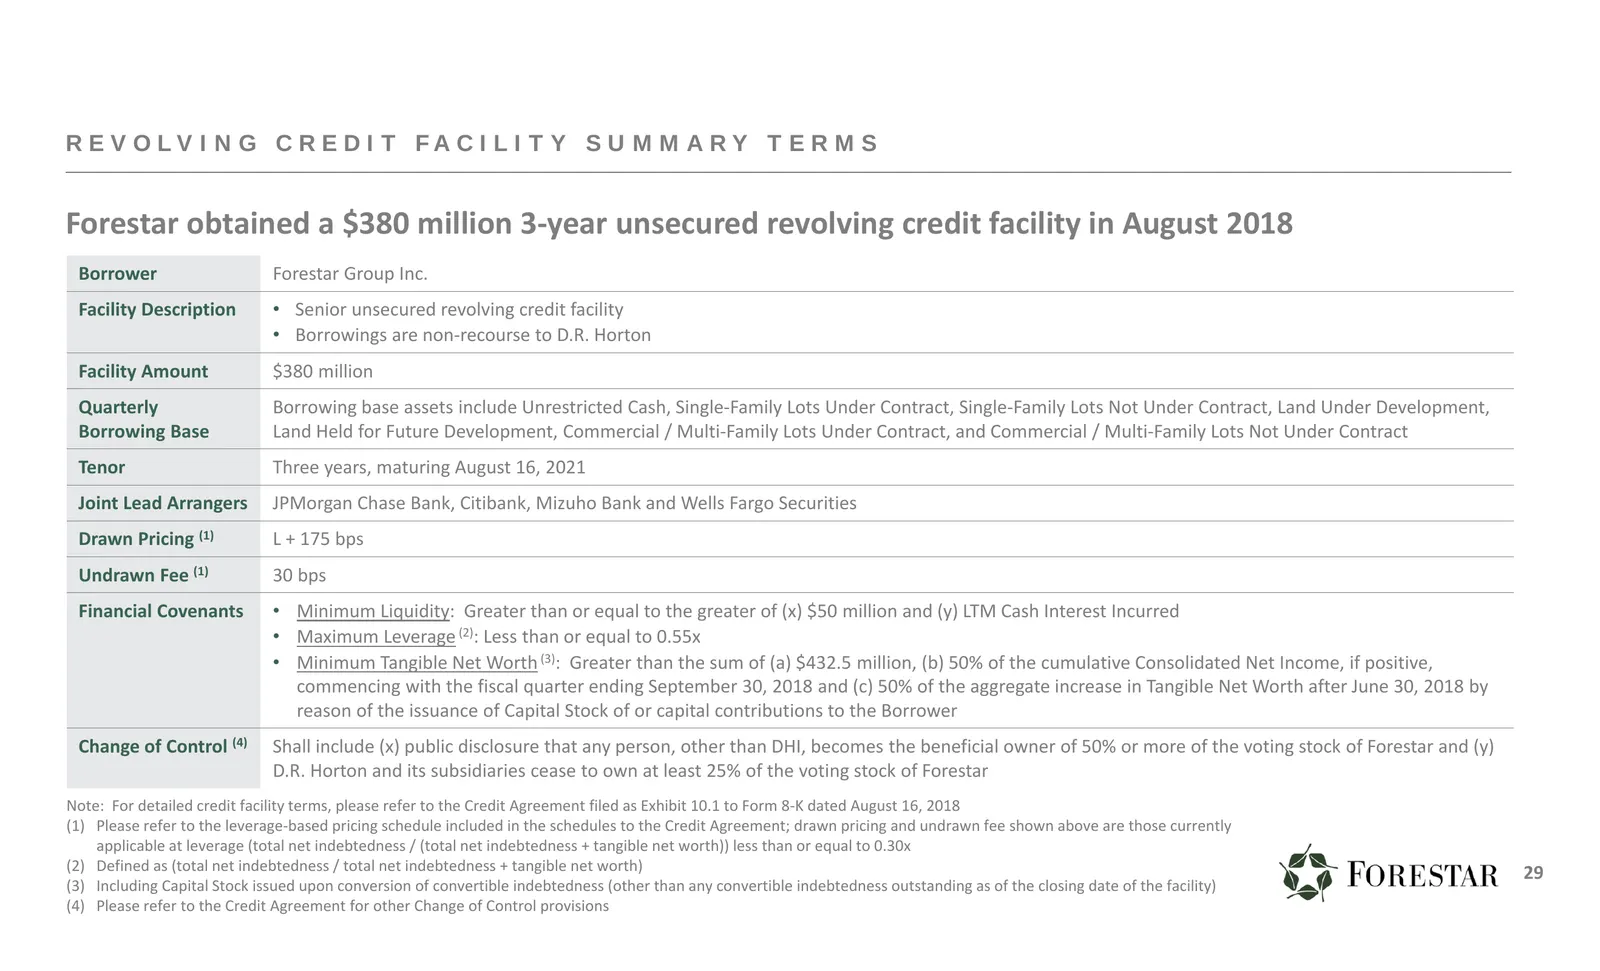
R E V O L V I N G C R E D I T FA C I L I T Y S U M M A R Y T E R M S Forestar obtained a $380 million 3‐year unsecured revolving credit facility in August 2018 Borrower Forestar Group Inc. Facility Description • Senior unsecured revolving credit facility • Borrowings are non‐recourse to D.R. Horton
Source: Internet Archive copy of investor.forestar.com
More decks from Forestar Group Inc
 Q4 2026 Earnings Presentation31 slides · October 2026
 Q3 2026 Earnings Presentation30 slides · Jul 21, 2026
 Q2 2026 Earnings Presentation30 slides · Apr 21, 2026
 Q1 2026 Earnings Presentation30 slides · Jan 20, 2026
 Q4 2025 Earnings Presentation31 slides · Oct 28, 2025
 Q3 2025 Earnings Presentation29 slides · Jul 22, 2025