Thermax Limited. · NSE:THERMAX
Thermax — Q3 FY2020-21 Earnings Presentation
15 slides from Thermax's earnings presentation, February 2021
Slide 1: Thermax Limited – Analyst Call Q3 FY20-21
Thermax Limited – Analyst Call Q3 FY20-21 Energy | Environment | Chemical Our Vision To be a globally respected high performance organisation offering sustainable solutions in energy and the environment
Slide 2: Disclaimer
Disclaimer This presentation includes forward-looking information and statements including statements concerning the outlook for our businesses. These statements are based on current expectations, estimates and projections about the factors that may affect our future performance, including global ec
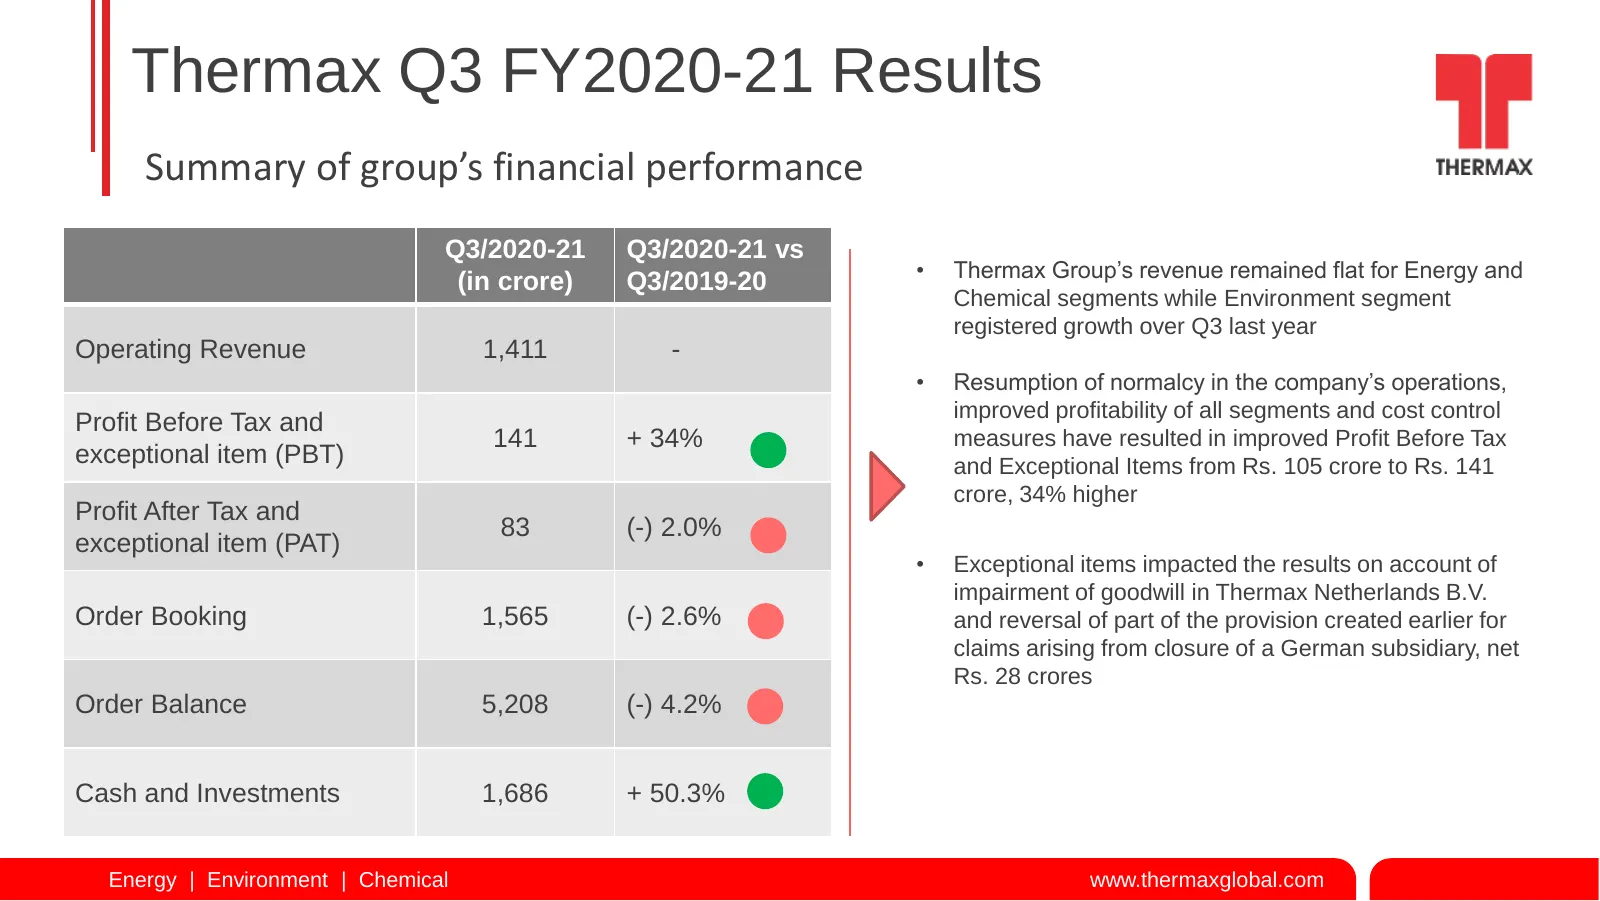
Slide 3: Thermax Q3 FY2020-21 Results
Thermax Q3 FY2020-21 Results Summary of group’s financial performance Q3/2020-21 Q3/2020-21 vs • Thermax Group’s revenue remained flat for Energy and (in crore) Q3/2019-20 Chemical segments while Environment segment registered growth over Q3 last year Operating Revenue 1,411 - • Resumption of normal
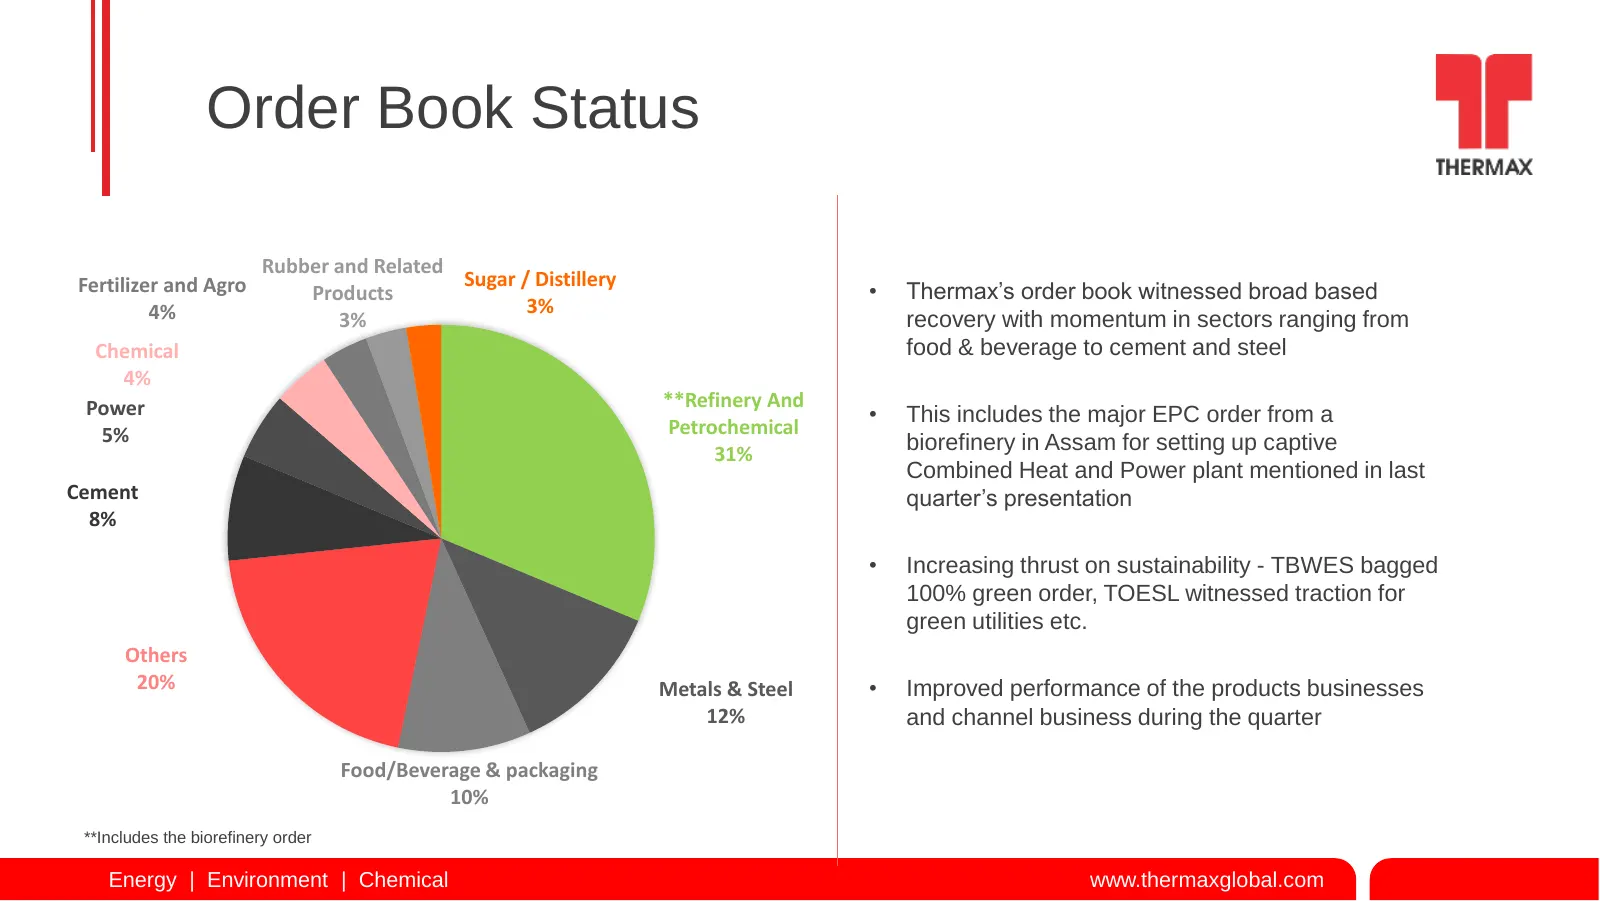
Slide 4: Order Book Status
Order Book Status Rubber and Related Fertilizer and Agro Sugar / Distillery Products • Thermax’s order book witnessed broad based 4% 3% 3% recovery with momentum in sectors ranging from Chemical food & beverage to cement and steel 4% Power **Refinery And • This includes the major EPC order from a 5%
Slide 5: Business Highlights – Energy Segment
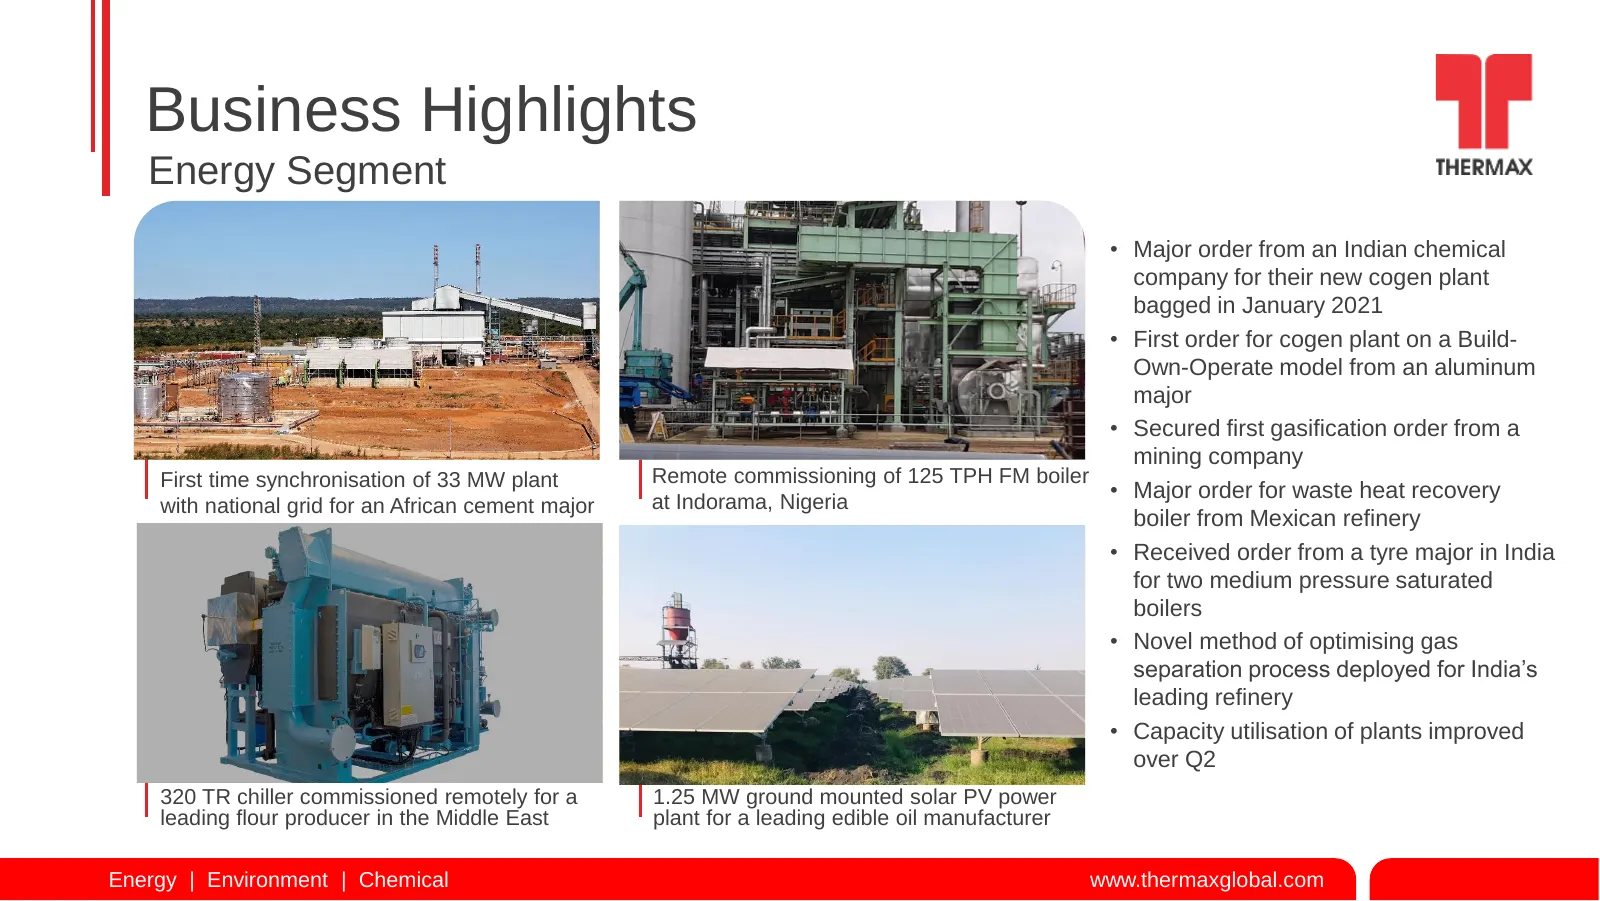
Business Highlights Energy Segment • Major order from an Indian chemical company for their new cogen plant bagged in January 2021 • First order for cogen plant on a Build- Own-Operate model from an aluminum major • Secured first gasification order from a mining company First time synchronisation of
Slide 6: Business Highlights – Environment Segment
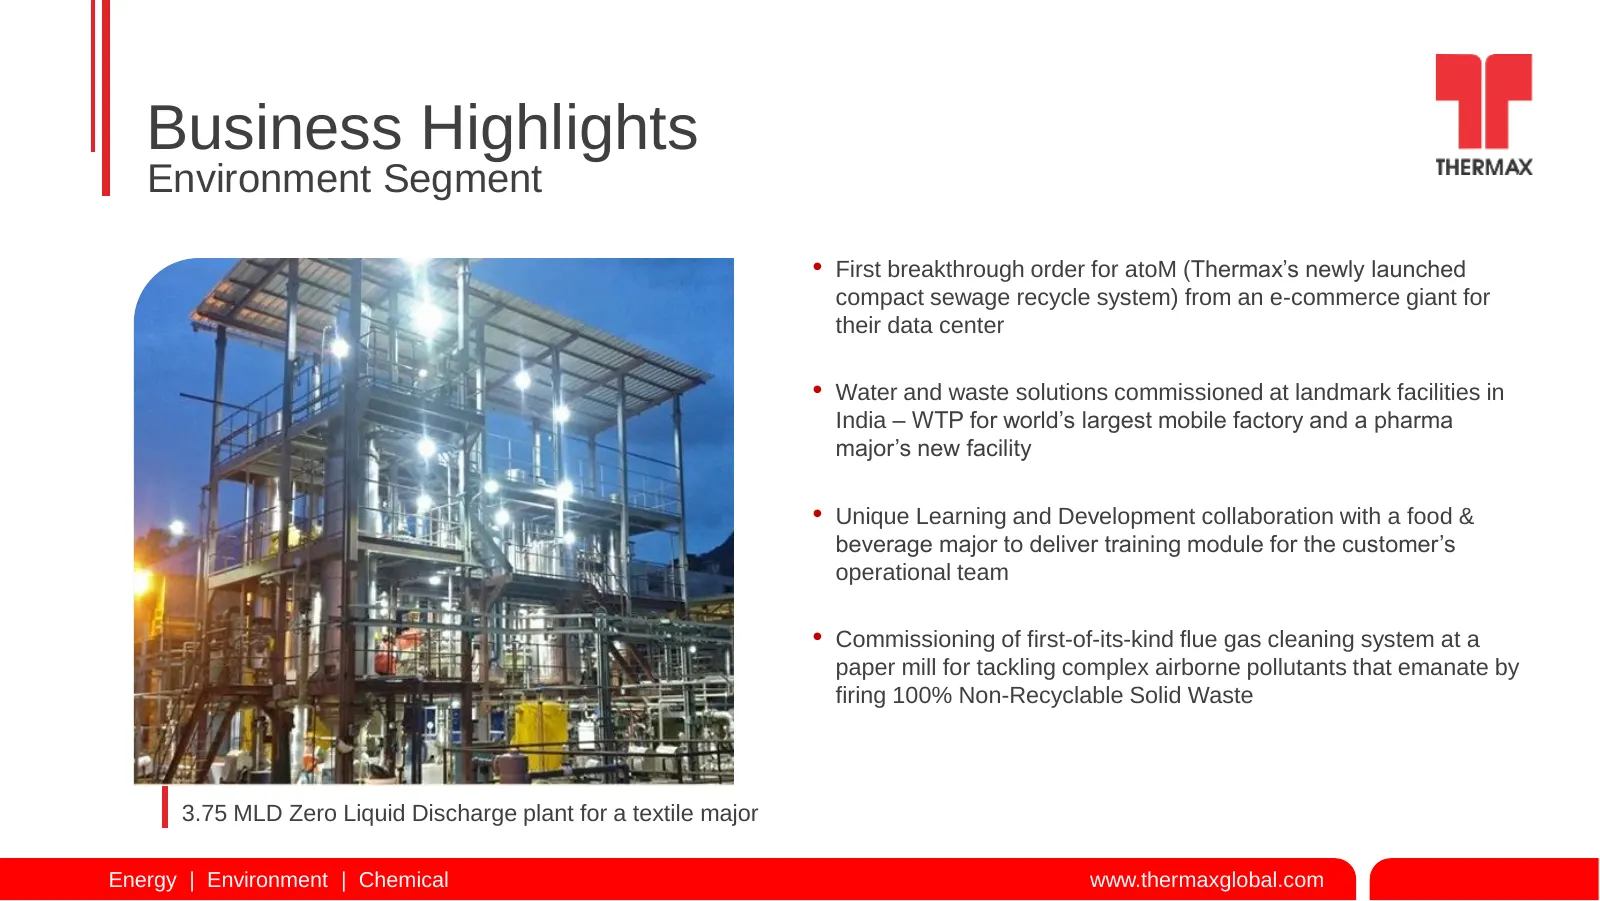
Business Highlights Environment Segment • First breakthrough order for atoM (Thermax’s newly launched compact sewage recycle system) from an e-commerce giant for their data center • Water and waste solutions commissioned at landmark facilities in India – WTP for world’s largest mobile factory and a
Slide 7: Business Highlights – Chemical Segment
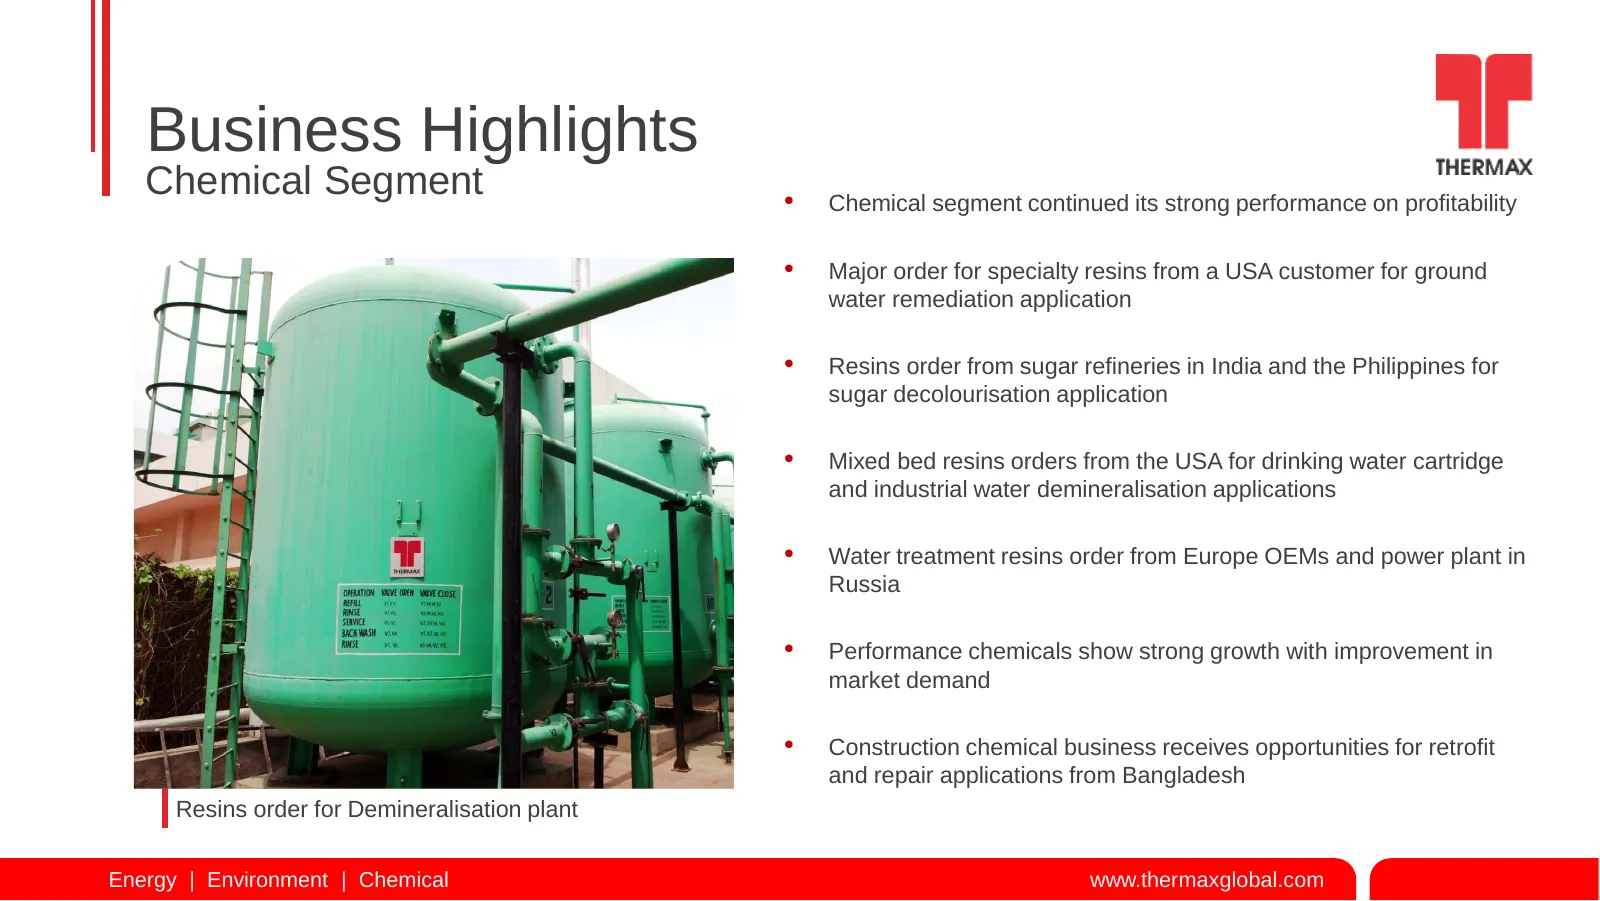
Business Highlights Chemical Segment • Chemical segment continued its strong performance on profitability • Major order for specialty resins from a USA customer for ground water remediation application • Resins order from sugar refineries in India and the Philippines for sugar decolourisation applic
Slide 8: Awards and Recognition
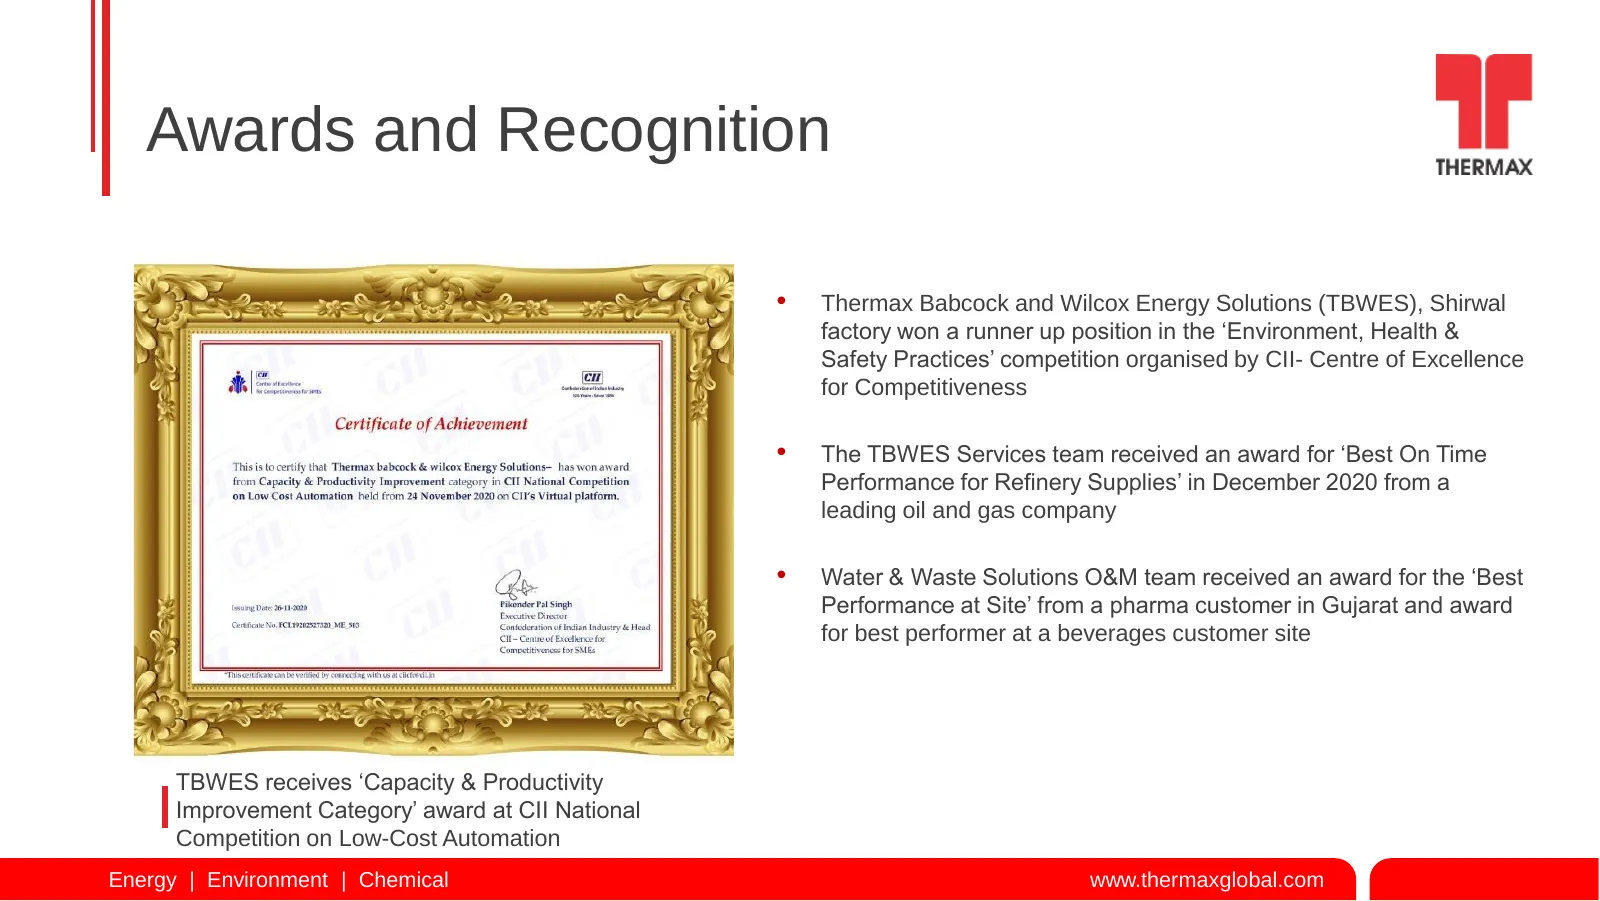
Awards and Recognition • Thermax Babcock and Wilcox Energy Solutions (TBWES), Shirwal factory won a runner up position in the ‘Environment, Health & Safety Practices’ competition organised by CII- Centre of Excellence for Competitiveness • The TBWES Services team received an award for ‘Best On Time
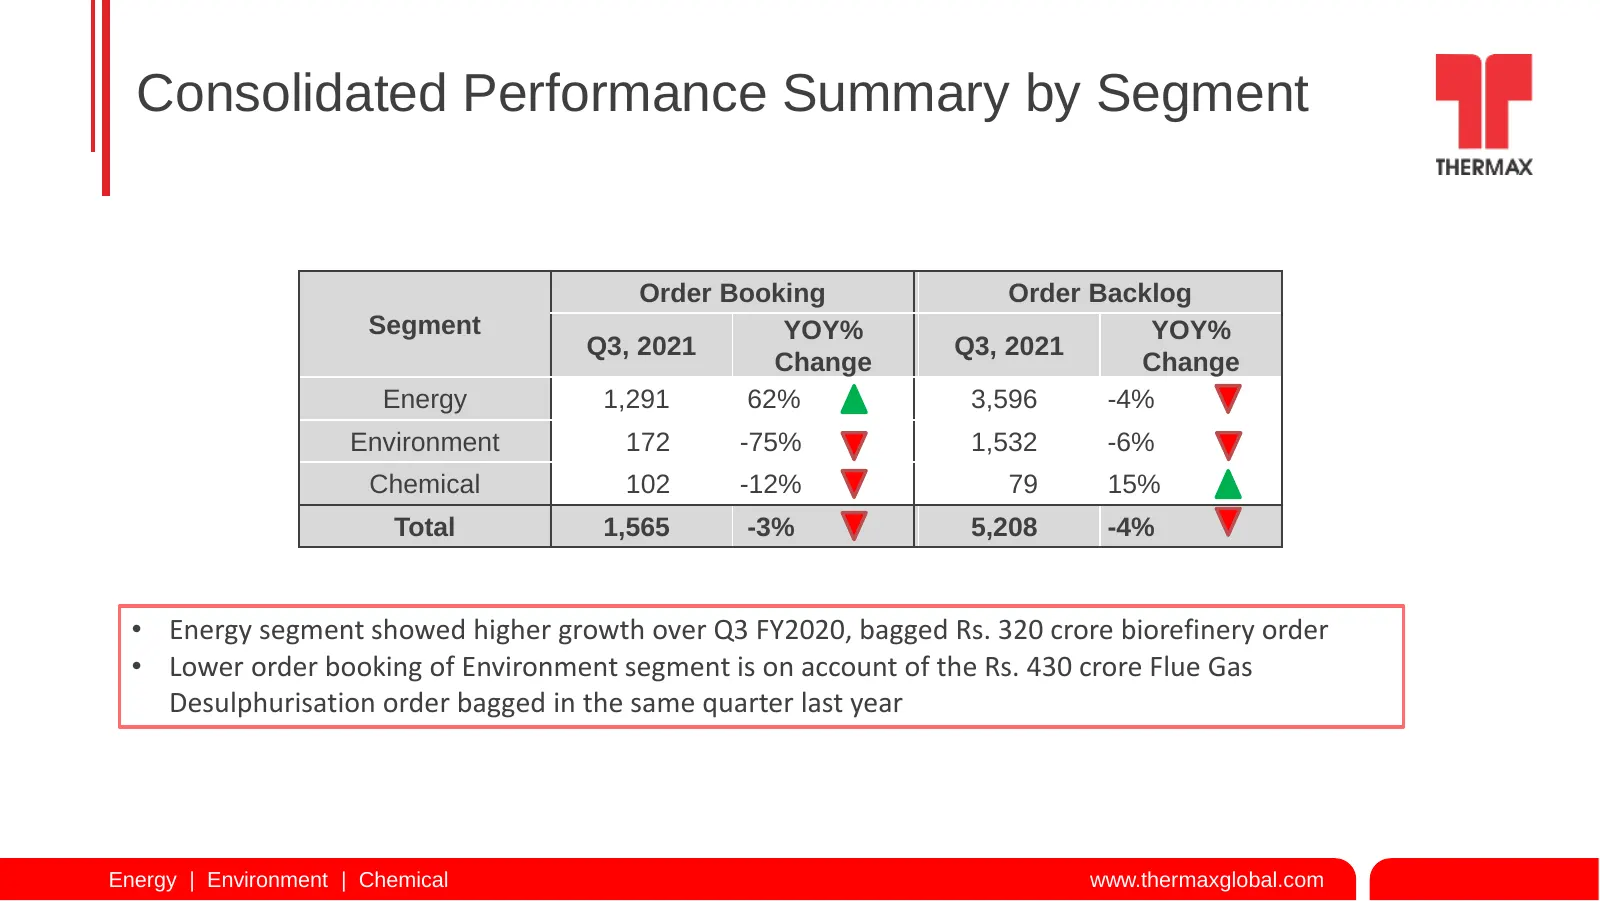
Slide 9: Consolidated Performance Summary by Segment
Consolidated Performance Summary by Segment Order Booking Order Backlog Segment YOY% YOY% Q3, 2021 Q3, 2021 Change Change Energy 1,291 62% 3,596 -4% Environment 172 -75% 1,532 -6% Chemical 102 -12% 79 15% Total 1,565 -3% 5,208 -4% • Energy segment showed higher growth over Q3 FY2020, bagged Rs. 320
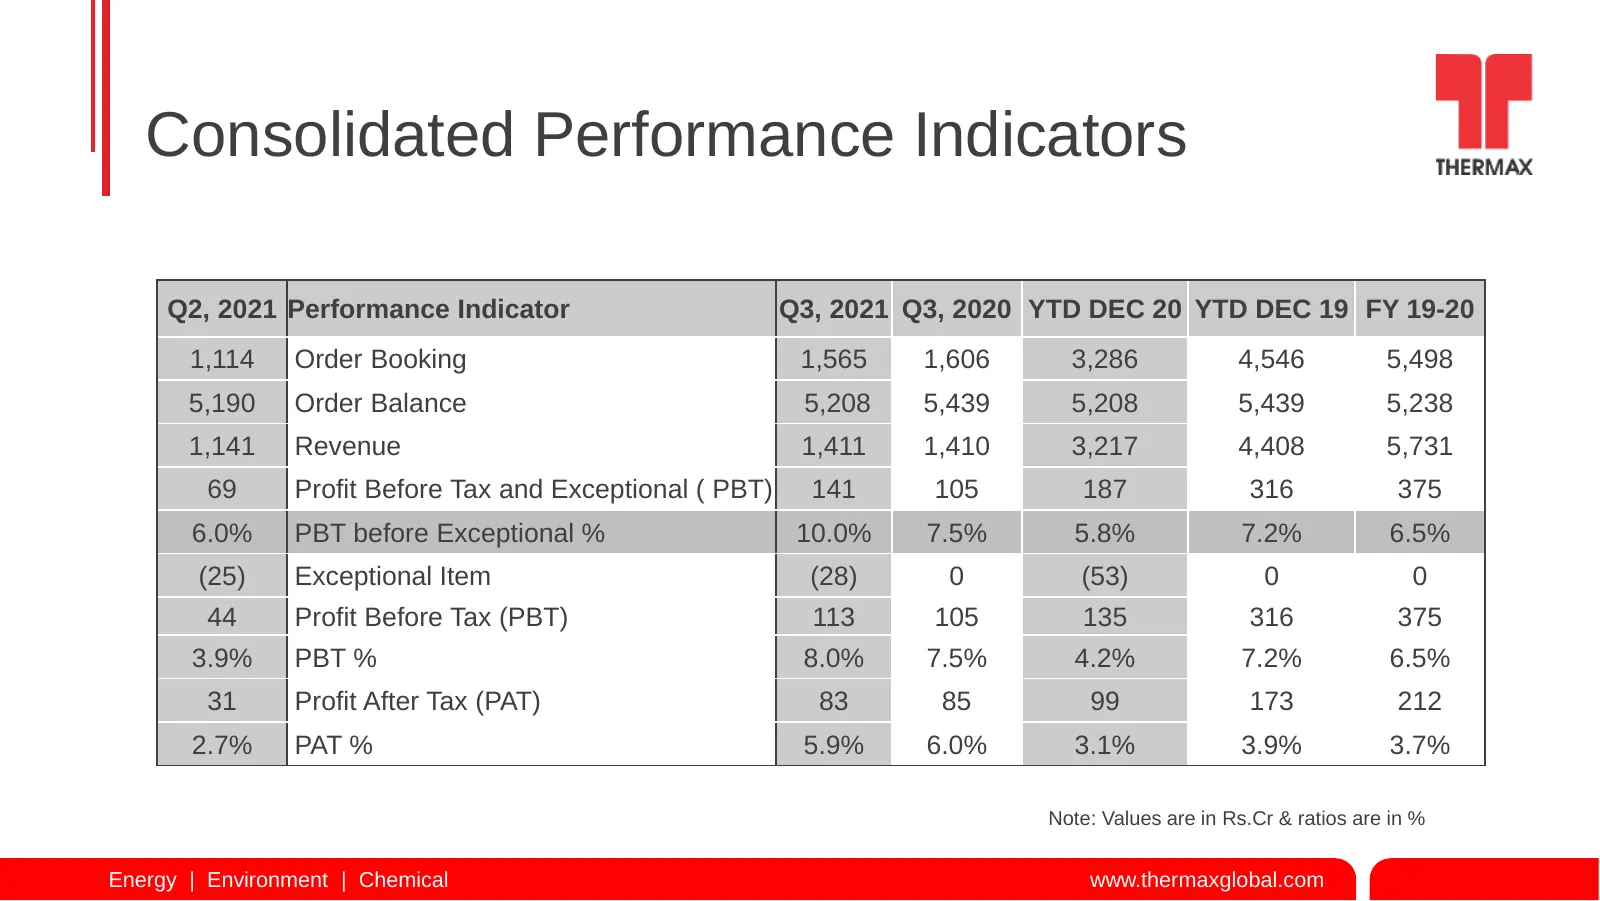
Slide 10: Consolidated Performance Indicators
Consolidated Performance Indicators Q2, 2021 Performance Indicator Q3, 2021 Q3, 2020 YTD DEC 20 YTD DEC 19 FY 19-20 1,114 Order Booking 1,565 1,606 3,286 4,546 5,498 5,190 Order Balance 5,208 5,439 5,208 5,439 5,238 1,141 Revenue 1,411 1,410 3,217 4,408 5,731 69 Profit Before Tax and Exceptional ( P
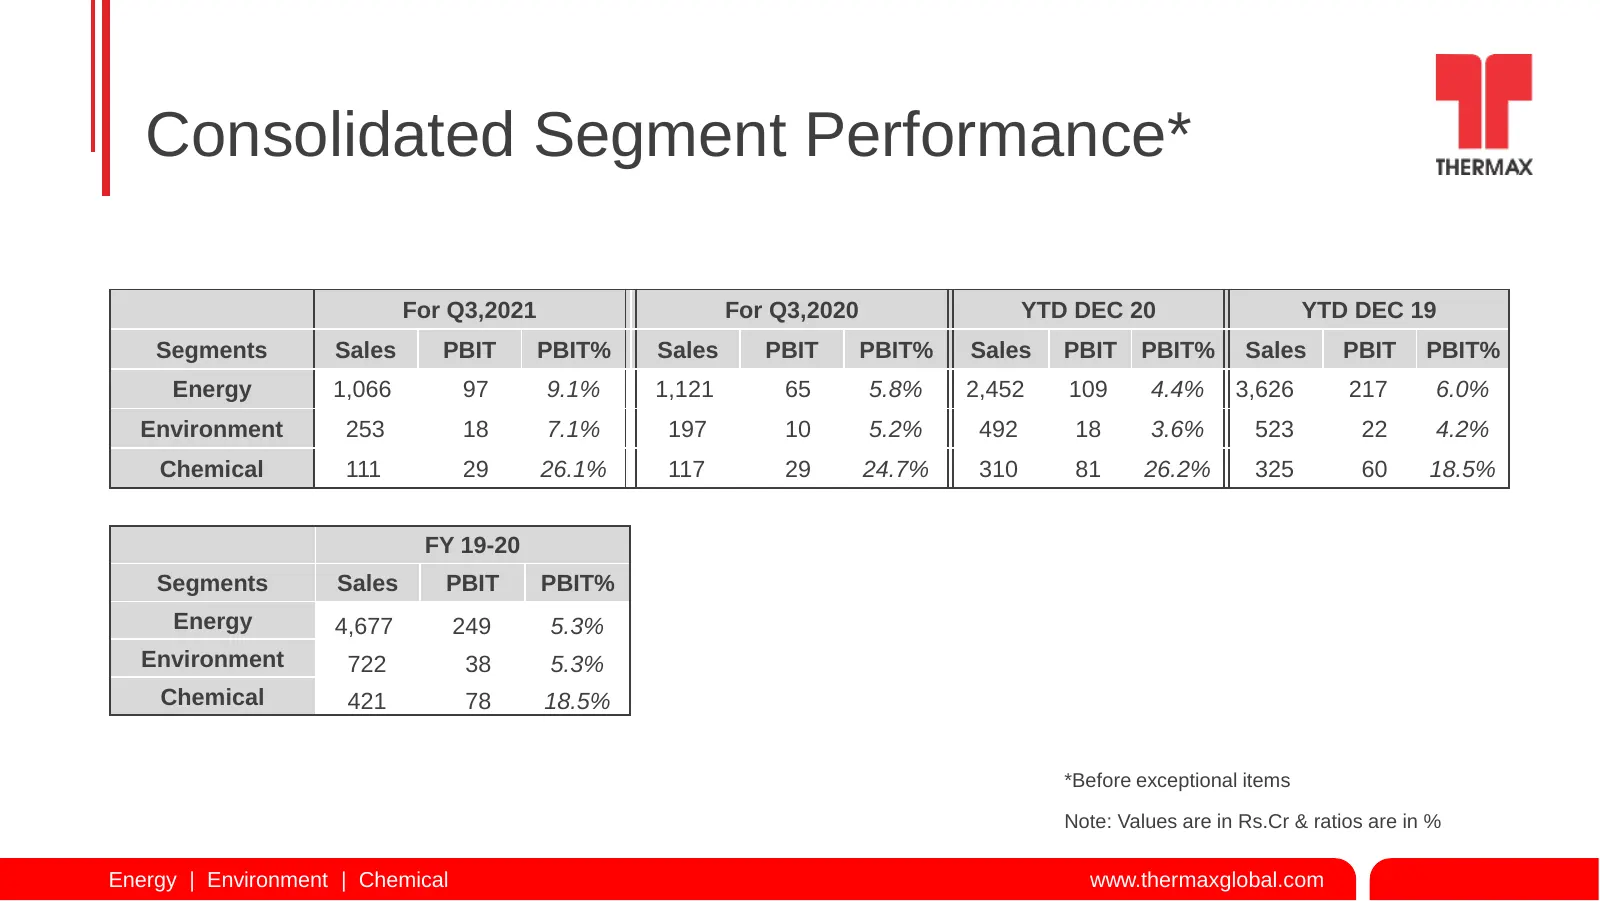
Slide 11: Consolidated Segment Performance
Consolidated Segment Performance* For Q3,2021 For Q3,2020 YTD DEC 20 YTD DEC 19 Segments Sales PBIT PBIT% Sales PBIT PBIT% Sales PBIT PBIT% Sales PBIT PBIT% Energy 1,066 97 9.1% 1,121 65 5.8% 2,452 109 4.4% 3,626 217 6.0% Environment 253 18 7.1% 197 10 5.2% 492 18 3.6% 523 22 4.2% Chemical 111 29 26
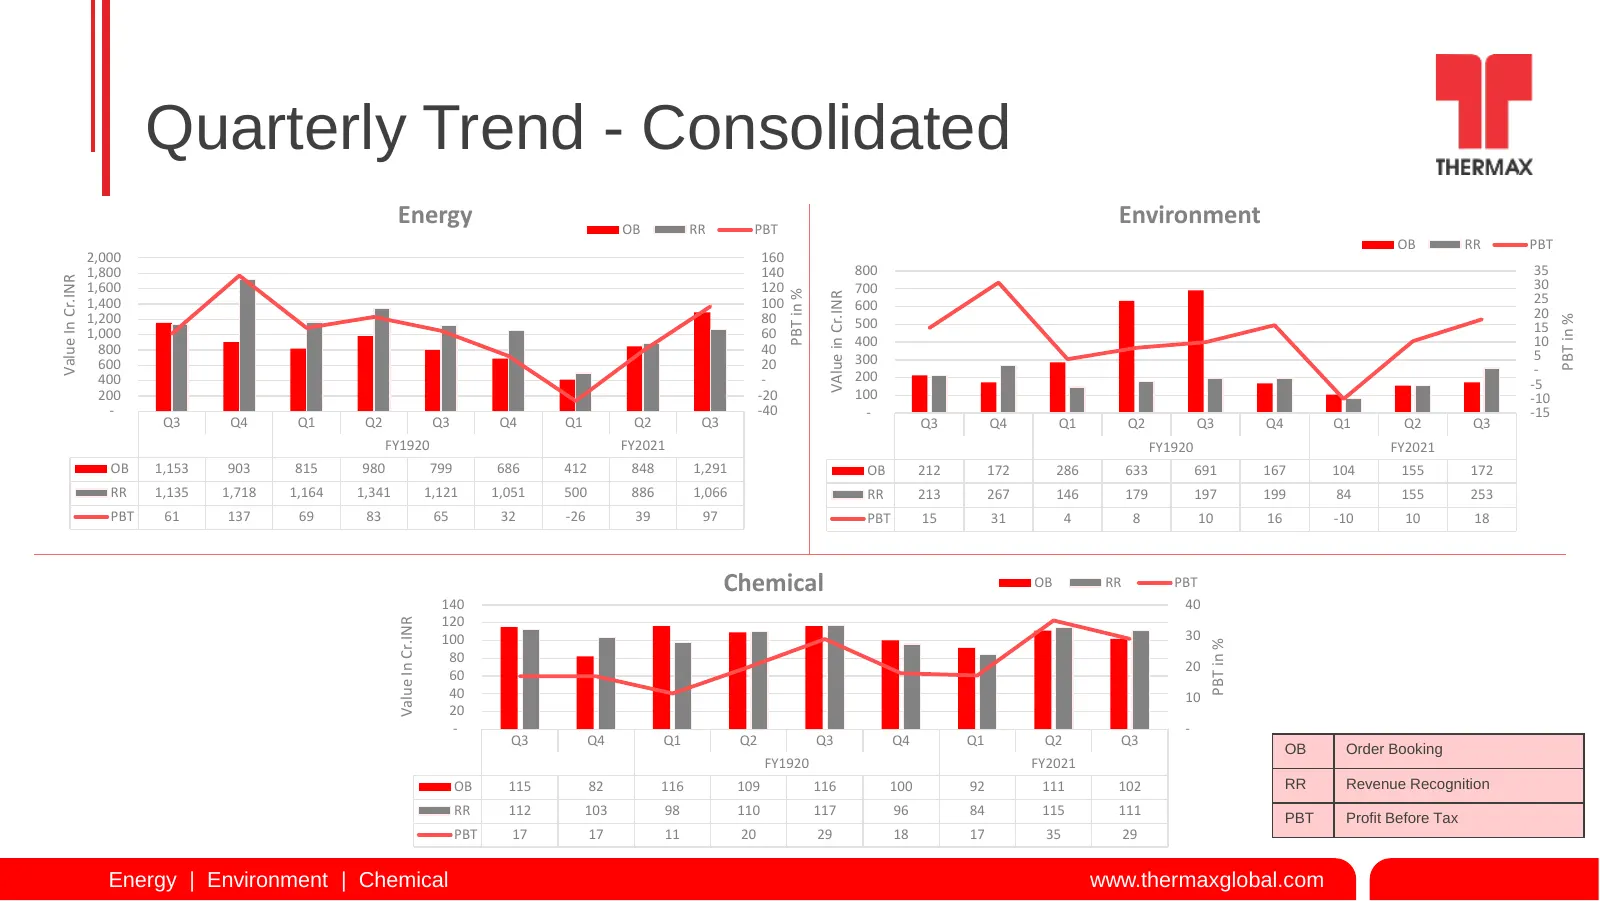
Slide 12: Quarterly Trend - Consolidated
Quarterly Trend - Consolidated Energy OB RR PBT Environment OB RR PBT 2,000 160 1,800 140 800 35 Value In Cr.INR 1,600 120 700 30 PBT in % VAlue in Cr.INR 1,400 100 600 25 1,200 80 20 PBT in % 500 15 1,000 60 400 10 800 40 5 600 20 300 200 - 400 - -5 200 -20 100 -10 - -40 - -15 Q3 Q4 Q1 Q2 Q3 Q4 Q1
Slide 13: Domestic – Export Business Performance
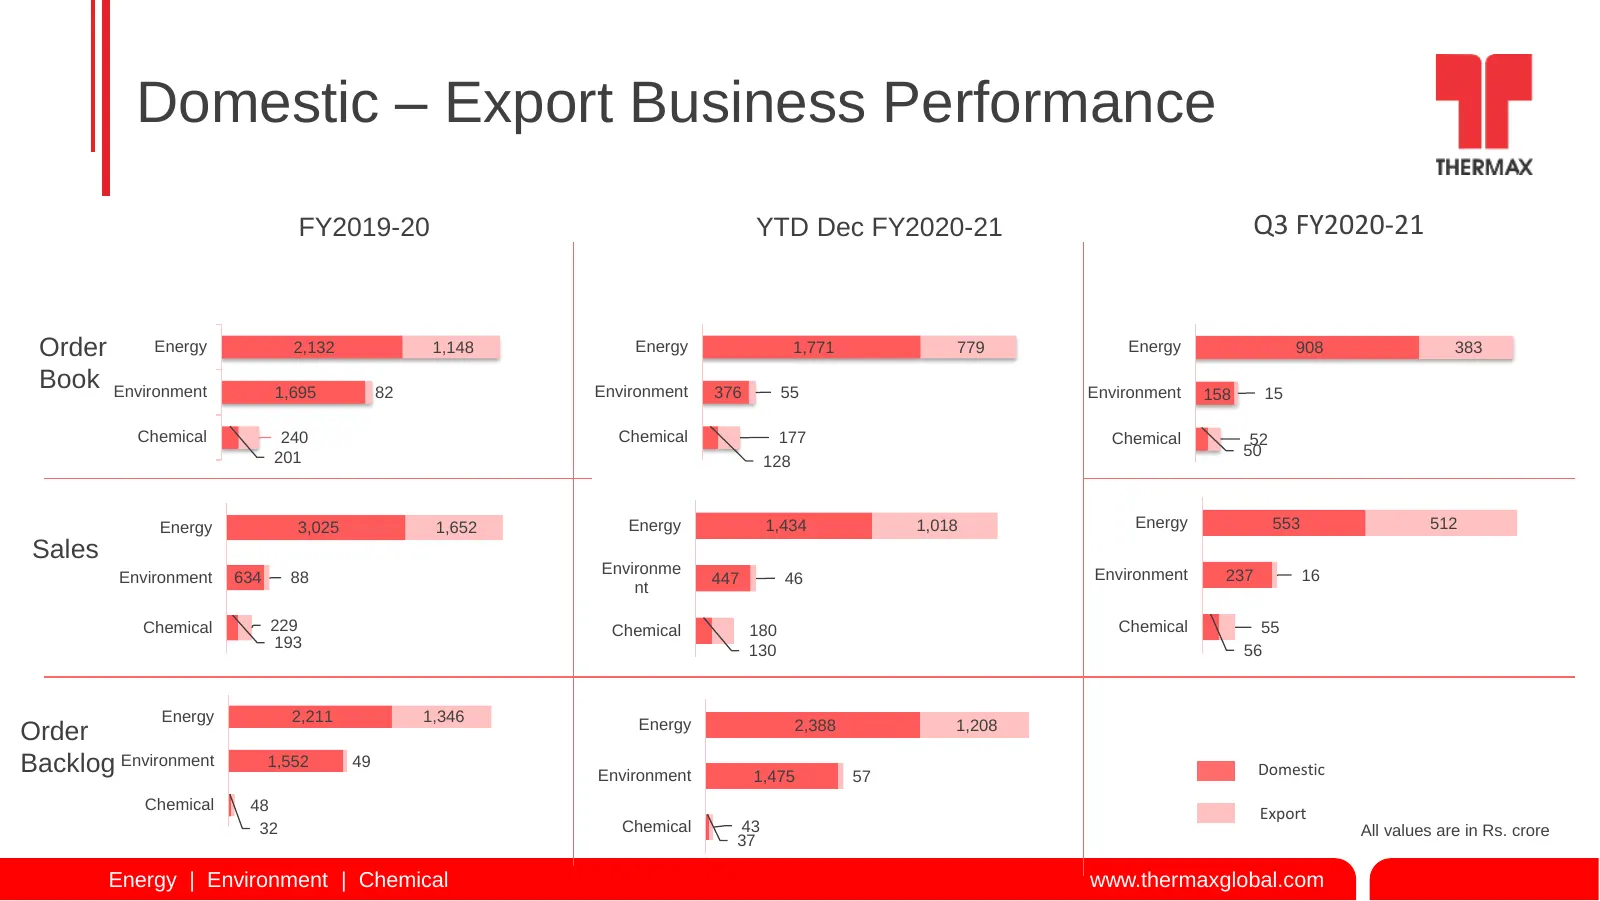
Domestic – Export Business Performance FY2019-20 YTD Dec FY2020-21 Q3 FY2020-21 Order Energy 2,132 1,148 Energy 1,771 779 Energy 908 383 Book Environment 1,695 82 Environment 376 55 Environment 158 15 Chemical 240 Chemical 177 Chemical 52 201 50 128 Energy 3,025 1,652 Energy 1,434 1,018 Energy 553 5
Slide 14: Environment and Industry Outlook
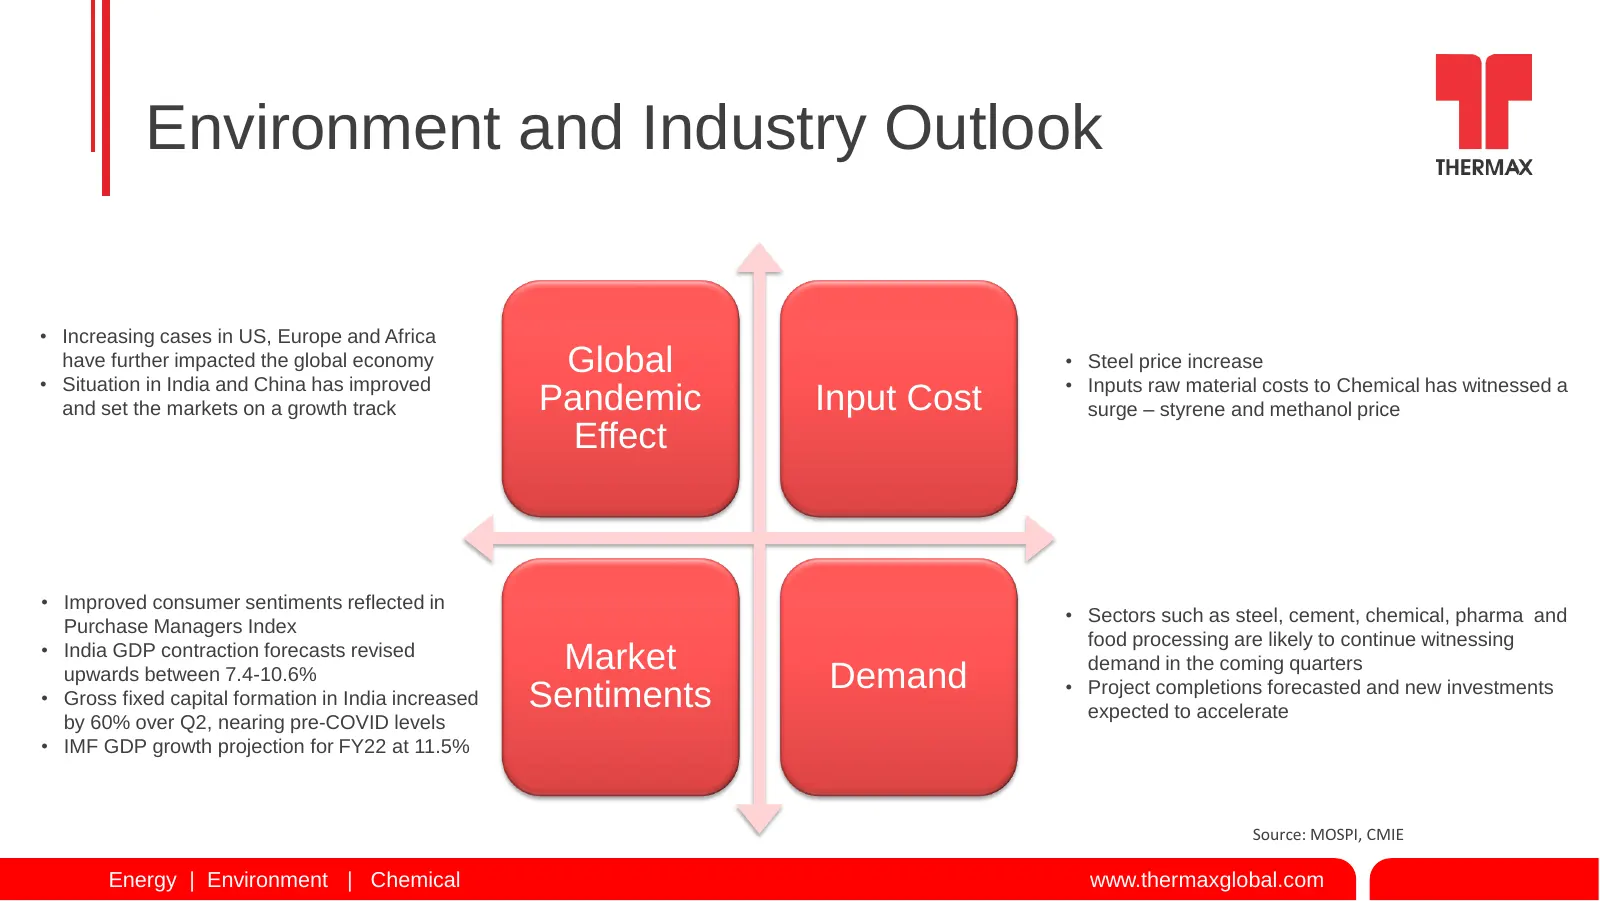
Environment and Industry Outlook • Increasing cases in US, Europe and Africa have further impacted the global economy Global • Steel price increase • Situation in India and China has improved • Inputs raw material costs to Chemical has witnessed a and set the markets on a growth track Pandemic Input

Slide 15: Thank You
Thank You
Source: Internet Archive copy of thermaxglobal.com
More decks from Thermax Limited.
 Q2 FY2026-27 Earnings Presentation17 slides · Nov 5, 2026
 Q2 FY2026-27 Earnings Presentation18 slides · Nov 5, 2026
 Q1 FY2026-27 Earnings Presentation19 slides · Jul 31, 2026
 Q4 FY2025-26 Earnings Presentation20 slides · May 7, 2026
 Q3 FY2025-26 Earnings Presentation19 slides · Feb 2, 2026
 Q1 FY2026-27 Earnings Presentation18 slides · 2026