Altabancorp — People's Utah Bancorp — Shareholder Meeting (May 2019)
28 slides from Altabancorp's shareholder meeting presentation, May 23, 2019

Slide 1: Annual Shareholders Meeting May 22, 2019
Annual Shareholders Meeting May 22, 2019 Exhibit 99.1
Slide 2: Forward Looking Statements
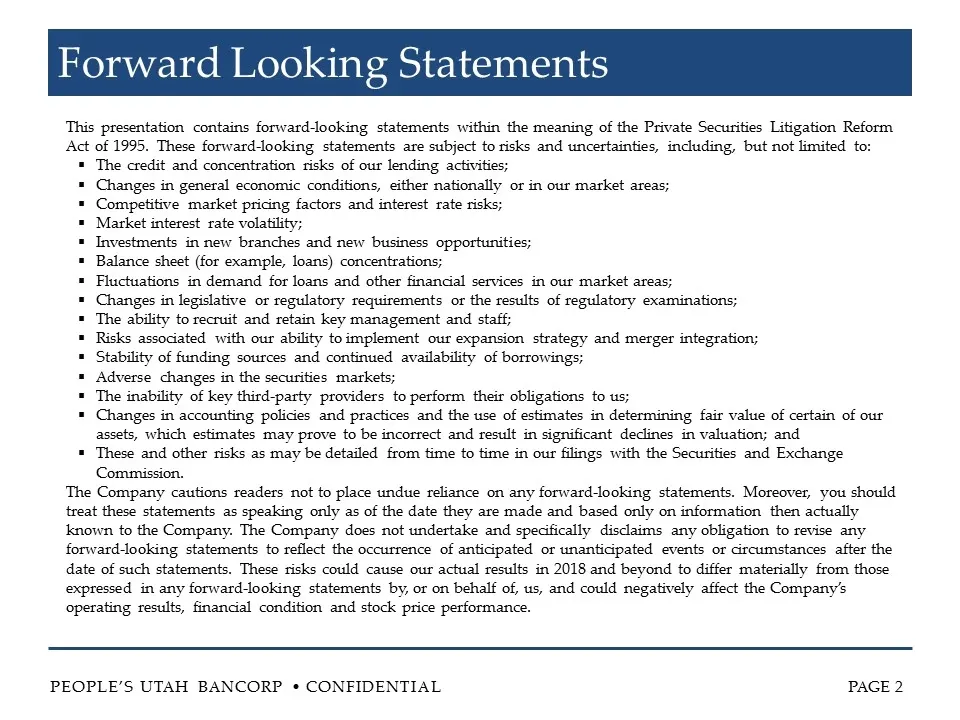
Forward Looking Statements This presentation contains forward-looking statements within the meaning of the Private Securities Litigation Reform Act of 1995. These forward-looking statements are subject to risks and uncertainties, including, but not limited to: The credit and concentration risks of o
Slide 3: Welcome!
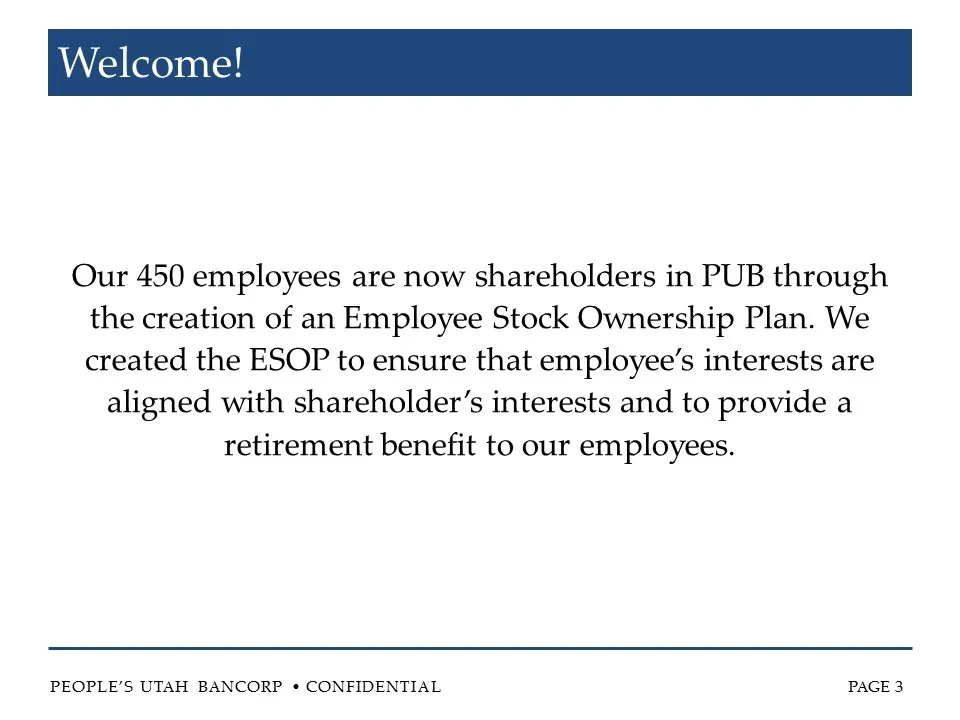
Welcome! Our 450 employees are now shareholders in PUB through the creation of an Employee Stock Ownership Plan. We created the ESOP to ensure that employee’s interests are aligned with shareholder’s interests and to provide a retirement benefit to our employees.
Slide 4: 2018 Year in Review: Financial Performance
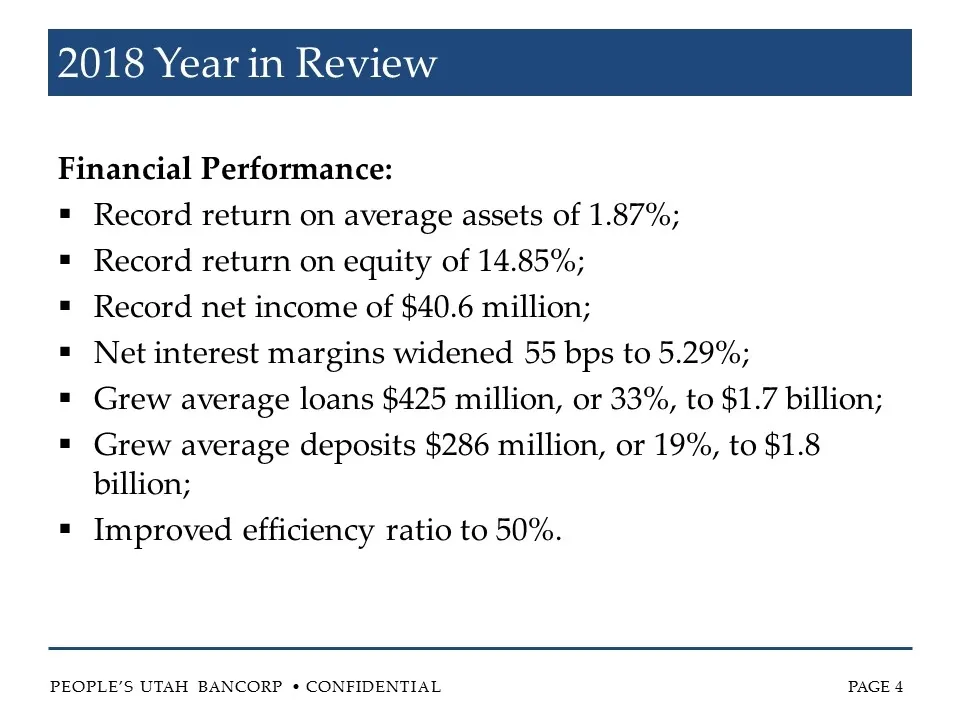
2018 Year in Review Financial Performance: Record return on average assets of 1.87%; Record return on equity of 14.85%; Record net income of $40.6 million; Net interest margins widened 55 bps to 5.29%; Grew average loans $425 million, or 33%, to $1.7 billion; Grew average deposits $286 million, or 1
Slide 5: Loan Growth Trend & Composition
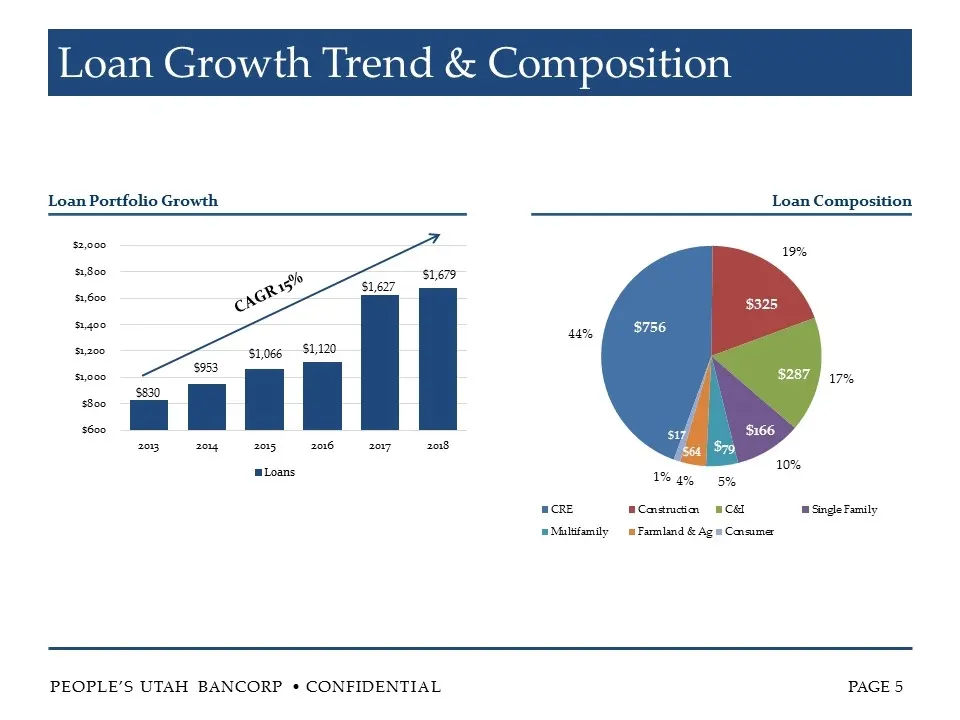
Loan Growth Trend & Composition Loan Portfolio Growth $830 $953 $1,066 $1,120 $1,627 CAGR 15% Loan Composition $1,679
Slide 6: Deposit Growth Trend & Composition
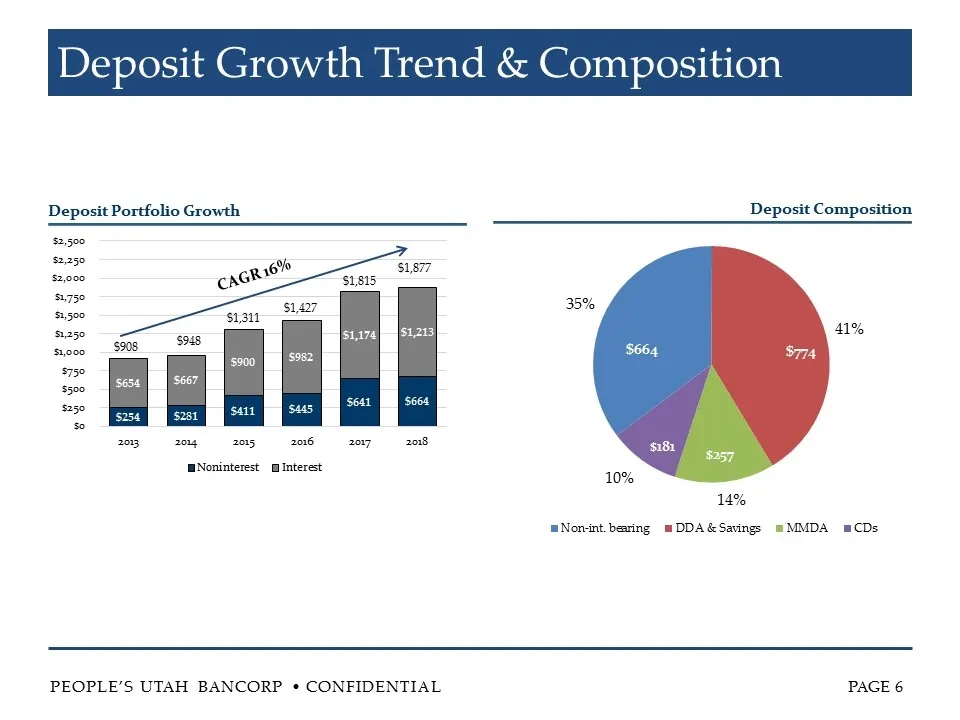
Deposit Growth Trend & Composition Deposit Portfolio Growth CAGR 16% $908 $948 $1,311 $1,427 $1,877 Deposit Composition $1,815
Slide 7: Asset Quality Trends
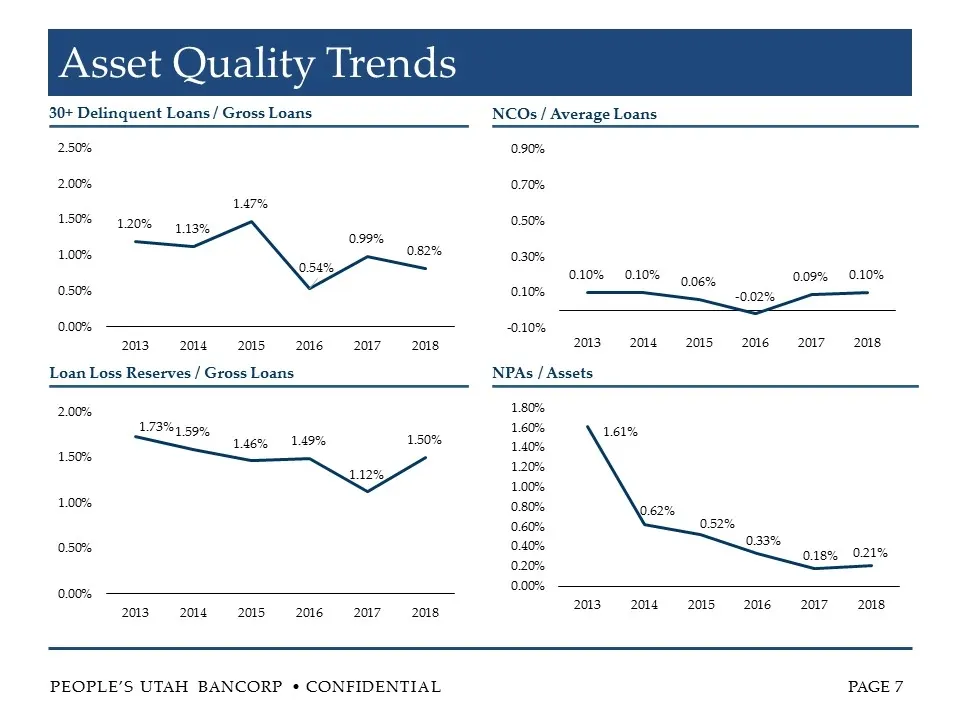
Asset Quality Trends 30+ Delinquent Loans / Gross Loans NCOs / Average Loans Loan Loss Reserves / Gross Loans NPAs / Assets
Slide 8: Net Income ("Core")
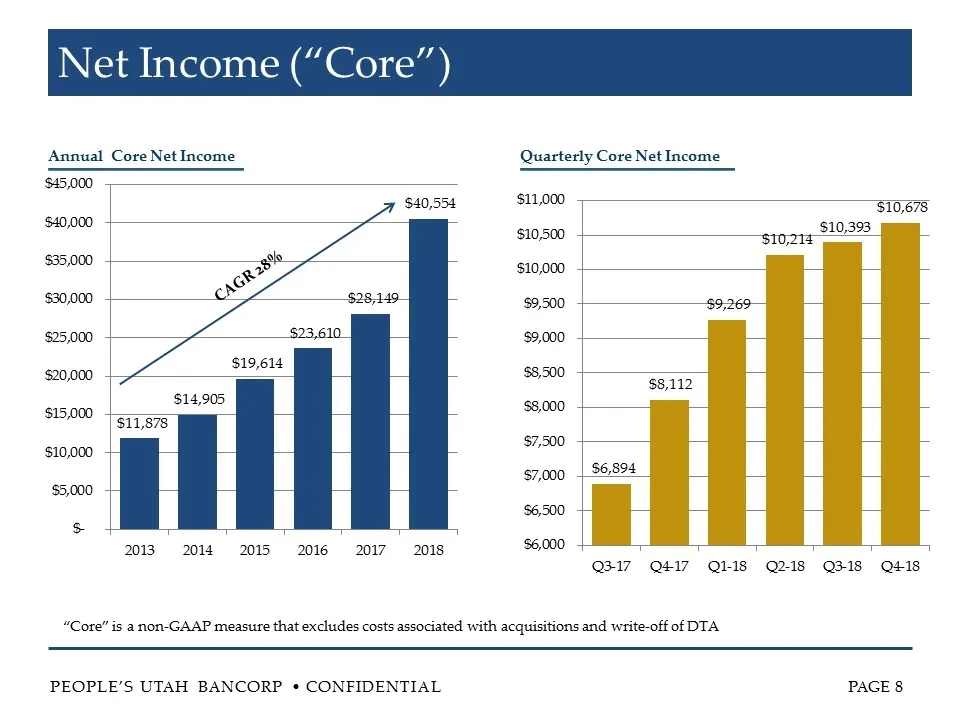
Net Income (“Core”) Annual Core Net Income Quarterly Core Net Income “Core” is a non-GAAP measure that excludes costs associated with acquisitions and write-off of DTA CAGR 28%
Slide 9: Diluted Earnings Per Share ("Core")
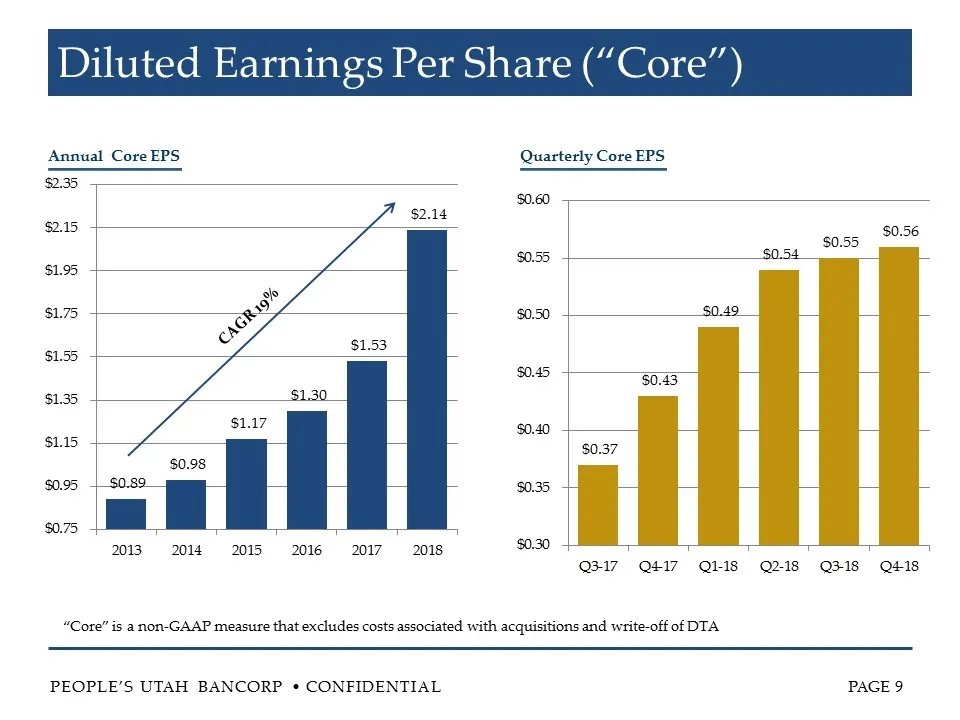
Diluted Earnings Per Share (“Core”) Annual Core EPS Quarterly Core EPS “Core” is a non-GAAP measure that excludes costs associated with acquisitions and write-off of DTA CAGR 19%
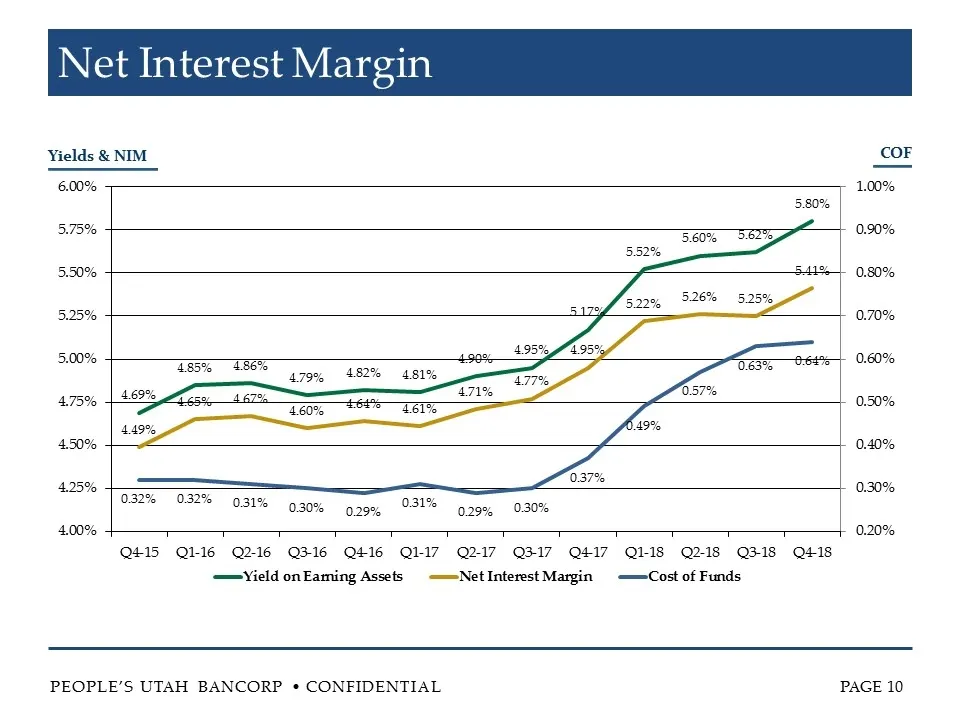
Slide 10: Net Interest Margin
Net Interest Margin Yields & NIM COF
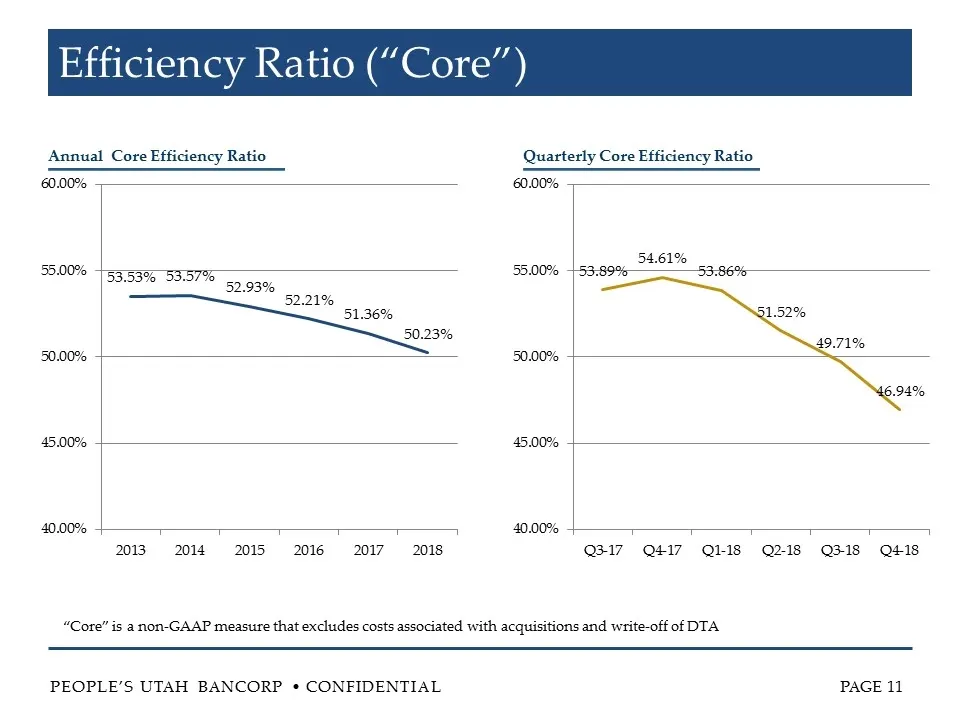
Slide 11: Efficiency Ratio ("Core")
Efficiency Ratio (“Core”) Annual Core Efficiency Ratio Quarterly Core Efficiency Ratio “Core” is a non-GAAP measure that excludes costs associated with acquisitions and write-off of DTA
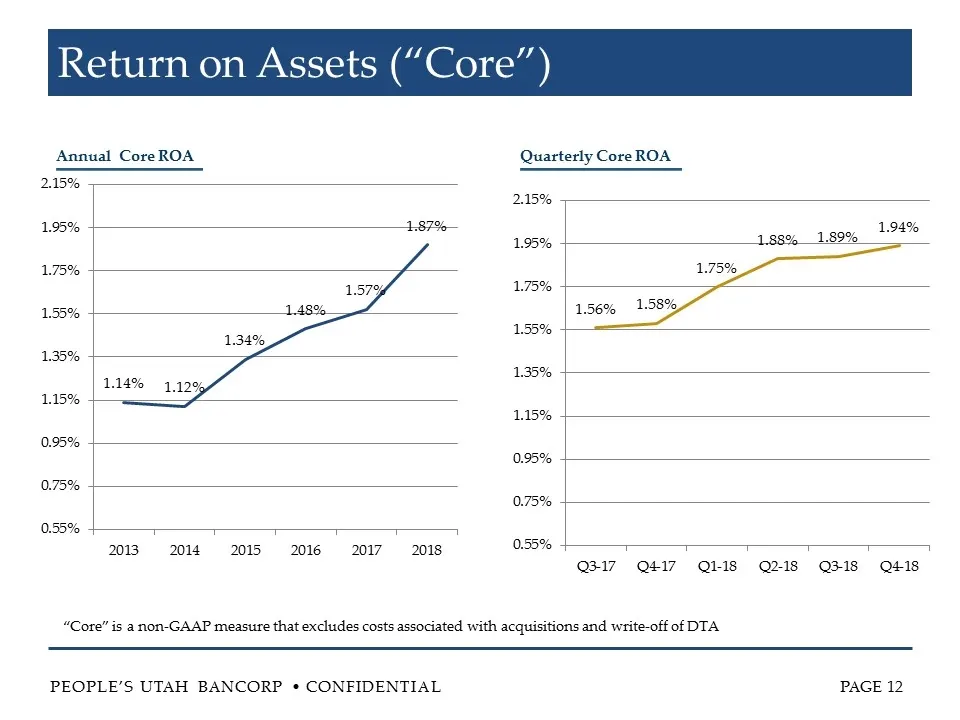
Slide 12: Return on Assets ("Core")
Return on Assets (“Core”) Annual Core ROA Quarterly Core ROA “Core” is a non-GAAP measure that excludes costs associated with acquisitions and write-off of DTA
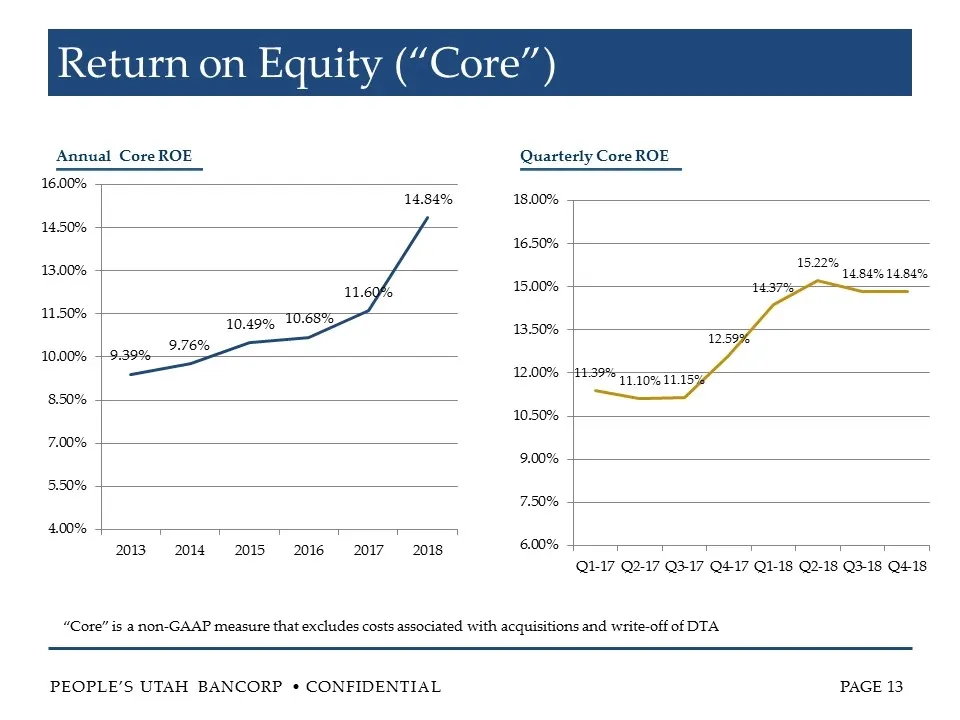
Slide 13: Return on Equity ("Core")
Return on Equity (“Core”) Annual Core ROE Quarterly Core ROE “Core” is a non-GAAP measure that excludes costs associated with acquisitions and write-off of DTA
Slide 14: 2018 Year in Review: Strengthened Balance Sheet
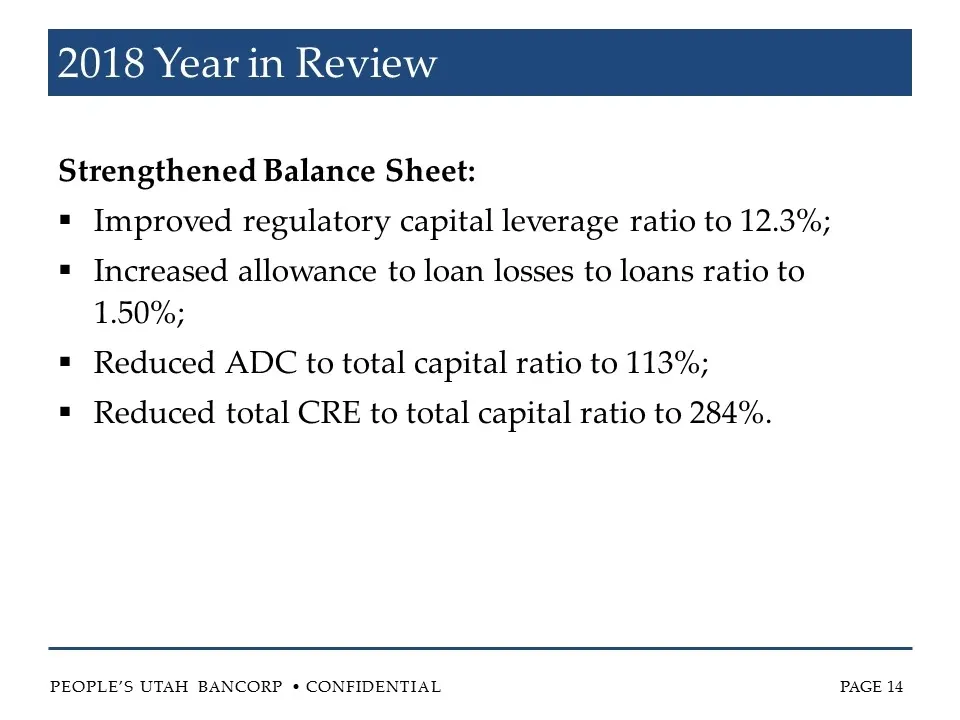
2018 Year in Review Strengthened Balance Sheet: Improved regulatory capital leverage ratio to 12.3%; Increased allowance to loan losses to loans ratio to 1.50%; Reduced ADC to total capital ratio to 113%; Reduced total CRE to total capital ratio to 284%.
Slide 15: Strong Market Dynamics in Utah
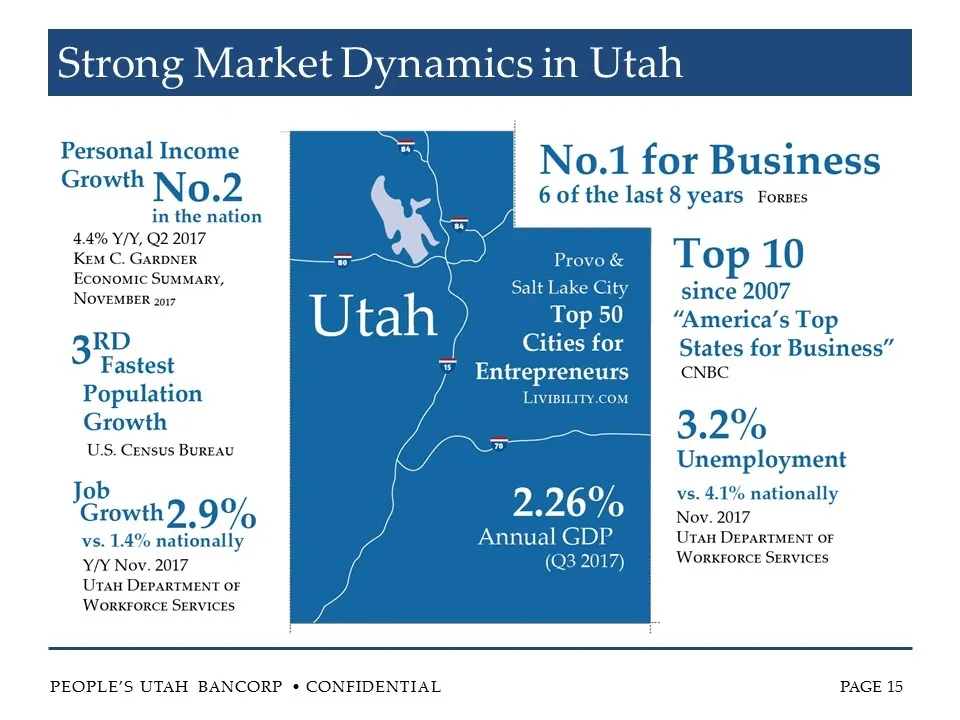
Strong Market Dynamics in Utah
Slide 16: Deposit Market Share in Utah—2018
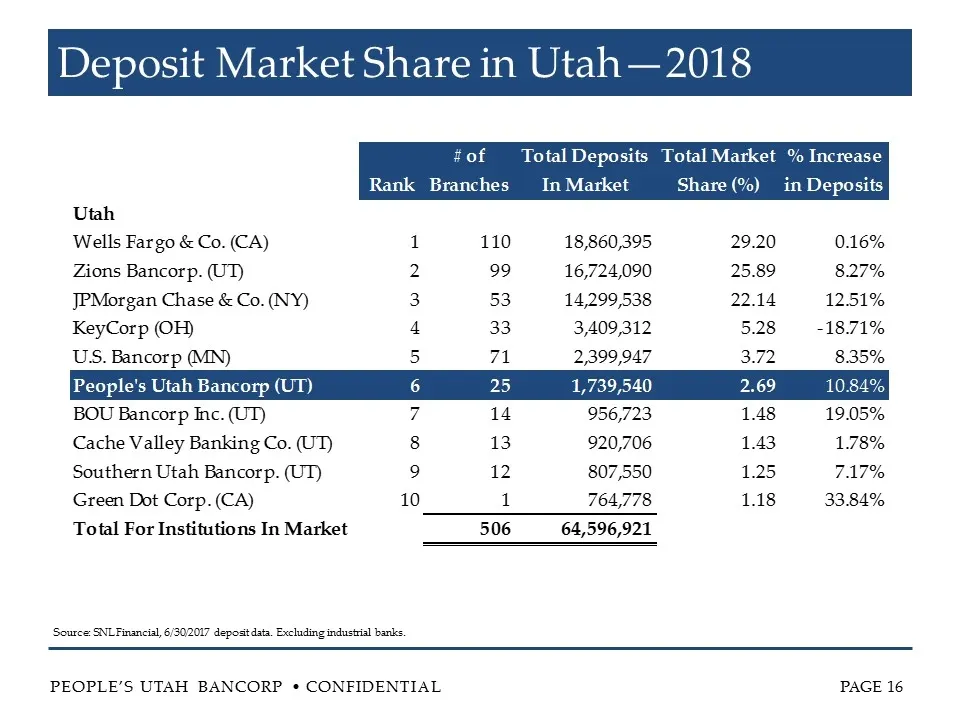
Deposit Market Share in Utah—2018 Source: SNL Financial, 6/30/2017 deposit data. Excluding industrial banks.
Slide 17: Deposit Market Share in Utah
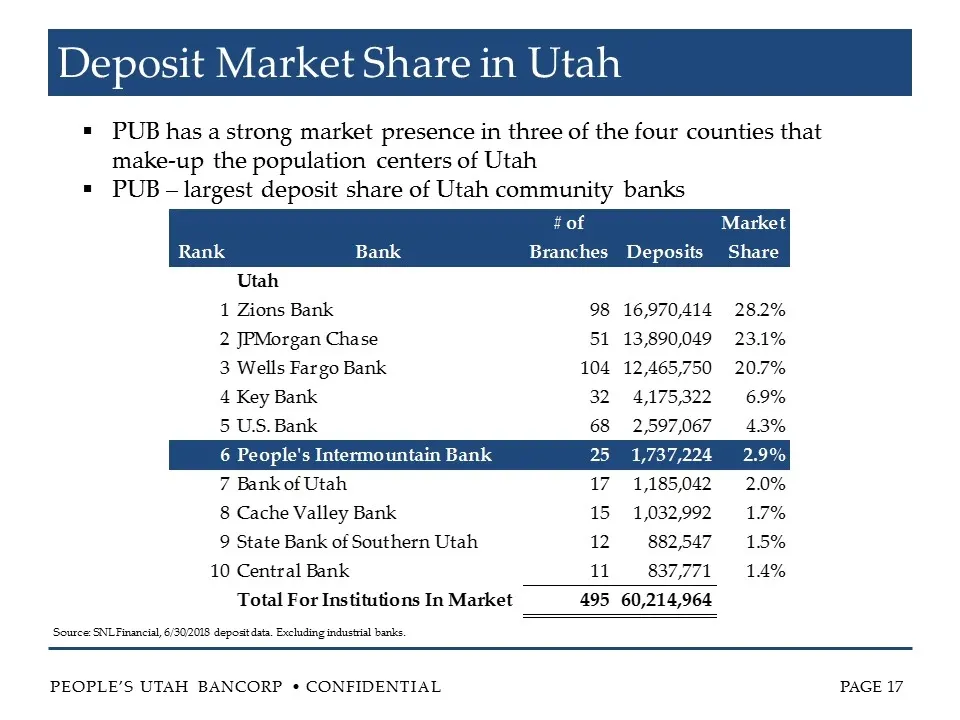
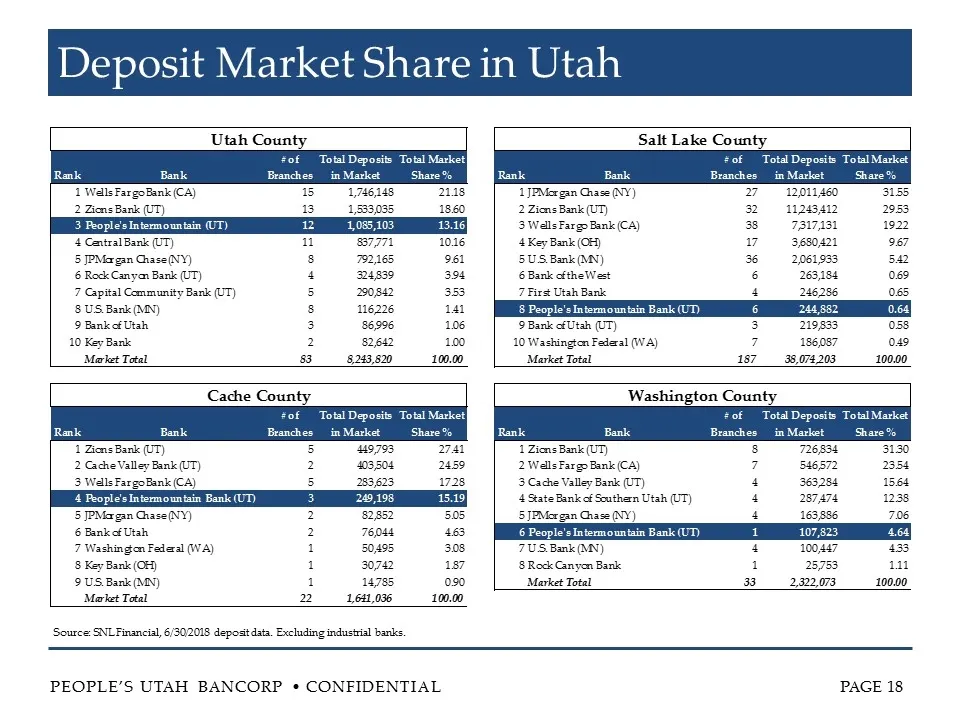
Deposit Market Share in Utah PUB has a strong market presence in three of the four counties that make-up the population centers of Utah PUB – largest deposit share of Utah community banks Source: SNL Financial, 6/30/2018 deposit data. Excluding industrial banks.
Slide 18: Deposit Market Share in Utah
Deposit Market Share in Utah Source: SNL Financial, 6/30/2018 deposit data. Excluding industrial banks.
Slide 19: Strengthened Board and Management Oversight
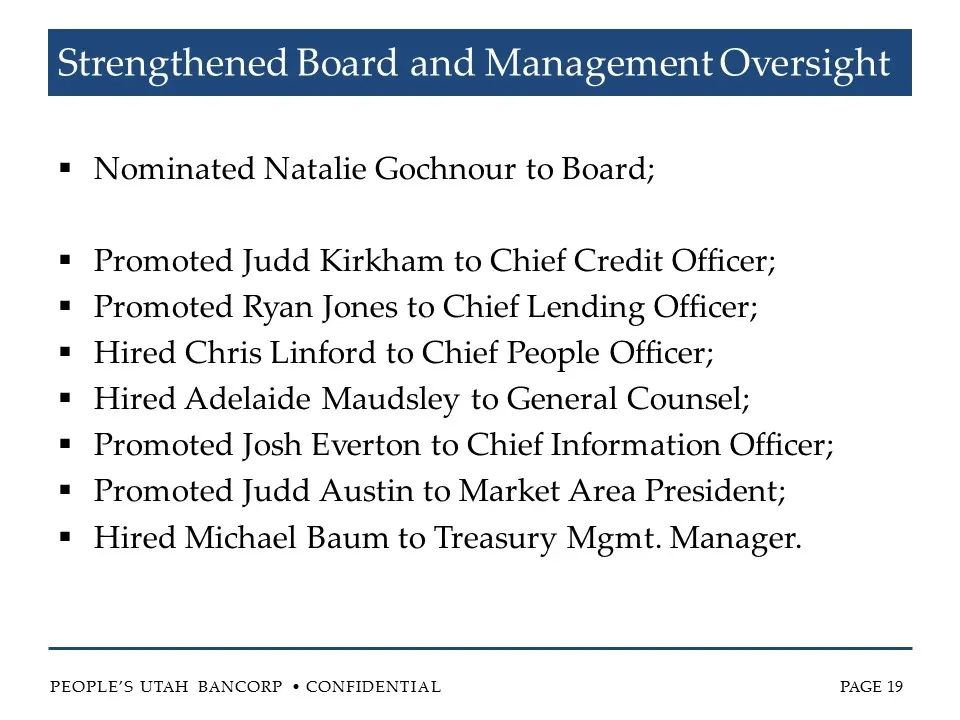
Strengthened Board and Management Oversight Nominated Natalie Gochnour to Board; Promoted Judd Kirkham to Chief Credit Officer; Promoted Ryan Jones to Chief Lending Officer; Hired Chris Linford to Chief People Officer; Hired Adelaide Maudsley to General Counsel; Promoted Josh Everton to Chief Inform

Slide 20: Executive Leadership Team
Executive Leadership Team Len E. Williams Chief Executive Officer Mark K. Olson Chief Financial Officer Rick W. Anderson President Judd P. Kirkham Chief Credit Officer Ryan H. Jones Chief Lending Officer Chris Linford Chief People Officer
Slide 21: Refined Vision, Purpose, and Values
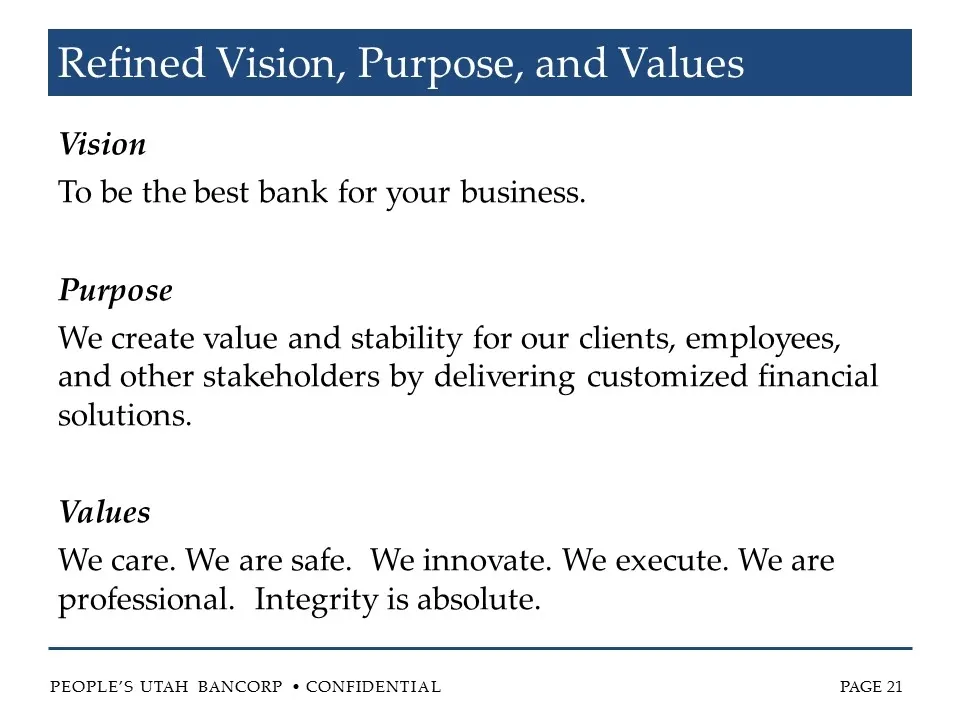
Refined Vision, Purpose, and Values Vision To be the best bank for your business. Purpose We create value and stability for our clients, employees, and other stakeholders by delivering customized financial solutions. Values We care. We are safe. We innovate. We execute. We are professional. Integrit
Slide 22: PUB Stock Performance
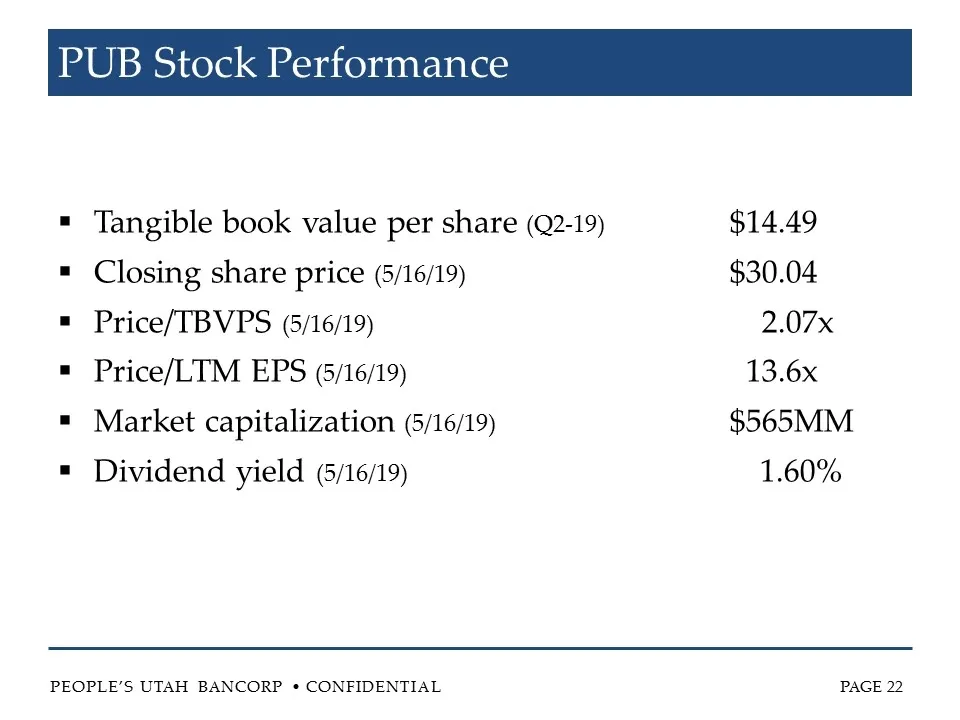
PUB Stock Performance Tangible book value per share (Q2-19) $14.49 Closing share price (5/16/19) $30.04 Price/TBVPS (5/16/19) 2.07x Price/LTM EPS (5/16/19) 13.6x Market capitalization (5/16/19)$565MM Dividend yield (5/16/19) 1.60%
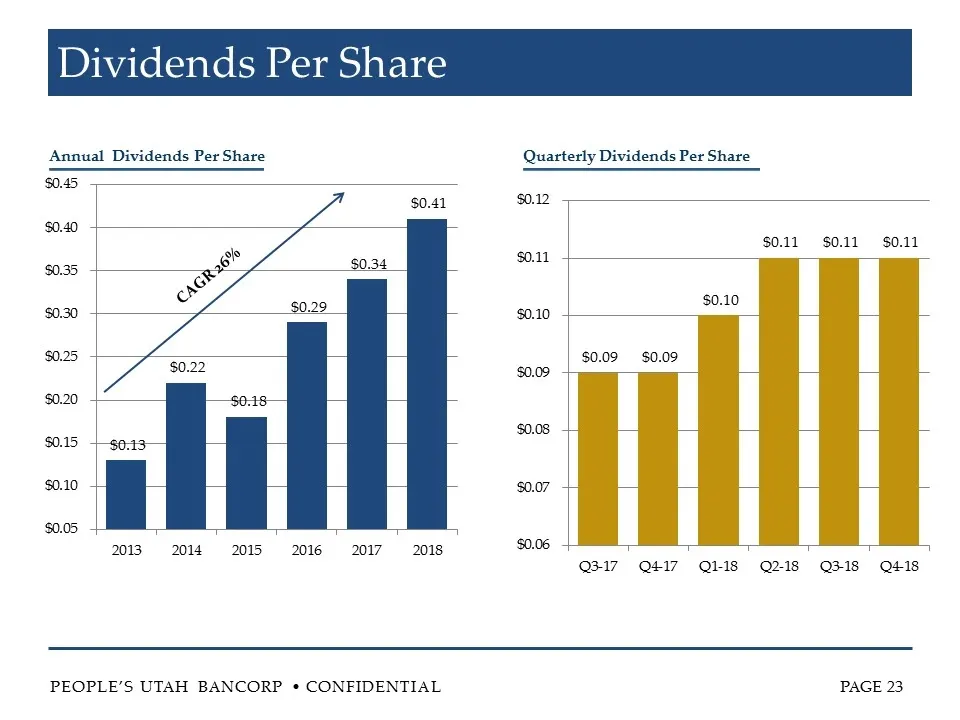
Slide 23: Dividends Per Share
Dividends Per Share Annual Dividends Per Share Quarterly Dividends Per Share CAGR 26%
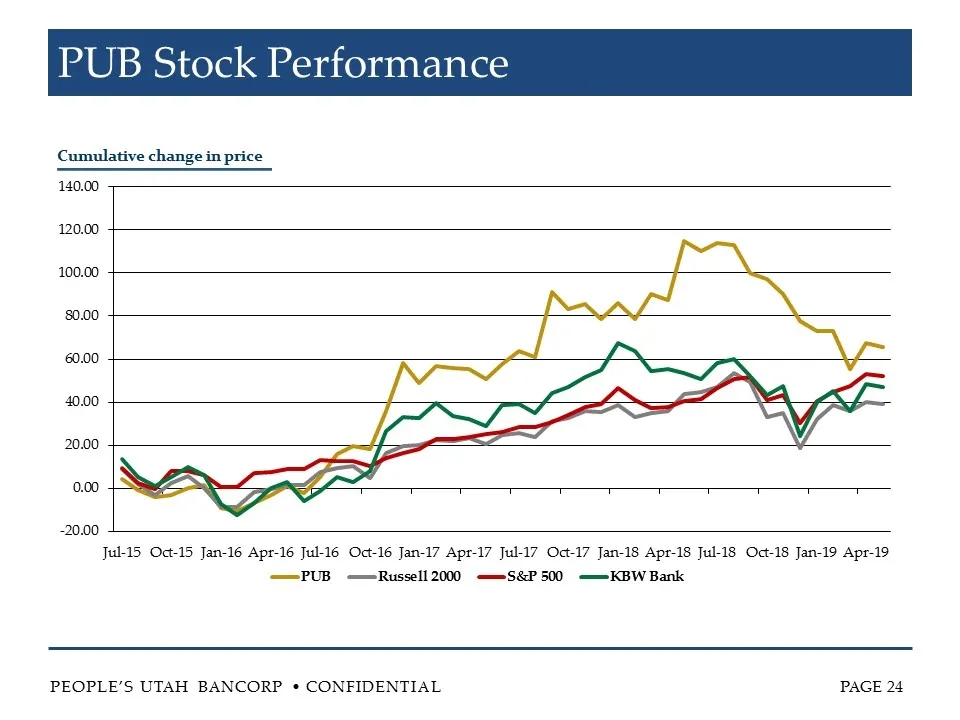
Slide 24: PUB Stock Performance: Cumulative change in price
PUB Stock Performance Cumulative change in price
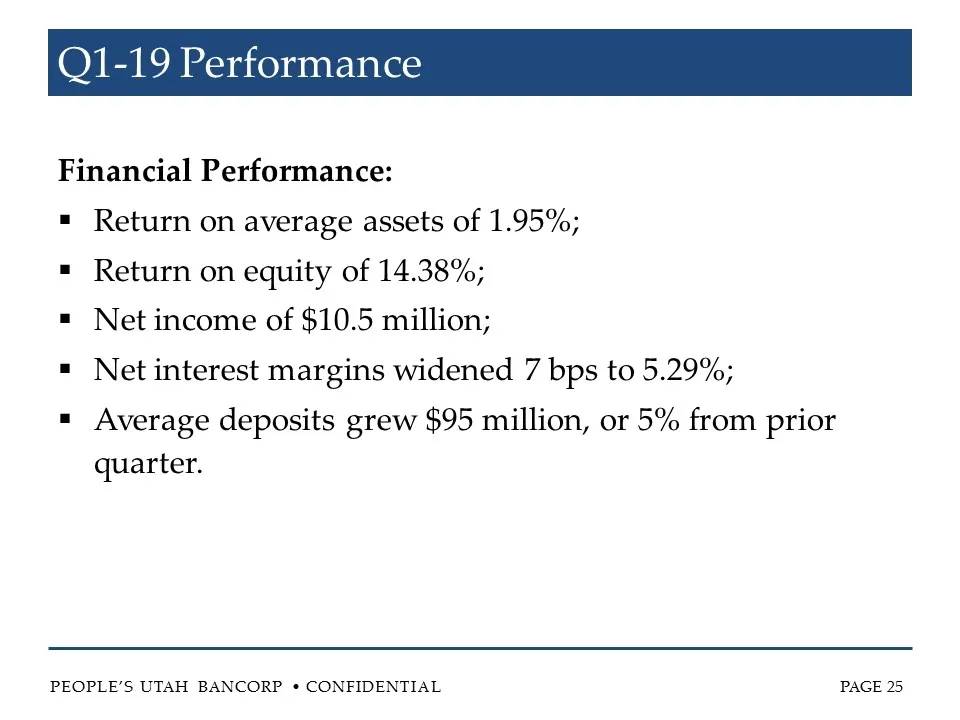
Slide 25: Q1-19 Performance
Q1-19 Performance Financial Performance: Return on average assets of 1.95%; Return on equity of 14.38%; Net income of $10.5 million; Net interest margins widened 7 bps to 5.29%; Average deposits grew $95 million, or 5% from prior quarter.
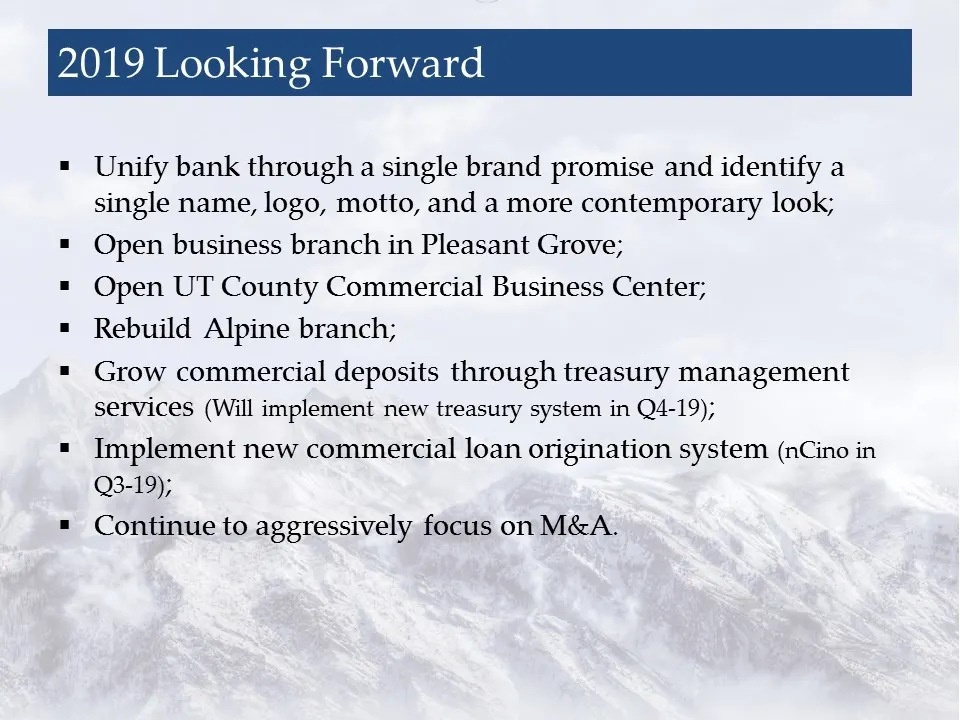
Slide 26: 2019 Looking Forward
2019 Looking Forward Unify bank through a single brand promise and identify a single name, logo, motto, and a more contemporary look; Open business branch in Pleasant Grove; Open UT County Commercial Business Center; Rebuild Alpine branch; Grow commercial deposits through treasury management service
Slide 27: Thank You!
Thank You! Grateful to our team who live our core values every day; Appreciate our clients for their business and loyalty; Indebted to you, our shareholders for the confidence, loyalty, and trust you give to us.

Slide 28: Annual Shareholders Meeting May 22, 2019
Annual Shareholders Meeting May 22, 2019
Source: SEC EDGAR · 8-K filed May 23, 2019
More decks from Altabancorp
 Merger or Acquisition (May 2021)19 slides · May 19, 2021
 Q1 2021 Earnings Presentation48 slides · Apr 28, 2021
 Q4 2020 Earnings Presentation51 slides · Jan 27, 2021
 Q3 2020 Earnings Presentation52 slides · Oct 28, 2020
 Q2 2020 Earnings Presentation46 slides · Jul 30, 2020
 People's Utah Bancorp — Shareholder Meeting (May 2020)31 slides · May 28, 2020