Verizon Communications Inc. · NYSE:VZ
Verizon Communications — MCI — Merger or Acquisition (August 2005)
29 slides from Verizon Communications's merger presentation, Aug 18, 2005
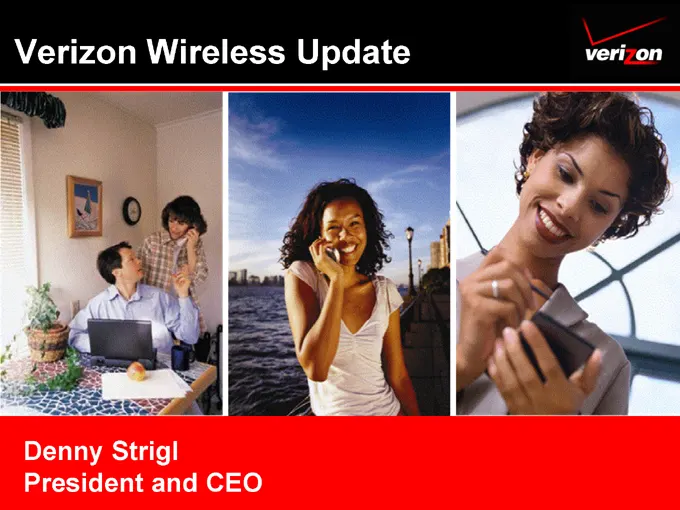
Slide 1: Verizon Wireless Update
Verizon Wireless Update Denny Strigl President and CEO
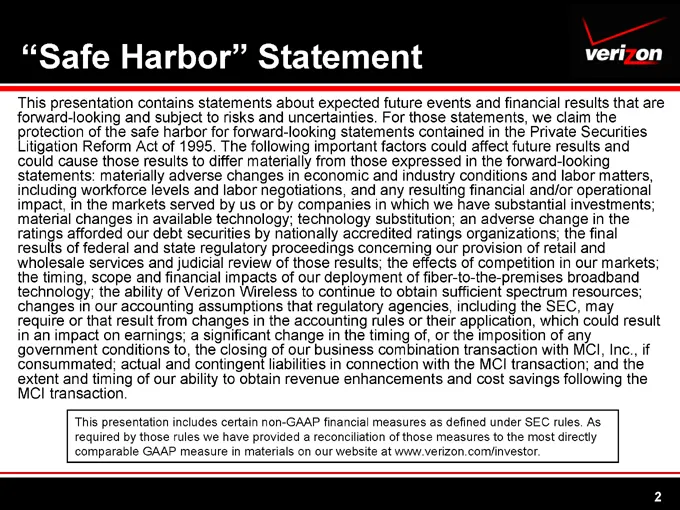
Slide 2: Safe Harbor Statement
“Safe Harbor” Statement This presentation contains statements about expected future events and financial results that are forward-looking and subject to risks and uncertainties. For those statements, we claim the protection of the safe harbor for forward-looking statements contained in the Private S
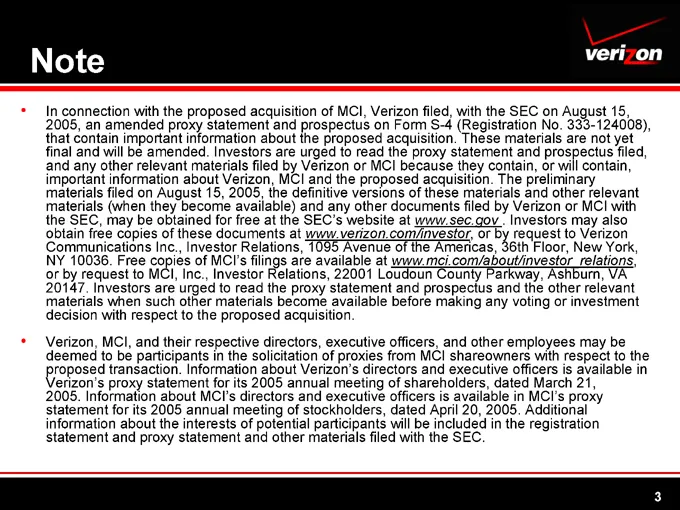
Slide 3: Note
Note In connection with the proposed acquisition of MCI, Verizon filed, with the SEC on August 15, 2005, an amended proxy statement and prospectus on Form S-4 (Registration No. 333-124008), that contain important information about the proposed acquisition. These materials are not yet final and will
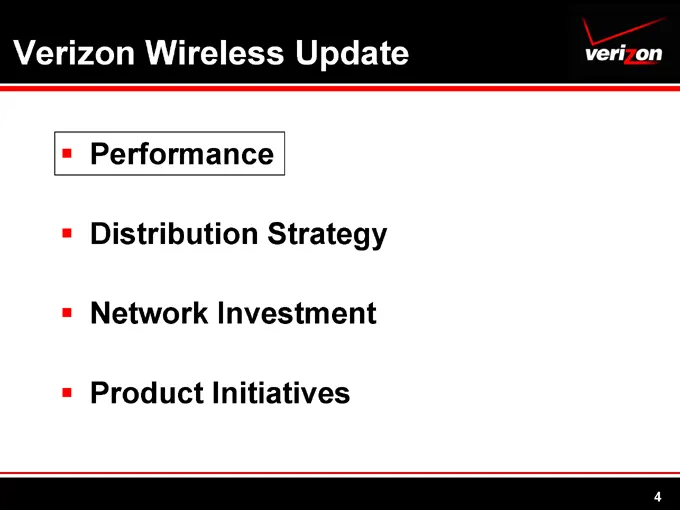
Slide 4: Verizon Wireless Update
Verizon Wireless Update Performance Distribution Strategy Network Investment Product Initiatives
Slide 5: Strong Performance
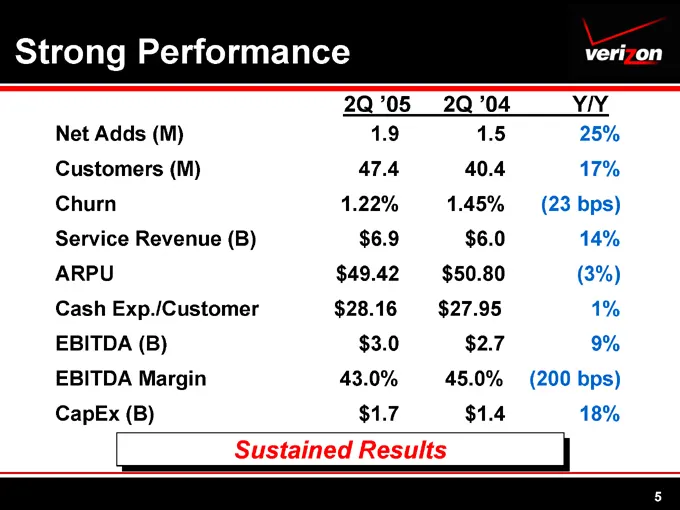
Strong Performance 2Q ‘05 2Q ‘04 Y/Y Net Adds (M) 1.9 1.5 25% Customers (M) 47.4 40.4 17% Churn 1.22% 1.45% (23 bps) Service Revenue (B) $6.9 $6.0 14% ARPU $49.42 $50.80 (3%) Cash Exp./Customer $28.16 $27.95 1% EBITDA (B) $3.0 $2.7 9% EBITDA Margin 43.0% 45.0% (200 bps) CapEx (B) $1.7 $1.4 18% Susta
Slide 6: Record Growth
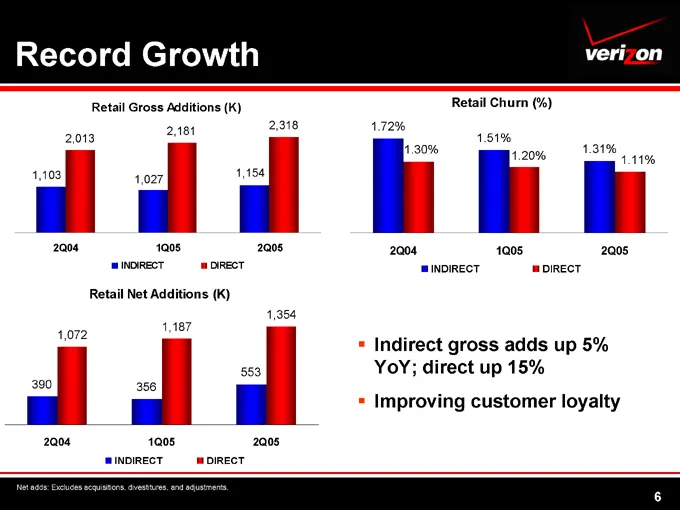
Record Growth Retail Gross Additions (K) 1,103 2,013 2Q04 1,027 2,181 1Q05 1,154 2,318 2Q05 INDIRECT DIRECT Retail Net Additions (K) 390 1,072 2Q04 356 1,187 1Q05 553 1,354 2Q05 INDIRECT DIRECT Retail Churn (%) 1.72% 1.30% 2Q04 1.51% 1.20% 1Q05 1.31% 1.11% 2Q05 INDIRECT DIRECT Indirect gross adds up
Slide 7: Industry-Leading Growth & Loyalty - 2Q05
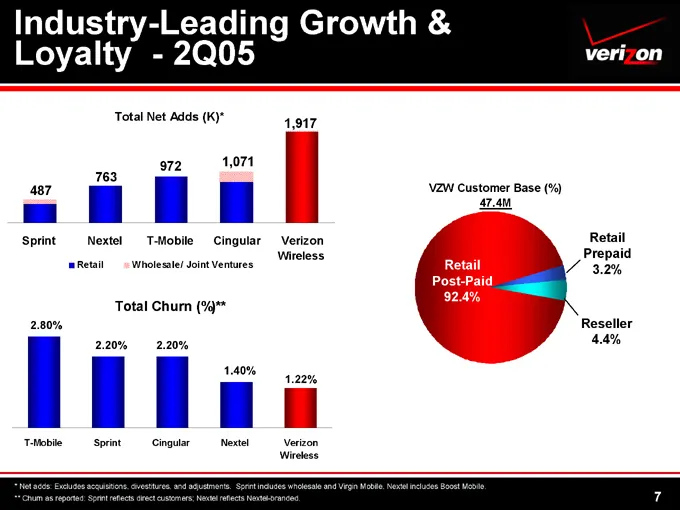
Industry-Leading Growth & Loyalty - 2Q05 Total Net Adds (K)* Sprint Nextel T-Mobile 1,071 Cingular 1,917 Verizon Wireless Retail Wholesale/ Joint Ventures Total Churn (%)** 2.80% T-Mobile 2.20% Sprint 2.20% Cingular 1.40% Nextel 1.22% Verizon Wireless VZW Customer Base (%) 47.4M Retail Post-Paid 92.
Slide 8: LNP Porting Ratio
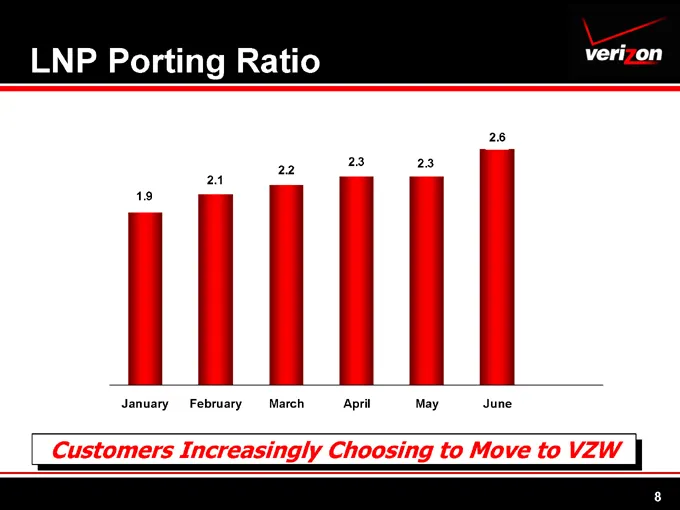
LNP Porting Ratio 1.9 January 2.1 February 2.2 March 2.3 April 2.3 May 2.6 June Customers Increasingly Choosing to Move to VZW
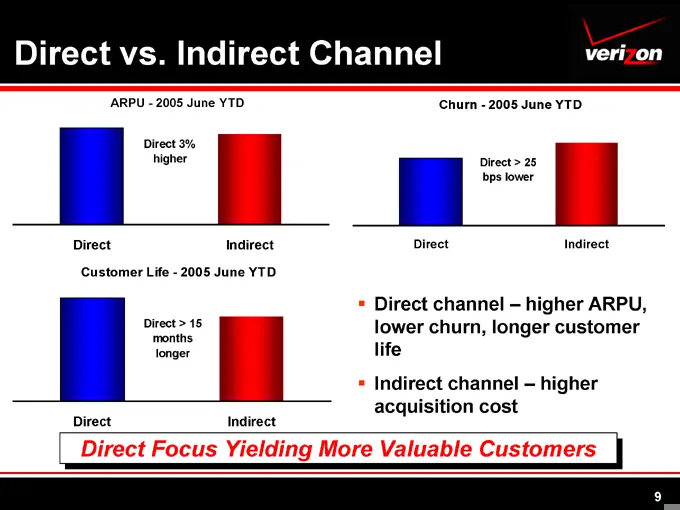
Slide 9: Direct vs. Indirect Channel
Direct vs. Indirect Channel ARPU - 2005 June YTD Direct 3% higher Direct Indirect Customer Life - 2005 June YTD Direct > 15 months longer Direct Indirect Churn - 2005 June YTD Direct > 25 bps lower Direct Indirect Direct channel – higher ARPU, lower churn, longer customer life Indirect channel – hig
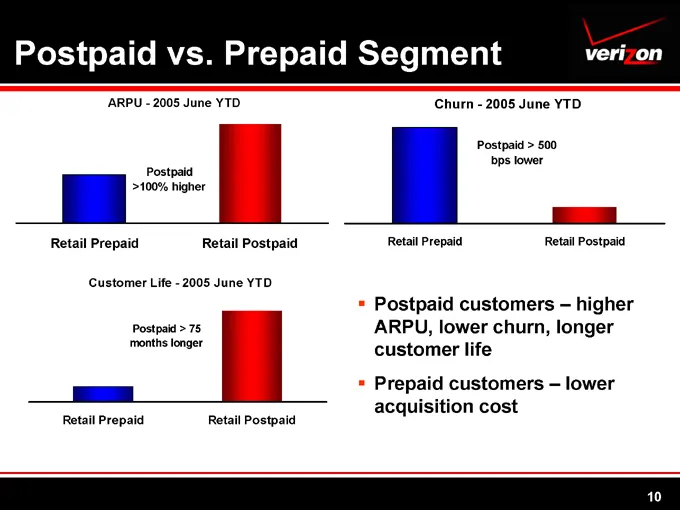
Slide 10: Postpaid vs. Prepaid Segment
Postpaid vs. Prepaid Segment ARPU - 2005 June YTD Postpaid >100% higher Retail Prepaid Retail Postpaid Customer Life - 2005 June YTD Postpaid > 75 months longer Retail Prepaid Retail Postpaid Churn - 2005 June YTD Postpaid > 500 bps lower Retail Prepaid Retail Postpaid Postpaid customers – higher AR
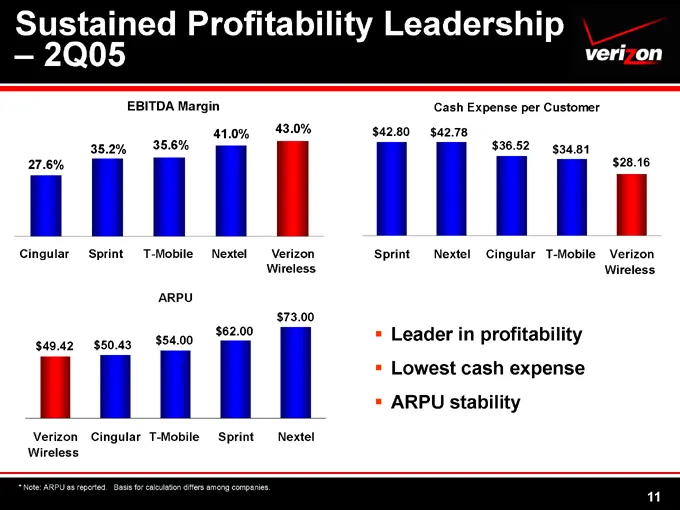
Slide 11: Sustained Profitability Leadership - 2Q05
Sustained Profitability Leadership – 2Q05 EBITDA Margin 27.6% 35.2% 35.6% 41.0% 43.0% Cingular Sprint T-Mobile Nextel Verizon Wireless ARPU $49.42 $50.43 $54.00 ` $62.00 $73.00 Verizon Wireless Cingular T-Mobile Sprint Nextel Cash Expense per Customer $42.80 $42.78 $36.52 $34.81 $28.16 Sprint Nextel
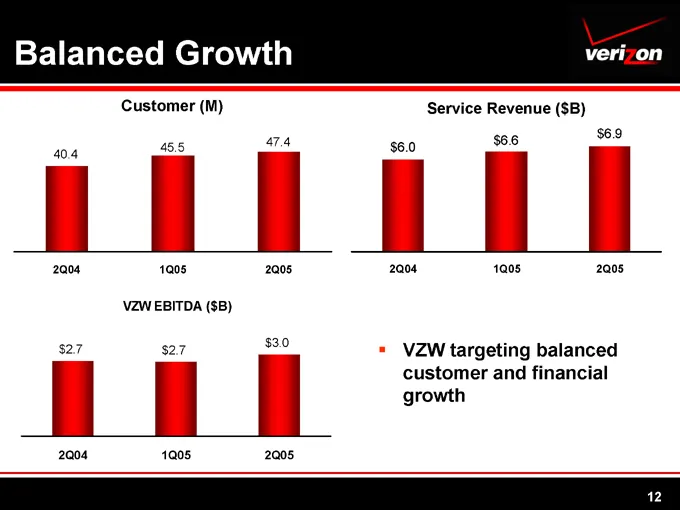
Slide 12: Balanced Growth
Balanced Growth Customer (M) 40.4 45.5 47.4 2Q04 1Q05 2Q05 VZW EBITDA ($B) $2.7 $2.7 $3.0 2Q04 1Q05 2Q05 Service Revenue ($B) $6.0 $6.6 $6.9 2Q04 1Q05 2Q05 VZW targeting balanced customer and financial growth
Slide 13: Best Brand Among Consumers & Businesses
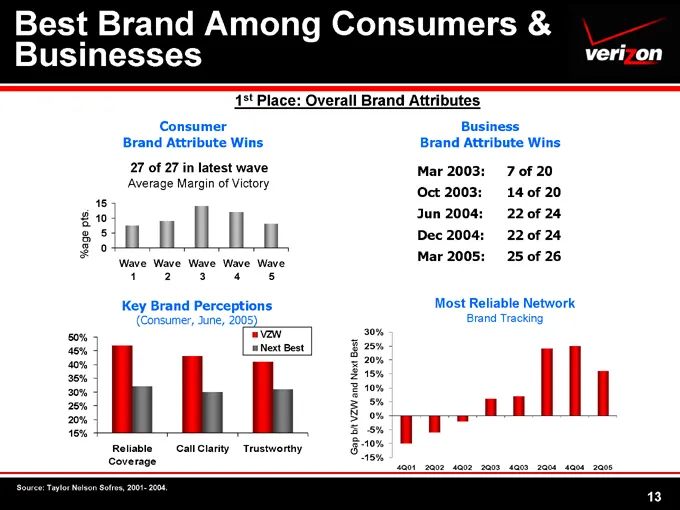
Best Brand Among Consumers & Businesses 1st Place: Overall Brand Attributes Consumer Brand Attribute Wins 27 of 27 in latest wave Average Margin of Victory %age pts. 10 5 0 Wave 1 Wave 2 Wave 3 Wave 4 Wave 5 Key Brand Perceptions (Consumer, June, 2005) VZW Next Best 50% 45% 40% 35% 30% 25% 20% 15% R
Slide 14: Data Performance
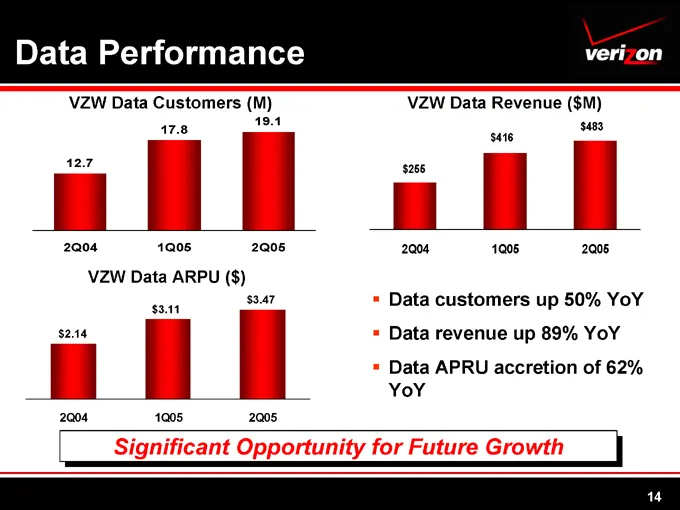
Data Performance VZW Data Customers (M) 12.7 17.8 19.1 2Q04 1Q05 2Q05 VZW Data ARPU ($) $2.14 $3.11 $3.47 2Q04 1Q05 2Q05 VZW Data Revenue ($M) $255 $416 $483 2Q04 1Q05 2Q05 Data customers up 50% YoY Data revenue up 89% YoY Data APRU accretion of 62% YoY Significant Opportunity for Future Growth
Slide 15: EV-DO Performance
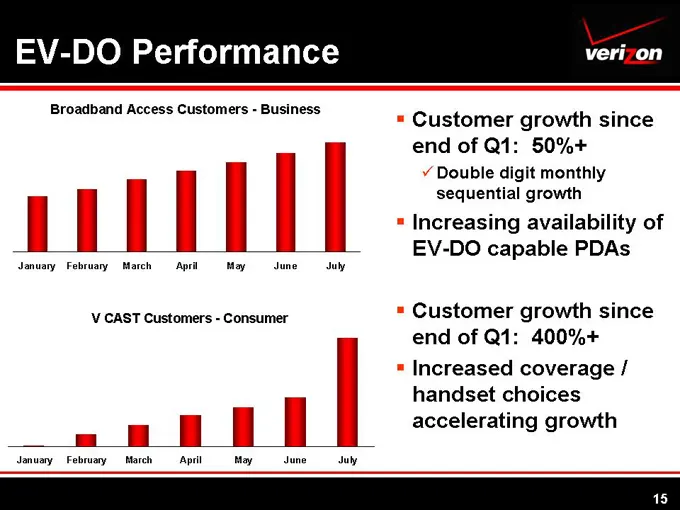
EV-DO Performance Broadband Access Customers - Business January February March April May June July V CAST Customers - Consumer January February March April May June July Customer growth since end of Q1: 50%+ Double digit monthly sequential growth Increasing availability of EV-DO capable PDAs Custome
Slide 16: Verizon Wireless Update
Verizon Wireless Update Performance Distribution Strategy Network Investment Product Initiatives
Slide 17: Distribution Plan
Distribution Plan Continue to leverage our strong network of direct and indirect distribution Develop new sources of direct distribution New stores & kiosks in key locations Pursue and implement relationships with new national retailers Currently negotiating with a number of highly respected househo
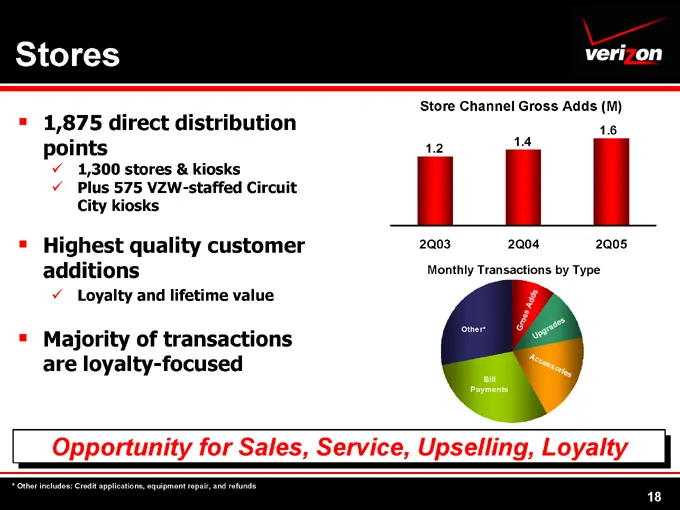
Slide 18: Stores
Stores 1,875 direct distribution points 1,300 stores & kiosks Plus 575 VZW-staffed Circuit City kiosks Highest quality customer additions Loyalty and lifetime value Majority of transactions are loyalty-focused Store Channel Gross Adds (M) 1.2 1.4 1.6 2Q03 2Q04 2Q05 Monthly Transactions by Type Other
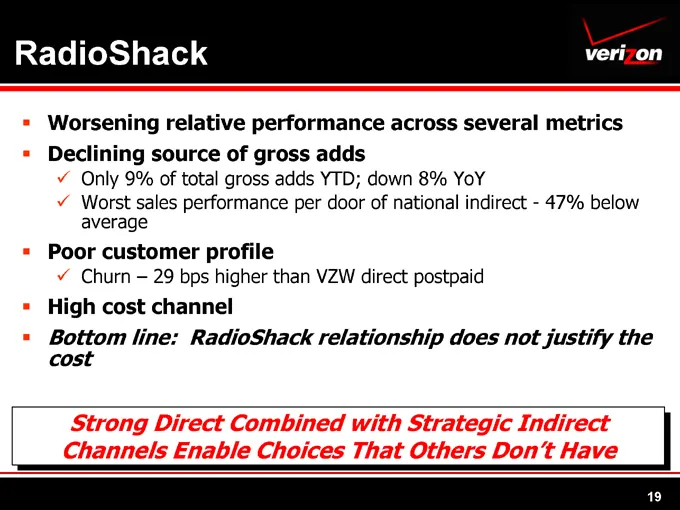
Slide 19: RadioShack
RadioShack Worsening relative performance across several metrics Declining source of gross adds Only 9% of total gross adds YTD; down 8% YoY Worst sales performance per door of national indirect - 47% below average Poor customer profile Churn – 29 bps higher than VZW direct postpaid High cost channe
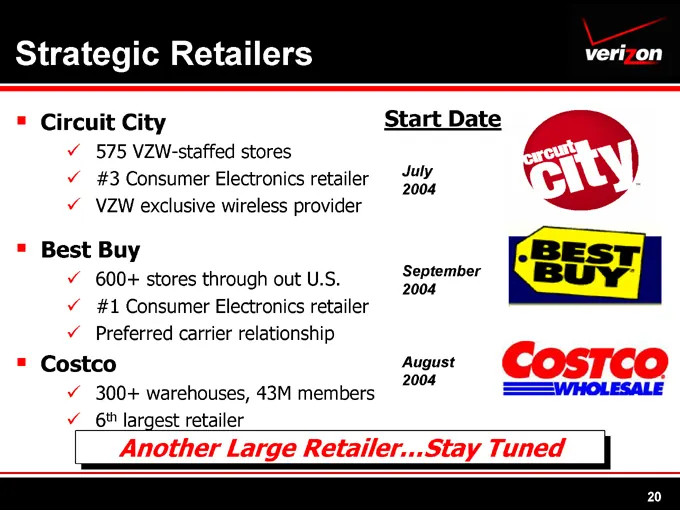
Slide 20: Strategic Retailers
Strategic Retailers Circuit City 575 VZW-staffed stores #3 Consumer Electronics retailer VZW exclusive wireless provider Best Buy 600+ stores through out U.S. #1 Consumer Electronics retailer Preferred carrier relationship Costco 300+ warehouses, 43M members 6th largest retailer Start Date July 2004
Slide 21: Verizon Wireless Update
Verizon Wireless Update Performance Distribution Strategy Network Investment Product Initiatives
Slide 22: Premier Network - Reliability
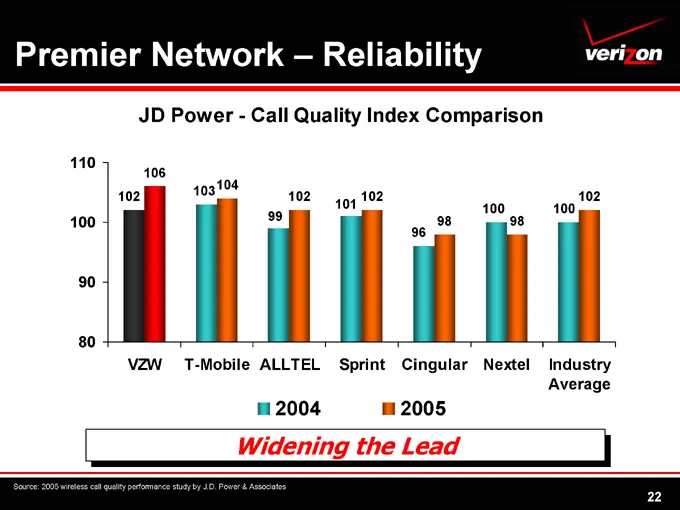
Premier Network – Reliability JD Power - Call Quality Index Comparison 103104 102 102 102 102 99 101 98 100 100 100 98 80 90 96 VZW T-Mobile ALLTEL Sprint Cingular Nextel Industry Average Widening the Lead Source: 2005 wireless call quality performance study by J.D. Power & Associates
Slide 23: Premier Network - Reliability
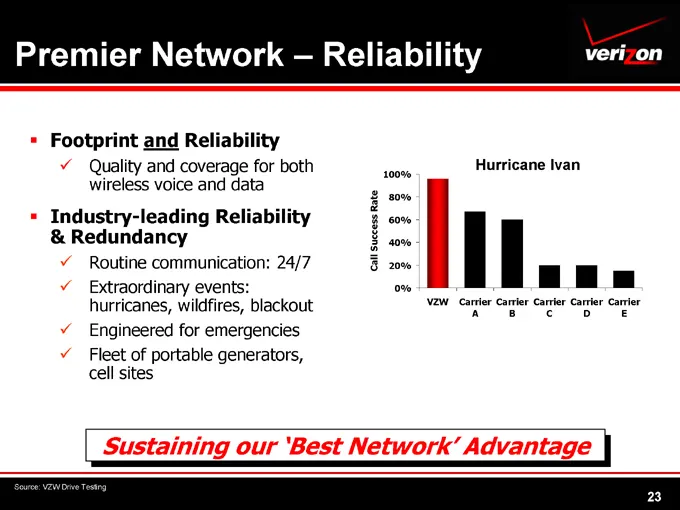
Premier Network – Reliability Footprint and Reliability Quality and coverage for both wireless voice and data Industry-leading Reliability & Redundancy Routine communication: 24/7 Extraordinary events: hurricanes, wildfires, blackout Engineered for emergencies Fleet of portable generators, cell site
Slide 24: Broadband Leader
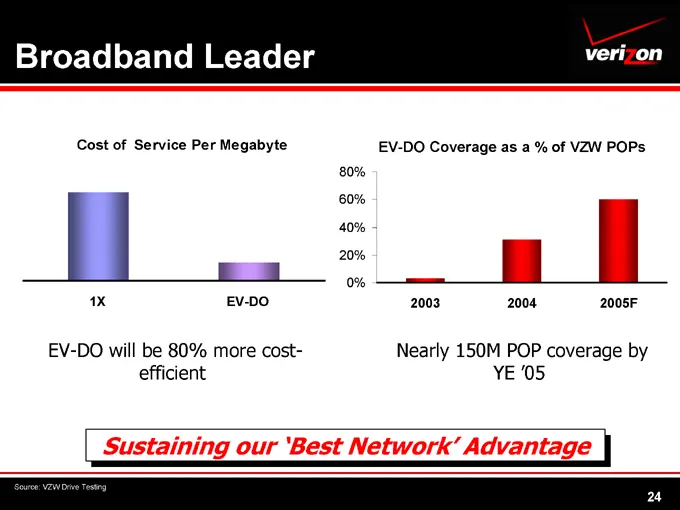
Broadband Leader Cost of Service Per Megabyte 1X EV-DO EV-DO will be 80% more cost-efficient 80% 60% 40% 20% 0% EV-DO Coverage as a % of VZW POPs 2003 2004 2005F Nearly 150M POP coverage by YE ‘05 Sustaining our ‘Best Network’ Advantage Source: VZW Drive Testing
Slide 25: Consistent Investment
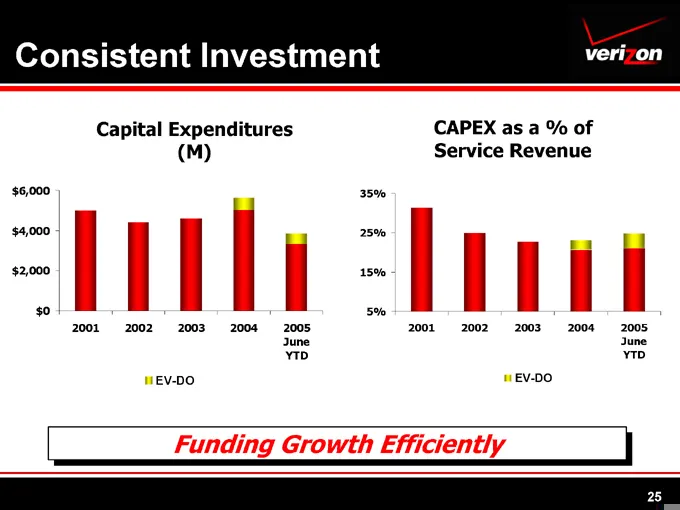
Consistent Investment Capital Expenditures (M) $6,000 $4,000 $2,000 $0 2001 2002 2003 2004 2005 June YTD EV-DO CAPEX as a % of Service Revenue 35% 25% 15% 5% 2001 2002 2003 2004 2005 June YTD EV-DO Funding Growth Efficiently
Slide 26: Verizon Wireless Update
Verizon Wireless Update Performance Distribution Strategy Network Investment Product Initiatives
Slide 27: Key Product Initiatives - Consumer
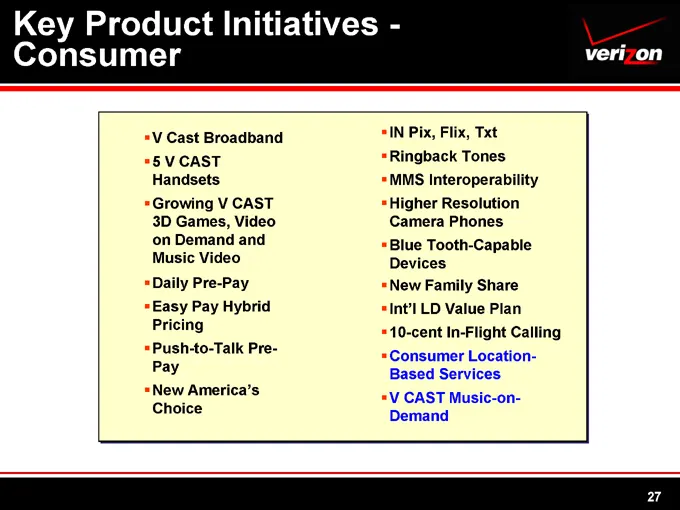
Key Product Initiatives -Consumer V Cast Broadband 5 V CAST Handsets Growing V CAST 3D Games, Video on Demand and Music Video Daily Pre-Pay Easy Pay Hybrid Pricing Push-to-Talk PrePay New America’s Choice IN Pix, Flix, Txt Ringback Tones MMS Interoperability Higher Resolution Camera Phones Blue Toot
Slide 28: Key Product Initiatives - Business
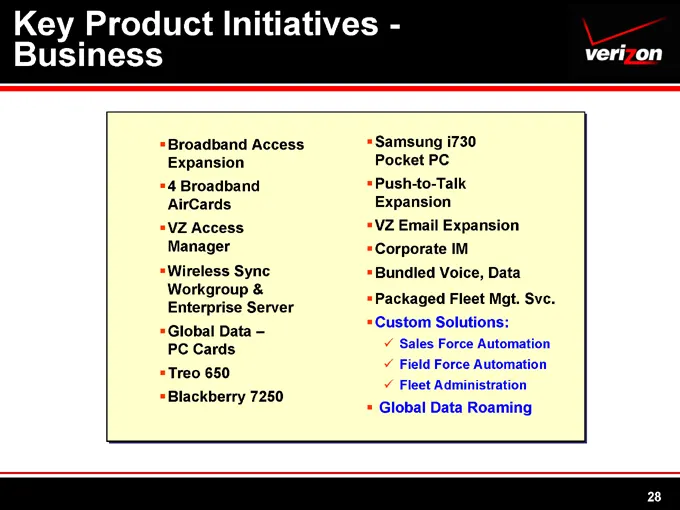
Key Product Initiatives -Business Broadband Access Expansion 4 Broadband AirCards VZ Access Manager Wireless Sync Workgroup & Enterprise Server Global Data –PC Cards Treo 650 Blackberry 7250 Samsung i730 Pocket PC Push-to-Talk Expansion VZ Email Expansion Corporate IM Bundled Voice, Data Packaged Fl
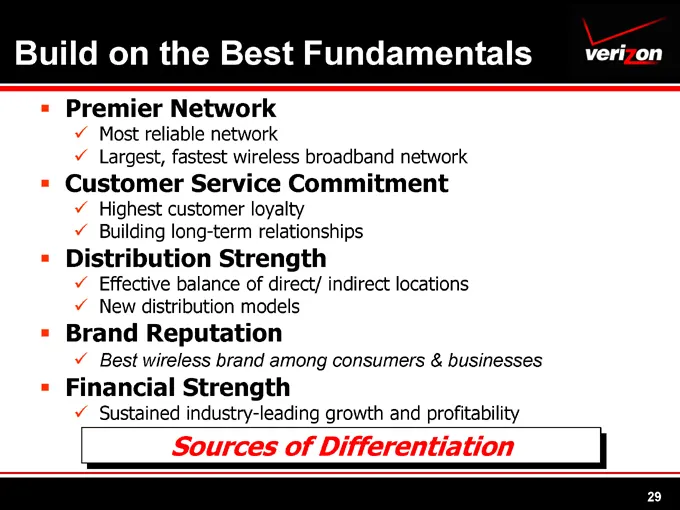
Slide 29: Build on the Best
Build on the Best Fundamentals Premier Network Most reliable network Largest, fastest wireless broadband network Customer Service Commitment Highest customer loyalty Building long-term relationships Distribution Strength Effective balance of direct/ indirect locations New distribution models Brand R
Source: SEC EDGAR · 425 filed Aug 18, 2005
More decks from Verizon Communications Inc.
 Q3 2026 Earnings Presentation9 slides · Oct 26, 2026
 Q2 2026 Earnings Presentation9 slides · Jul 24, 2026
 Q1 2026 Earnings Presentation9 slides · Apr 27, 2026
 Q4 2025 Earnings Presentation10 slides · Jan 30, 2026
 Q3 2025 Earnings Presentation9 slides · Oct 29, 2025
 Q2 2025 Earnings Presentation8 slides · Jul 21, 2025