MidWestOne Financial Group Inc
MidWestOne Financial — Shareholder Meeting (June 2015)
27 slides from MidWestOne Financial's shareholder meeting presentation, Jun 12, 2015
Slide 1: Annual Shareholders' Meeting
Annual Shareholders’ Meeting June 16, 2015 Iowa City, Iowa MidWestOne Financial Group, Inc.
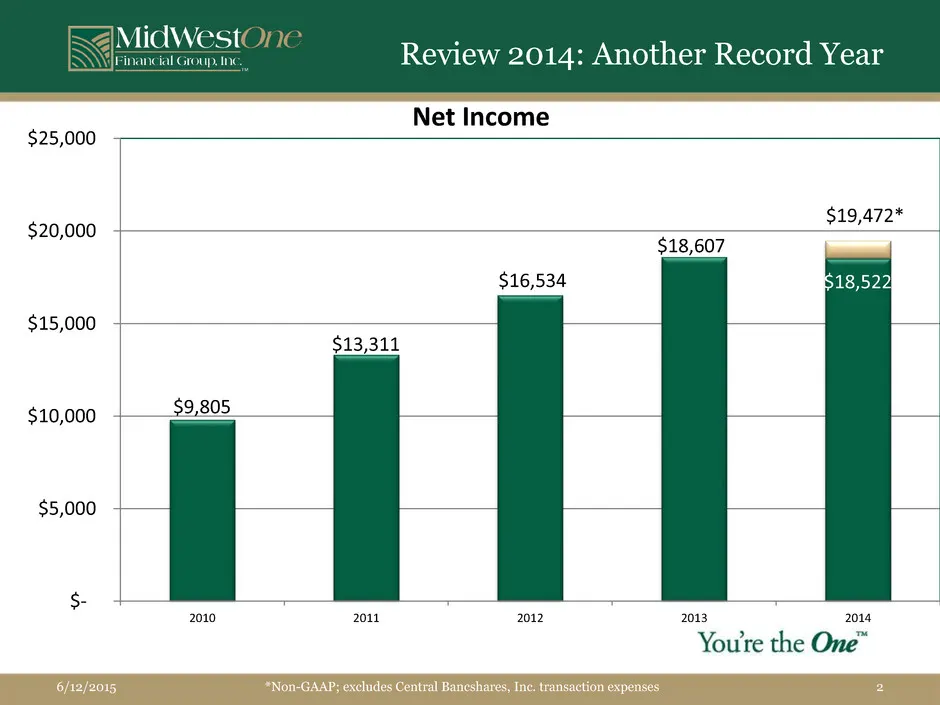
Slide 2: Review 2014: Another Record Year - Net Income
$25,000 $20,000 $15,000 Midw esi¢ ne Review 2014: Another Record Year Net Income $19,472* $18,607 $16,534 518,52: $13,311 $9,805 i 2010 2011 2012 2013 2014
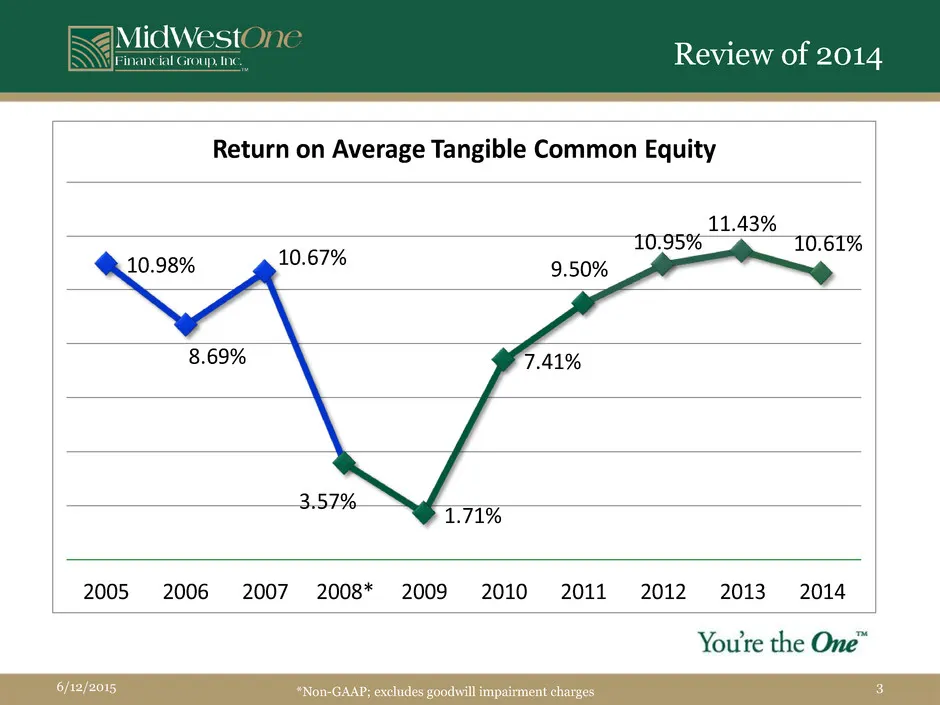
Slide 3: Review of 2014: Return on Average Tangible Common Equity
MidWest inane onaaing Review of 2014 Return on Average Tangible Common Equity 10.98% 11.43% 10.95% 10.61% 10.67% 9.50% me 8.69% \ | dle nw 3 171% 2005 2006 2007 2008* 2009 2010 2011 2012 2013 2014 You're the One™
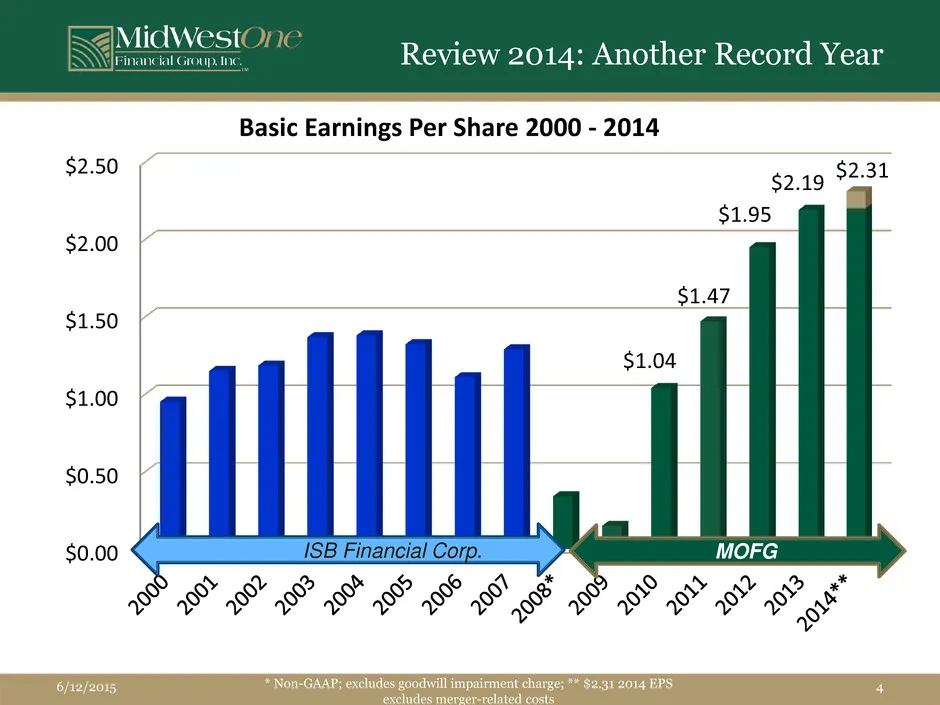
Slide 4: Review 2014: Basic Earnings Per Share 2000-2014
inancial Group, Inc lestOne Review 2014: Another Record Year $2.50 $2.00 $1.50 $1.00 Basic Earnings Per Share 2000 - 2014 $2.19 $2.31
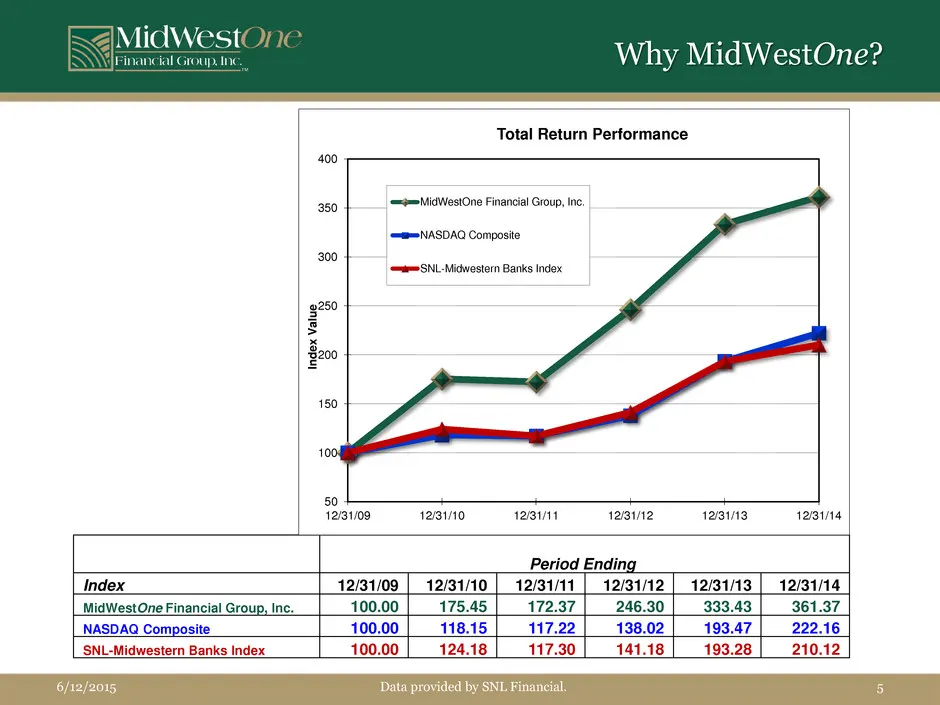
Slide 5: Why MidWestOne? Total Return Performance
we Why MidWestOne? Financial Group. Inc Total Return Performance 400 a6 =eMiswestOne Financial Group, ne. m= NASOAA Composite 300 = SNL Midwestern Bans Index 9250 s $eo0 150 1004 50 } 12181/08 1291/10 Pr W2eH2 128113 vare114 Period Ending Index 42/31/09 | 12/31/10 |_ 12/34/11 | 12/3112 | 12/3413 | 1
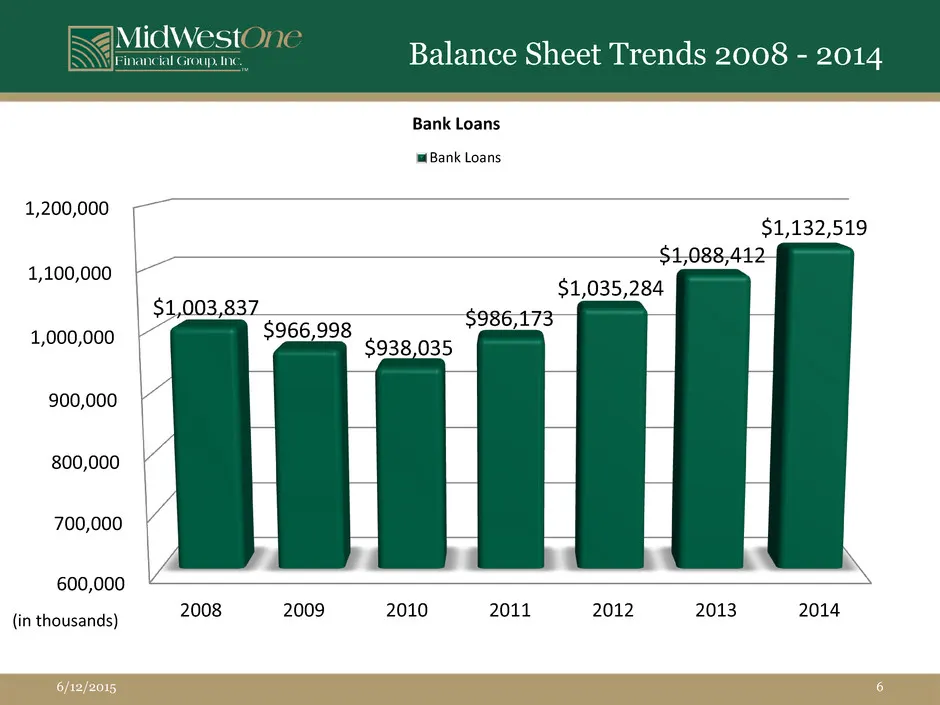
Slide 6: Balance Sheet Trends 2008-2014: Bank Loans
MidWestOne X Z Balance Sheet Trends 2008 - 2014 Bank Loans mi Bank Loans 1,200,000 $1,132,519 1,100,000 $1,088,412 _ | $1,035,284 oe? $986,173 ne $938,035 900,000 00,000 |” 700,000 600,000 4 {in thousands) 2008 2009 2010 2011 2012 2013 2014
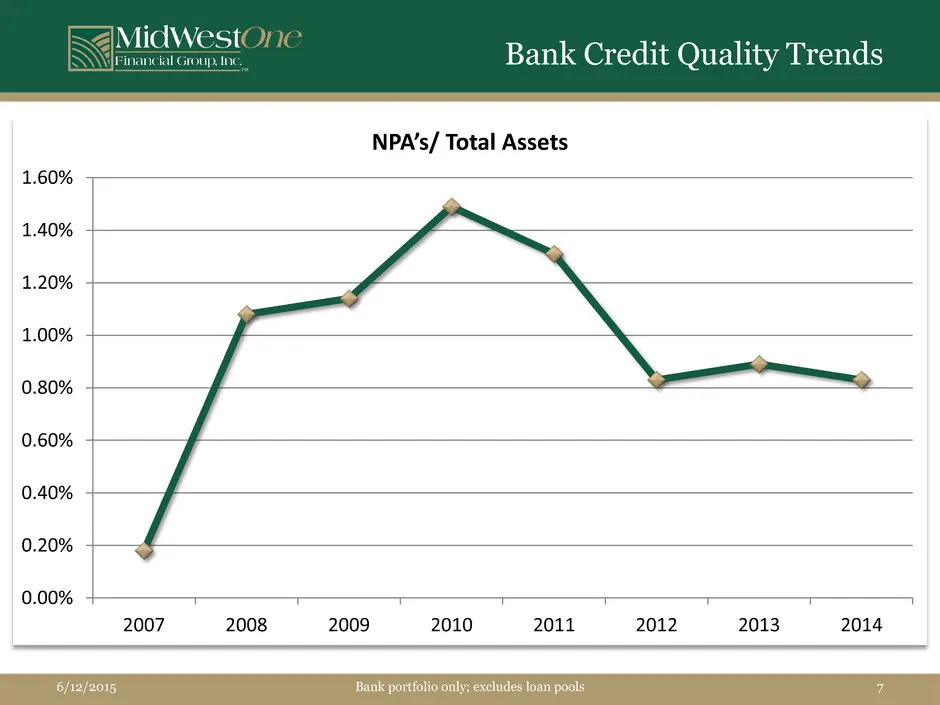
Slide 7: Bank Credit Quality Trends: NPAs / Total Assets
MidWest Faomne Kenn Bank Credit Quality Trends NPA’s/ Total Assets 0.60% / 0.40% ] 0.20% $ 2007 2008 2009 2010 2011 2012 2013 2014
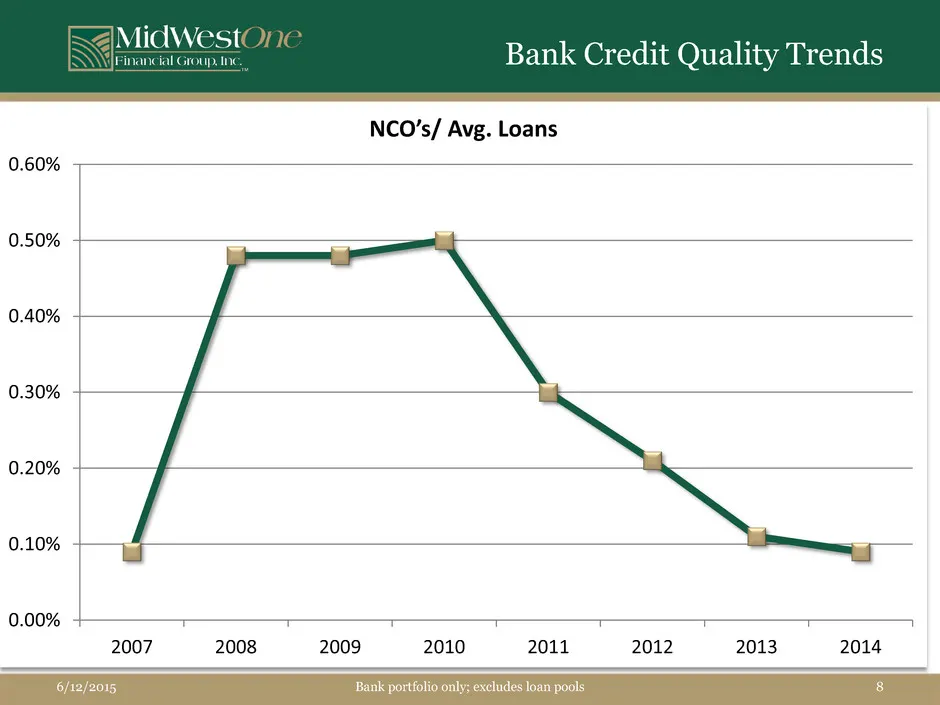
Slide 8: Bank Credit Quality Trends: NCOs / Avg. Loans
MidWest Faomne Kenn Bank Credit Quality Trends NCO’s/ Avg. Loans 0.60% 0.50% =| 0.40% f \ 0.30% 0.20% / 0.10% + 2007 2008 2009 2010 2011 2012 2013 2014
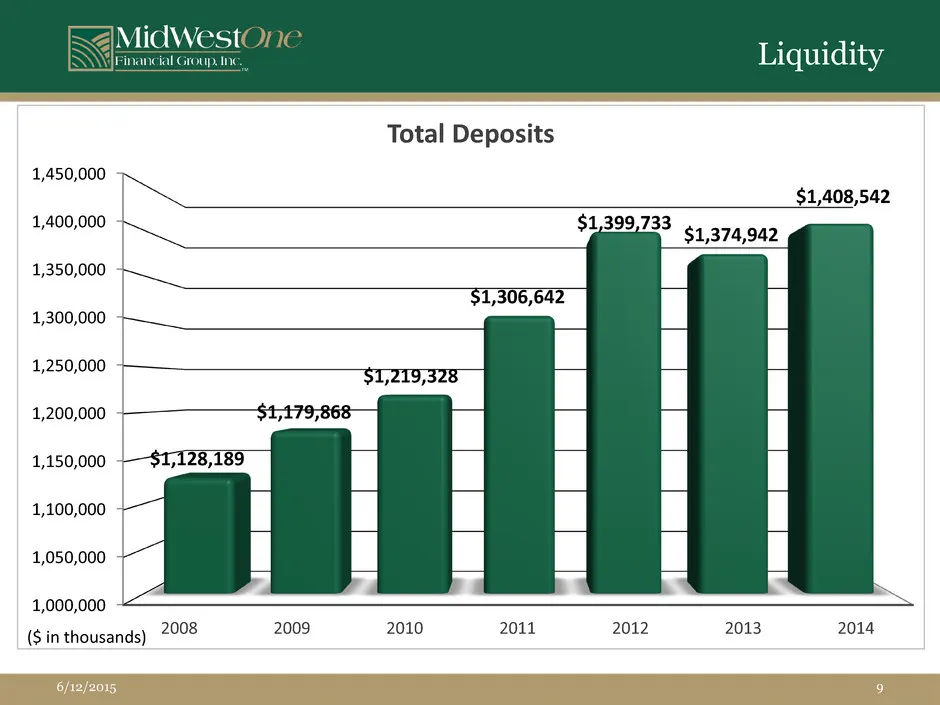
Slide 9: Liquidity: Total Deposits
lidWestOne inancial Group, Inc Liquidity Total Deposits 1,450,000 $1,408,542 1,4 ,400,000 3 s1s74902 1,350,000 $1,306,642 1,300,000 1,250,000 1,200,000 1,150,000 1,100,000 1,050,000 1,000,000 2008 2009 2010 2011 2012 2013 2014 ($ in thousands)
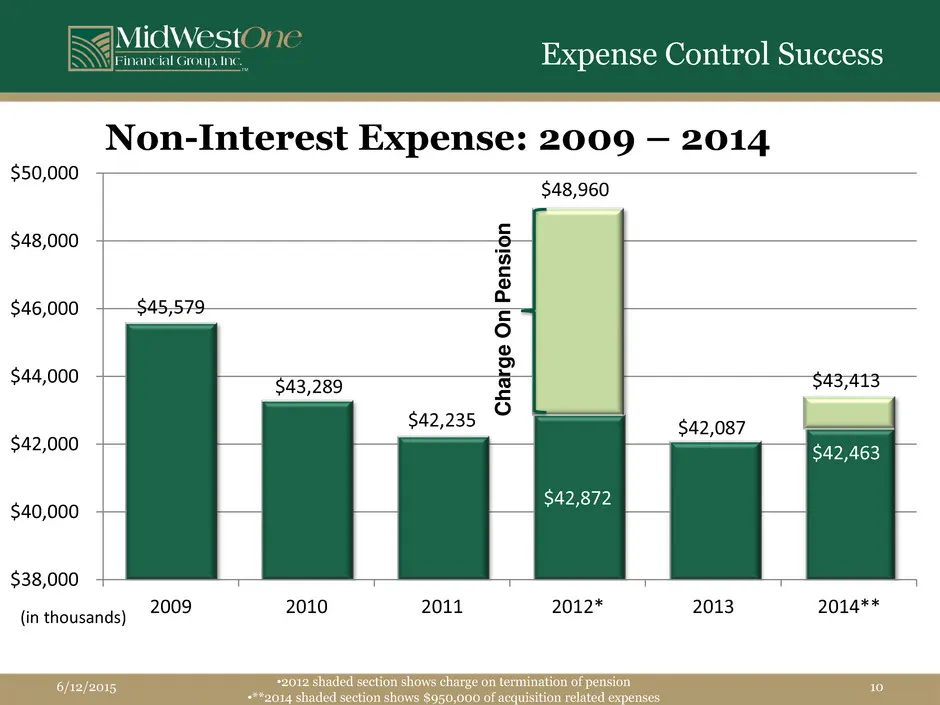
Slide 10: Expense Control Success
Expense Control Success Non-Interest Expense: 2009 — 2014 $50,000 $48,960 $48,000 $46,000 $45,579 $44,000 -~- $43,289 $43,413 49°00 $42,087 $40,000 | $38,000 4 i 4 , 2009 2010 2011 2012* 2013 2014** (in thousands) Charge On Pension uo & B N oO a
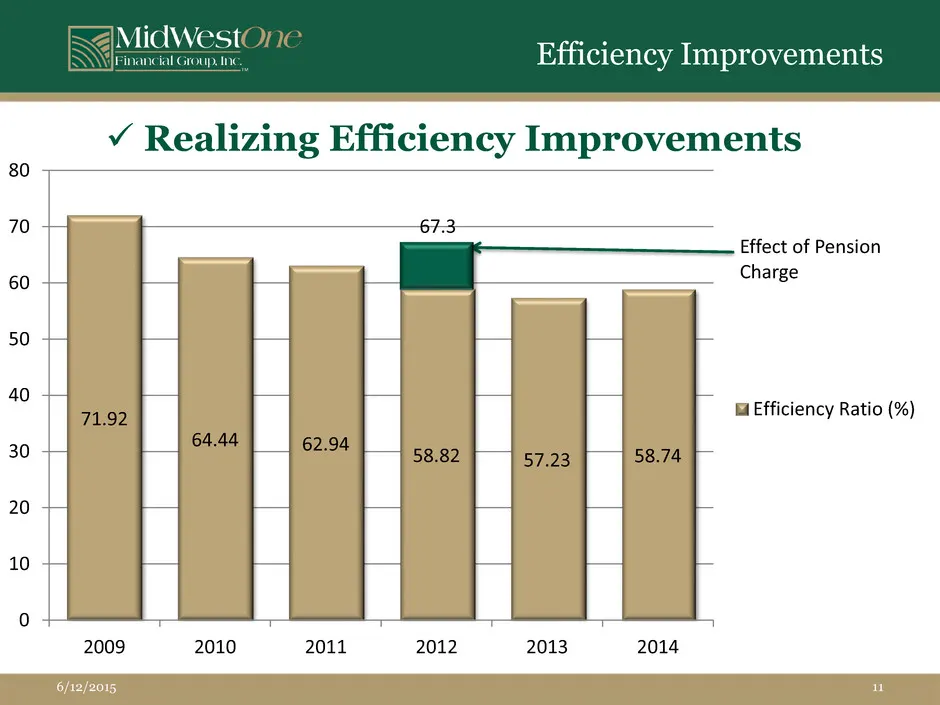
Slide 11: Efficiency Improvements
lidWestOne inancial Group, Inc Efficiency Improvements Y Realizing Efficiency Improvements 71.92 2009 64.44 2010 62.94 2011 58.82 2012 57.23 2013 58.74 2014 Effect of Pension Charge Efficiency Ratio (%)
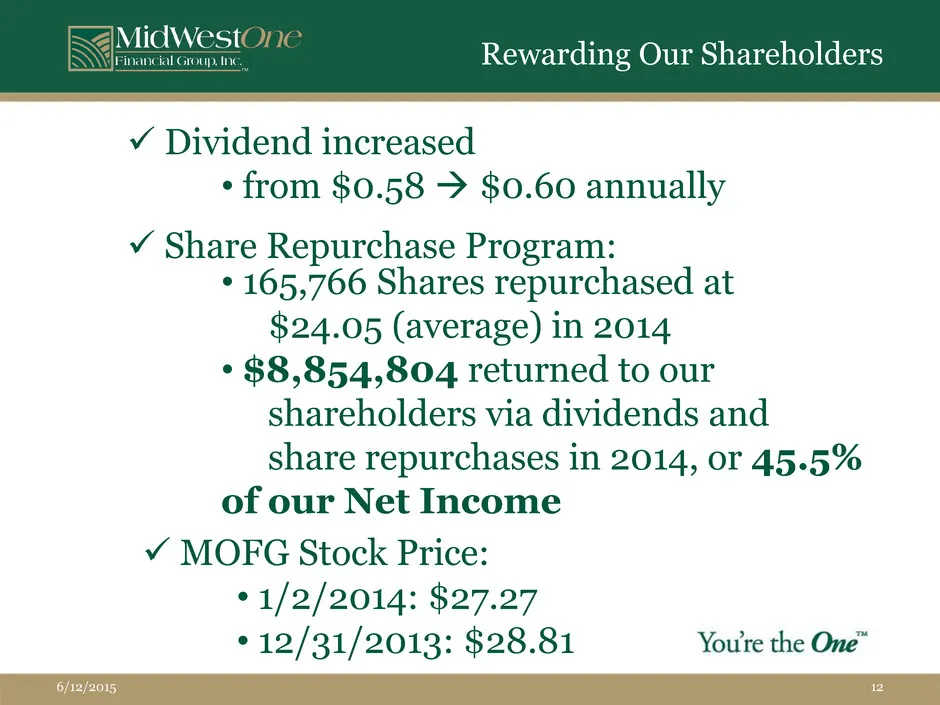
Slide 12: Rewarding Our Shareholders
Rewarding Our Shareholders Y Dividend increased * from $0.58 > $0.60 annually v Share Repurchase Program: * 165,766 Shares repurchased at $24.05 (average) in 2014 * $8,854,804 returned to our shareholders via dividends and share repurchases in 2014, or 45.5% of our Net Income ¥ MOFG Stock Price: ° 1
Slide 13: 2014 Performance
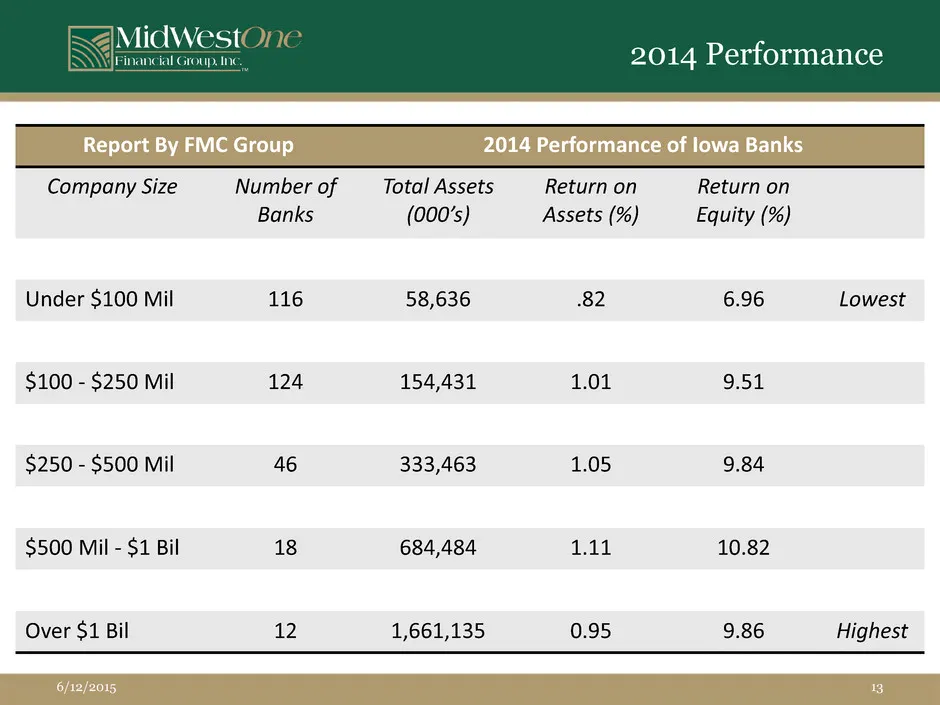
MidWestOne X 2014 Performance Company Size Under $100 Mil $100 - $250 Mil $250 - $500 Mil $500 Mil - $1 Bil Over $1 Bil Number of Banks 116 124 46 Total Assets (000’s) 58,636 154,431 333,463 684,484 1,661,135 Return on Assets (%) 82 Return on Equity (%) 6.96 Lowest 10.82 9.86 Highest
Slide 14: Why Central Bank?
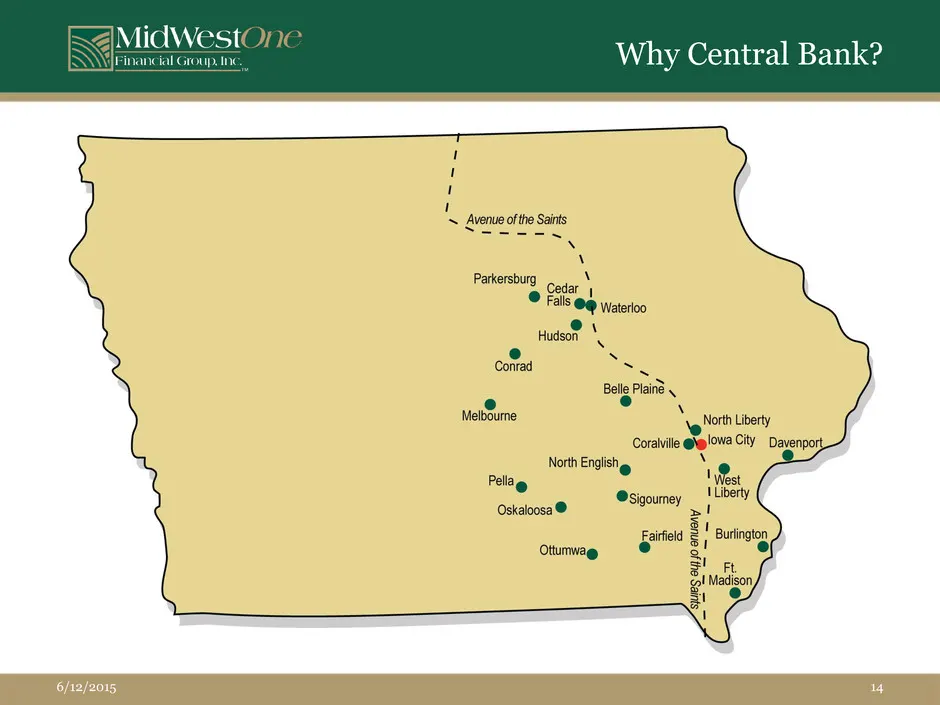
eiMidWest {Financial Group ine Why Central Bank? Patkersbud catar ° i © Fals @@ Waterco Conrad —- Belle Plaine e e Melbourne rth Liberty Coralville @rp!owa City Daven, North Engi % lorth English : Peliag, Vie en Oskaloosa ®@ rey Gites a! Burington Ottumwag @
Slide 15: Growing Capital Base
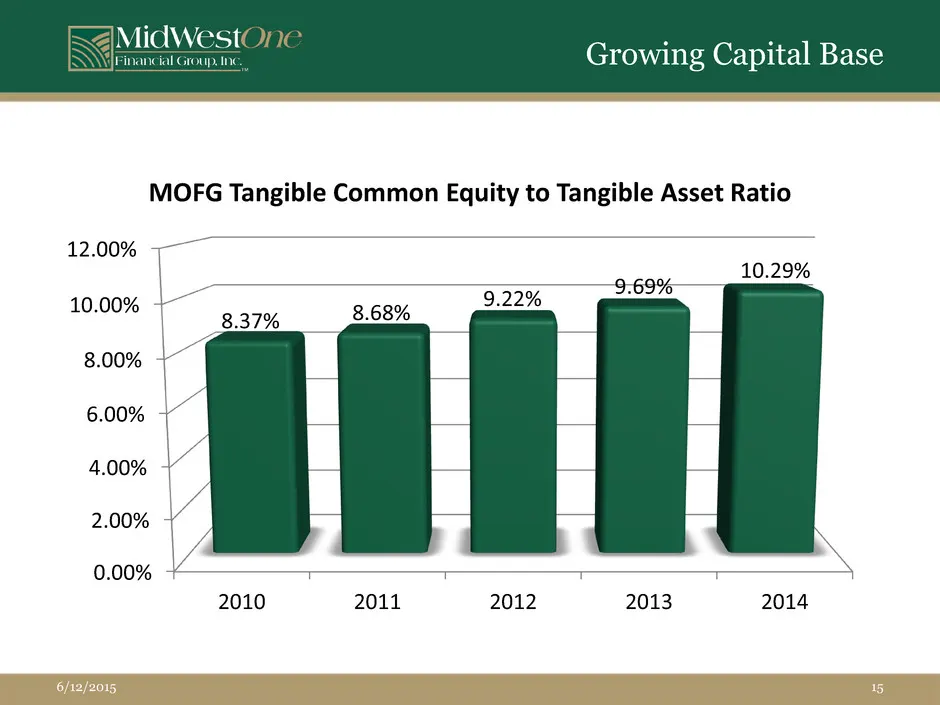
MidWestOne Growing Capital Base MOFG Tangible Common Equity to Tangible Asset Ratio 12.00% 7 | ses 10.29% 69% 10.00% 1 368% 9.22% 37% 8.00% + 6.00% /~ | 4.00% 2.00% -— — — : 0.00% + ‘ 2010 2011 2012 2013 2014
Slide 16: Company Overviews: Central Bancshares, Inc.
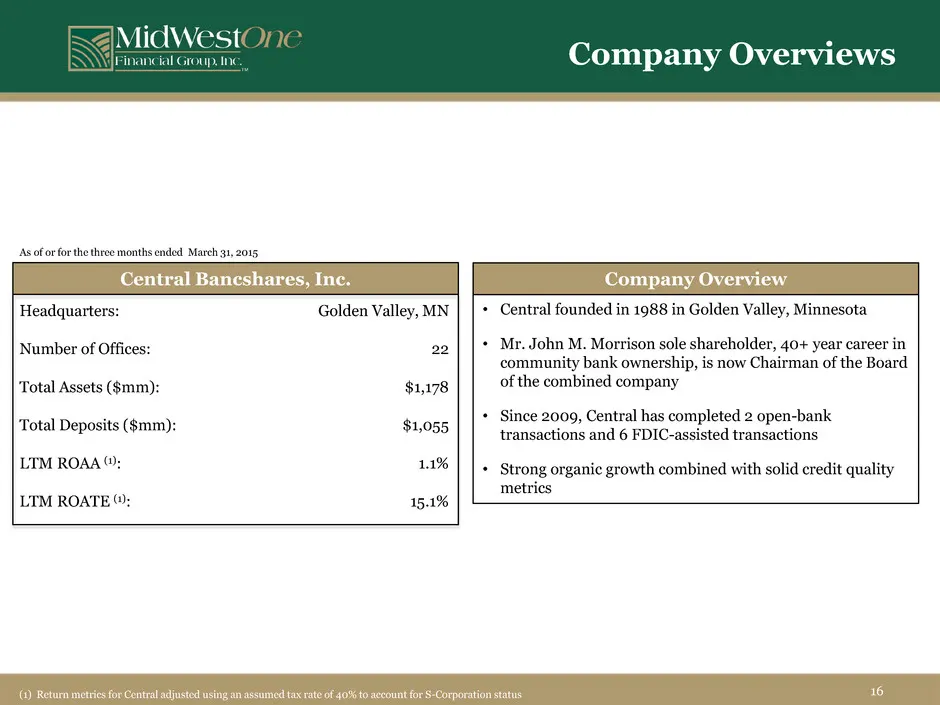
MidWest Faomne Kenn Company Overviews ‘As of or for the three months ended Match 91,2015, Central Bancshares, Inc. Company Overview Headquarters: Golden Valley, MN | | + Central founded in 1988 in Golden Valley, Minnesota Number of Offices: aa| [+ Me John: 7 Morrison sole shareholder, 40+ year caree
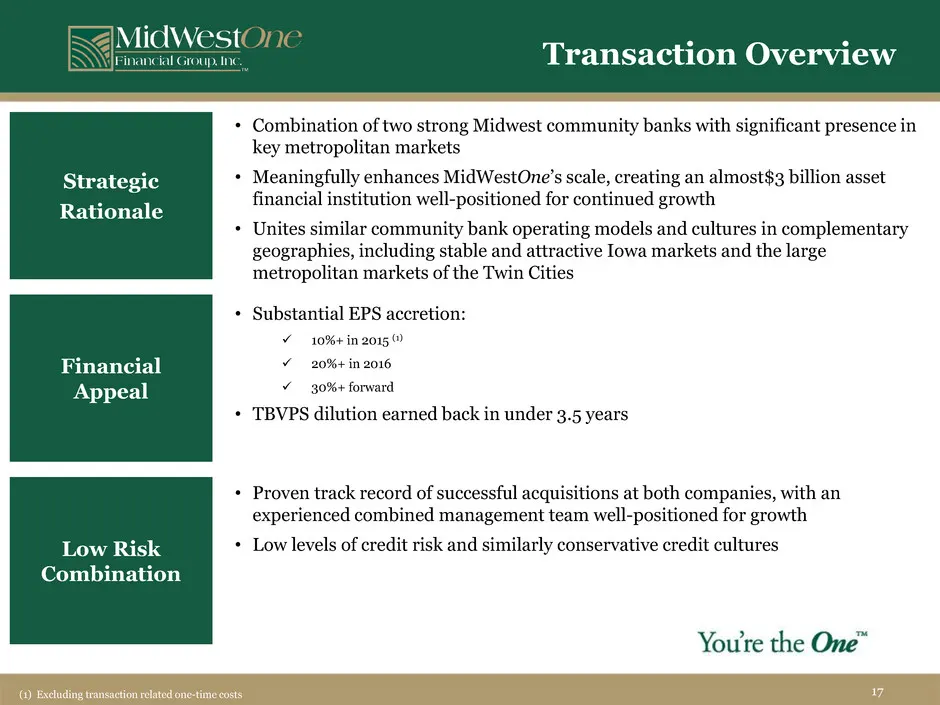
Slide 17: Transaction Overview
MidWestOne inancial Group, Inc Transaction Overview Strategic Rationale Financial Appeal Low Ris! Combination Combination of two strong Midwest community banks with significant presence in key metropolitan markets Meaningfully enhances MidWestOne’s scale, creating an almost$3 billion asset financial
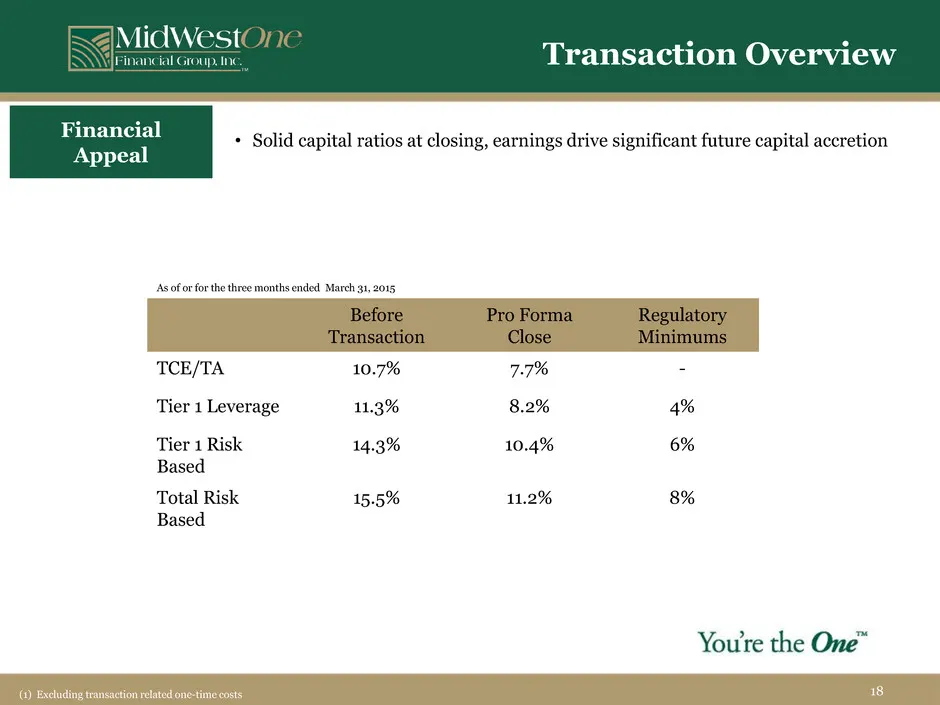
Slide 18: Transaction Overview: Financial Appeal
IwestOone N . 4 Financial Group, Inc. Transaction Overview Financial + Solid capital ratios at closing, earnings drive significant future capital accretion Appeal Asof or forthe three months ended March 31, 2015, Before Pro Forma Regulatory Transaction Close ini TCE/TA 10.7% 7.7% - Tier 1 Leverage 1
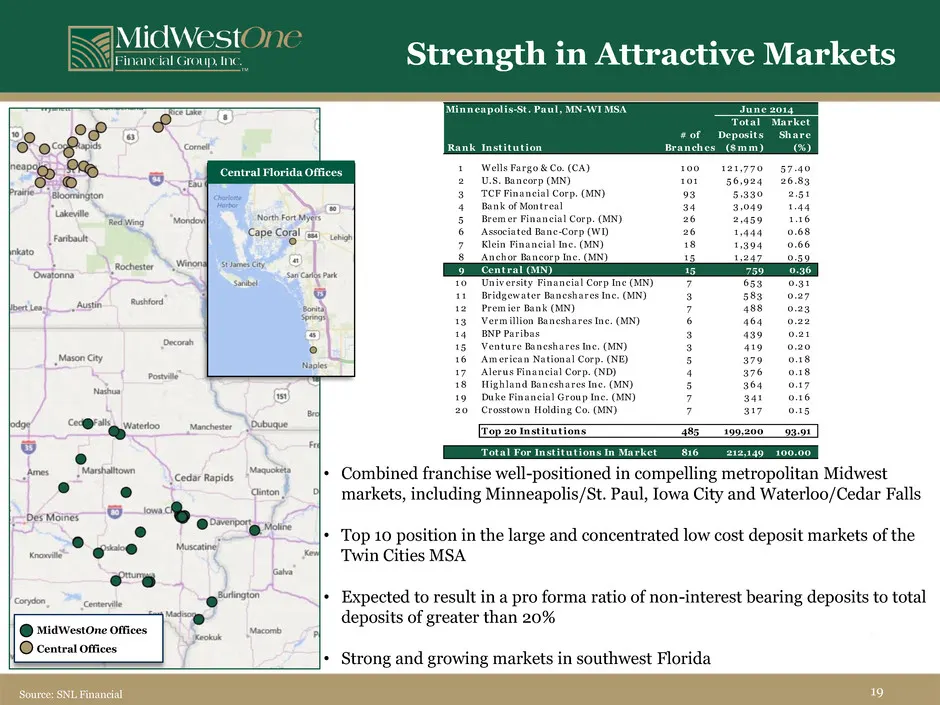
Slide 19: Combined franchise in compelling markets
Cape Coral reece Kl Anchor Bancorp ne. (MND anes! Corp ne), 1 Bri rneshares Inc (MN) 12° Premier Bank (MN) 13 Vermillion Baneshares Ine. (MN) 14 BNP Paribas 7 Fi «xp 18 Highland Bancshares Ine, (MN) 19 Duke Financial Group Ine. (MN) 20° Crosstown Holding Co, (MN) Combined franchise well-positioned i
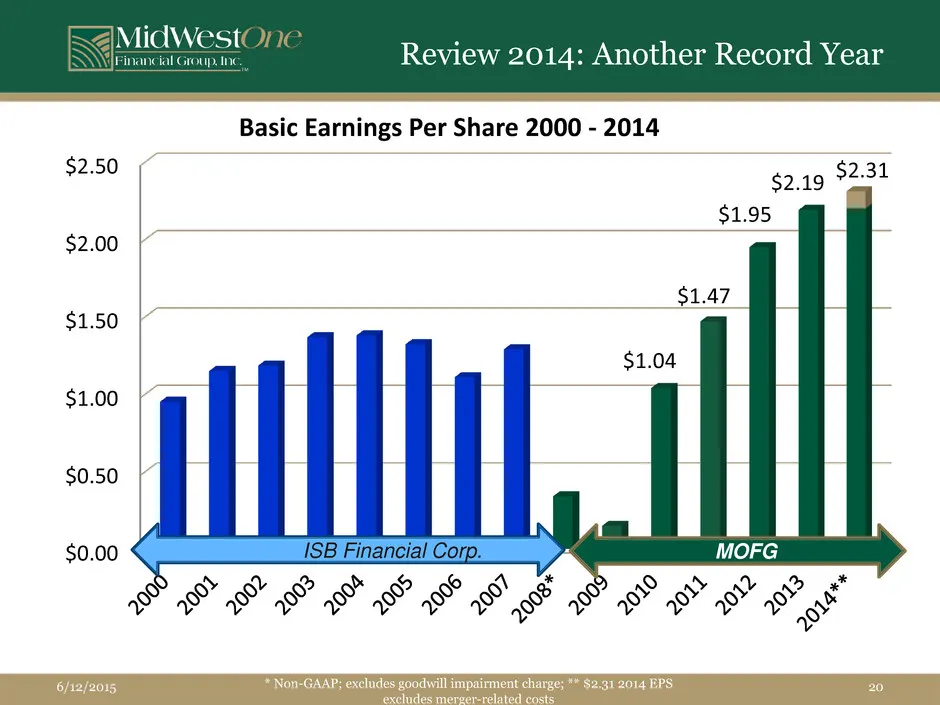
Slide 20: Review 2014: Basic Earnings Per Share 2000-2014
inancial Group, Inc lestOne Review 2014: Another Record Year $2.50 $2.00 $1.50 $1.00 Basic Earnings Per Share 2000 - 2014 $2.19 $2.31
Slide 21: Our Operating Principles
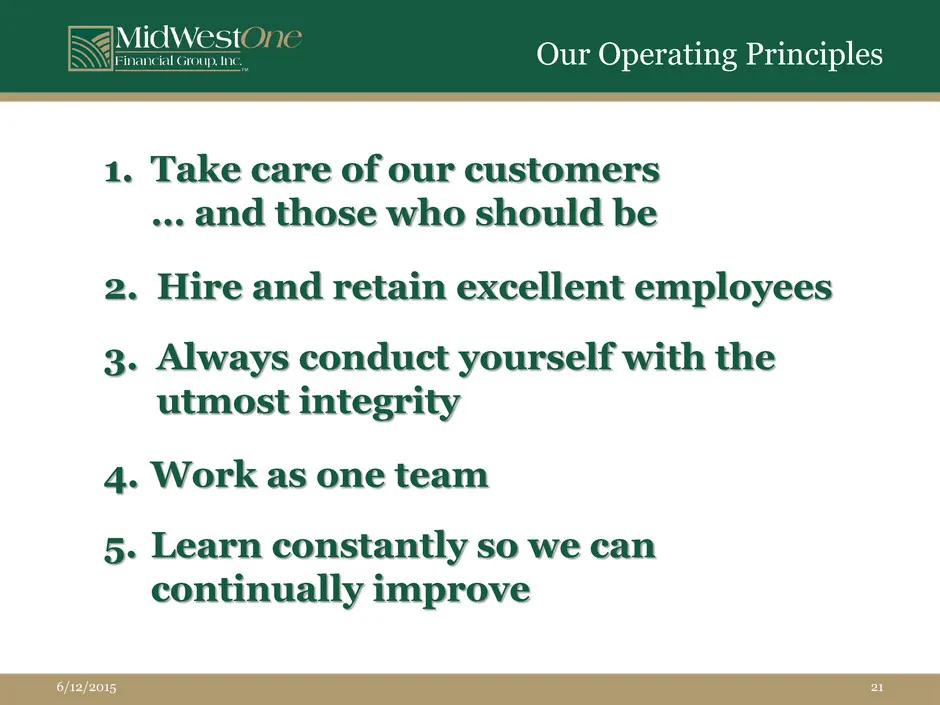
we Our Operating Principles Financial Group. Inc 1. Take care of our customers ... and those who should be 2. Hire and retain excellent employees 3. Always conduct yourself with the utmost integrity 4. Work as one team 5. Learn constantly so we can continually improve
Slide 22: Executive Management Team
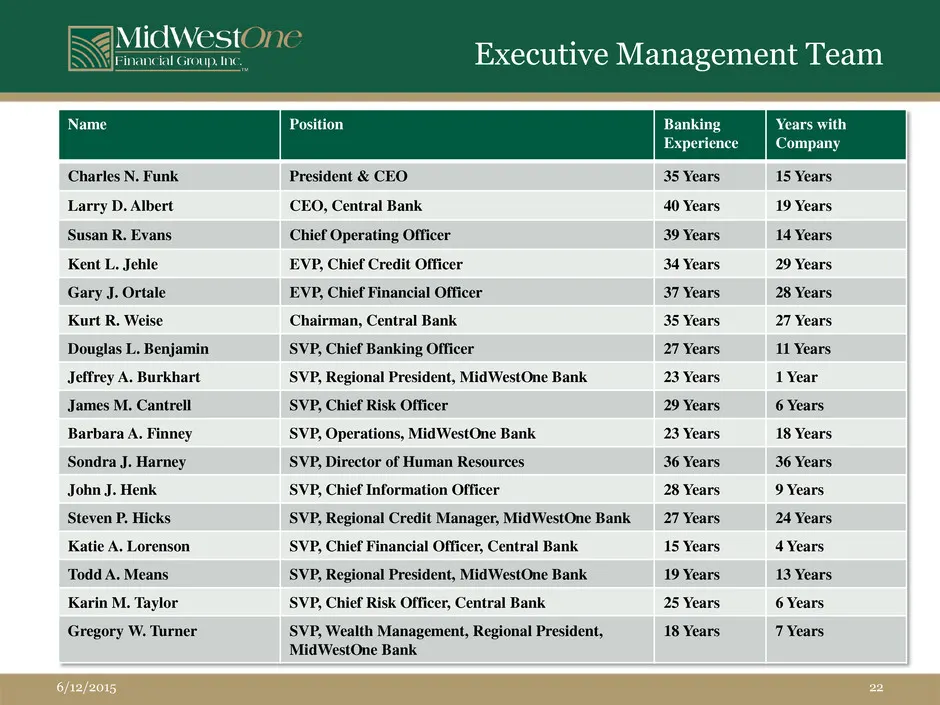
festOne Executive Management Team Comp: Charles N. Funk President & CEO 35 Years 15 Years Larry D. Albert , Central Bank 40 Years 19 Years Susan R. Evans Chief Operating Officer 39 Years 14 Years Kent L. Jehle EVP, Chief Credit Officer 34 Years 29 Years Gary J. Ortale EVP, Chief Financial Officer 37
Slide 23: Employee Engagement Awards
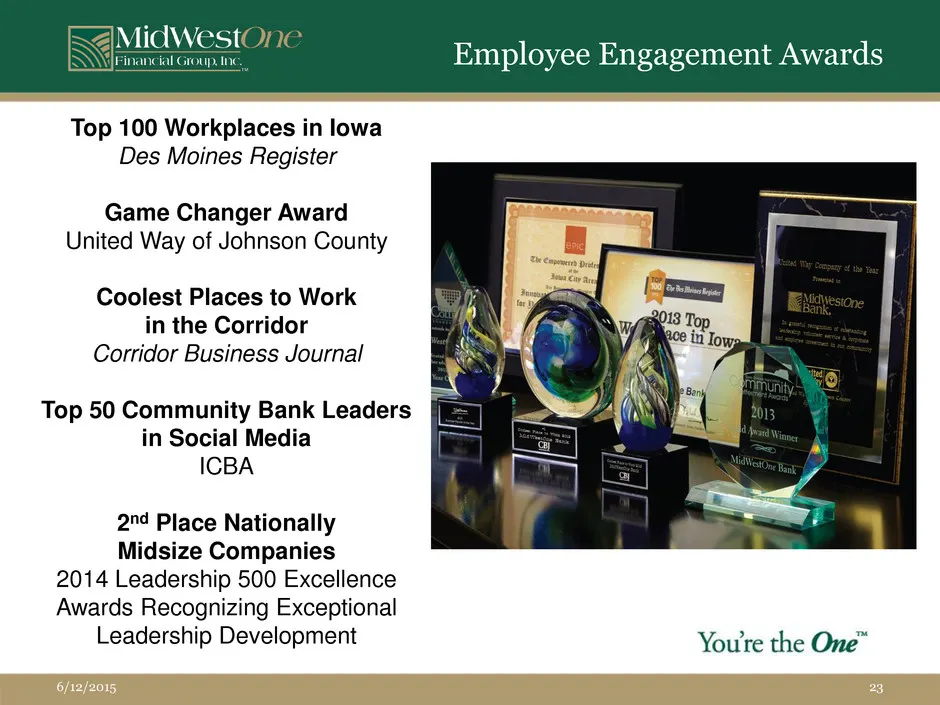
Employee Engagement Awards Top 100 Workplaces in lowa Des Moines Register Game Changer Award United Way of Johnson County Coolest Places to Work in the Corridor Corridor Business Journal Top 50 Community Bank Leaders i in Social Media ICBA 2"d Place Nationally Midsize Companies 2014 Leadership 500 E
Slide 24: Serving Our Communities
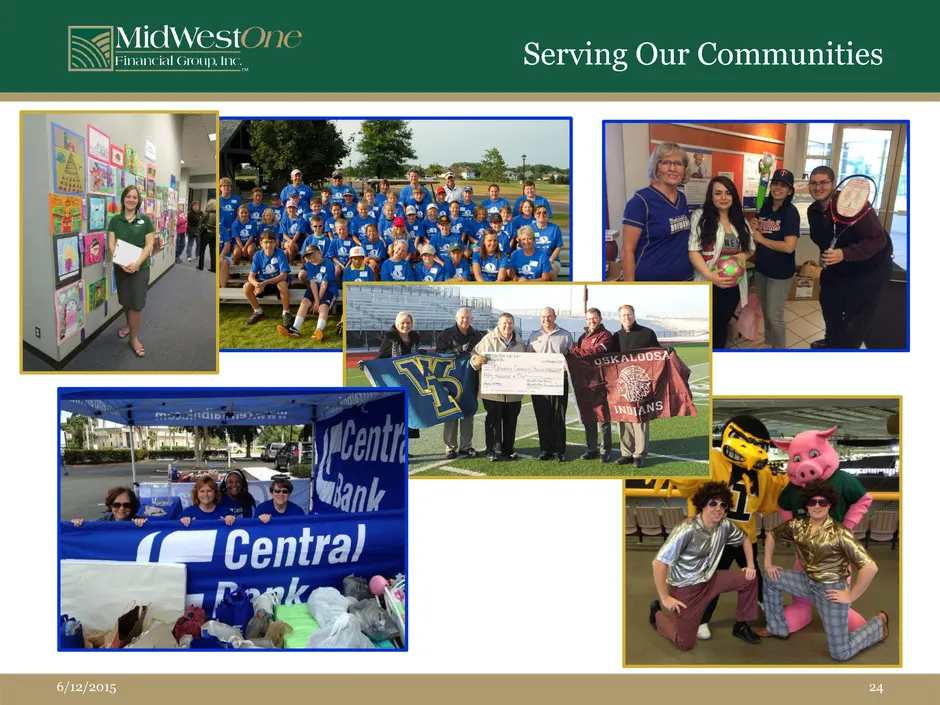
MidWest , ae FAnancil Group ine Serving Our Communities 6/12/2015 24
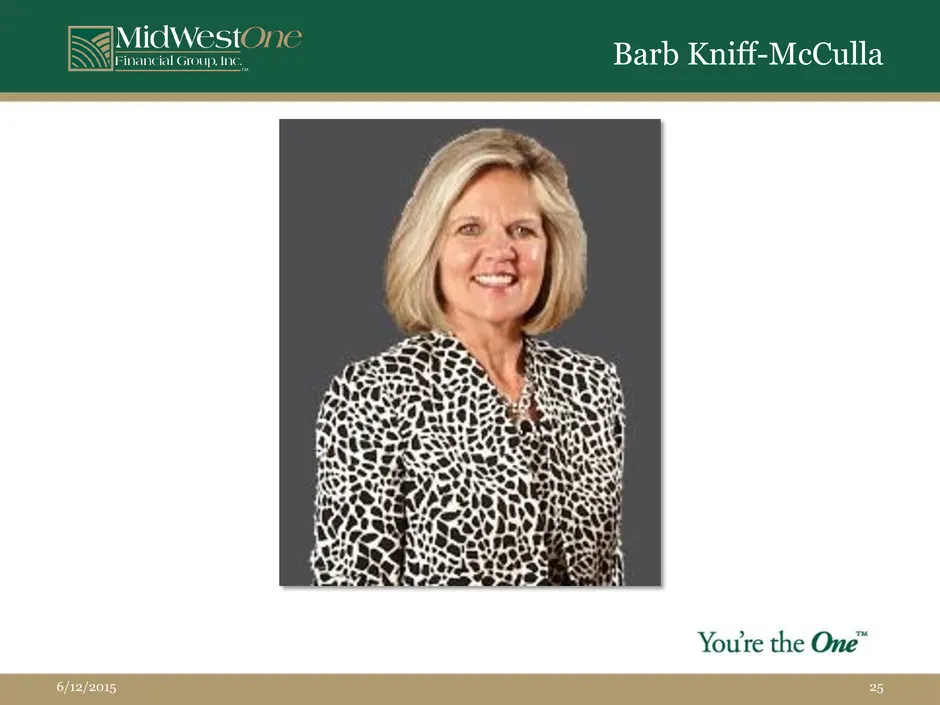
Slide 25: S Rp 1S) 3) = ft ES i=} oa eS -Q fidWestOne inancial Group,
3 S Rp 1S) 3) = ft ES i=} 4 oa eS -Q fidWestOne inancial Group, Inc You're the One’
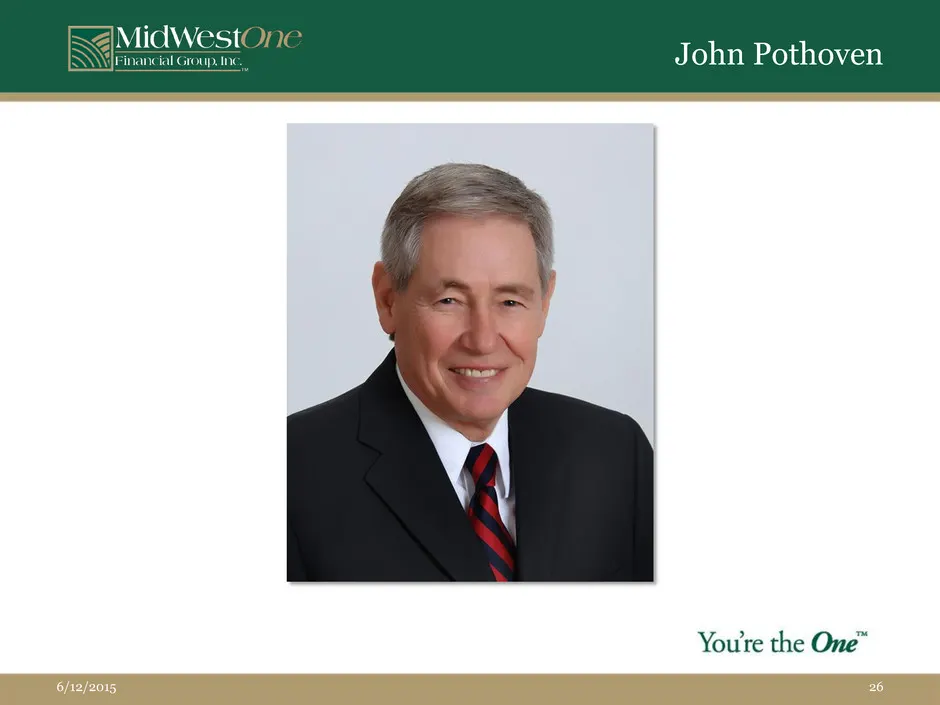
Slide 26: John Pothoven
John Pothoven You're the One™
Slide 27: Thank you for joining us.
Thank you for joining us. MidWestOne Financial Group, Inc. 6/12/2015
Source: SEC EDGAR · 8-K filed Jun 12, 2015
More decks from MidWestOne Financial Group Inc
 Q3 2025 Earnings Presentation18 slides · Oct 23, 2025
 Merger or Acquisition (October 2025)20 slides · Oct 23, 2025
 Q2 2025 Earnings Presentation32 slides · Jul 25, 2025
 Q2 2025 Earnings Presentation18 slides · Jul 25, 2025
 Investor Presentation (April 2025)31 slides · Apr 28, 2025
 Q1 2025 Earnings Presentation17 slides · Apr 25, 2025