Tabcorp Holdings Limited · ASX:TAH
Tabcorp — FY2018 Earnings Presentation
39 slides from Tabcorp's earnings presentation, Aug 8, 2018
Slide 1: 2017/18 Full Year Results Presentation
TABCORP HOLDINGS LIMITED 2017/18 FULL YEAR RESULTS PRESENTATION 8 AUGUST 2018 ABN 66 063 780 709
Slide 2: Table of Contents
TABLE OF CONTENTS FY18 Overview 3-4 Group Results 6-7 Integration Update 9 - 10 Group Results - Pro-forma 12 - 14 Divisional Results 16 - 22 Capital Expenditure 24 Capital Management 26 Regulatory Update 28 Conclusion 30 Appendices 32 - 37 2
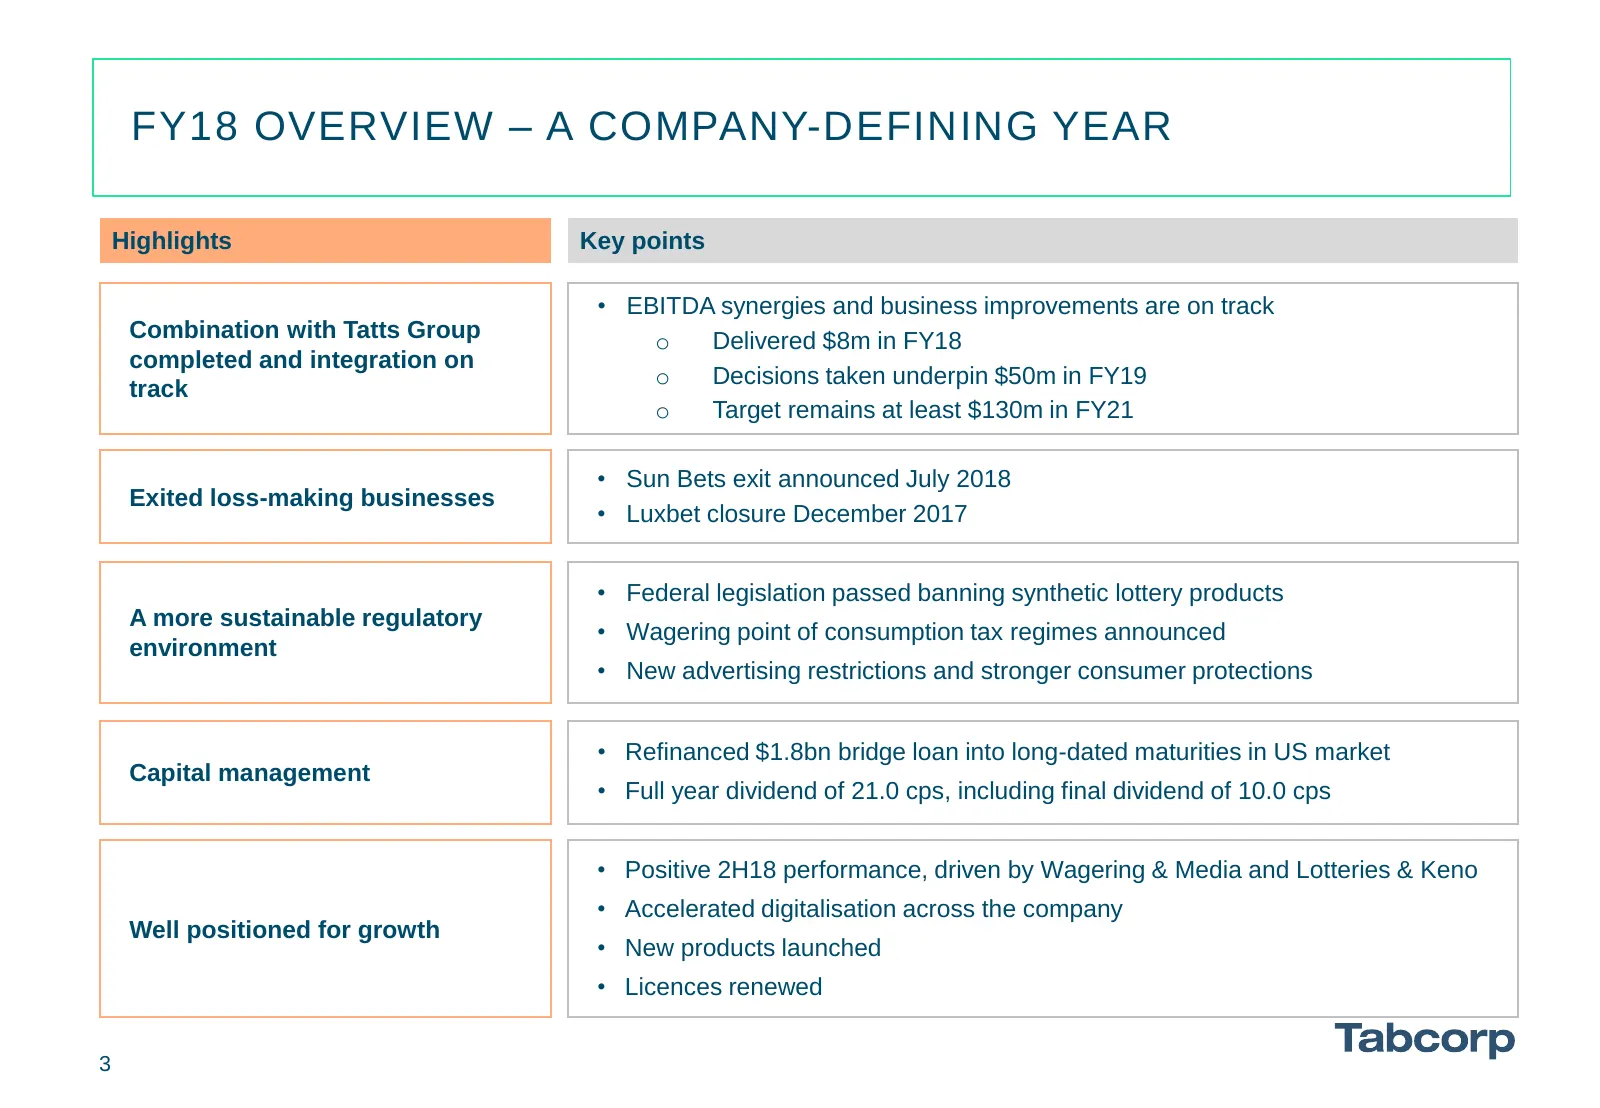
Slide 3: FY18 Overview – A Company-Defining Year
FY18 OVERVIEW – A COMPANY-DEFINING YEAR Highlights Key points • EBITDA synergies and business improvements are on track Combination with Tatts Group o Delivered $8m in FY18 completed and integration on o Decisions taken underpin $50m in FY19 track o Target remains at least $130m in FY21 • Sun Bets e
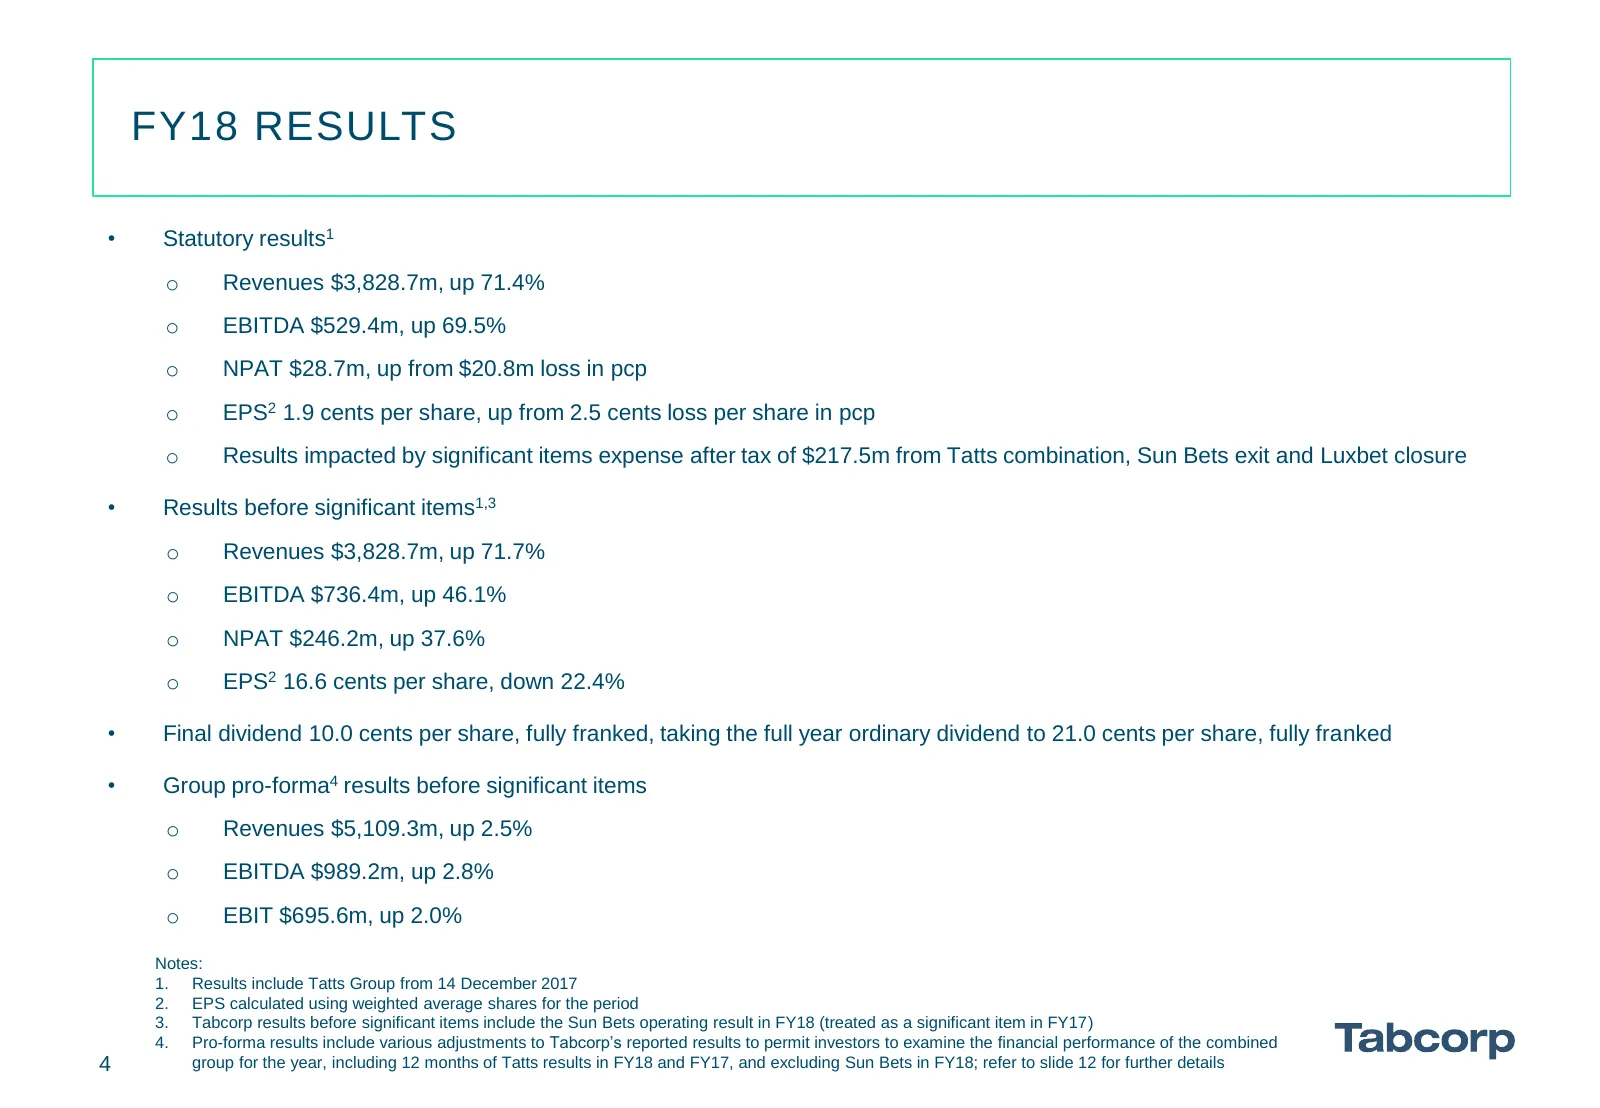
Slide 4: FY18 Results
FY18 RESULTS • Statutory results1 o Revenues $3,828.7m, up 71.4% o EBITDA $529.4m, up 69.5% o NPAT $28.7m, up from $20.8m loss in pcp o EPS2 1.9 cents per share, up from 2.5 cents loss per share in pcp o Results impacted by significant items expense after tax of $217.5m from Tatts combination, Sun B
Slide 5: Table of Contents
TABLE OF CONTENTS FY18 Overview 3-4 Group Results 6-7 Integration Update 9 - 10 Group Results - Pro-forma 12 - 14 Divisional Results 16 - 22 Capital Expenditure 24 Capital Management 26 Regulatory Update 28 Conclusion 30 Appendices 32 - 37 5
Slide 6: Group Results
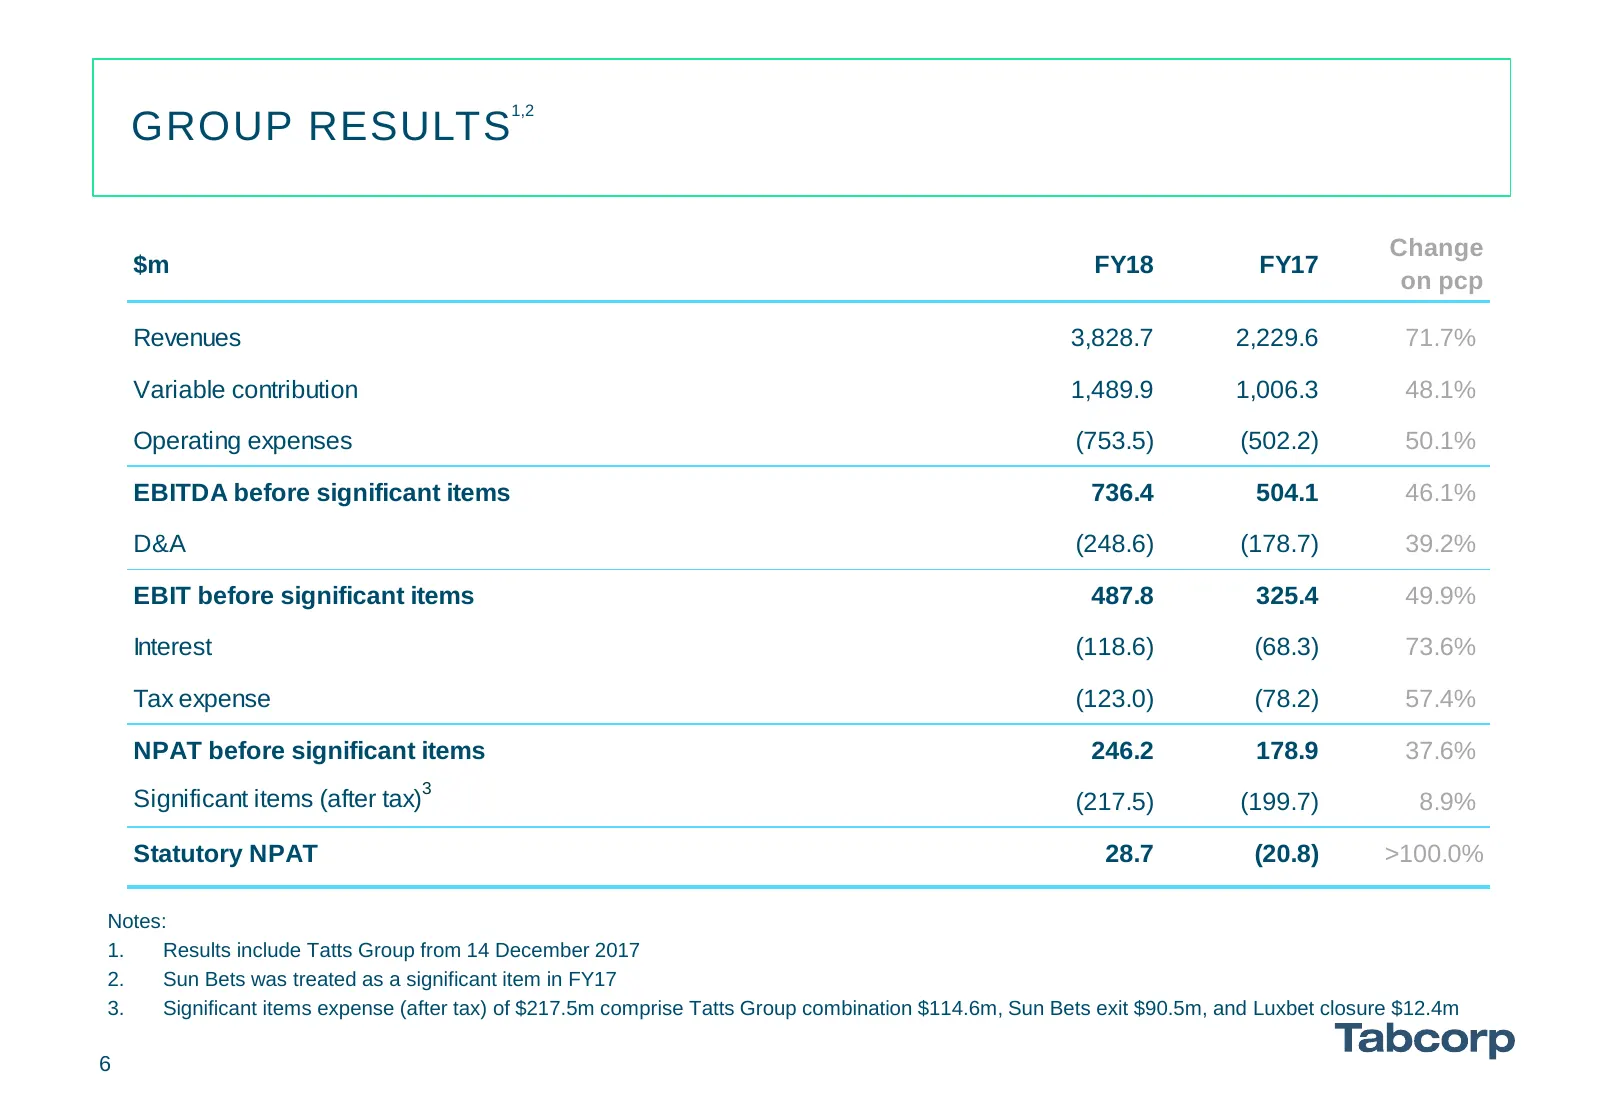
1,2 GROUP RESULTS Change $m FY18 FY17 on pcp Revenues 3,828.7 2,229.6 71.7% Variable contribution 1,489.9 1,006.3 48.1% Operating expenses (753.5) (502.2) 50.1% EBITDA before significant items 736.4 504.1 46.1% D&A (248.6) (178.7) 39.2% EBIT before significant items 487.8 325.4 49.9% Interest (118.6
Slide 7: Business Results
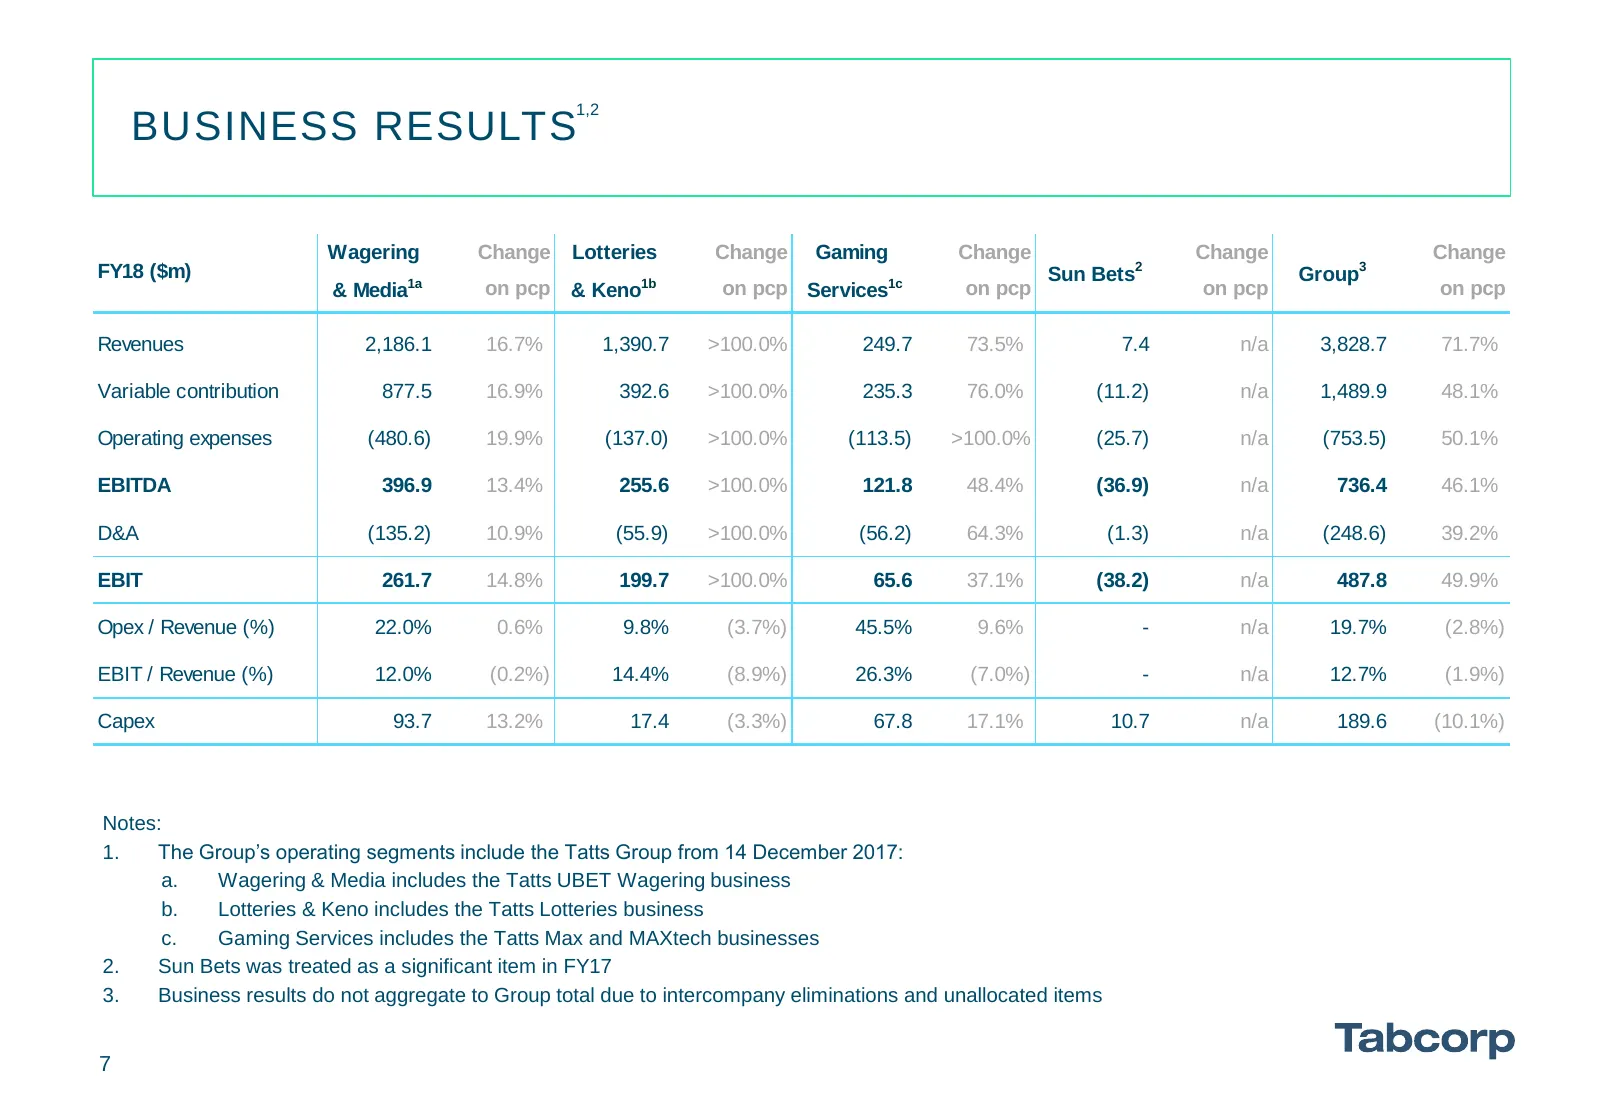
1,2 BUSINESS RESULTS Wagering Change Lotteries Change Gaming Change Change Change FY18 ($m) Sun Bets2 Group3 & Media1a on pcp & Keno1b on pcp Services1c on pcp on pcp on pcp Revenues 2,186.1 16.7% 1,390.7 >100.0% 249.7 73.5% 7.4 n/a 3,828.7 71.7% Variable contribution 877.5 16.9% 392.6 >100.0% 235.3
Slide 8: Table of Contents
TABLE OF CONTENTS FY18 Overview 3-4 Group Results 6-7 Integration Update 9 - 10 Group Results - Pro-forma 12 - 14 Divisional Results 16 - 22 Capital Expenditure 24 Capital Management 26 Regulatory Update 28 Conclusion 30 Appendices 32 - 37 8
Slide 9: Integration on Track
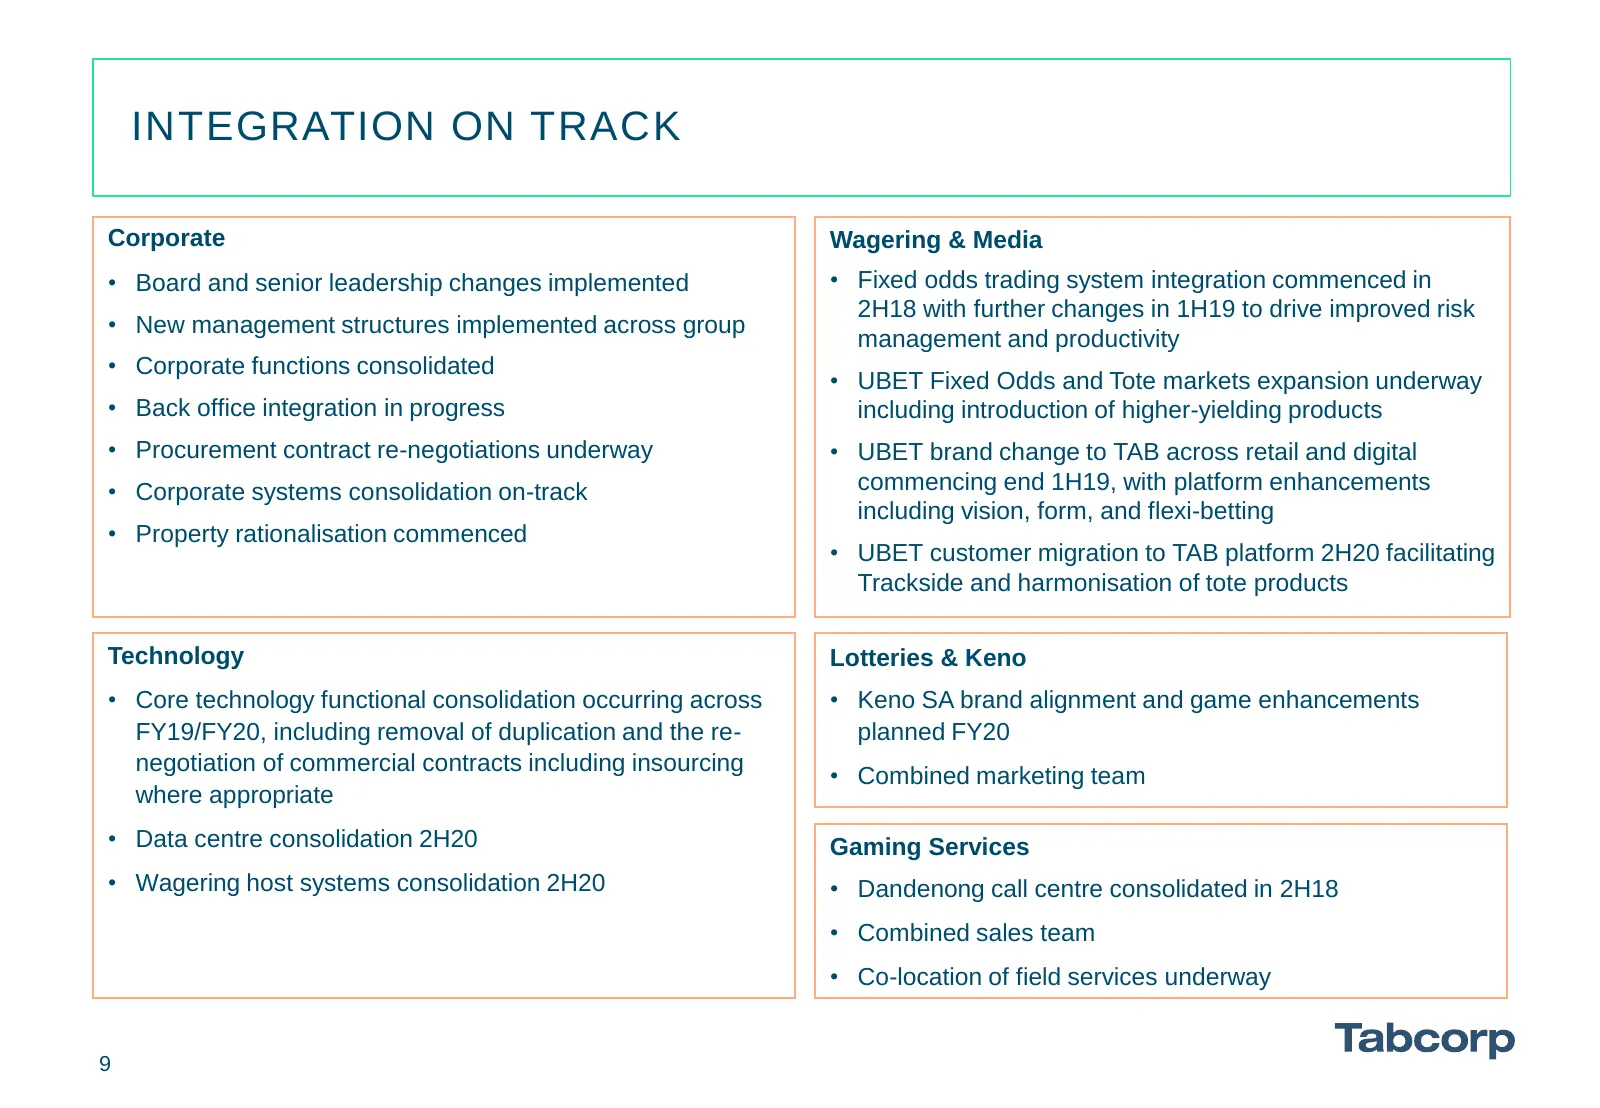
INTEGRATION ON TRACK Corporate Wagering & Media • Board and senior leadership changes implemented • Fixed odds trading system integration commenced in 2H18 with further changes in 1H19 to drive improved risk • New management structures implemented across group management and productivity • Corporate
Slide 10: Synergies & Business Improvements
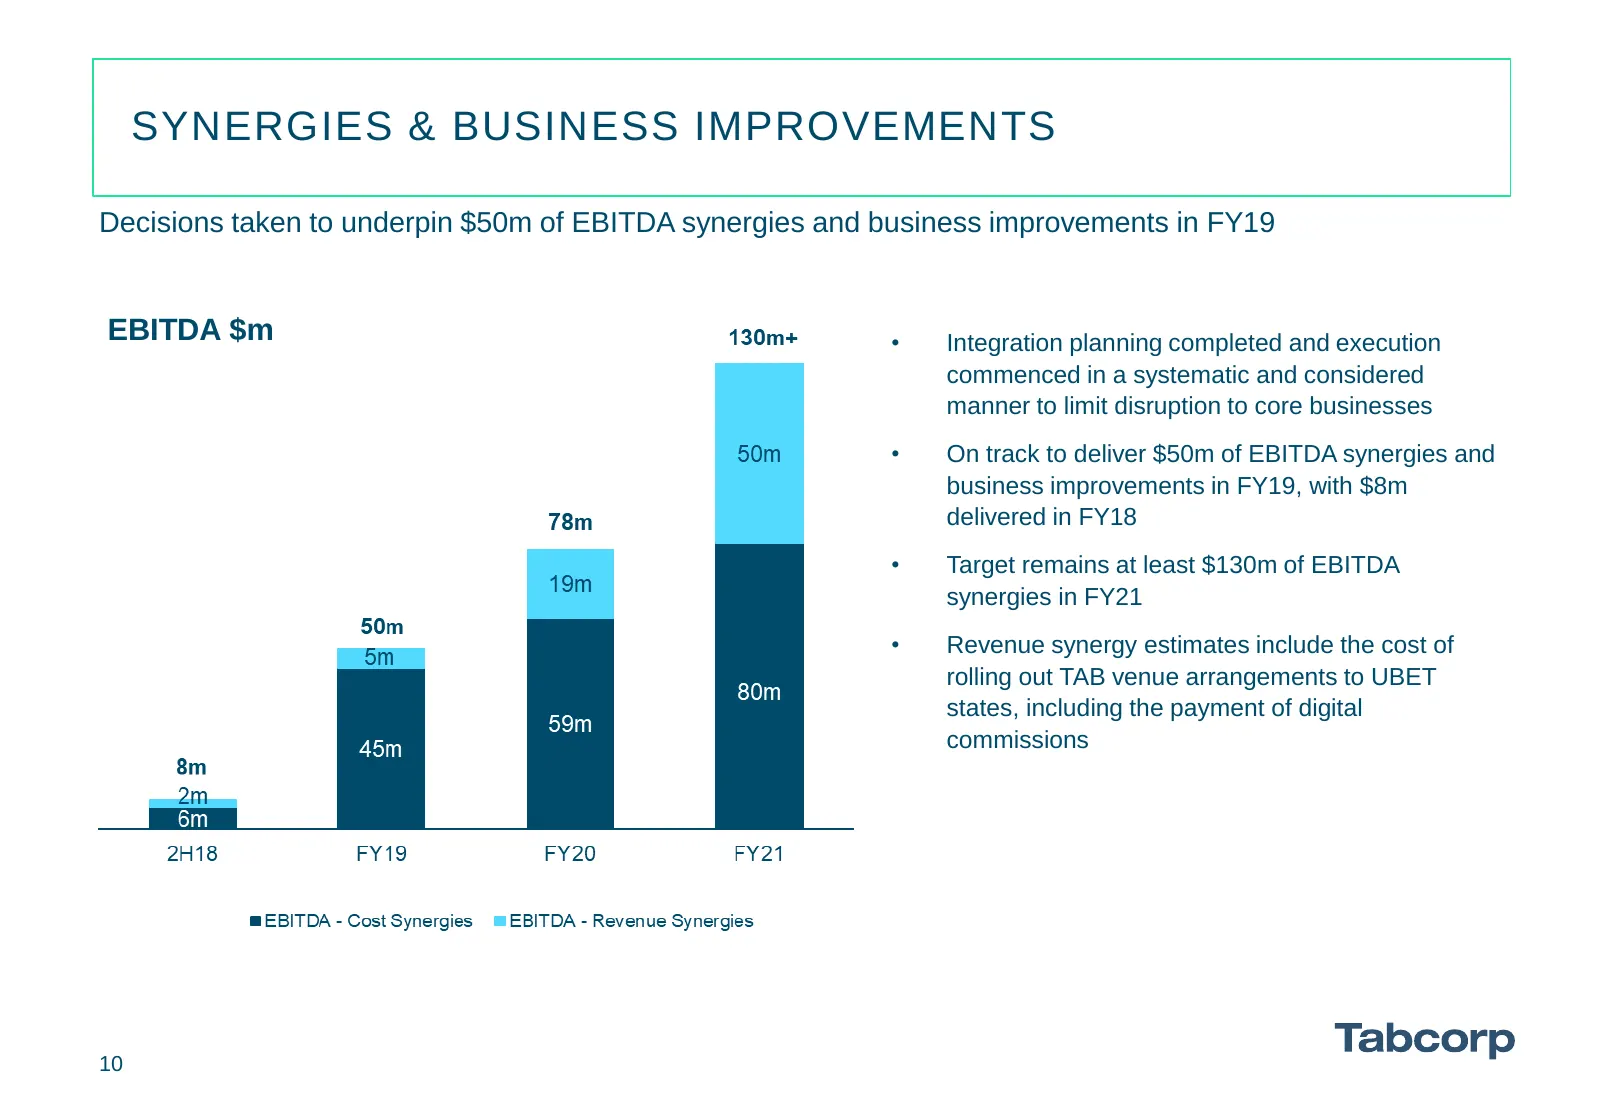
SYNERGIES & BUSINESS IMPROVEMENTS Decisions taken to underpin $50m of EBITDA synergies and business improvements in FY19 EBITDA $m • Integration planning completed and execution commenced in a systematic and considered manner to limit disruption to core businesses • On track to deliver $50m of EBITD
Slide 11: Table of Contents
TABLE OF CONTENTS FY18 Overview 3-4 Group Results 6-7 Integration Update 9 - 10 Group Results - Pro-forma 12 - 14 Divisional Results 16 - 22 Capital Expenditure 24 Capital Management 26 Regulatory Update 28 Conclusion 30 Appendices 32 - 37 11
Slide 12: Group Results – Reconciliation to Pro-forma
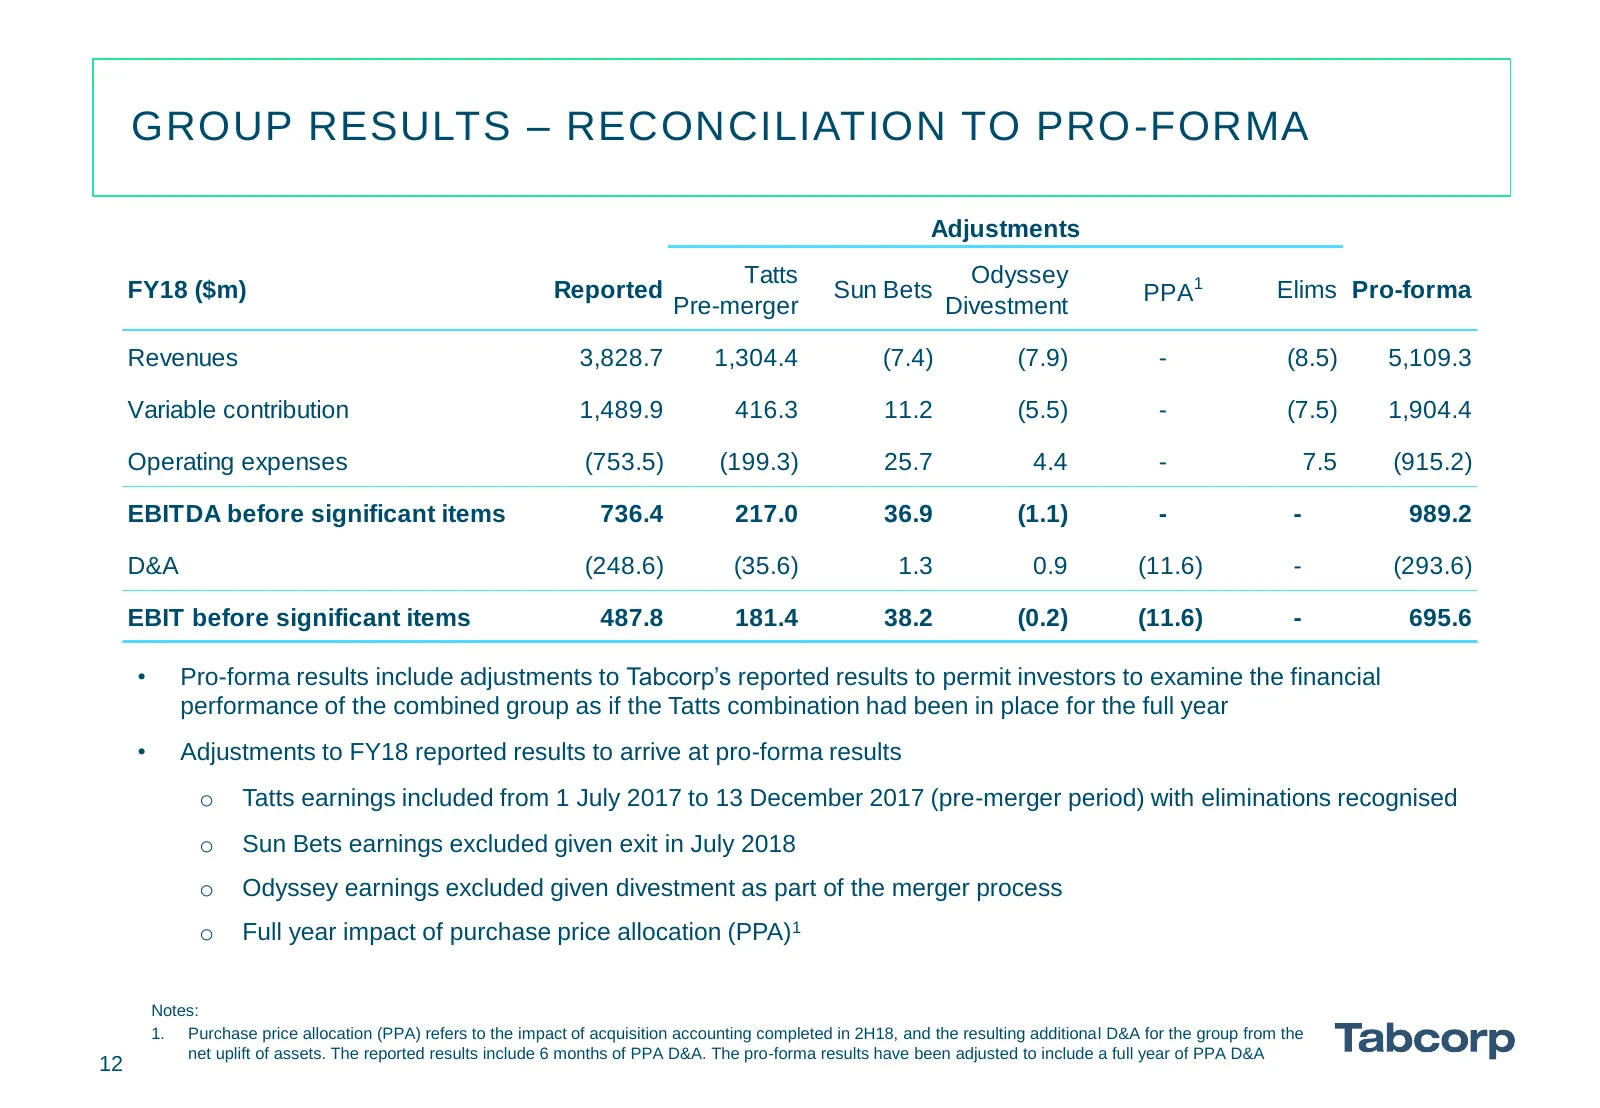
GROUP RESULTS – RECONCILIATION TO PRO-FORMA Adjustments Tatts Odyssey FY18 ($m) Reported Sun Bets PPA1 Elims Pro-forma Pre-merger Divestment Revenues 3,828.7 1,304.4 (7.4) (7.9) - (8.5) 5,109.3 Variable contribution 1,489.9 416.3 11.2 (5.5) - (7.5) 1,904.4 Operating expenses (753.5) (199.3) 25.7 4.4
Slide 13: Group Results (Pro-forma)
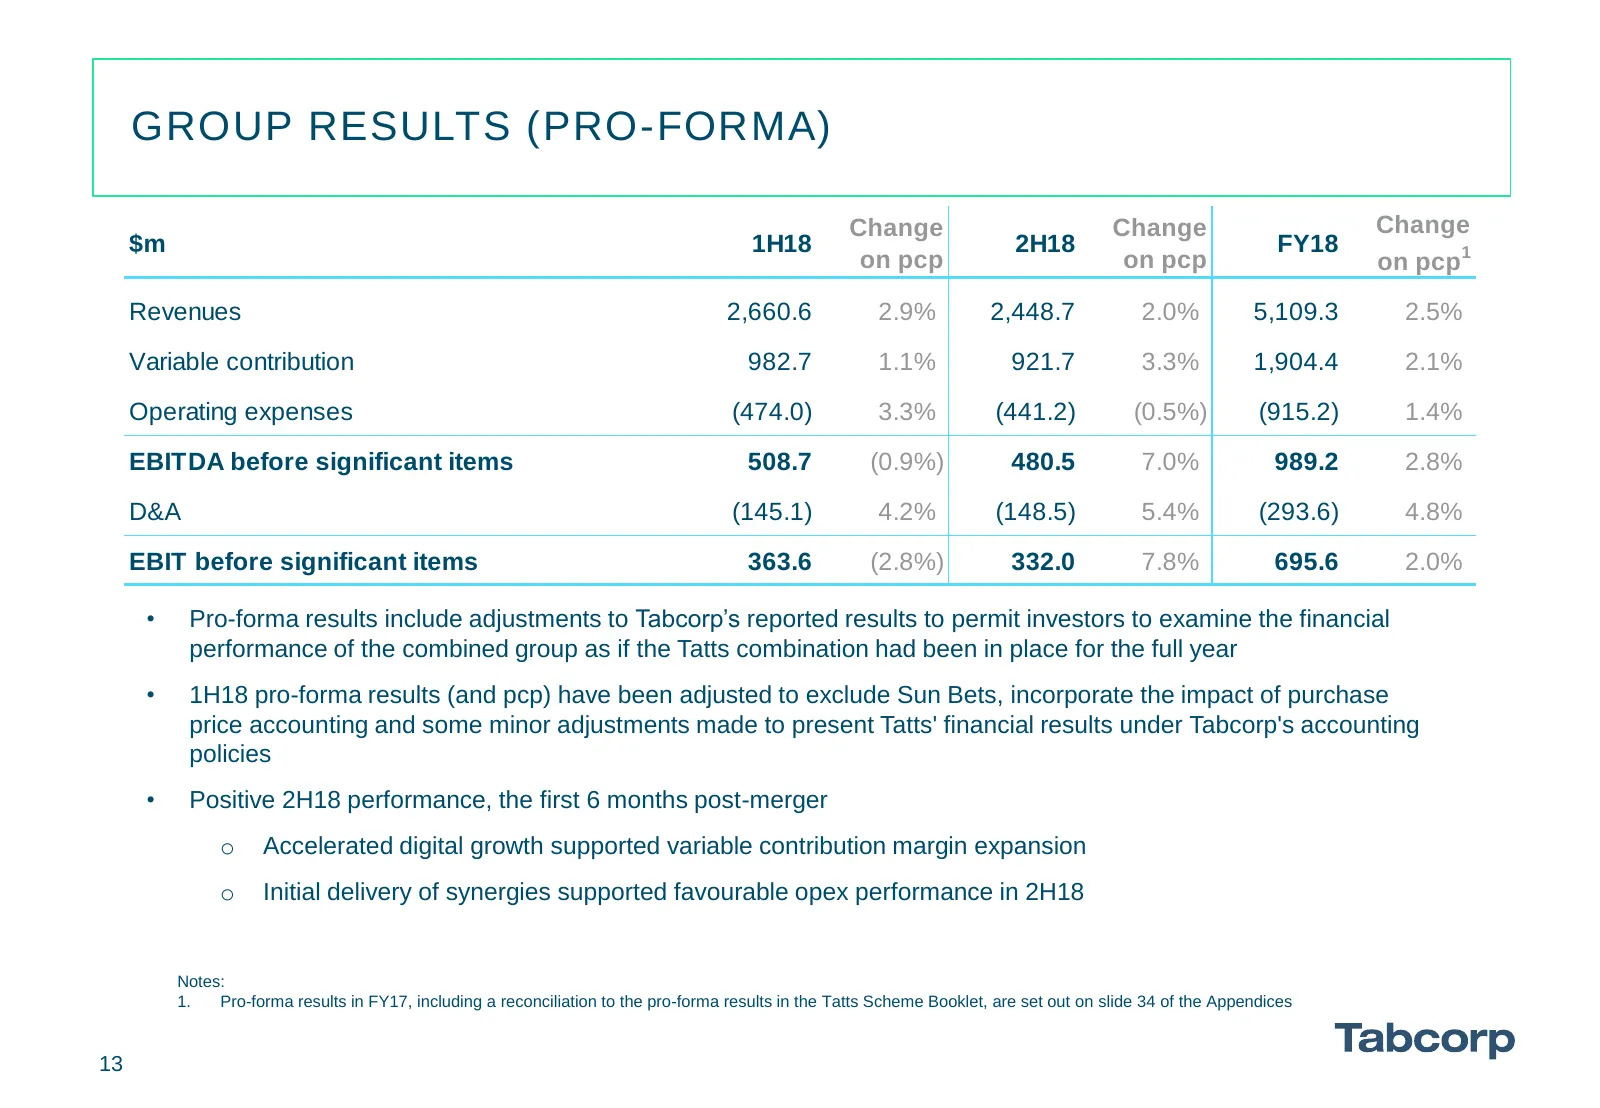
GROUP RESULTS (PRO-FORMA) Change Change Change $m 1H18 2H18 FY18 on pcp on pcp on pcp1 Revenues 2,660.6 2.9% 2,448.7 2.0% 5,109.3 2.5% Variable contribution 982.7 1.1% 921.7 3.3% 1,904.4 2.1% Operating expenses (474.0) 3.3% (441.2) (0.5%) (915.2) 1.4% EBITDA before significant items 508.7 (0.9%) 480
Slide 14: Business Results (Pro-forma)
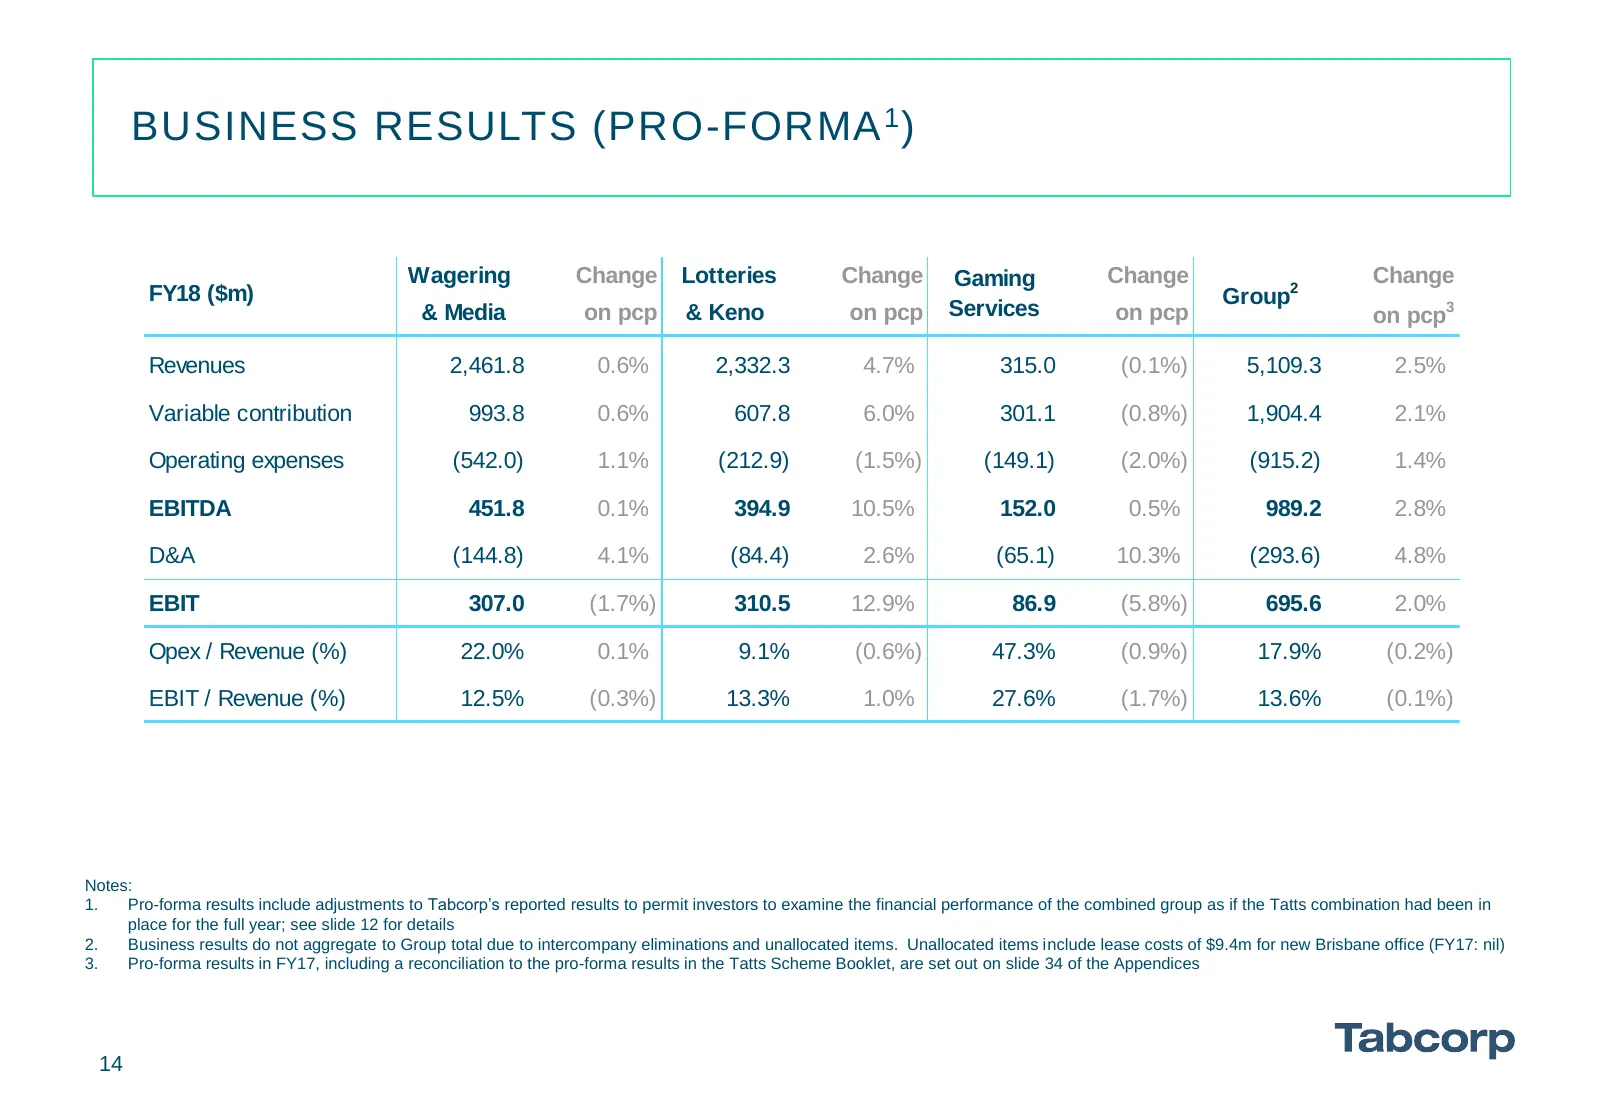
BUSINESS RESULTS (PRO-FORMA 1 ) Wagering Change Lotteries Change Gaming Change Change FY18 ($m) Group2 & Media on pcp & Keno on pcp Services on pcp on pcp3 Revenues 2,461.8 0.6% 2,332.3 4.7% 315.0 (0.1%) 5,109.3 2.5% Variable contribution 993.8 0.6% 607.8 6.0% 301.1 (0.8%) 1,904.4 2.1% Operating exp
Slide 15: Table of Contents
TABLE OF CONTENTS FY18 Overview 3-4 Group Results 6-7 Integration Update 9 - 10 Group Results - Pro-forma 12 - 14 Divisional Results 16 - 22 Capital Expenditure 24 Capital Management 26 Regulatory Update 28 Conclusion 30 Appendices 32 - 37 15
Slide 16: Wagering & Media (Pro-forma)
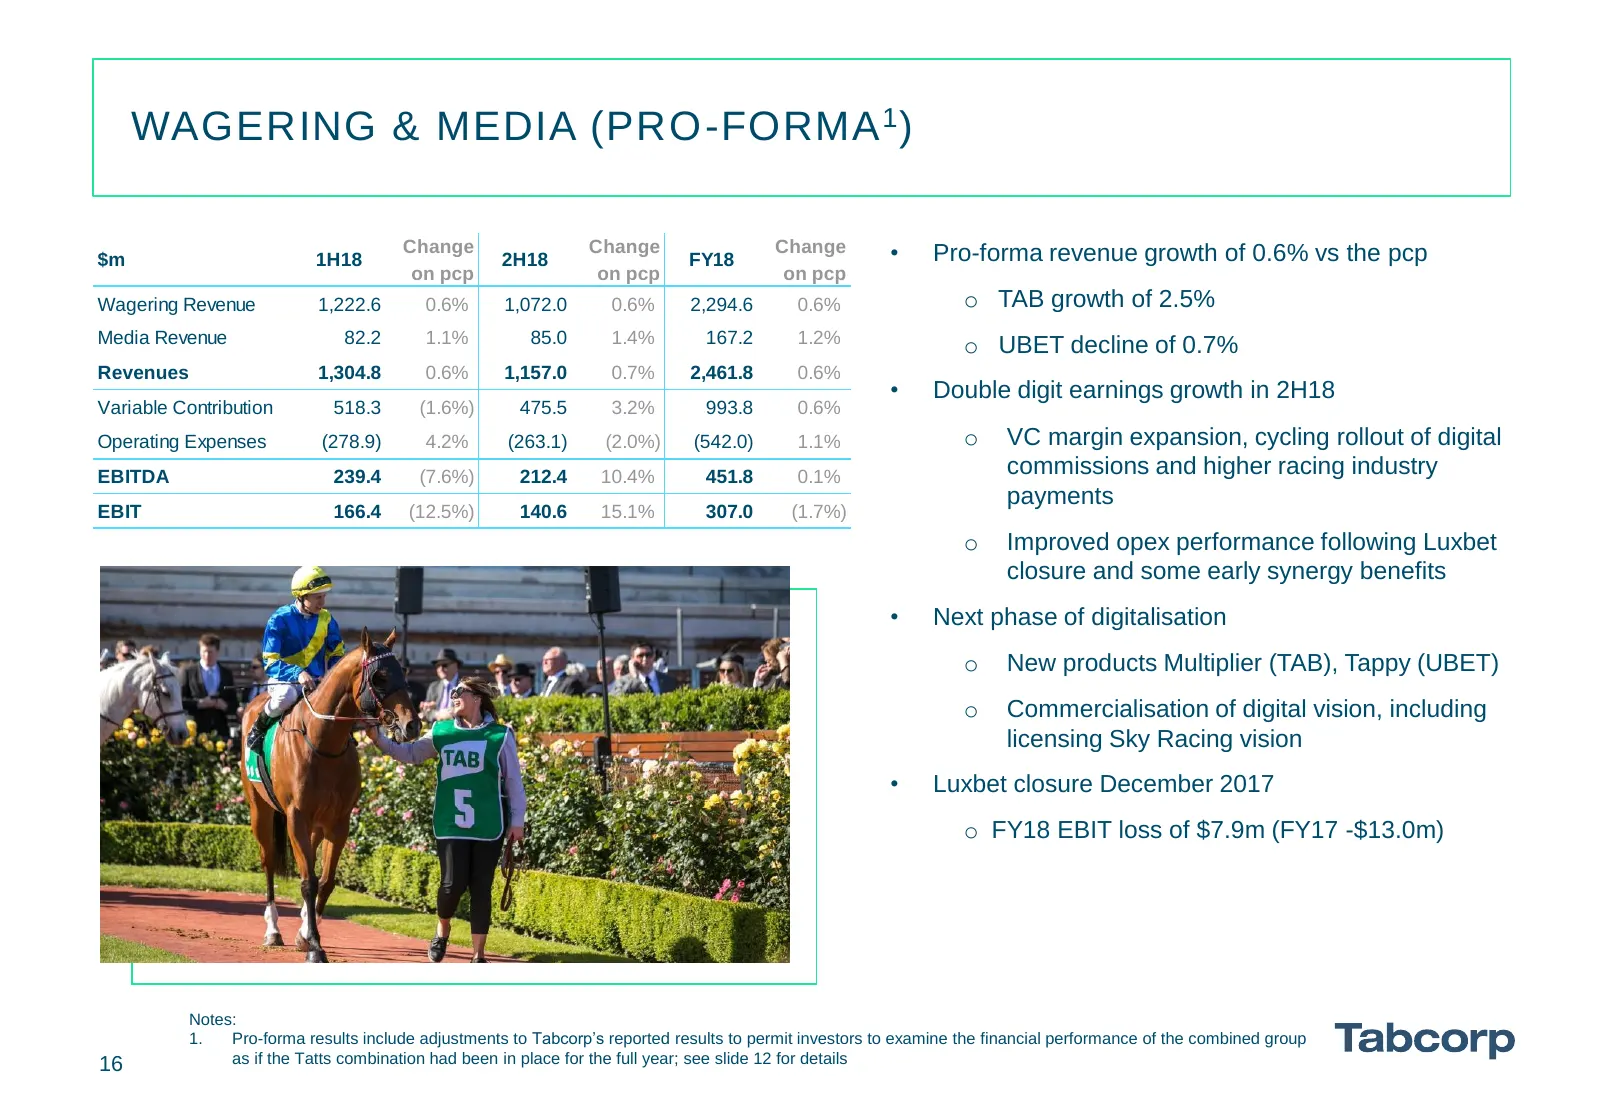
WAGERING & MEDIA (PRO-FORMA 1 ) $m 1H18 Change 2H18 Change FY18 Change • Pro-forma revenue growth of 0.6% vs the pcp on pcp on pcp on pcp Wagering Revenue 1,222.6 0.6% 1,072.0 0.6% 2,294.6 0.6% o TAB growth of 2.5% Media Revenue 82.2 1.1% 85.0 1.4% 167.2 1.2% o UBET decline of 0.7% Revenues 1,304.8
Slide 17: Wagering KPIs (Pro-forma)
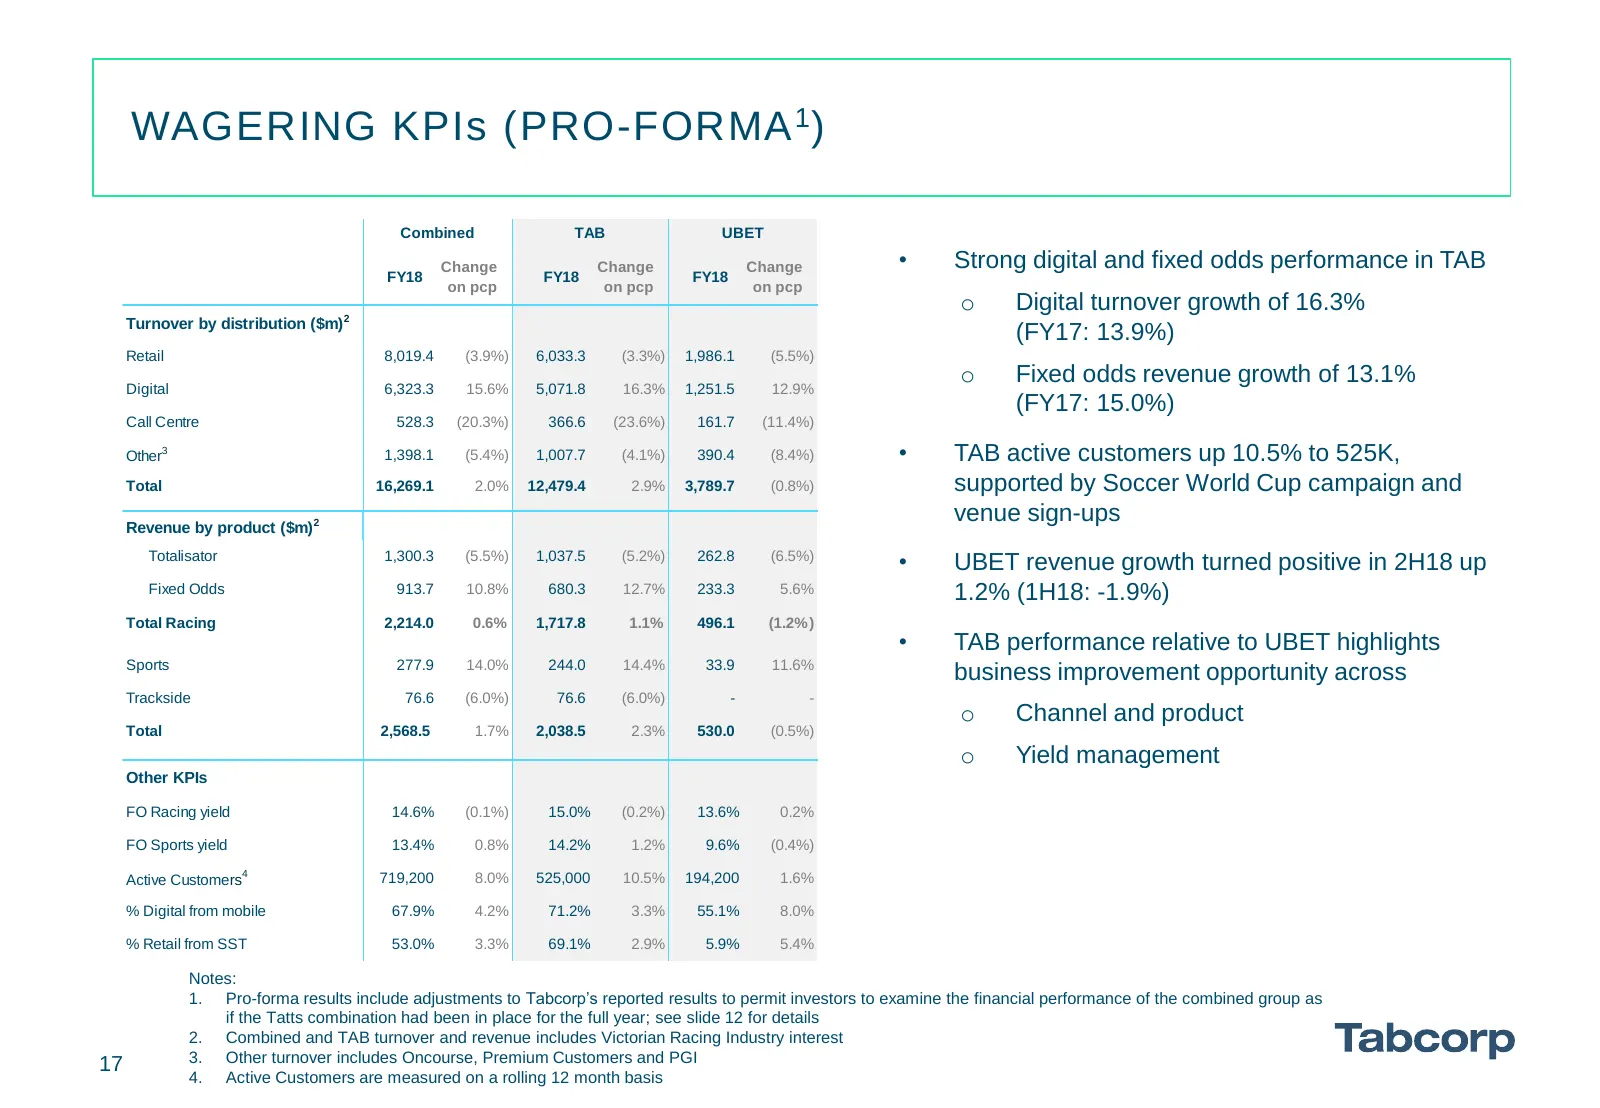
WAGERING KPIs (PRO-FORMA 1 ) Combined TAB UBET Change Change Change • Strong digital and fixed odds performance in TAB FY18 FY18 FY18 on pcp on pcp on pcp o Digital turnover growth of 16.3% Turnover by distribution ($m) 2 (FY17: 13.9%) Retail 8,019.4 (3.9%) 6,033.3 (3.3%) 1,986.1 (5.5%) Digital 6,32
Slide 18: Fixed Odds Wagering (Pro-forma)
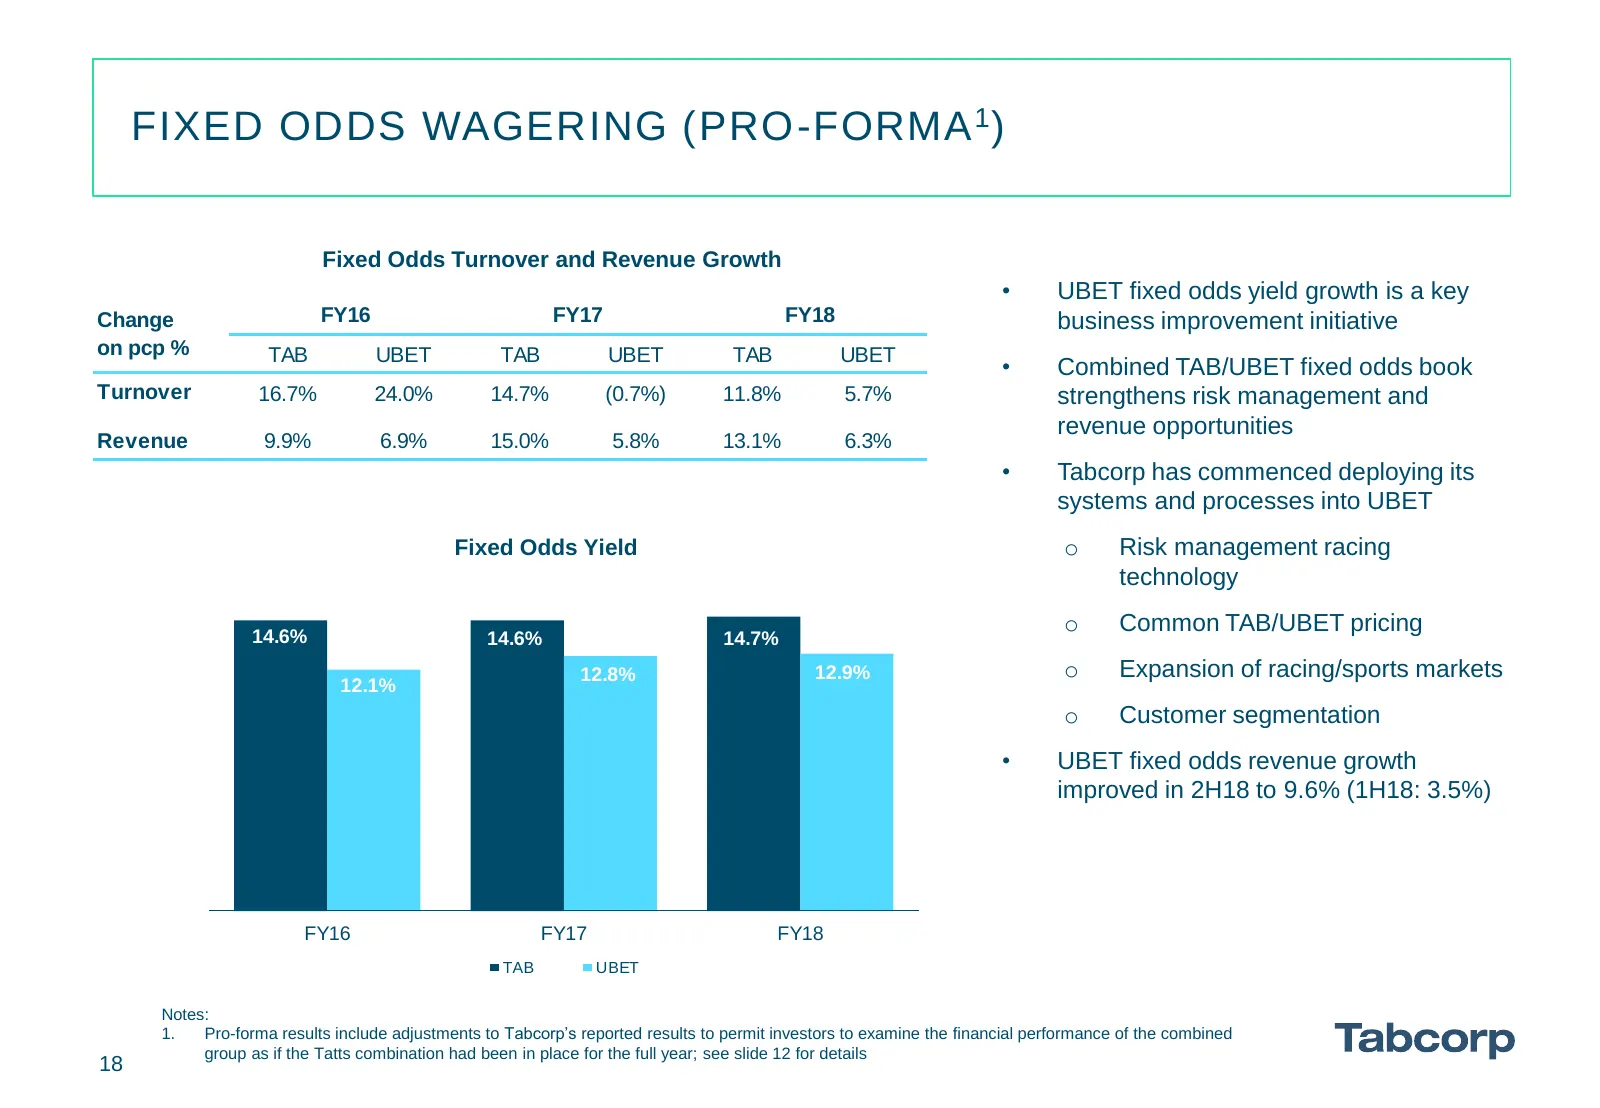
FIXED ODDS WAGERING (PRO-FORMA 1 ) Fixed Odds Turnover and Revenue Growth • UBET fixed odds yield growth is a key Change FY16 FY17 FY18 business improvement initiative on pcp % TAB UBET TAB UBET TAB UBET • Combined TAB/UBET fixed odds book Turnover 16.7% 24.0% 14.7% (0.7%) 11.8% 5.7% strengthens ris
Slide 19: Lotteries & Keno (Pro-forma)
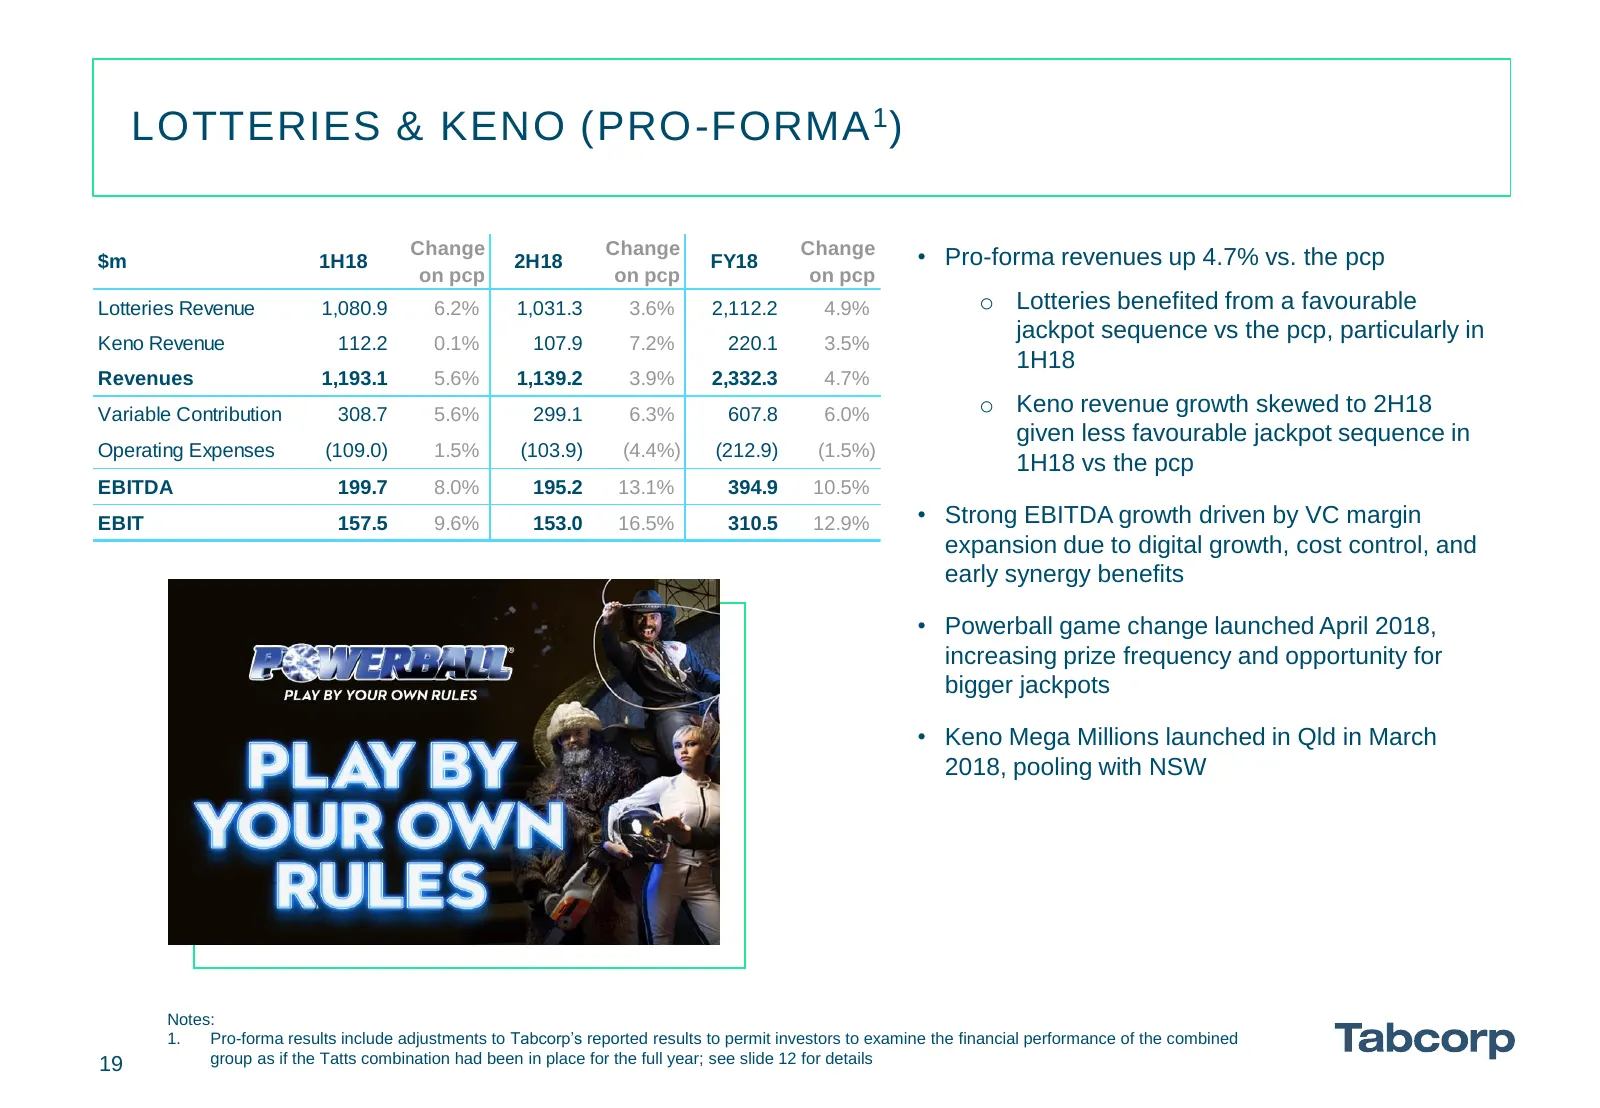
LOTTERIES & KENO (PRO-FORMA 1 ) Change Change Change $m 1H18 2H18 FY18 • Pro-forma revenues up 4.7% vs. the pcp on pcp on pcp on pcp Lotteries Revenue 1,080.9 6.2% 1,031.3 3.6% 2,112.2 4.9% o Lotteries benefited from a favourable Keno Revenue 112.2 0.1% 107.9 7.2% 220.1 3.5% jackpot sequence vs the
Slide 20: Lotteries & Keno KPIs (Pro-forma)
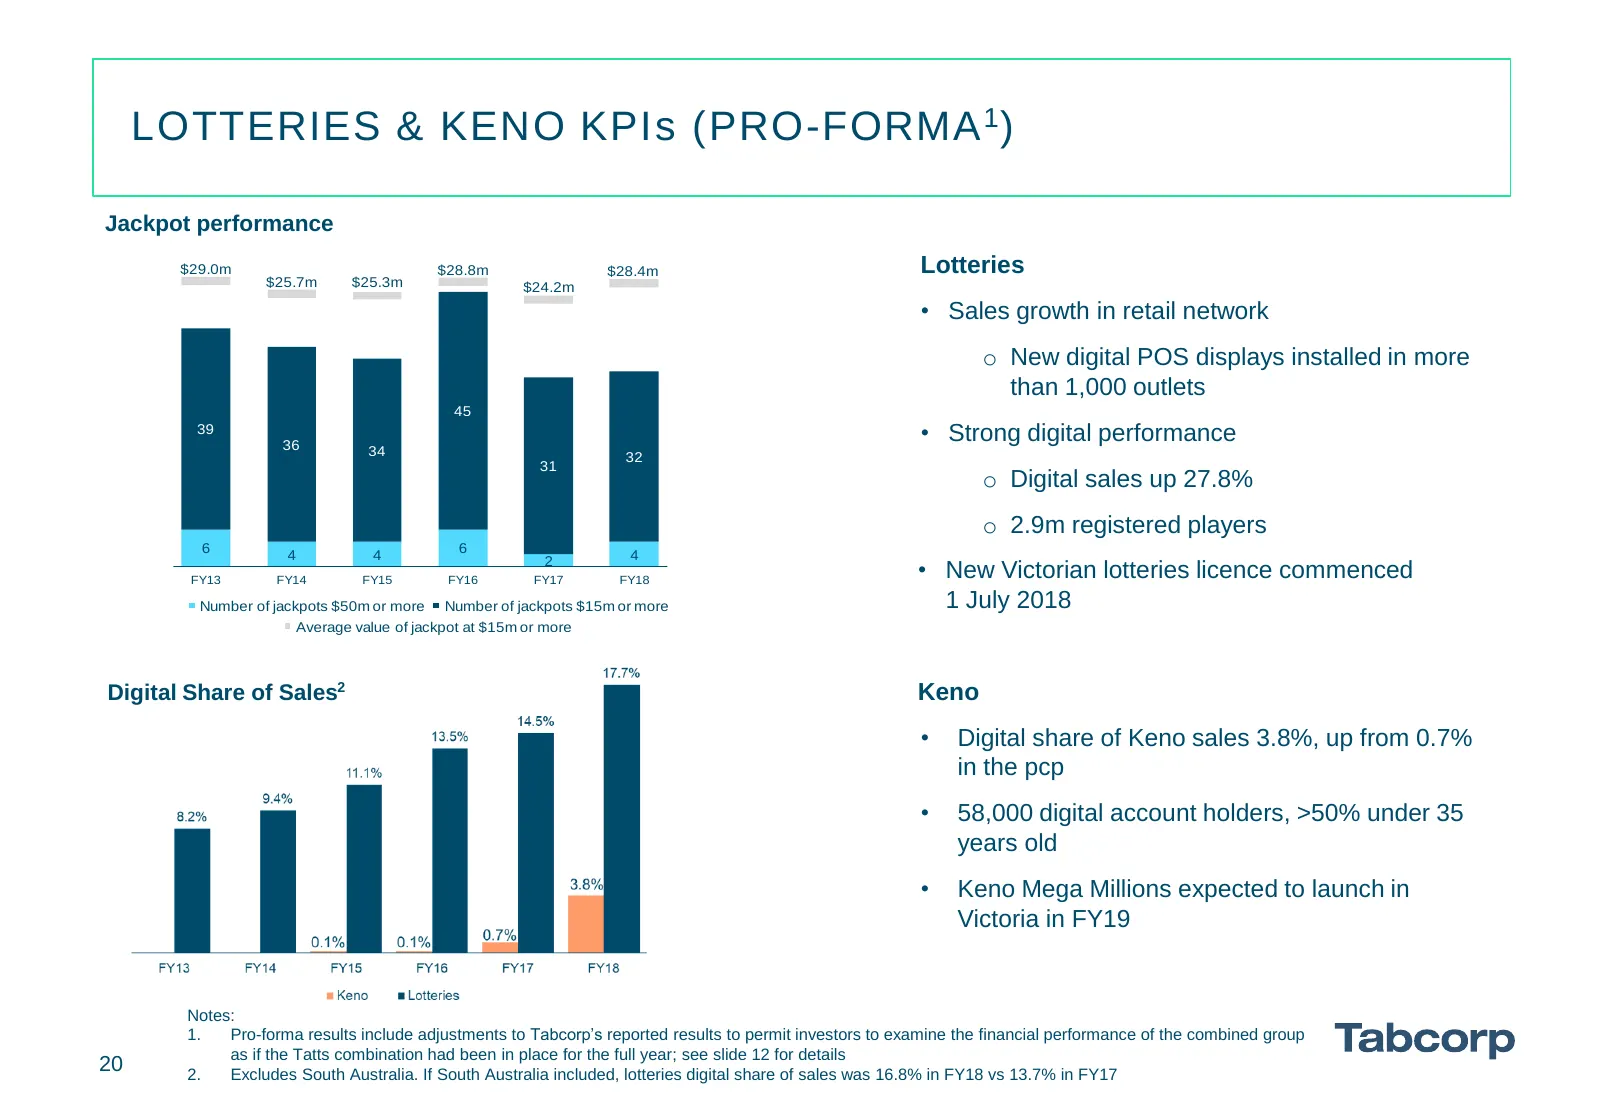
LOTTERIES & KENO KPIs (PRO-FORMA 1 ) Jackpot performance $29.0m $28.8m $28.4m Lotteries $25.7m $25.3m $24.2m • Sales growth in retail network o New digital POS displays installed in more than 1,000 outlets 45 39 36 • Strong digital performance 34 32 31 o Digital sales up 27.8% o 2.9m registered play
Slide 21: Gaming Services (Pro-forma)
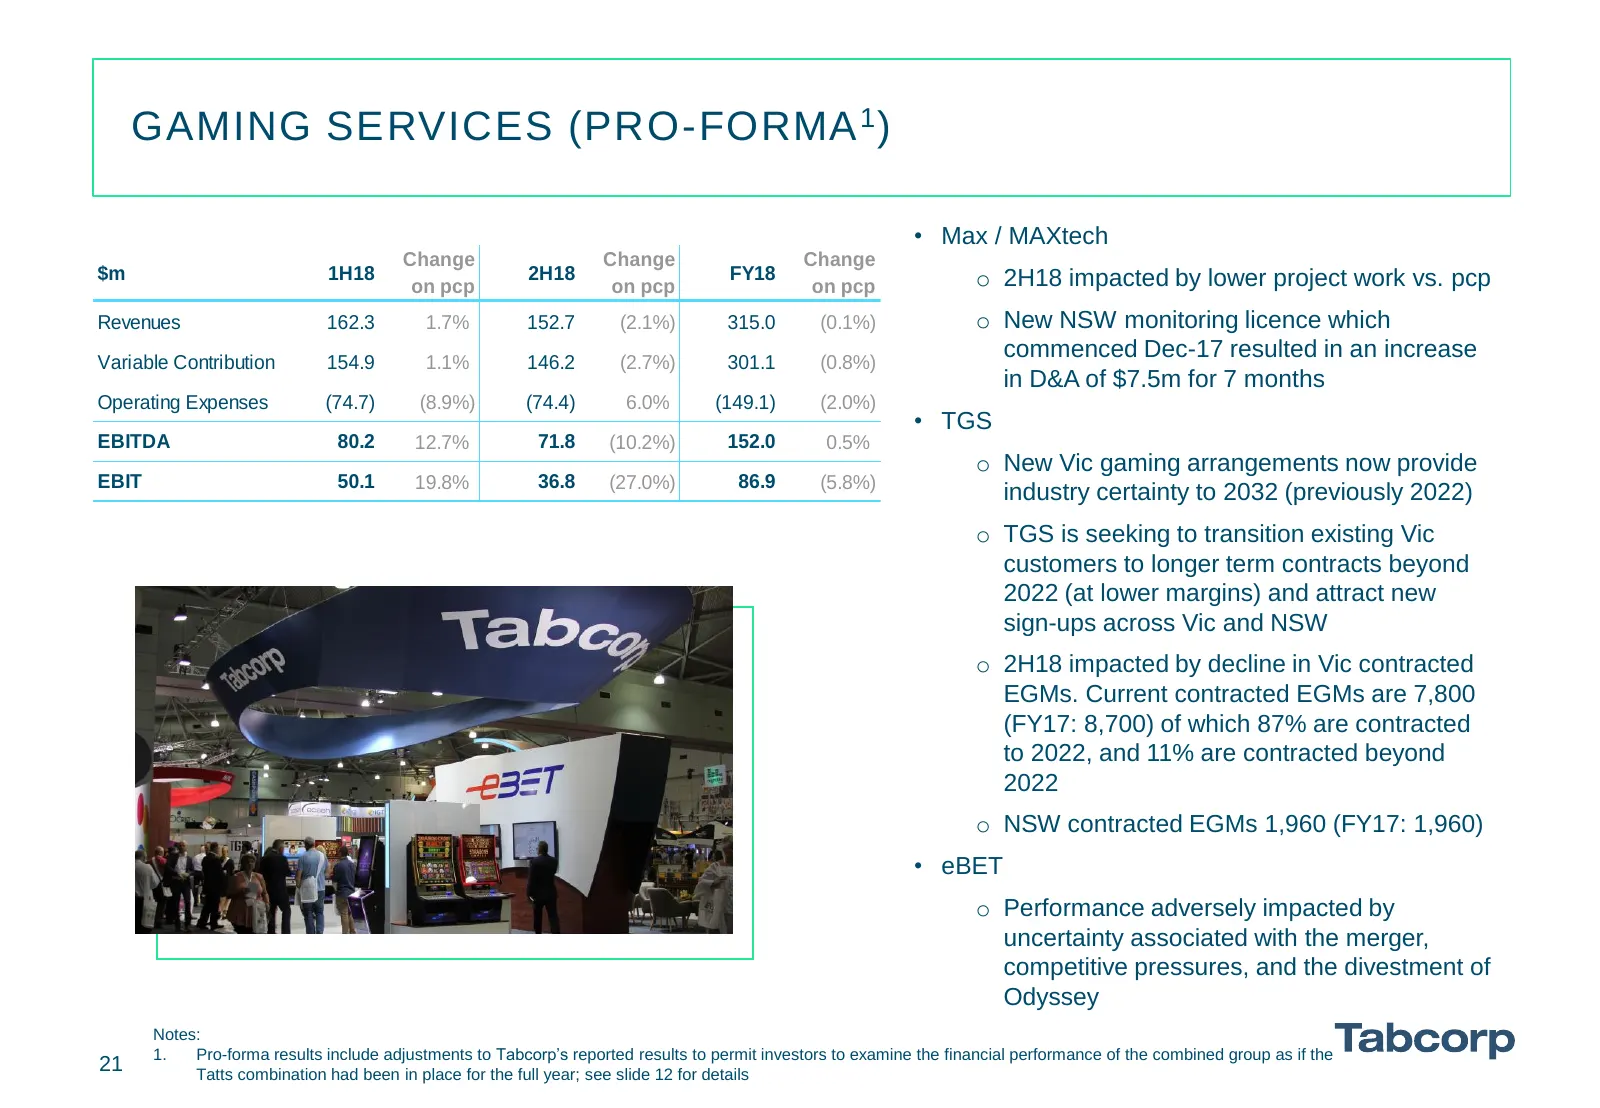
GAMING SERVICES (PRO-FORMA 1 ) • Max / MAXtech Change Change Change $m 1H18 on pcp 2H18 on pcp FY18 on pcp o 2H18 impacted by lower project work vs. pcp Revenues 162.3 1.7% 152.7 (2.1%) 315.0 (0.1%) o New NSW monitoring licence which Variable Contribution 154.9 1.1% 146.2 (2.7%) 301.1 (0.8%) commenc
Slide 22: Sun Bets
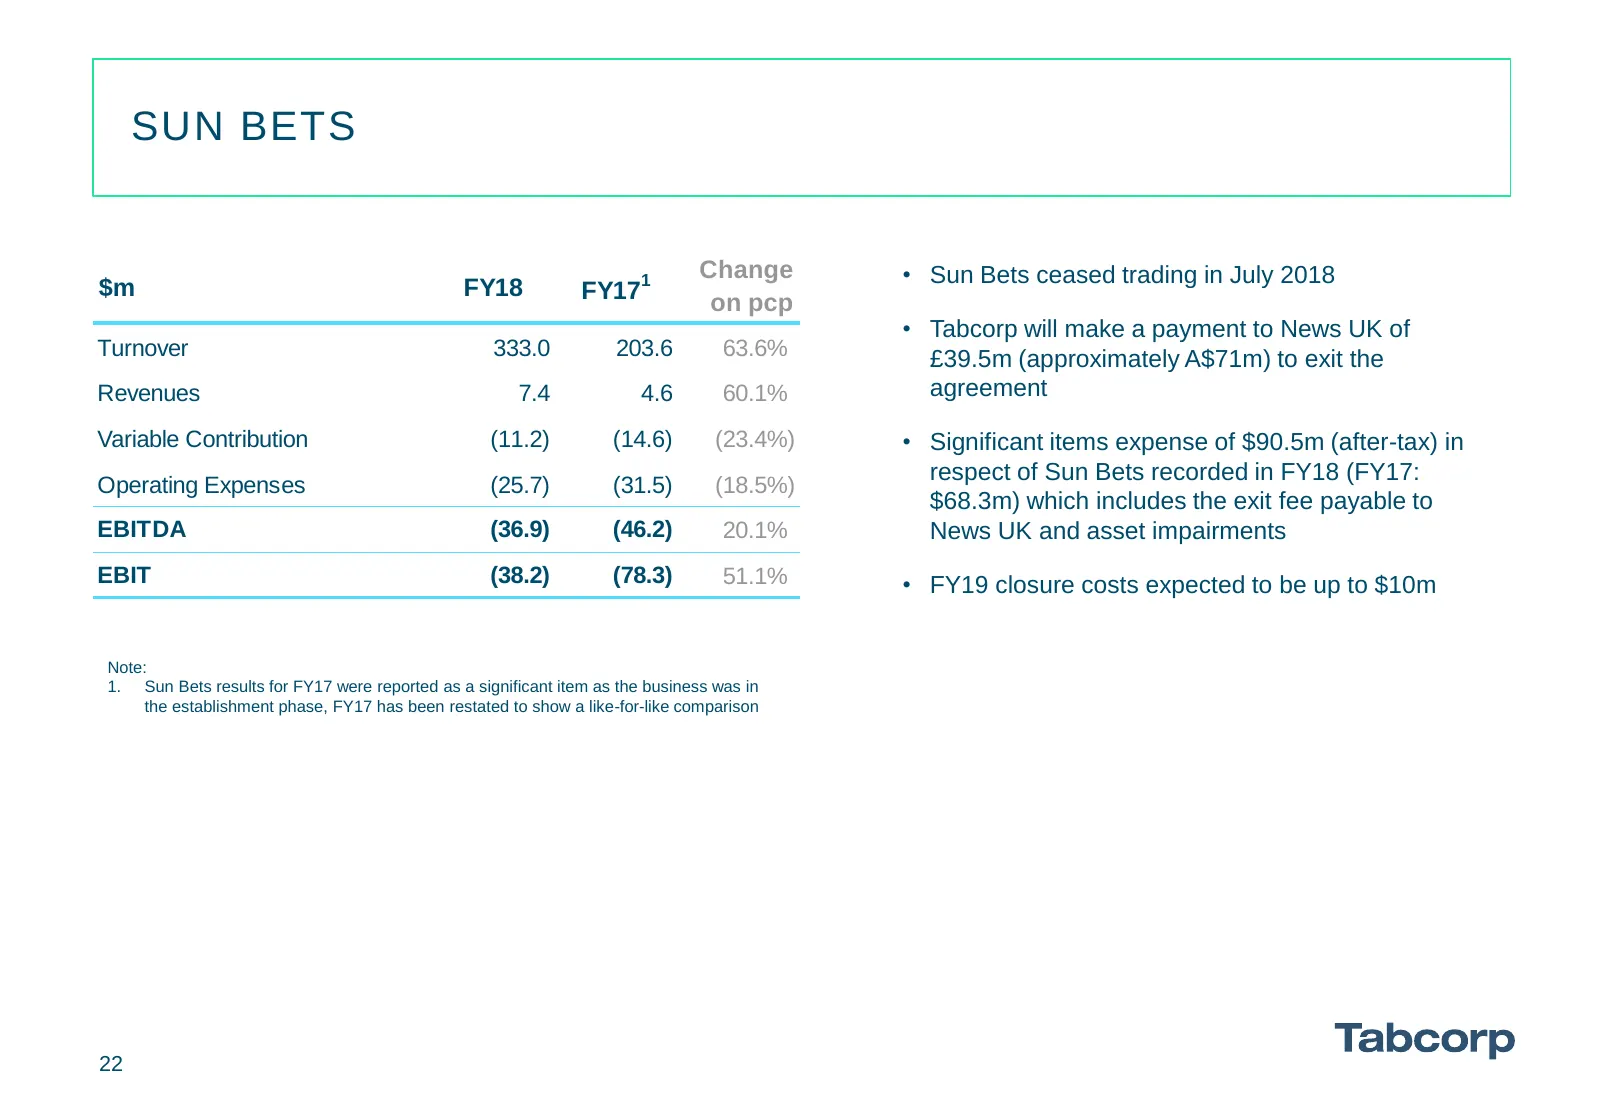
SUN BETS Change • Sun Bets ceased trading in July 2018 $m FY18 FY171 on pcp • Tabcorp will make a payment to News UK of Turnover 333.0 203.6 63.6% £39.5m (approximately A$71m) to exit the Revenues 7.4 4.6 60.1% agreement Variable Contribution (11.2) (14.6) (23.4%) • Significant items expense of $90.
Slide 23: Table of Contents
TABLE OF CONTENTS FY18 Overview 3-4 Group Results 6-7 Integration Update 9 - 10 Group Results - Pro-forma 12 - 14 Divisional Results 16 - 22 Capital Expenditure 24 Capital Management 26 Regulatory Update 28 Conclusion 30 Appendices 32 - 37 23
Slide 24: Capital Expenditure (Pro-forma)
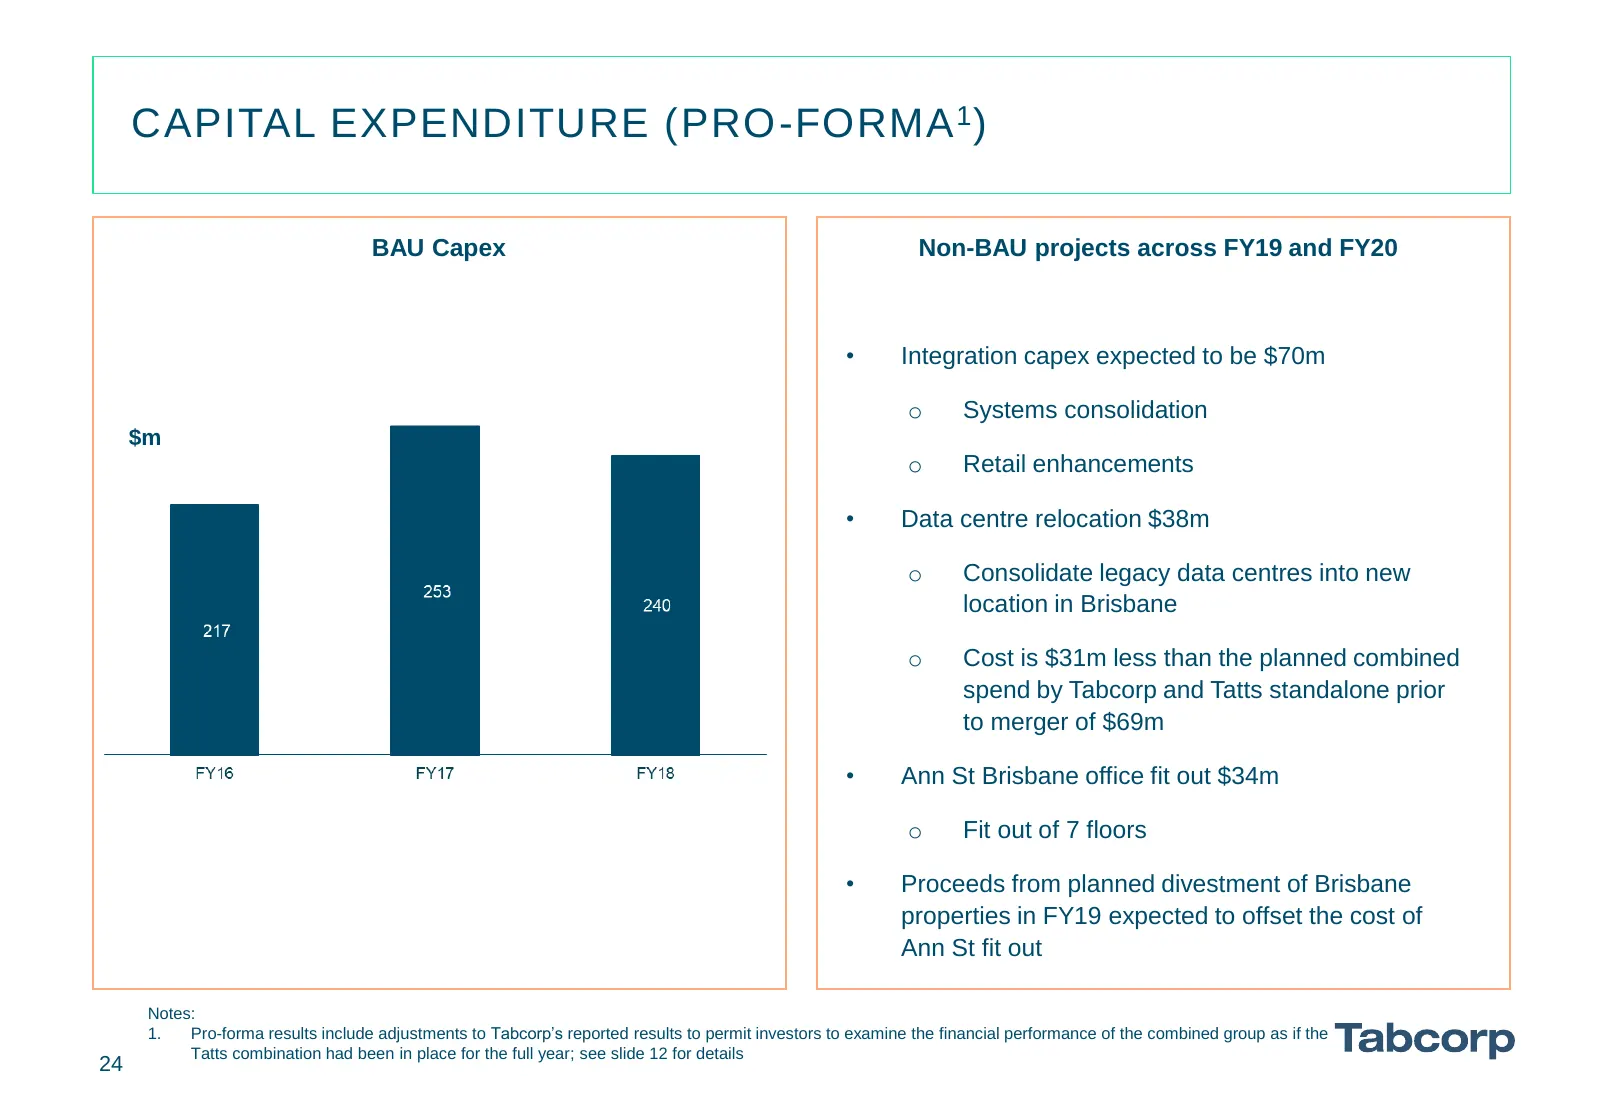
CAPITAL EXPENDITURE (PRO-FORMA 1 ) BAU Capex Non-BAU projects across FY19 and FY20 • Integration capex expected to be $70m o Systems consolidation $m o Retail enhancements • Data centre relocation $38m o Consolidate legacy data centres into new location in Brisbane o Cost is $31m less than the plann
Slide 25: Table of Contents
TABLE OF CONTENTS FY18 Overview 3-4 Group Results 6-7 Integration Update 9 - 10 Group Results - Pro-forma 12 - 14 Divisional Results 16 - 22 Capital Expenditure 24 Capital Management 26 Regulatory Update 28 Conclusion 30 Appendices 32 - 37 25
Slide 26: Capital Management
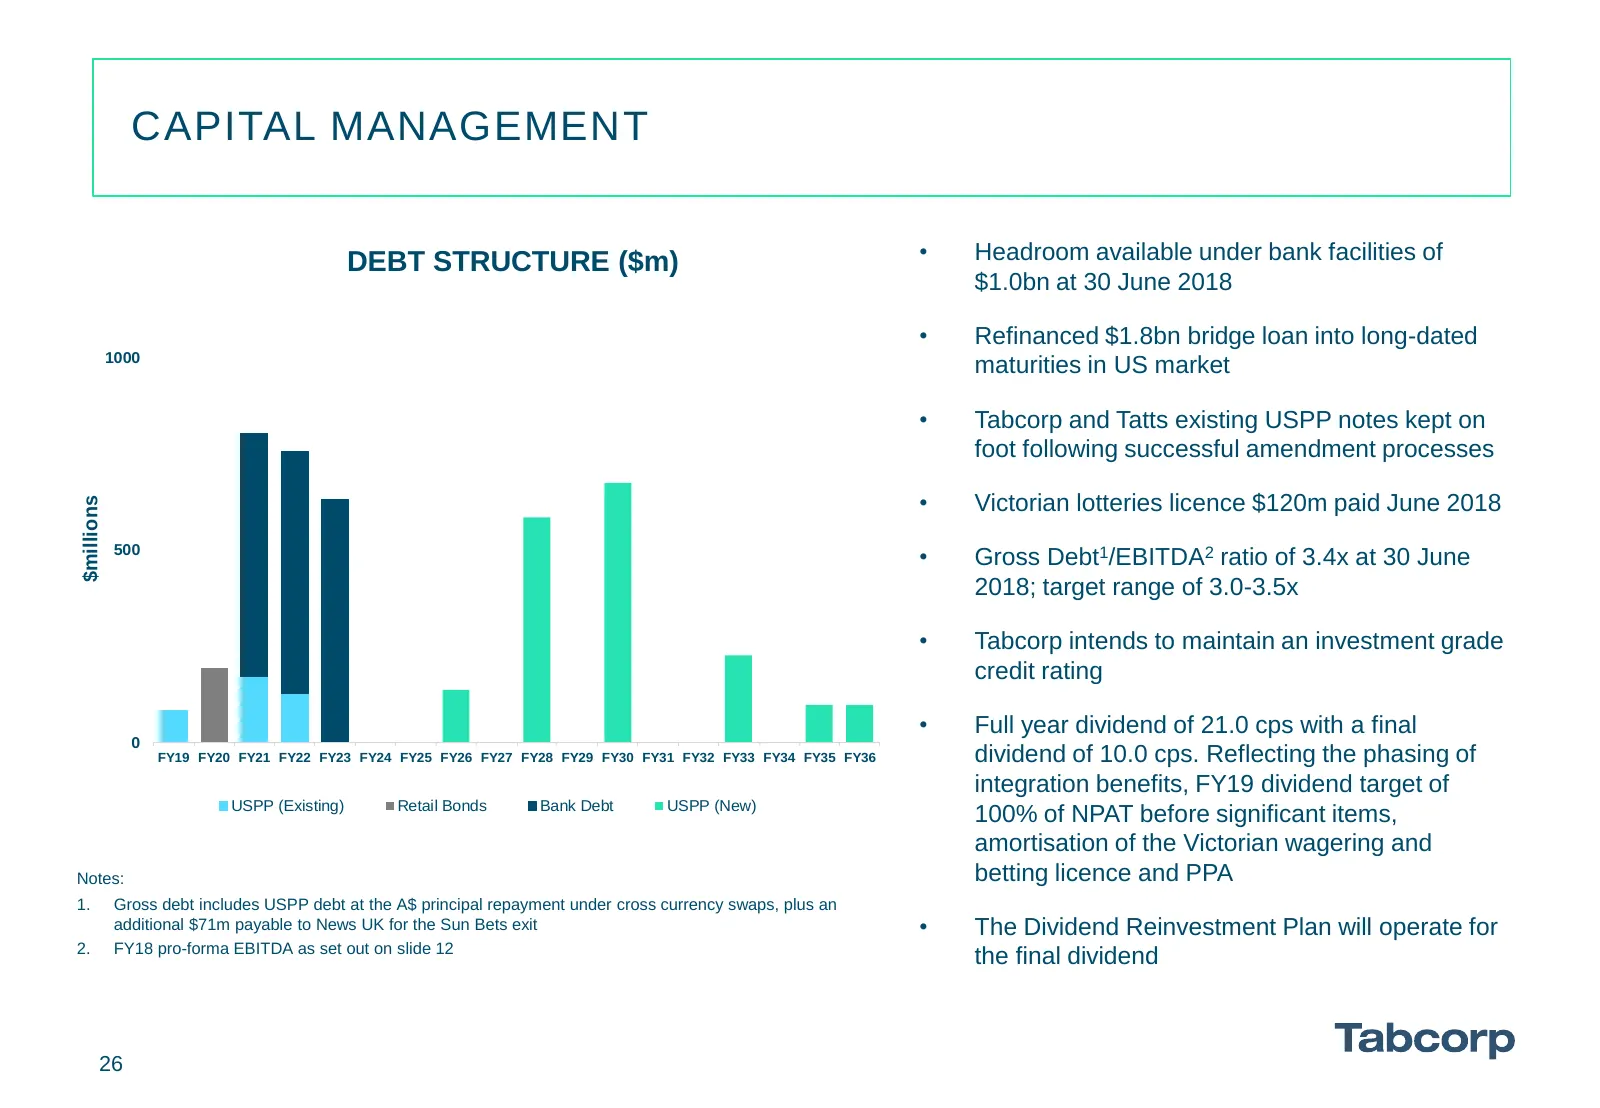
CAPITAL MANAGEMENT DEBT STRUCTURE ($m) • Headroom available under bank facilities of $1.0bn at 30 June 2018 • Refinanced $1.8bn bridge loan into long-dated 1000 maturities in US market • Tabcorp and Tatts existing USPP notes kept on foot following successful amendment processes • Victorian lotteries
Slide 27: Table of Contents
TABLE OF CONTENTS FY18 Overview 3-4 Group Results 6-7 Integration Update 9 - 10 Group Results - Pro-forma 12 - 14 Divisional Results 16 - 22 Capital Expenditure 24 Capital Management 26 Regulatory Update 28 Conclusion 30 Appendices 32 - 37 27
Slide 28: An Evolving Regulatory Landscape
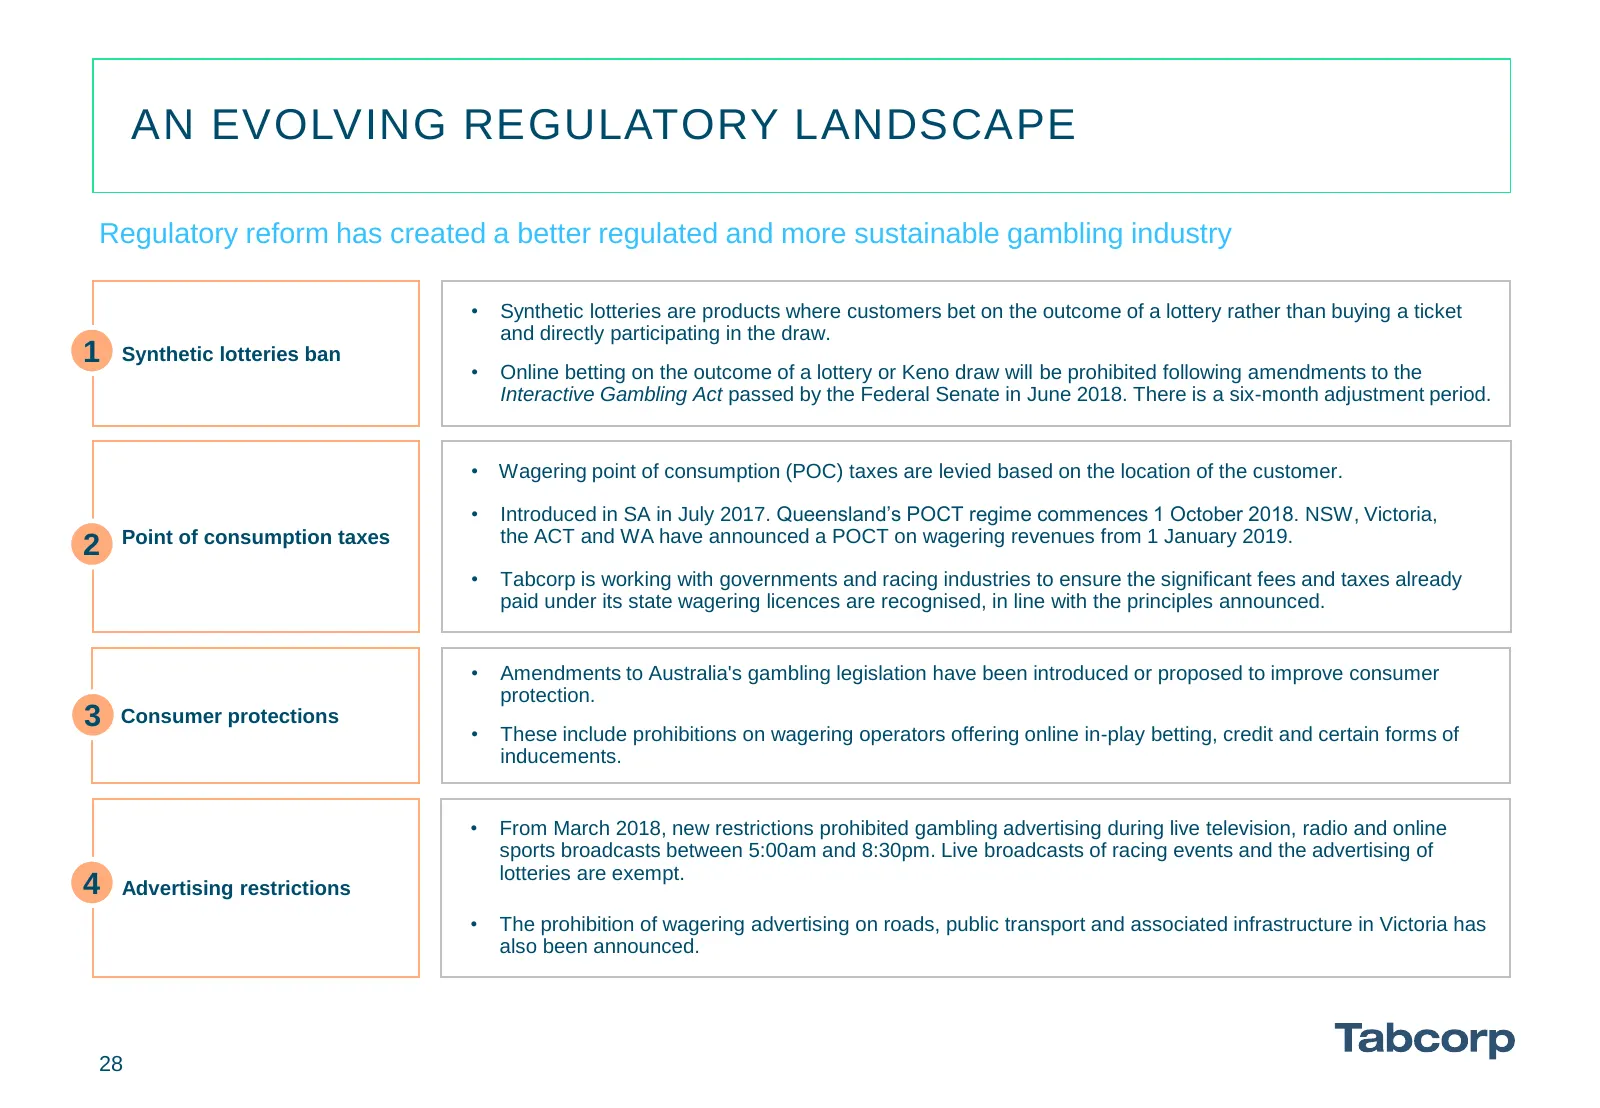
AN EVOLVING REGULATORY LANDSCAPE Regulatory reform has created a better regulated and more sustainable gambling industry • Synthetic lotteries are products where customers bet on the outcome of a lottery rather than buying a ticket and directly participating in the draw. 1 Synthetic lotteries ban •
Slide 29: Table of Contents
TABLE OF CONTENTS FY18 Overview 3-4 Group Results 6-7 Integration Update 9 - 10 Group Results - Pro-forma 12 - 14 Divisional Results 16 - 22 Capital Expenditure 24 Capital Management 26 Regulatory Update 28 Conclusion 30 Appendices 32 - 37 29
Slide 30: Conclusion
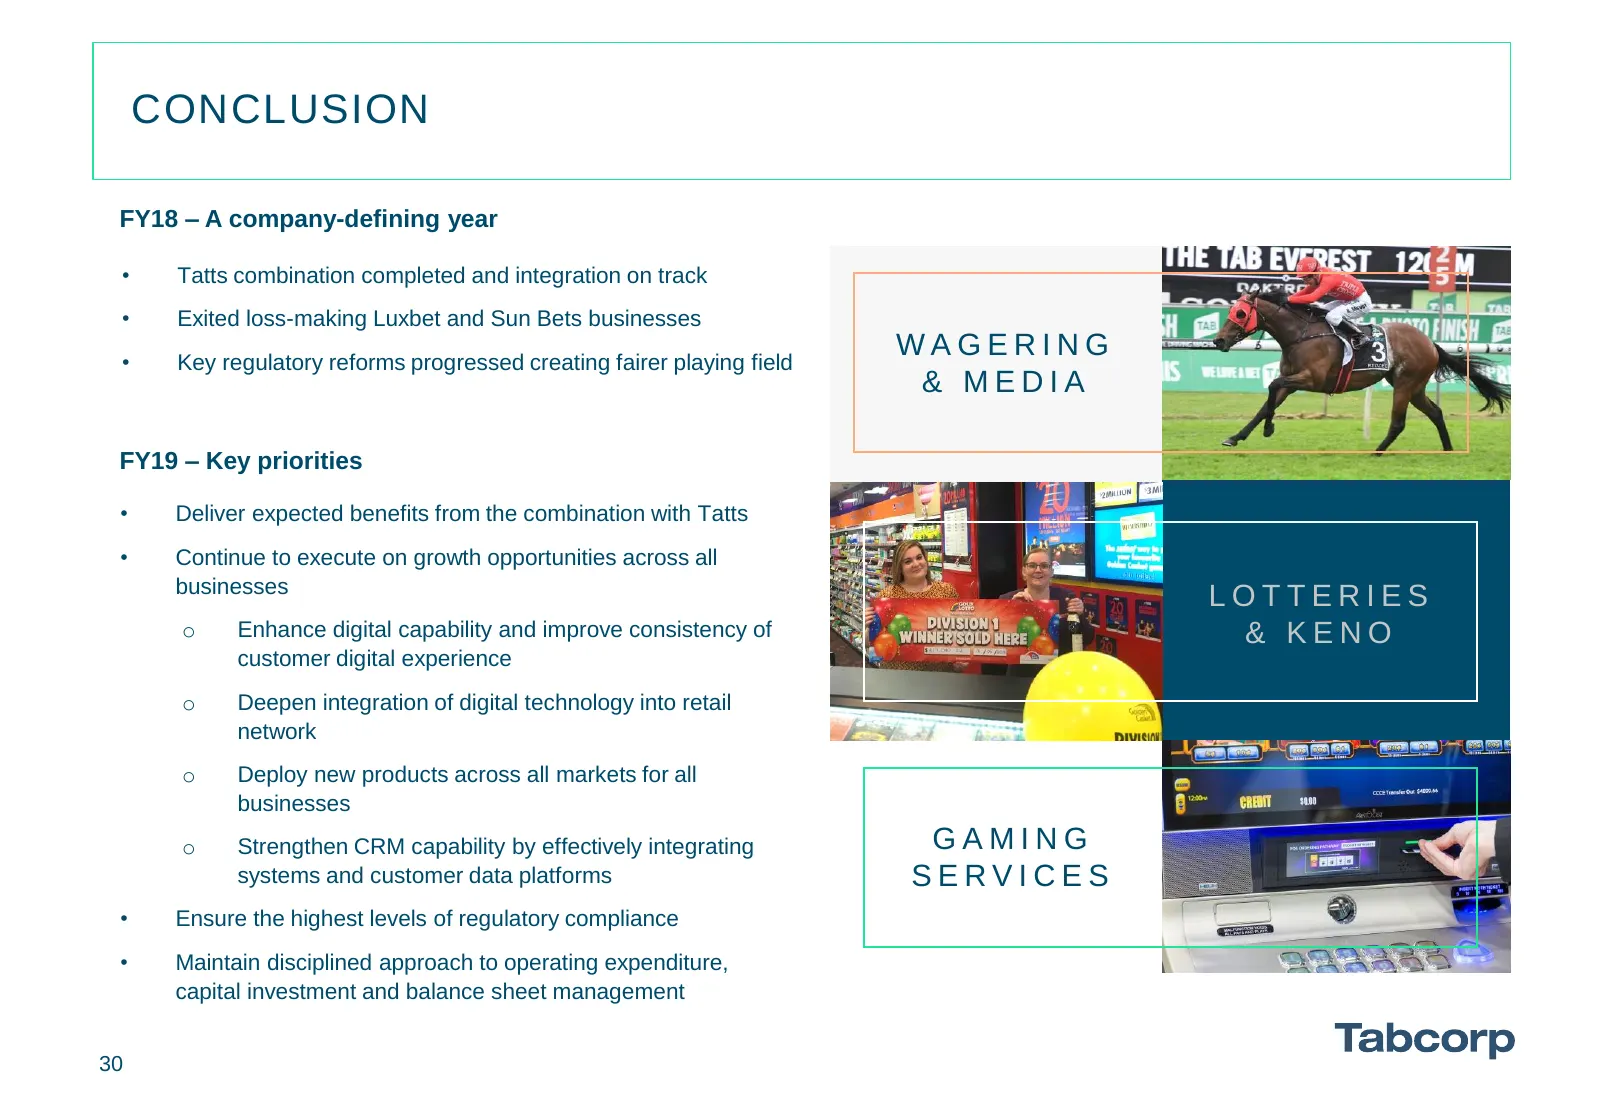
CONCLUSION FY18 – A company-defining year • Tatts combination completed and integration on track • Exited loss-making Luxbet and Sun Bets businesses • Key regulatory reforms progressed creating fairer playing field WAGERING & MEDIA FY19 – Key priorities • Deliver expected benefits from the combinati
Slide 31: Table of Contents
TABLE OF CONTENTS FY18 Overview 3-4 Group Results 6-7 Integration Update 9 - 10 Group Results - Pro-forma 12 - 14 Divisional Results 16 - 22 Capital Expenditure 24 Capital Management 26 Regulatory Update 28 Conclusion 30 Appendices 32 - 37 31
Slide 32: Appendices
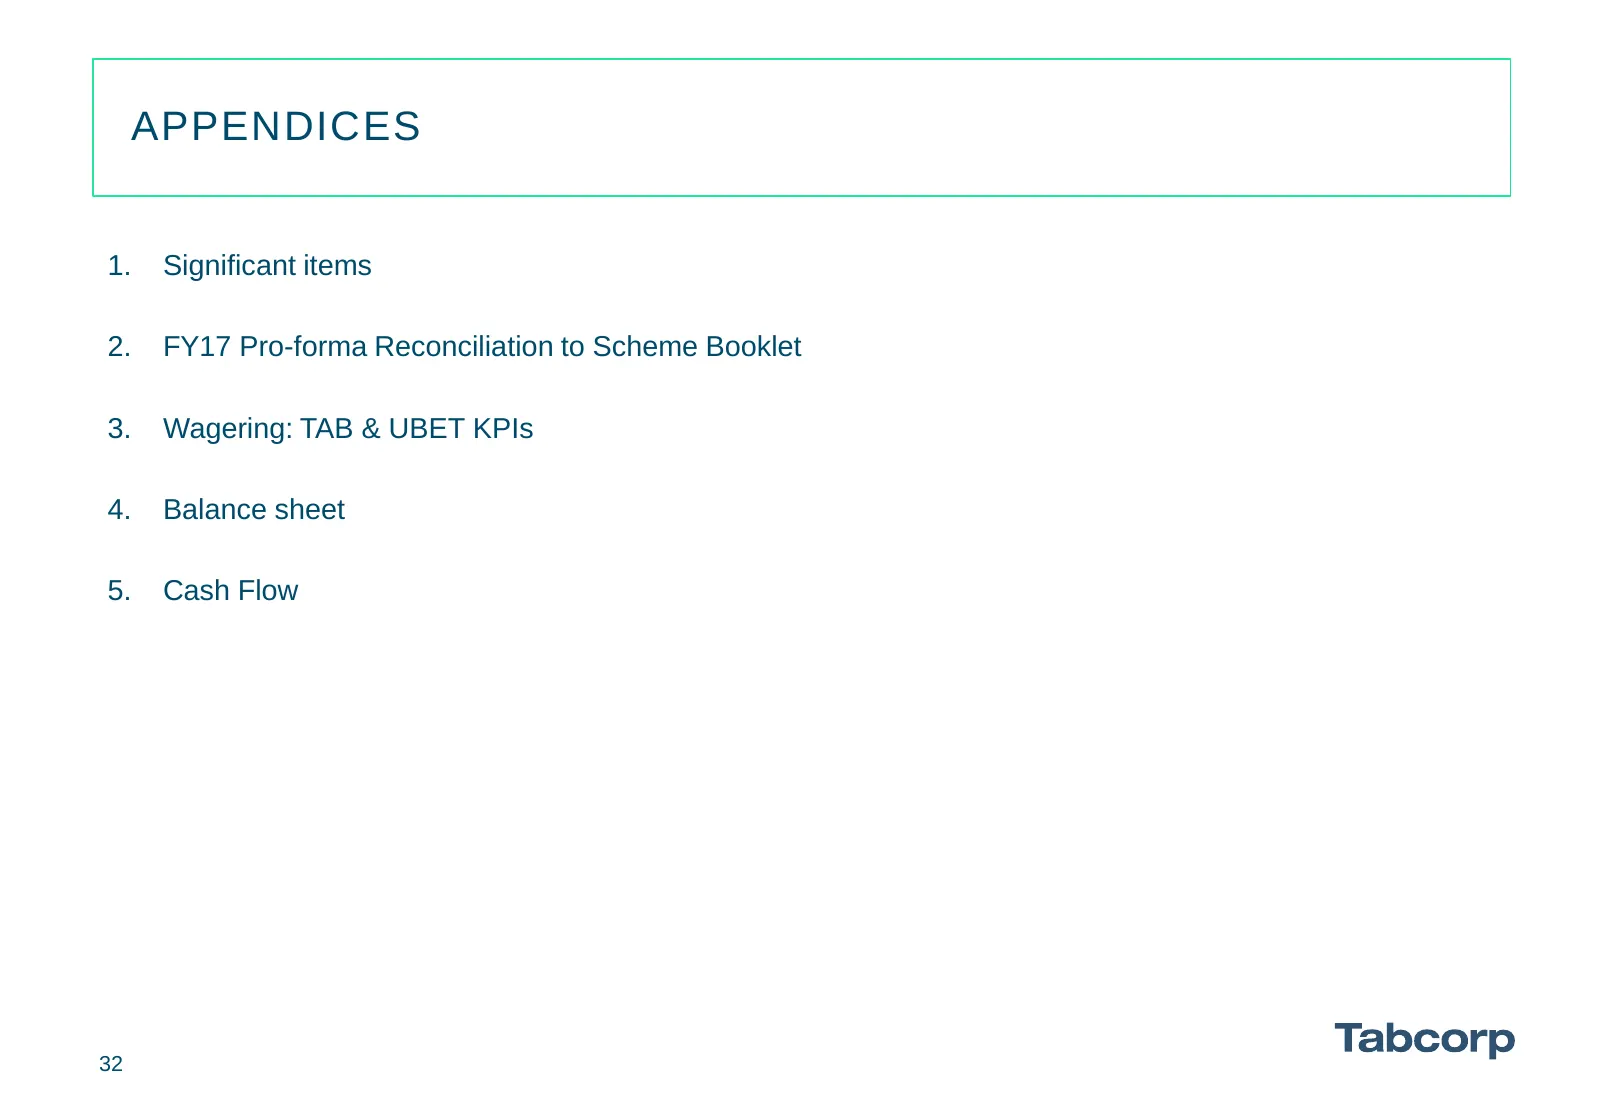
APPENDICES 1. Significant items 2. FY17 Pro-forma Reconciliation to Scheme Booklet 3. Wagering: TAB & UBET KPIs 4. Balance sheet 5. Cash Flow 32
Slide 33: 1. Significant Items (After-Tax)
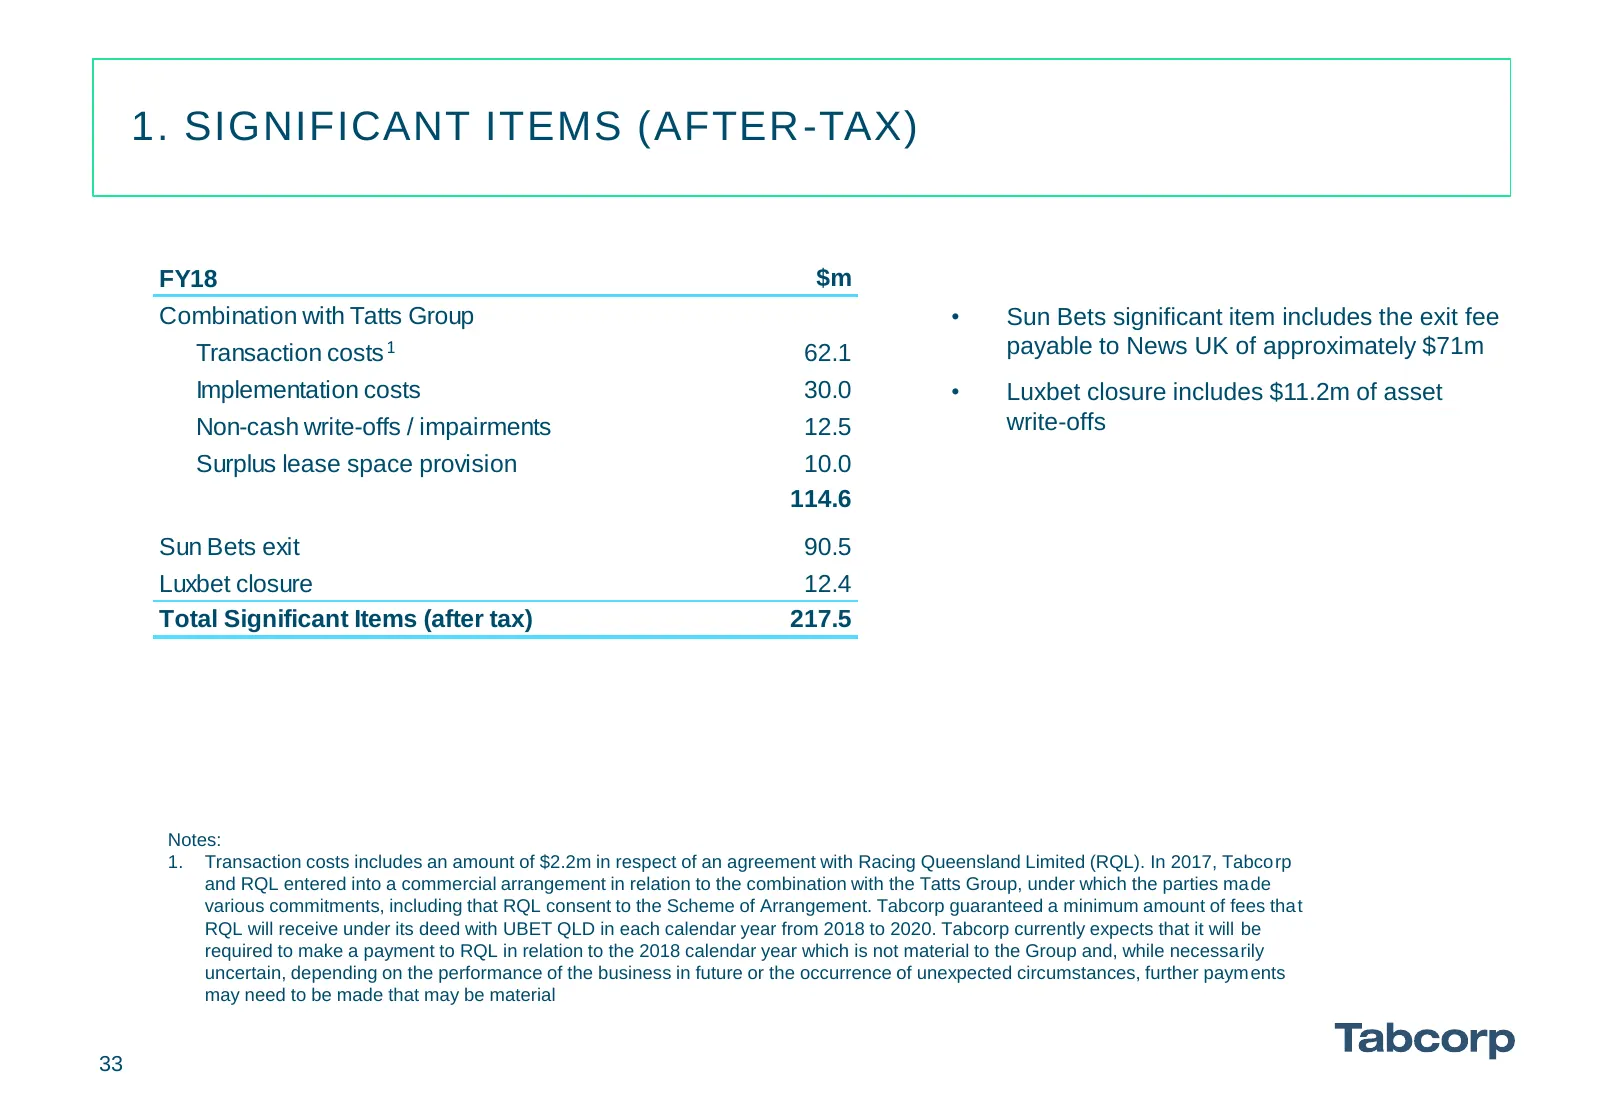
1. SIGNIFICANT ITEMS (AFTER-TAX) FY18 $m Combination with Tatts Group • Sun Bets significant item includes the exit fee Transaction costs 1 62.1 payable to News UK of approximately $71m Implementation costs 30.0 • Luxbet closure includes $11.2m of asset Non-cash write-offs / impairments 12.5 write-o
Slide 34: 2. FY17 Pro-forma Reconciliation to Scheme Booklet
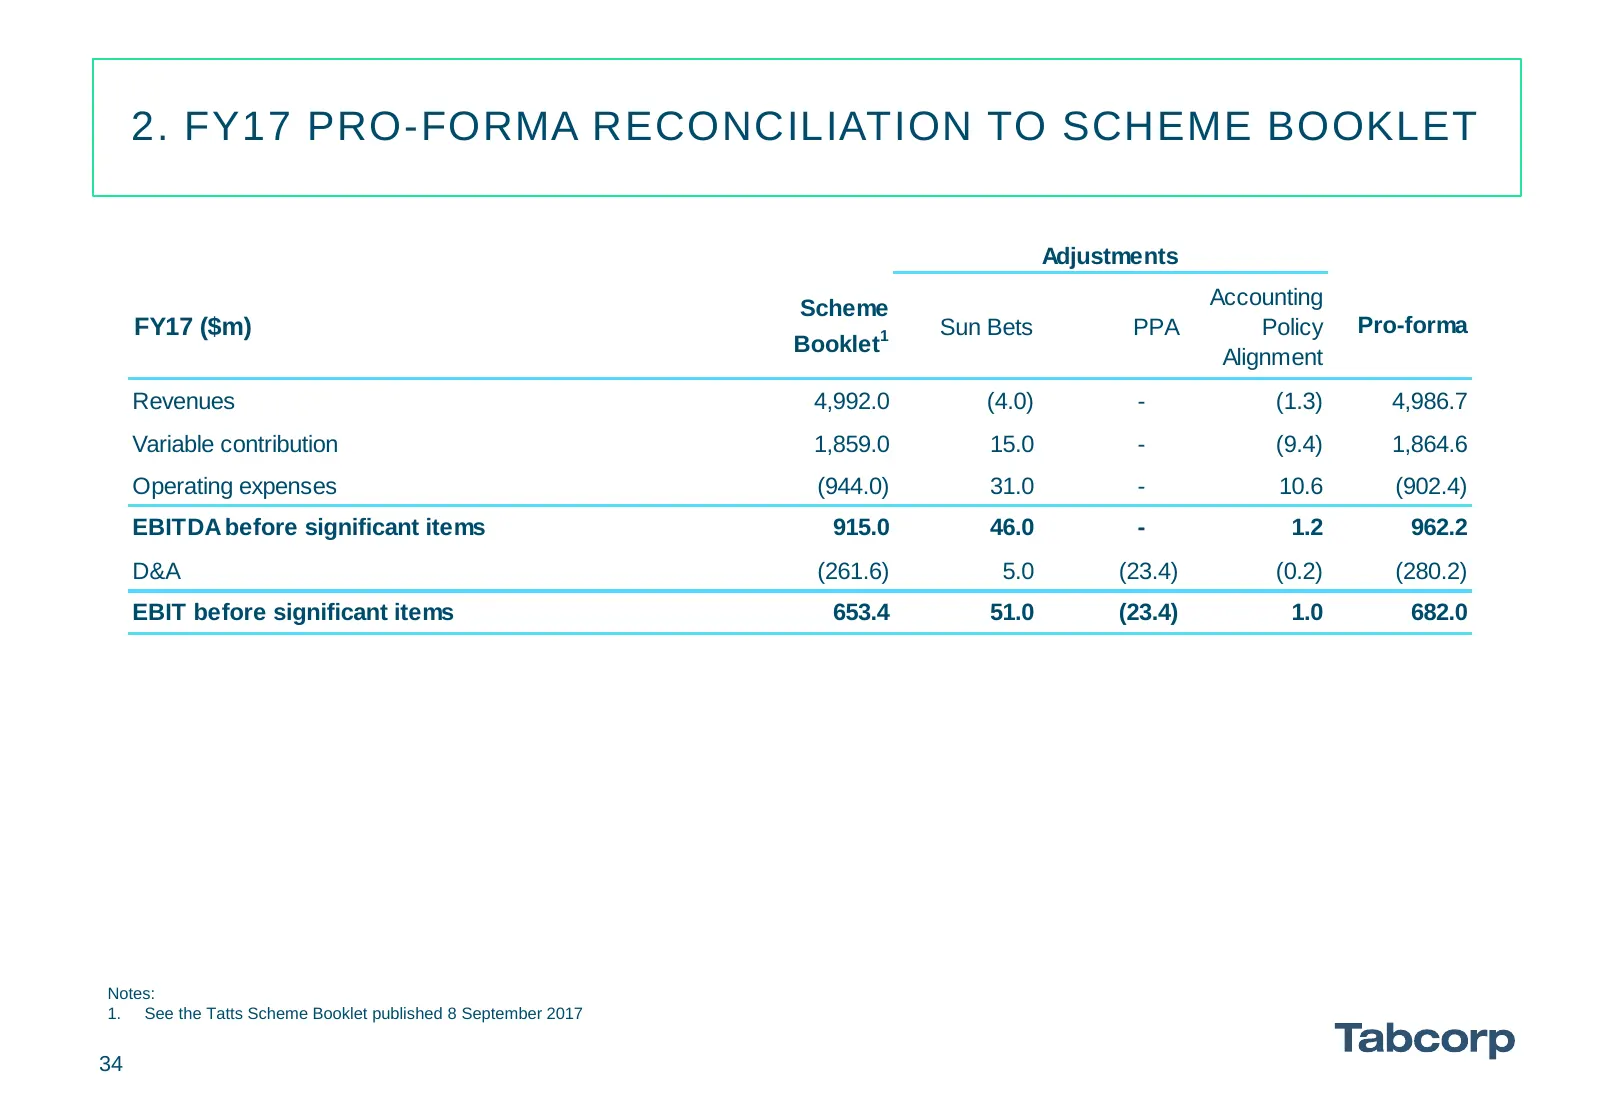
2. FY17 PRO-FORMA RECONCILIATION TO SCHEME BOOKLET Adjustments Scheme Accounting FY17 ($m) Sun Bets PPA Policy Pro-forma Booklet1 Alignment Revenues 4,992.0 (4.0) - (1.3) 4,986.7 Variable contribution 1,859.0 15.0 - (9.4) 1,864.6 Operating expenses (944.0) 31.0 - 10.6 (902.4) EBITDA before significa
Slide 35: 3. Wagering: TAB & UBET KPIs
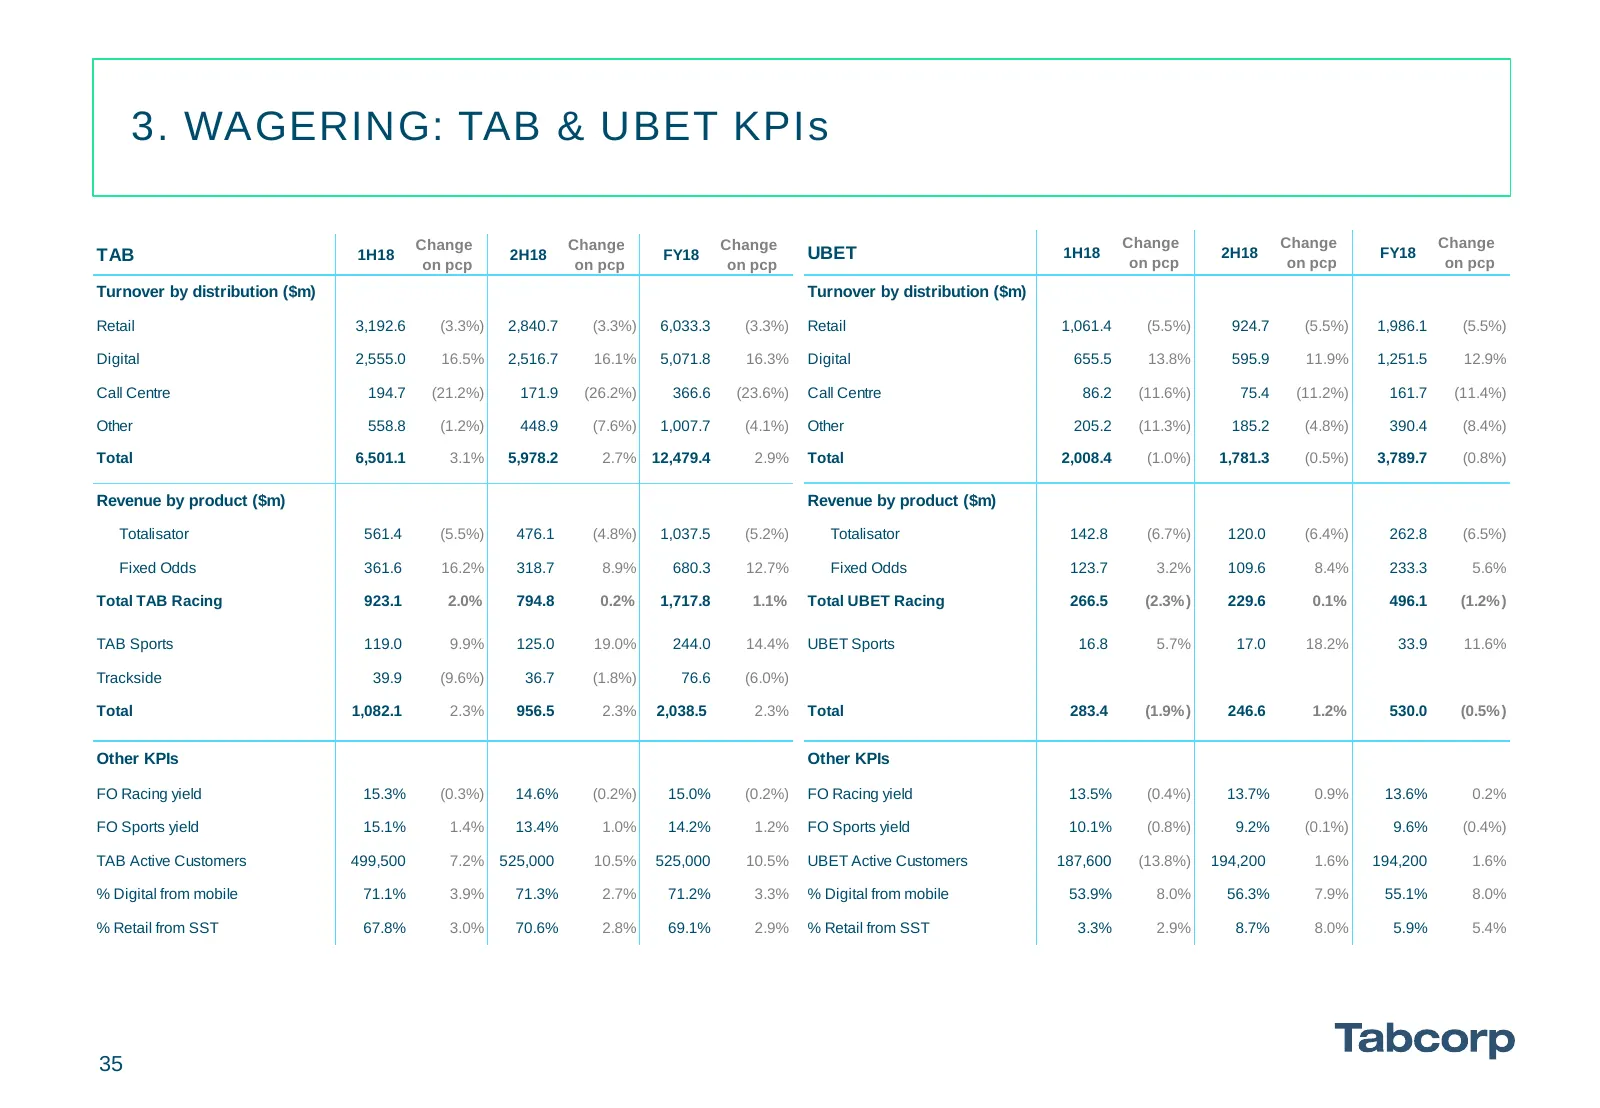
3. WAGERING: TAB & UBET KPIs Change Change Change Change Change Change TAB 1H18 2H18 FY18 UBET 1H18 on pcp 2H18 on pcp FY18 on pcp on pcp on pcp on pcp Turnover by distribution ($m) Turnover by distribution ($m) Retail 3,192.6 (3.3%) 2,840.7 (3.3%) 6,033.3 (3.3%) Retail 1,061.4 (5.5%) 924.7 (5.5%) 1
Slide 36: 4. Balance Sheet
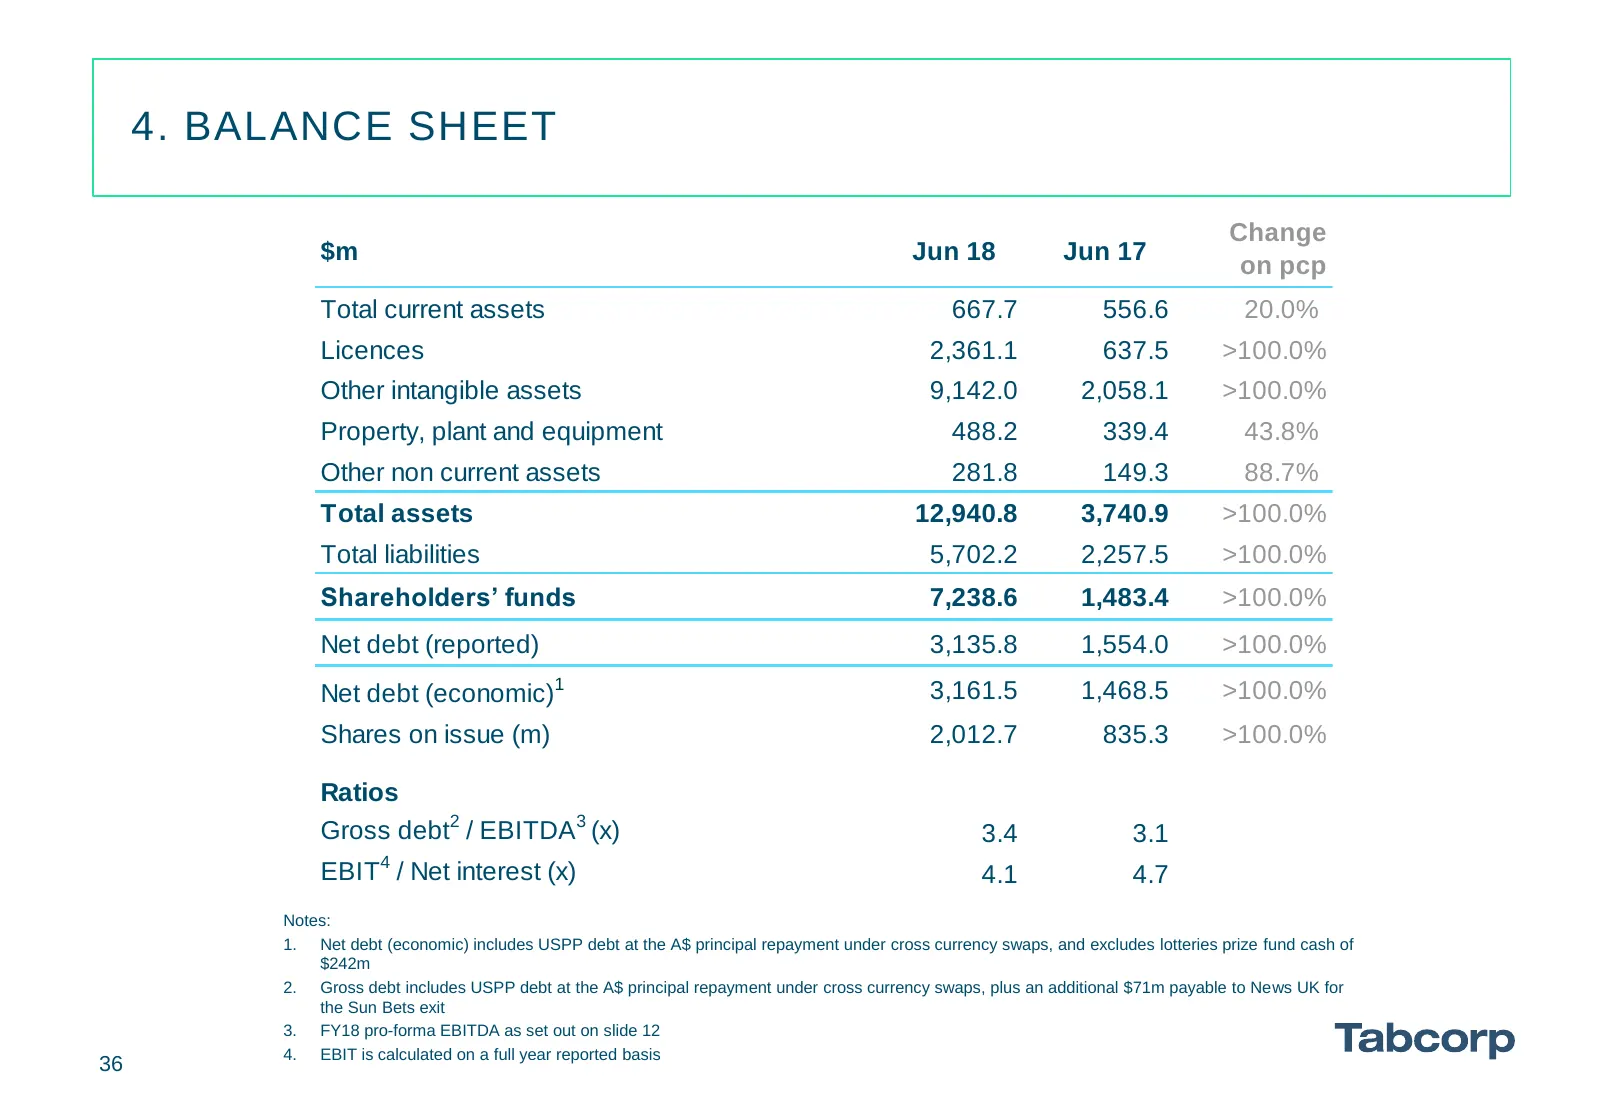
4. BALANCE SHEET Change $m Jun 18 Jun 17 on pcp Total current assets 667.7 556.6 20.0% Licences 2,361.1 637.5 >100.0% Other intangible assets 9,142.0 2,058.1 >100.0% Property, plant and equipment 488.2 339.4 43.8% Other non current assets 281.8 149.3 88.7% Total assets 12,940.8 3,740.9 >100.0% Total
Slide 37: 5. Cash Flow
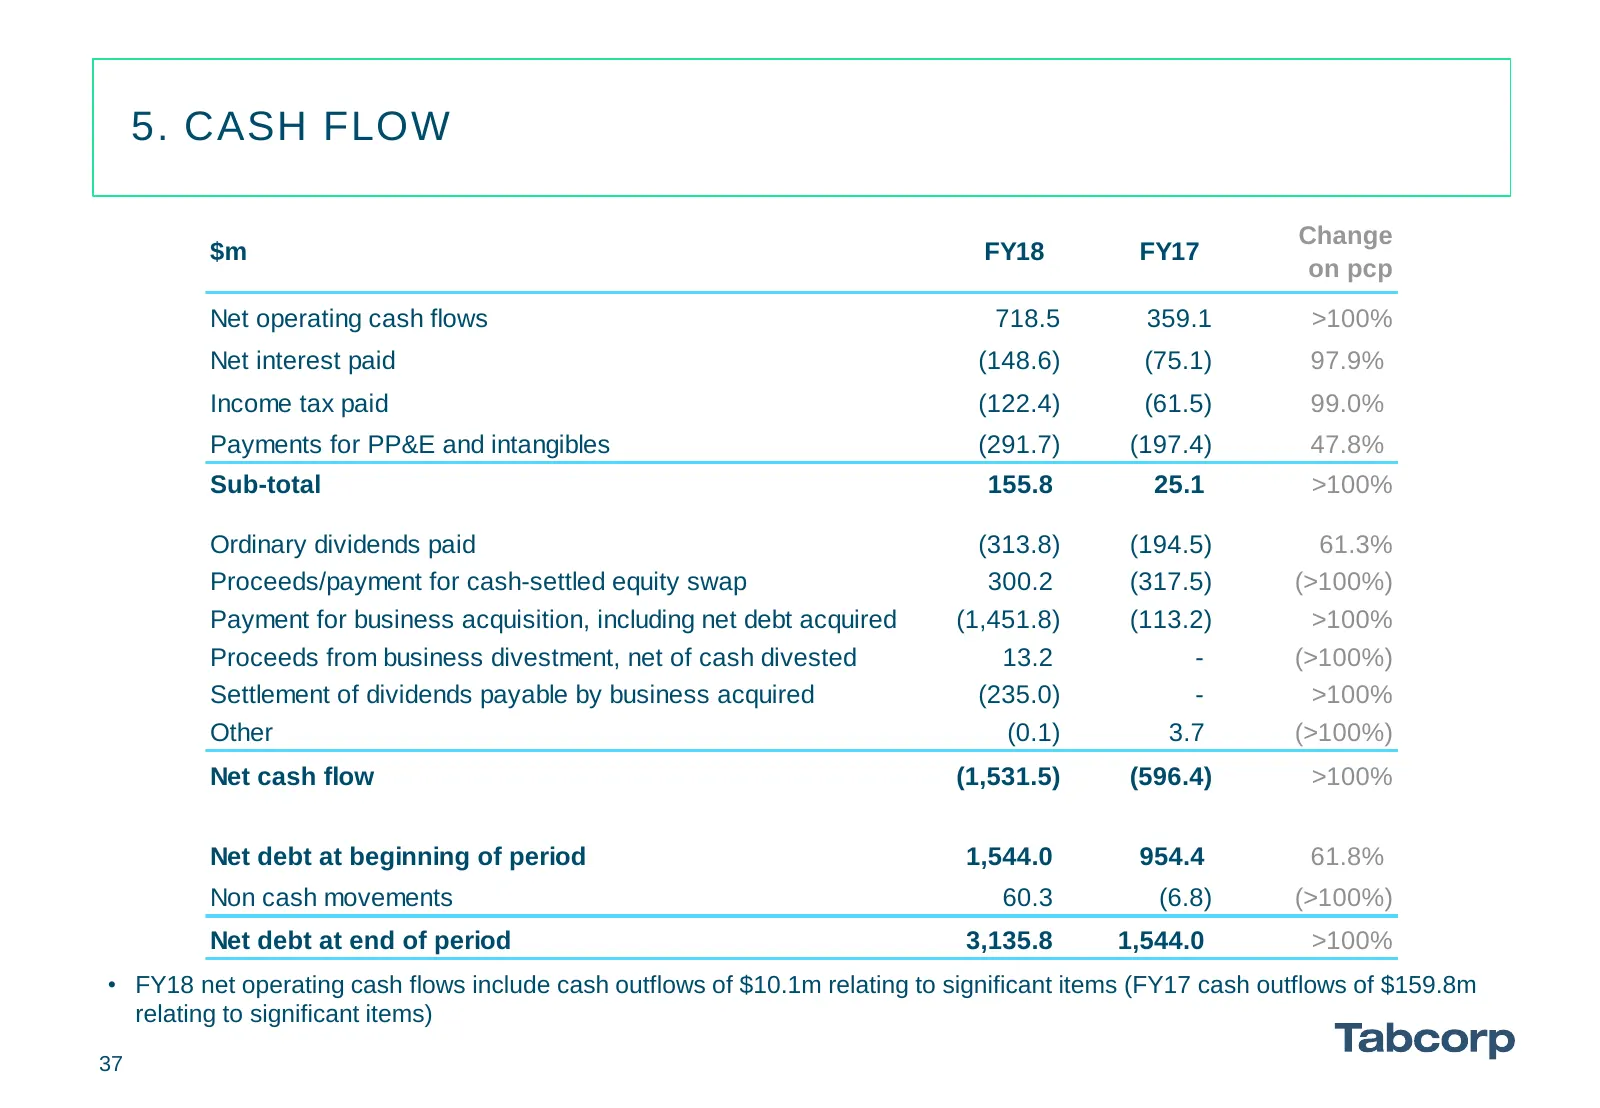
5. CASH FLOW Change $m FY18 FY17 on pcp Net operating cash flows 718.5 359.1 >100% Net interest paid (148.6) (75.1) 97.9% Income tax paid (122.4) (61.5) 99.0% Payments for PP&E and intangibles (291.7) (197.4) 47.8% Sub-total 155.8 25.1 >100% Ordinary dividends paid (313.8) (194.5) 61.3% Proceeds/pay
Slide 38: Disclaimer
DISCLAIMER This Presentation contains summary information about the current activities of Tabcorp Holdings Limited (Tabcorp) and its subsidiaries (Tabcorp Group). It should be read in conjunction with the Tabcorp Group’s other periodic and continuous disclosure announcements lodged with the Australi
Slide 39: To Advance the Way We Play
TO ADVANCE THE WAY WE PLAY Tabcorp
Source: Internet Archive copy of tabcorp.com.au
More decks from Tabcorp Holdings Limited
 FY2026 Earnings Presentation40 slides · Aug 26, 2026
 FY2026 Earnings Presentation39 slides · Aug 25, 2026
 Investor Presentation (August 2026)16 slides · Aug 10, 2026
 Macquarie Australia Conference 202614 slides · May 5, 2026
 1H26 Earnings Presentation39 slides · Feb 25, 2026
 Shareholder Meeting (October 2025)17 slides · Oct 20, 2025