Rehabcare — Investor Day (May 2010)
50 slides from Rehabcare's investor day presentation, May 18, 2010

Slide 1: Welcome and Introductions
Exhibit 99 Welcome and Introductions John H. Short President and CEO
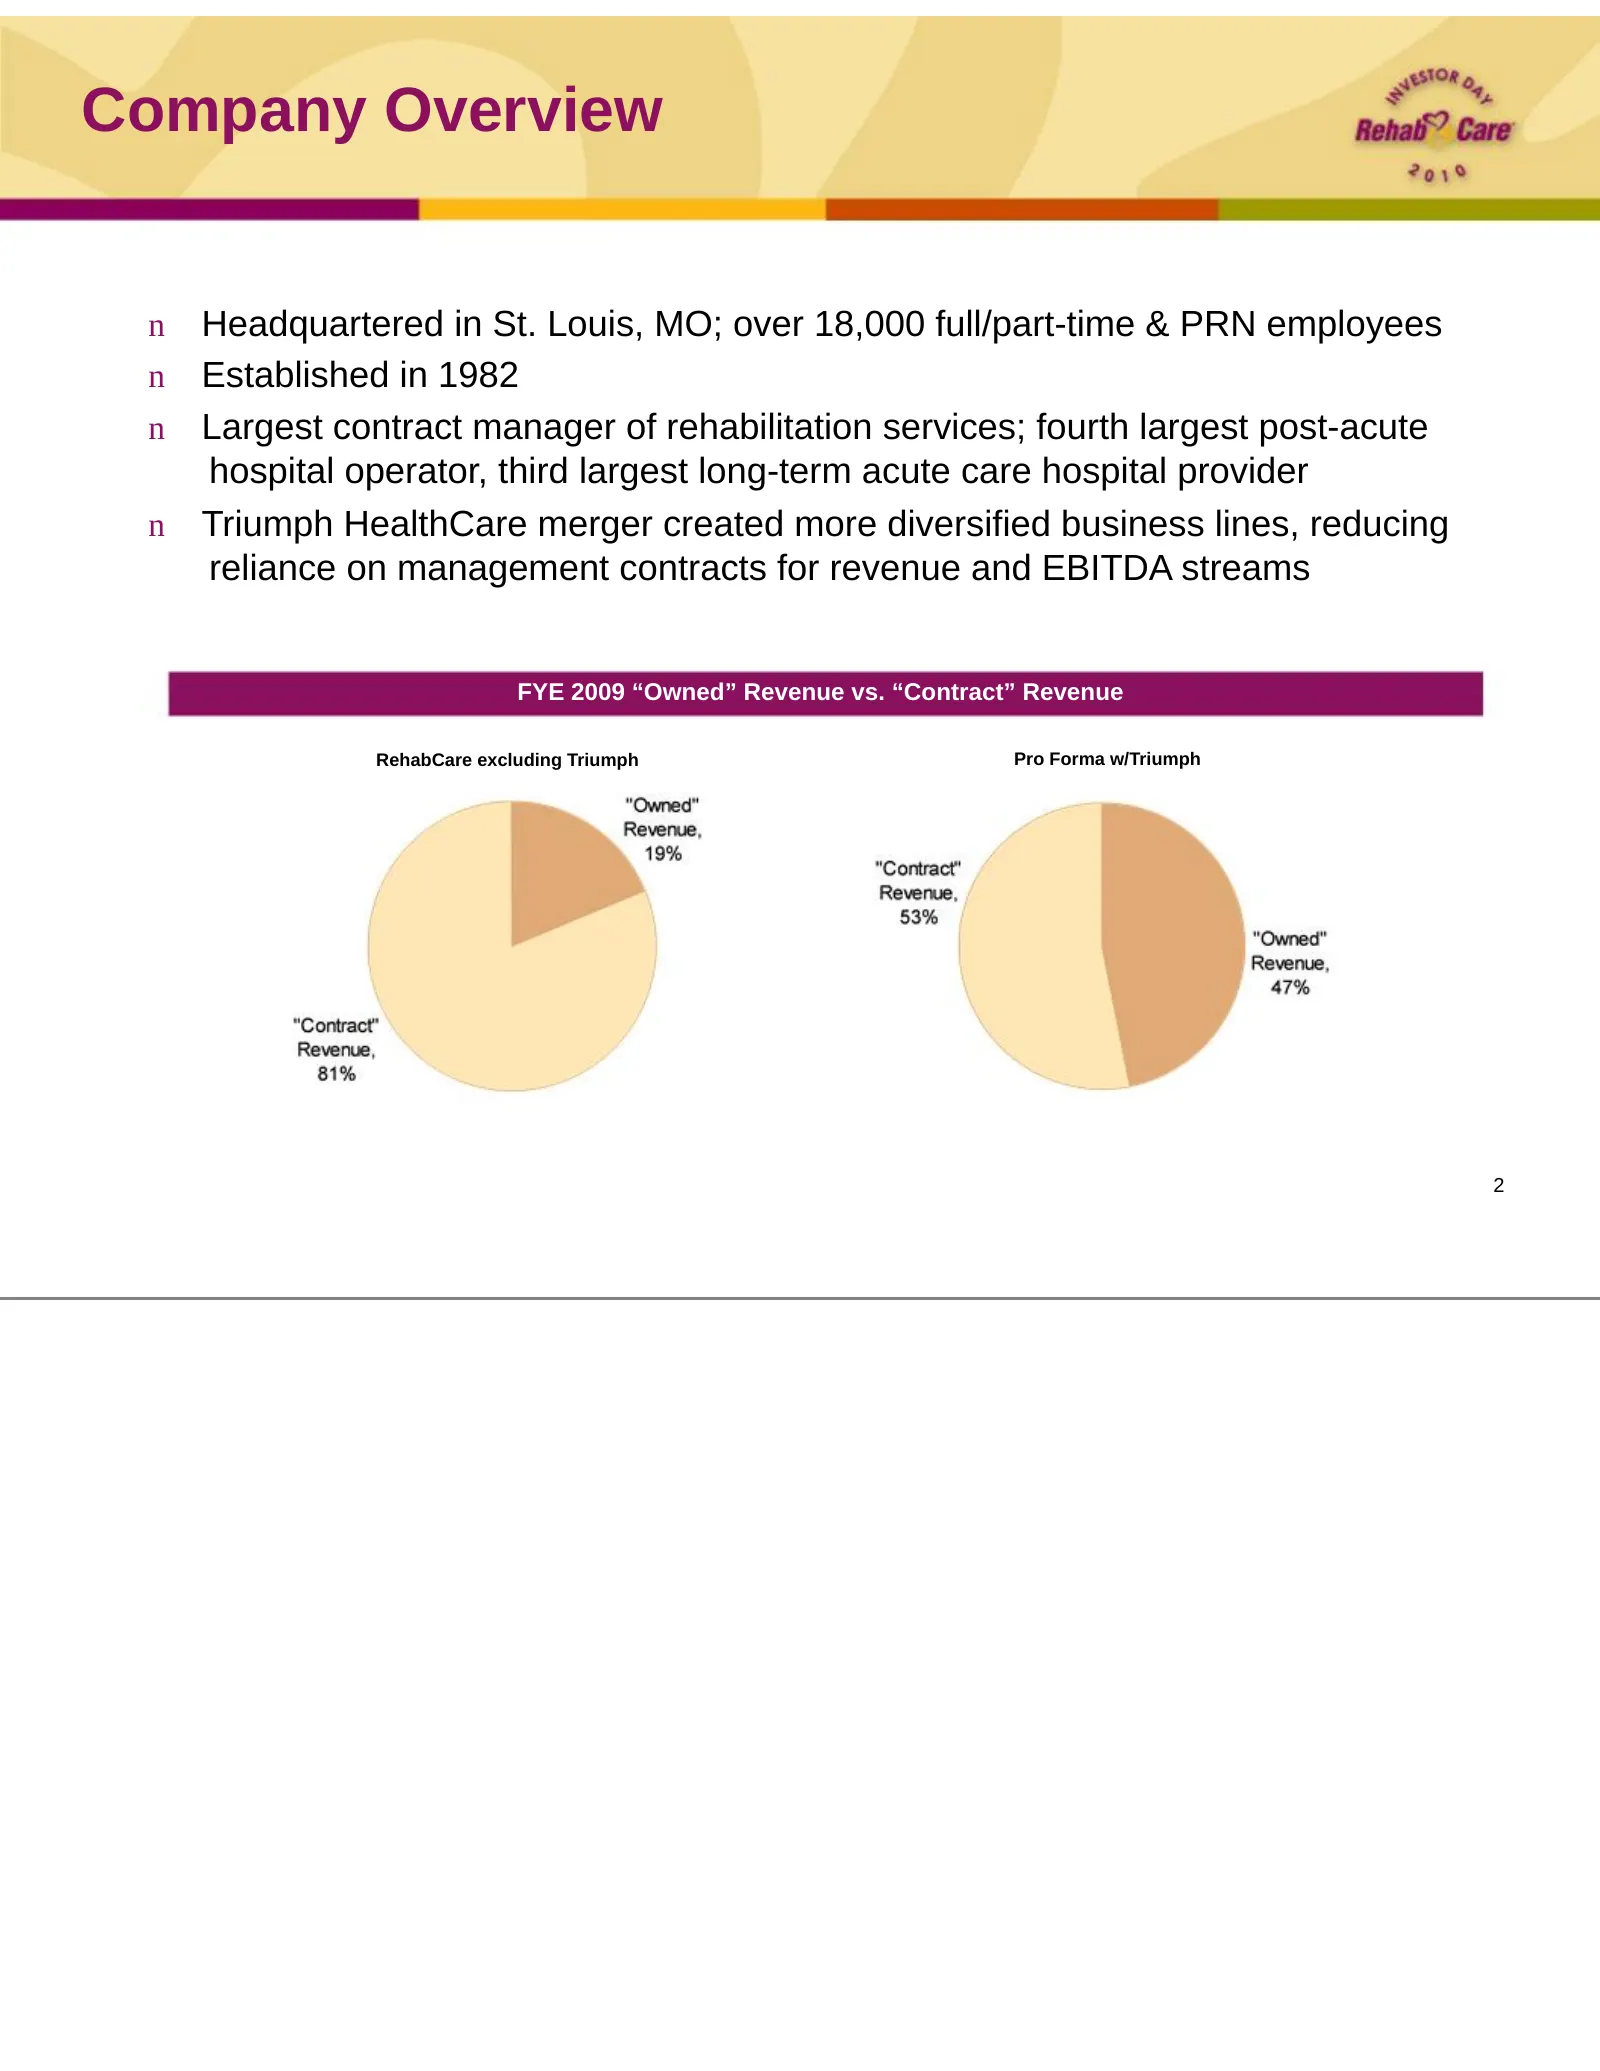
Slide 2: Company Overview
Company Overview n Headquartered in St. Louis, MO; over 18,000 full/part-time & PRN employees n Established in 1982 n Largest contract manager of rehabilitation services; fourth largest post-acute hospital operator, third largest long-term acute care hospital provider n Triumph HealthCare merger cre
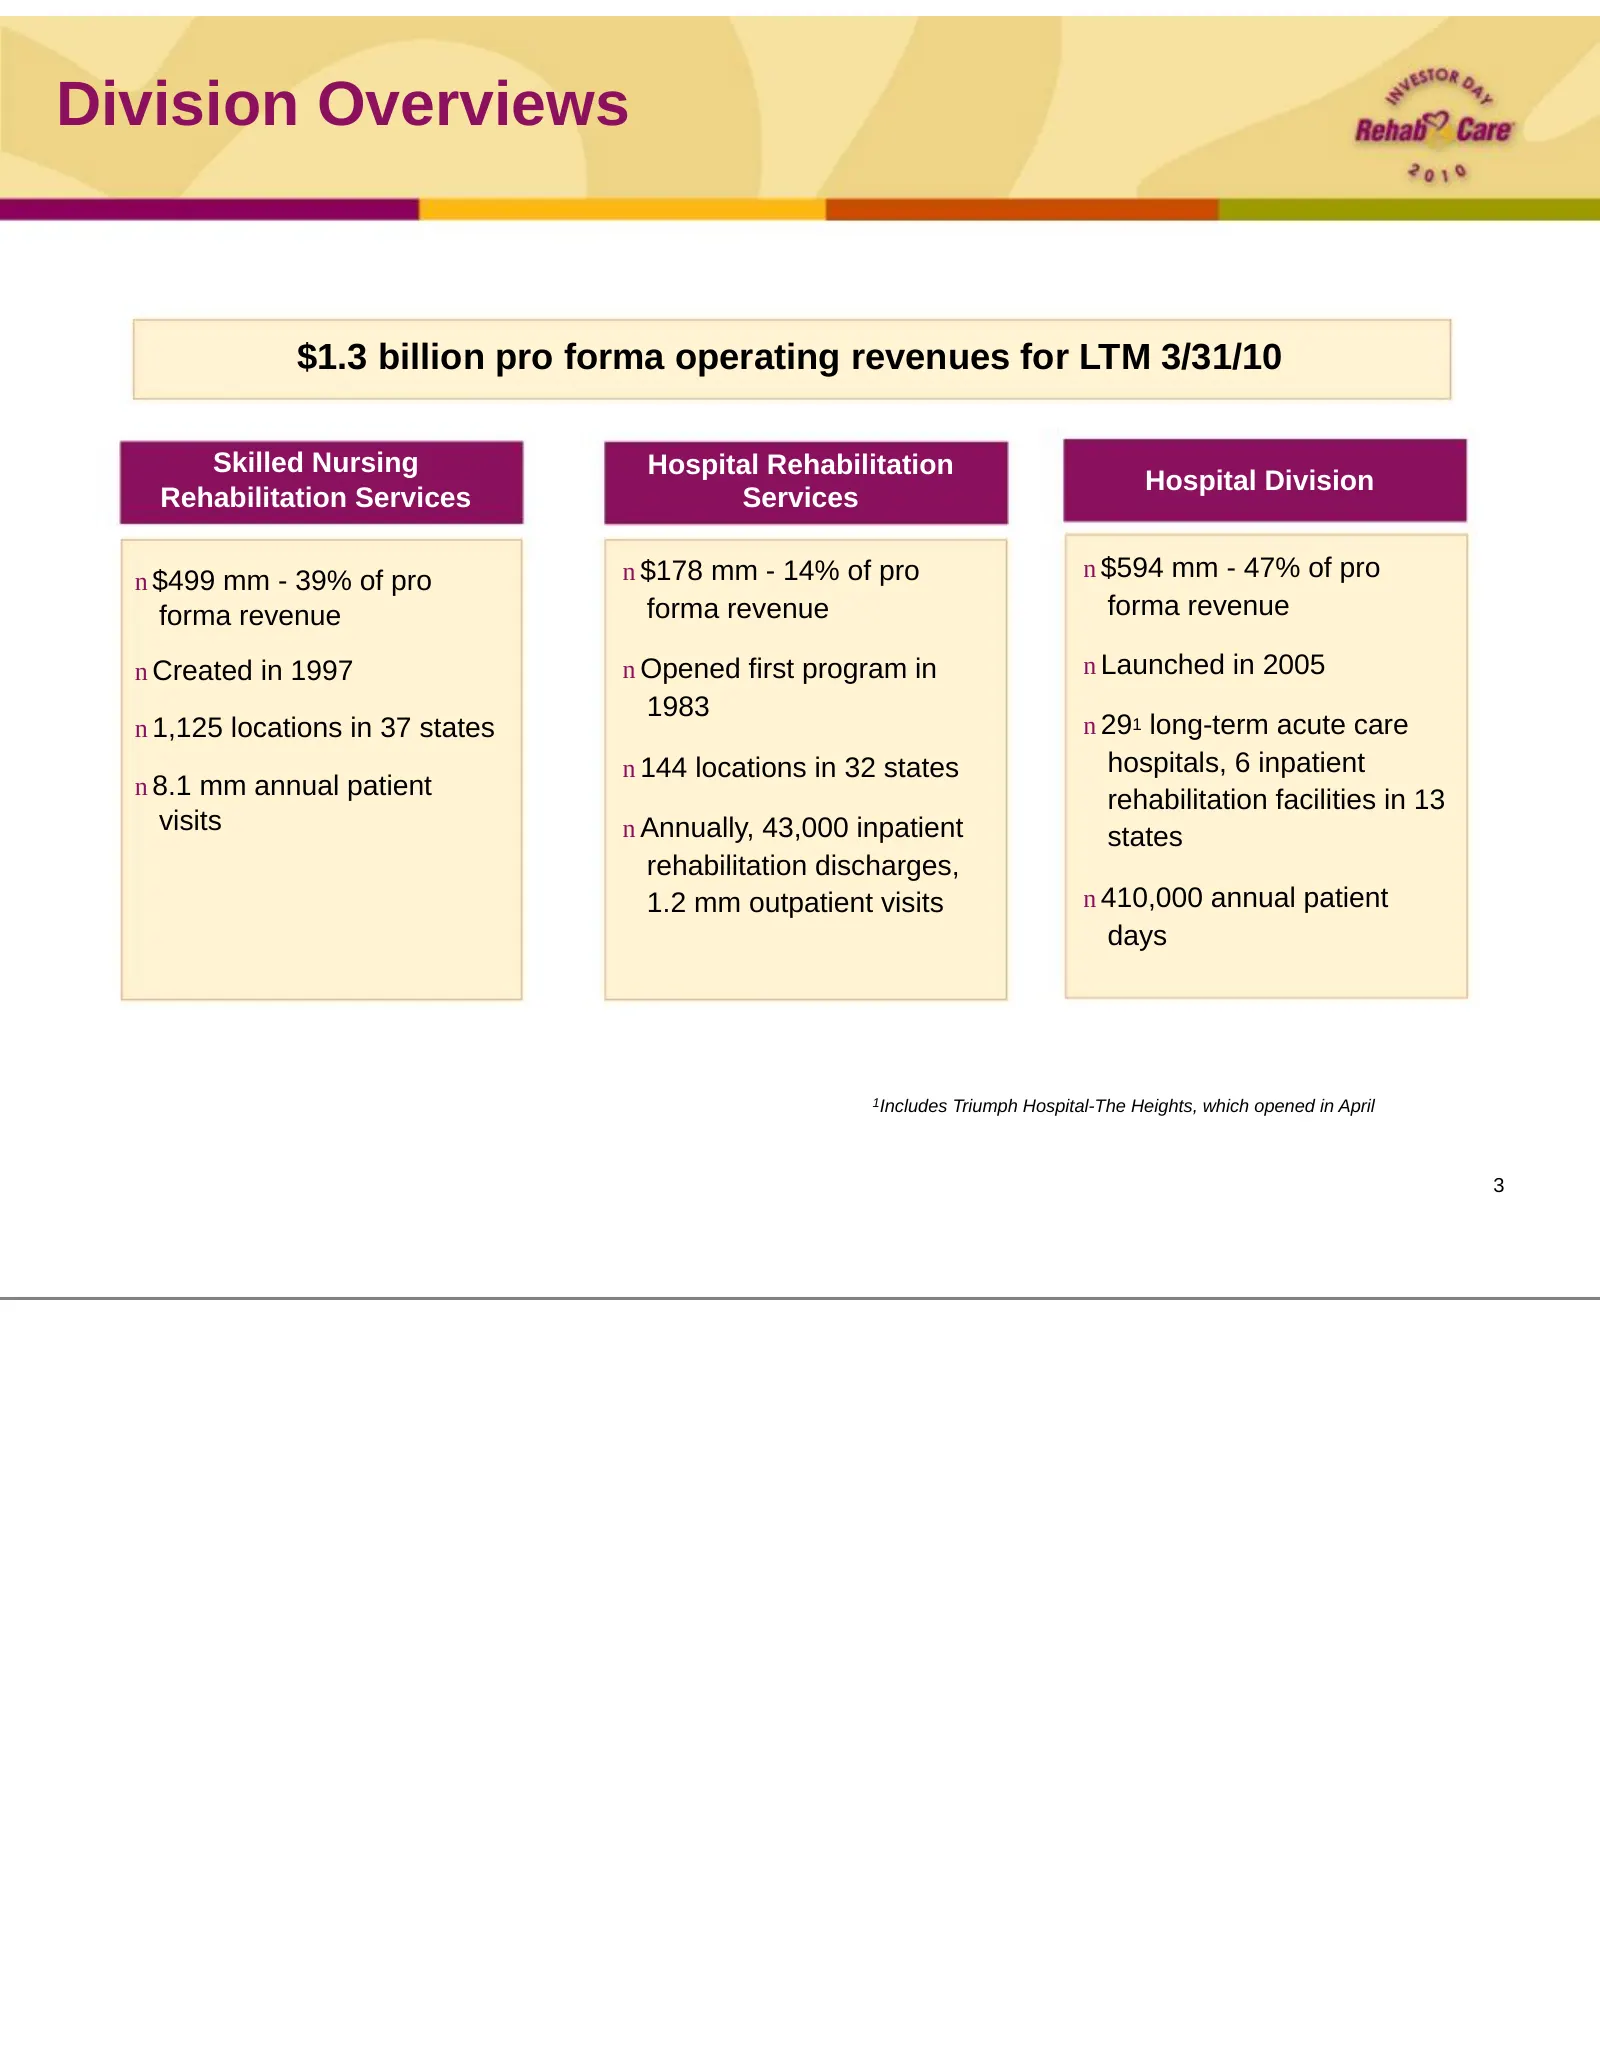
Slide 3: Division Overviews
Division Overviews $1.3 billion pro forma operating revenues for LTM 3/31/10 Skilled Nursing Hospital Rehabilitation Hospital Division Rehabilitation Services Services n $178 mm - 14% of pro n $594 mm - 47% of pro n $499 mm - 39% of pro forma revenue forma revenue forma revenue n Created in 1997 n O
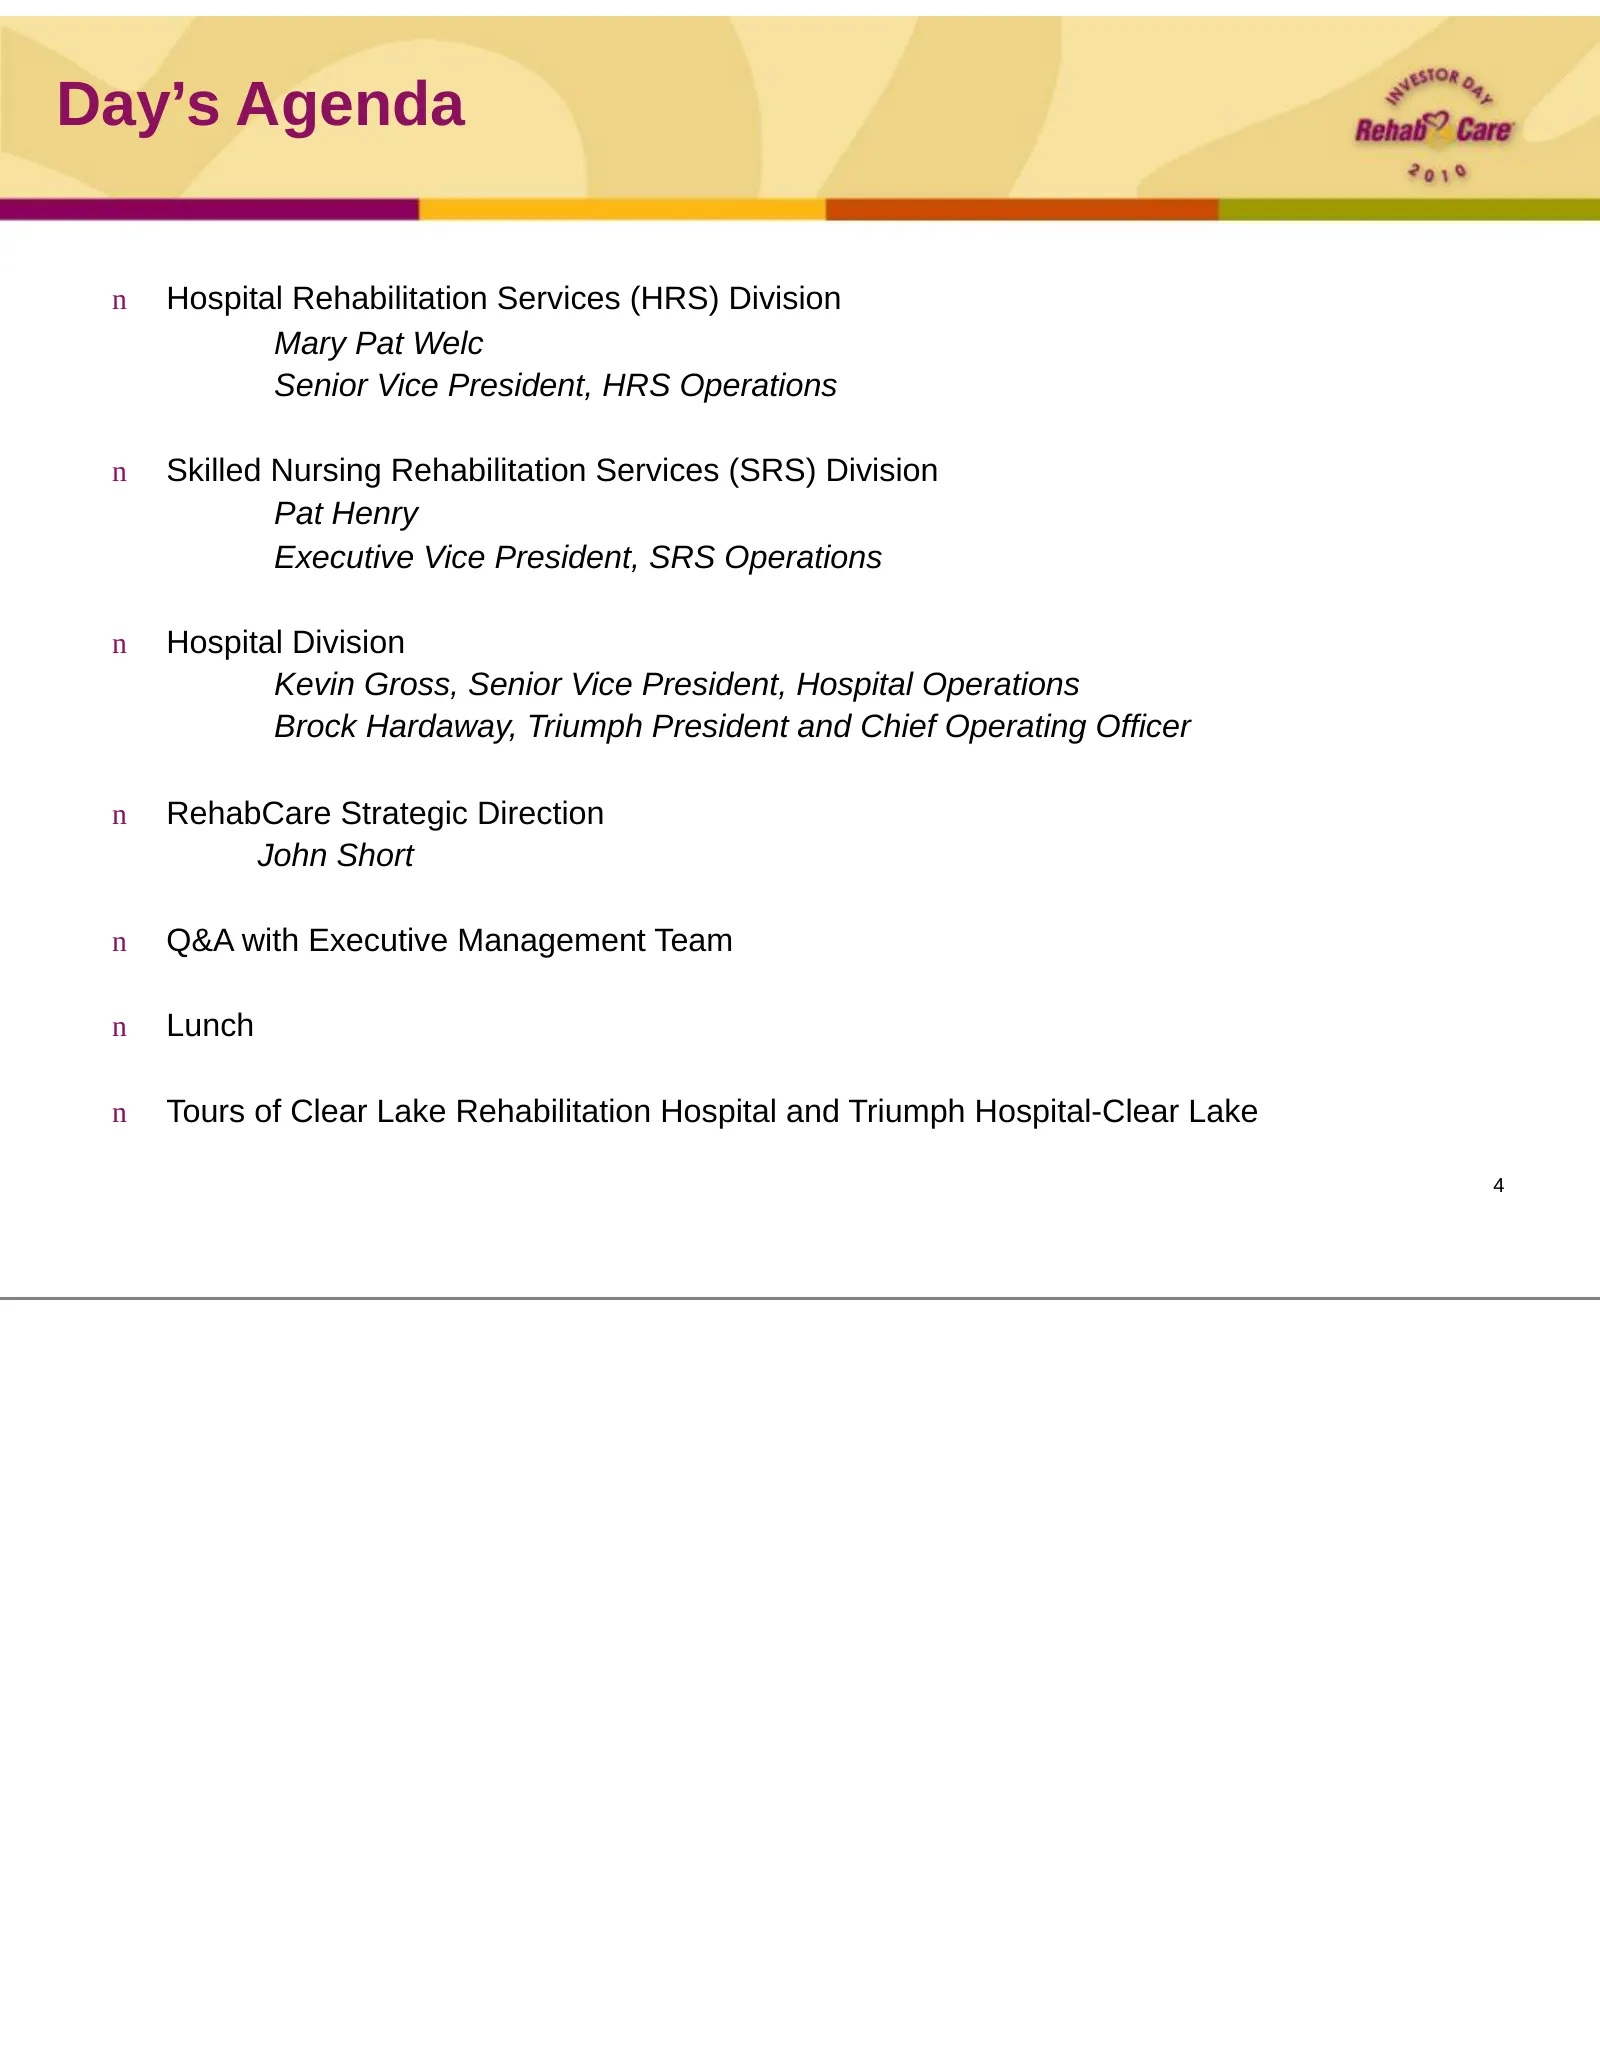
Slide 4: Day's Agenda
Day’s Agenda n Hospital Rehabilitation Services (HRS) Division Mary Pat Welc Senior Vice President, HRS Operations n Skilled Nursing Rehabilitation Services (SRS) Division Pat Henry Executive Vice President, SRS Operations n Hospital Division Kevin Gross, Senior Vice President, Hospital Operations B
Slide 5: Hospital Rehabilitation Services
Hospital Rehabilitation Services Mary Pat Welc Senior Vice President, HRS Operations
Slide 6: Hospital Rehabilitation Services (HRS)
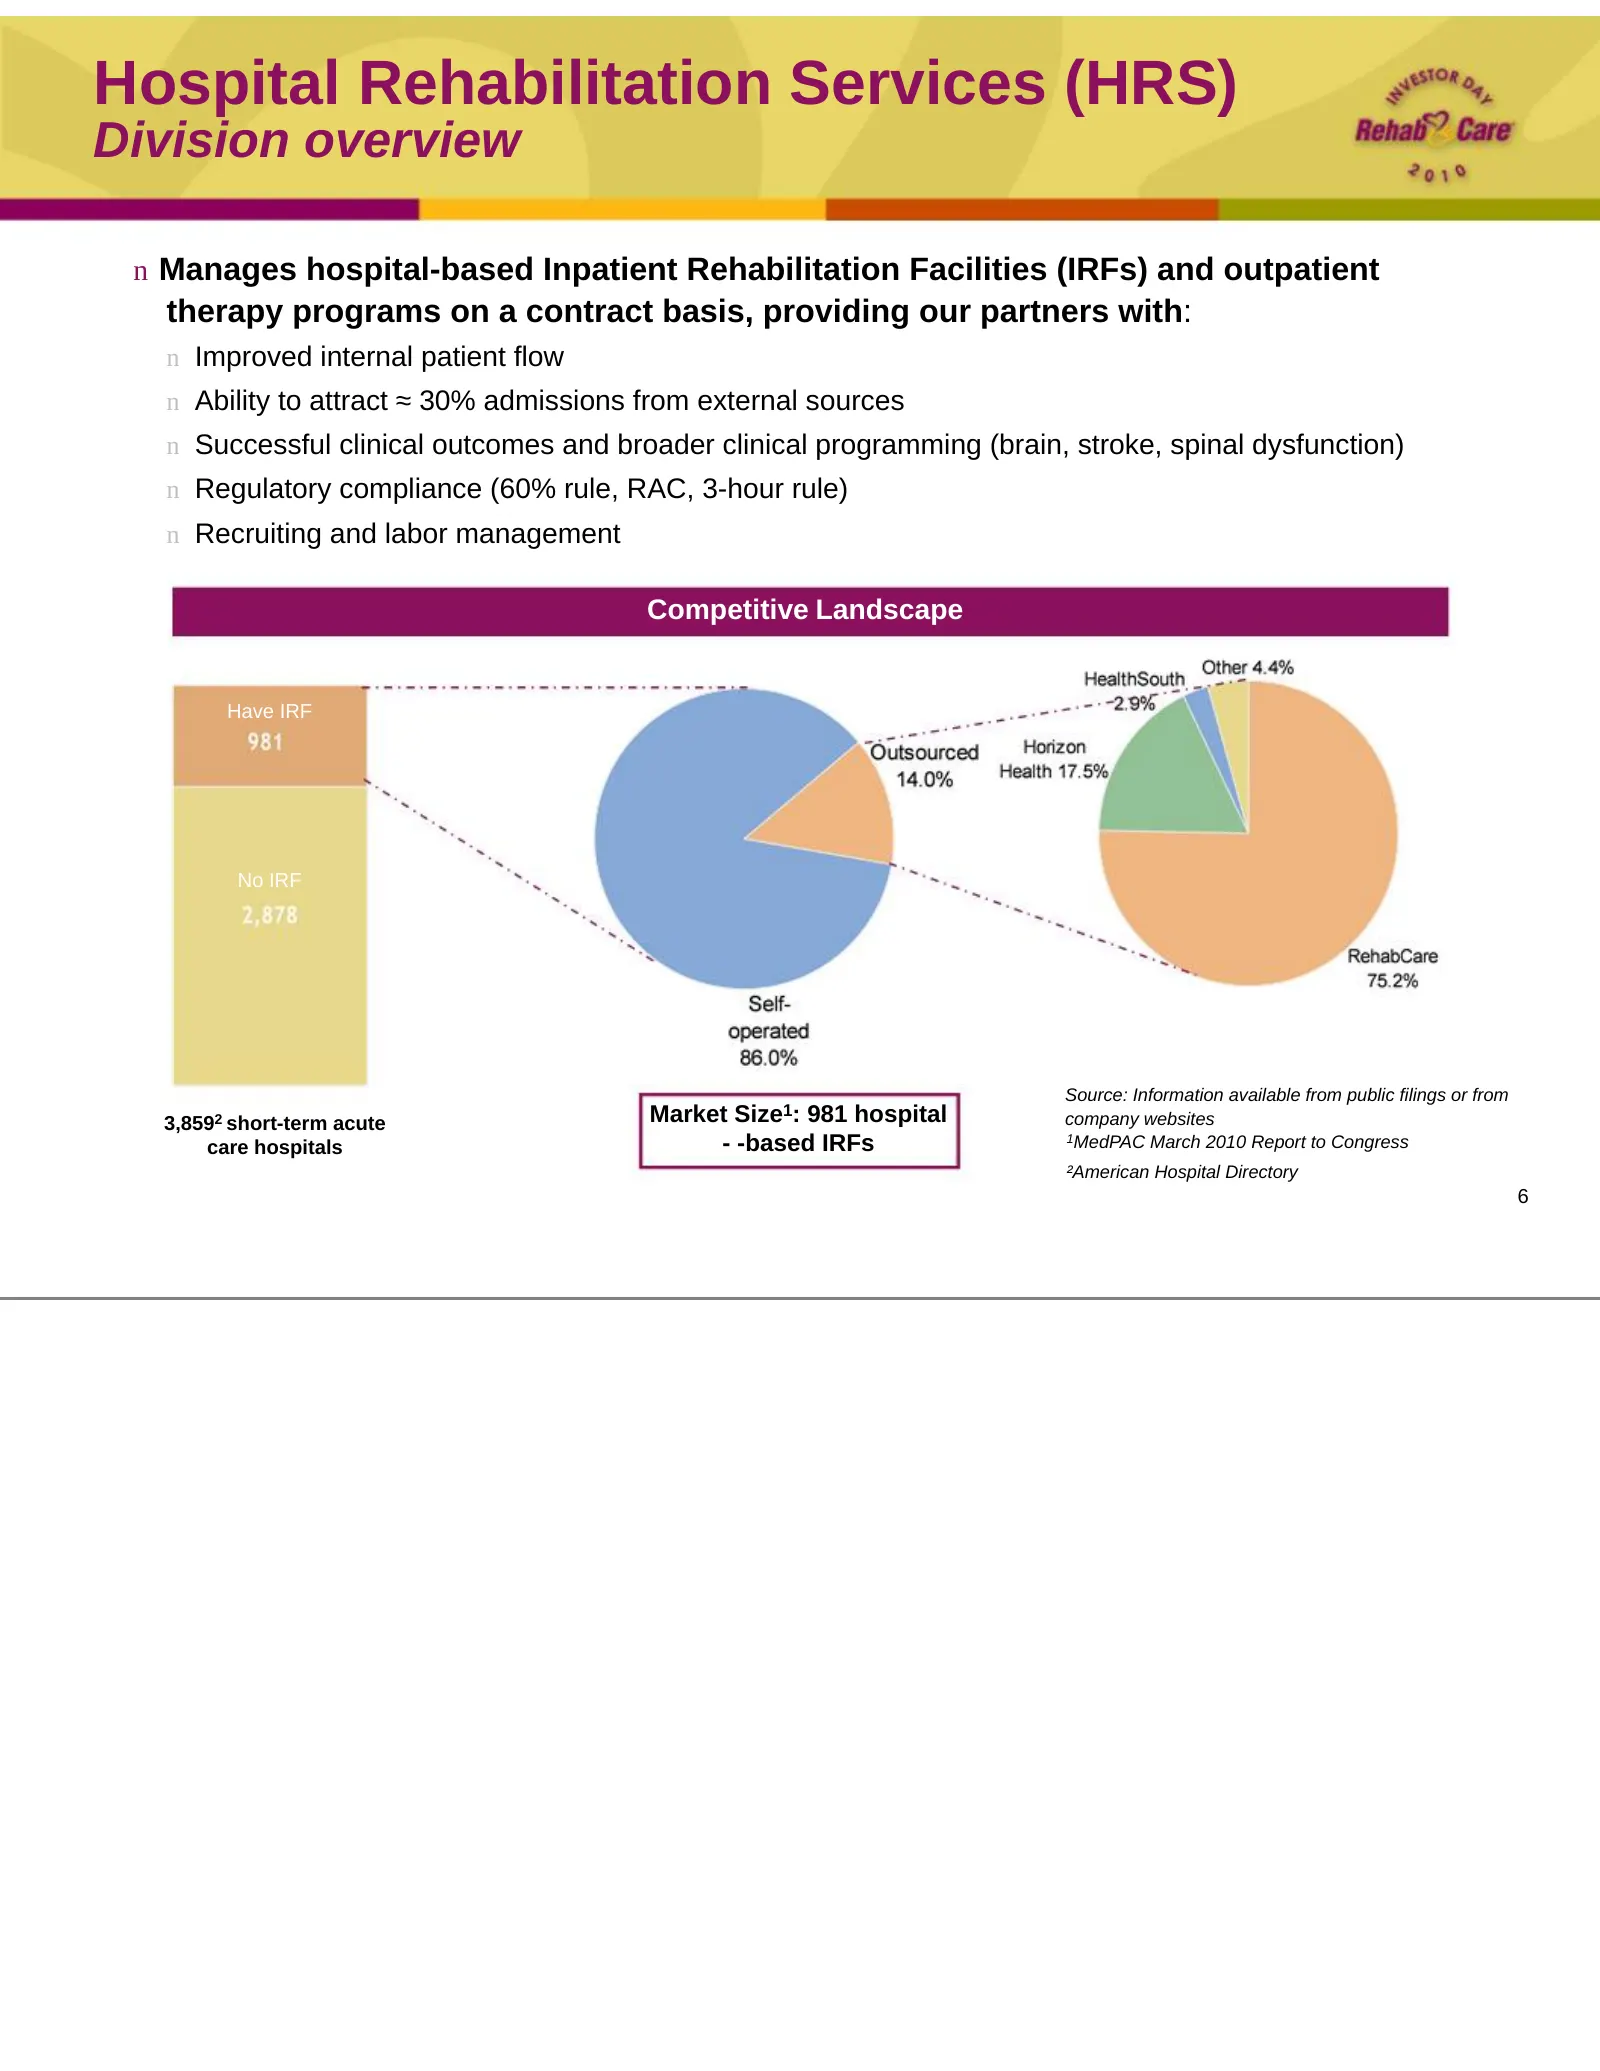
Hospital Rehabilitation Services (HRS) Division overview n Manages hospital-based Inpatient Rehabilitation Facilities (IRFs) and outpatient therapy programs on a contract basis, providing our partners with: n Improved internal patient flow n Ability to attract ≈ 30% admissions from external sources
Slide 7: HRS Division: Clinical outcomes
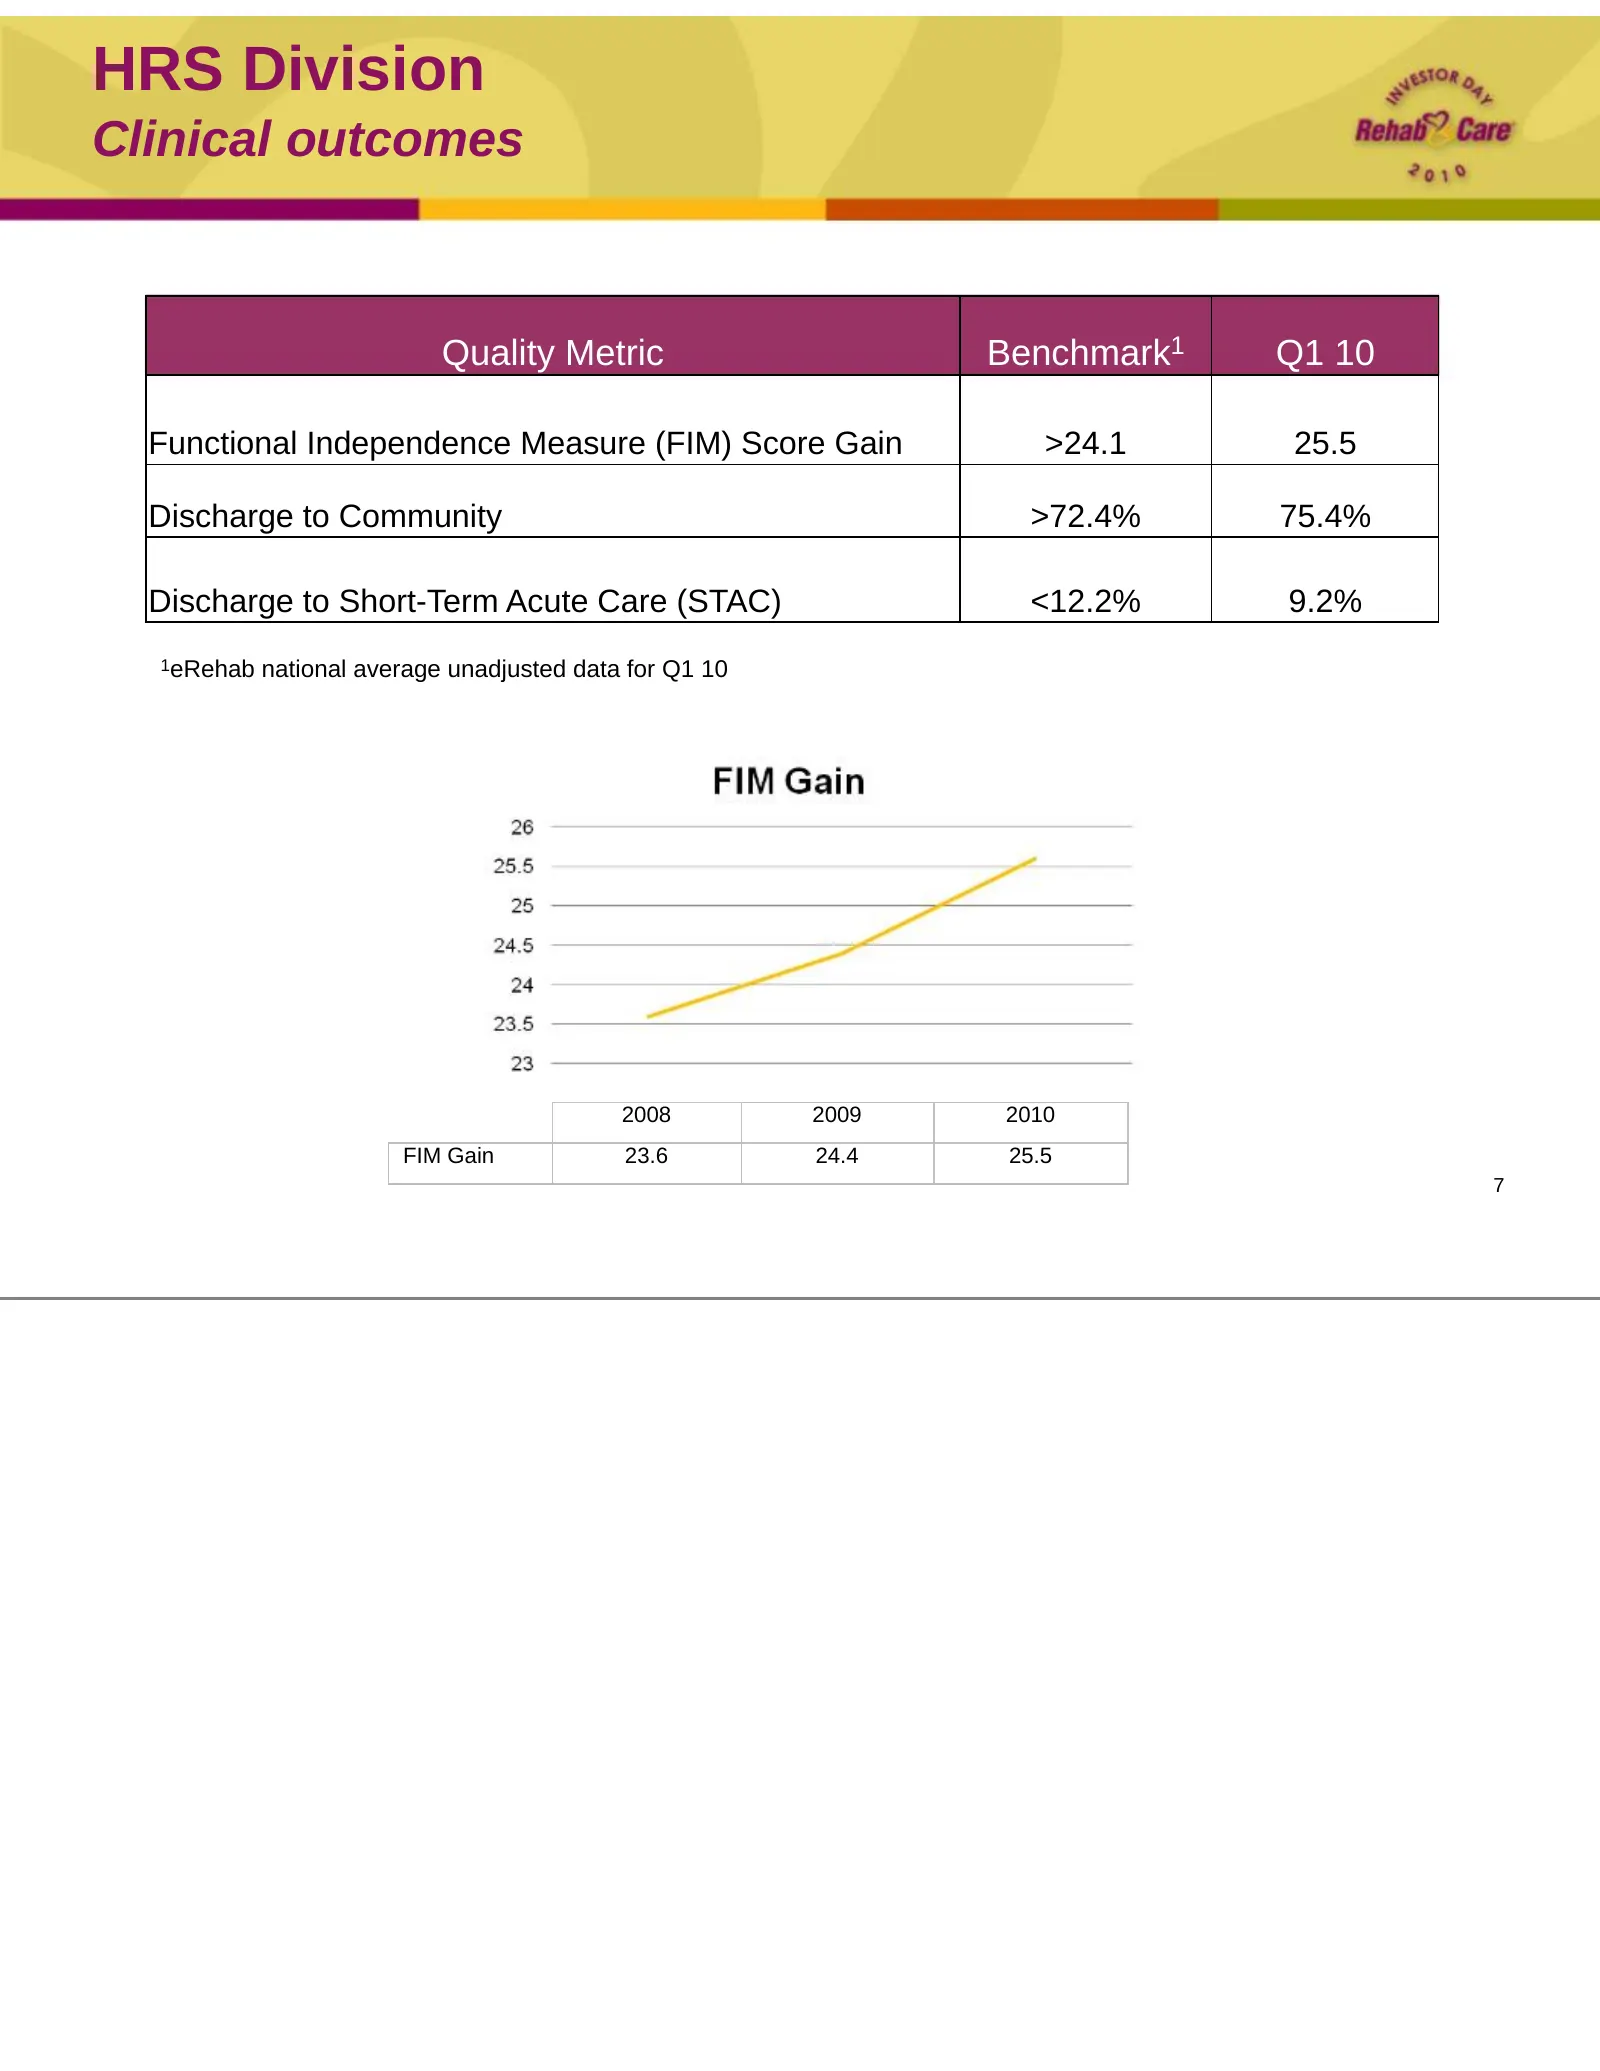
HRS Division Clinical outcomes Quality Metric Benchmark1 Q1 10 Functional Independence Measure (FIM) Score Gain >24.1 25.5 Discharge to Community >72.4% 75.4% Discharge to Short-Term Acute Care (STAC) <12.2% 9.2% 1eRehab national average unadjusted data for Q1 10 2008 2009 2010 FIM Gain 23.6 24.4 25
Slide 8: HRS Division: Client profile
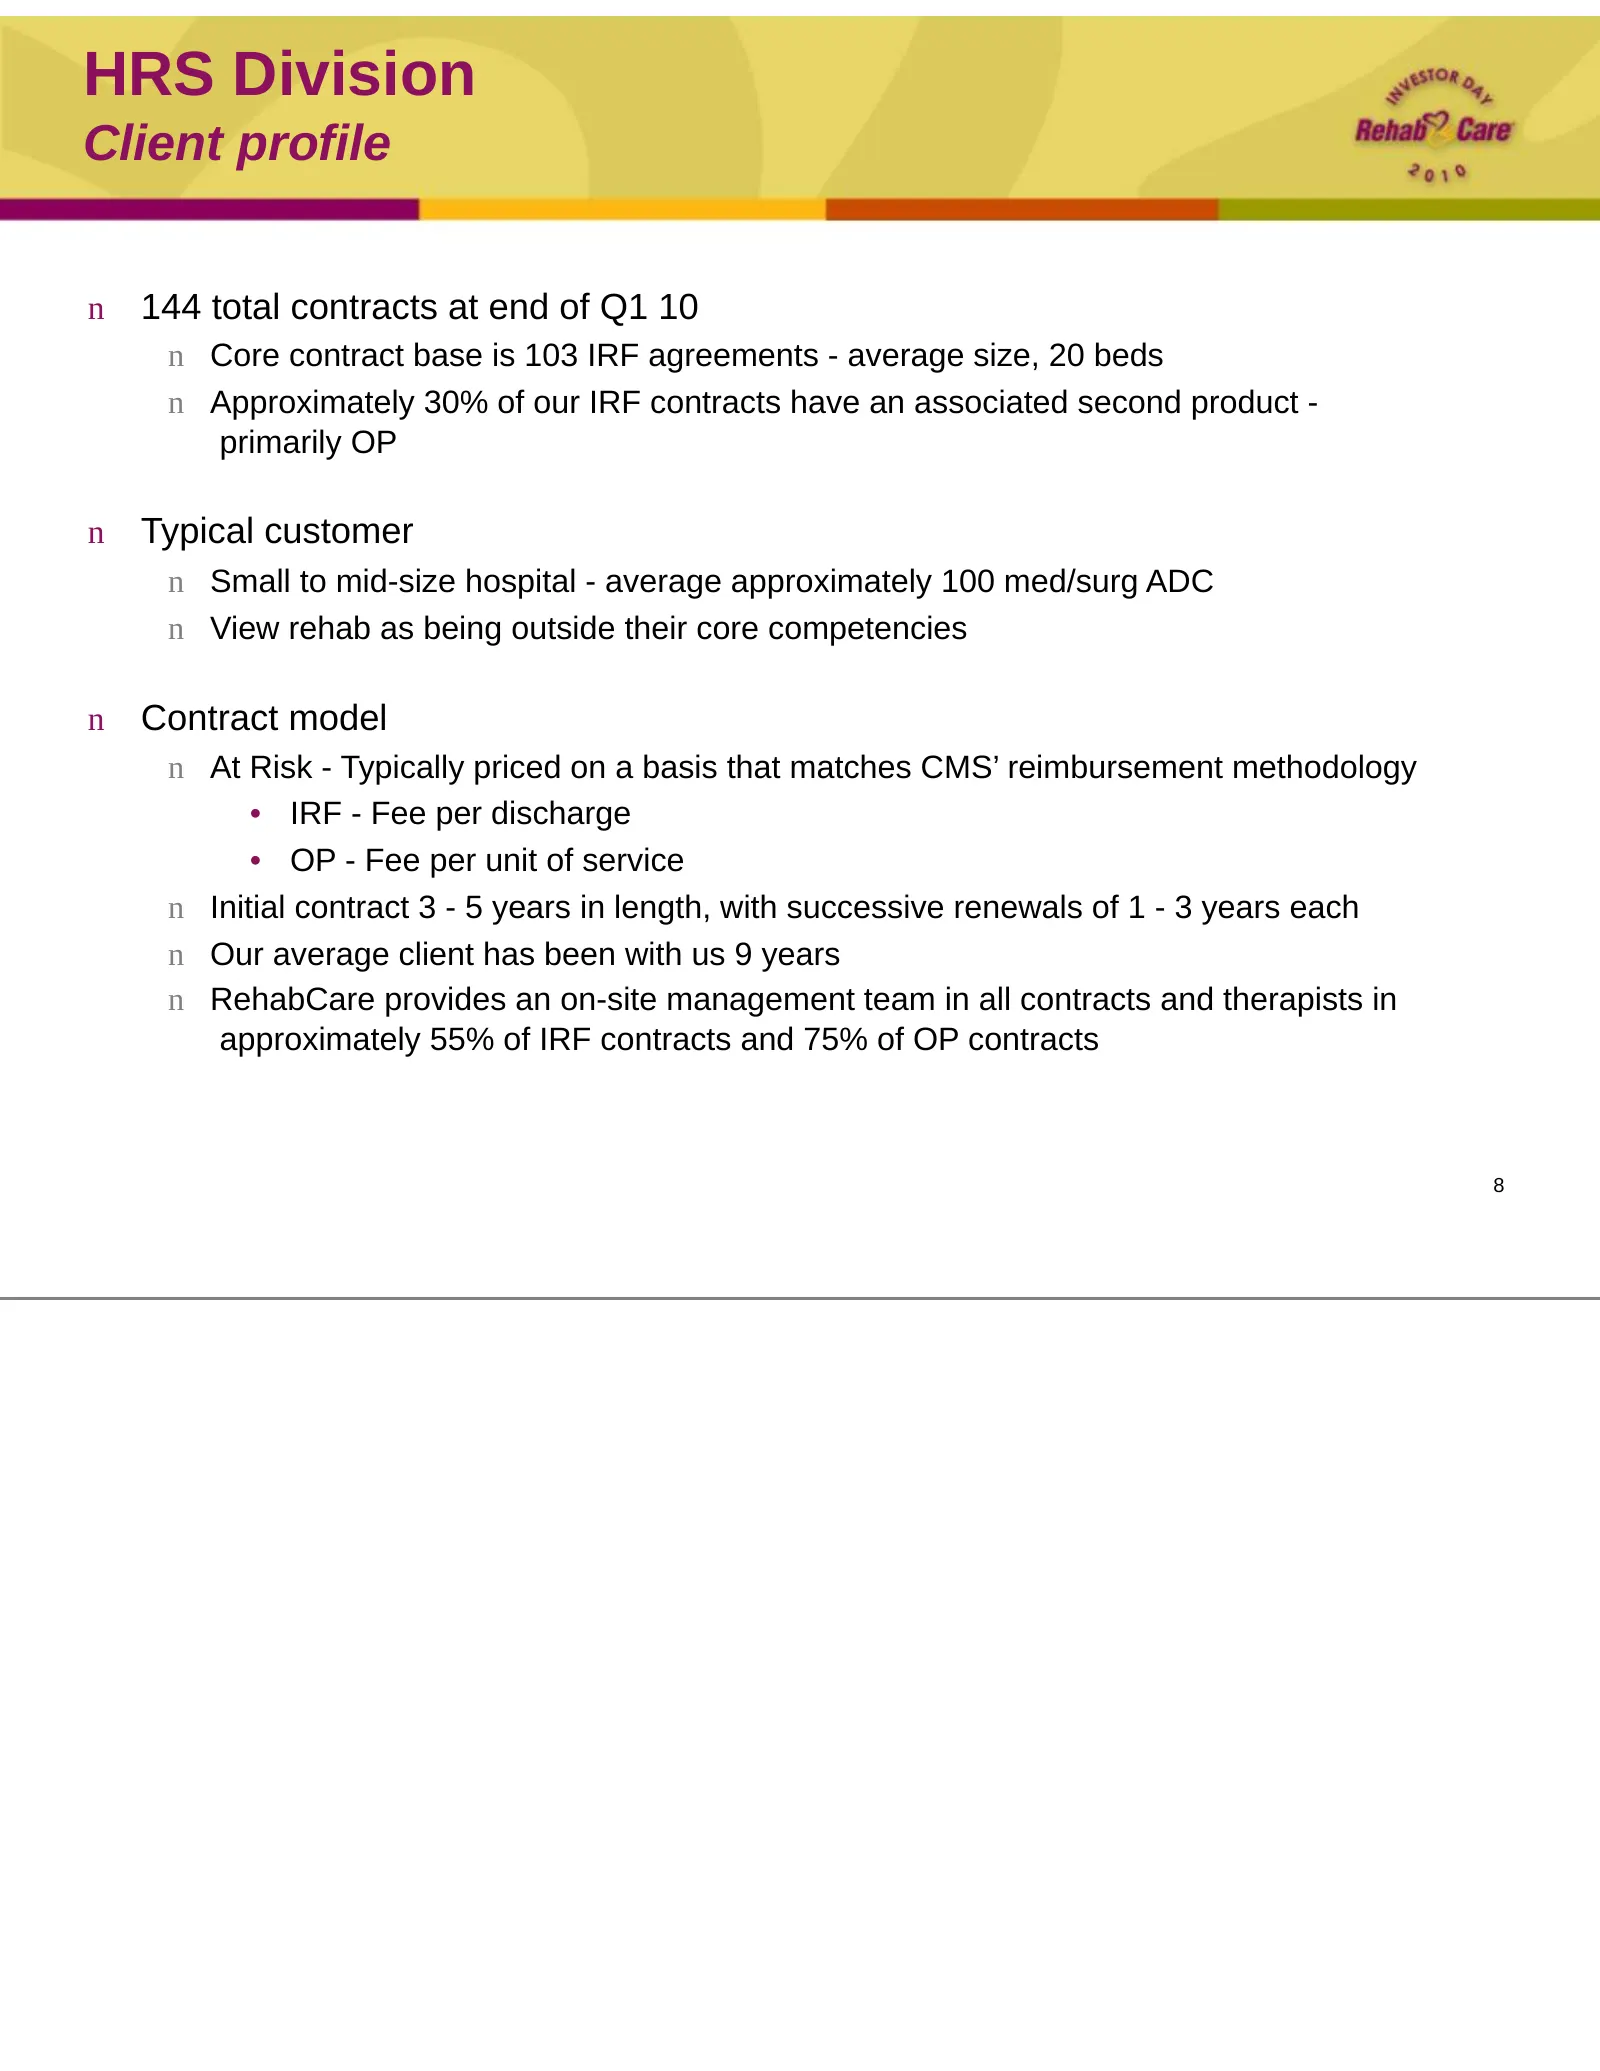
HRS Division Client profile n 144 total contracts at end of Q1 10 n Core contract base is 103 IRF agreements - average size, 20 beds n Approximately 30% of our IRF contracts have an associated second product - primarily OP n Typical customer n Small to mid-size hospital - average approximately 100 m
Slide 9: HRS Division: Growth strategy
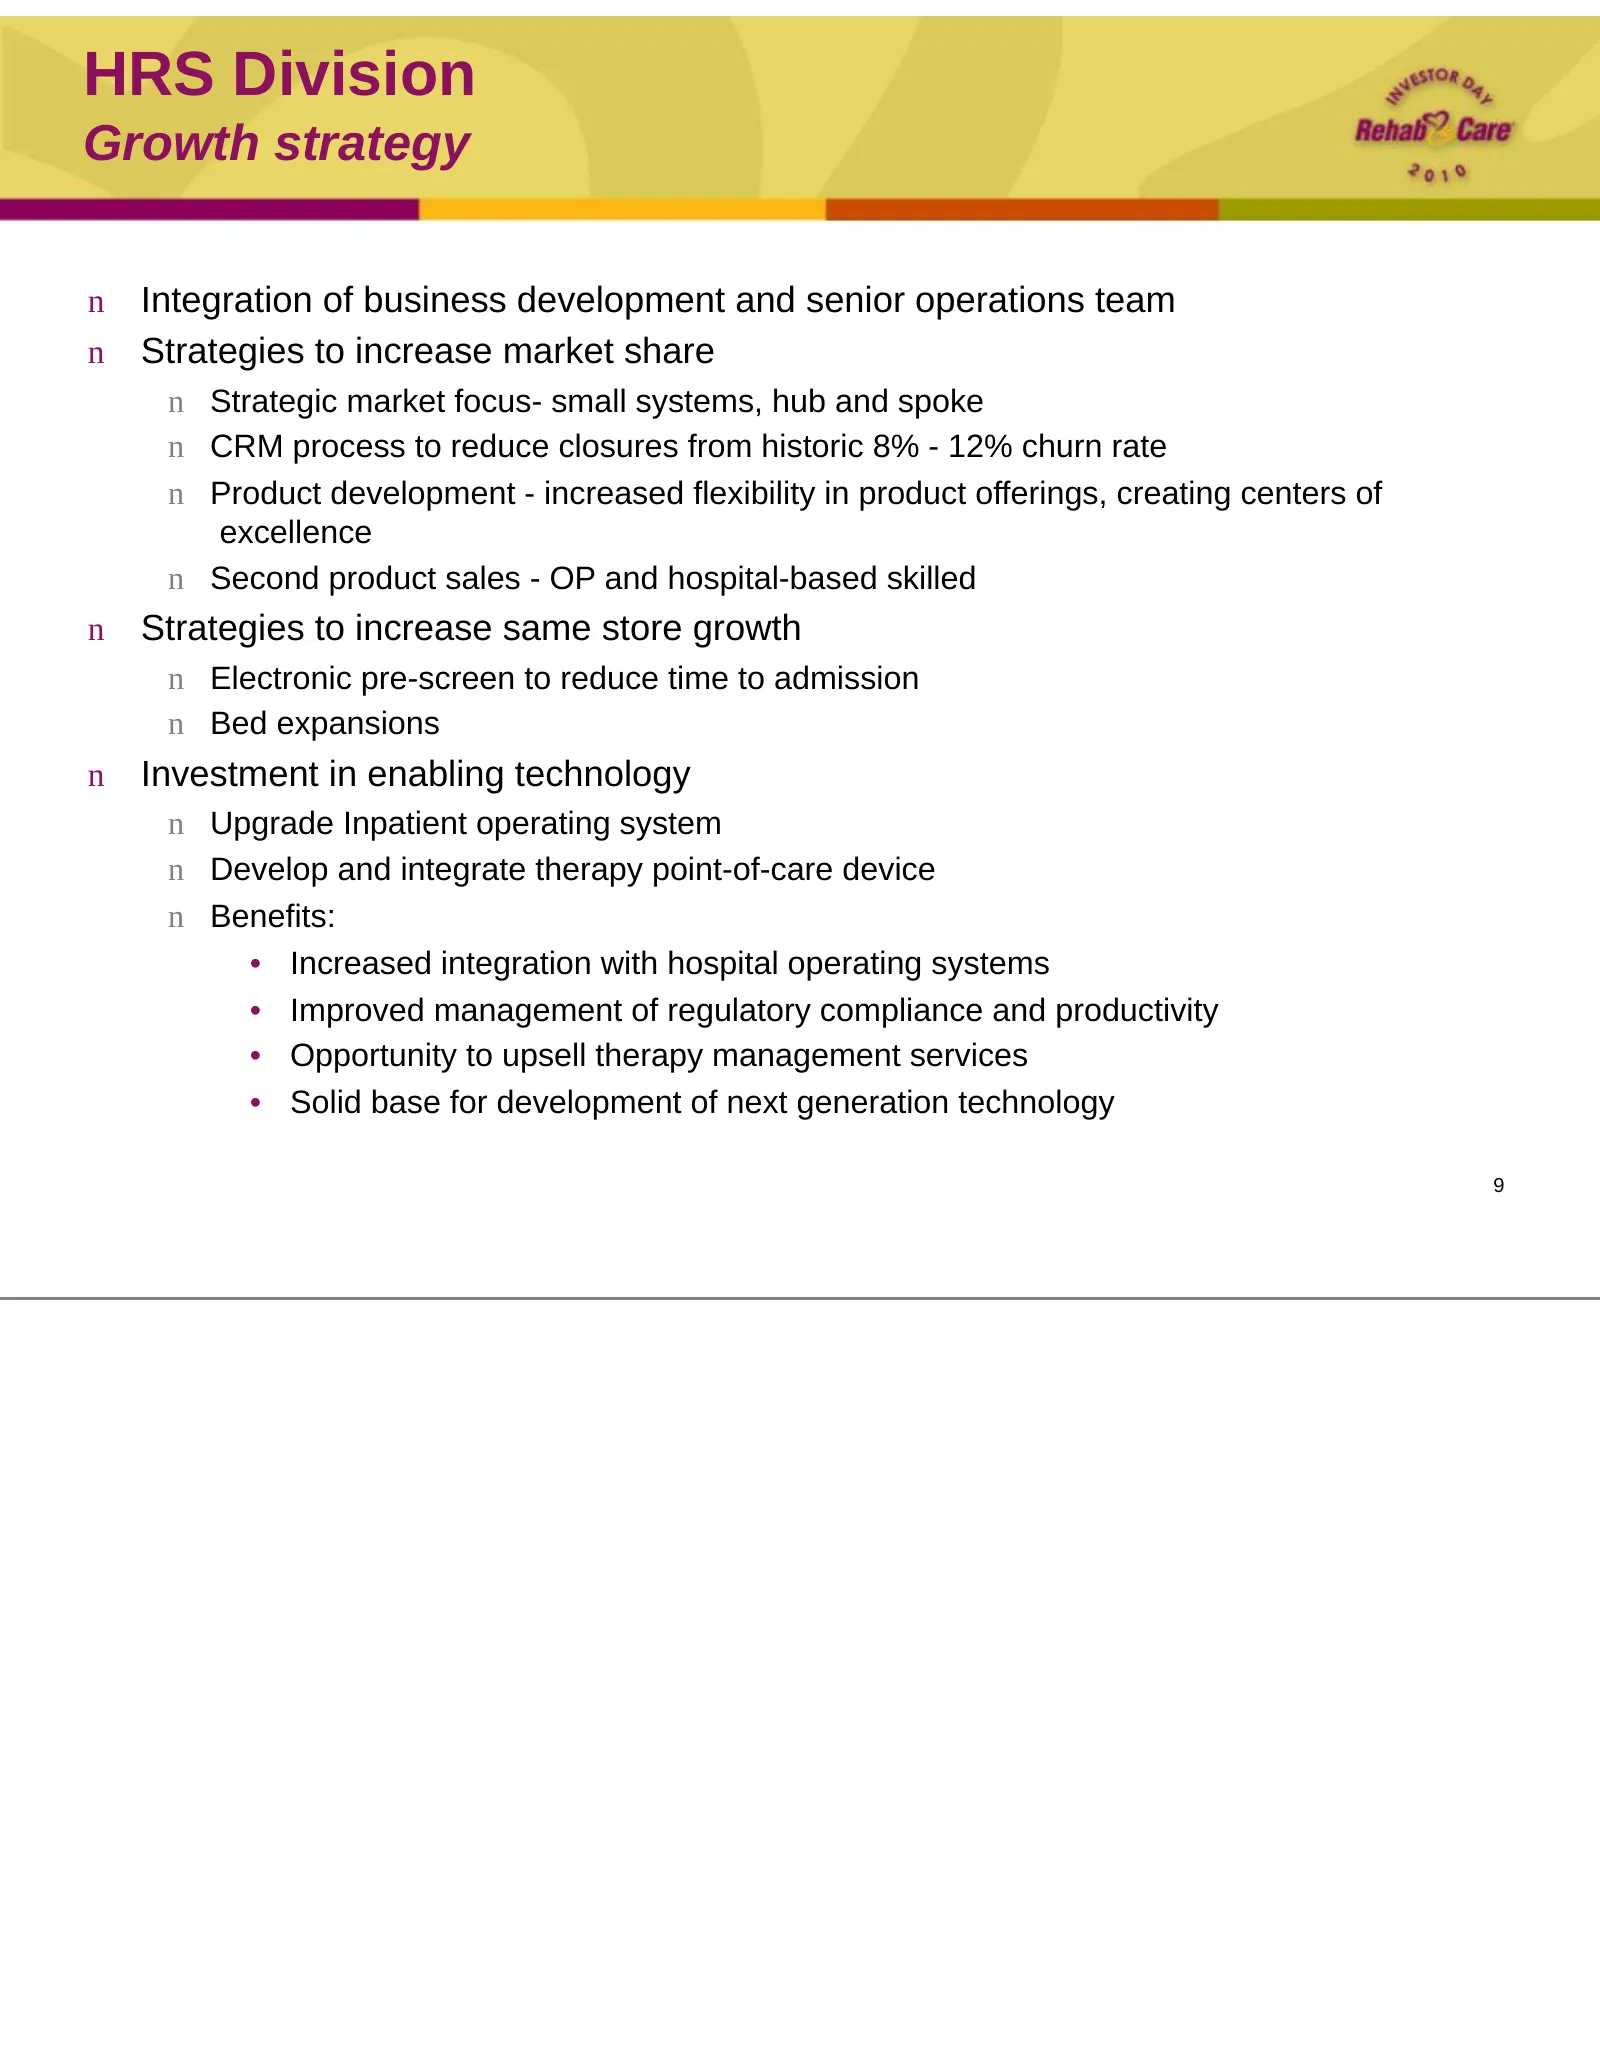
HRS Division Growth strategy n Integration of business development and senior operations team n Strategies to increase market share n Strategic market focus- small systems, hub and spoke n CRM process to reduce closures from historic 8% - 12% churn rate n Product development - increased flexibility
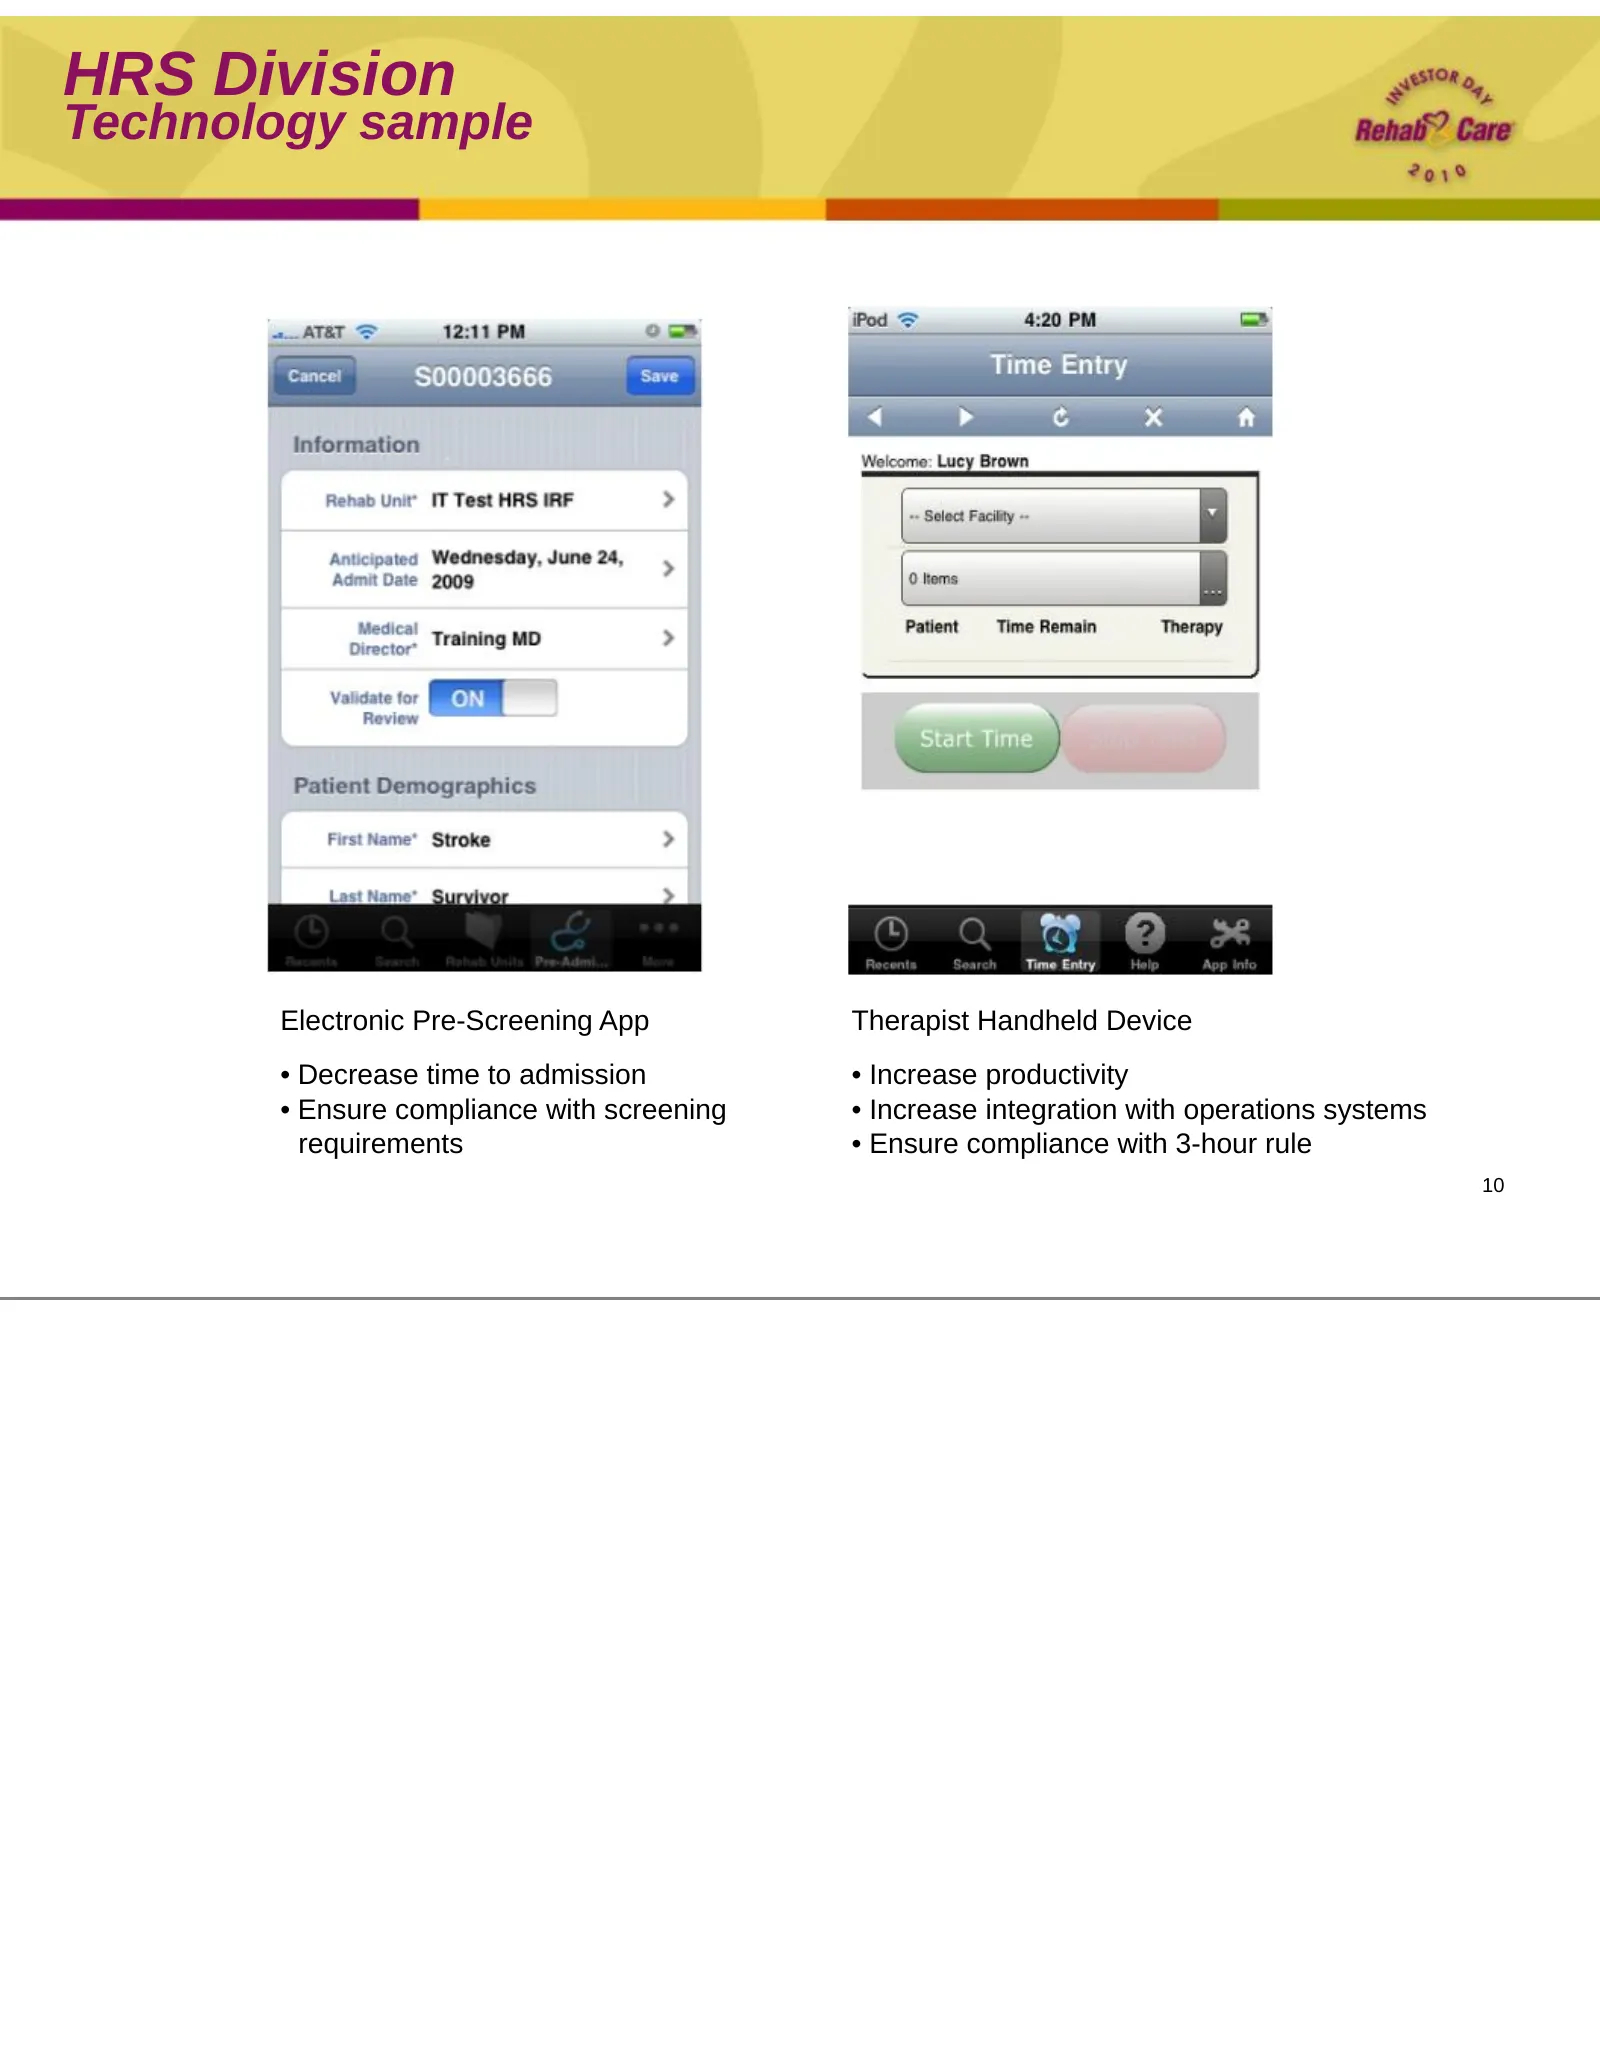
Slide 10: HRS Division: Technology sample
HRS Division Technology sample Electronic Pre-Screening App Therapist Handheld Device • Decrease time to admission • Increase productivity • Ensure compliance with screening • Increase integration with operations systems requirements • Ensure compliance with 3-hour rule 10
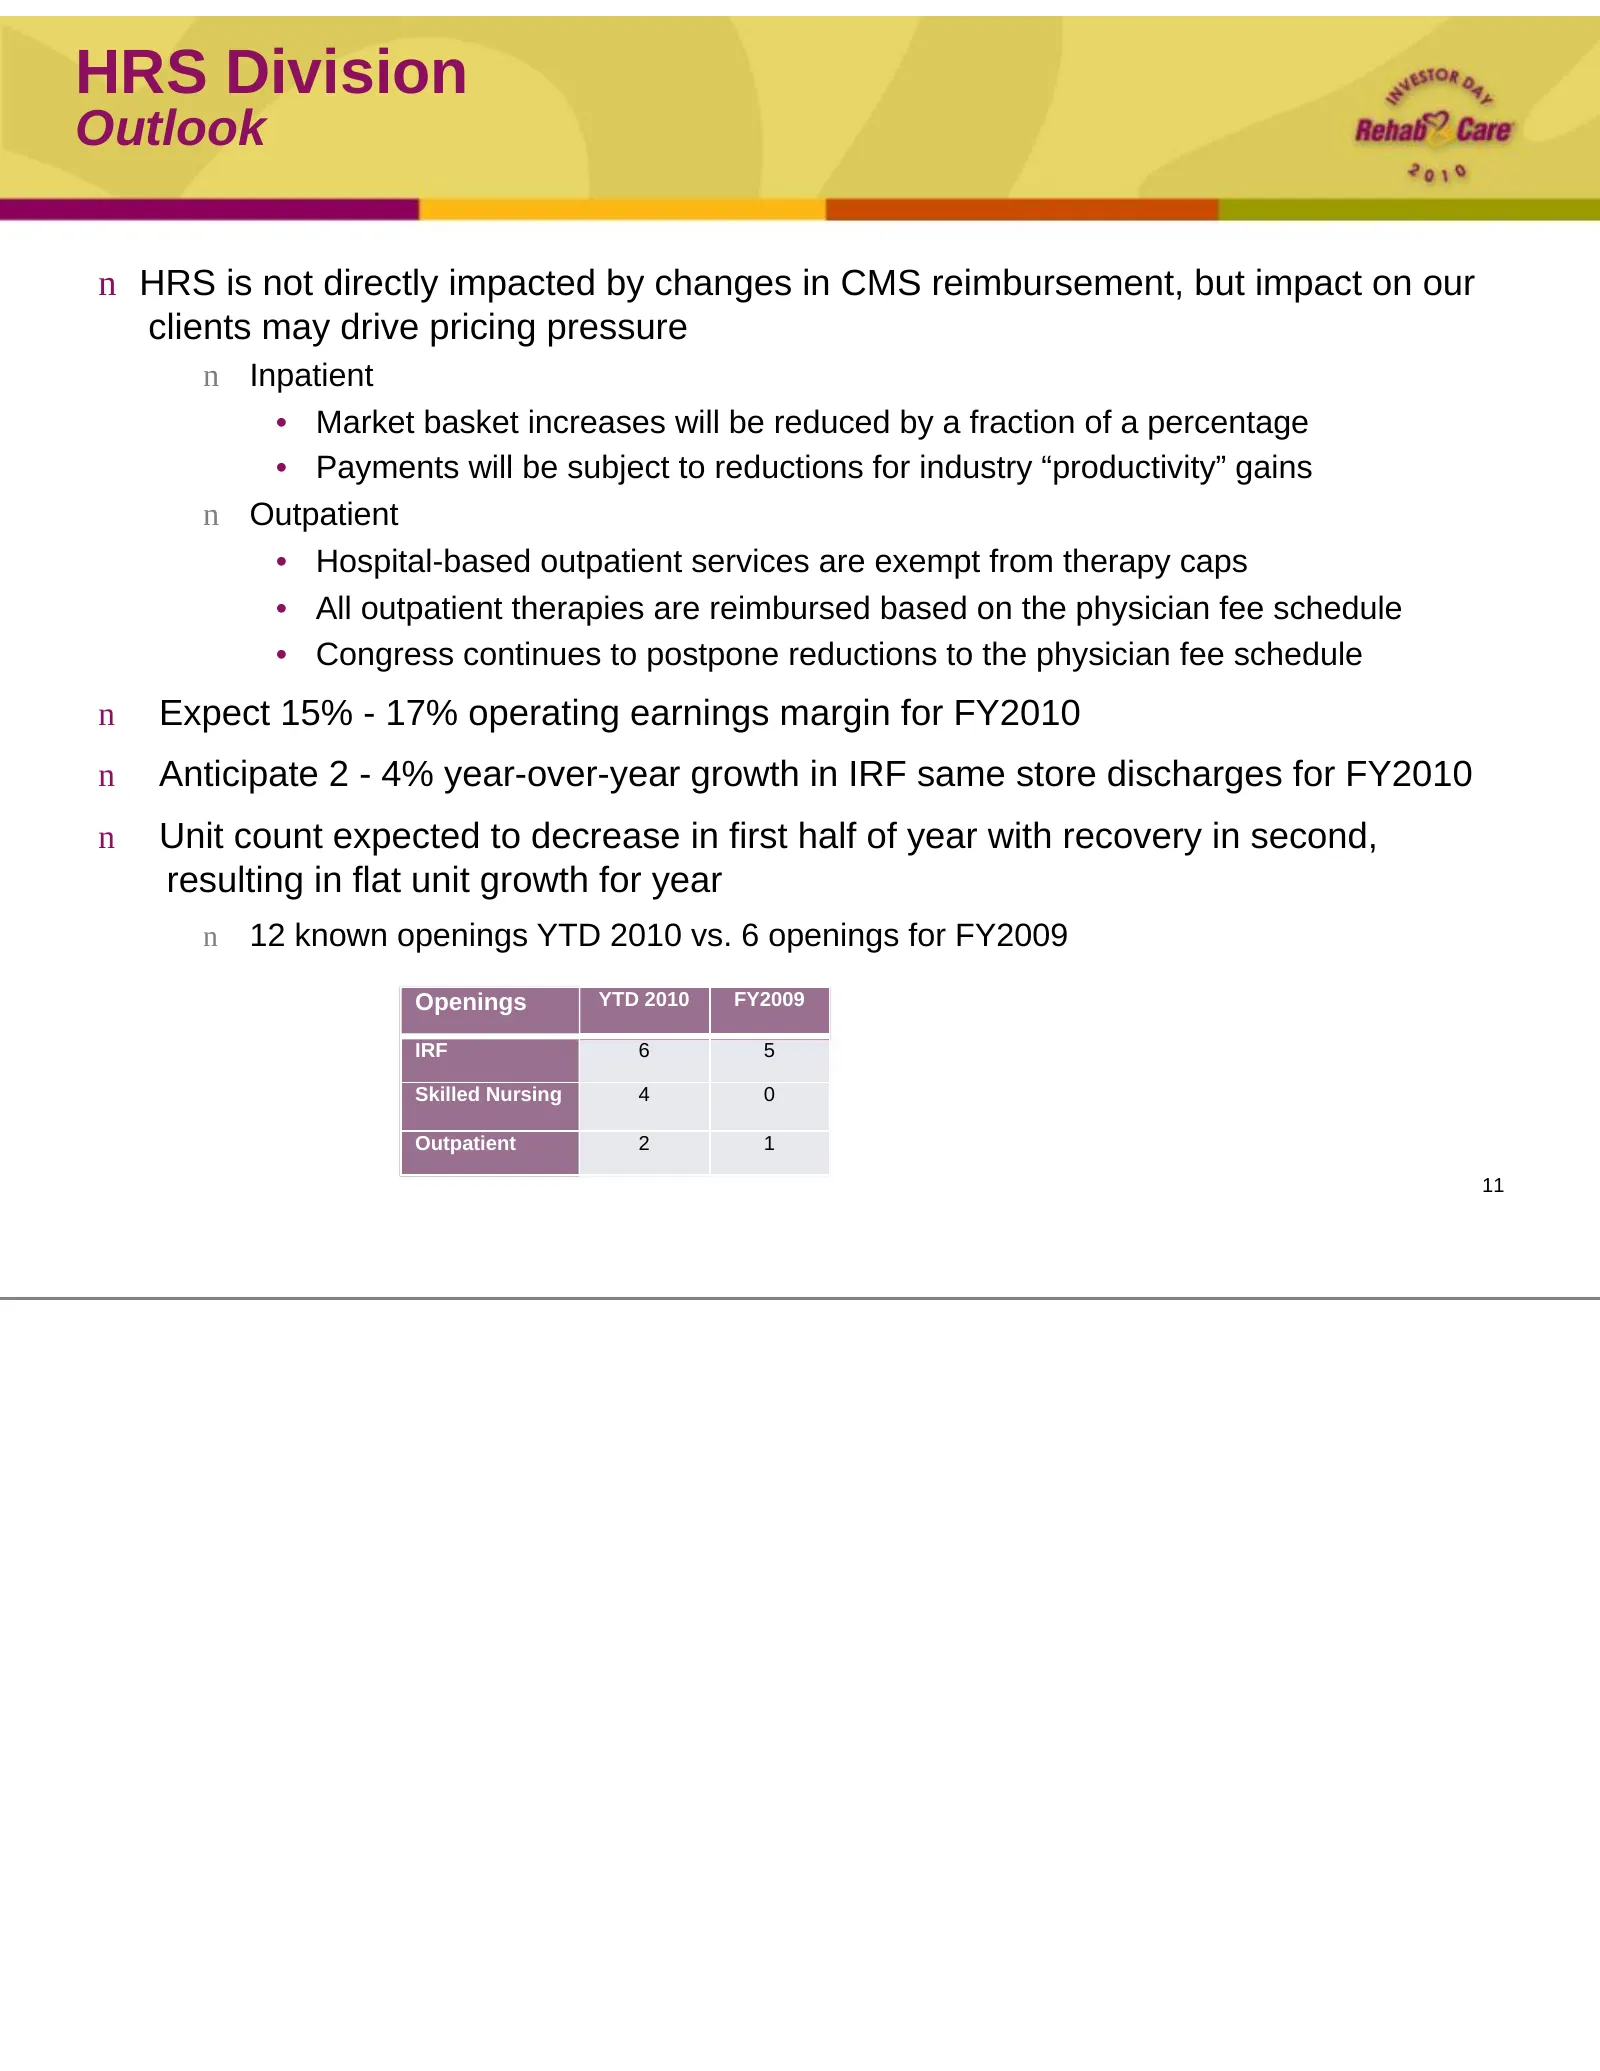
Slide 11: HRS Division: Outlook
HRS Division Outlook n HRS is not directly impacted by changes in CMS reimbursement, but impact on our clients may drive pricing pressure n Inpatient • Market basket increases will be reduced by a fraction of a percentage • Payments will be subject to reductions for industry “productivity” gains n O
Slide 12: Skilled Nursing Rehabilitation Services
Skilled Nursing Rehabilitation Services Pat Henry Executive Vice President, SRS Operations
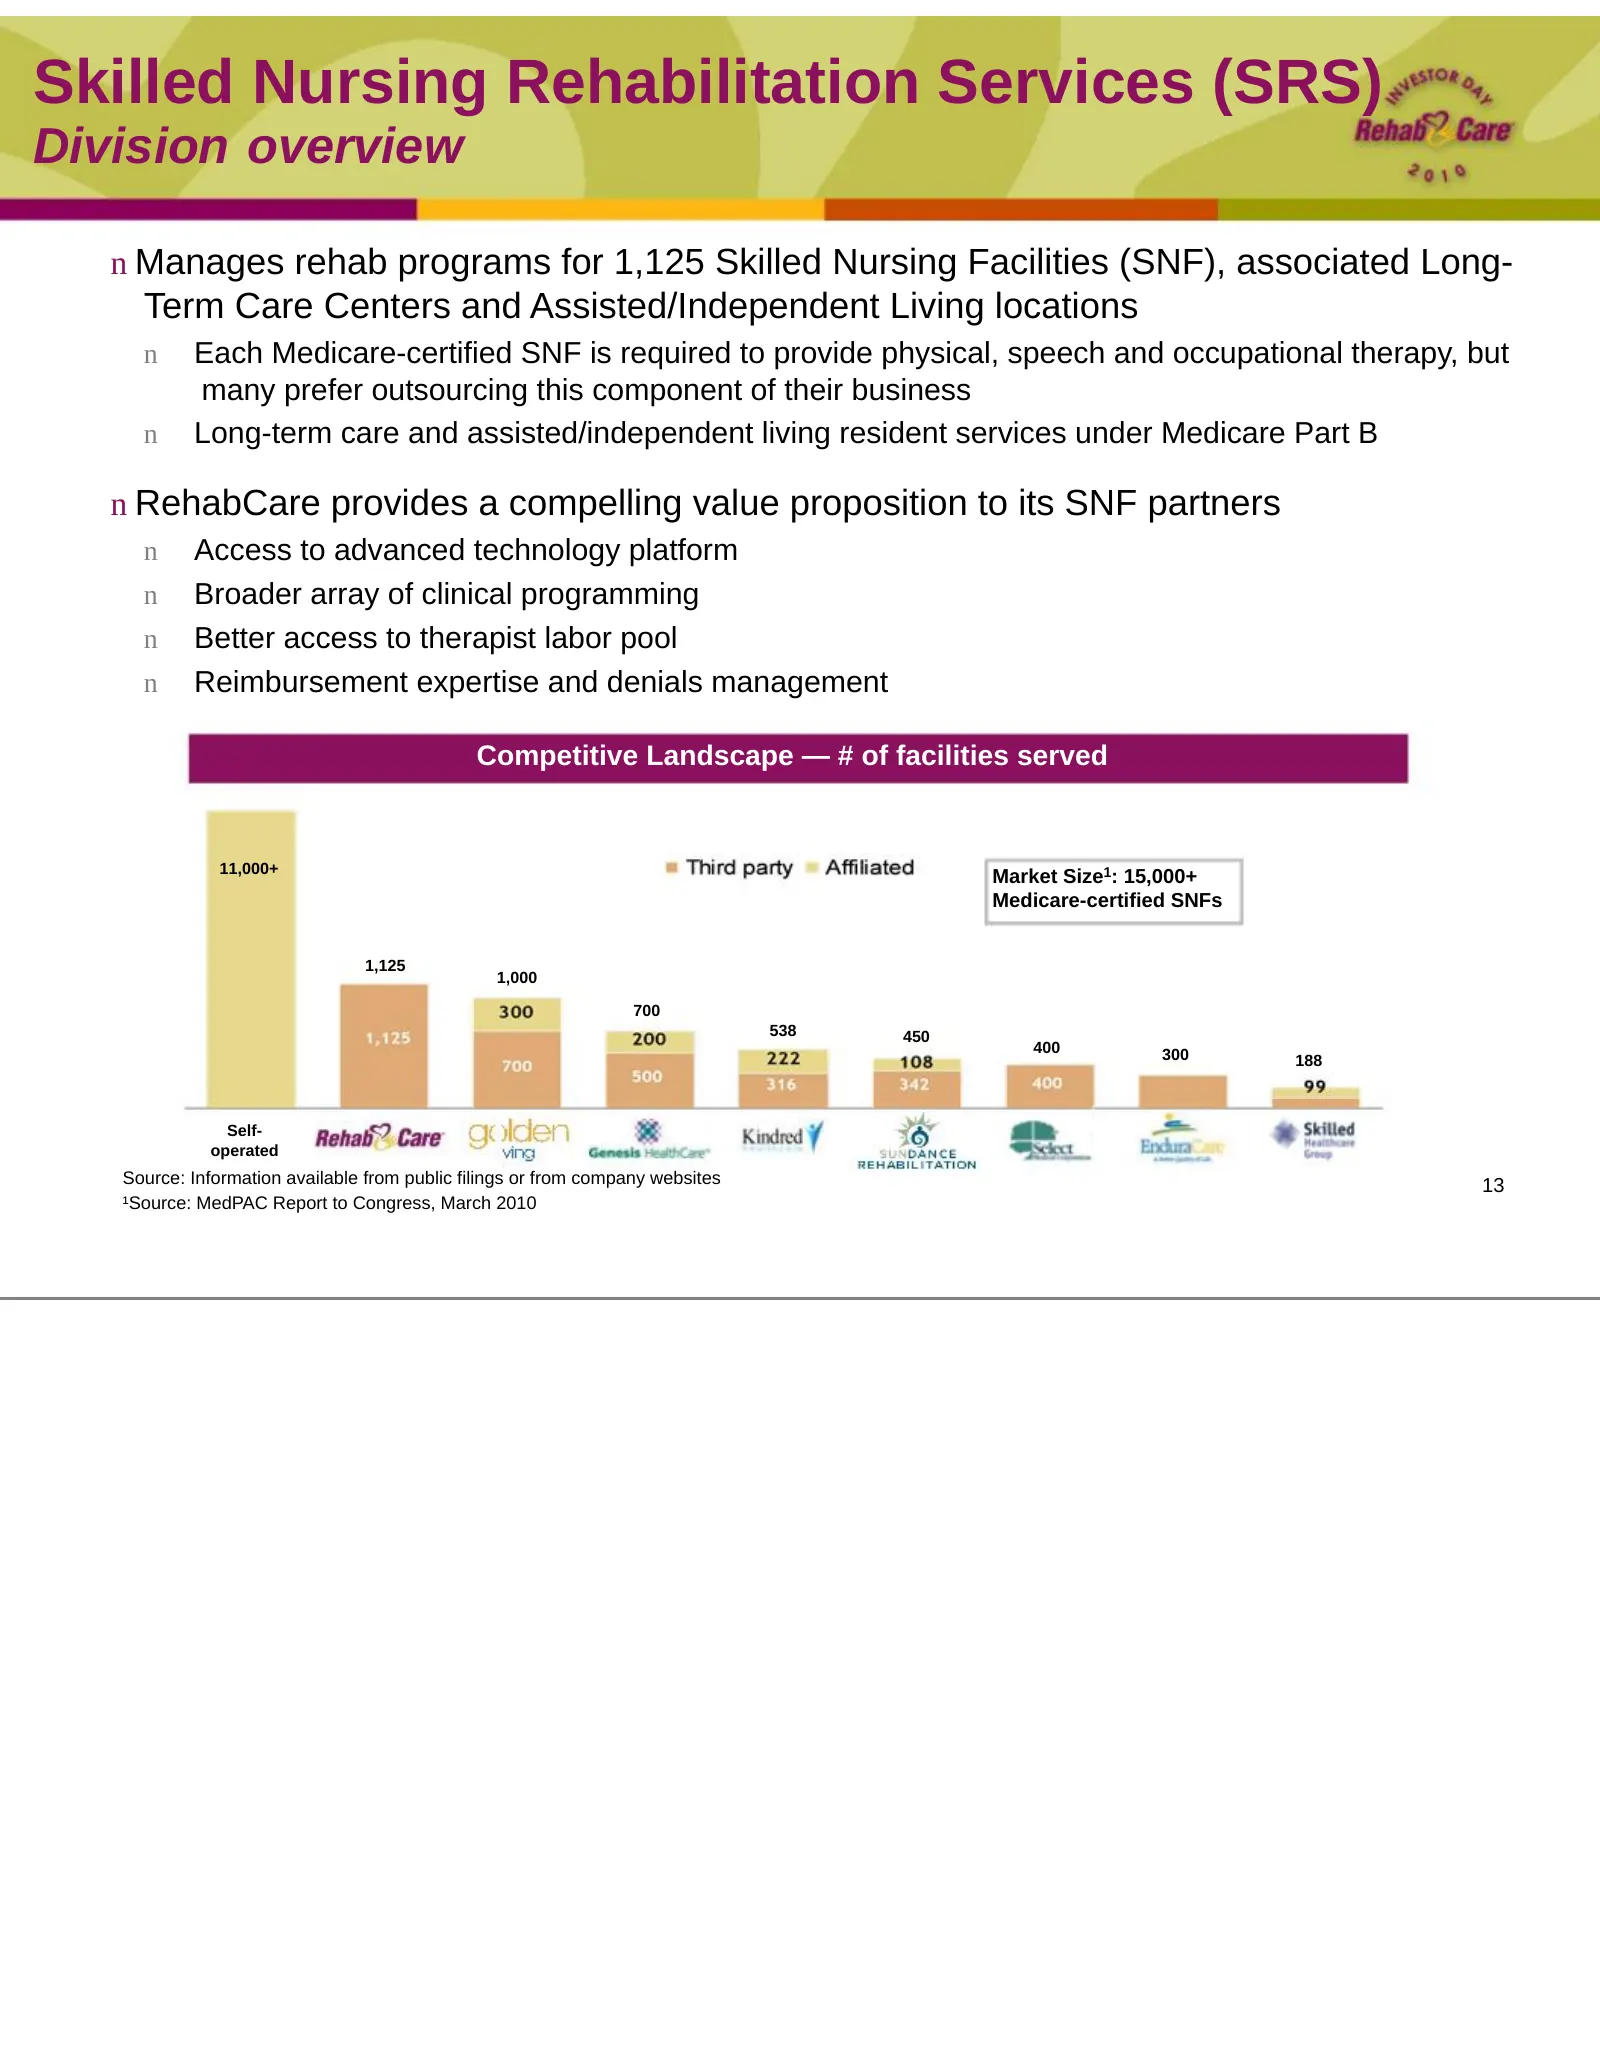
Slide 13: Skilled Nursing Rehabilitation Services (SRS)
Skilled Nursing Rehabilitation Services (SRS) Division overview n Manages rehab programs for 1,125 Skilled Nursing Facilities (SNF), associated Long- Term Care Centers and Assisted/Independent Living locations n Each Medicare-certified SNF is required to provide physical, speech and occupational the
Slide 14: SRS Division: Client profile
SRS Division Client profile n Average SNF includes 120-140 beds n Medicare Part A - 20 beds n Residential Long-Term Care/Part B n RHB client n Freestanding SNF (85% of total contracts) n Small to mid-size chain of facilities (chains of 3 or more facilities account for 47% of total contracts) • Avera
Slide 15: SRS Division: Technology platform
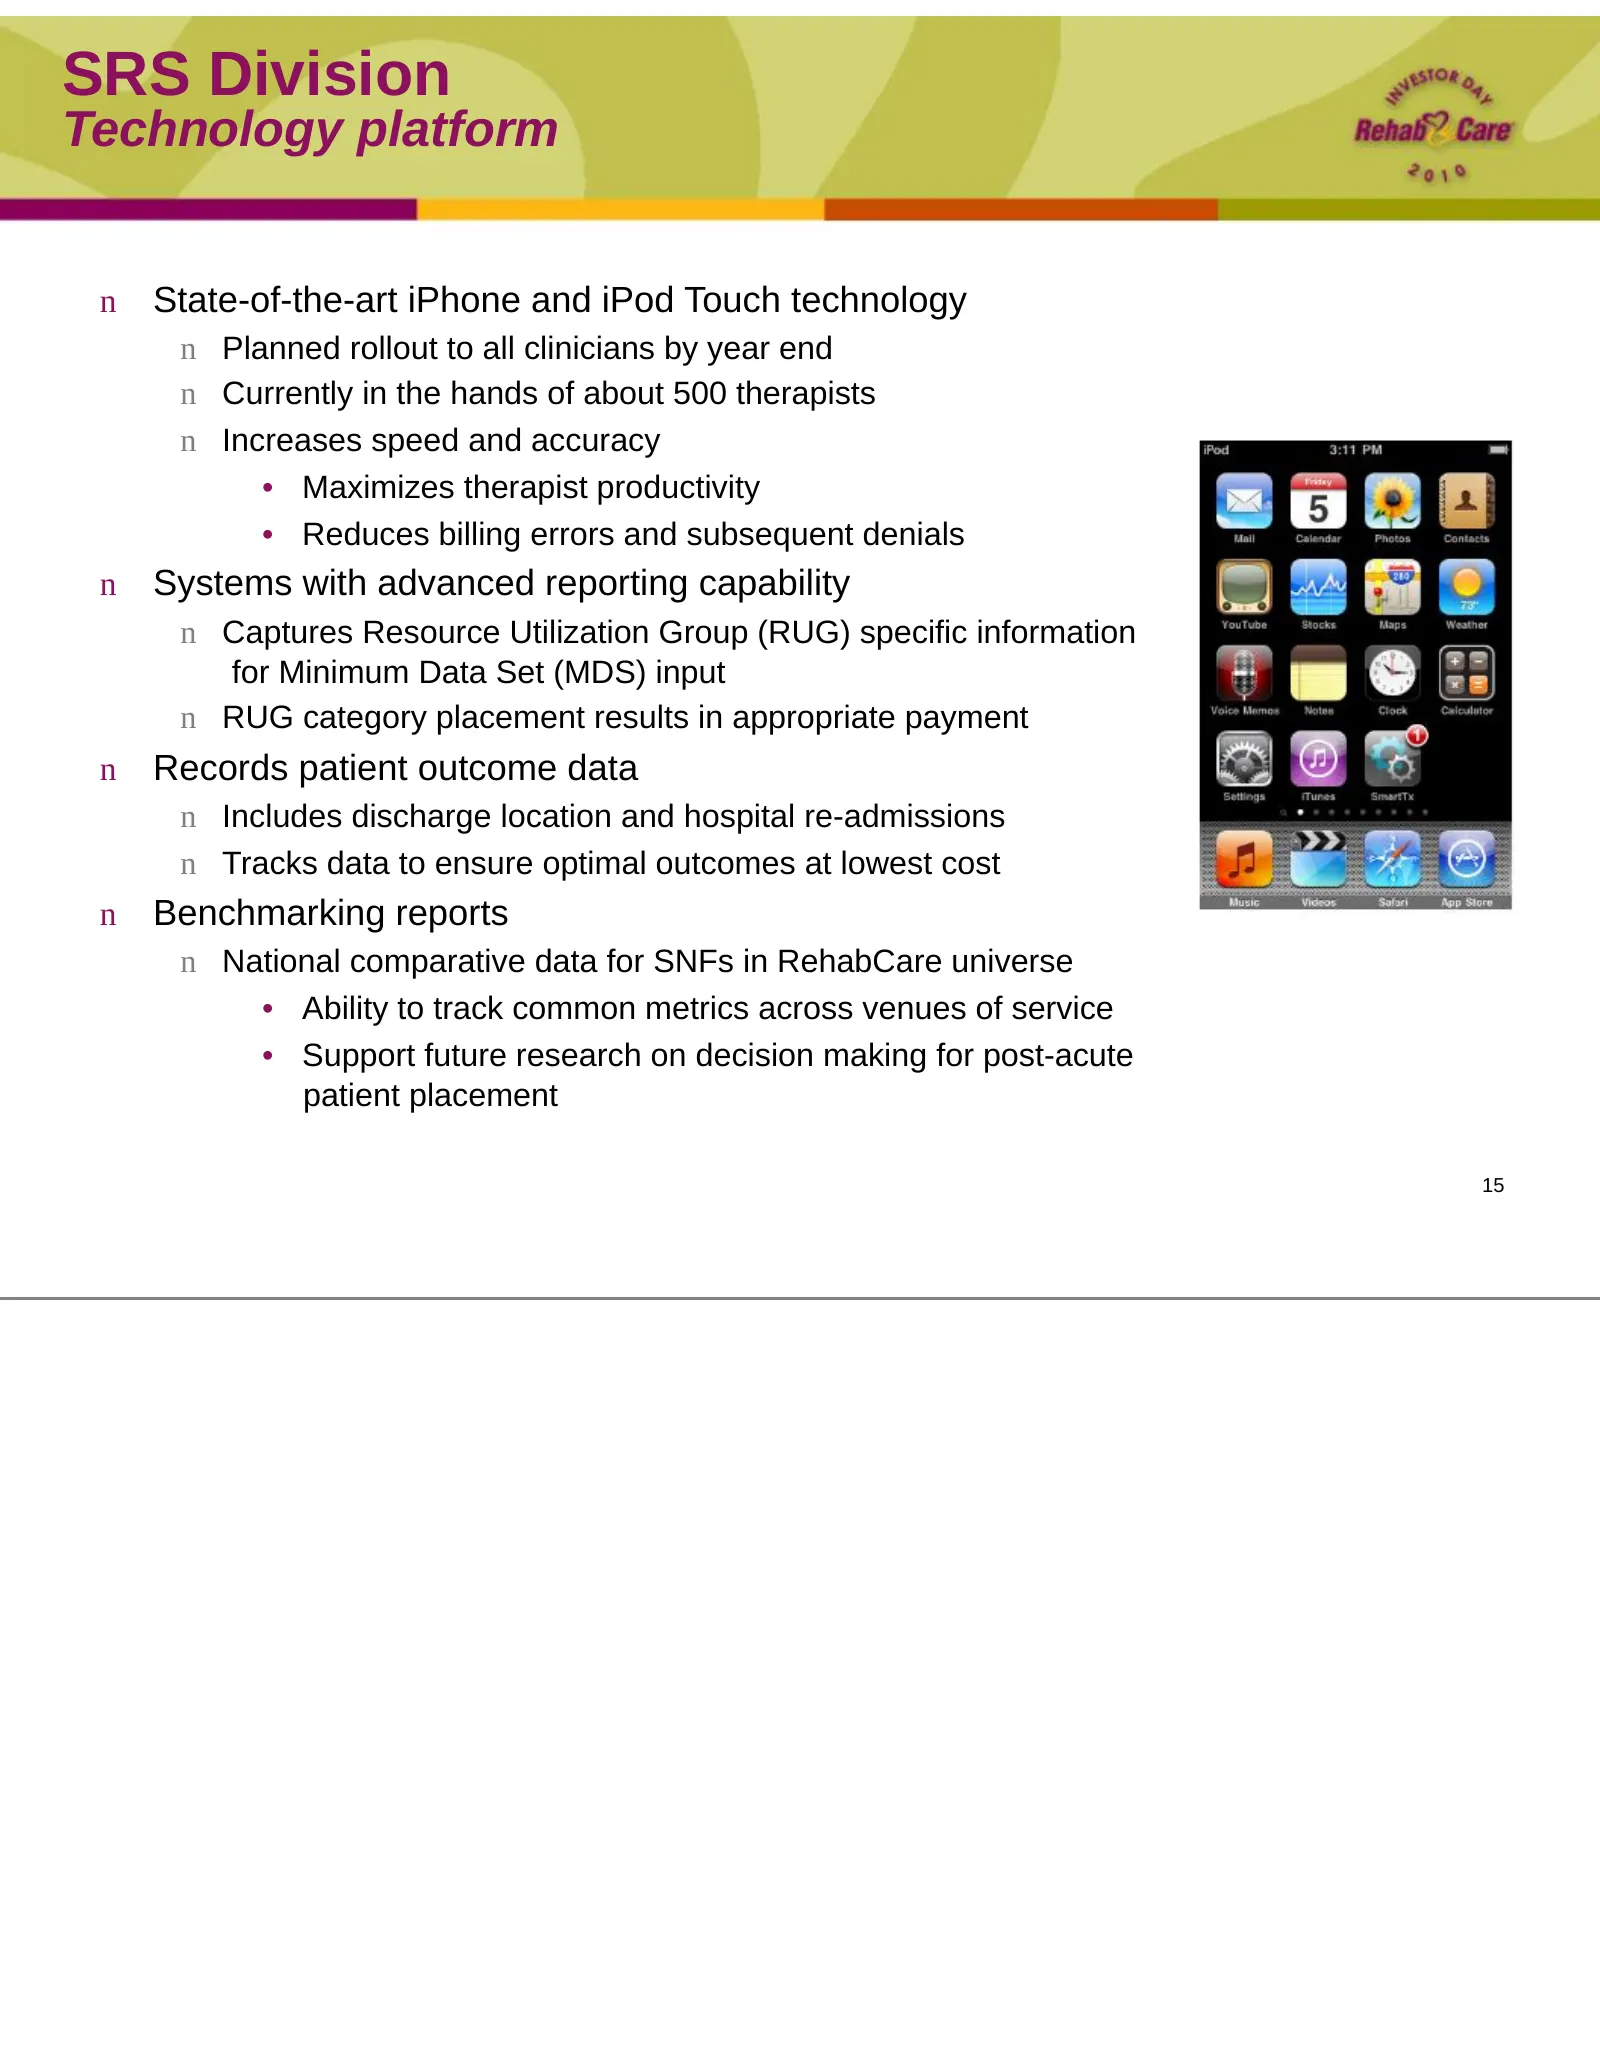
SRS Division Technology platform n State-of-the-art iPhone and iPod Touch technology n Planned rollout to all clinicians by year end n Currently in the hands of about 500 therapists n Increases speed and accuracy • Maximizes therapist productivity • Reduces billing errors and subsequent denials n Sy
Slide 16: SRS Division: Technology sample
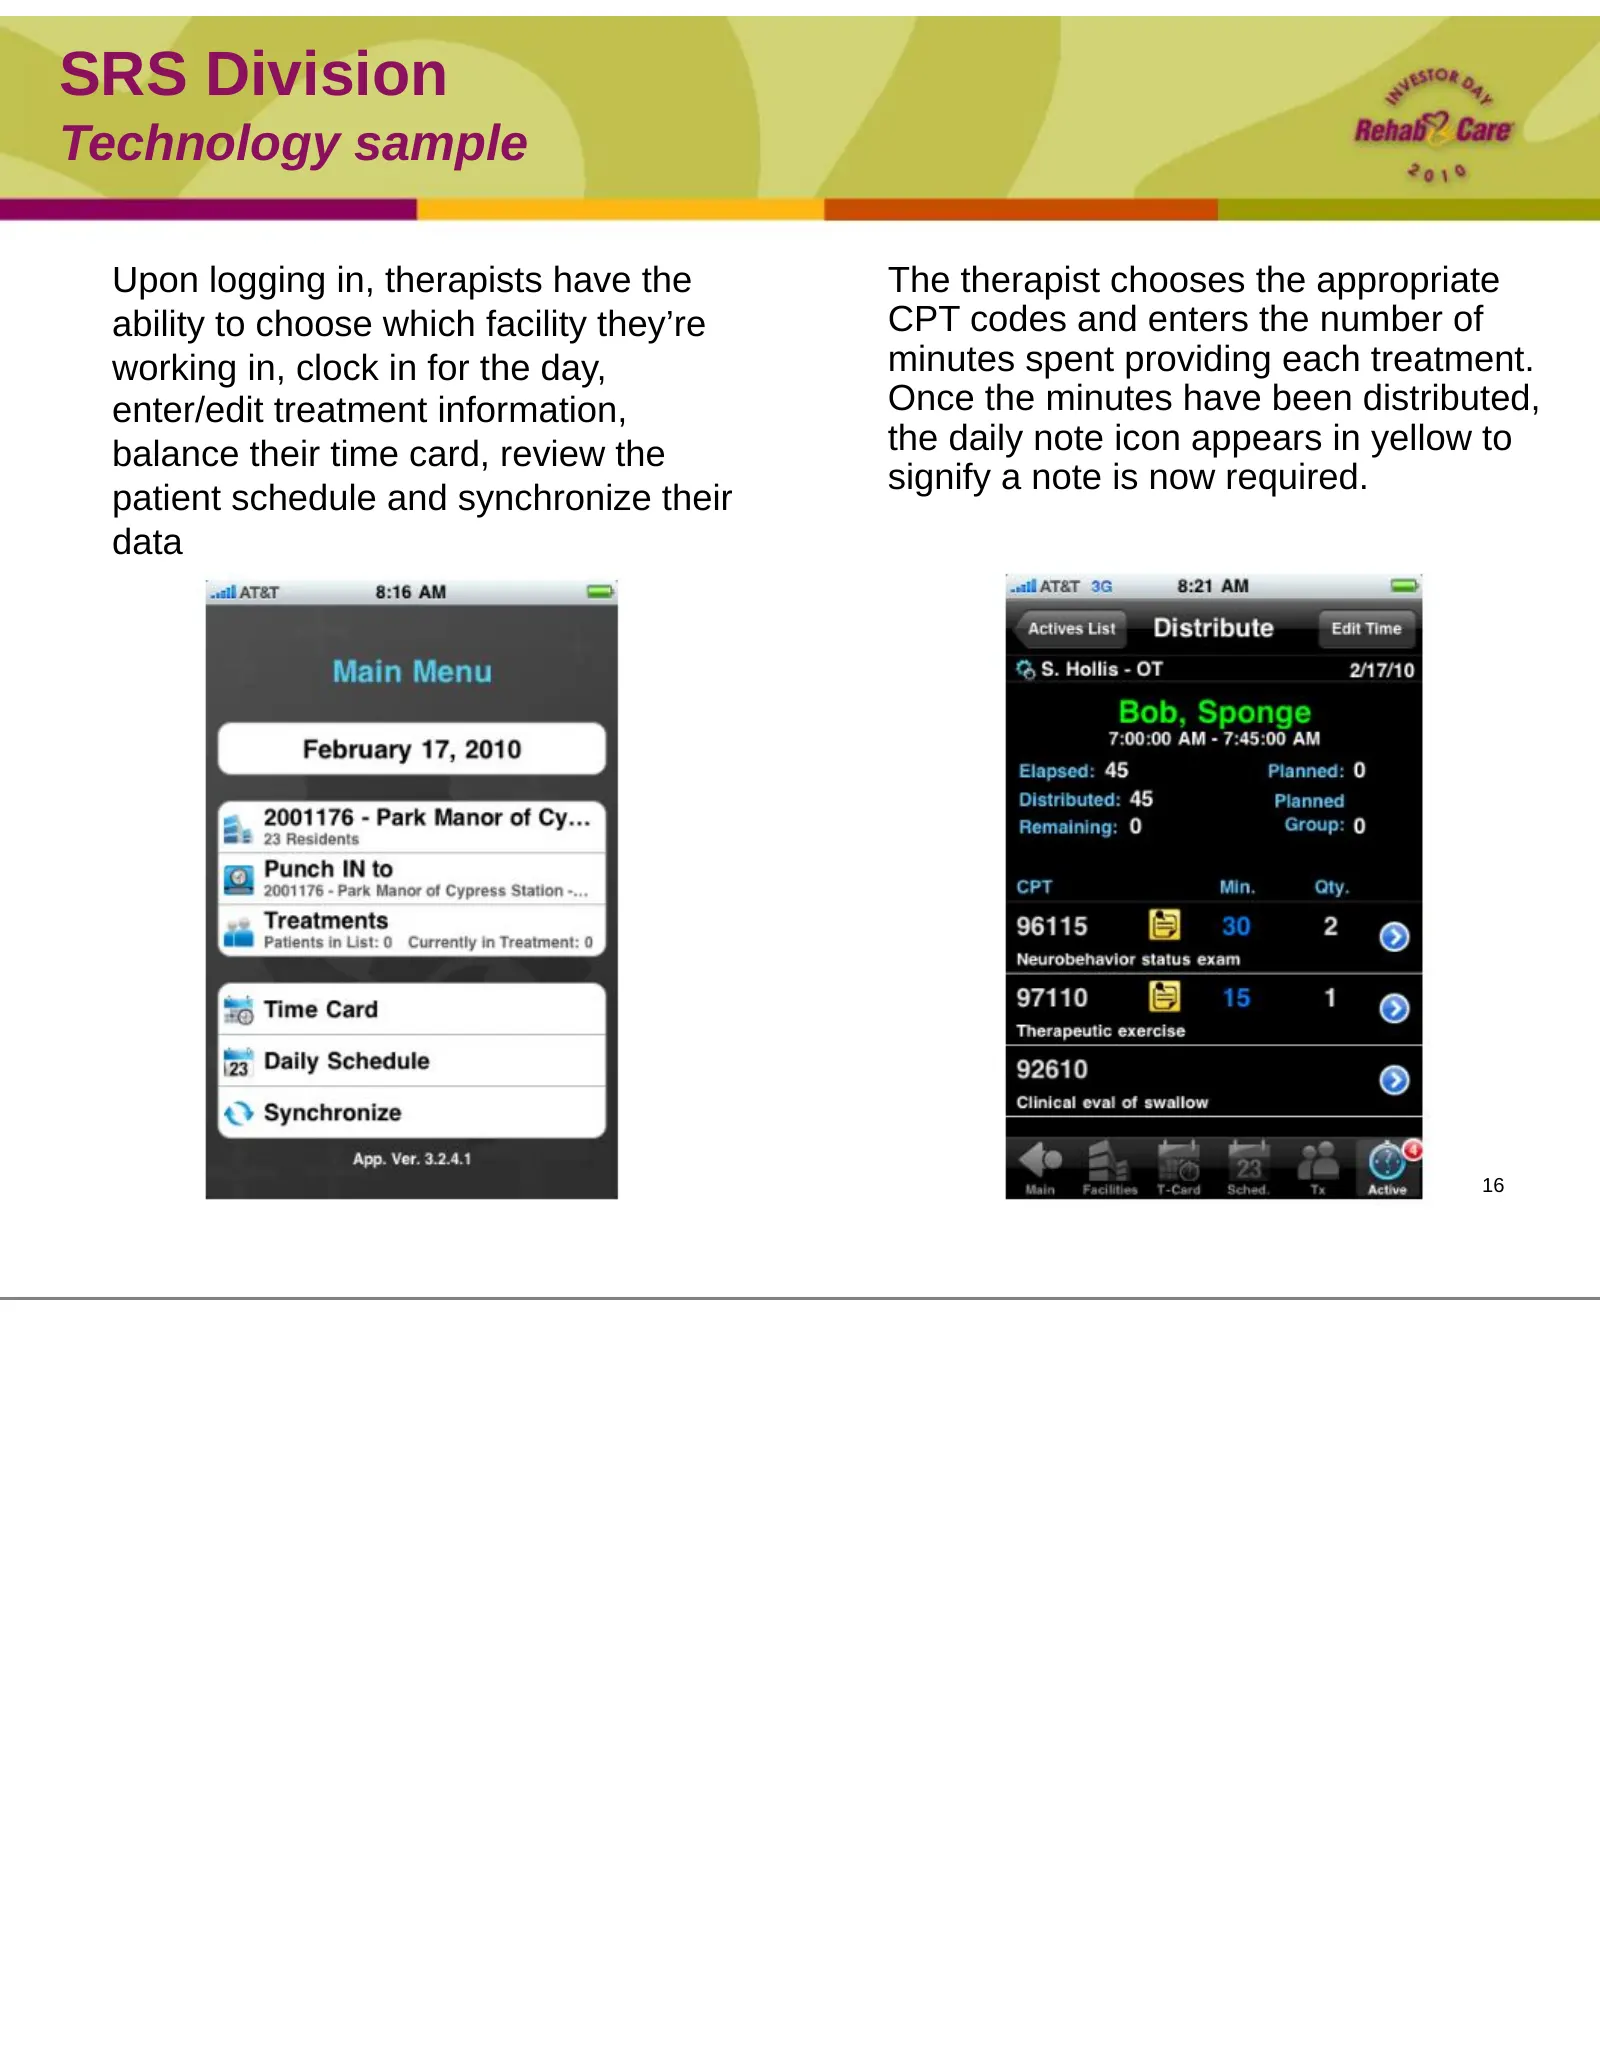
SRS Division Technology sample Upon logging in, therapists have the The therapist chooses the appropriate ability to choose which facility they’re CPT codes and enters the number of working in, clock in for the day, minutes spent providing each treatment. enter/edit treatment information, Once the m
Slide 17: SRS Division: Clinical programming
SRS Division Clinical programming n Patient-specific care planning tools n Care maps designed to guide decision making in patient treatment • Incorporated into point-of-service technology • Link initial care planning with discharge planning • Outcomes drive future placement or discharge to home n Pr
Slide 18: SRS Division: Clinical outcomes
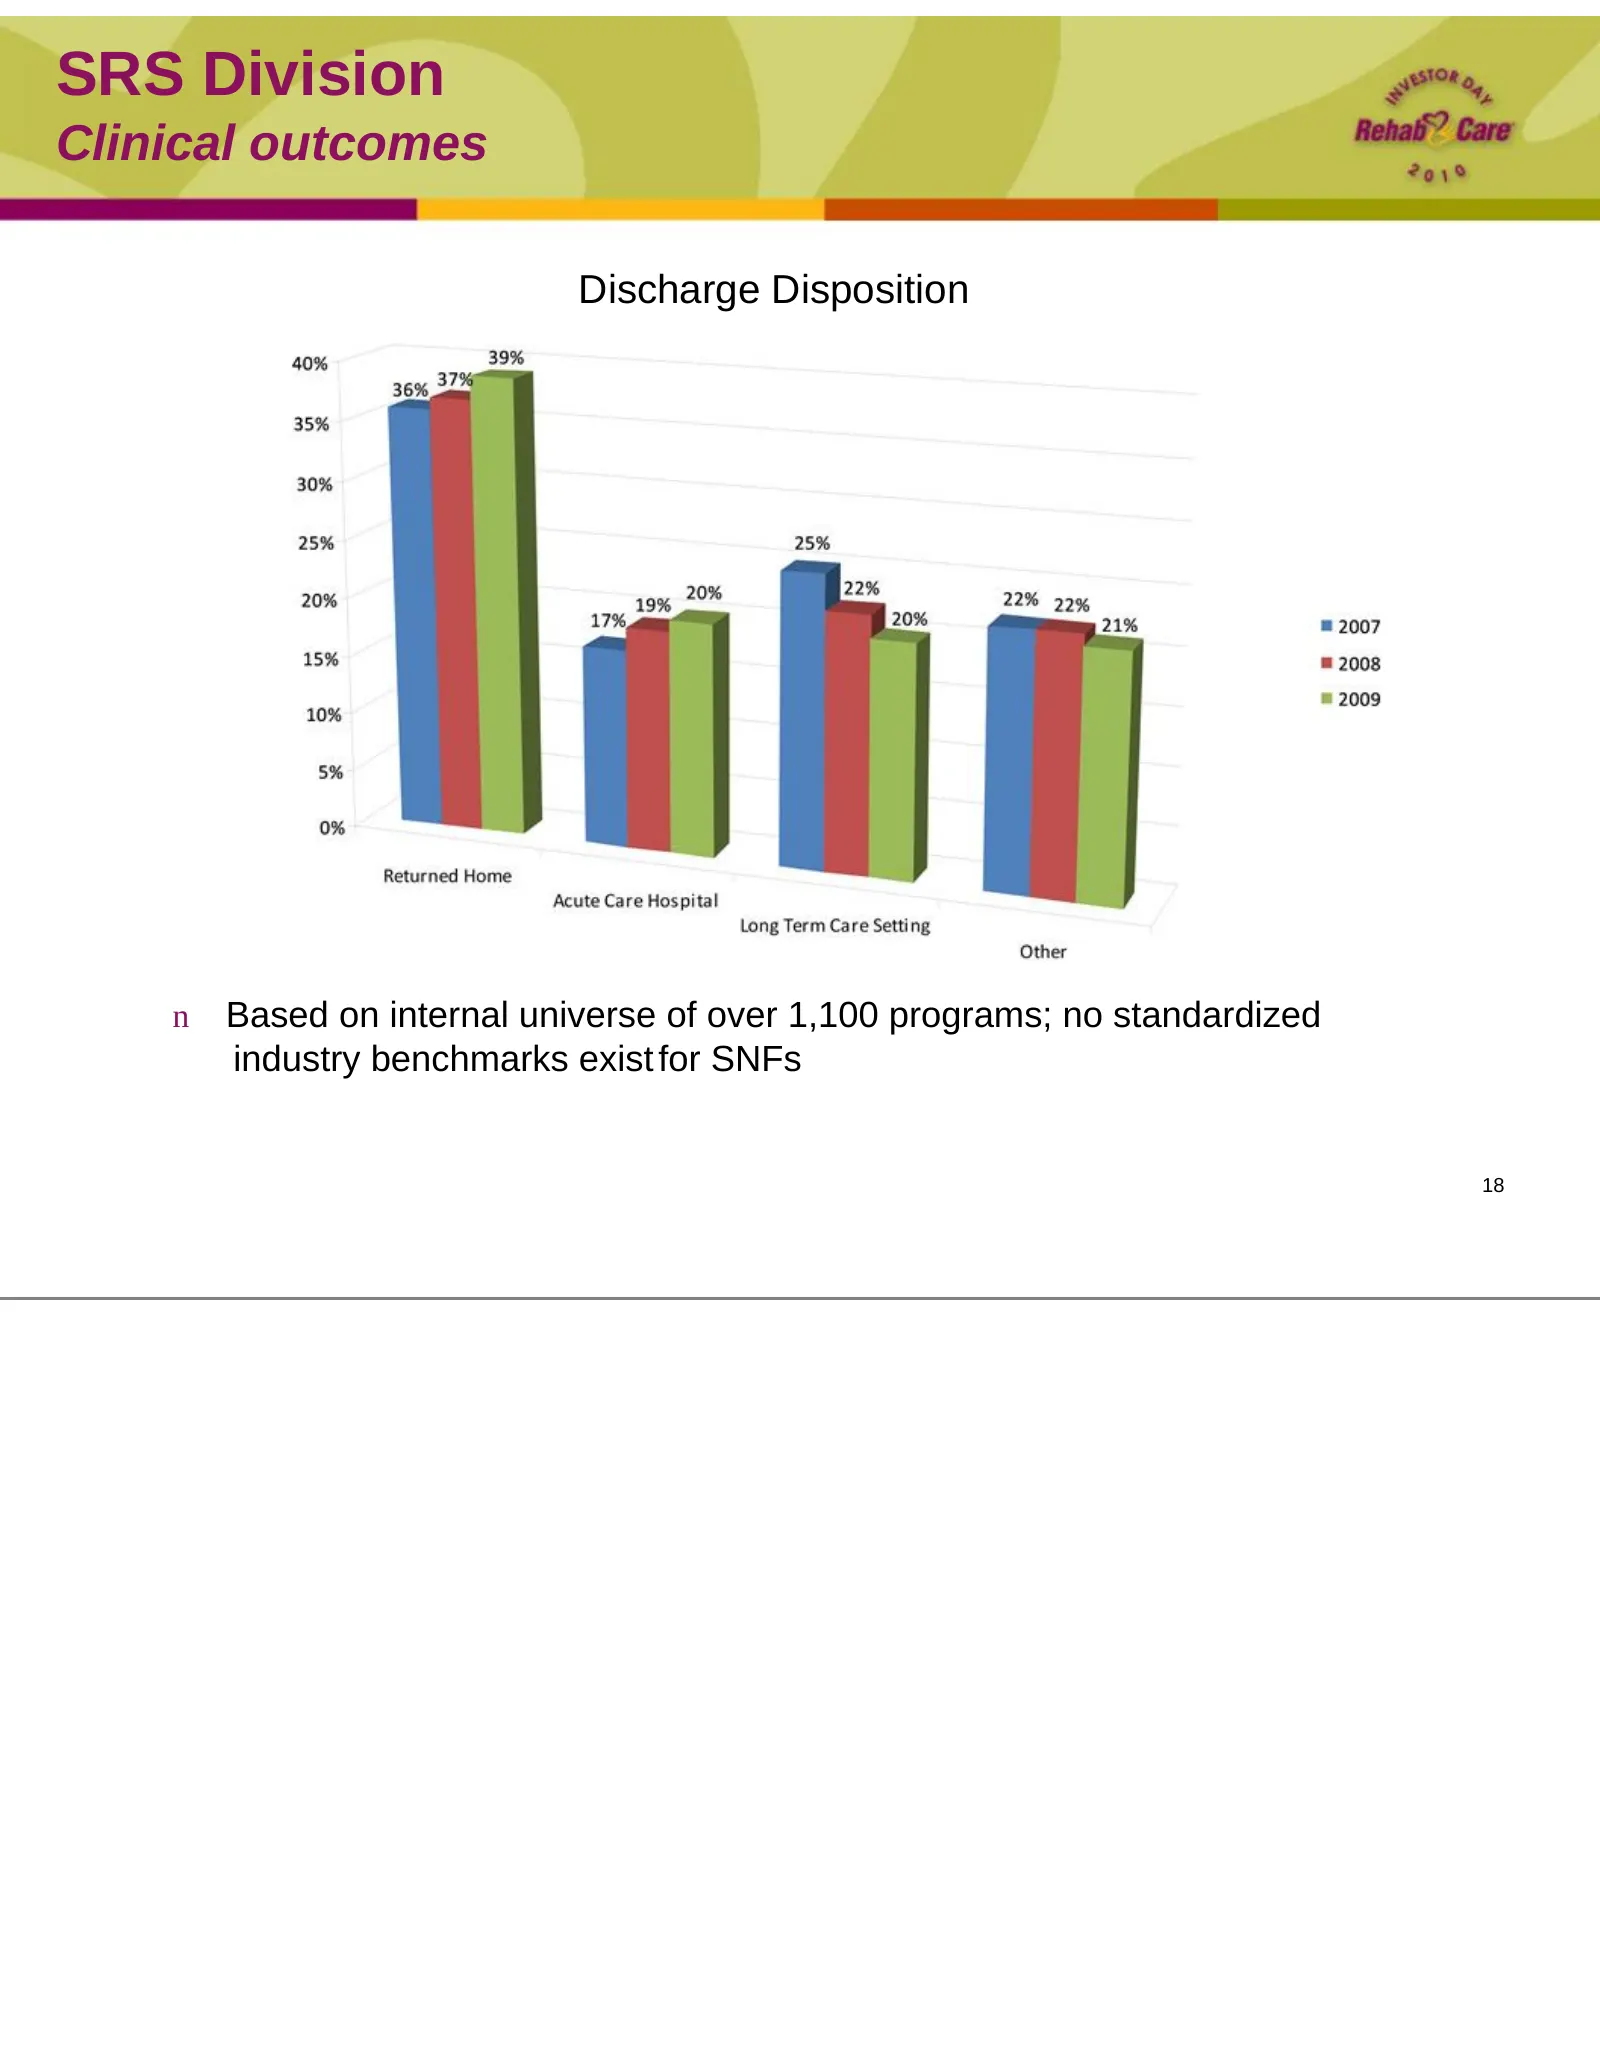
SRS Division Clinical outcomes Discharge Disposition n Based on internal universe of over 1,100 programs; no standardized industry benchmarks exist for SNFs 18
Slide 19: SRS Division: Access to therapy staff
SRS Division Access to therapy staff n RehabCare model of regional employment teams n Shared resource between RehabCare divisions n 7 teams of recruiting and staffing management • Linked closely to operations; hired 2,150 therapists in 2009 n Student programs • 275 academic affiliations and 332 Reha
Slide 20: SRS Division: Challenges and opportunities
SRS Division Challenges and opportunities n Implementation of change to concurrent therapy rules n Preparation underway n RehabCare existing policy on concurrent therapy delivery model has been restrictive n Mitigation plan in progress: • Analysis of treatment methods - concurrent, group and individ
Slide 21: SRS Division: Outlook
SRS Division Outlook n Growth strategy n New sales with focus on self-operated programs n Same store growth as patient population requiring rehabilitation increases n Expect 7% - 8% operating earnings margins for the full year 2010, driven by mid -single digit year-over-year same store revenue growt
Slide 22: Hospital Division
Hospital Division Kevin Gross Senior Vice President, Hospital Operations Brock Hardaway Triumph HealthCare President & COO
Slide 23: Hospital Division: Overview
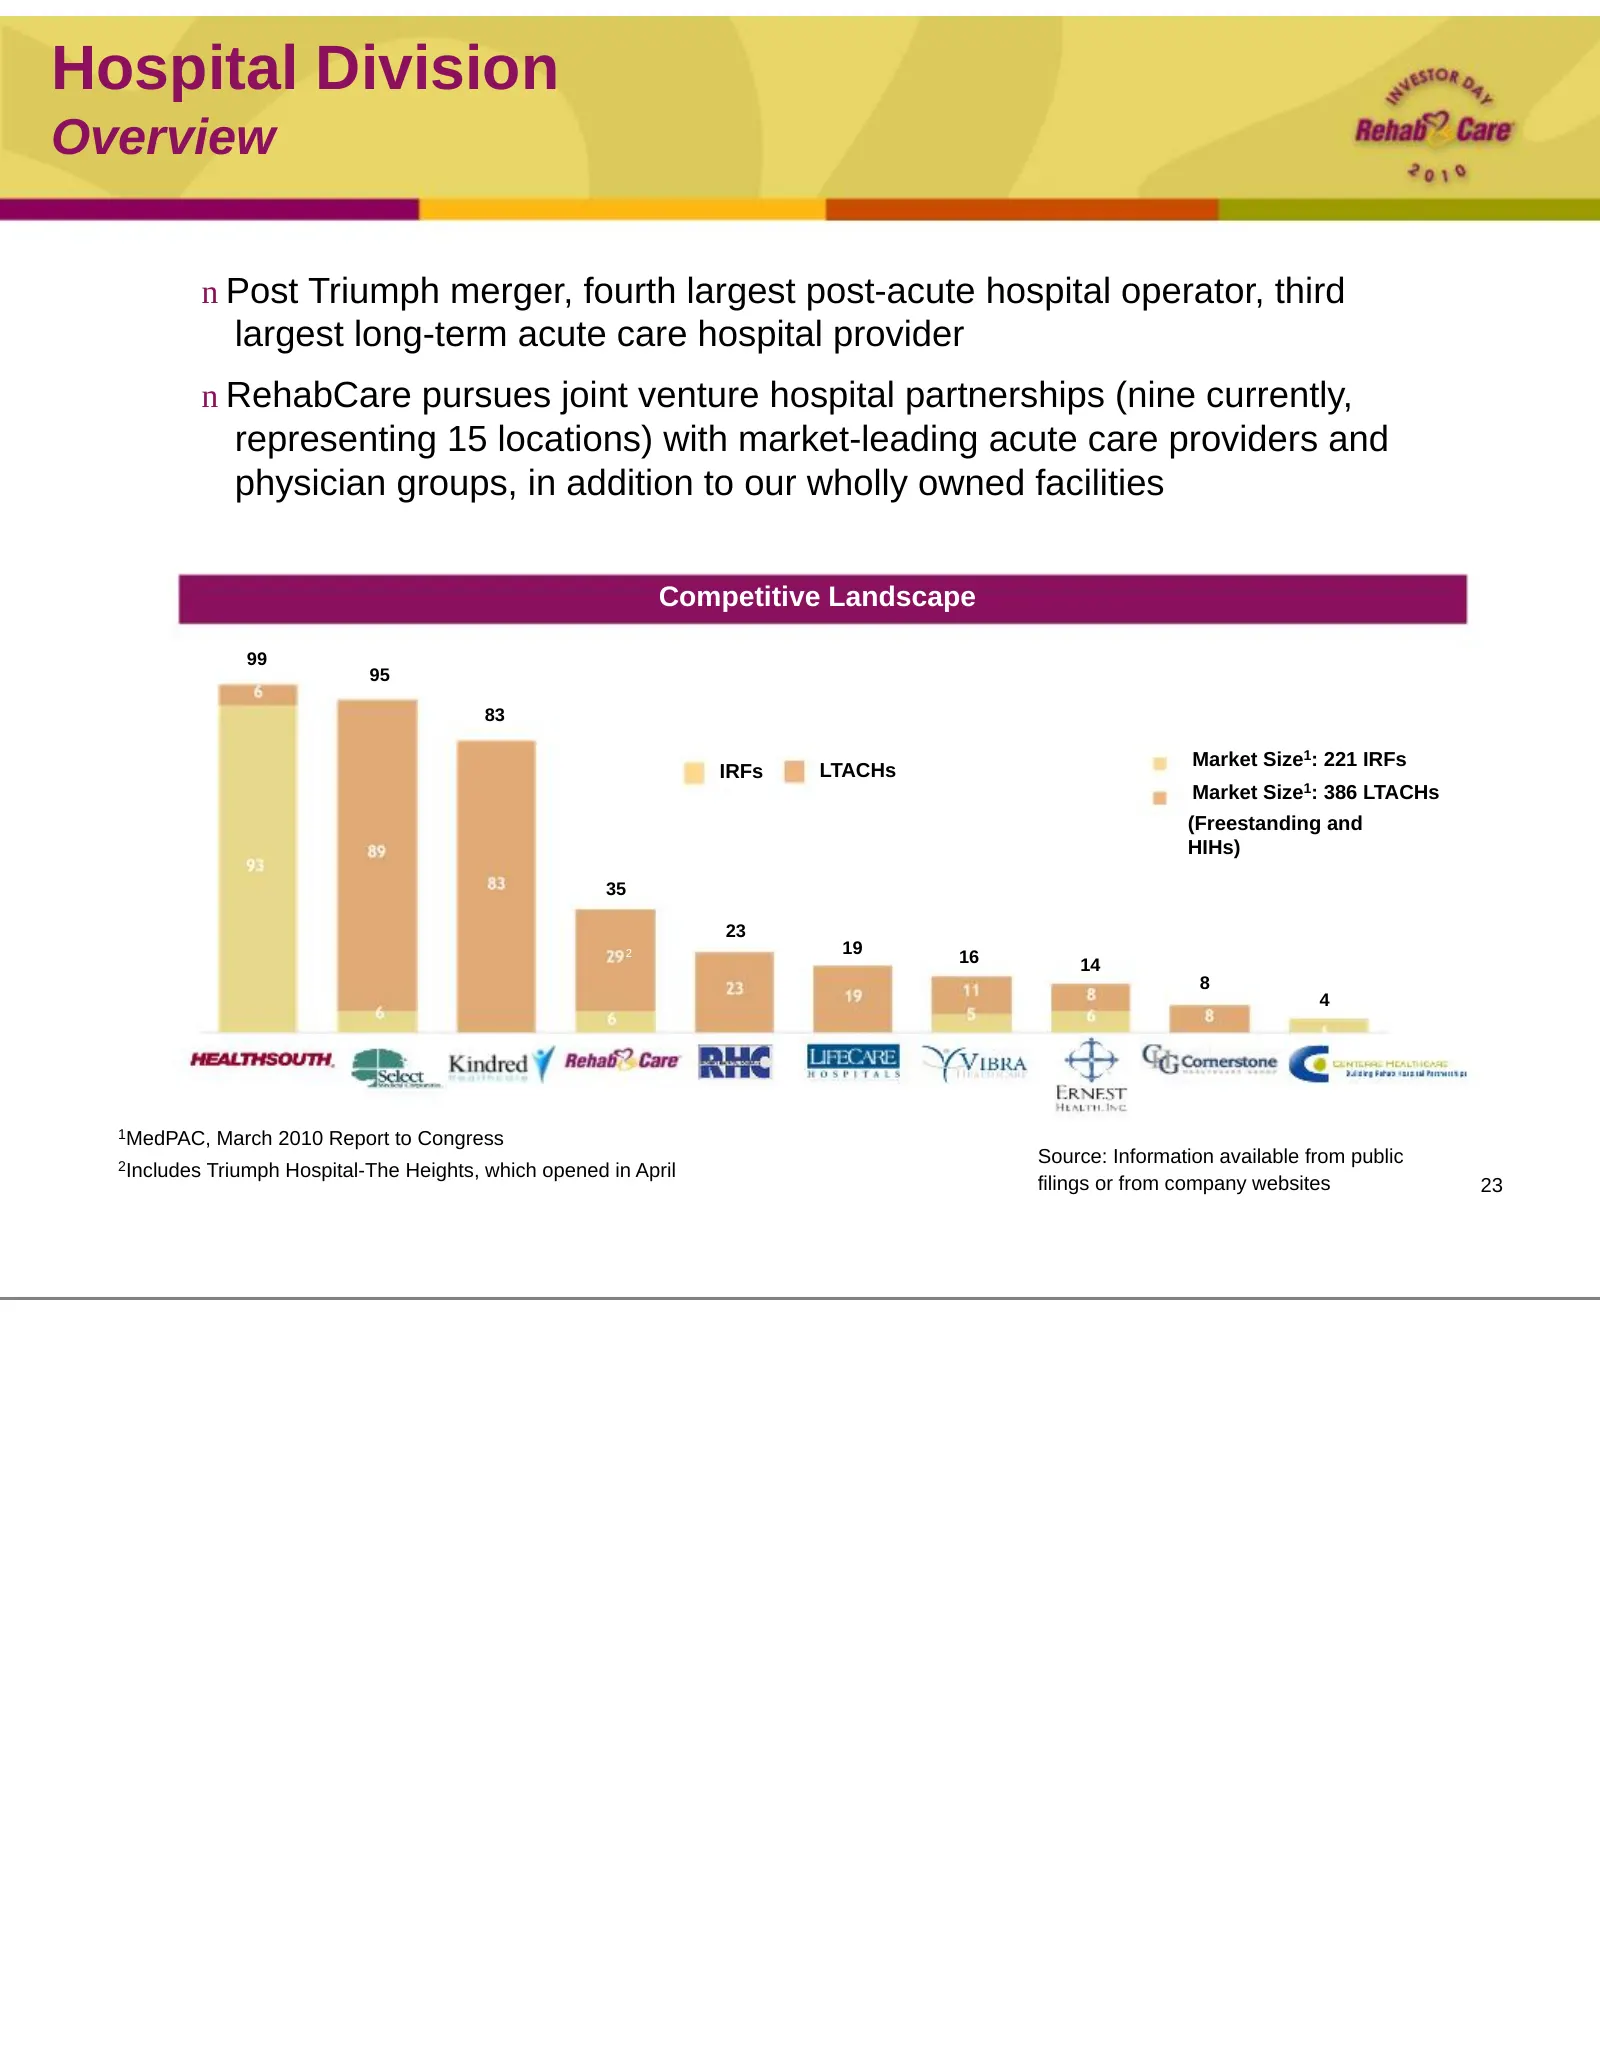
Hospital Division Overview n Post Triumph merger, fourth largest post-acute hospital operator, third largest long-term acute care hospital provider n RehabCare pursues joint venture hospital partnerships (nine currently, representing 15 locations) with market-leading acute care providers and physici
Slide 24: Hospital Division: Locations
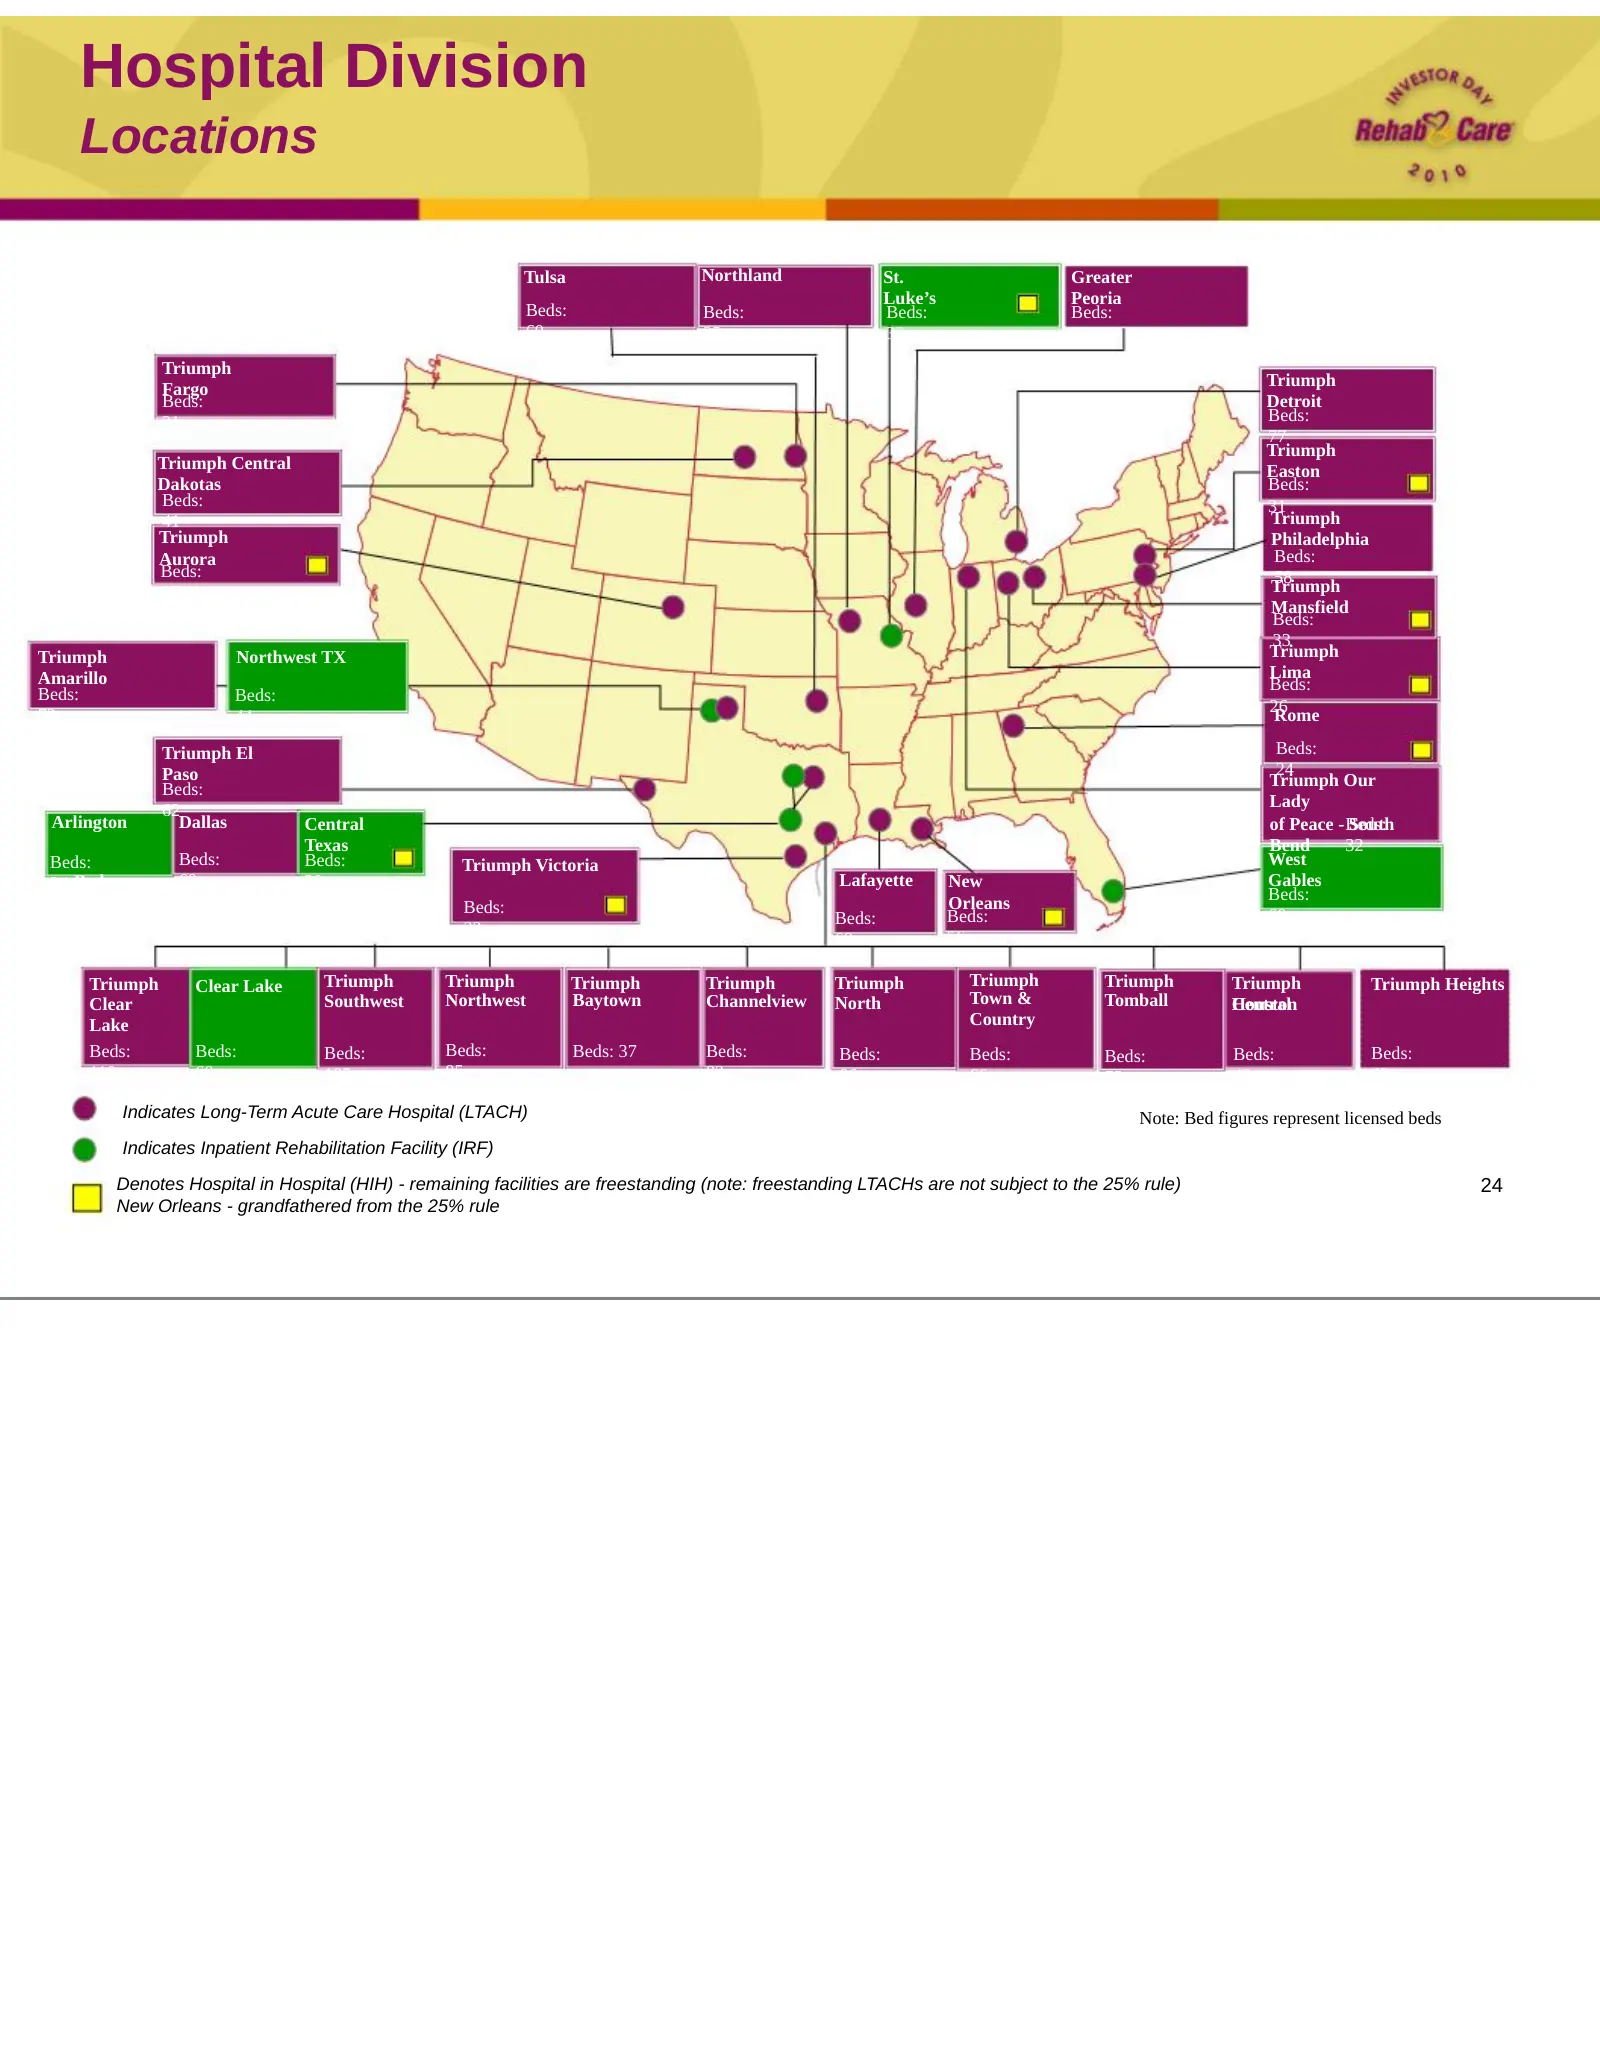
Hospital Division Locations Tulsa Northland St. Greater Luke’s Peoria Beds: Beds: Beds: Beds: 60 35 35 50 Triumph Triumph Fargo Beds: Detroit 31 Beds: 77 Triumph Triumph Central Easton Dakotas Beds: Beds: 31 41 Triumph Triumph Philadelphia Aurora Beds: Beds: 58 37 Triumph Mansfield Beds: 33 Triumph
Slide 25: Hospital Division: Strategy
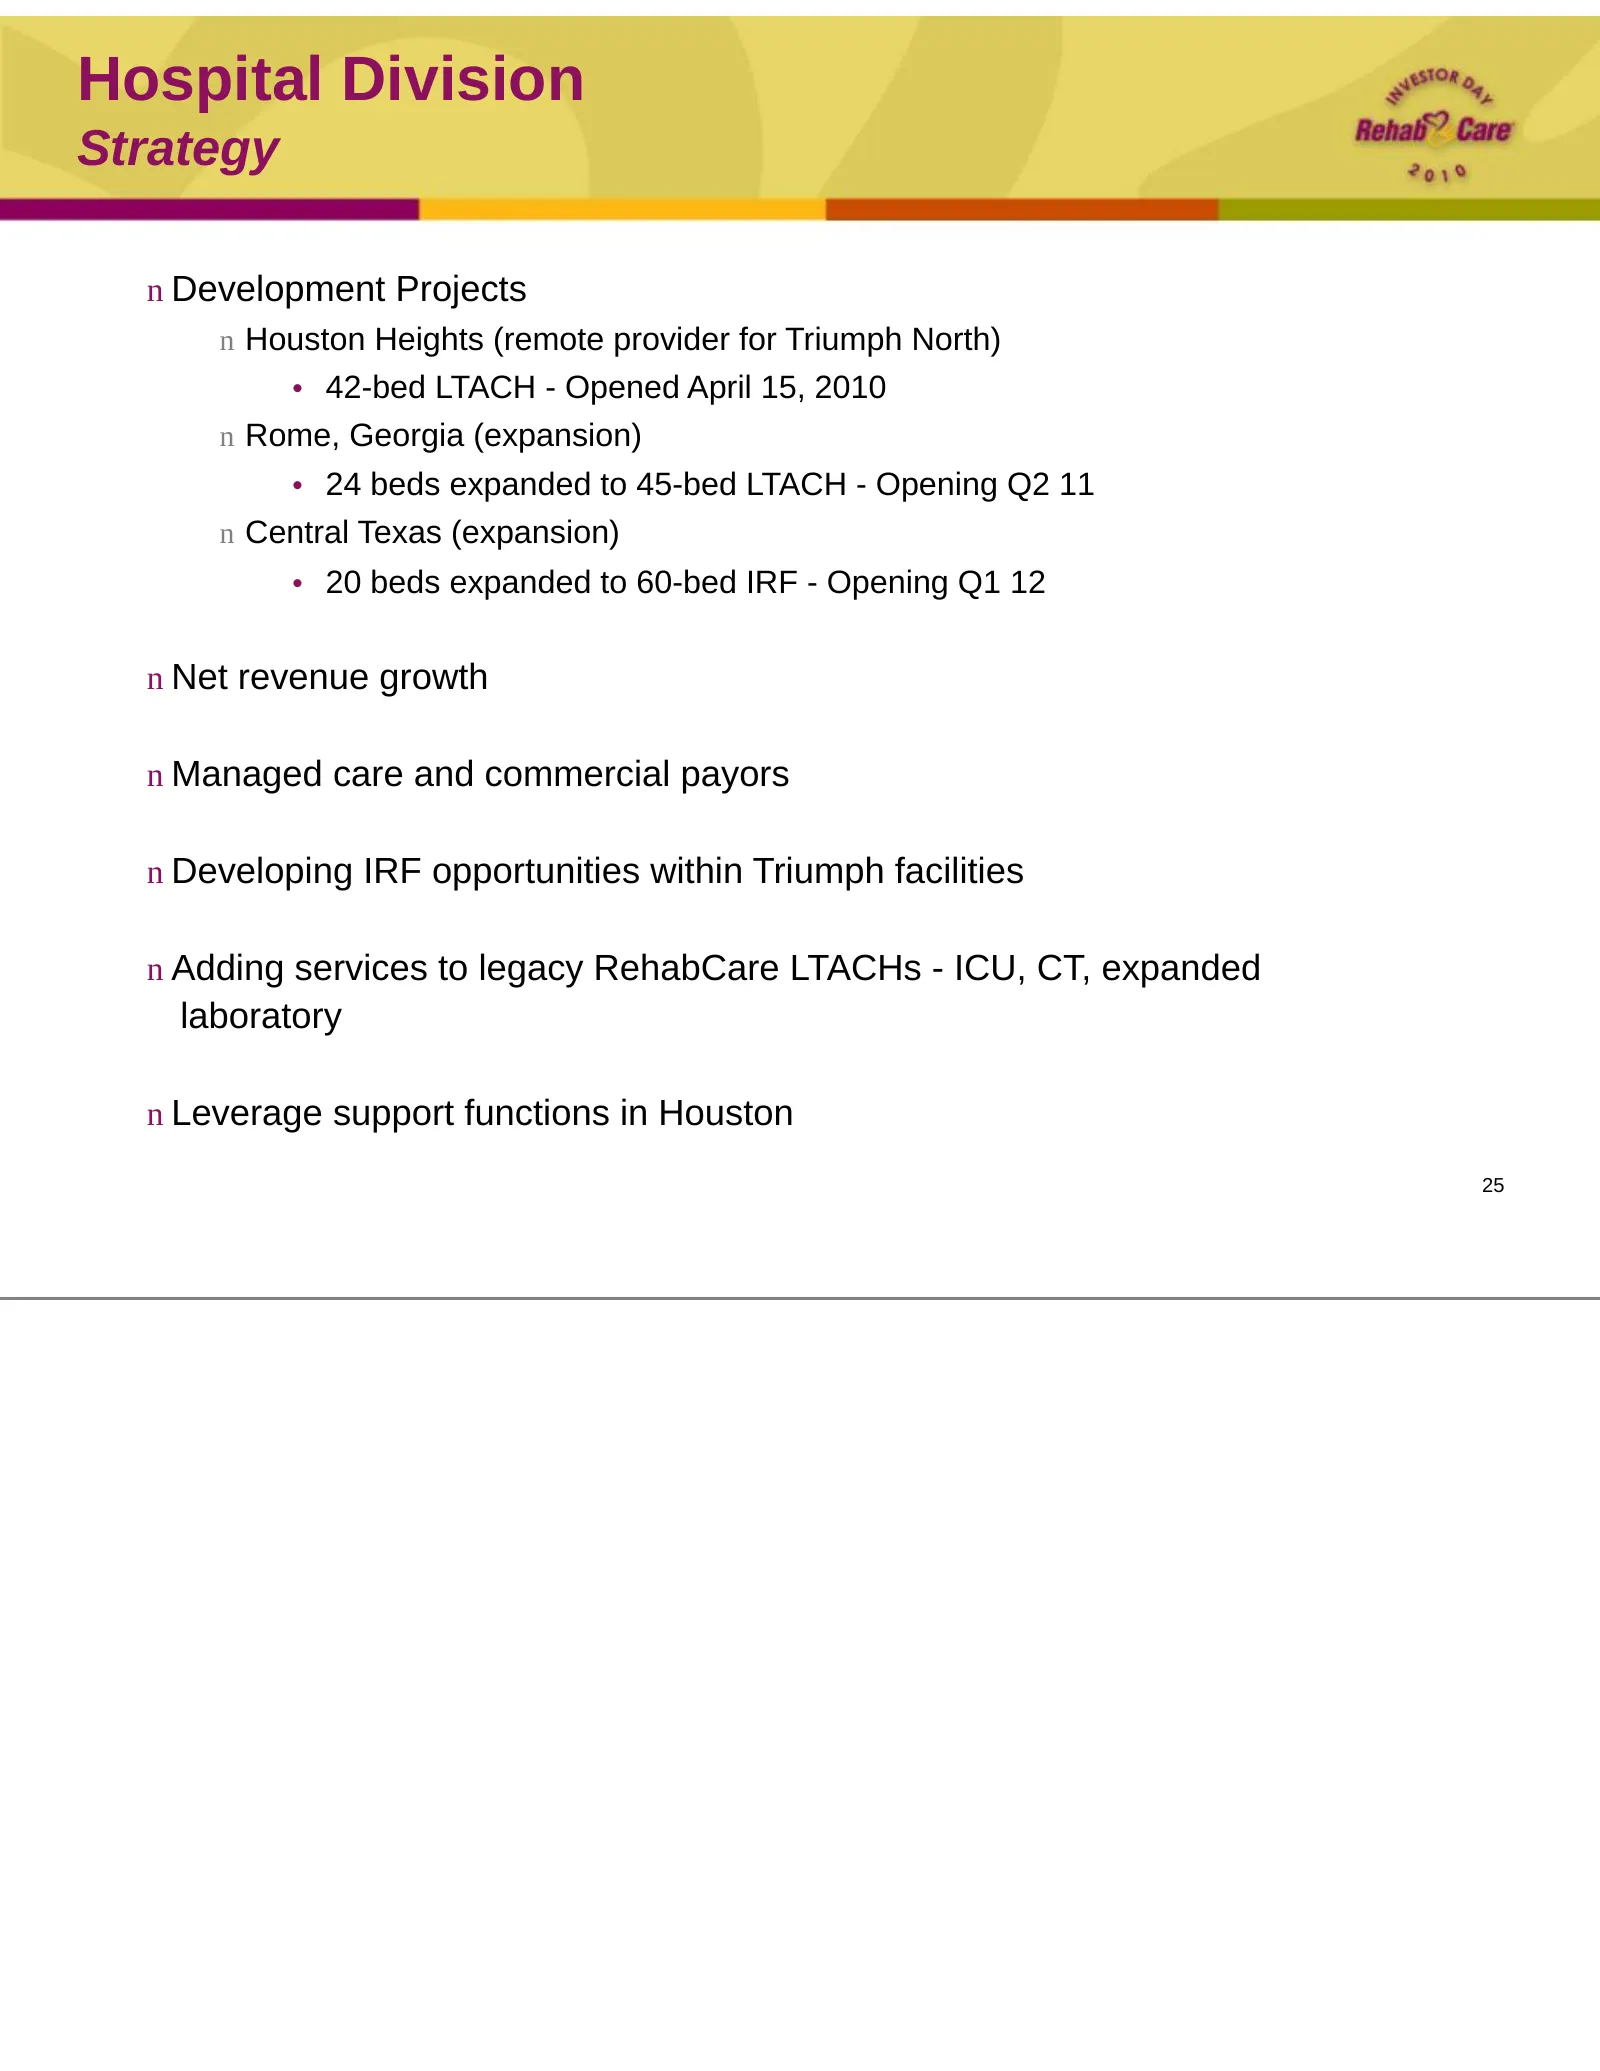
Hospital Division Strategy n Development Projects n Houston Heights (remote provider for Triumph North) • 42-bed LTACH - Opened April 15, 2010 n Rome, Georgia (expansion) • 24 beds expanded to 45-bed LTACH - Opening Q2 11 n Central Texas (expansion) • 20 beds expanded to 60-bed IRF - Opening Q1 12 n
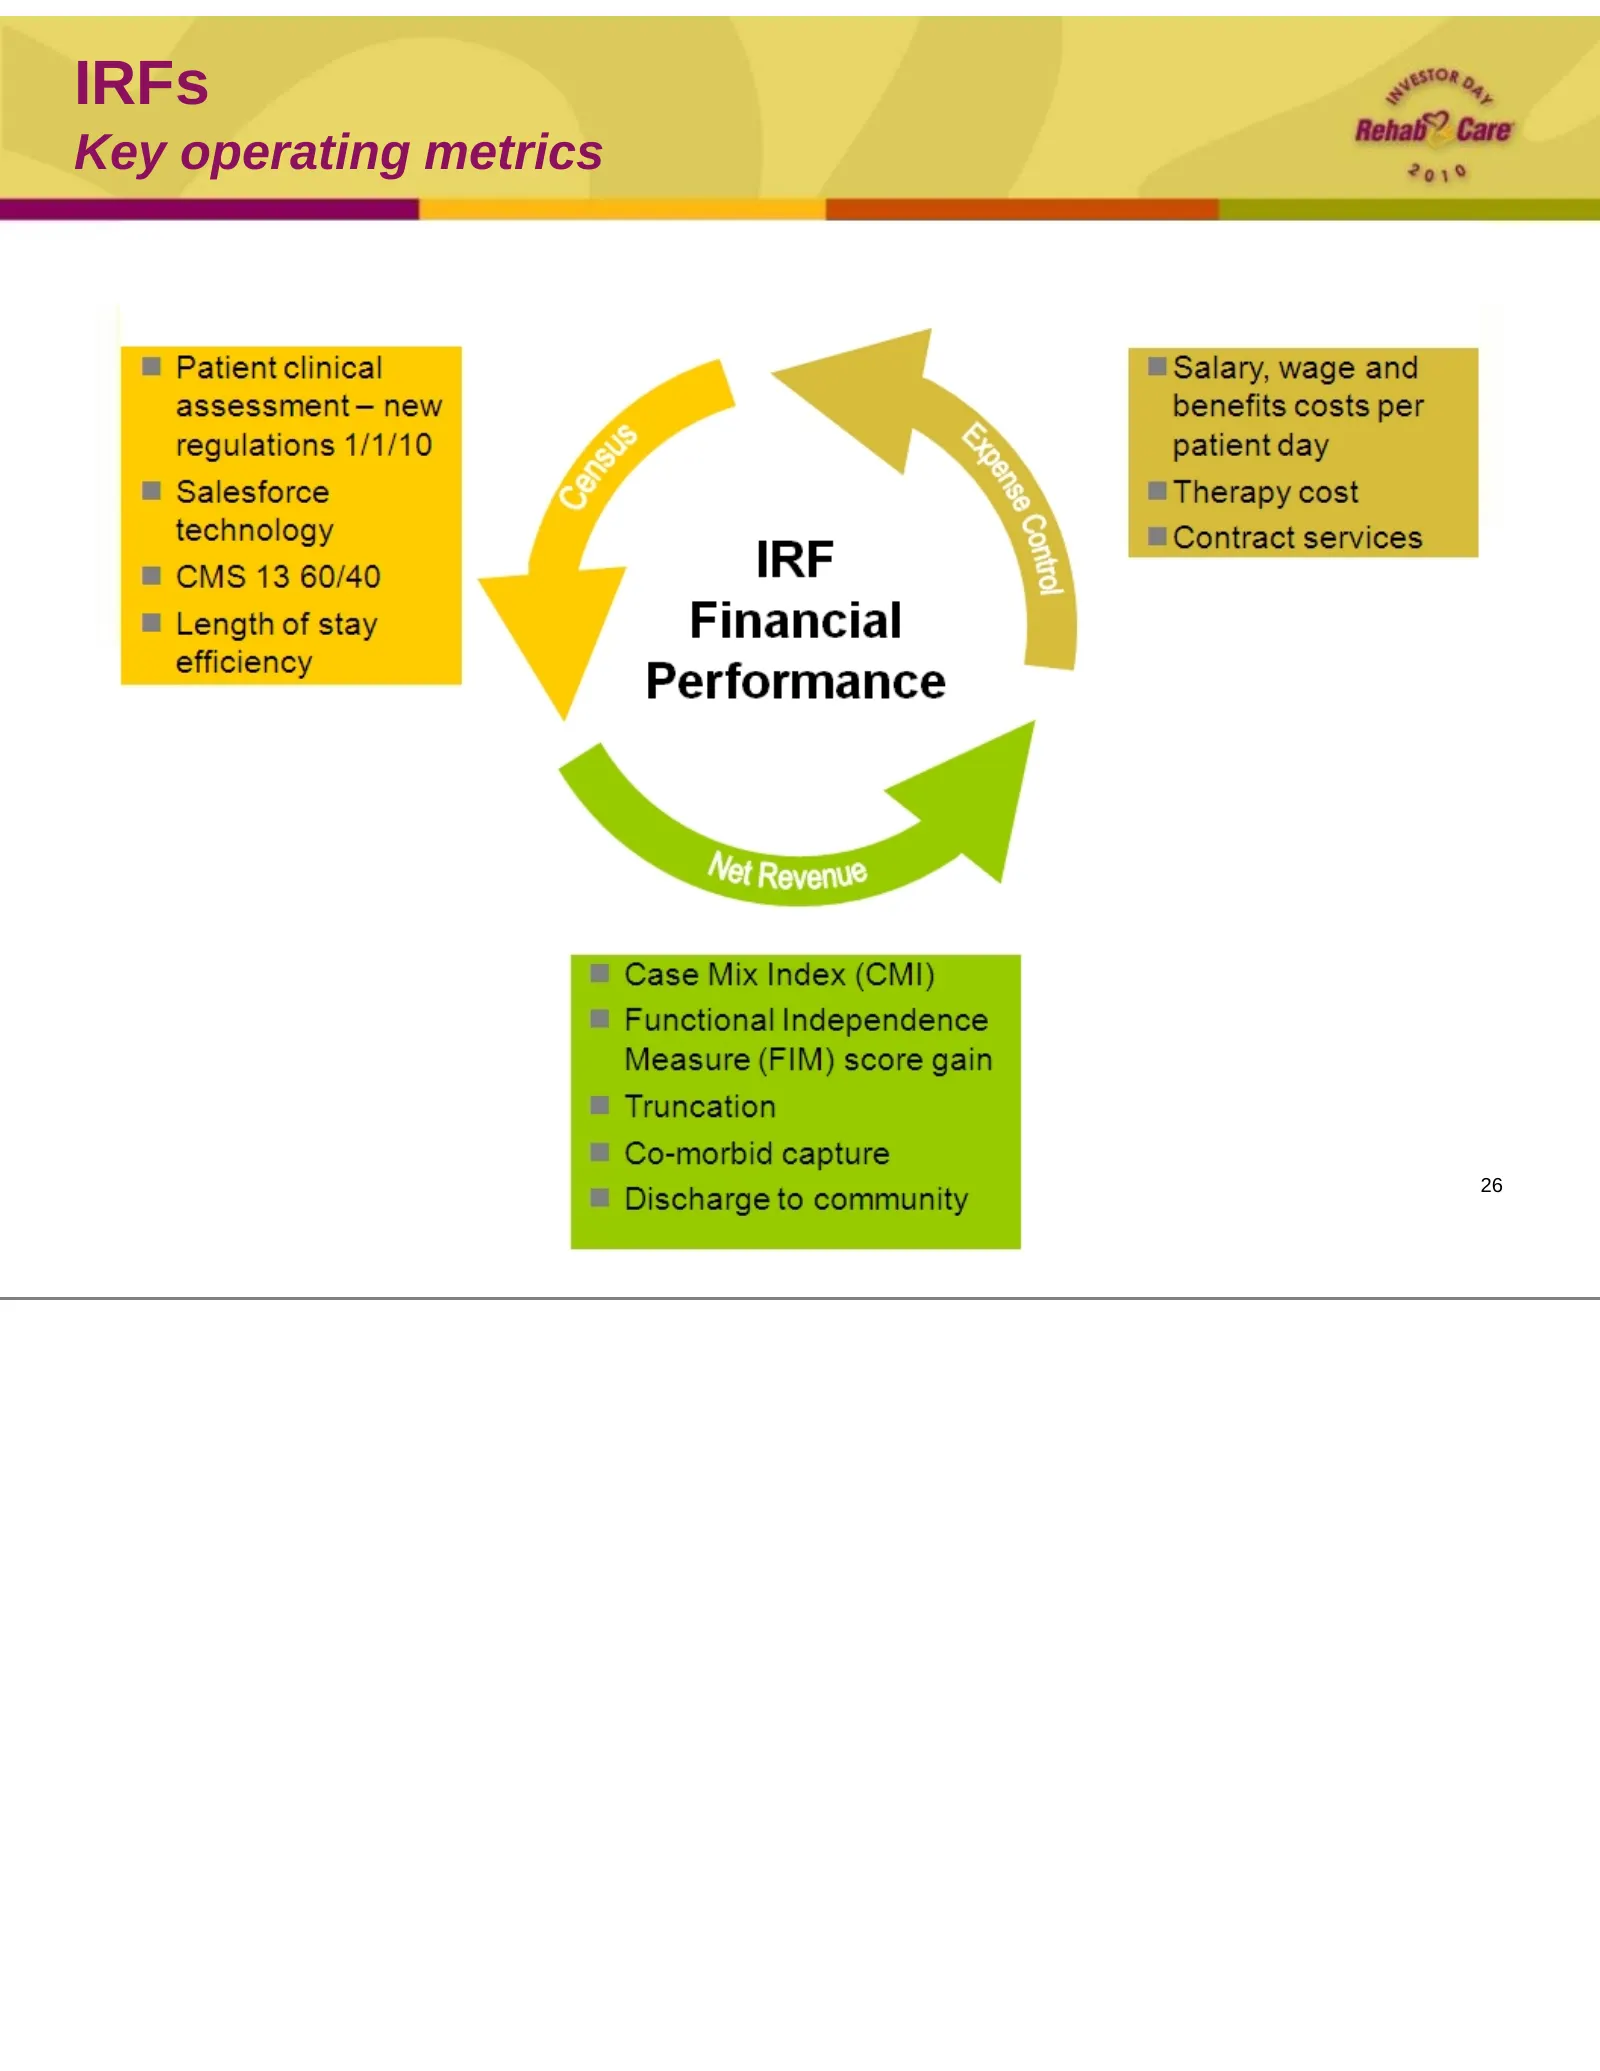
Slide 26: IRFs: Key operating metrics
IRFs Key operating metrics 26
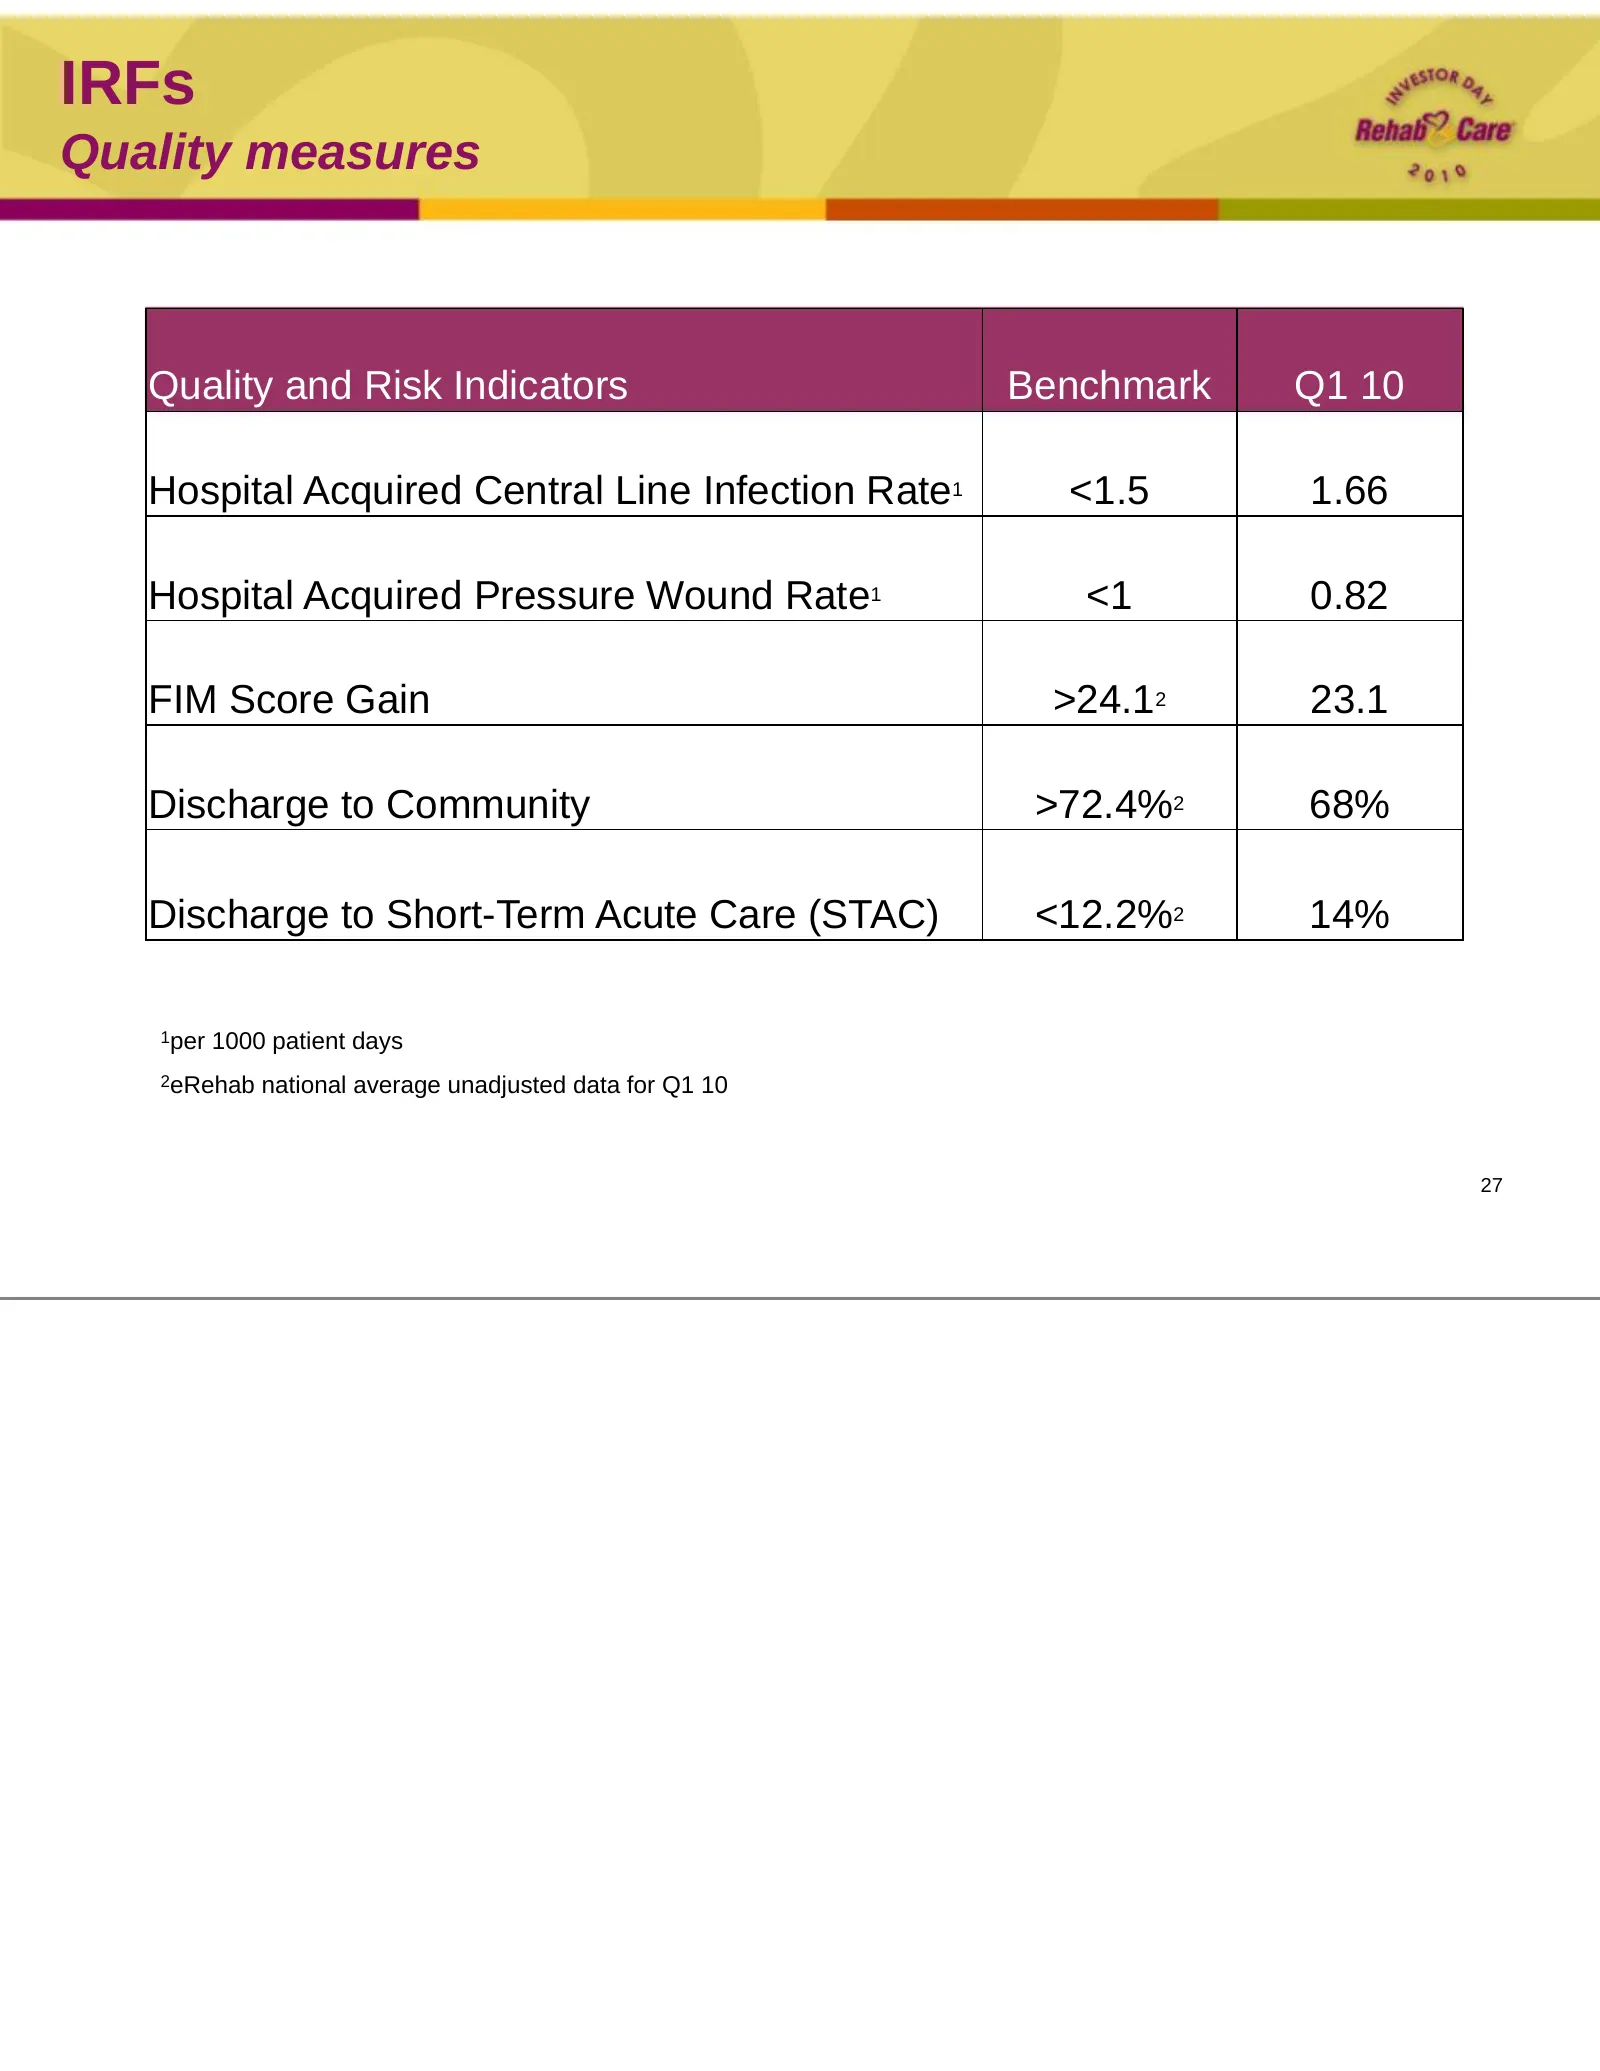
Slide 27: IRFs: Quality measures
IRFs Quality measures Quality and Risk Indicators Benchmark Q1 10 Hospital Acquired Central Line Infection Rate1 <1.5 1.66 Hospital Acquired Pressure Wound Rate1 <1 0.82 FIM Score Gain >24.12 23.1 Discharge to Community >72.4%2 68% Discharge to Short-Term Acute Care (STAC) <12.2%2 14% 1per 1000 pati
Slide 28: Overview and Update on LTACHs
Overview and Update on LTACHs Brock Hardaway
Slide 29: LTACHs: Overview
LTACHs Overview n Update on integration n Update on progress made with implementing key operating metrics at legacy RehabCare LTACHs n Update on Triumph n Role of LTACHs in continuum n Healthcare reform and the future 29
Slide 30: LTACHs: Integration update
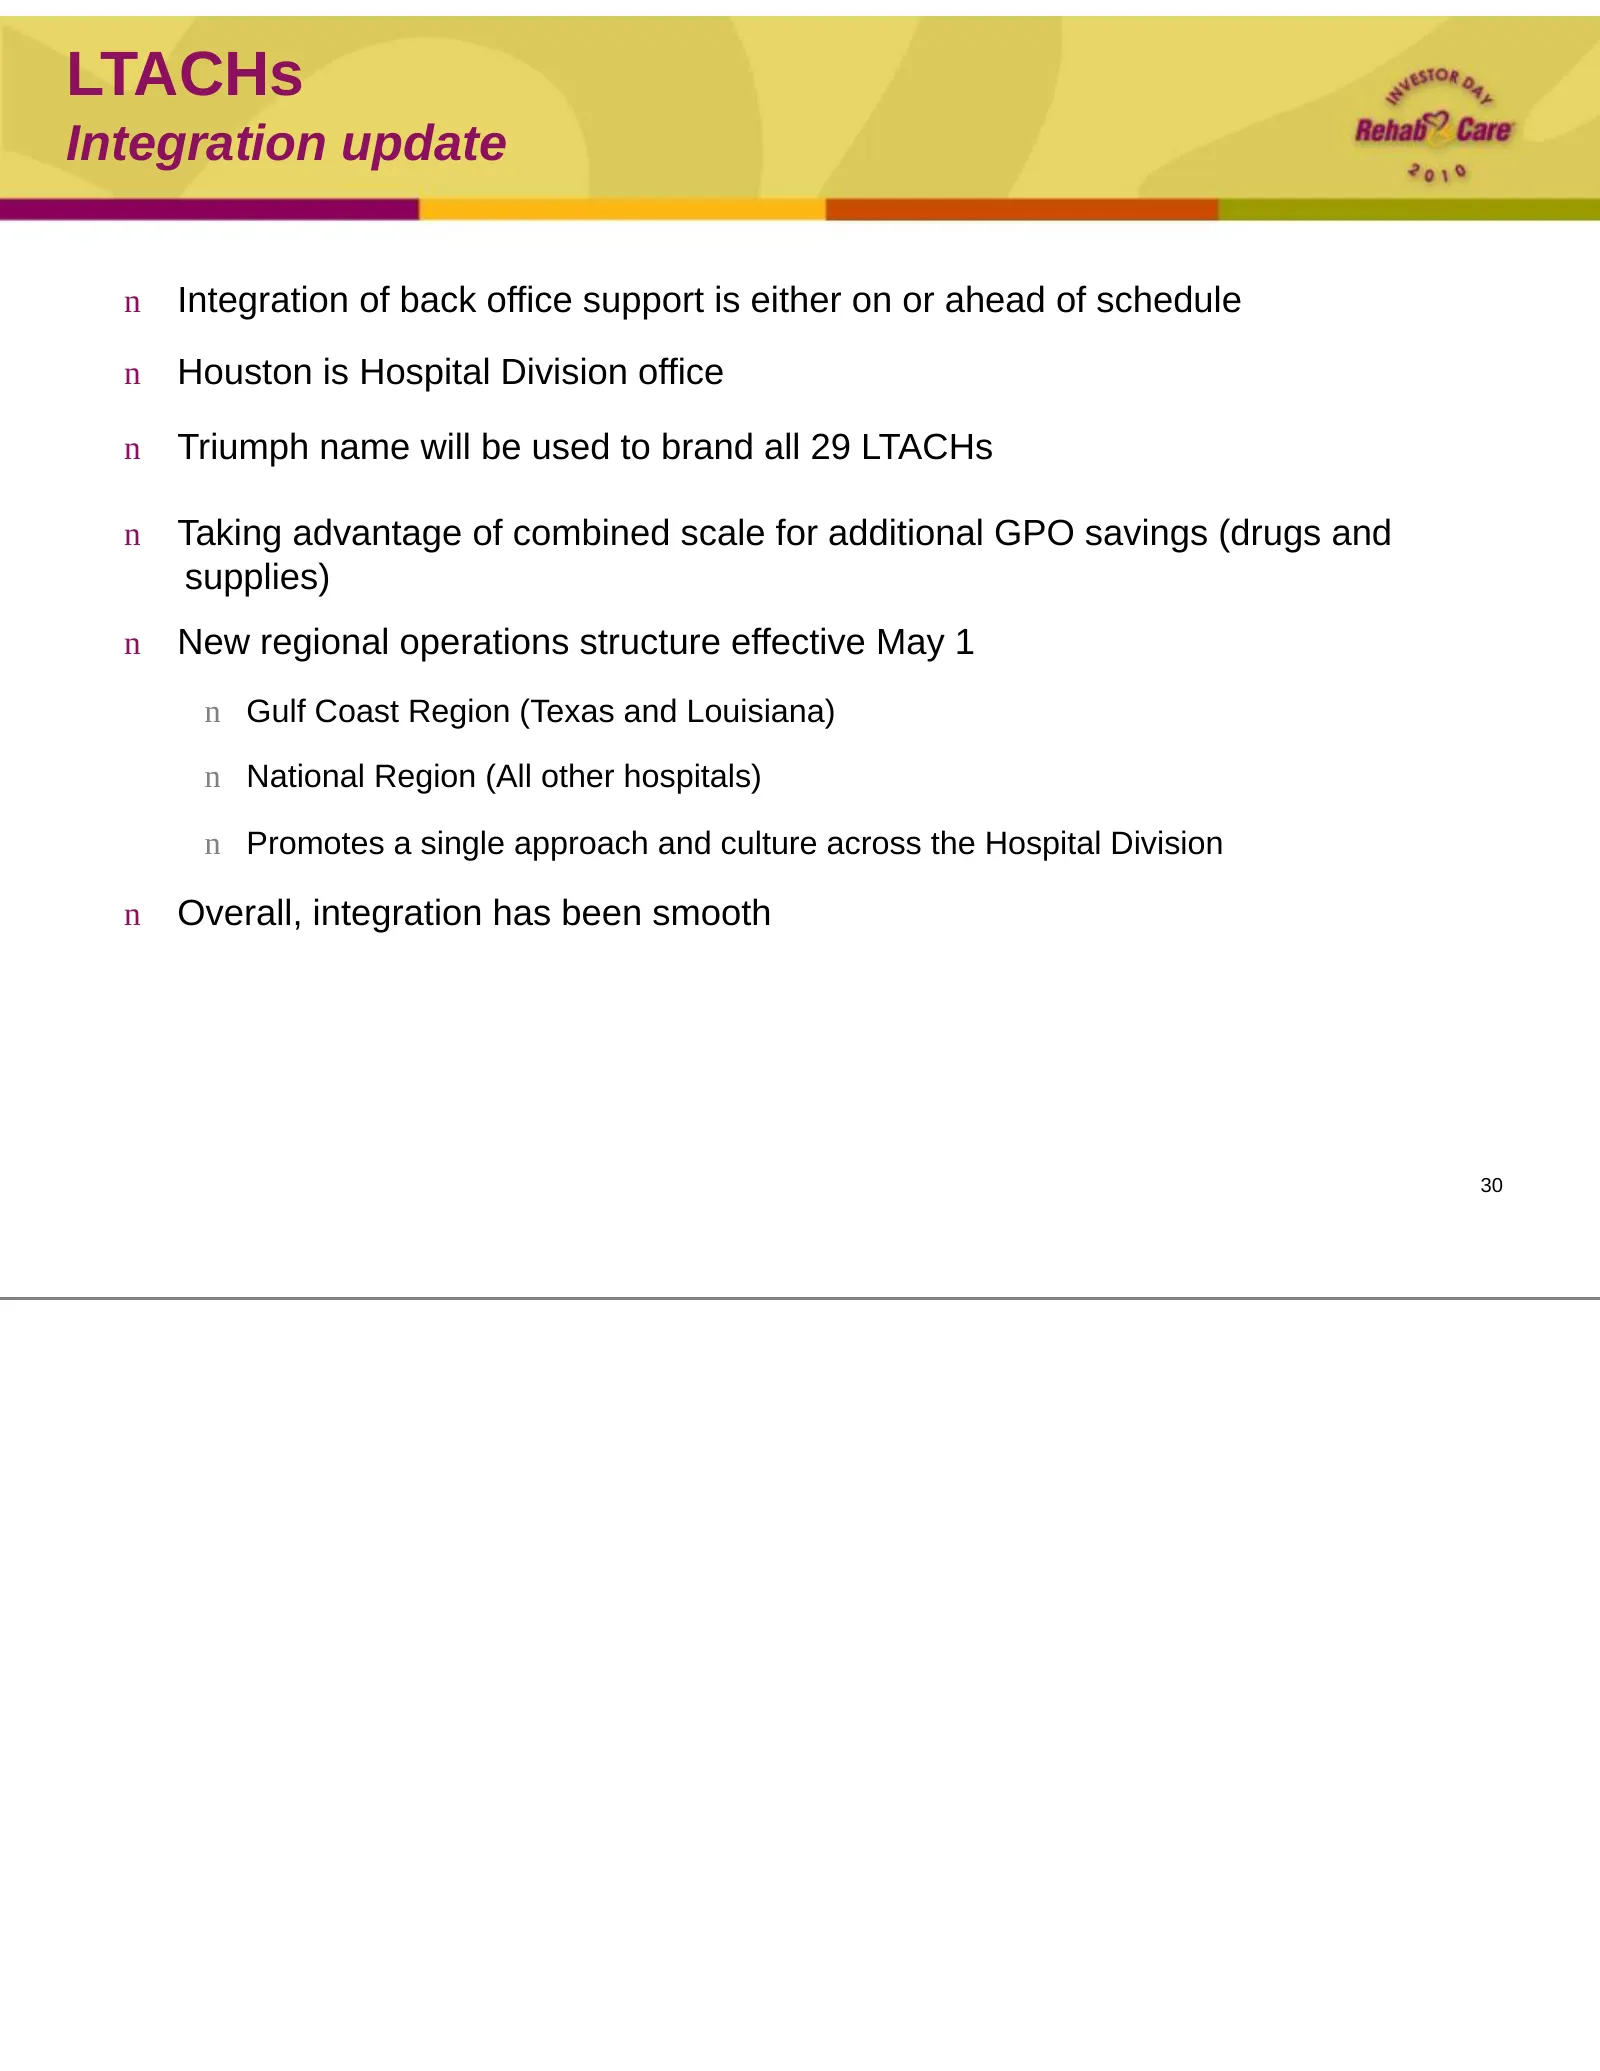
LTACHs Integration update n Integration of back office support is either on or ahead of schedule n Houston is Hospital Division office n Triumph name will be used to brand all 29 LTACHs n Taking advantage of combined scale for additional GPO savings (drugs and supplies) n New regional operations str
Slide 31: LTACHs: Key operating metrics
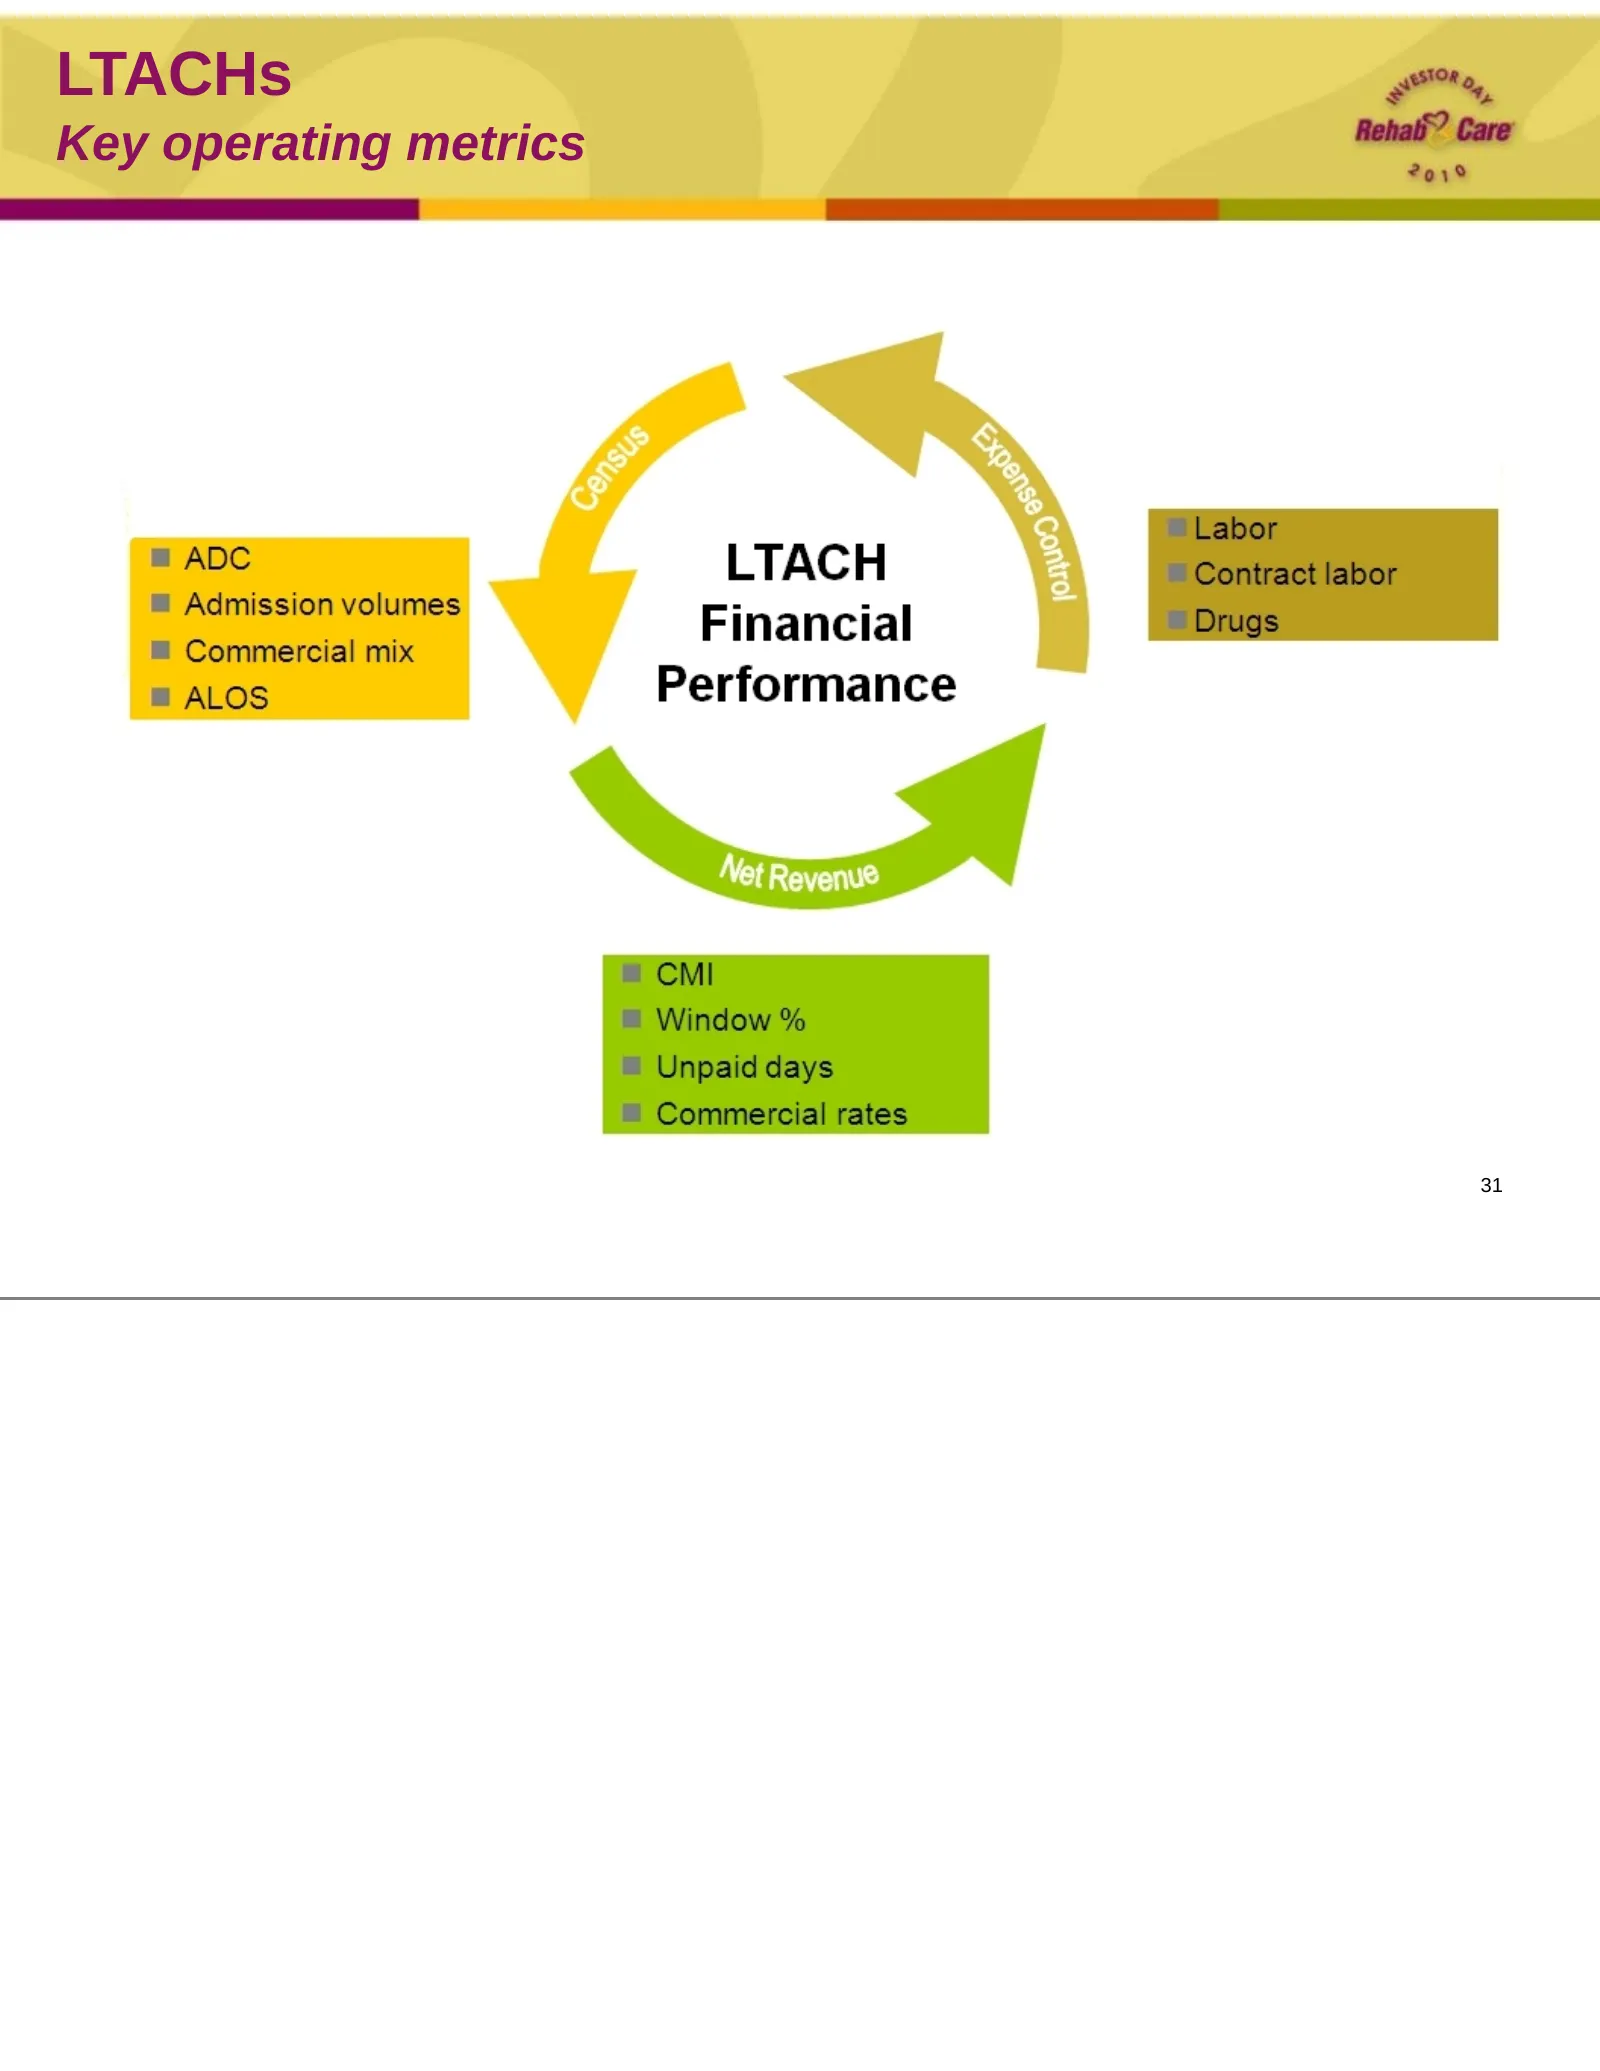
LTACHs Key operating metrics 31
Slide 32: LTACHs: Progress w/implementing Triumph metrics
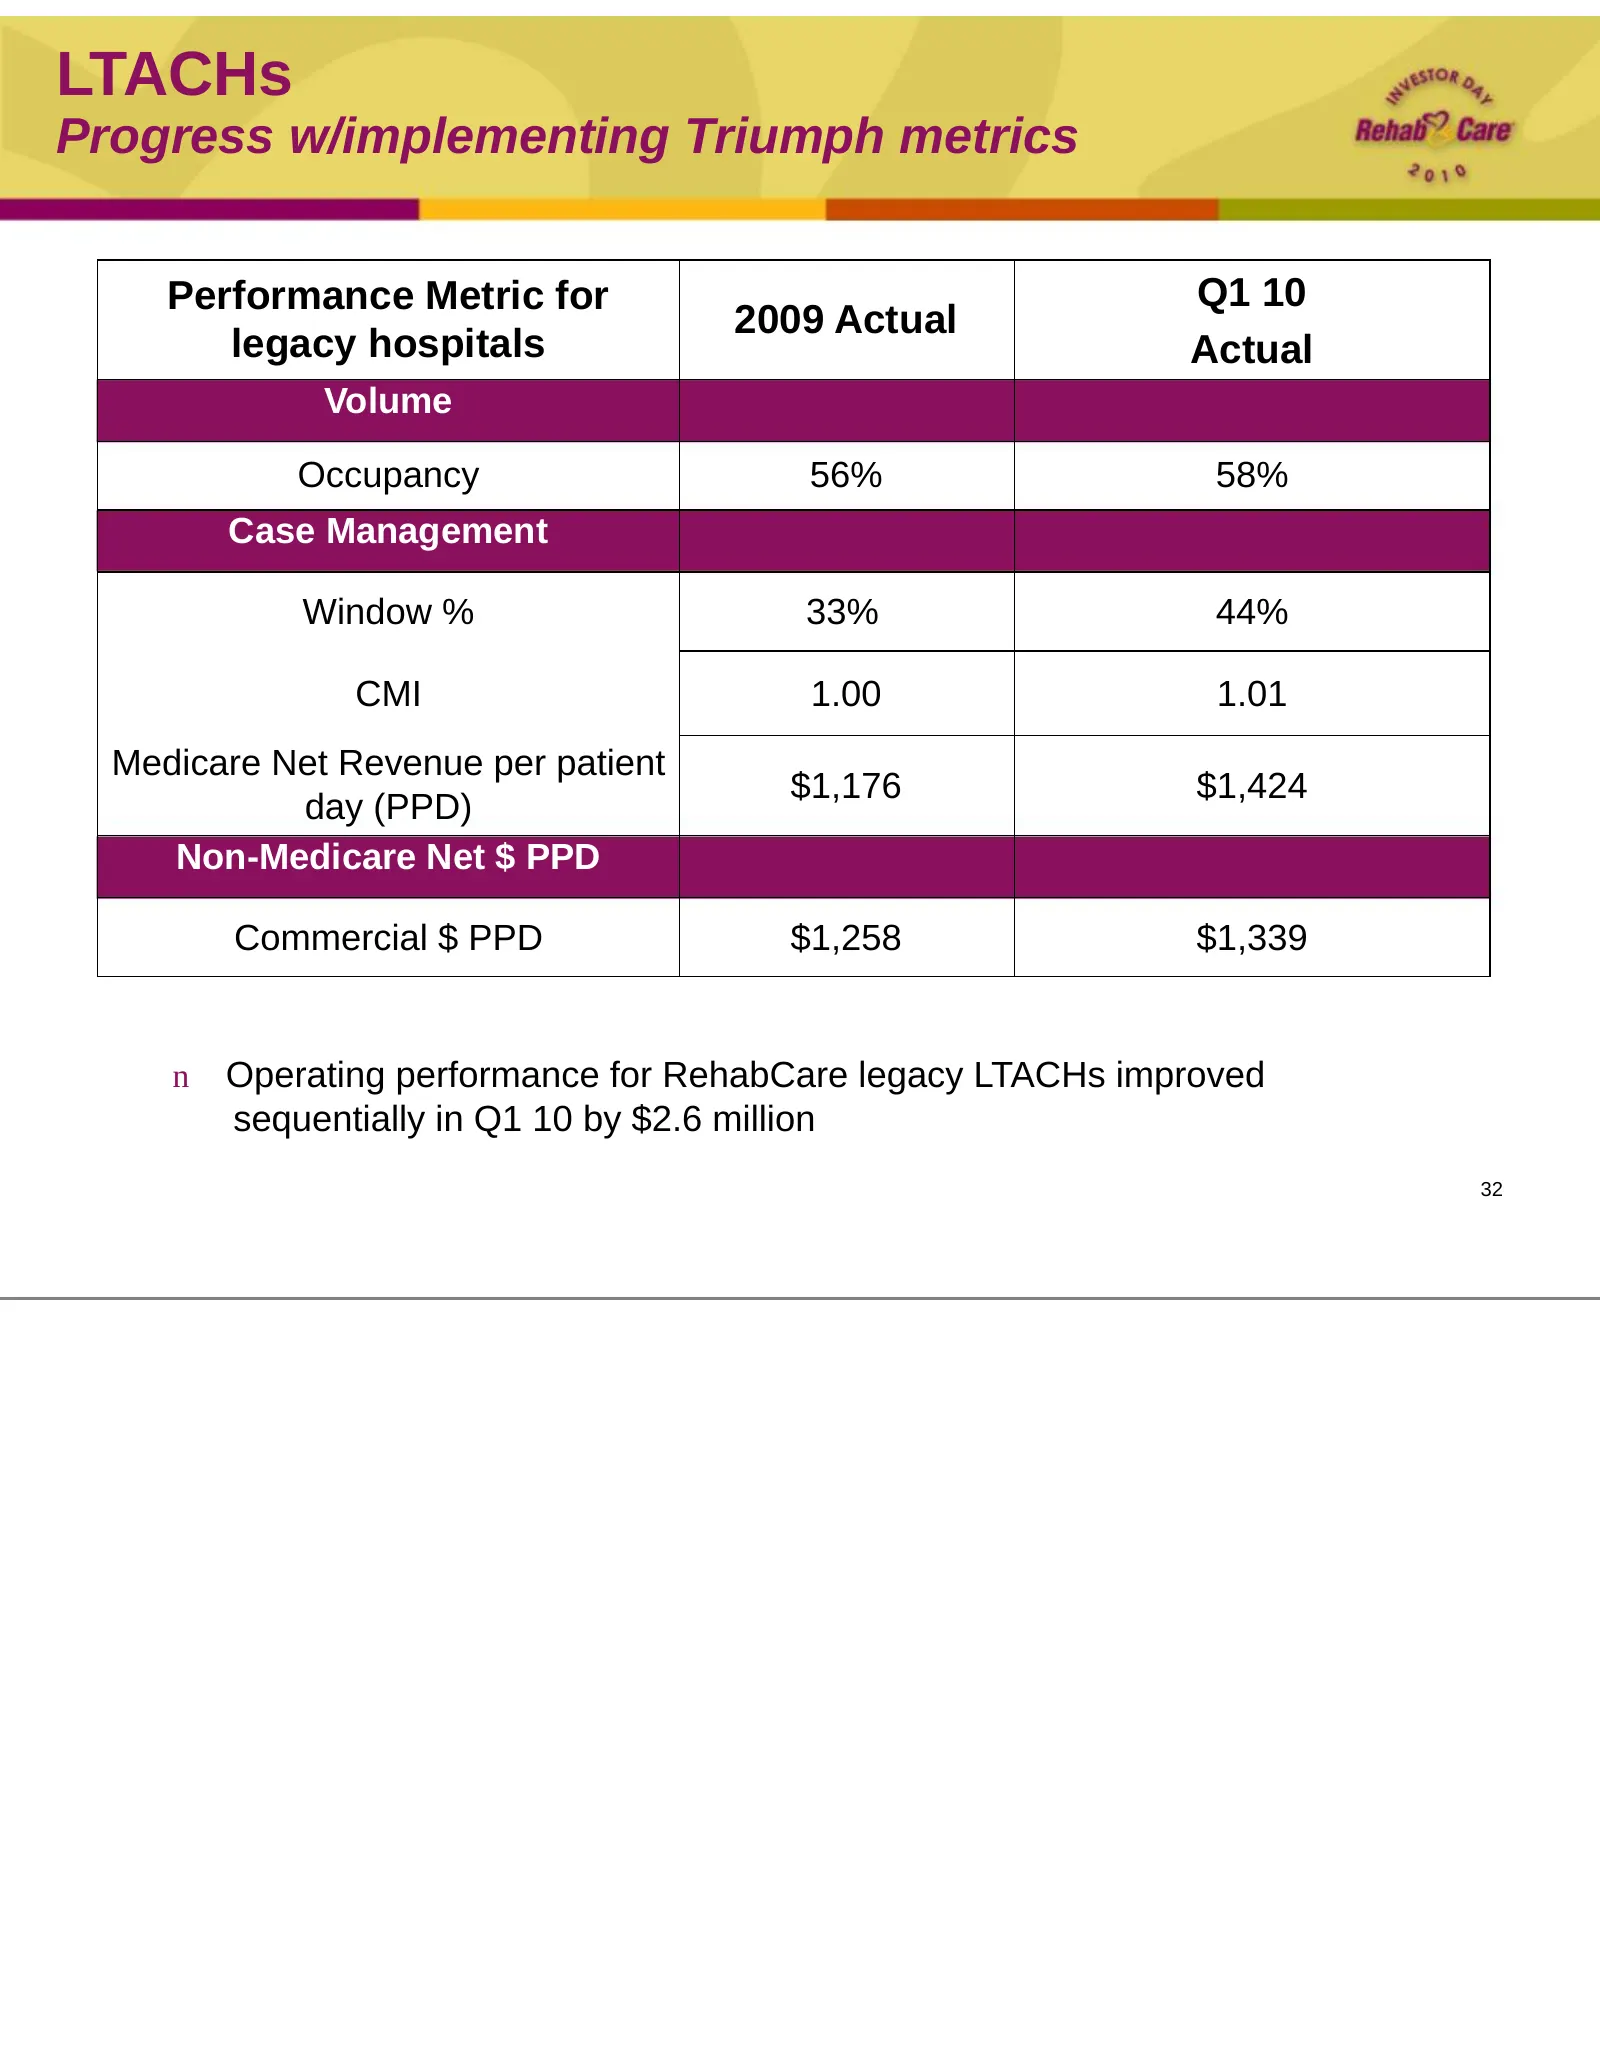
LTACHs Progress w/implementing Triumph metrics Performance Metric for Q1 10 2009 Actual legacy hospitals Actual Volume Occupancy 56% 58% Case Management Window % 33% 44% CMI 1.00 1.01 Medicare Net Revenue per patient $1,176 $1,424 day (PPD) Non-Medicare Net $ PPD Commercial $ PPD $1,258 $1,339 n Ope
Slide 33: LTACHs (all): Performance on key metrics
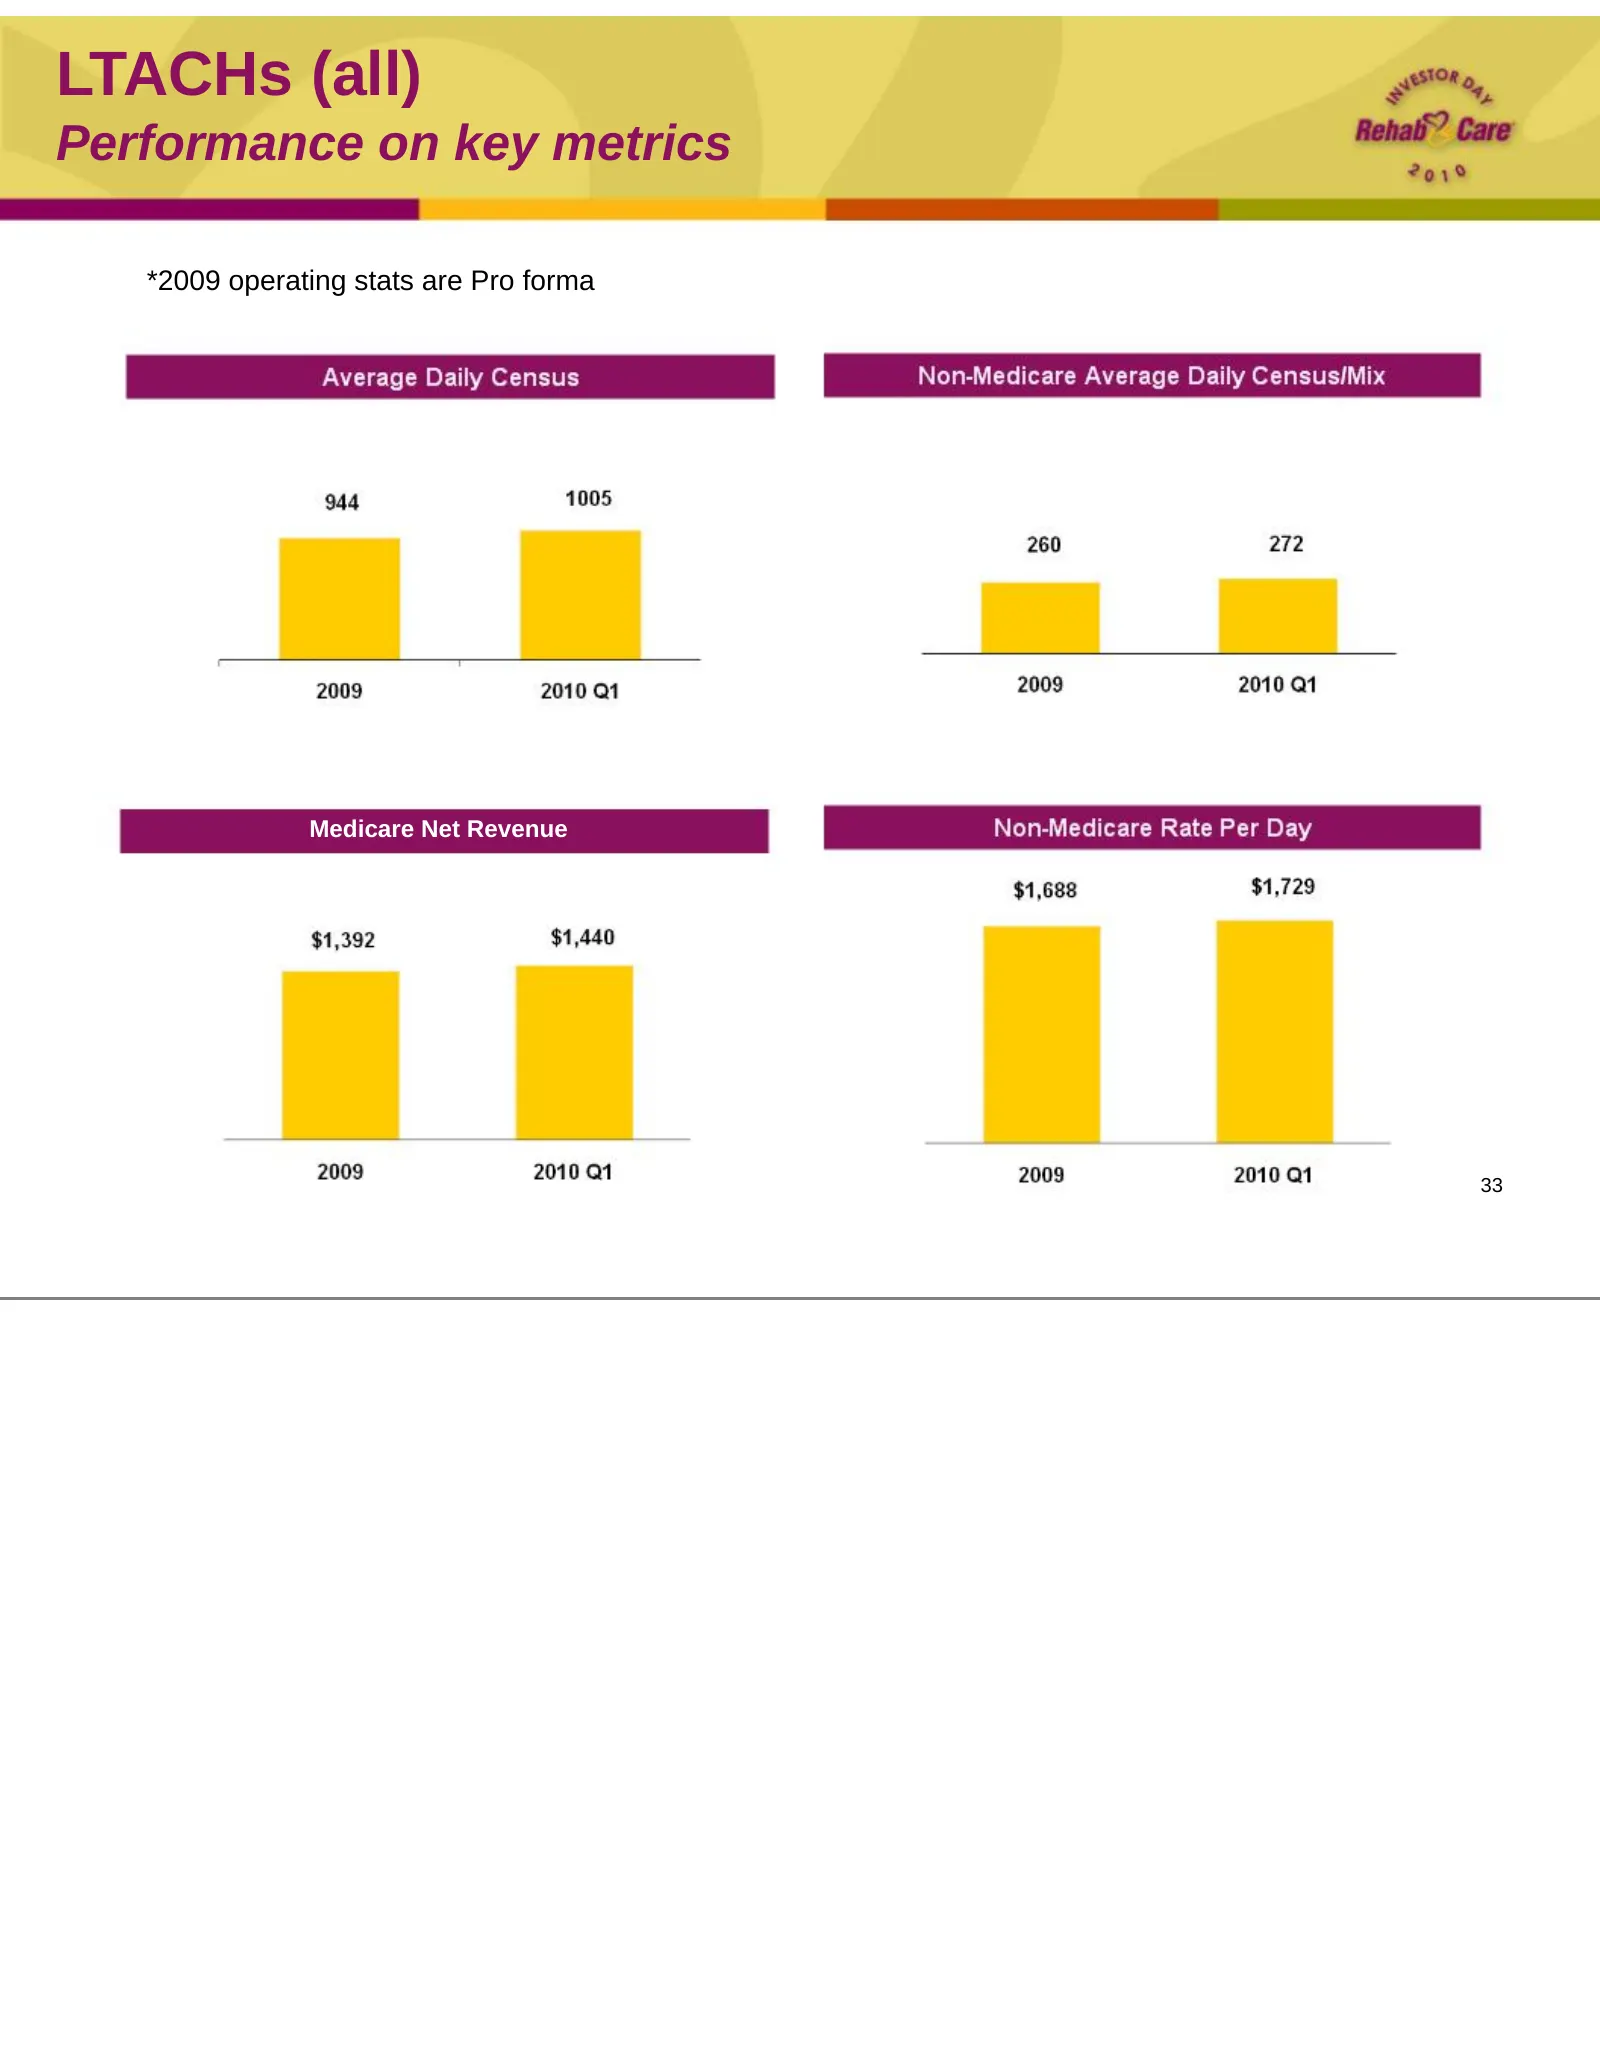
LTACHs (all) Performance on key metrics *2009 operating stats are Pro forma Medicare Net Revenue 33
Slide 34: LTACHs: 2010 operational outlook
LTACHs 2010 operational outlook n Implementing services and programs that will improve quality of care and quality of earnings n ICU (Tulsa and Rome - new construction) n Around-the-clock physician coverage (Tulsa, Dallas, Lafayette, Peoria, Kansas City) n Ancillary enhancements (Tulsa, Dallas, Lafa
Slide 35: LTACHs: Role within the continuum
LTACHs Role within the continuum n LTACHs represent the earliest discharge option from the STAC setting n ICU/high observation unit (HOU) allows for early and safe transfer of medically complex patients n Availability of ancillary services, advanced equipment and experienced staff n LTACHs can disch
Slide 36: LTACHs: Triumph approach
LTACHs Triumph approach Facility/Services n Equipped ICU or HOU with experienced, well-trained ICU staff n 88% of Triumph hospitals have an ICU or HOU today n All but one will have an ICU or HOU by this time next year n Availability of on-site, 24/7 physician coverage n 75% of Triumph hospitals have
Slide 37: LTACHs: Quality measures
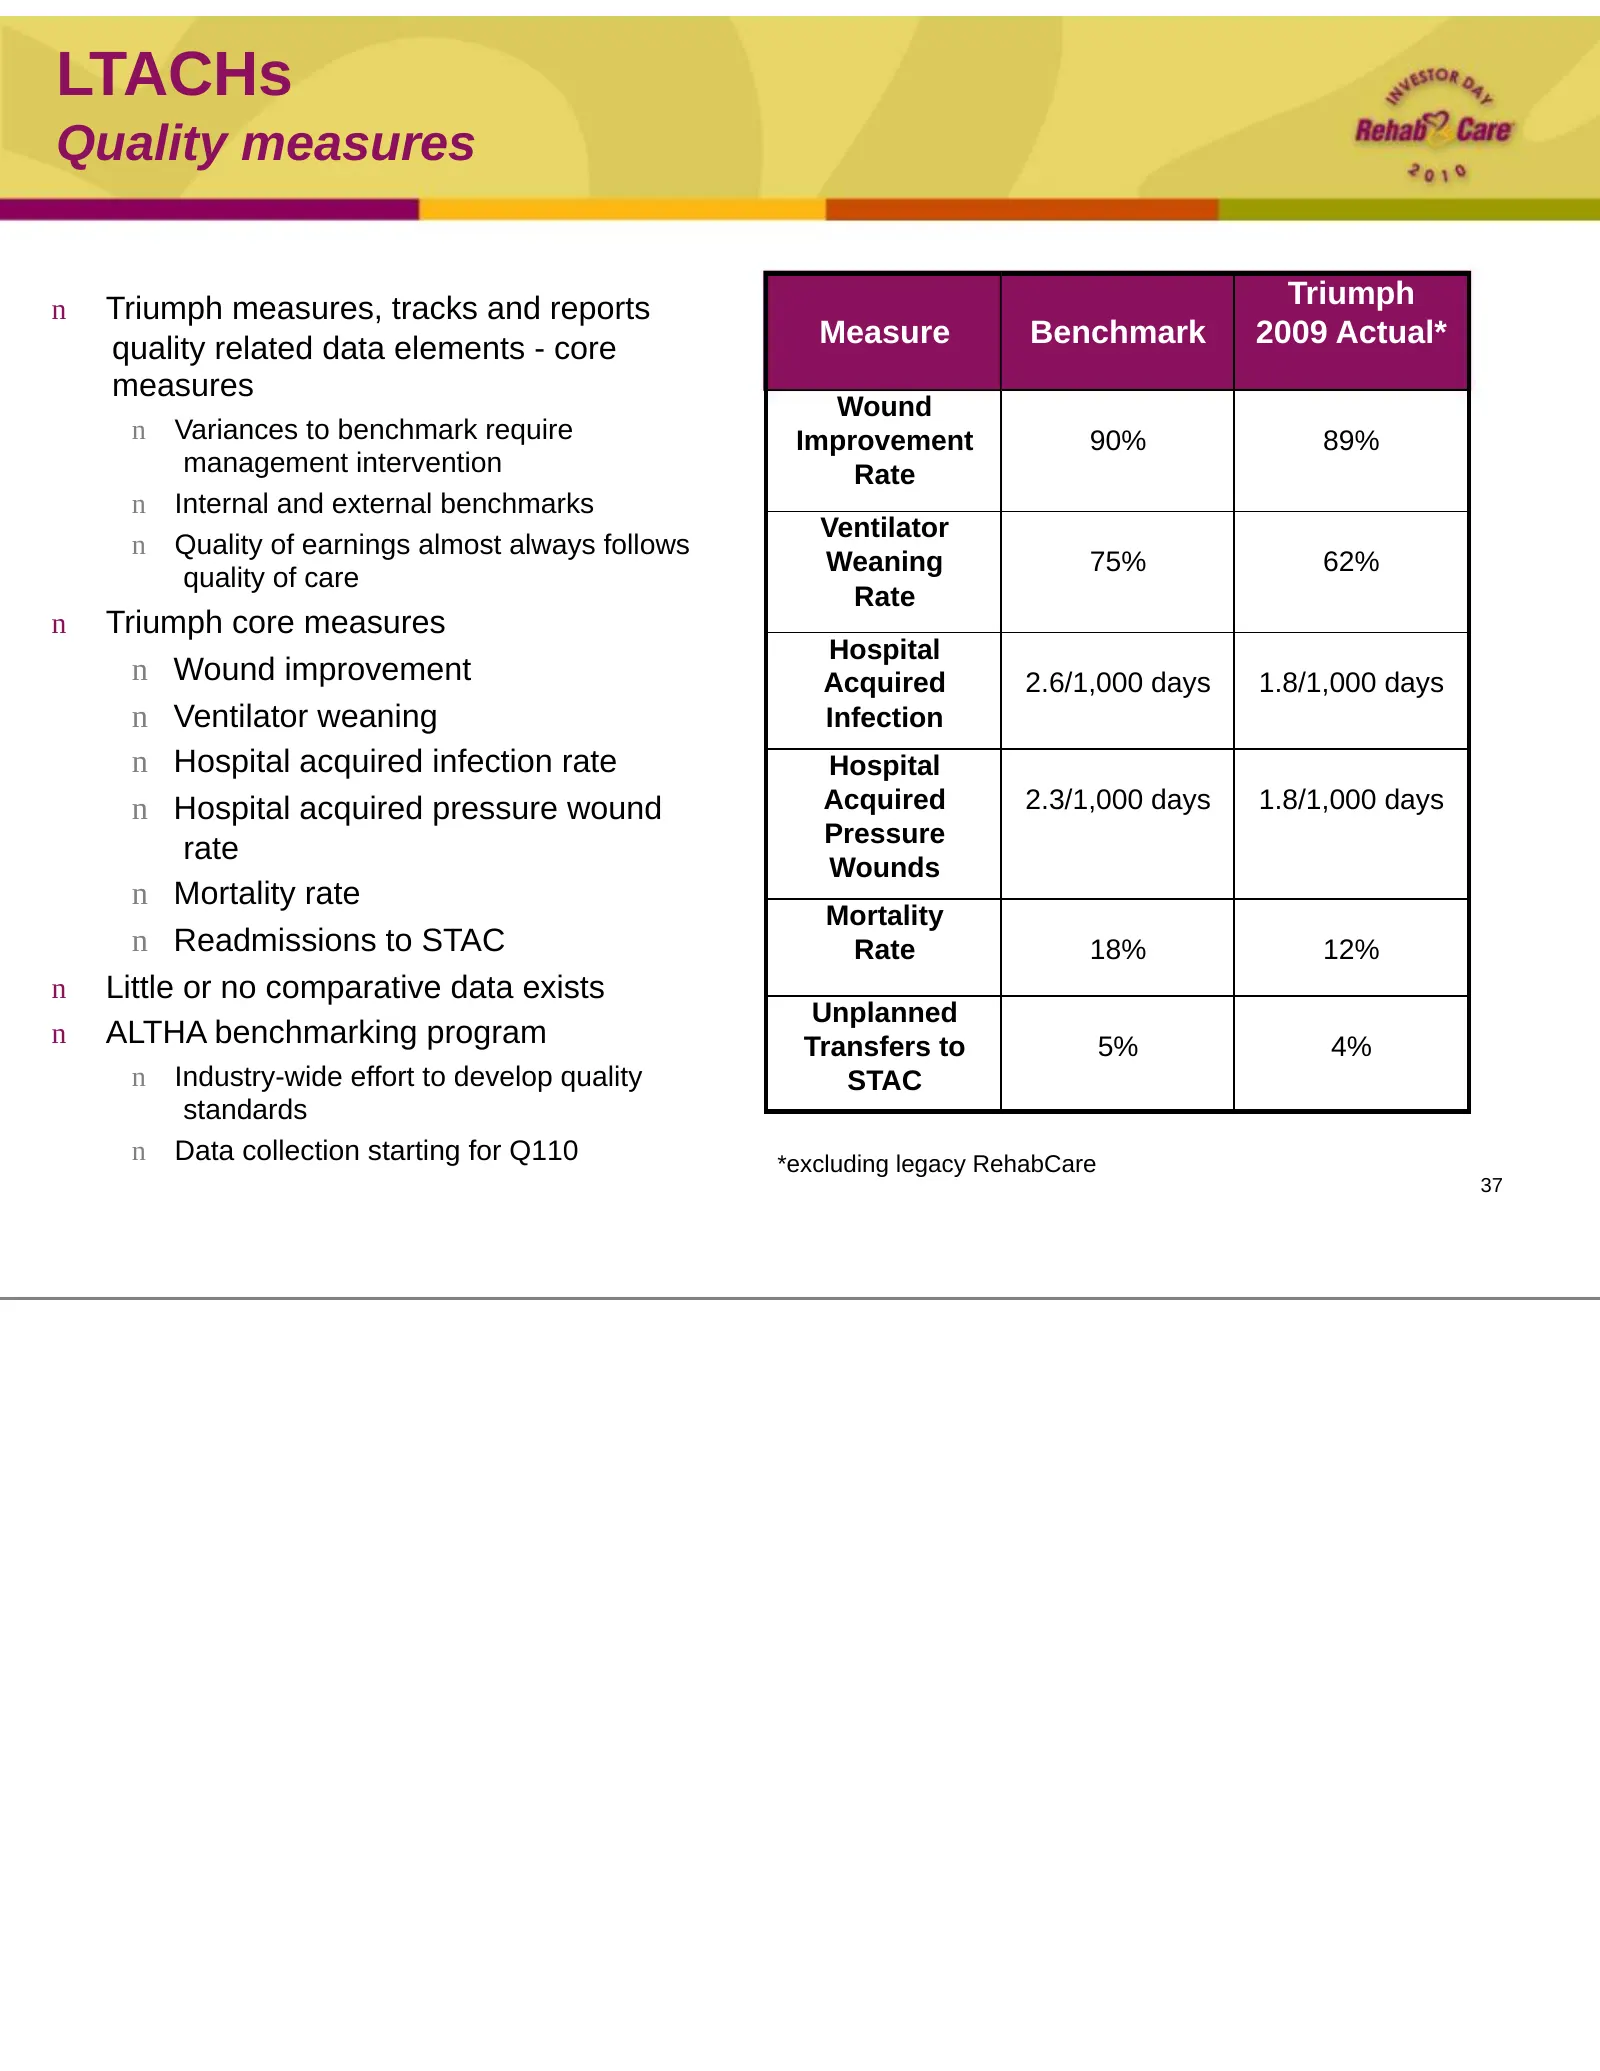
LTACHs Quality measures n Triumph measures, tracks and reports Triumph quality related data elements - core Measure Benchmark 2009 Actual* measures Wound n Variances to benchmark require Improvement 90% 89% management intervention Rate n Internal and external benchmarks Ventilator n Quality of earni
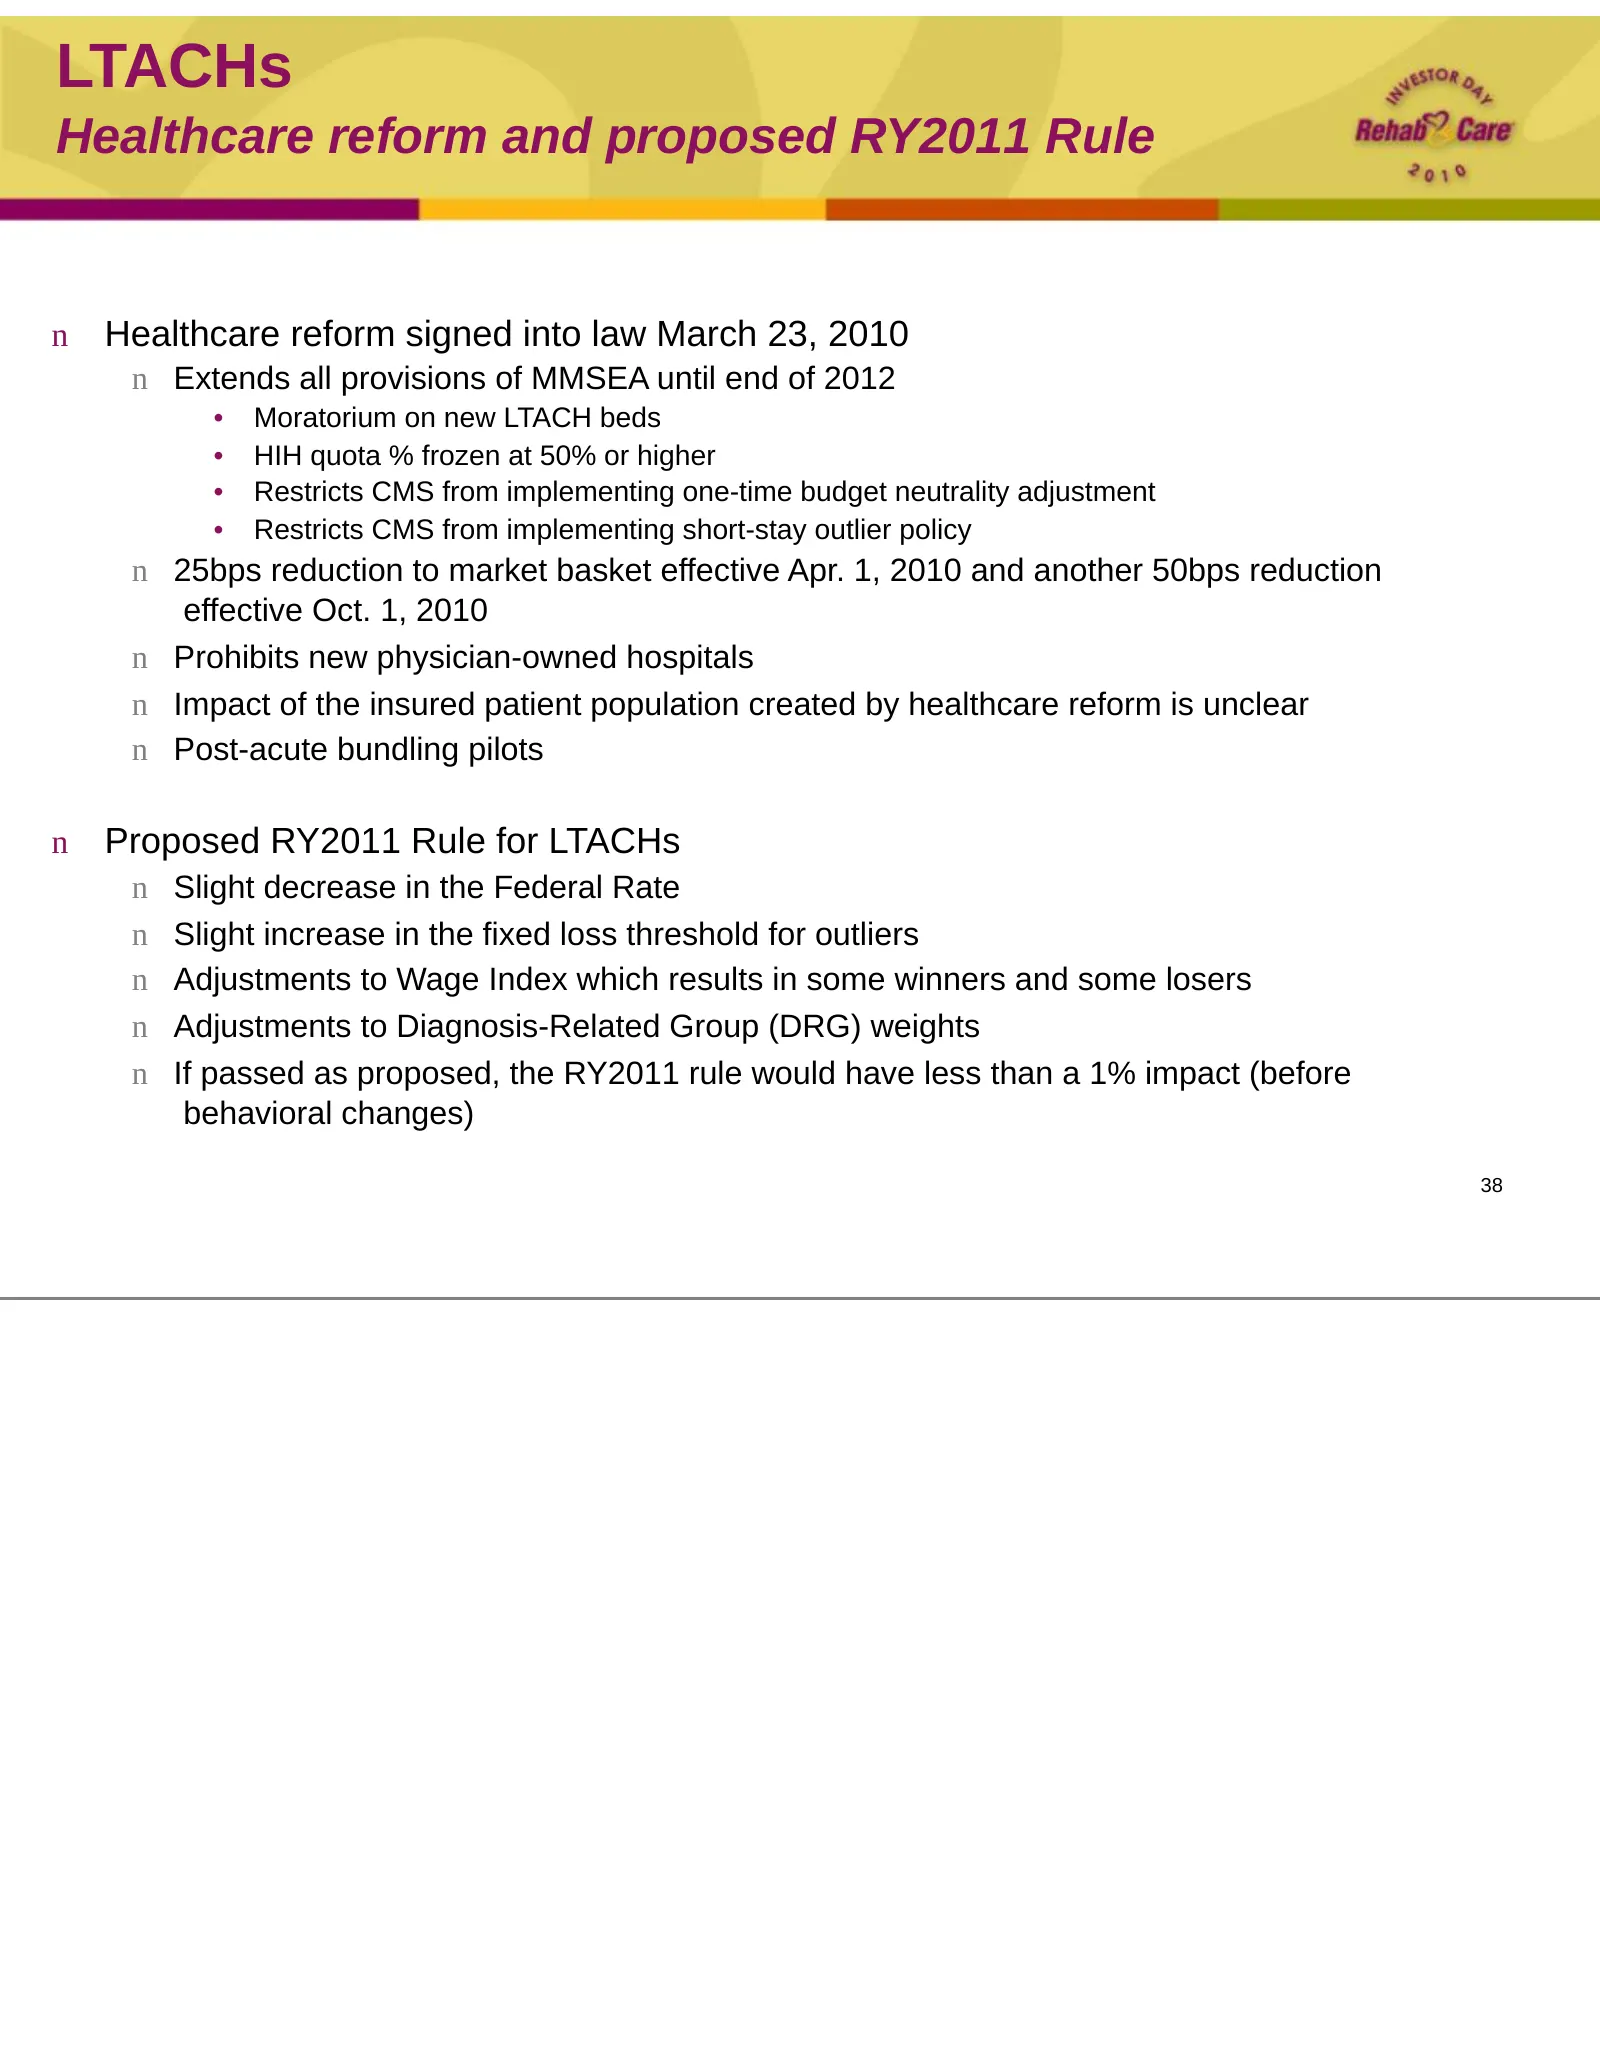
Slide 38: LTACHs: Healthcare reform and proposed RY2011 Rule
LTACHs Healthcare reform and proposed RY2011 Rule n Healthcare reform signed into law March 23, 2010 n Extends all provisions of MMSEA until end of 2012 • Moratorium on new LTACH beds • HIH quota % frozen at 50% or higher • Restricts CMS from implementing one-time budget neutrality adjustment • Rest
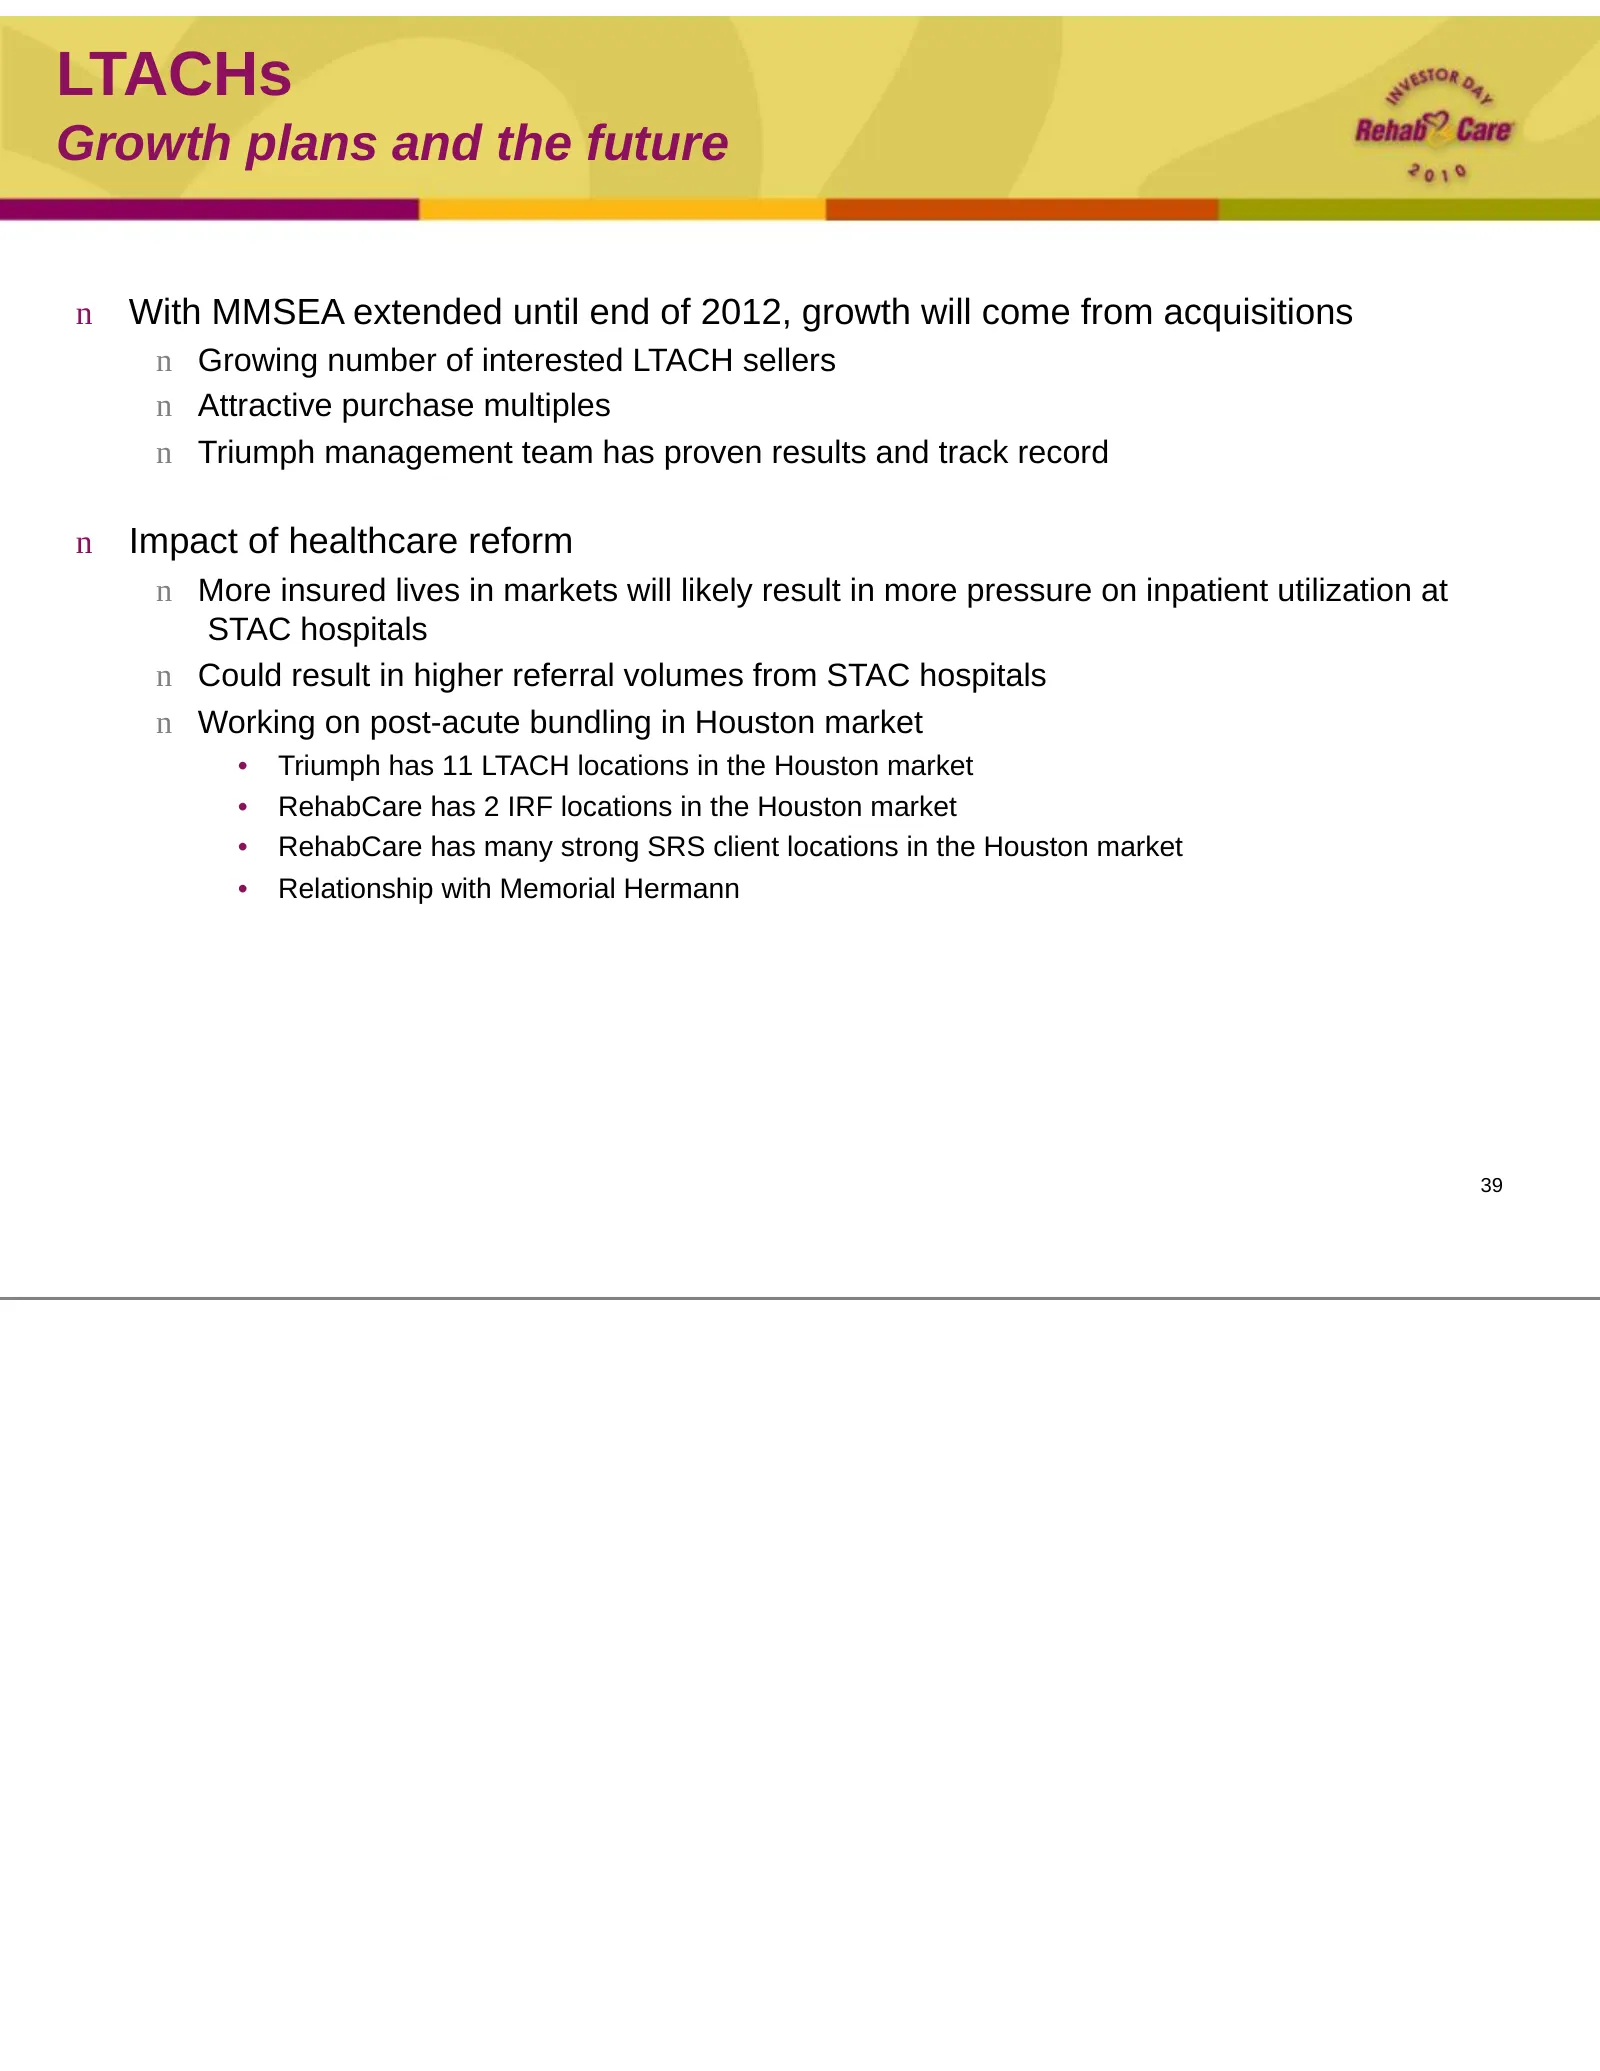
Slide 39: LTACHs: Growth plans and the future
LTACHs Growth plans and the future n With MMSEA extended until end of 2012, growth will come from acquisitions n Growing number of interested LTACH sellers n Attractive purchase multiples n Triumph management team has proven results and track record n Impact of healthcare reform n More insured lives
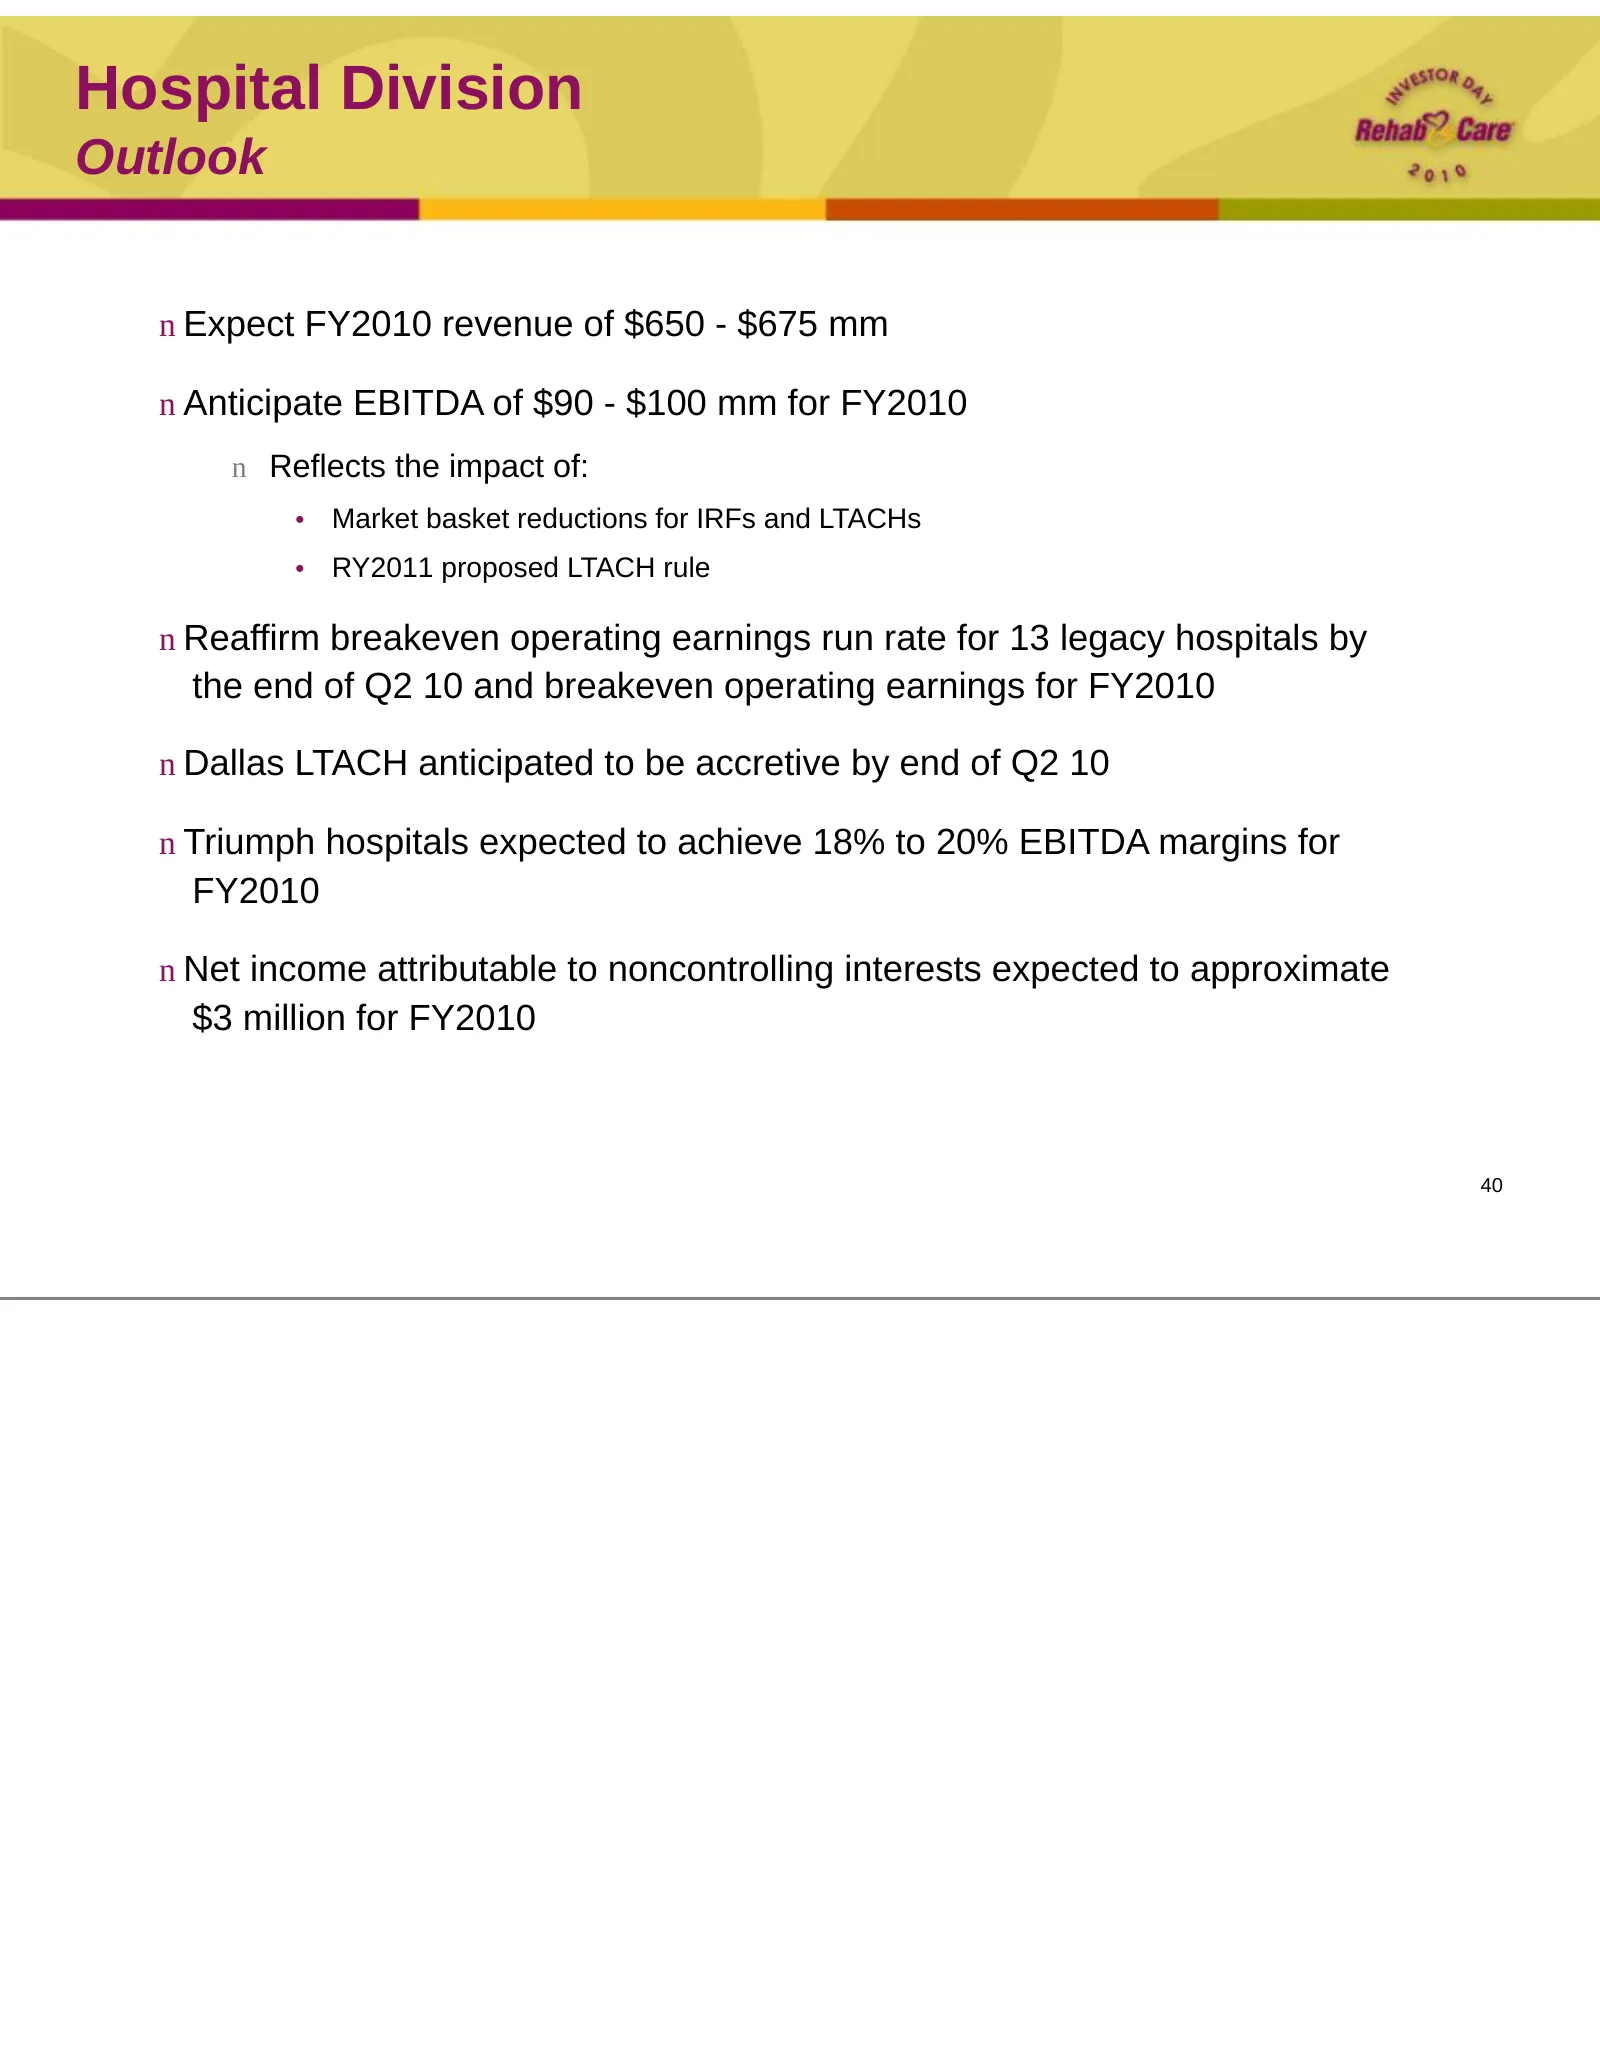
Slide 40: Hospital Division: Outlook
Hospital Division Outlook n Expect FY2010 revenue of $650 - $675 mm n Anticipate EBITDA of $90 - $100 mm for FY2010 n Reflects the impact of: • Market basket reductions for IRFs and LTACHs • RY2011 proposed LTACH rule n Reaffirm breakeven operating earnings run rate for 13 legacy hospitals by the en

Slide 41: Strategic Direction
Strategic Direction John Short
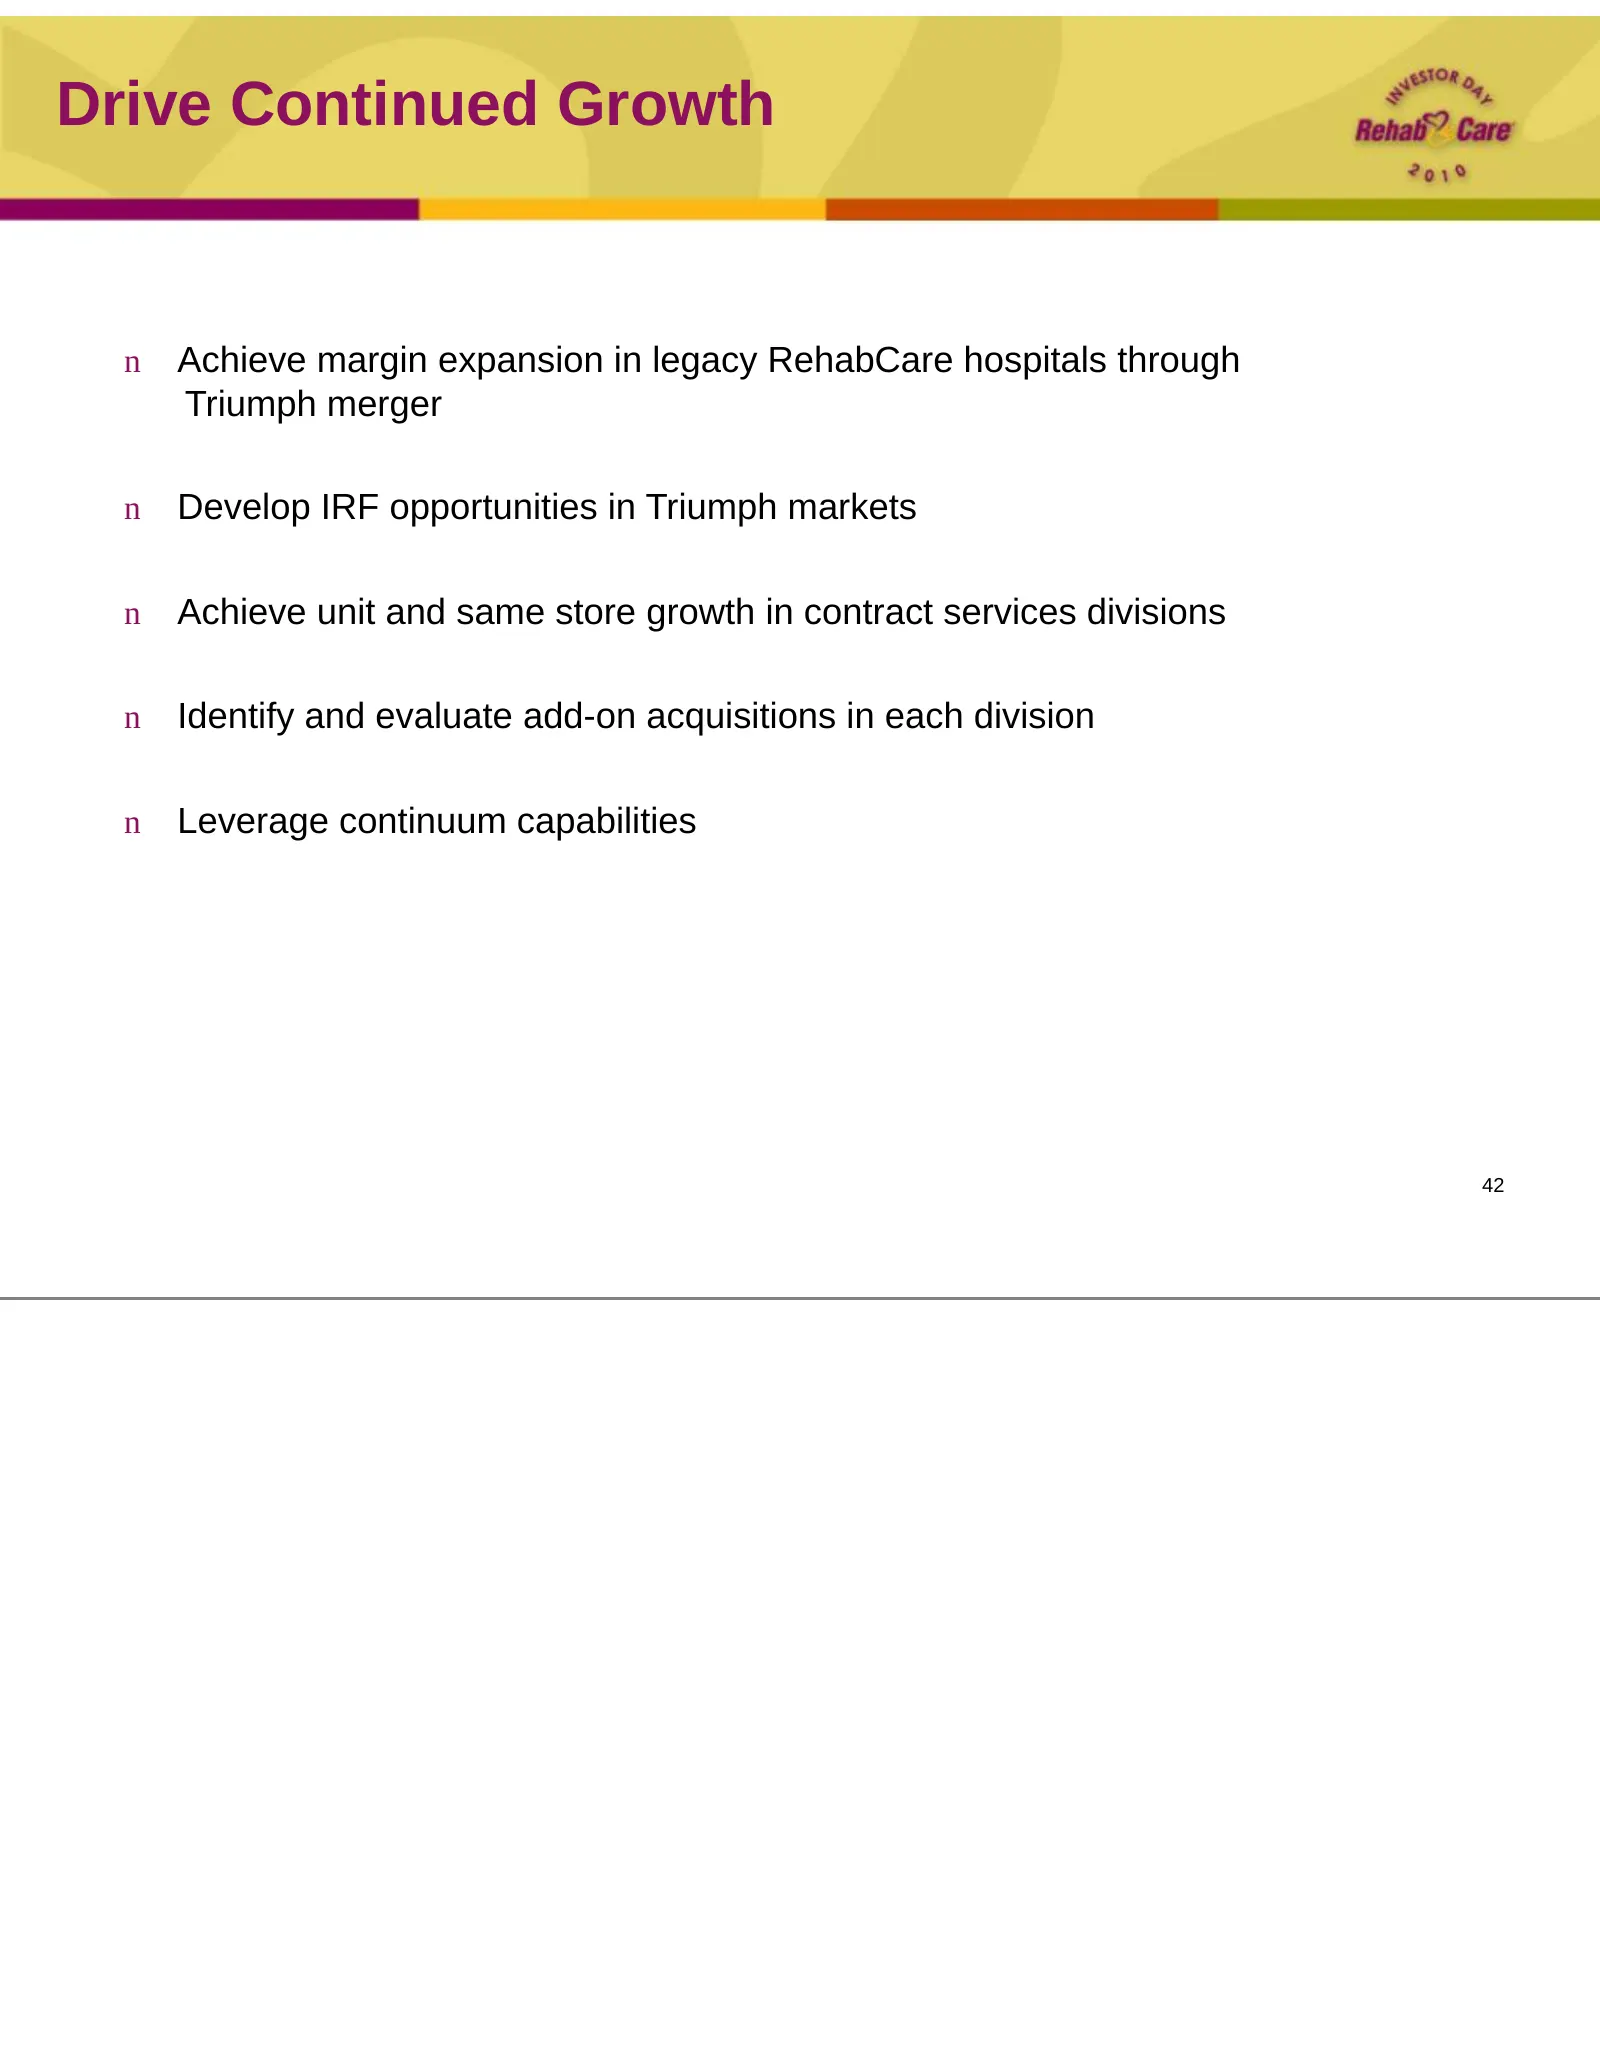
Slide 42: Drive Continued Growth
Drive Continued Growth n Achieve margin expansion in legacy RehabCare hospitals through Triumph merger n Develop IRF opportunities in Triumph markets n Achieve unit and same store growth in contract services divisions n Identify and evaluate add-on acquisitions in each division n Leverage continuum
Slide 43: Leverage Continuum Capabilities
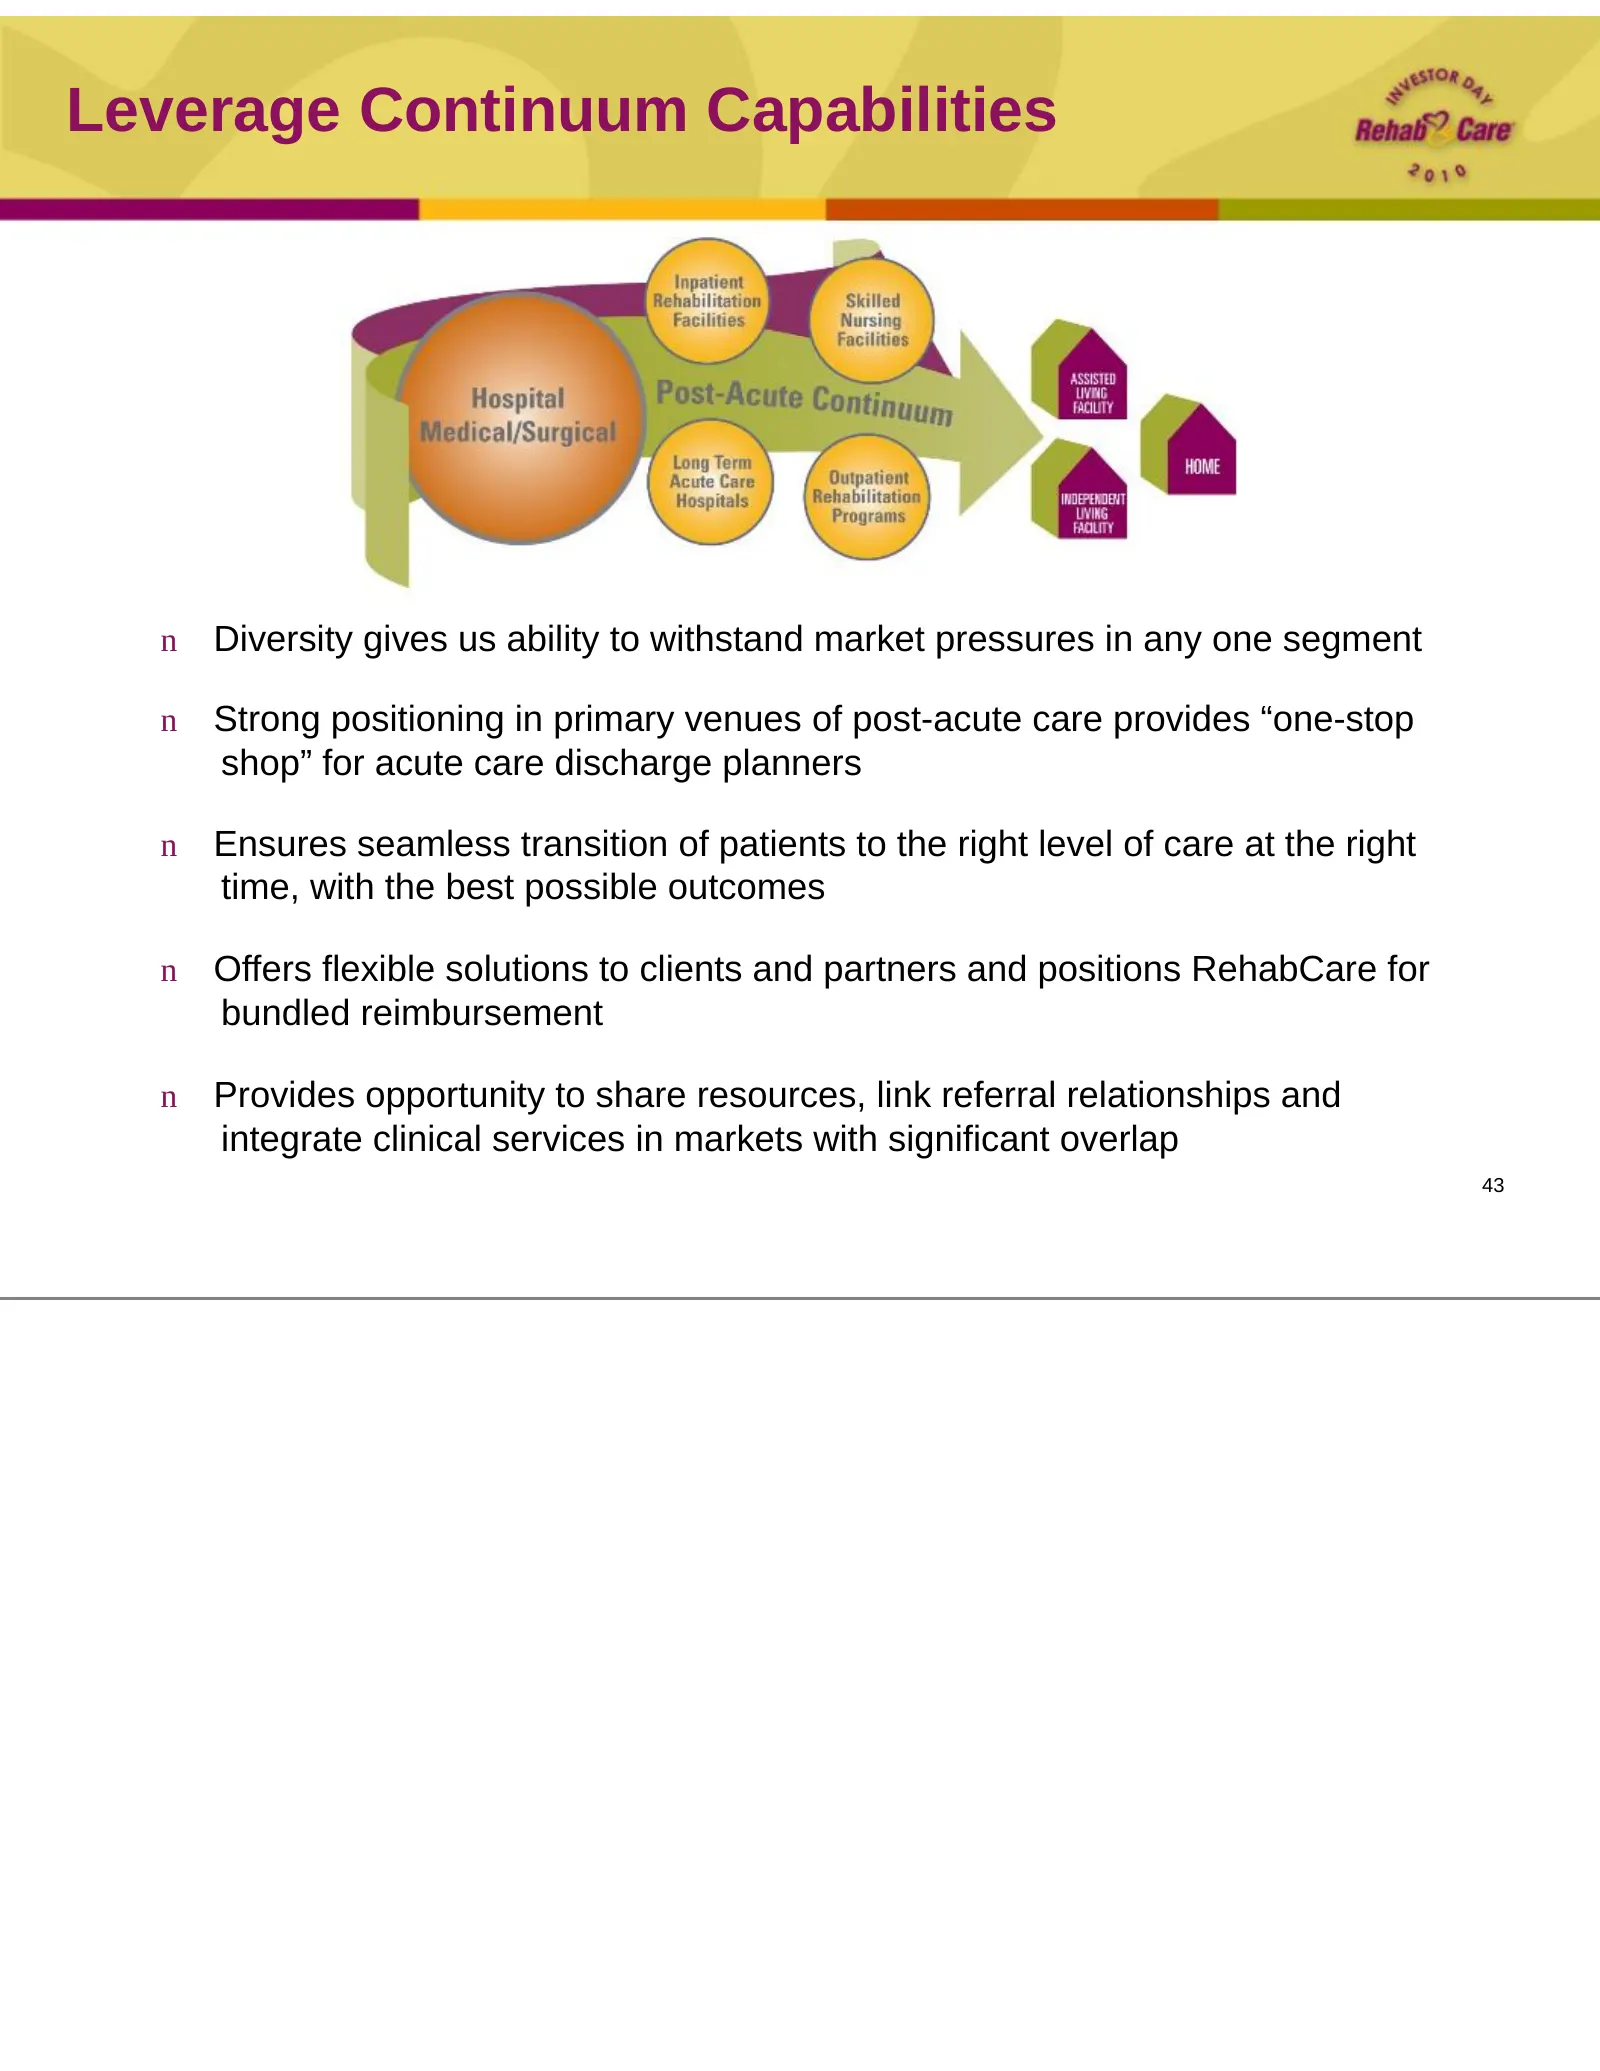
Leverage Continuum Capabilities n Diversity gives us ability to withstand market pressures in any one segment n Strong positioning in primary venues of post-acute care provides “one-stop shop” for acute care discharge planners n Ensures seamless transition of patients to the right level of care at t
Slide 44: Market Sector Overlap
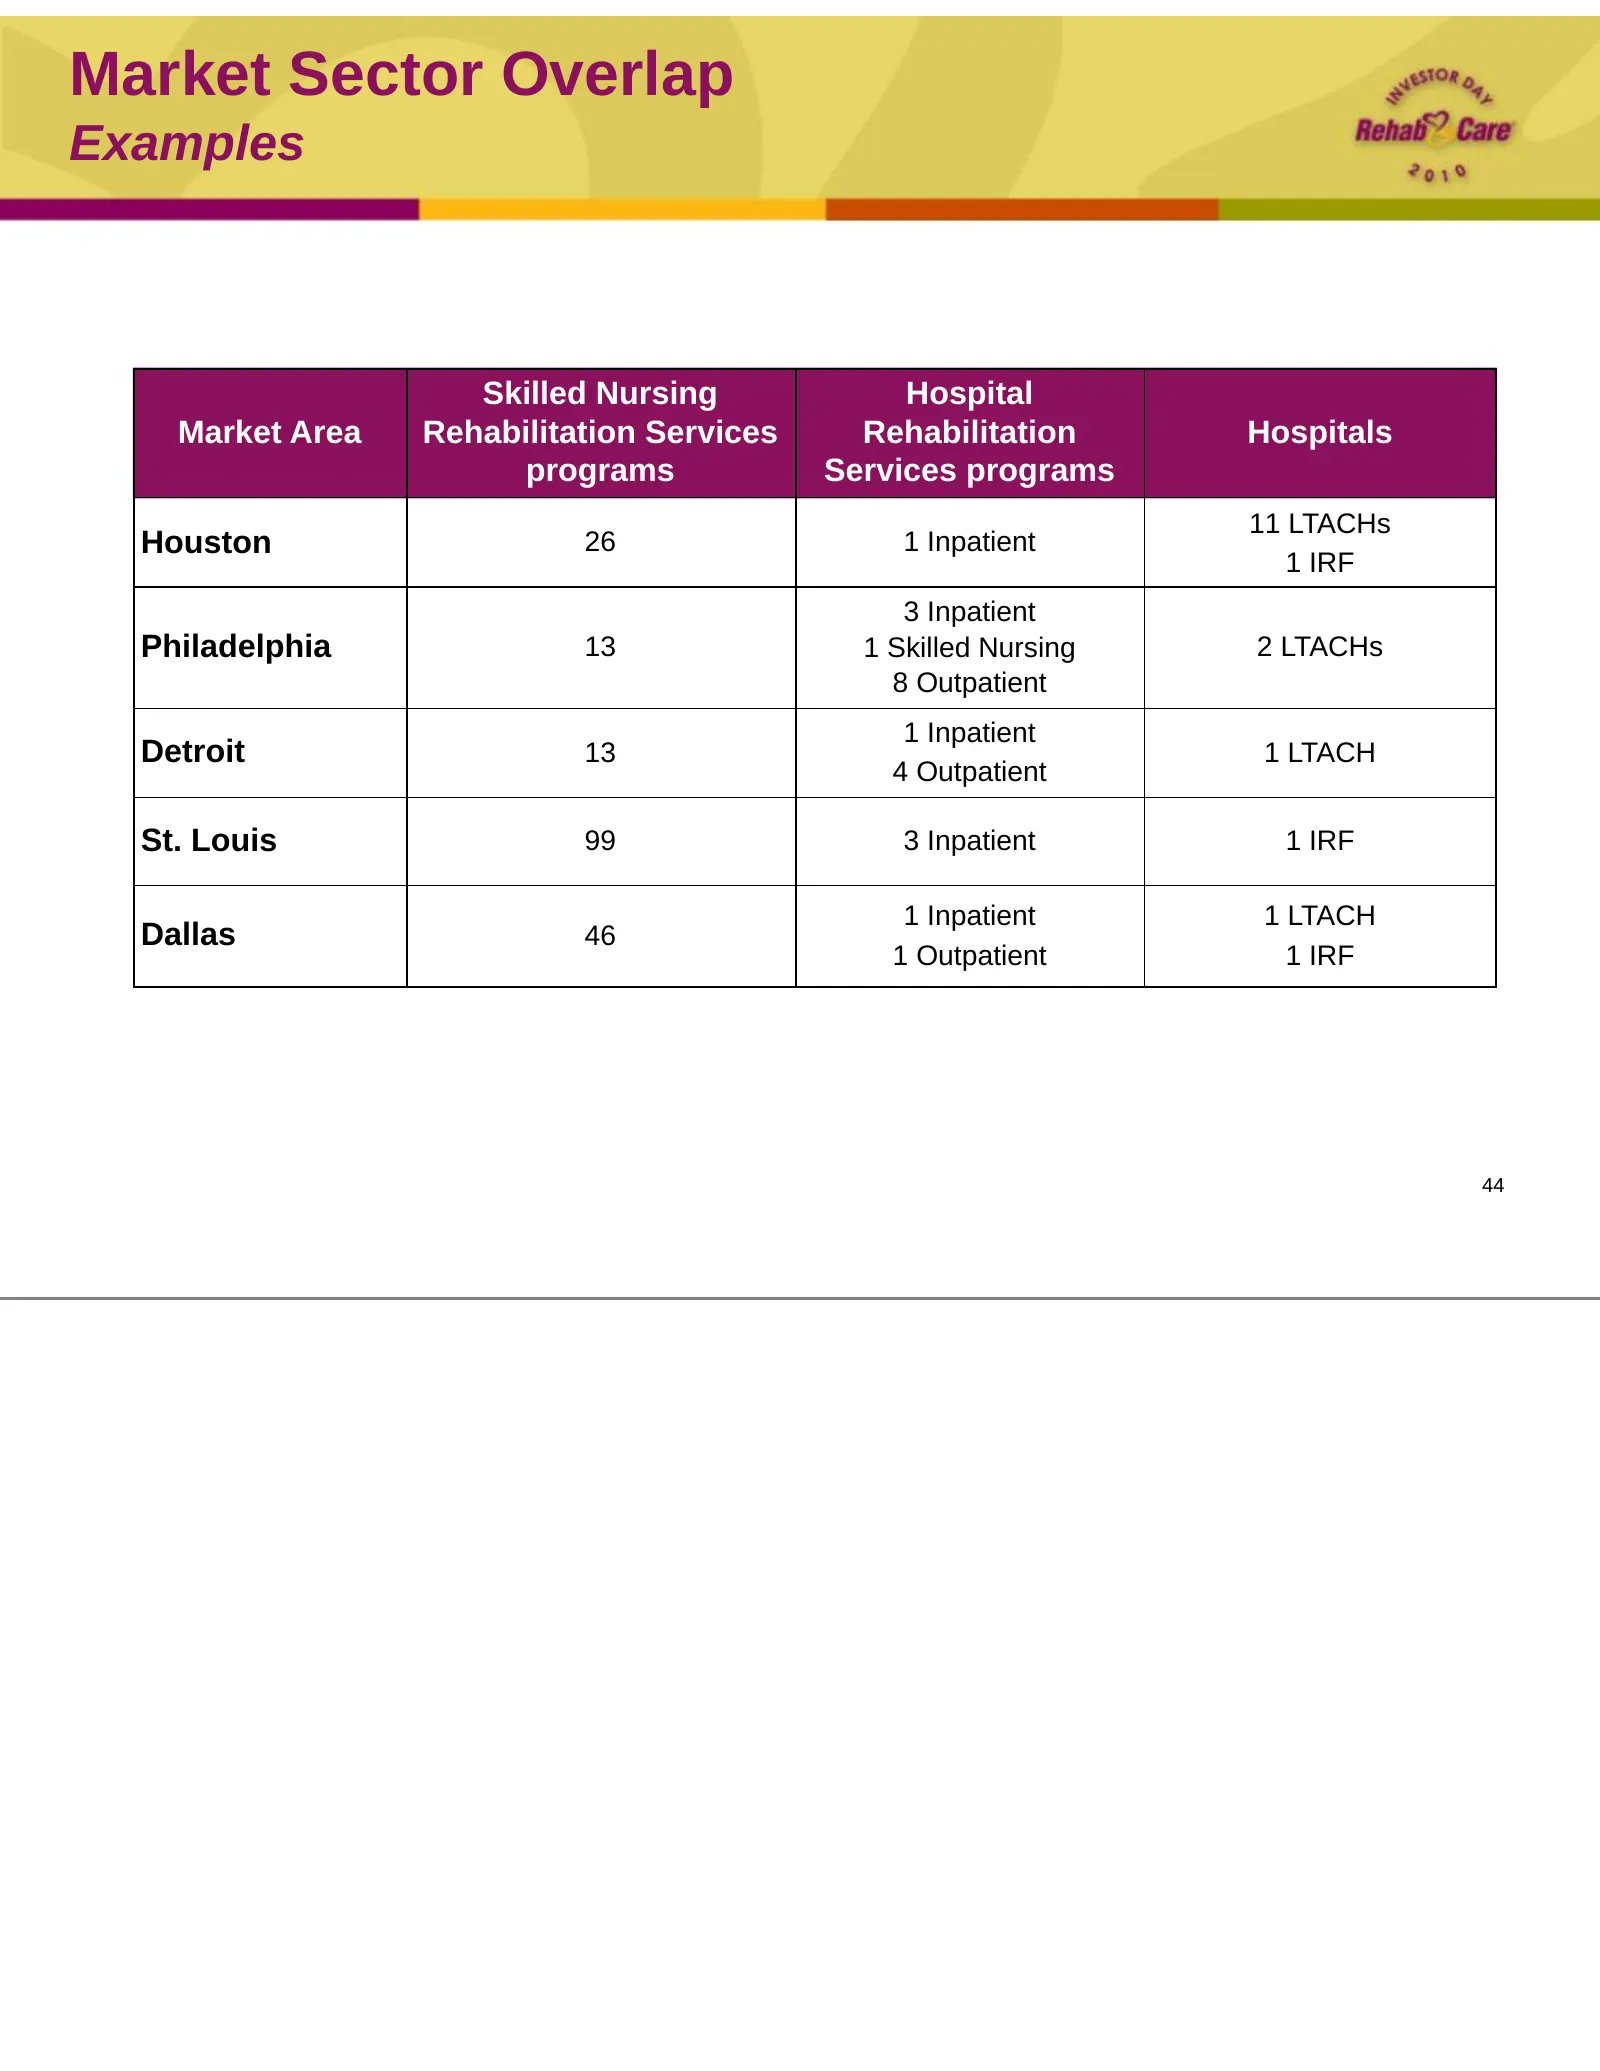
Market Sector Overlap Examples Skilled Nursing Hospital Market Area Rehabilitation Services Rehabilitation Hospitals programs Services programs 11 LTACHs Houston 26 1 Inpatient 1 IRF 3 Inpatient Philadelphia 13 1 Skilled Nursing 2 LTACHs 8 Outpatient 1 Inpatient Detroit 13 1 LTACH 4 Outpatient St. L
Slide 45: Promote Integration
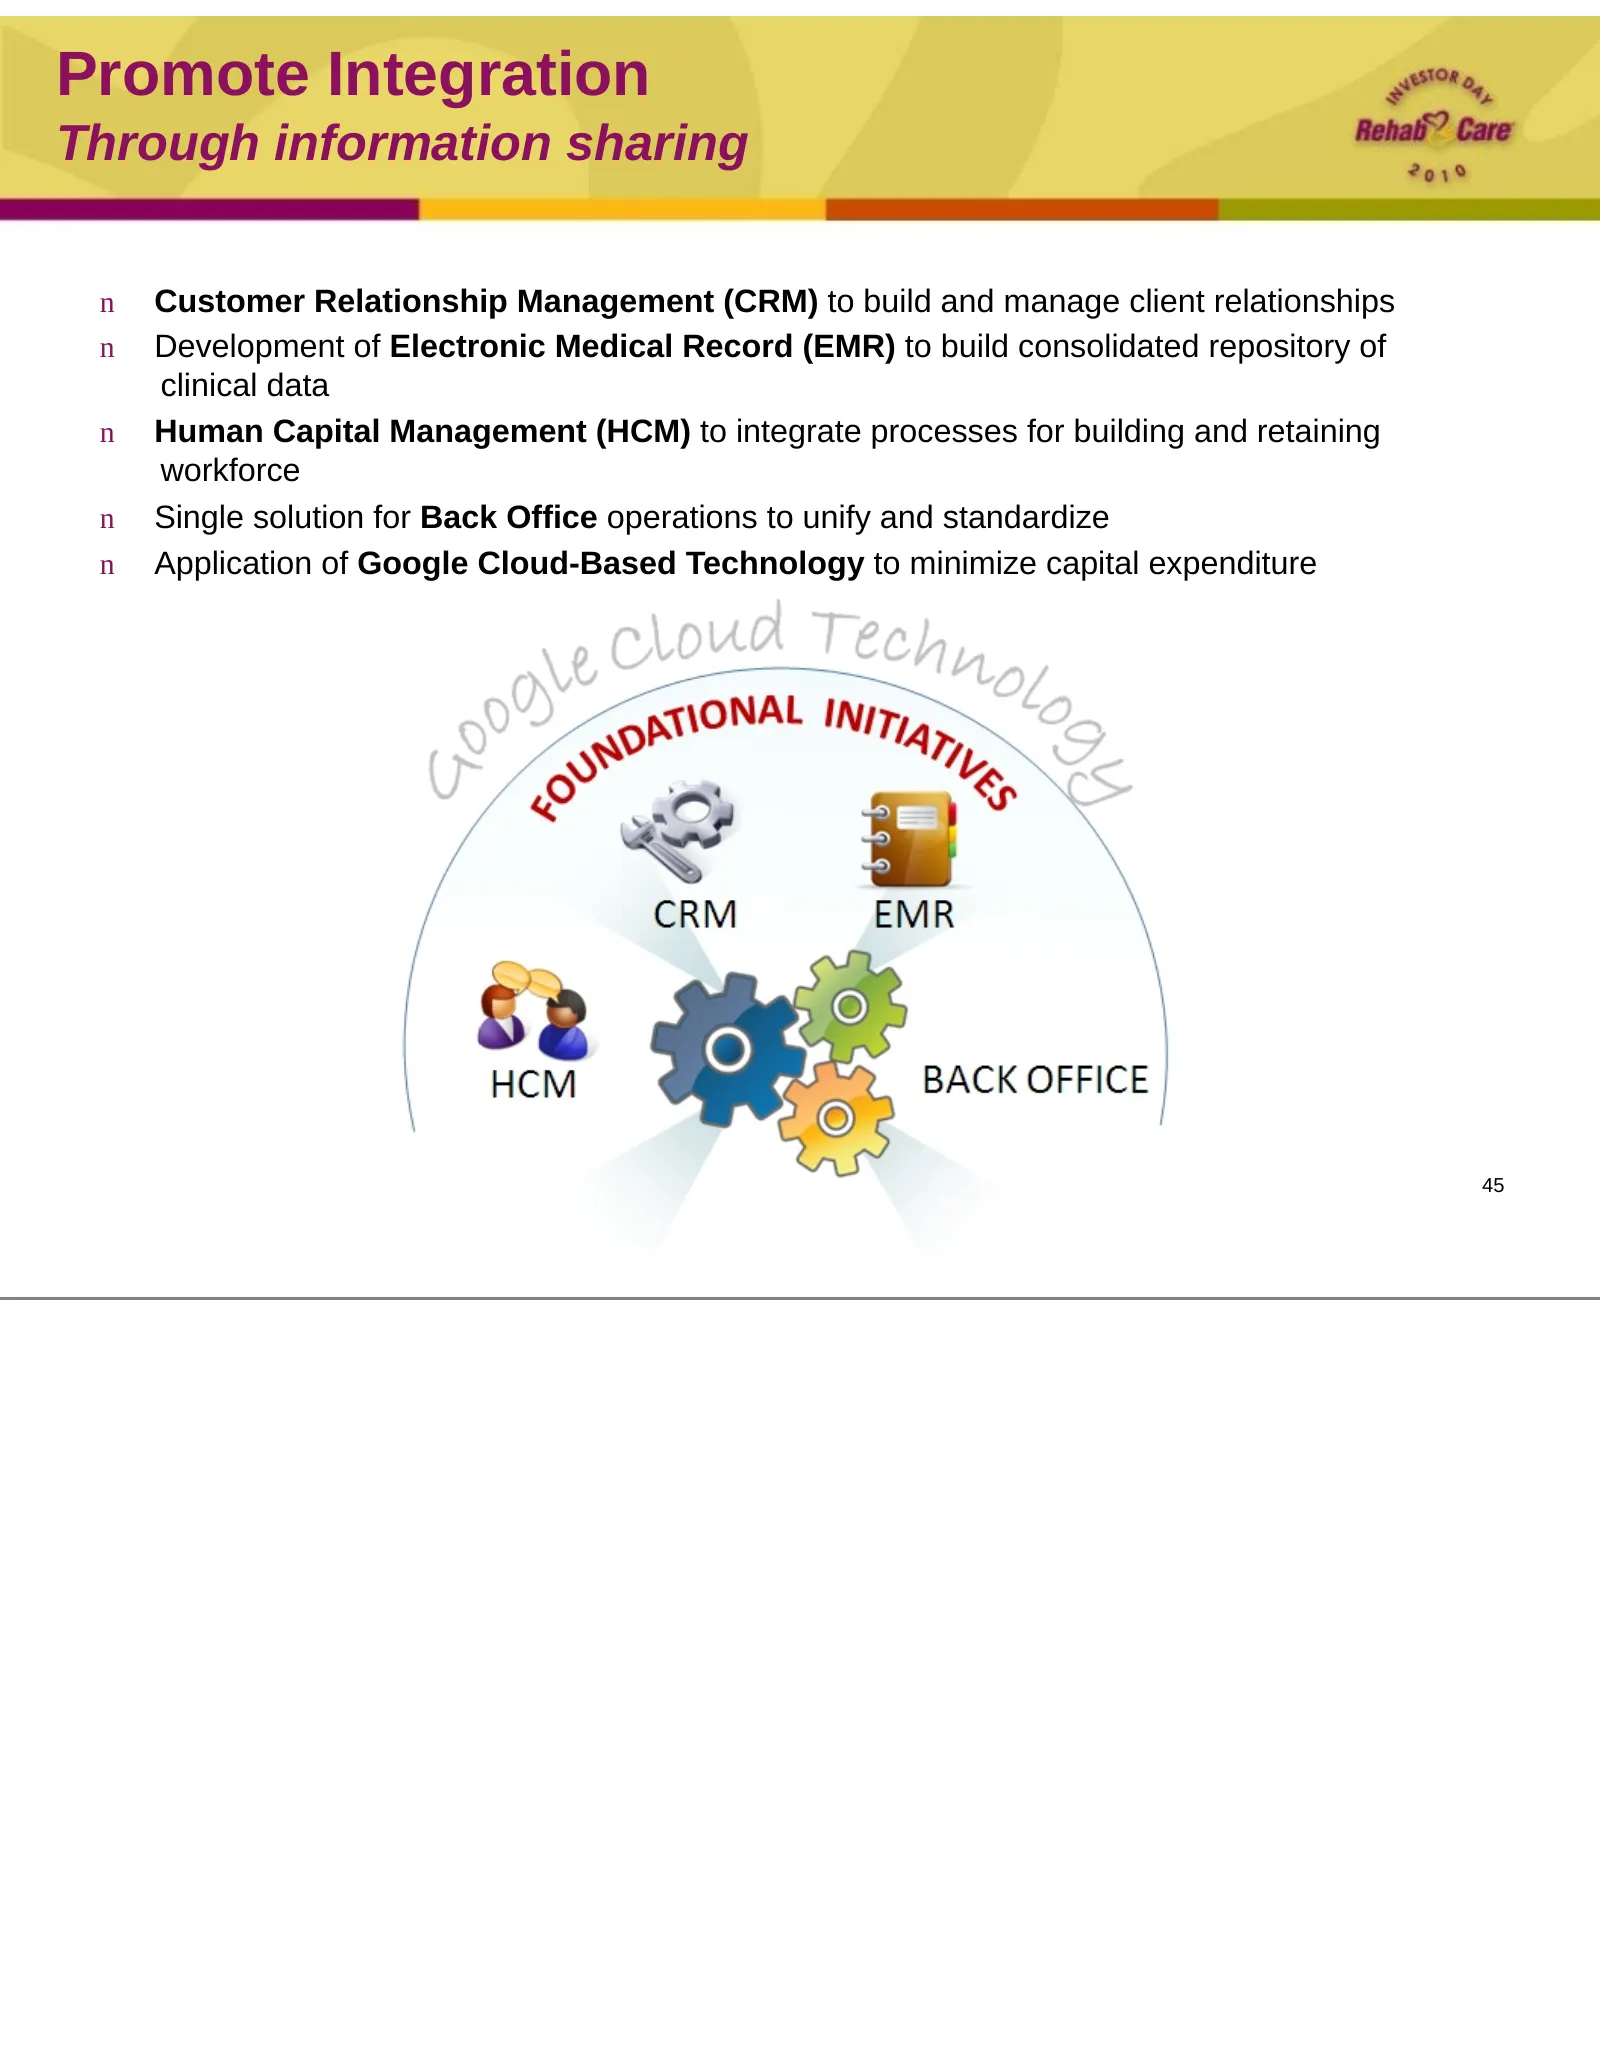
Promote Integration Through information sharing n Customer Relationship Management (CRM) to build and manage client relationships n Development of Electronic Medical Record (EMR) to build consolidated repository of clinical data n Human Capital Management (HCM) to integrate processes for building an
Slide 46: Electronic Medical Record
Electronic Medical Record Deploying cloud-based EMR platform to conform to meaningful use standards; in SRS by end of 2011, Hospitals by end of 2012 n Facilitates care coordination across settings and geographic locations, reduces administrative burden of dueling data sets n Integrates with or provi
Slide 47: Google PHR
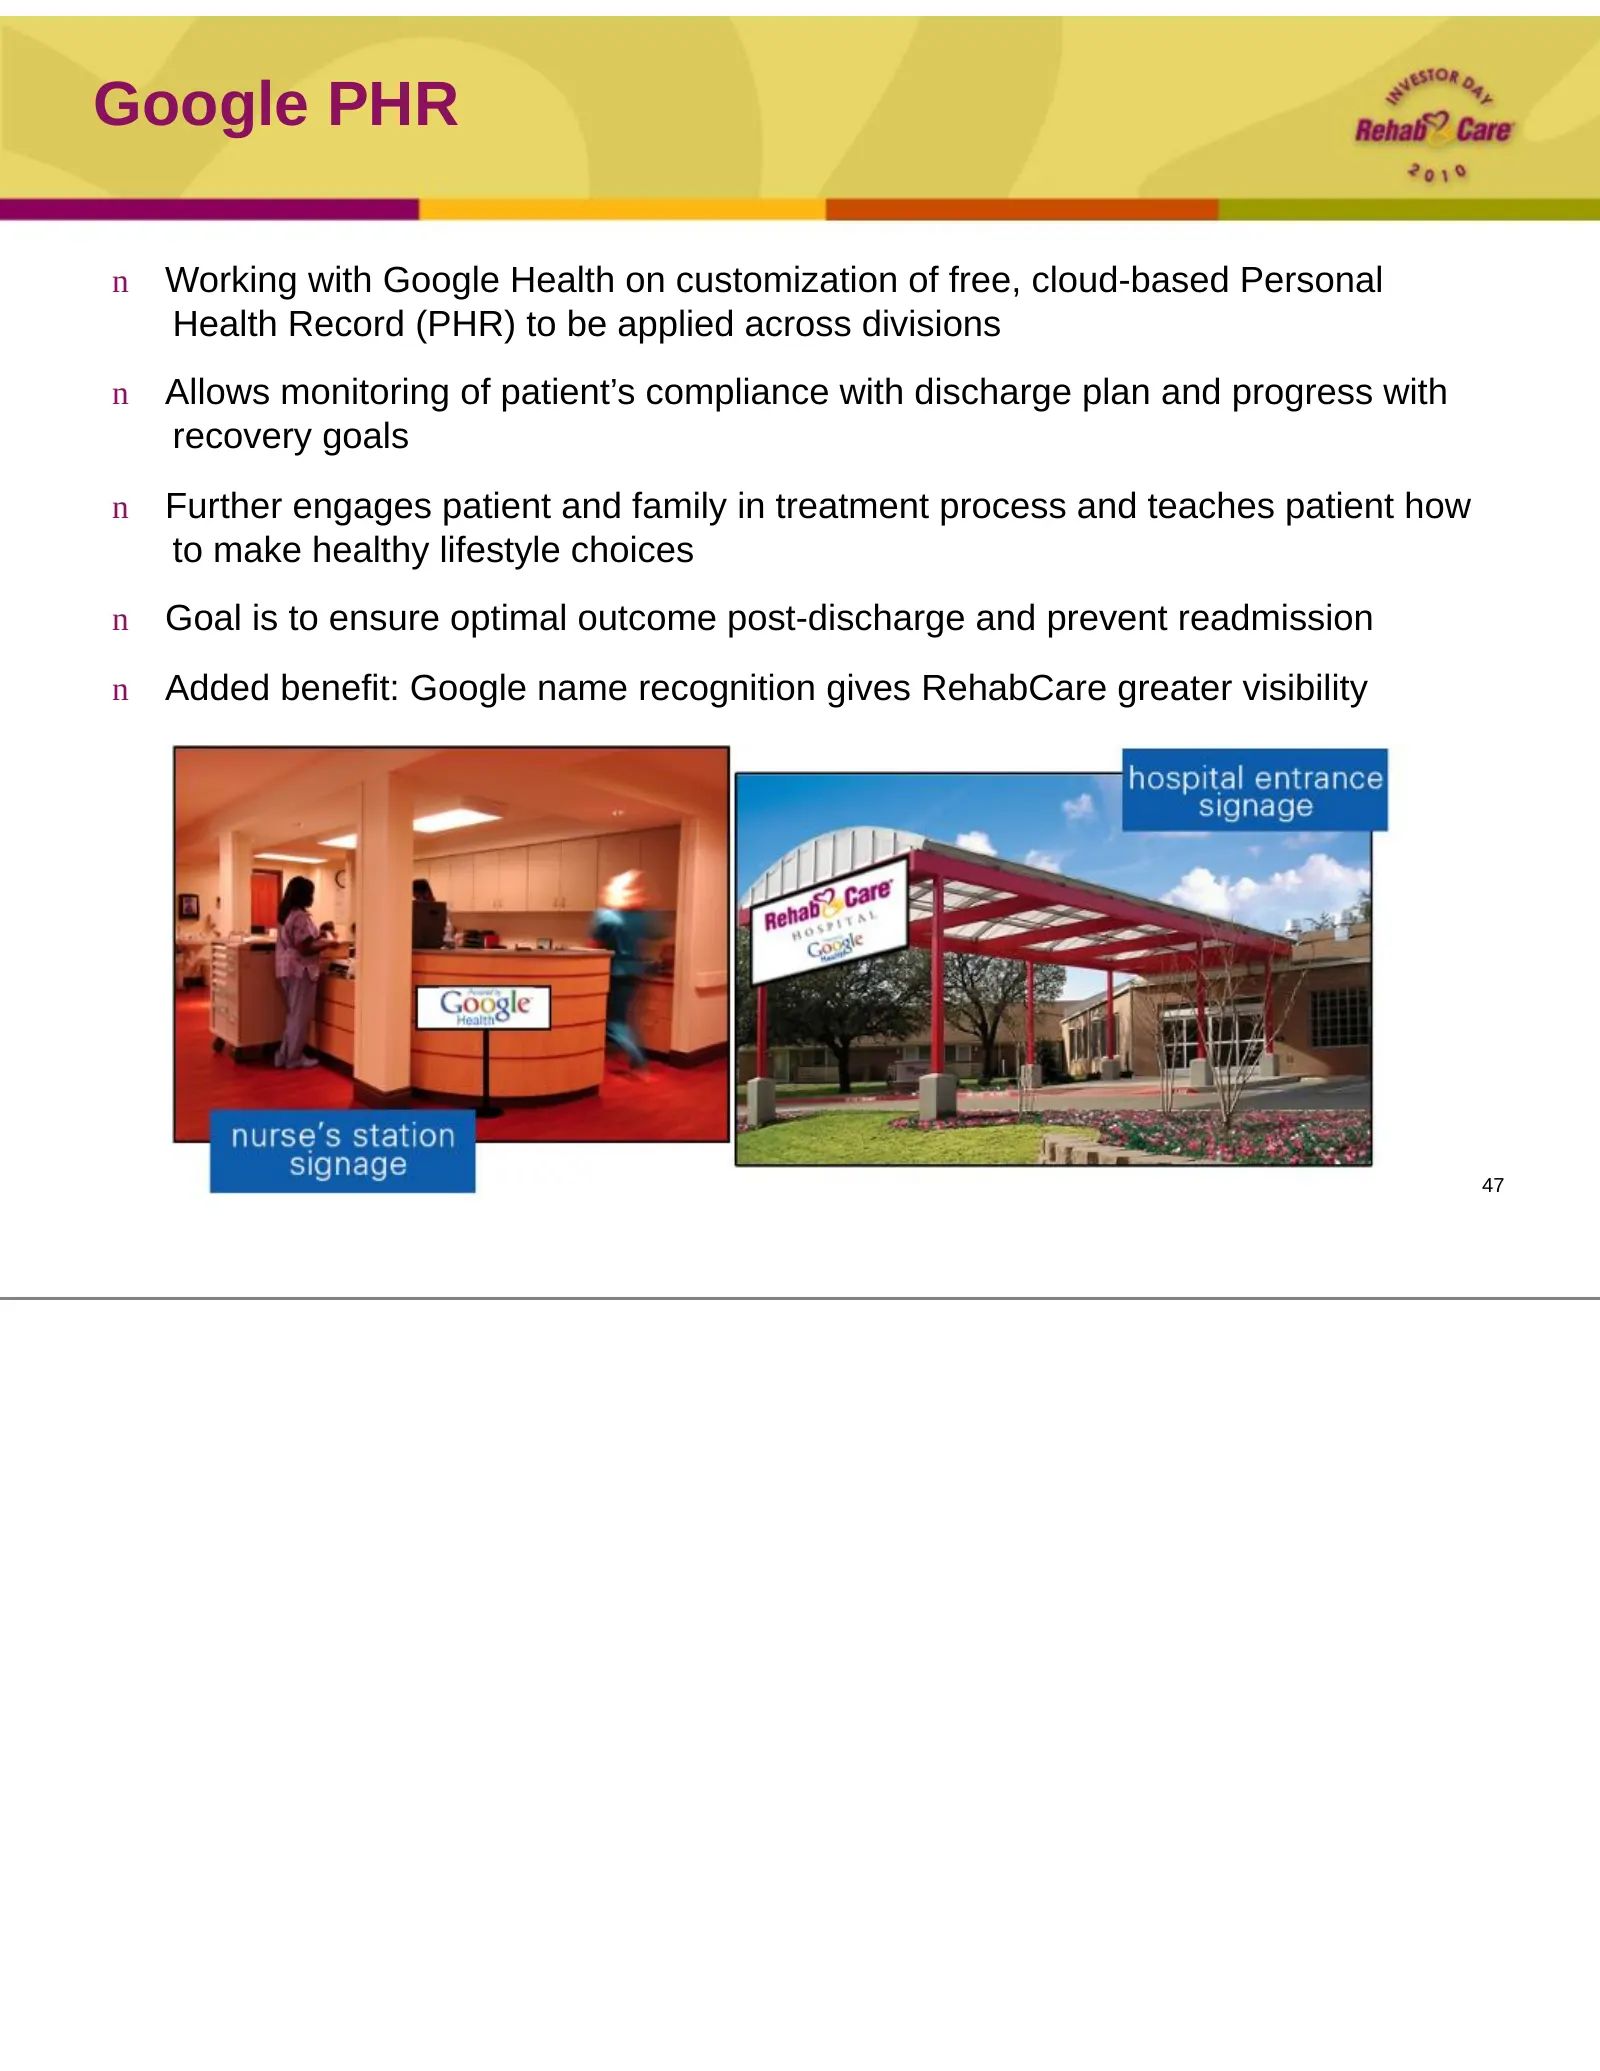
Google PHR n Working with Google Health on customization of free, cloud-based Personal Health Record (PHR) to be applied across divisions n Allows monitoring of patient’s compliance with discharge plan and progress with recovery goals n Further engages patient and family in treatment process and tea
Slide 48: Promote Integration Under Health Reform: ACOs
Promote Integration Under health reform Shared savings program is established in 2012 for providers organized as Accountable Care Organizations (ACOs) that voluntarily meet quality thresholds. n Initially targeted at Medicare beneficiaries; demonstration project will determine what structures and pr
Slide 49: Promote Integration Under Health Reform: Bundling
Promote Integration Under health reform In 2013, CMS begins 3-year national pilot project to study the effectiveness of a bundled payment system. n Houston network model n Utilizing our broad continuum services and system relationships (e.g. Memorial Hermann) to test post-acute network strategy n Be

Slide 50: Safe Harbor
Safe Harbor Forward-looking statements have been provided pursuant to the safe harbor provisions of the Private Securities Litigation Reform Act of 1995. Such statements are based on the Company’s current expectations and could be affected by numerous factors, risks and uncertainties discussed in th
Source: SEC EDGAR · 8-K filed May 18, 2010
More decks from Rehabcare Group Inc
 Merger or Acquisition (May 2011)42 slides · May 12, 2011
 Merger or Acquisition (March 2011)35 slides · Mar 16, 2011
 Merger or Acquisition (March 2011)28 slides · Mar 3, 2011
 Merger or Acquisition (February 2011)15 slides · Feb 10, 2011
 J.P. Morgan Healthcare Conference 201127 slides · Jan 10, 2011
 Q3 2010 Earnings Presentation26 slides · Nov 17, 2010