Seche Environnement SA · EURONEXT:SCHP
Seche Environnement SA — 9M 2012 Earnings Presentation
11 slides from Seche Environnement SA's earnings presentation, Oct 25, 2012

Slide 1: Consolidated Revenue as of September 30, 2012
Consolidated Revenue as of September 30, 2012 Conference call on October 25, 2012 Consolidated Revenue as of September 30, 2012 1
Slide 2: Highlights
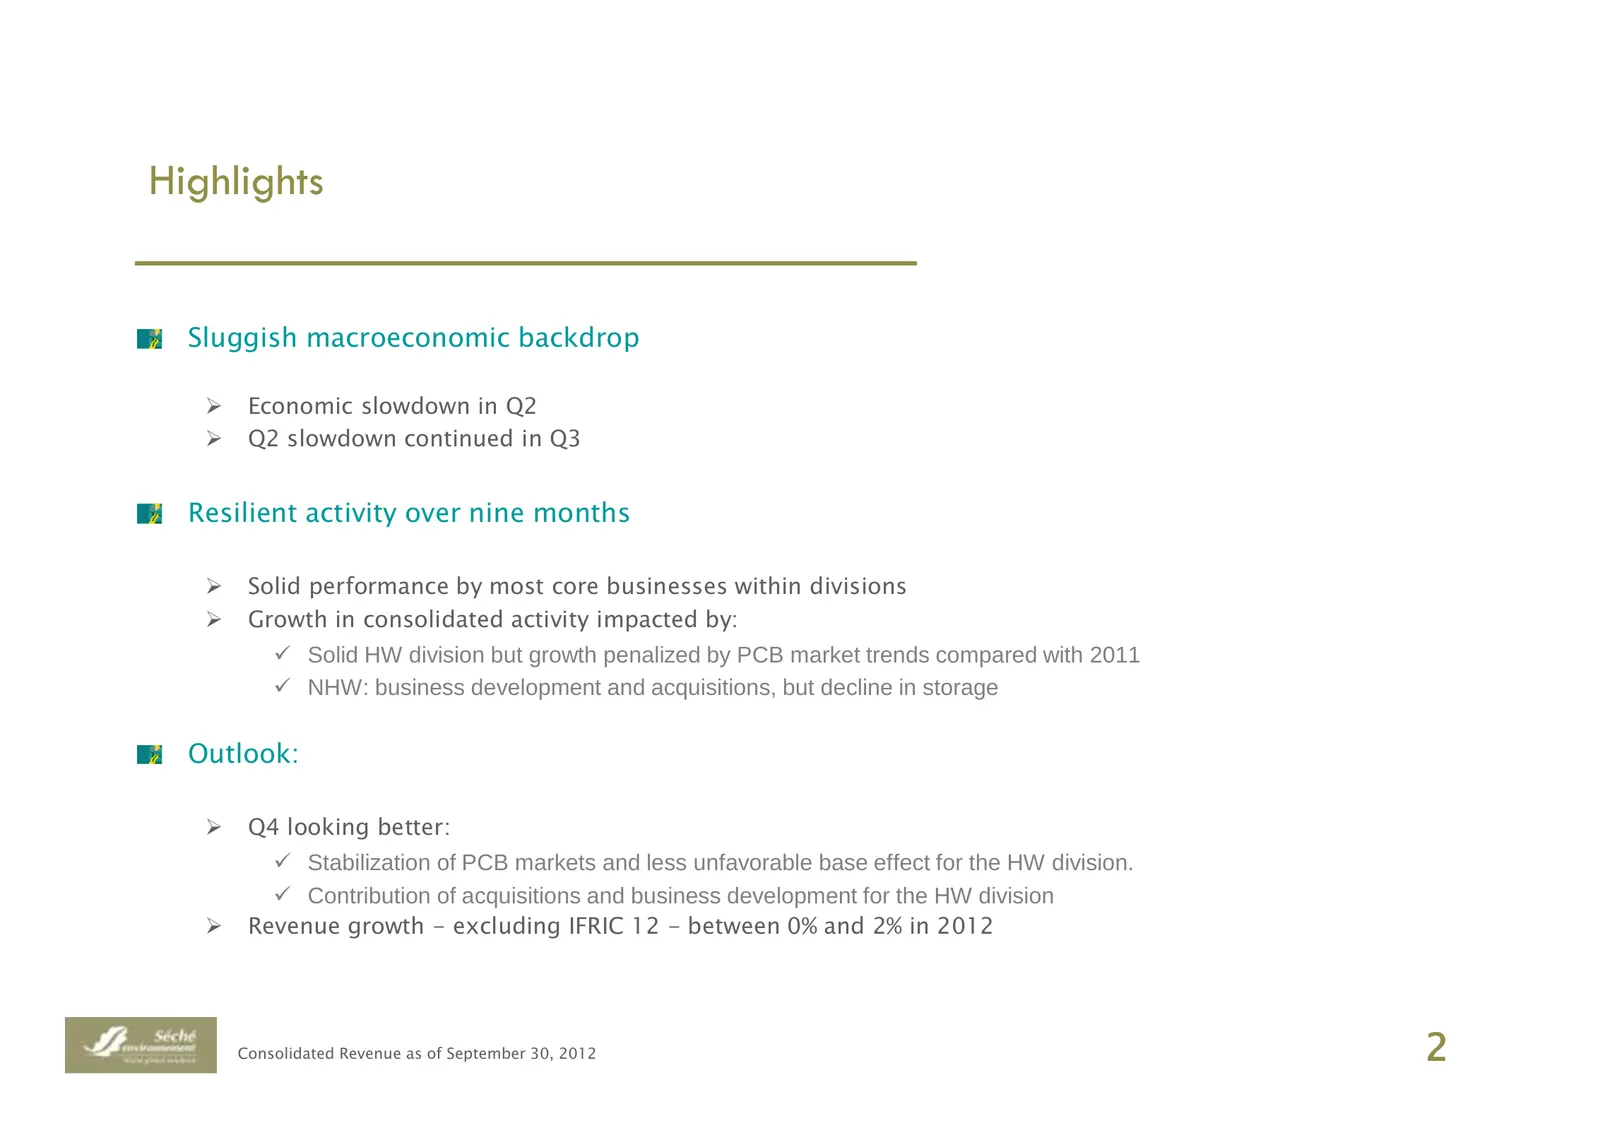
Highlights Sluggish macroeconomic backdrop Economic slowdown in Q2 Q2 slowdown continued in Q3 Resilient activity over nine months Solid performance by most core businesses within divisions Growth in consolidated activity impacted by: Solid HW division but growth penalized by PCB market trends compa
Slide 3: Slight slowdown in consolidated activity as of September 30, 2012
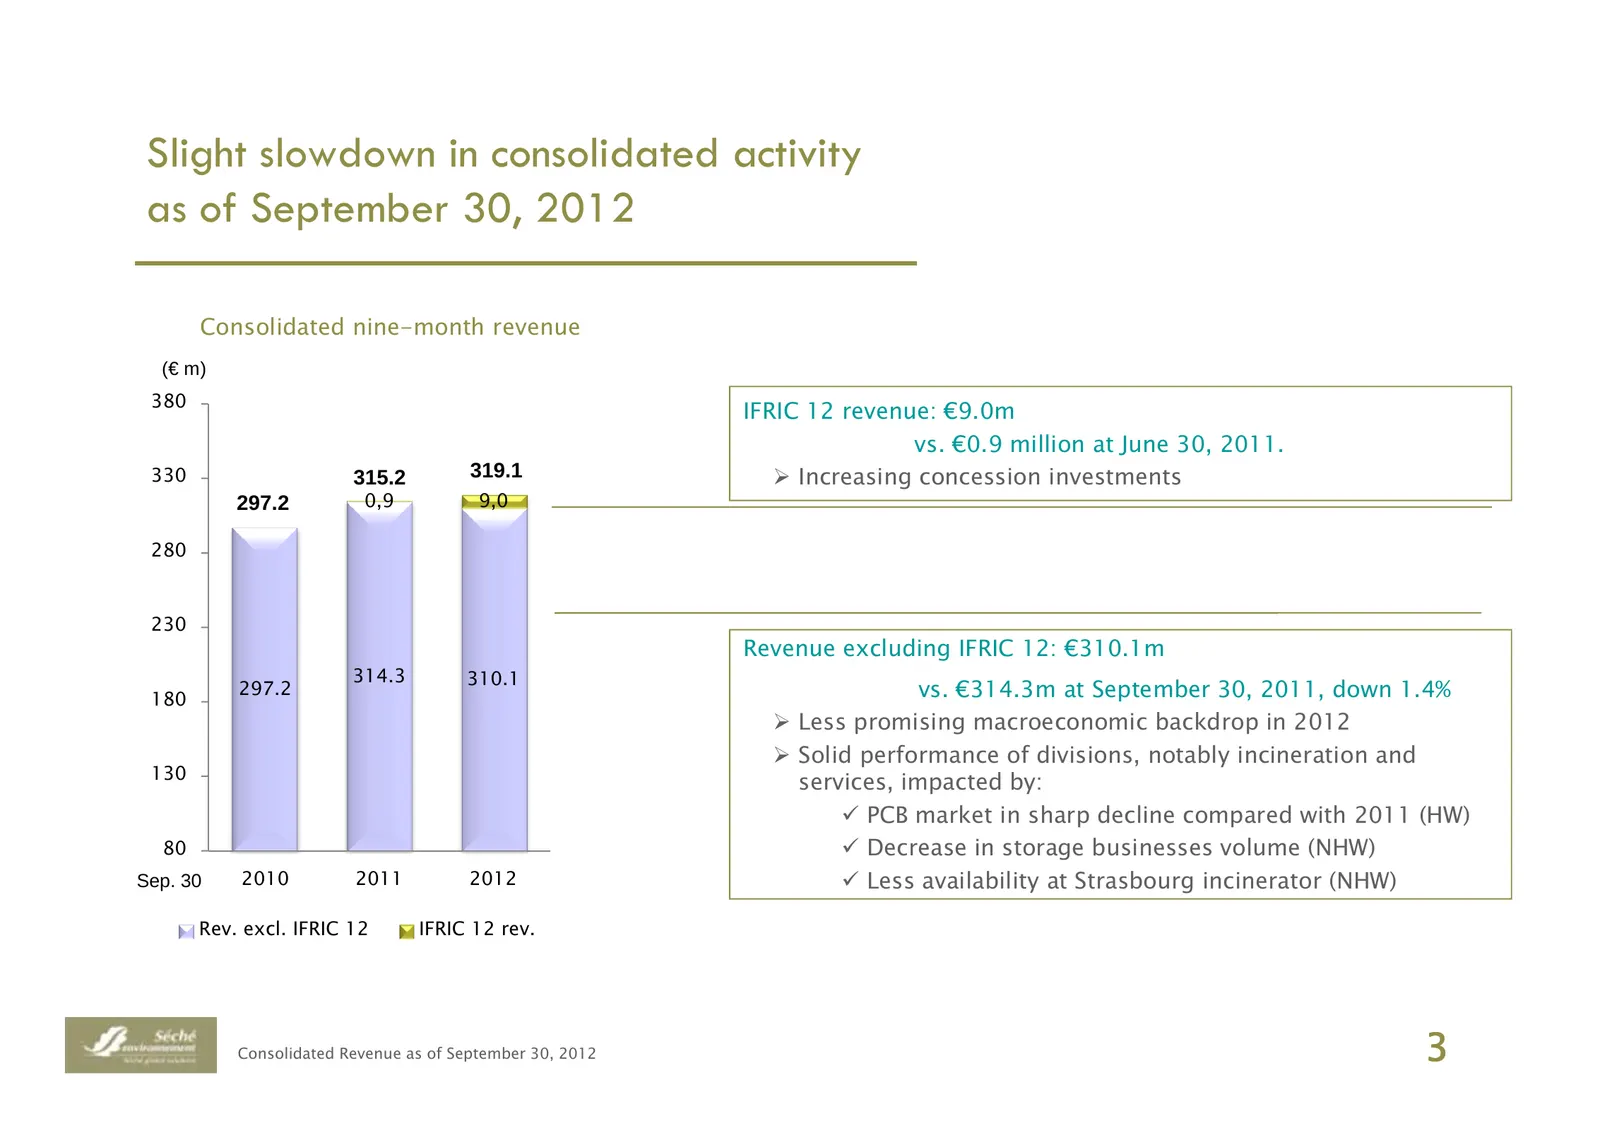
Slight slowdown in consolidated activity as of September 30, 2012 Consolidated nine-month revenue (€ m) 380 IFRIC 12 revenue: €9.0m vs. €0.9 million at June 30, 2011. 330 315.2 319.1 Increasing concession investments 297.2 0,9 9,0 280 230 Revenue excluding IFRIC 12: €310.1m 314.3 310.1 180 297.2 vs.
Slide 4: French and International activity over the first nine months 2012
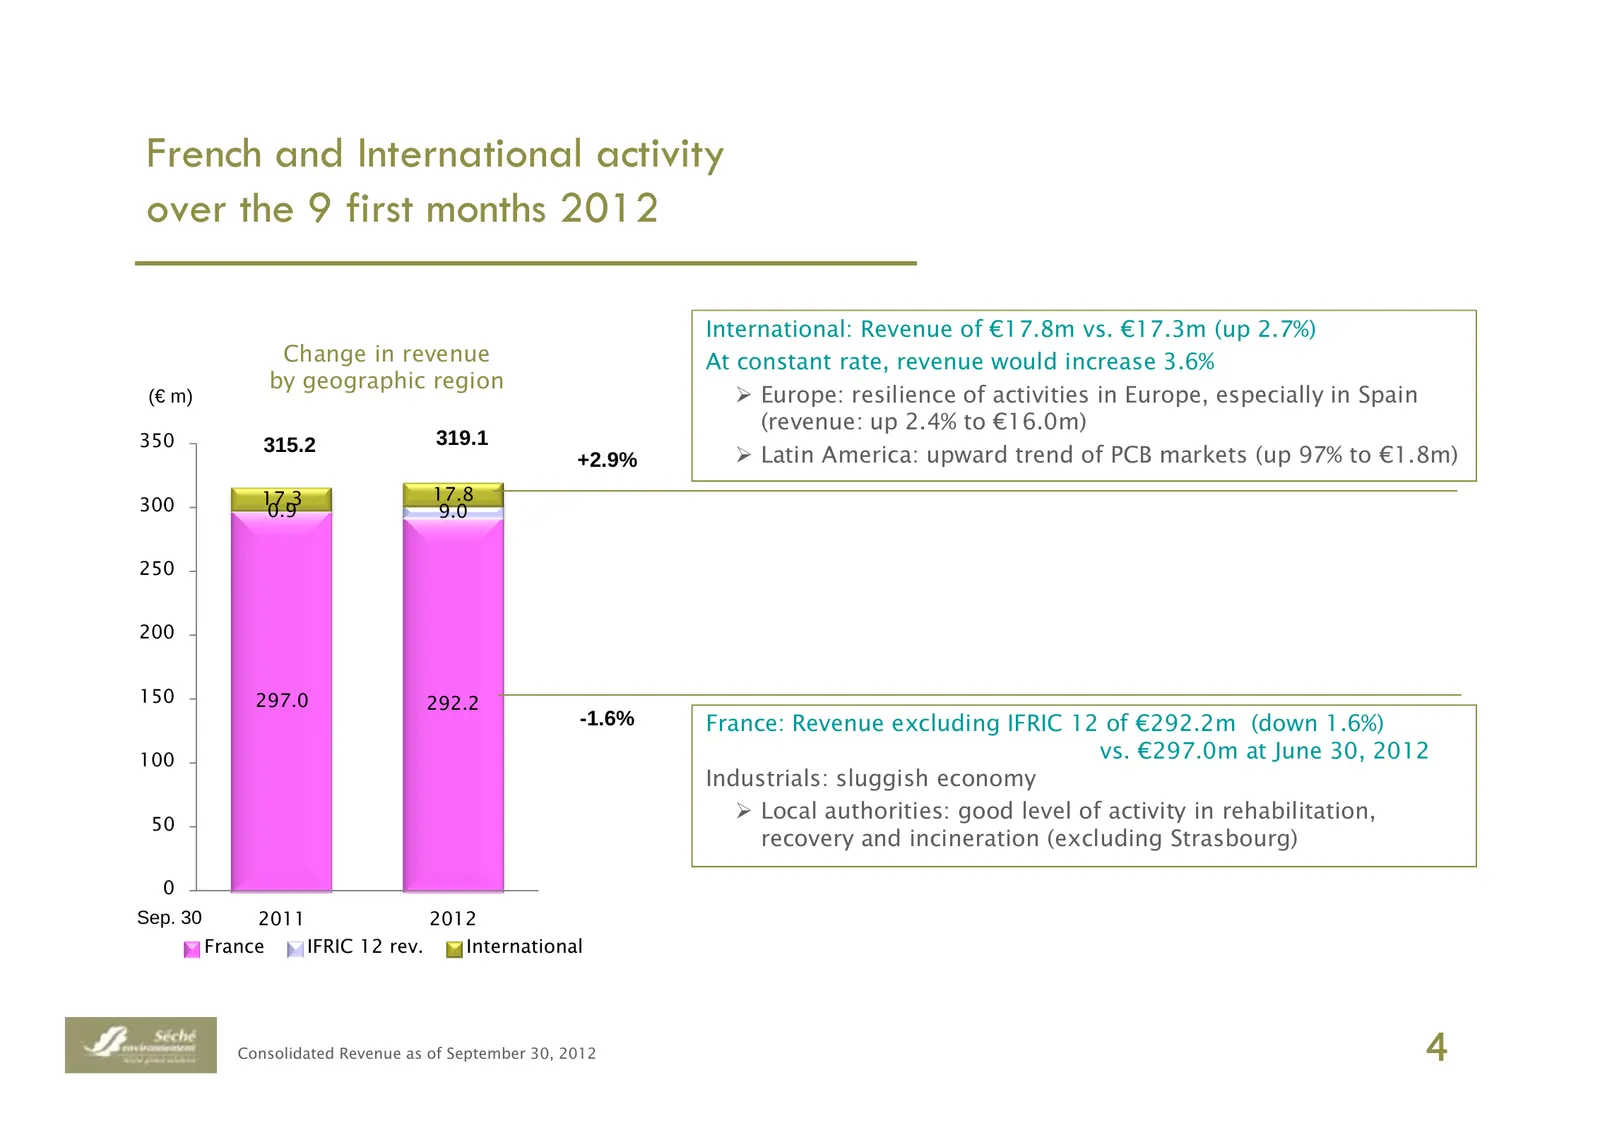
French and International activity over the 9 first months 2012 International: Revenue of €17.8m vs. €17.3m (up 2.7%) Change in revenue At constant rate, revenue would increase 3.6% by geographic region (€ m) Europe: resilience of activities in Europe, especially in Spain (revenue: up 2.4% to €16.0m)
Slide 5: Change in revenue by division over the first nine months 2012
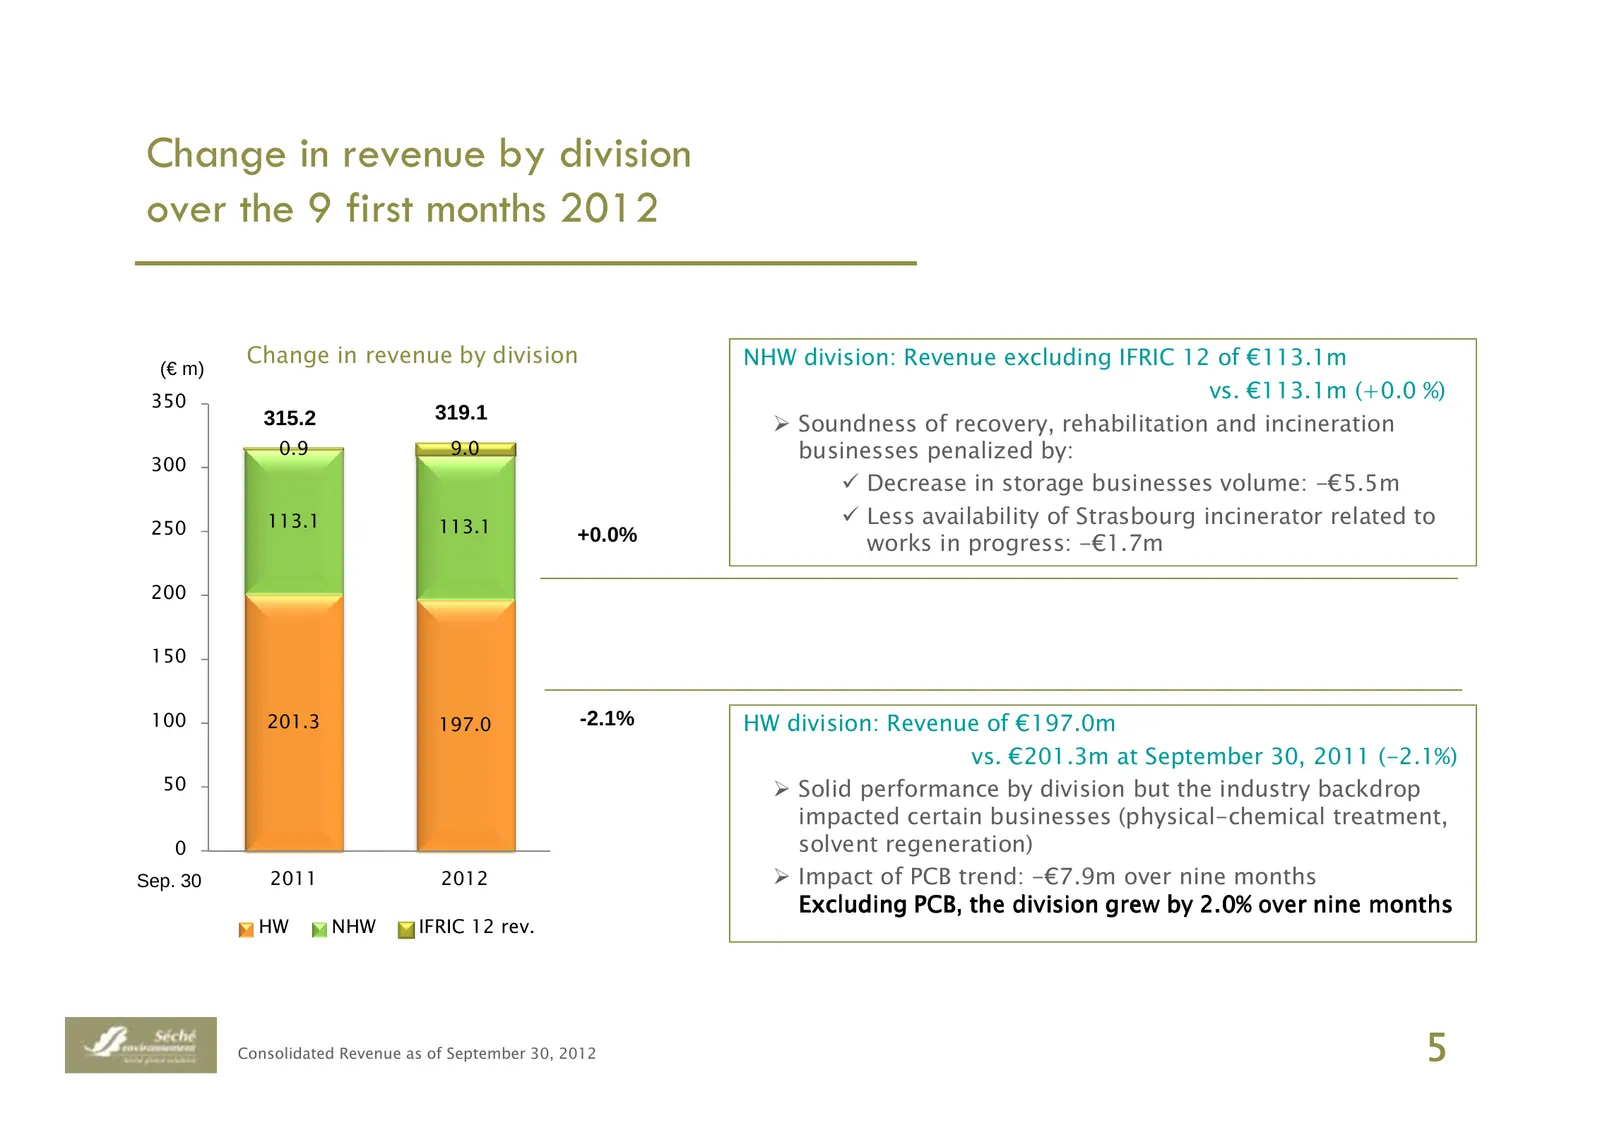
Change in revenue by division over the 9 first months 2012 Change in revenue by division NHW division: Revenue excluding IFRIC 12 of €113.1m (€ m) 350 vs. €113.1m (+0.0 %) 315.2 319.1 Soundness of recovery, rehabilitation and incineration 0.9 9.0 businesses penalized by: 300 Decrease in storage busi
Slide 6: Q3: better performance by HW division
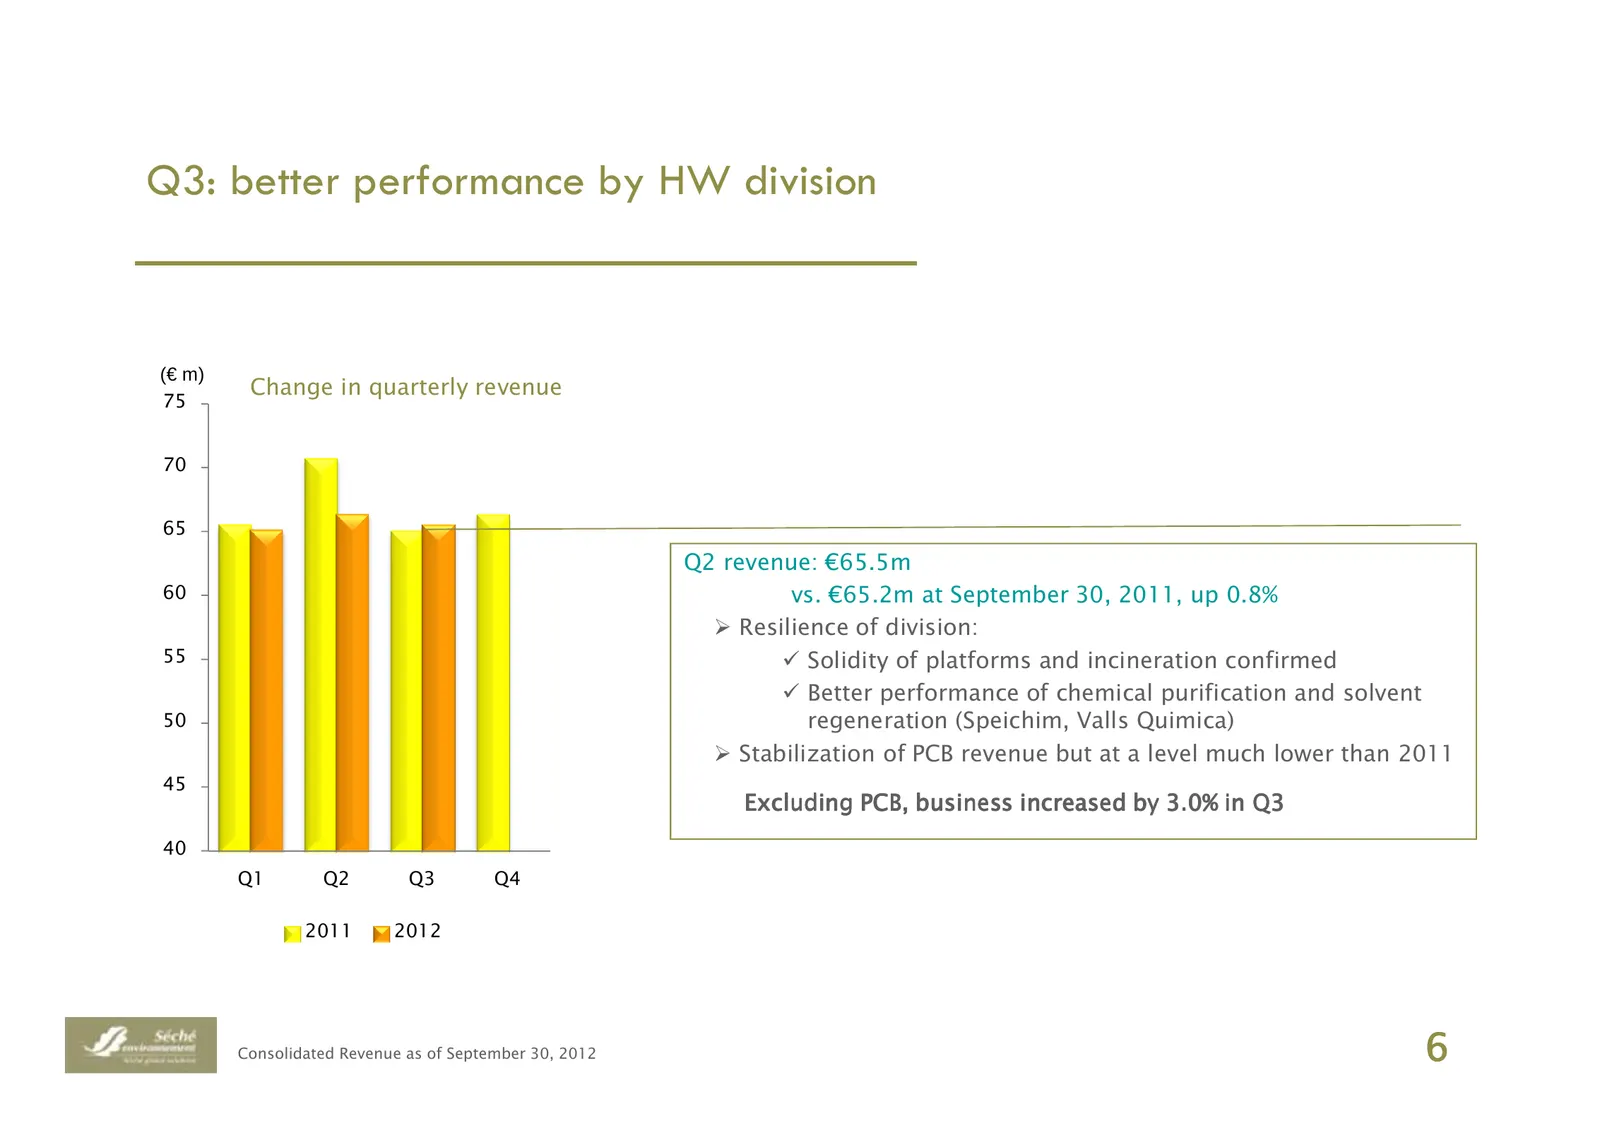
Q3: better performance by HW division (€ m) Change in quarterly revenue 75 70 65 Q2 revenue: €65.5m 60 vs. €65.2m at September 30, 2011, up 0.8% Resilience of division: 55 Solidity of platforms and incineration confirmed Better performance of chemical purification and solvent 50 regeneration (Speich
Slide 7: Stabilization of PCB markets, upturn for HW division
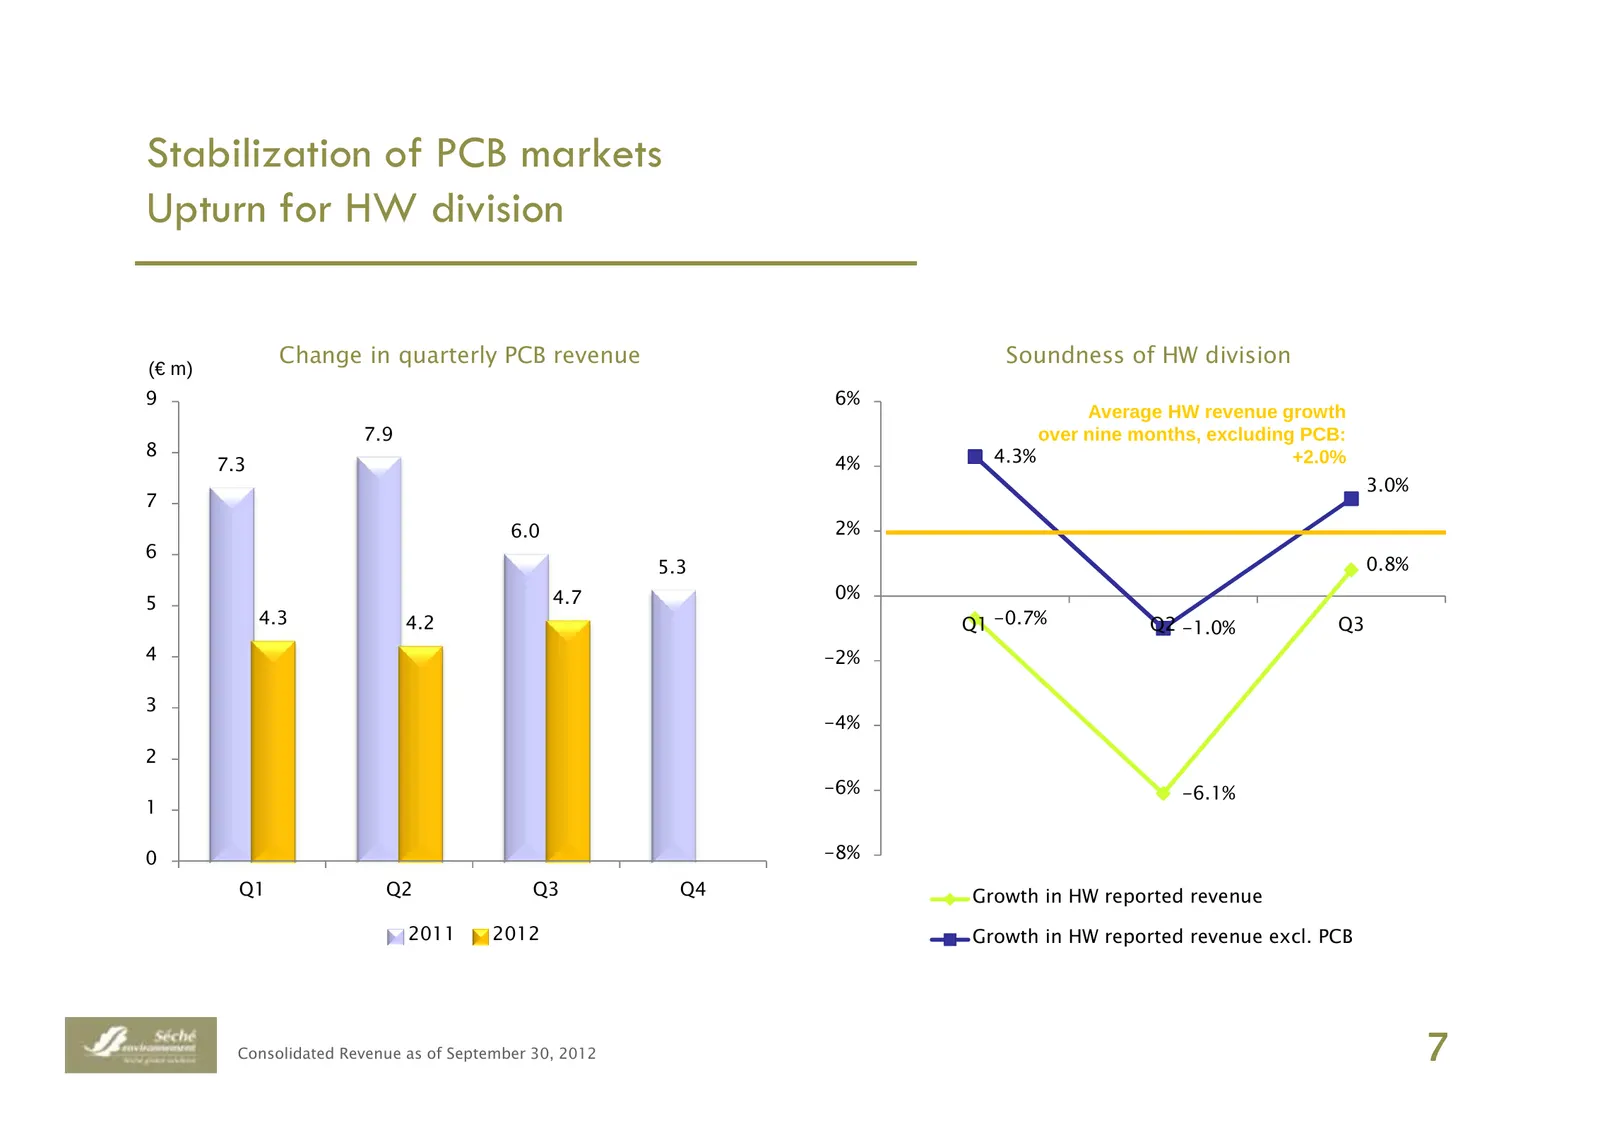
Stabilization of PCB markets Upturn for HW division Change in quarterly PCB revenue Soundness of HW division (€ m) 9 6% Average HW revenue growth 7.9 over nine months, excluding PCB: 8 4.3% +2.0% 7.3 4% 3.0% 7 6.0 2% 6 5.3 0.8% 4.7 0% 5 4.3 4.2 Q1 -0.7% Q2 -1.0% Q3 4 -2% 3 -4% 2 -6% -6.1% 1 0 -8% Q1
Slide 8: Q3: performance of HW division impacted by decrease in volumes
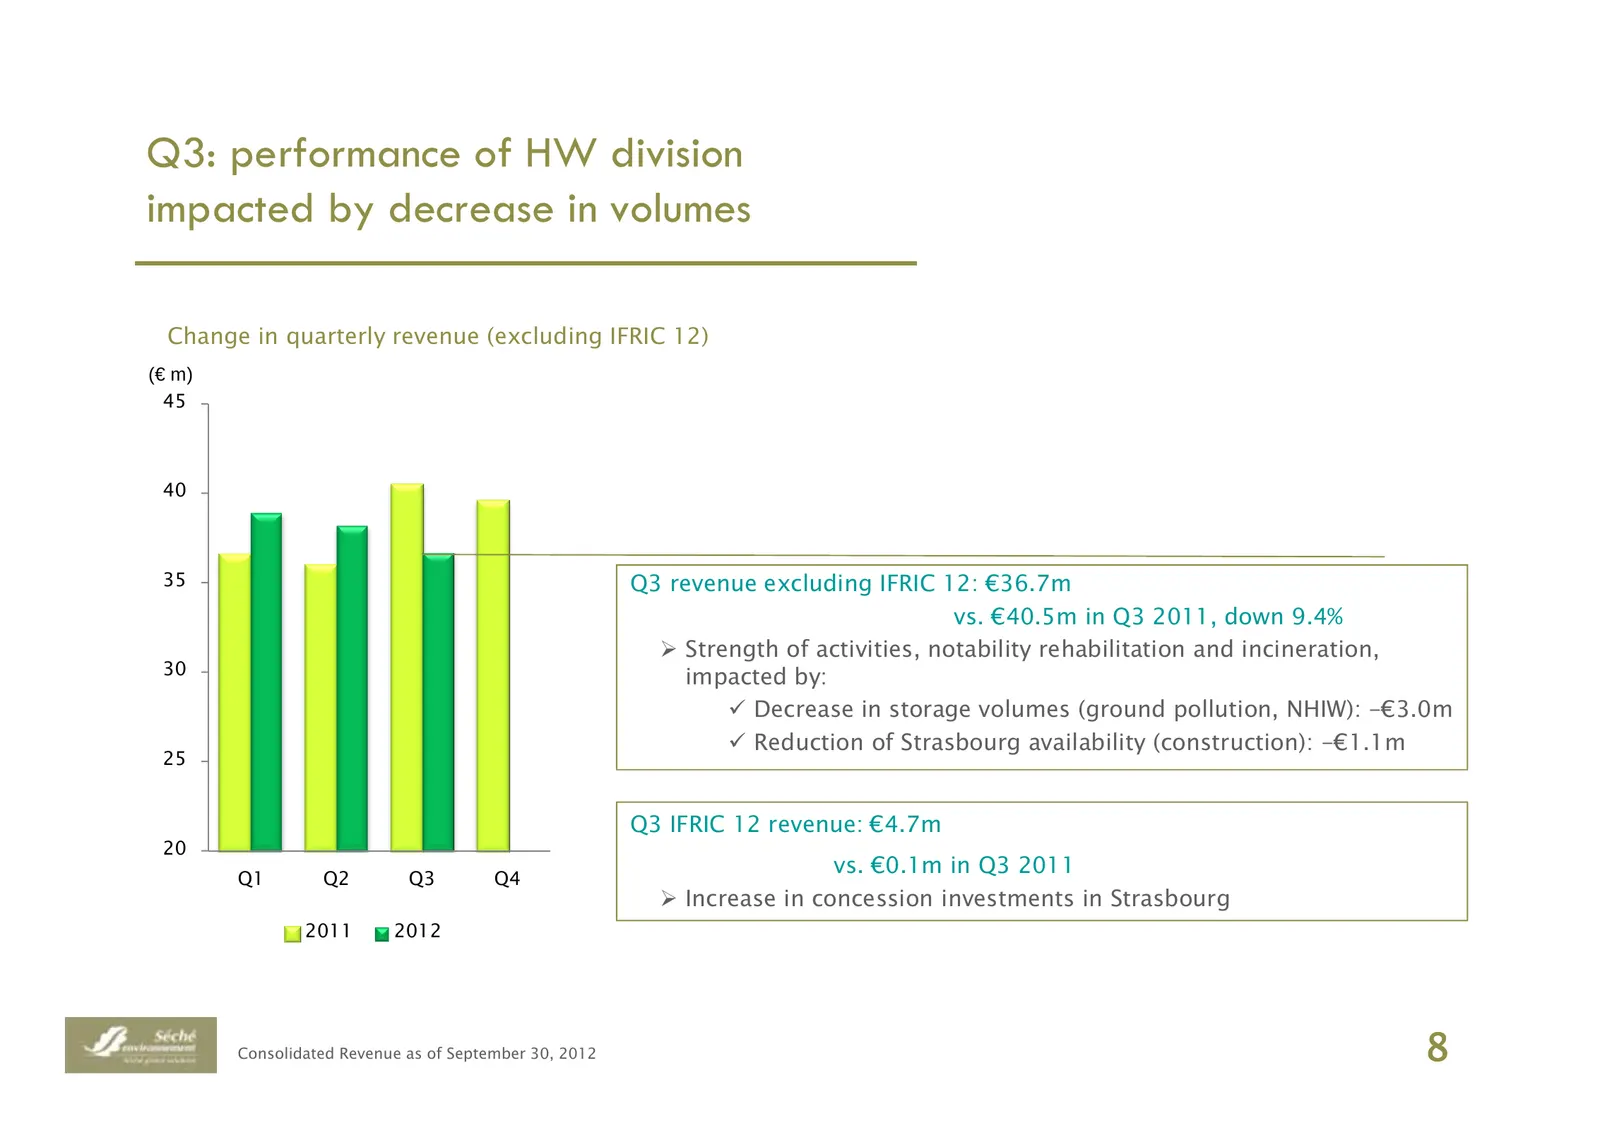
Q3: performance of HW division impacted by decrease in volumes Change in quarterly revenue (excluding IFRIC 12) (€ m) 45 40 35 Q3 revenue excluding IFRIC 12: €36.7m vs. €40.5m in Q3 2011, down 9.4% Strength of activities, notability rehabilitation and incineration, 30 impacted by: Decrease in storag
Slide 9: Outlook for 2012
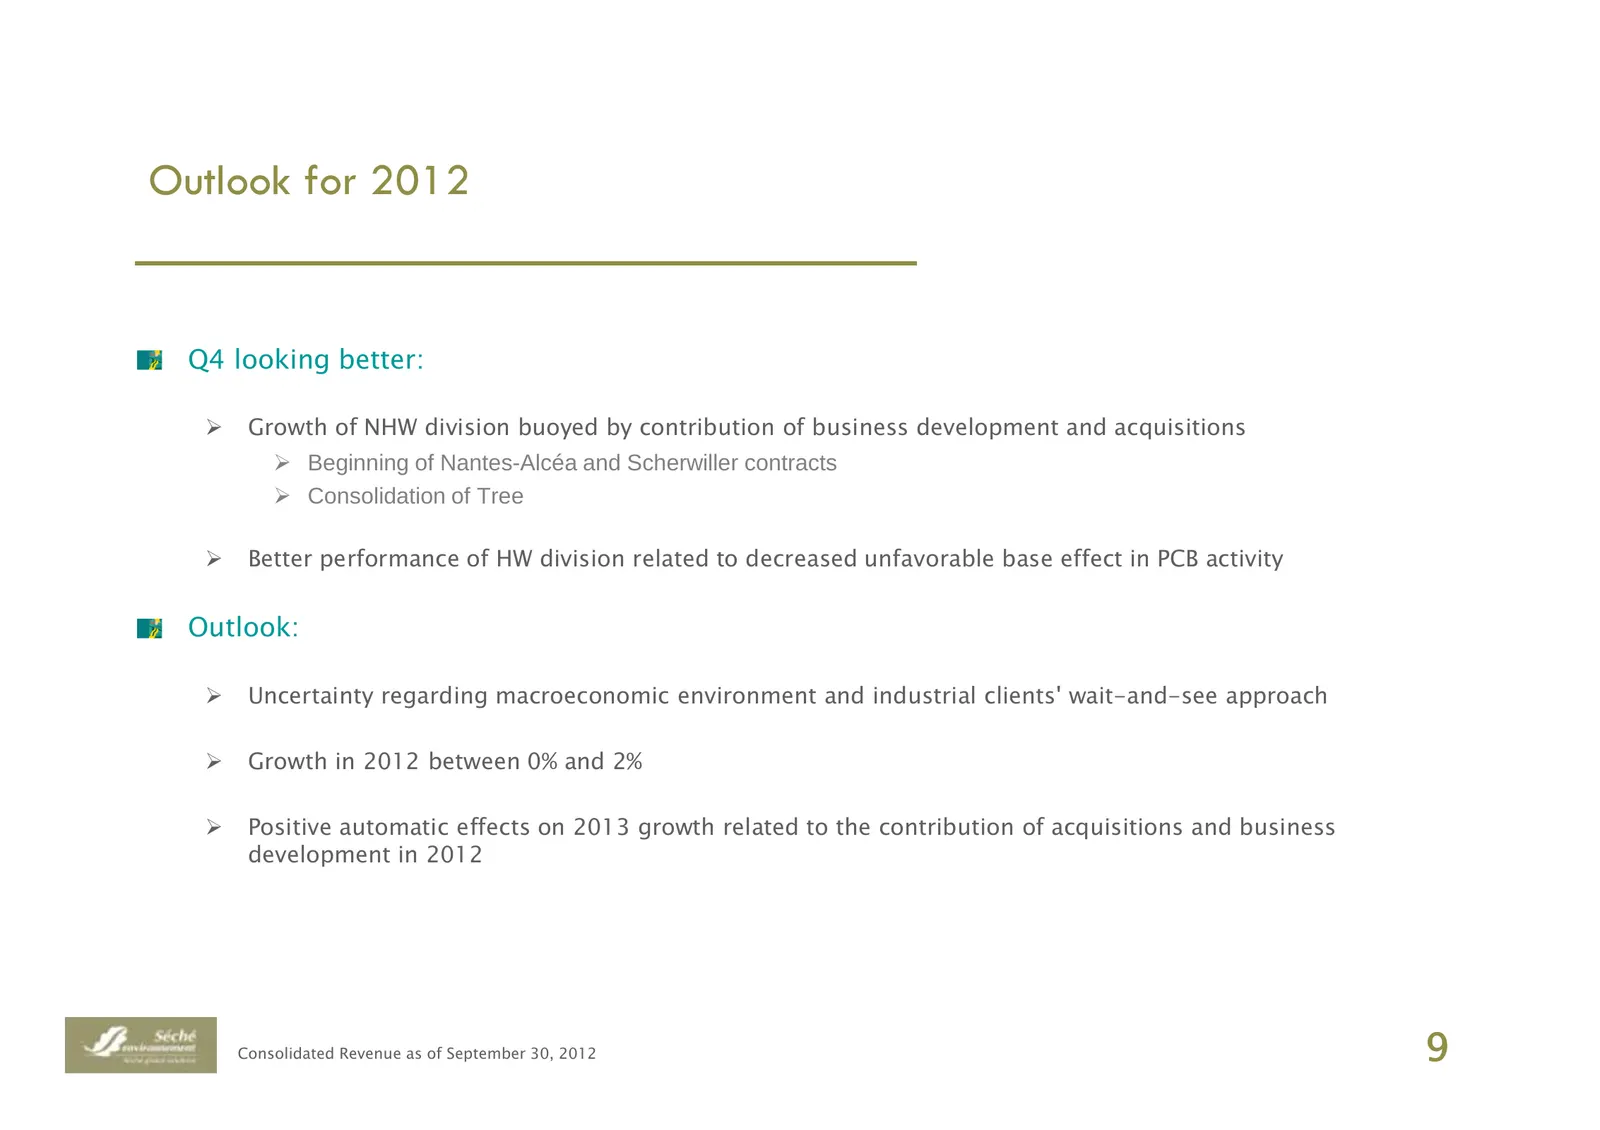
Outlook for 2012 Q4 looking better: Growth of NHW division buoyed by contribution of business development and acquisitions Beginning of Nantes-Alcéa and Scherwiller contracts Consolidation of Tree Better performance of HW division related to decreased unfavorable base effect in PCB activity Outlook:
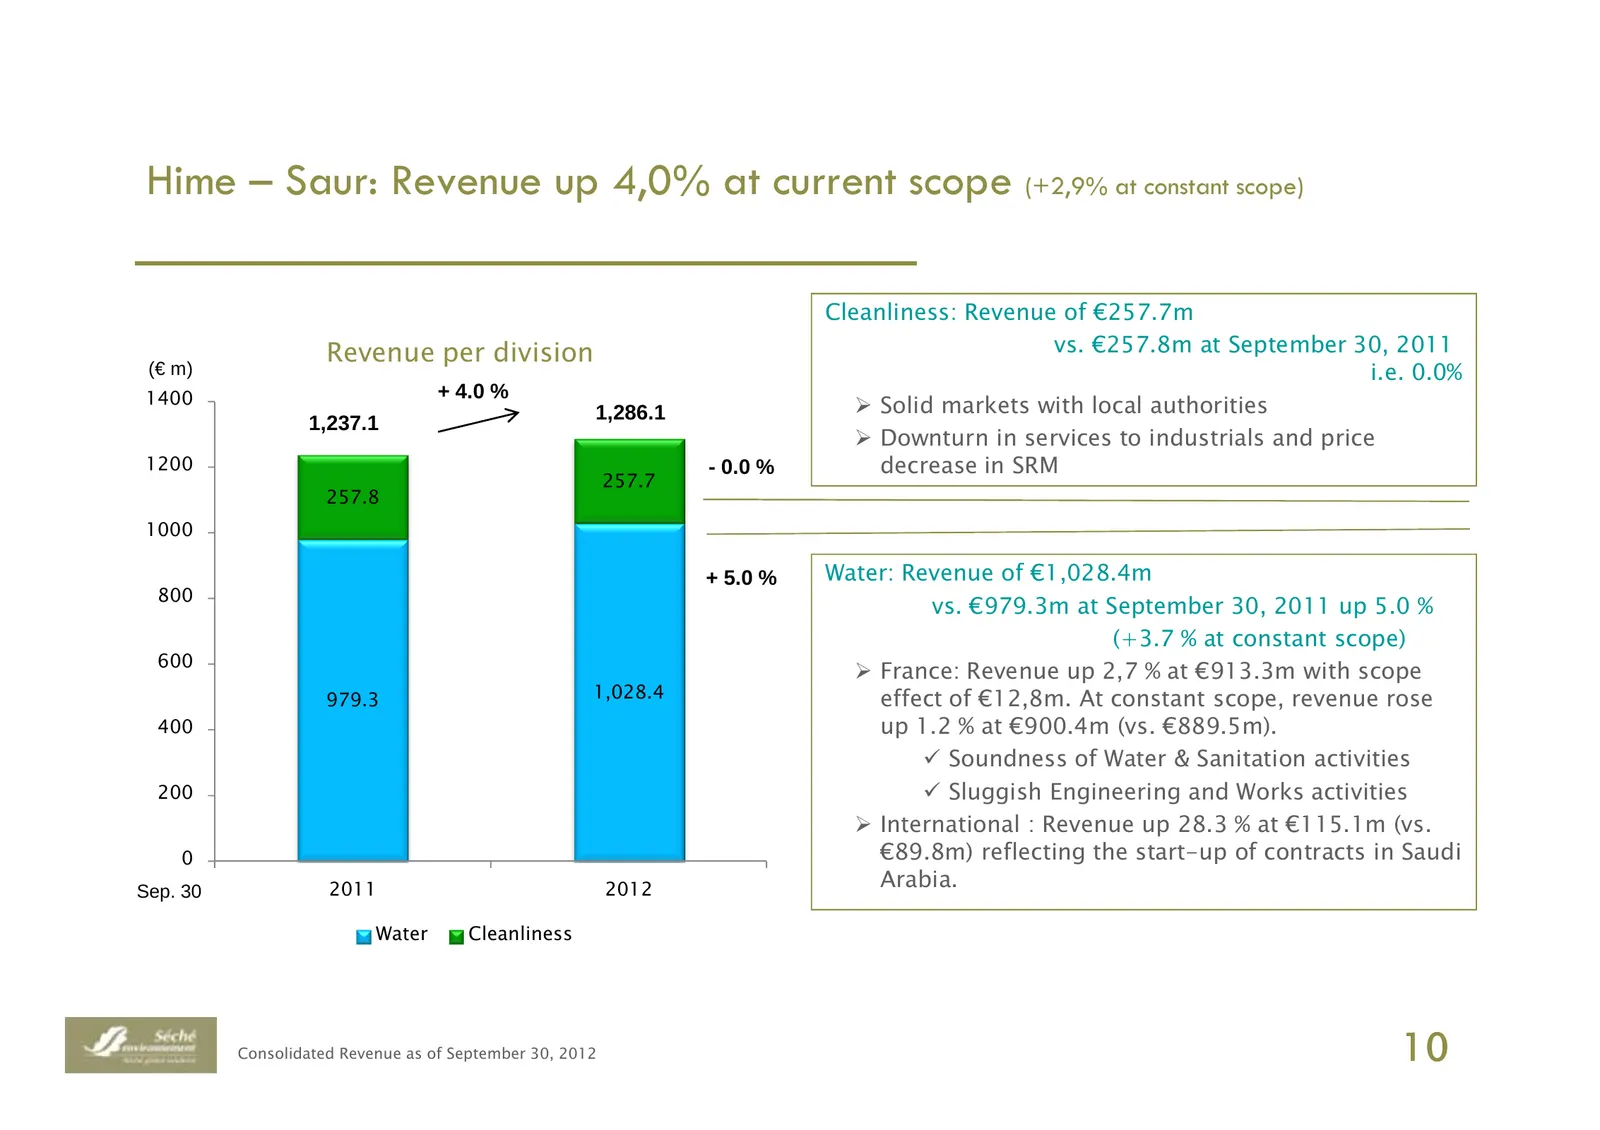
Slide 10: Hime – Saur: Revenue up 4.0% at current scope
Hime – Saur: Revenue up 4,0% at current scope (+2,9% at constant scope) Cleanliness: Revenue of €257.7m Revenue per division vs. €257.8m at September 30, 2011 (€ m) i.e. 0.0% 1400 + 4.0 % 1,286.1 Solid markets with local authorities 1,237.1 Downturn in services to industrials and price 1200 - 0.0 %

Slide 11: Q&A
Q&A Manuel Andersen m.andersen@groupe-seche.com www.groupe-seche.com
Source: Internet Archive copy of groupe-seche.com
More decks from Seche Environnement SA
 Groupe Séché Environnement — Q3 2026 Earnings Presentation13 slides · Oct 27, 2026
 H1 2026 Earnings Presentation34 slides · Sep 9, 2026
 H1 2026 Earnings Presentation34 slides · Sep 9, 2026
 Q1 2026 Earnings Presentation10 slides · Apr 23, 2026
 FY2025 Earnings Presentation43 slides · Mar 10, 2026
 Q3 2025 Earnings Presentation13 slides · Oct 28, 2025