Westar Energy — Citigroup Power, Gas and Utilities Conference 2006
51 slides from Westar Energy's conference presentation, Mar 2, 2006
Slide 1: Citigroup Power, Gas and Utilities Conference
Citigroup Power, Gas and Utilities Conference Miami, FL March 2-3, 2006 Exhibit 99.1 Citigroup Power, Gas and Utilities Conference Miami, FL March 2-3, 2006
Slide 2: Forward-Looking Statements Disclosure
Forward-Looking Statements Disclosure Forward-Looking Statements Disclosure The following presentation contains some “forward-looking statements” with respect to Westar Energy, Inc.’s (“Westar”) future plans, expectations and goals, including management’s expectations with respect to future operatin
Slide 3: Management Team Present
Management Team Present Management Team Present Jim Haines President and Chief Executive Officer Mark Ruelle Executive Vice President & Chief Financial Officer Greg Greenwood Treasurer Bruce Burns Director Investor Relations Jim Haines President and Chief Executive Officer Mark Ruelle Executive Vice
Slide 4: Successful Transformation Complete
Successful Transformation Complete Successful Transformation Complete After strategic missteps in the late 1990s, Westar brought in new management in December 2002 Westar launched sweeping “back-to-basics” strategy Returned Westar to being exclusively a regulated, vertically integrated electric util
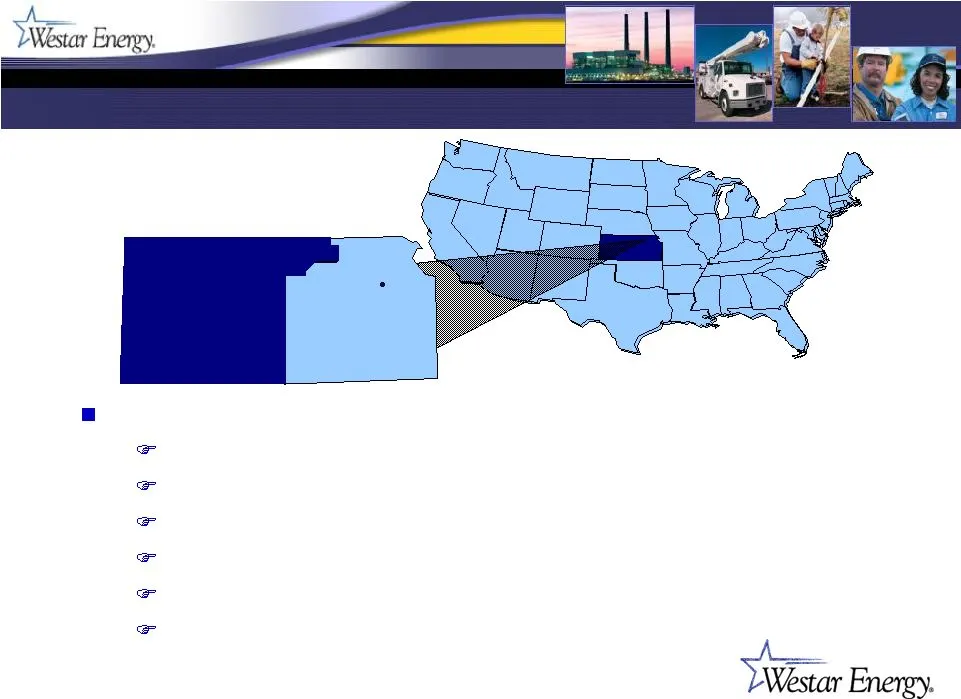
Slide 5: a a a oe a a SWesear Energy.
a a a oe a a SWesear Energy.
Slide 6: Approach to Delivering Shareholder Value
Approach to Delivering Shareholder Value Approach to Delivering Shareholder Value Offer competitive total returns through Growth Dividend yield Focus on reducing risk Business Regulatory Financial Operational Offer investors an attractive risk/return prospect Offer competitive total returns through
Slide 7: Favorable Risk Profile
Favorable Risk Profile Favorable Risk Profile
Slide 8: Stable Regulation
Stable Regulation Stable Regulation All retail customers are in a single state that continues under traditional regulation Kansas has no plans to deregulate or restructure the utility industry All generation assets are in regulated rate base Wholesale marketing Utility generation provides physical b
Slide 9: Adequate, Low-Cost Generation
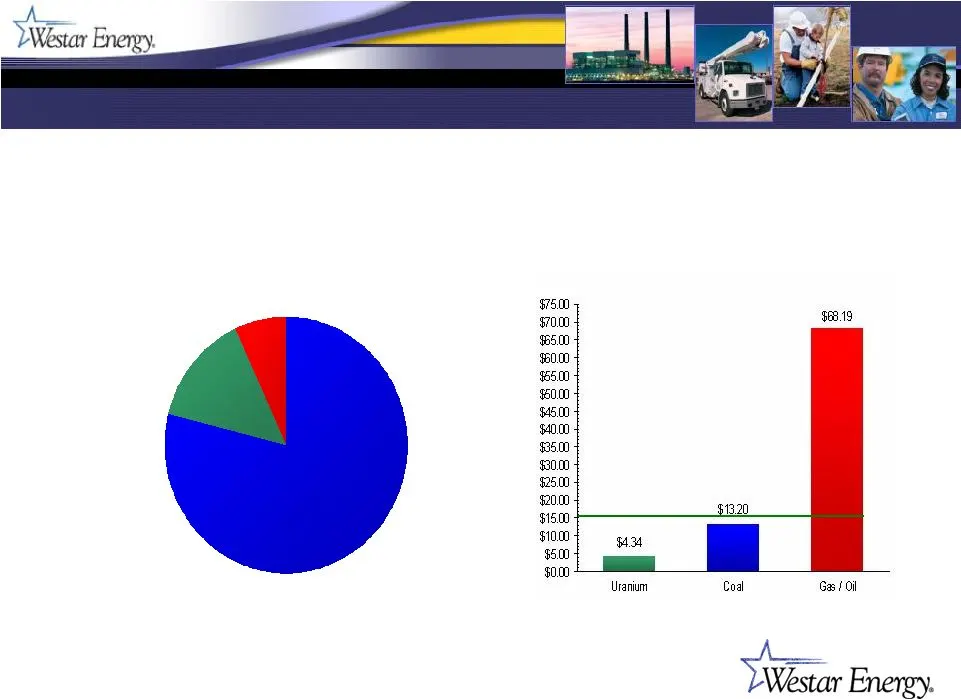
Adequate, Low-Cost Generation Adequate, Low-Cost Generation Advantageous fuel mix 80% coal (low-sulfur PRB) 15% nuclear < 5% oil and gas Most gas capacity can also burn #6 oil providing arbitrage opportunities Strong operating performance 2000-2005 base load coal EFOR of 5.6% Nuclear performance at
Slide 10: Constructive Regulatory Mechanics
Constructive Regulatory Mechanics Constructive Regulatory Mechanics Retail energy cost adjustment clause (RECA) Environmental cost recovery rider (ECRR) Transmission delivery charge (TDC) Property tax adjustment rider (PTS) Retail energy cost adjustment clause (RECA) Environmental cost recovery ride
Slide 11: Retail Energy Cost Adjustment (RECA)
Retail Energy Cost Adjustment (RECA) Retail Energy Cost Adjustment (RECA) Approved December 2005 Effective February 2006 Provides protection against volatile fuel and purchased power costs Commodity markets Fluctuations in plant performance Coal delivery risk Retail rates based on month-ahead foreca
Slide 12: Environmental Cost Recovery Rider (ECRR)
Environmental Cost Recovery Rider (ECRR) Environmental Cost Recovery Rider (ECRR) Approved December 2005 Effective June 2006 based on 2005 capital expenditures Provides automatic adjustment to retail rates to reflect capital costs for emission controls Eliminates need to file a rate case to capture
Slide 13: Transmission Cost Recovery (TDC)
Transmission Cost Recovery (TDC) Transmission Cost Recovery (TDC) FERC formula transmission rate Allows annual adjustment to FERC transmission rate to reflect changes in the cost of service Case filed May 2005 Rates effective December 2005, subject to refund In settlement discussions Kansas statute
Slide 14: Other Helpful Regulatory Mechanics
Other Helpful Regulatory Mechanics Other Helpful Regulatory Mechanics Kansas statute permits annual recovery of increased property taxes without having to file a retail rate case Changes are deferred and recovered in subsequent year Operating costs of Westar’s FERC-jurisdictional co-owned Stateline
Slide 15: Low Retail Utility Rates
Low Retail Utility Rates Low Retail Utility Rates Lowest rates in Kansas Below the national average of 7.8¢ Source: EEI July 1, 2005 0.0¢ 1.0¢ 2.0¢ 3.0¢ 4.0¢ 5.0¢ 6.0¢ 7.0¢ 8.0¢ 9.0¢ Westar Energy North Westar Energy South Empire District Electric (KS) Aquila (formerly West Plains, KS) Kansas City P
Slide 16: Stable, Diverse Economy
Stable, Diverse Economy Stable, Diverse Economy Retail revenue spread across diverse customer base No dominant industry No single customer makes up more than 2% of revenue Large customers spread among commercial, industrial, military and educational load Kansas has a history of being insulated from
Slide 17: Avenues For Growth
Avenues For Growth Avenues For Growth
Slide 18: Opportunities for Growth
Opportunities for Growth Opportunities for Growth Native retail load growth Environmental investment Transmission investment Investments in new generation Growth in energy marketing Tax asset utilization Rate relief Native retail load growth Environmental investment Transmission investment Investmen
Slide 19: Native Retail Load Growth
Native Retail Load Growth Native Retail Load Growth Predictable residential customer growth of about 1% per year Consistent trend for more than 10 years Typically translates into ~2.0-2.5% retail MWh and margin growth Presently enjoying above-trend industrial and large commercial growth Refineries R
Slide 20: Environmental Investment
Environmental Investment Environmental Investment Westar expects to add significant rate base related to pollution controls Estimated to be as much as $620 million over 8-year planning horizon Driven by Clean Air Act Illustrative projects: Scrubbers and SCRs at LaCygne Scrubbers and low-nox burners
Slide 21: Illustrative ECRR Mechanics
Illustrative ECRR Mechanics Illustrative ECRR Mechanics Regulatory lag limited to 5 – 17 months Investment made on equipment not in-service at year end is not allowed depreciation recovery until the following year Regulatory lag limited to 5 – 17 months Investment made on equipment not in-service at
Slide 22: Transmission Growth
Transmission Growth Transmission Growth Member of the Southwest Power Pool (SPP) Now an approved FERC RTO SPP coordinates regional planning and prioritizes transmission capital projects Westar expects sizable transmission opportunities in its control area The combination of a FERC formula rate, coup
Slide 23: Investment in New Generation
Investment in New Generation Investment in New Generation Near-term needs are limited to peaking capacity Acquisition of Spring Creek, subject to FERC and other conditions Favorable acquisition cost of $177/kW Existing capacity contract should serve to defray carrying cost until investment can be re
Slide 24: Growth in Energy Marketing
Growth in Energy Marketing Growth in Energy Marketing Westar has a proven track record in energy marketing (non- asset) business In addition to matching buyers and sellers, Westar provides energy marketing services for others (typically small utilities & cities) Margins remain “below the line” for r
Slide 25: Other Opportunities for Value
Other Opportunities for Value Other Opportunities for Value Previous divestitures of non-utility investments have produced sizeable capital losses Business plans may present opportunity to realize some of this value Up to $0.10 per share in 2006 Opportunity expires 2009 Present plans show need for r
Slide 26: Financial Profile
Financial Profile Financial Profile
Slide 27: Preliminary 2005 Results
Preliminary 2005 Results Preliminary 2005 Results Westar expects to announce 2005 results at “upper end” of $1.50-$1.60 ongoing earnings guidance Notwithstanding much higher fuel cost, the need to conserve coal, and no fuel clause in 2005, management demonstrated an ability to meet guidance in other
Slide 28: Guidance & Growth Expectations
Guidance & Growth Expectations Guidance & Growth Expectations Announced guidance for 2006 of $1.55-$1.65 per share Plan to report only GAAP EPS With restructuring complete, plan to discontinue using non-GAAP “ongoing earnings” measure Announced guidance for 2007 of $1.65-$1.75 per share Reflects ~ 6
Slide 29: Longer-Term Growth Expectations
Longer-Term Growth Expectations Longer-Term Growth Expectations Driven by: Intrinsic retail growth ~2.0-2.5% MWh and margin growth Energy marketing (non-asset) activities Rate base additions On average, Westar estimates ~ 3–3.5% annual rate base additions in the 2007-2010 horizon Other Deliver compe
Slide 30: Dividend History
Dividend History Dividend History As part of restructuring plan, Westar reduced dividend from $1.20 to $0.76 per share in 2003 In 2004 announced plans to begin restoring dividend November 2004 announced 21% increase to $0.92 per share Announced long-term payout target of 60%-75% of earnings February
Slide 31: Dividend Guidance
Dividend Guidance Dividend Guidance Continue to believe that 60%-75% long-term payout target is appropriate Balance investors’ need for current yield with opportunities for rate base growth Continue to believe that the rate of dividend growth may exceed rate of earnings growth to allow Westar to rea
Slide 32: Financial Strength
Financial Strength Financial Strength
Slide 33: Current Capitalization
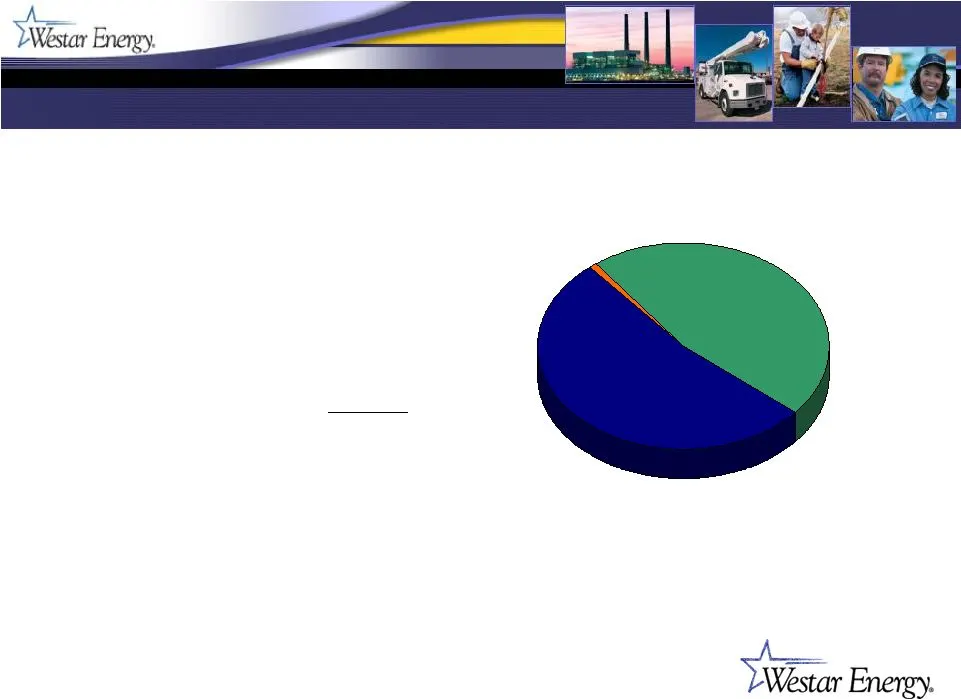
Current Capitalization Current Capitalization Debt 53% Preferred 1% Common 46% September 30, 2005 (millions) Debt $1,663 Preferred Common 1,465 Total Capitalization $3,149 Long-term capitalization target ~ 50%/50% ratio
Slide 34: Aggressive Liability Management
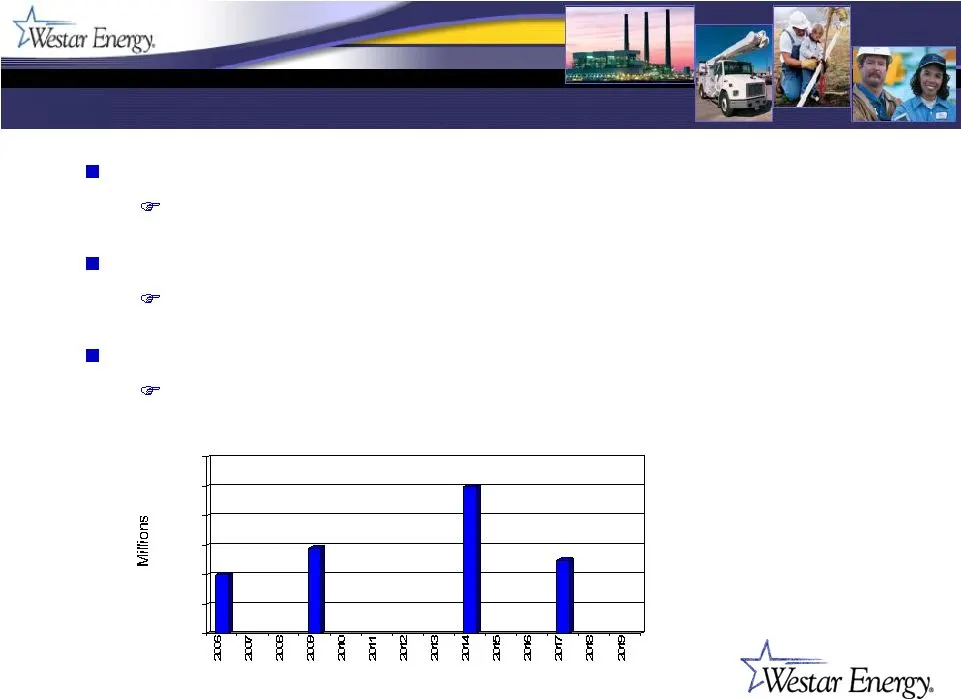
Aggressive Liability Management Aggressive Liability Management $1.7 billion of long-term debt at year end 2005 Floating rate debt of ~13%, mostly in tax-exempts Refinanced $1.3 billion of debt since June 2004 Reduced the weighted average cost of debt from 7.3% to about 5.5% Active management of mat
Slide 35: Credit Strength Belies Current Ratings
Credit Strength Belies Current Ratings Credit Strength Belies Current Ratings Westar’s unsecured debt still rated below investment grade (BB-/Ba1/BB+) Notwithstanding, Westar debt trades at investment grade levels 2005 credit stats support investment grade trading levels EBITDA/Interest Debt/Capital
Slide 36: Summary & Conclusions
Summary & Conclusions Summary & Conclusions
Slide 37: Investment Highlights
Investment Highlights Investment Highlights Diverse customer mix / below average utility rates Reliable, low-cost generating assets Stable environment Attractive dividend policy Good growth opportunities Pure utility / traditional regulation Diverse customer mix / below average utility rates Reliabl
Slide 38: Proven, Capable Management Team
Proven, Capable Management Team Proven, Capable Management Team Demonstrated ability to complete successful strategic transformation Demonstrated ability to deal with adversity Thoughtful, responsible plan for customers’ and investors’ future demands Demonstrated ability to meet commitments Demonstr
Slide 39: Westar Energy Investor Contact
Westar Energy Investor Contact Bruce Burns Director Investor Relations 785-575-8227 bruce_burns@wr.com Westar Energy Investor Contact Bruce Burns Director Investor Relations 785-575-8227 bruce_burns@wr.com
Slide 40: Appendices
Appendices Appendices
Slide 41: Appendices-Contents
Appendices-Contents Appendices-Contents Appendix 1 February 23 press release (Dividend declaration and earnings guidance) Appendix 2 Rate case recap Appendix 3 Generation operations Appendix 1 February 23 press release (Dividend declaration and earnings guidance) Appendix 2 Rate case recap Appendix
Slide 42: Appendix 1: February 23, Press Release & Related Material
Appendix 1 February 23, Press Release & Related Material Appendix 1 February 23, Press Release & Related Material
Slide 43: Appendix: Rate Case Recap
Appendix 2 Rate Case Recap Appendix 2 Rate Case Recap
Slide 44: Kansas Retail Rate Case
Kansas Retail Rate Case Kansas Retail Rate Case Requested $84 million rate increase – May 2005 KCC ordered net $3 million rate increase – December 2005 $38 million base rate increase $35 million credit to retail customer through fuel clause related to wholesale margins from rate-based generation KCC
Slide 45: Key Calculations in Retail Case
Key Calculations in Retail Case Key Calculations in Retail Case KCC jurisdictional rate base of $2.2 billion Excludes $320 million FERC jurisdictional rate base Allowed rate of return – summarized KCC jurisdictional rate base of $2.2 billion Excludes $320 million FERC jurisdictional rate base Allowe
Slide 46: Treatment of Market-Based Wholesale Margins
Treatment of Market-Based Wholesale Margins Treatment of Market-Based Wholesale Margins KCC requires that Westar credit to customers an amount equal to the prior three year average of such margins Rejected Westar’s request for incentive-based sharing Required margin sharing for 2006 is about $35 mil
Slide 47: Appendix: Operations
Appendix 3 Operations Appendix 3 Operations
Slide 48: Competitive Low-Cost Generation Portfolio
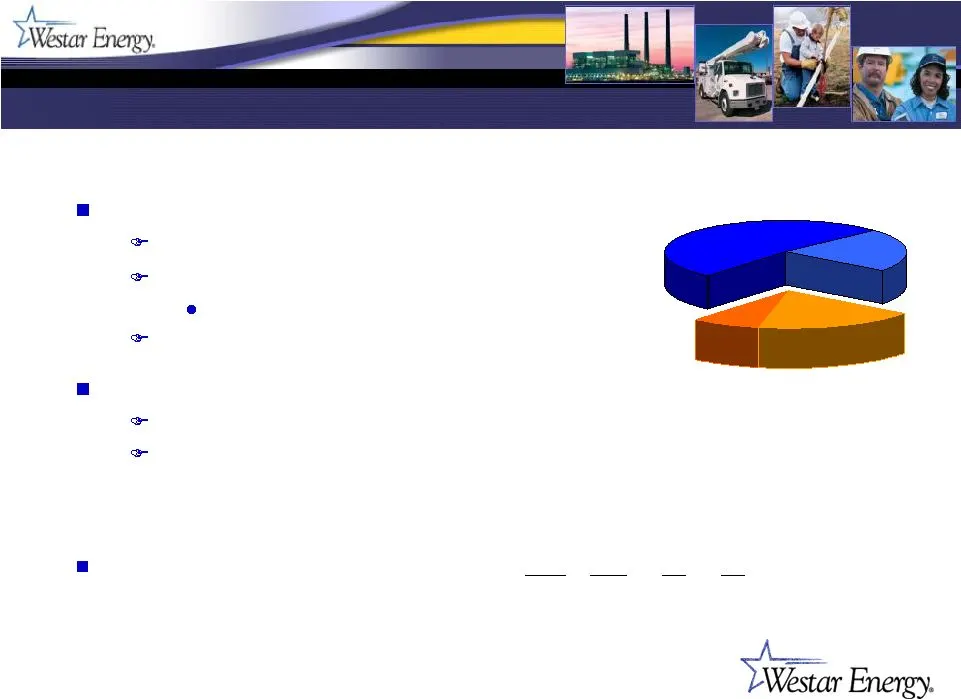
Competitive Low-Cost Generation Portfolio Competitive Low-Cost Generation Portfolio Energy Generated Fuel Cost by Source $/MWh Coal 79% Gas/Oil 7% Uranium 14% Avg. Fuel Cost: $15.36
Slide 49: Load and Capability Forecast
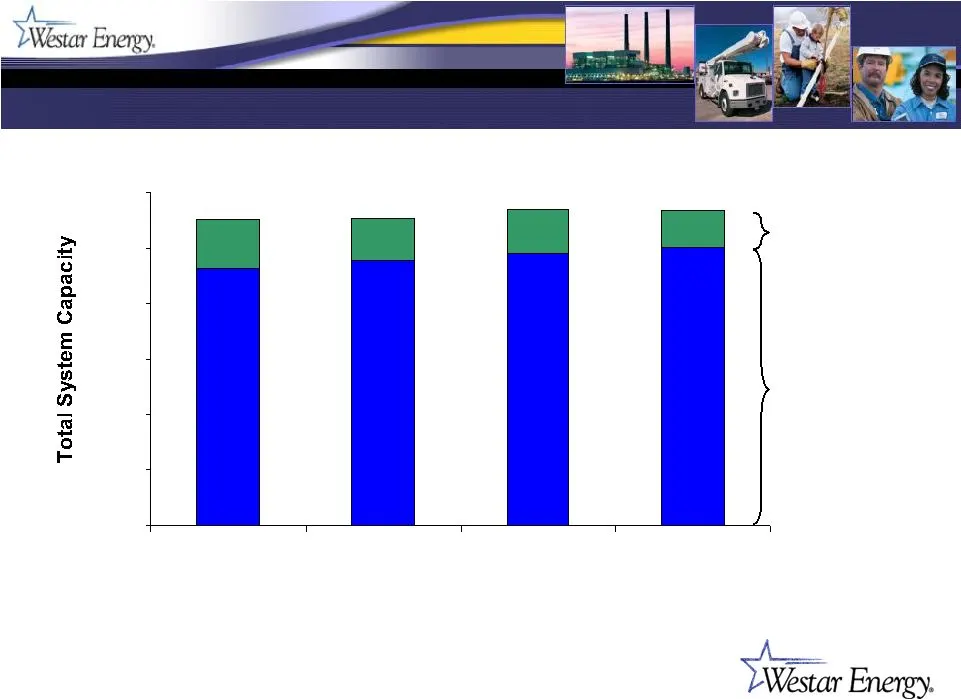
Load and Capability Forecast Load and Capability Forecast 16% 14% 14% 12% 1,000 2,000 3,000 4,000 5,000 6,000 Capacity Margin System Peak Responsibility Assumes purchase of Spring Creek in 2006
Slide 50: Coal Supply
Coal Supply Coal Supply Westar-operated plant supply (80%) 75% under contract through 2020 (10+ MM tons/yr) 70% has no market openers 30% reopened on price every 5 years Next reopening in 2008 All volumes have cost escalators 25% under contract until 2007 – 2009 (3.5 MM tons/yr) 100% at fixed price
Slide 51: Generating Plant Performance
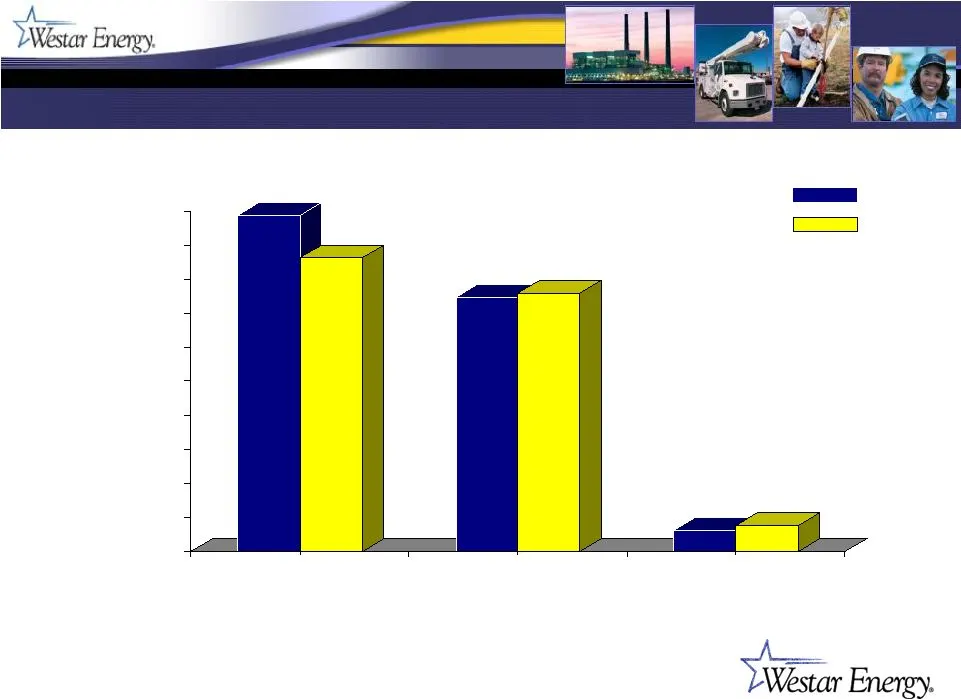
Generating Plant Performance Generating Plant Performance 99% 75% 86% 76% 6% 8% 0% 10% 20% 30% 40% 50% 60% 70% 80% 90% 100% Coal Nuclear Intermediate & Peaking Capacity Factors 2005 nuclear performance reflects a refuel outage
Source: SEC EDGAR · 8-K filed Mar 2, 2006
More decks from Westar Energy Inc
 Merger or Acquisition (January 2018)27 slides · Jan 10, 2018
 Q3 2017 Earnings Presentation19 slides · Nov 3, 2017
 Q2 2017 Earnings Presentation20 slides · Aug 10, 2017
 Q3 2016 Earnings Presentation6 slides · Nov 1, 2016
 Merger or Acquisition (September 2016)29 slides · Sep 8, 2016
 Merger or Acquisition (August 2016)59 slides · Aug 22, 2016