Arbor Realty Trust · NYSE:ABR
Arbor Realty Trust — Q1 2023 Earnings Presentation
15 slides from Arbor Realty Trust's earnings presentation, May 5, 2023
Slide 1: 1Q23 Investor Presentation
1Q23 Investor Presentation CONFIDENTIAL May 2023
Slide 2: Forward-Looking Statements
Forward-Looking Statements Certain items in this presentation may constitute forward-looking statements within the meaning of the “safe harbor” provisions of the Private Securities Litigation Reform Act of 1995, including information about possible, anticipated or assumed future results of our busin
Slide 3: Arbor Realty Trust Company Overview and Recent Highlights
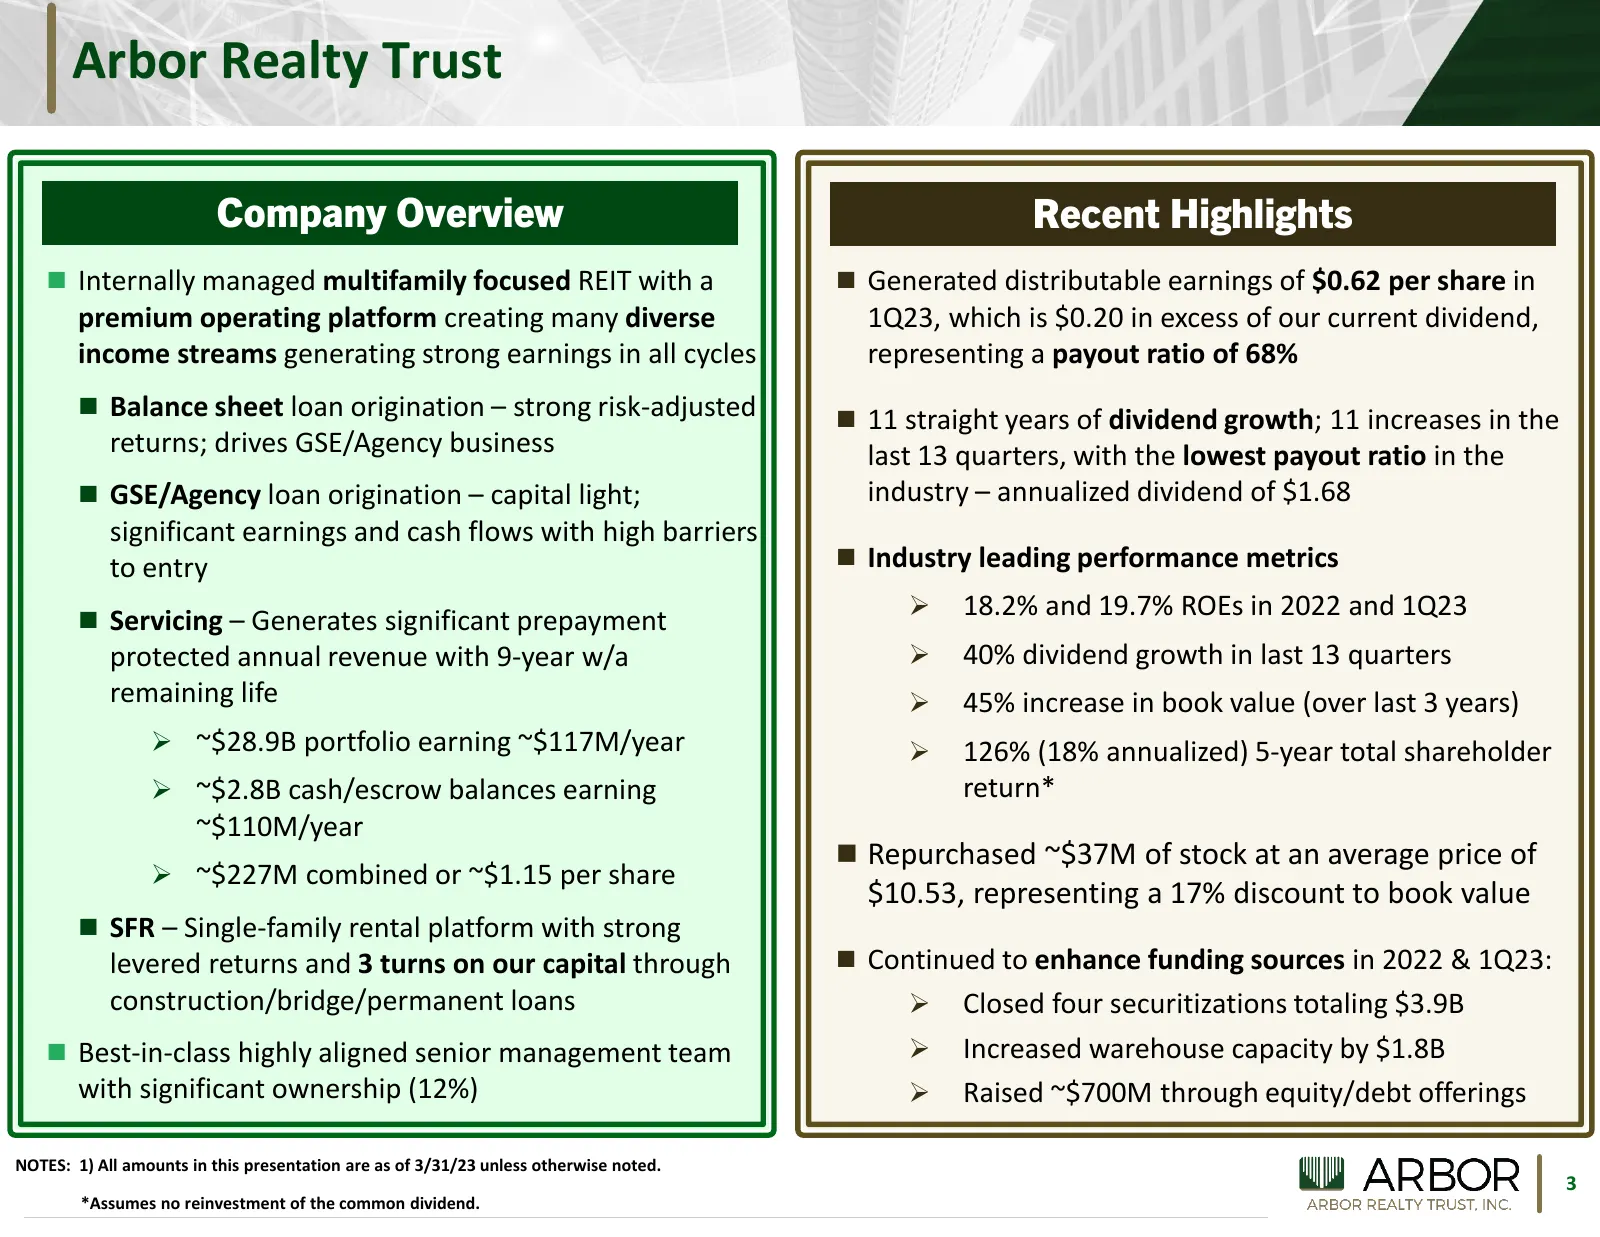
Arbor Realty Trust Company Overview Recent Highlights Internally managed multifamily focused REIT with a Generated distributable earnings of $0.62 per share in premium operating platform creating many diverse 1Q23, which is $0.20 in excess of our current dividend, income streams generating stron
Slide 4: Differentiated Business Platform
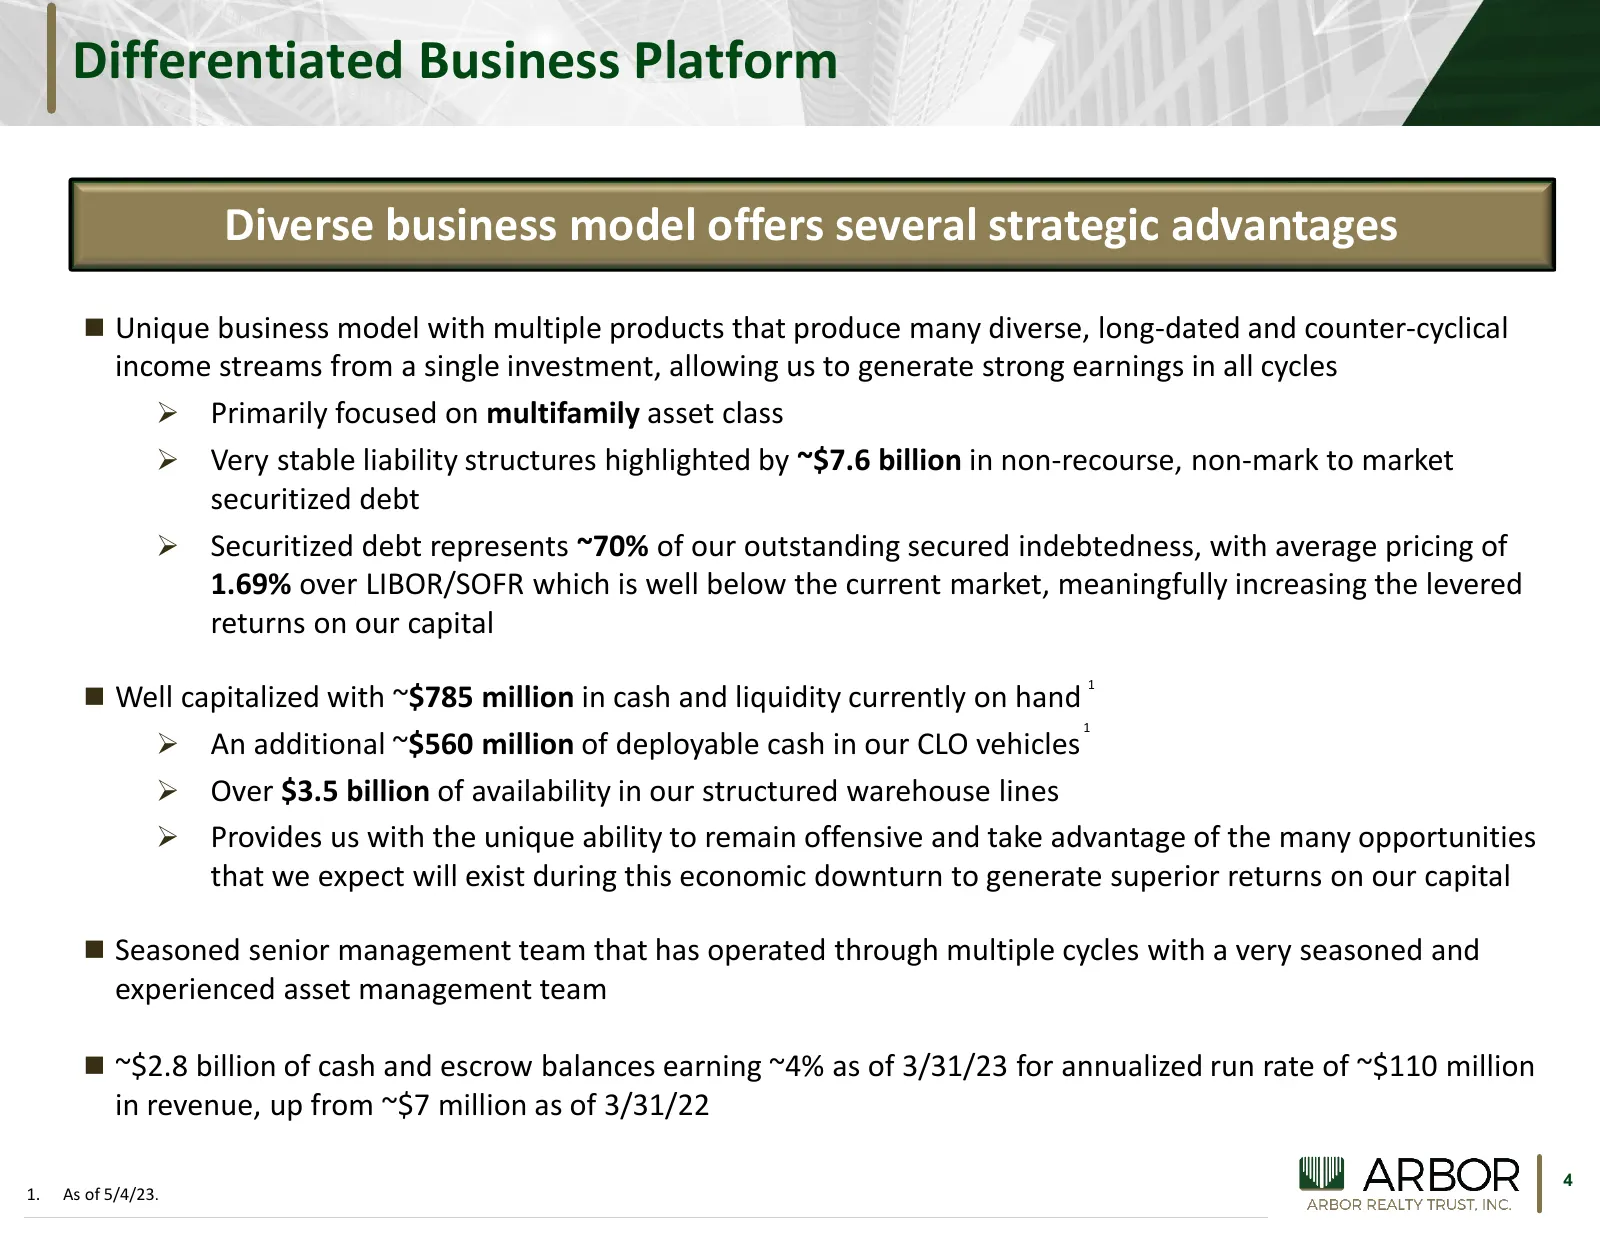
Differentiated Business Platform Diverse business model offers several strategic advantages Unique business model with multiple products that produce many diverse, long-dated and counter-cyclical income streams from a single investment, allowing us to generate strong earnings in all cycles Prima
Slide 5: Highly Diversified Originations Platform
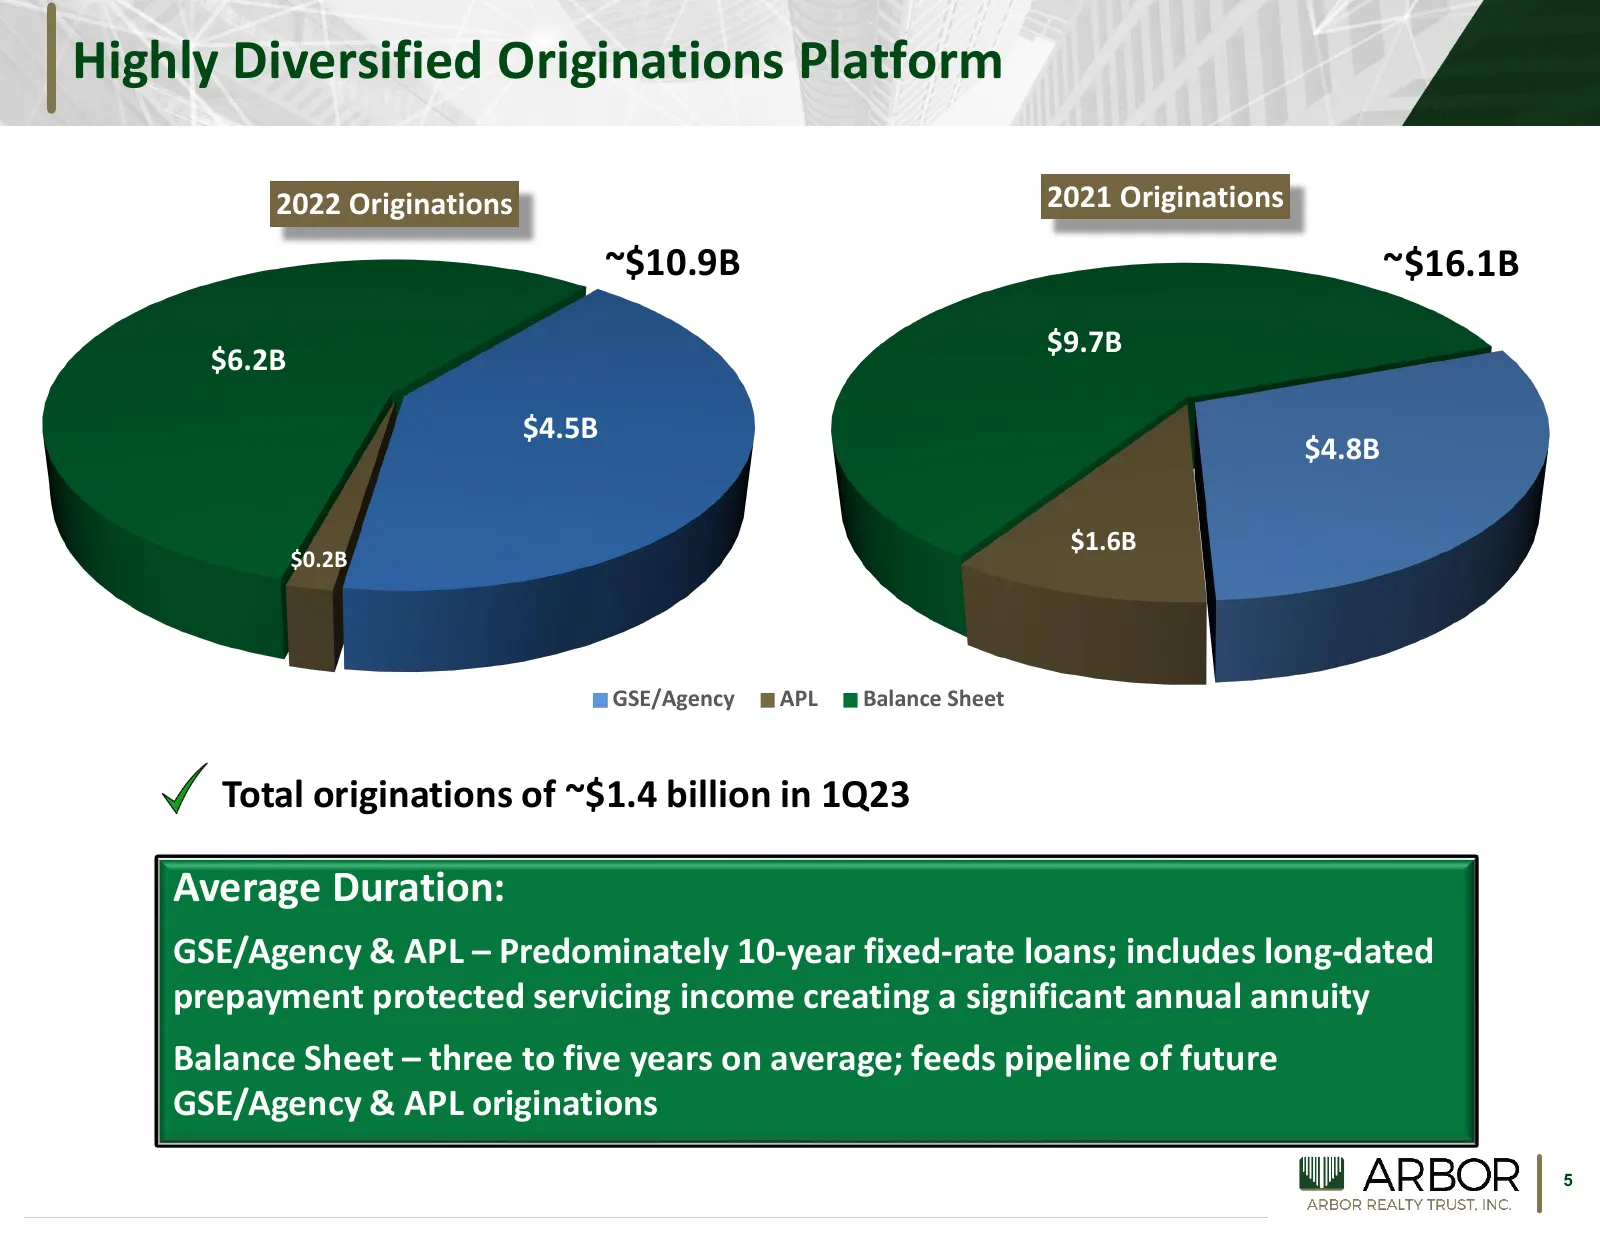
Highly Diversified Originations Platform 2022 Originations 2021 Originations ~$10.9B ~$16.1B $9.7B $6.2B $4.5B $4.8B $1.6B $0.2B 60% 56% 2% 42% GSE/Agency APL Balance Sheet 30% 10% Total originations of ~$1.4 billion in 1Q23 Average Duration: GSE/Agency & APL – Predominately 10-year fixed-rate loans
Slide 6: Balance Sheet Loan Portfolio Composition
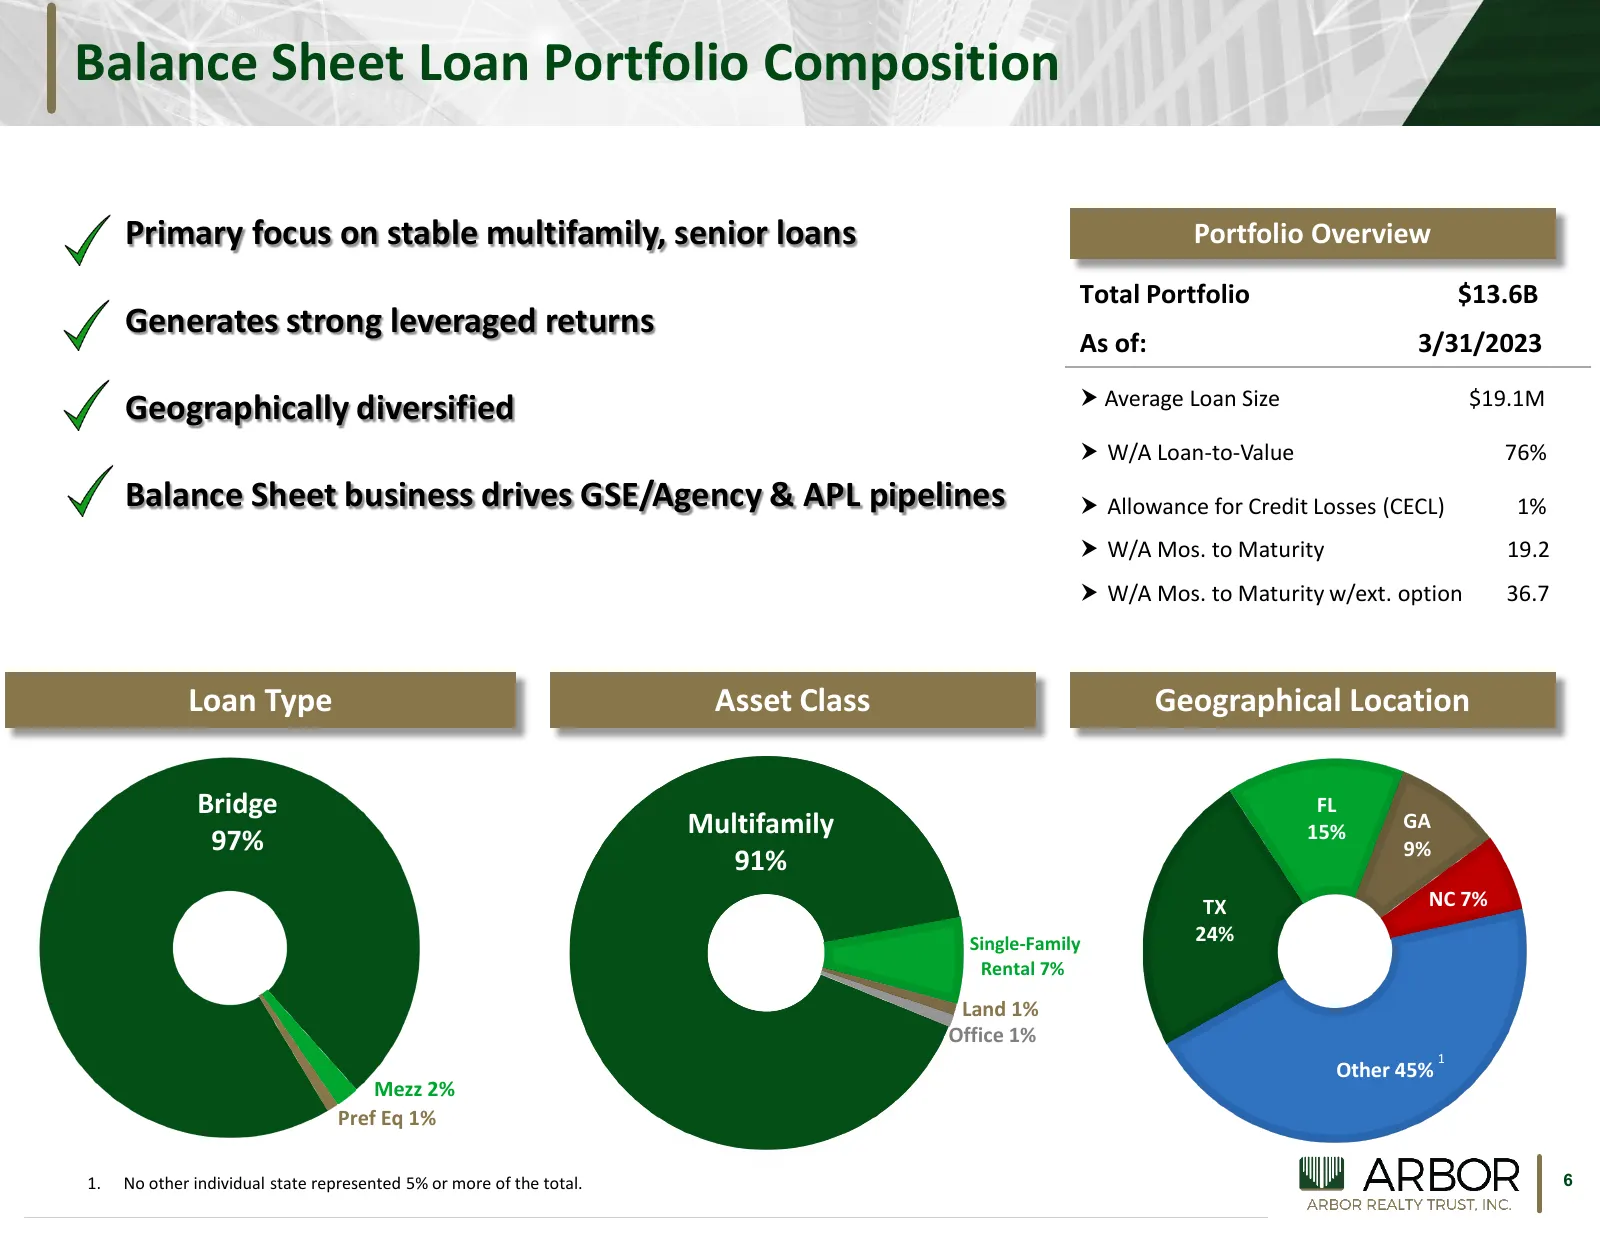
Balance Sheet Loan Portfolio Composition Primary focus on stable multifamily, senior loans Portfolio Overview Total Portfolio $13.6B Generates strong leveraged returns As of: 3/31/2023 Geographically diversified Average Loan Size $19.1M W/A Loan-to-Value 76% Balance Sheet business drives GSE/Age
Slide 7: Leading Nationwide Origination and Servicing Platform
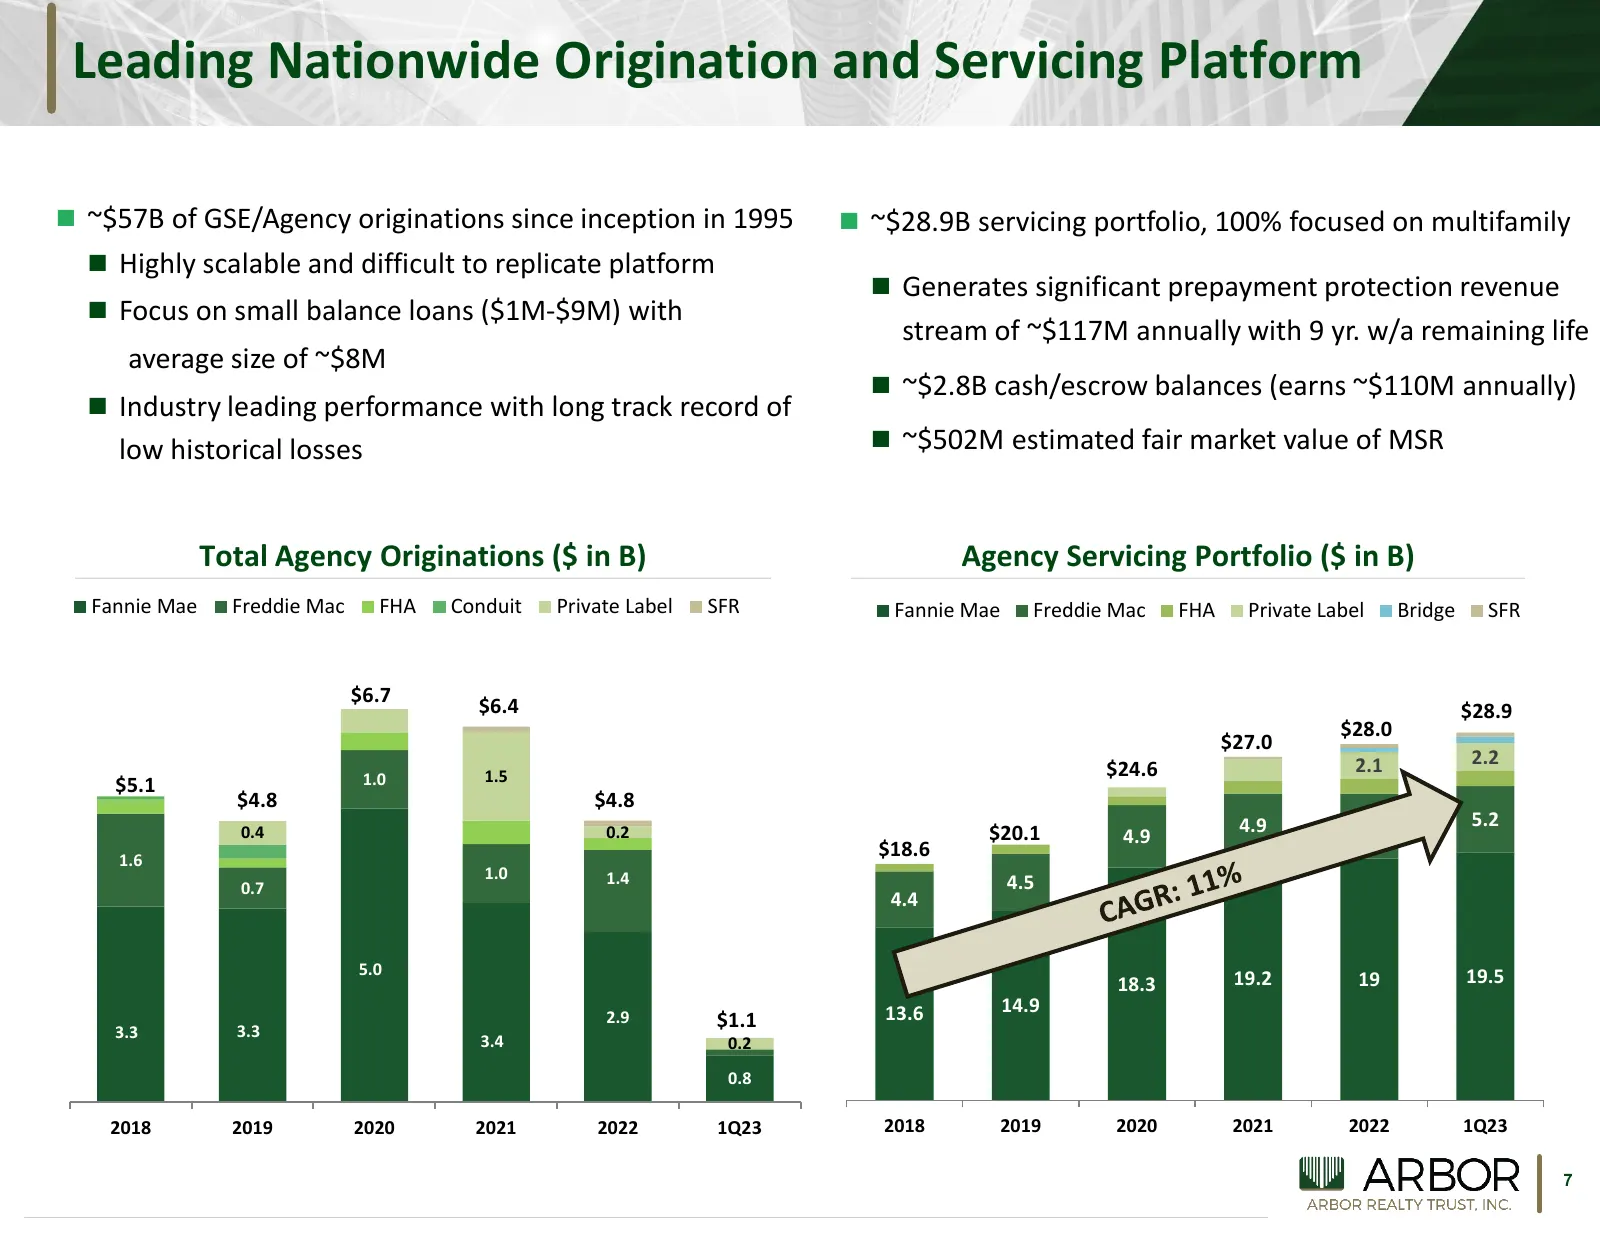
Leading Nationwide Origination and Servicing Platform ~$57B of GSE/Agency originations since inception in 1995 ~$28.9B servicing portfolio, 100% focused on multifamily Highly scalable and difficult to replicate platform Generates significant prepayment protection revenue Focus on small bal
Slide 8: Annuity Based Business Model Drives Diversified Income Streams
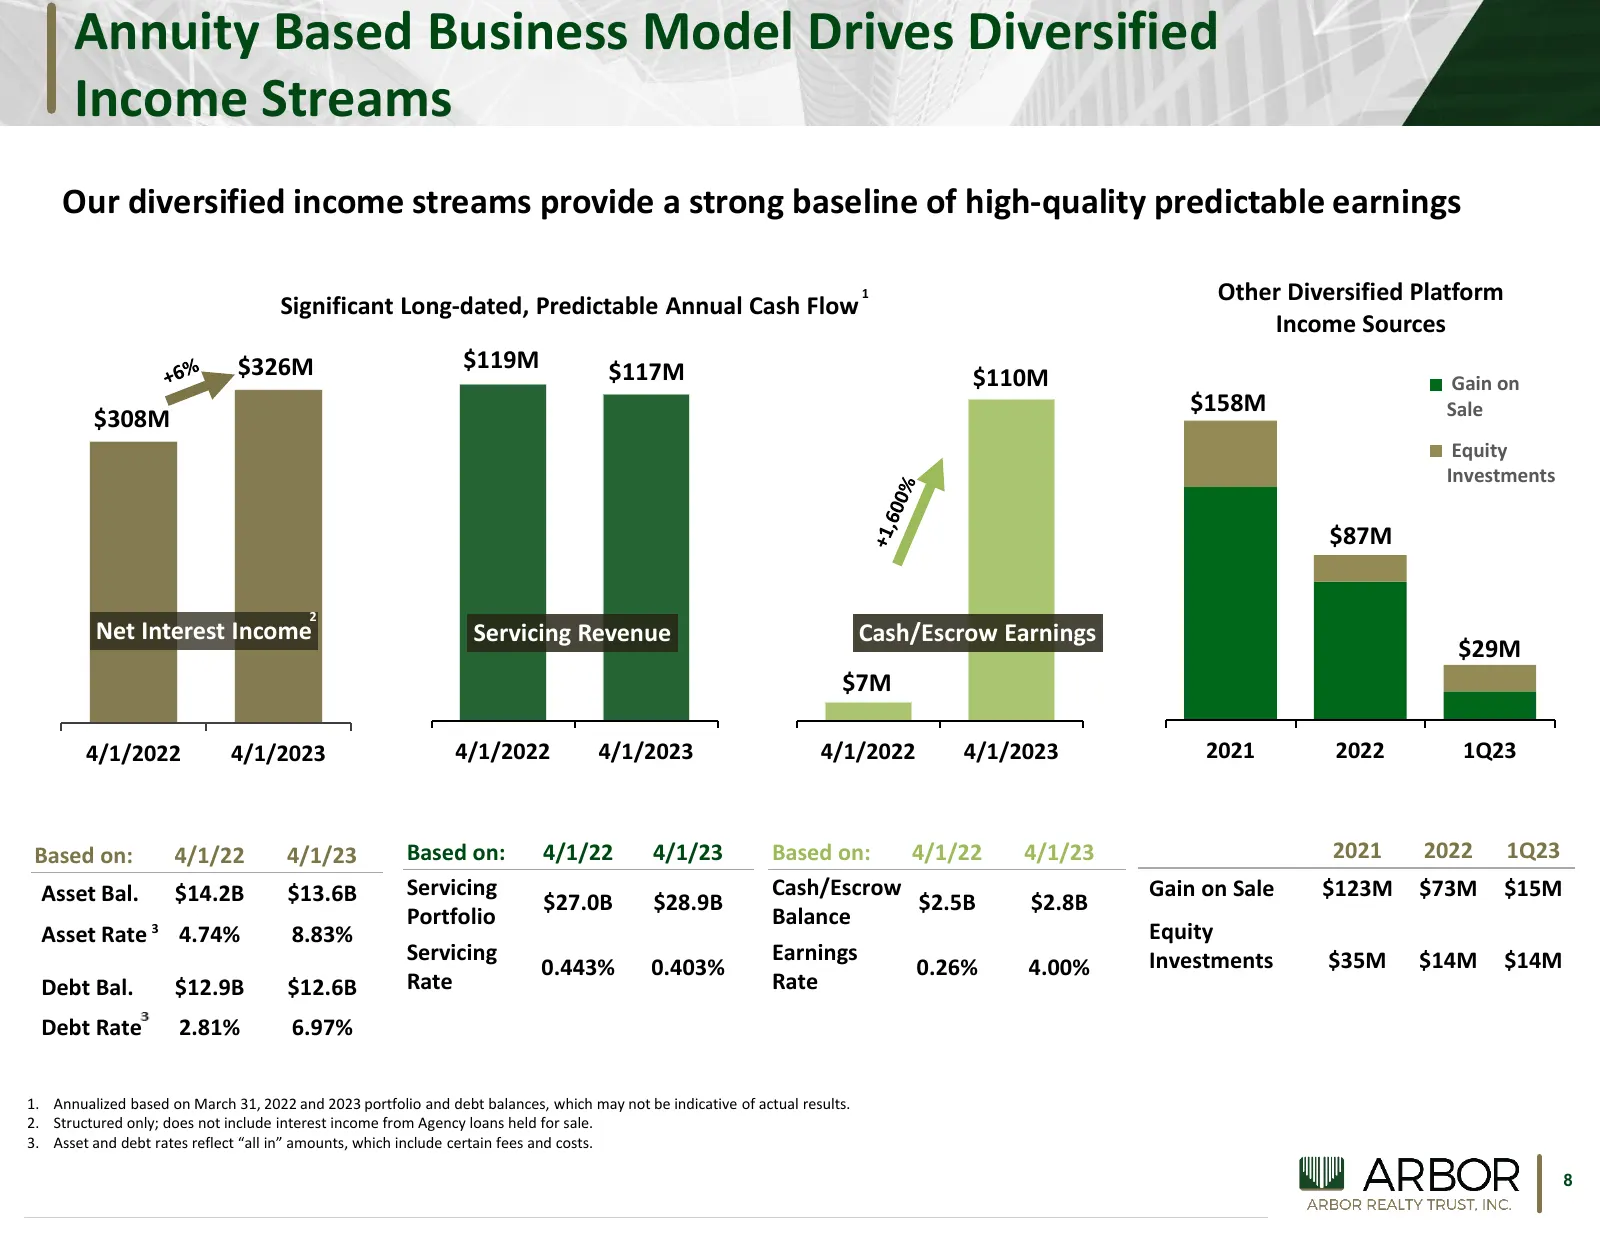
Annuity Based Business Model Drives Diversified Income Streams Our diversified income streams provide a strong baseline of high-quality predictable earnings 1 Other Diversified Platform Significant Long-dated, Predictable Annual Cash Flow Income Sources $326M $119M $117M $110M Gain on $158M Sale $30
Slide 9: Consistent Dividend Growth with Leading Payout Ratio
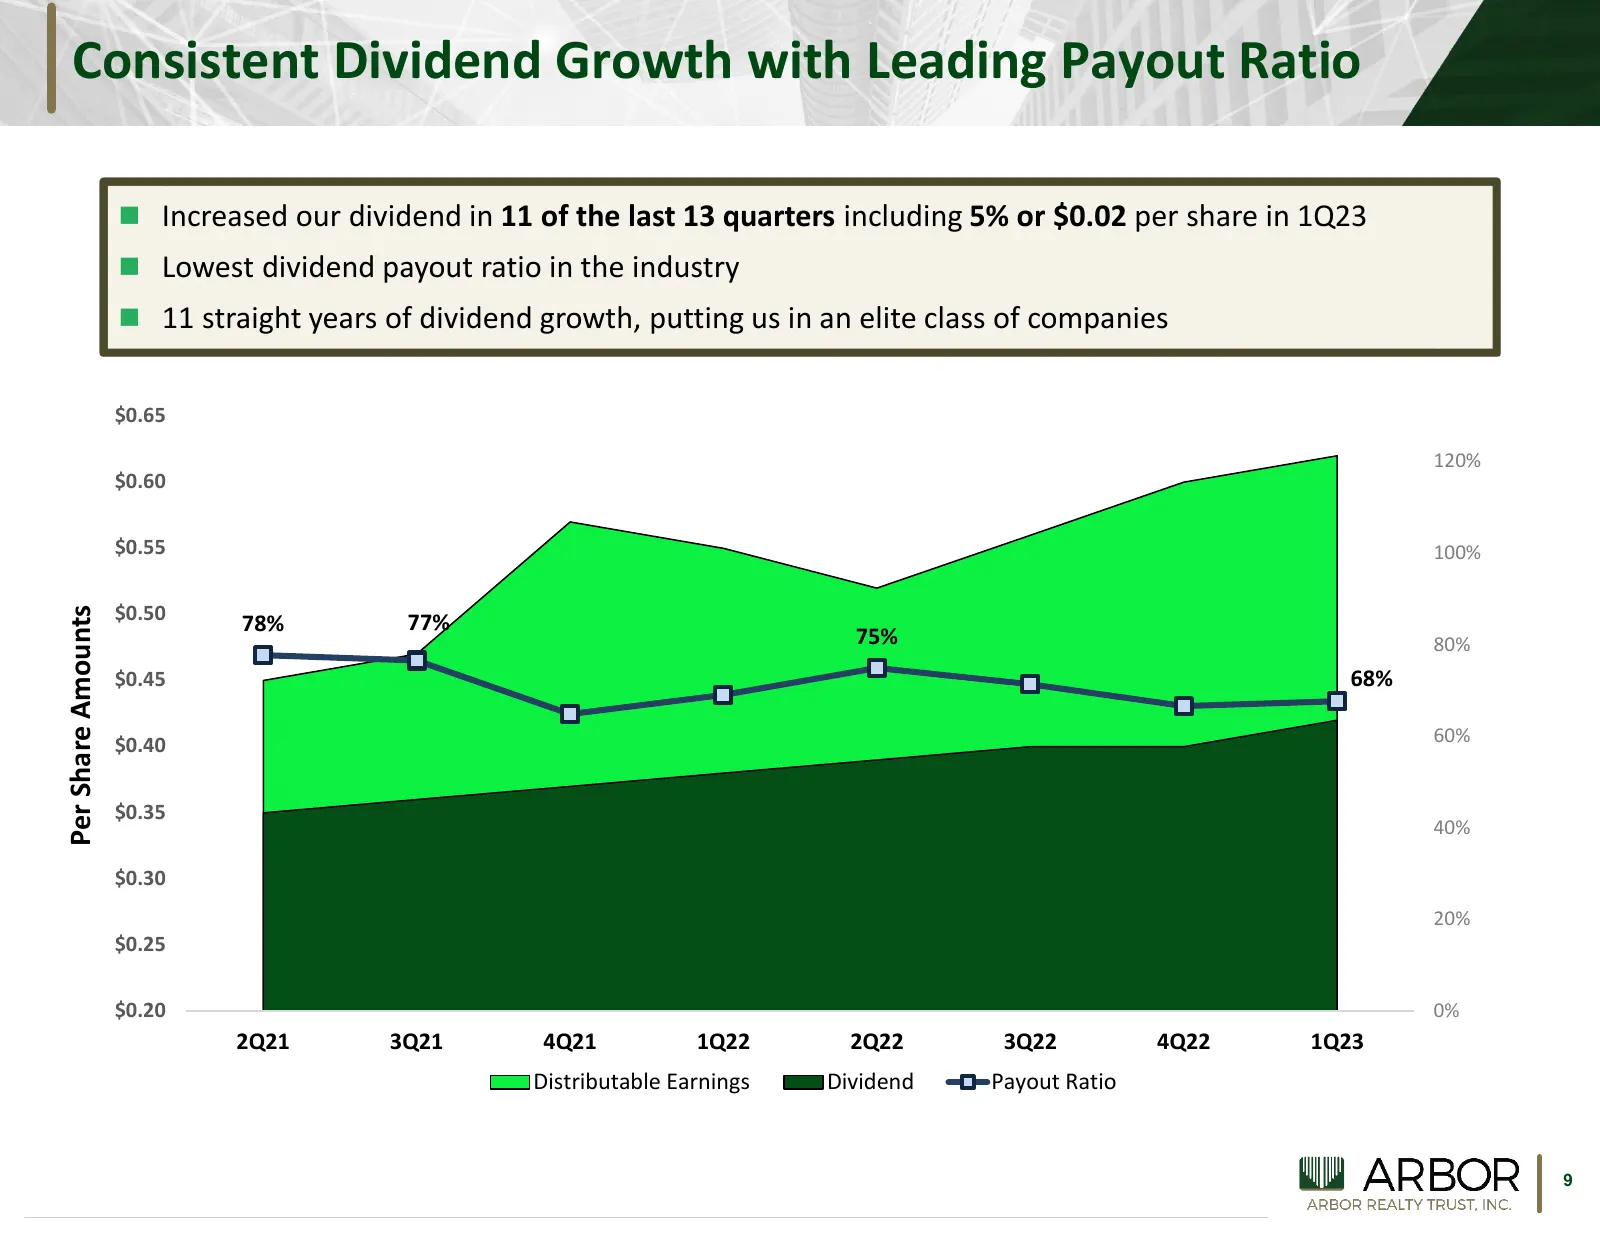
Consistent Dividend Growth with Leading Payout Ratio Increased our dividend in 11 of the last 13 quarters including 5% or $0.02 per share in 1Q23 Lowest dividend payout ratio in the industry 11 straight years of dividend growth, putting us in an elite class of companies $0.65 120% $0.60 $0.55
Slide 10: Industry Leading Securitization Platform
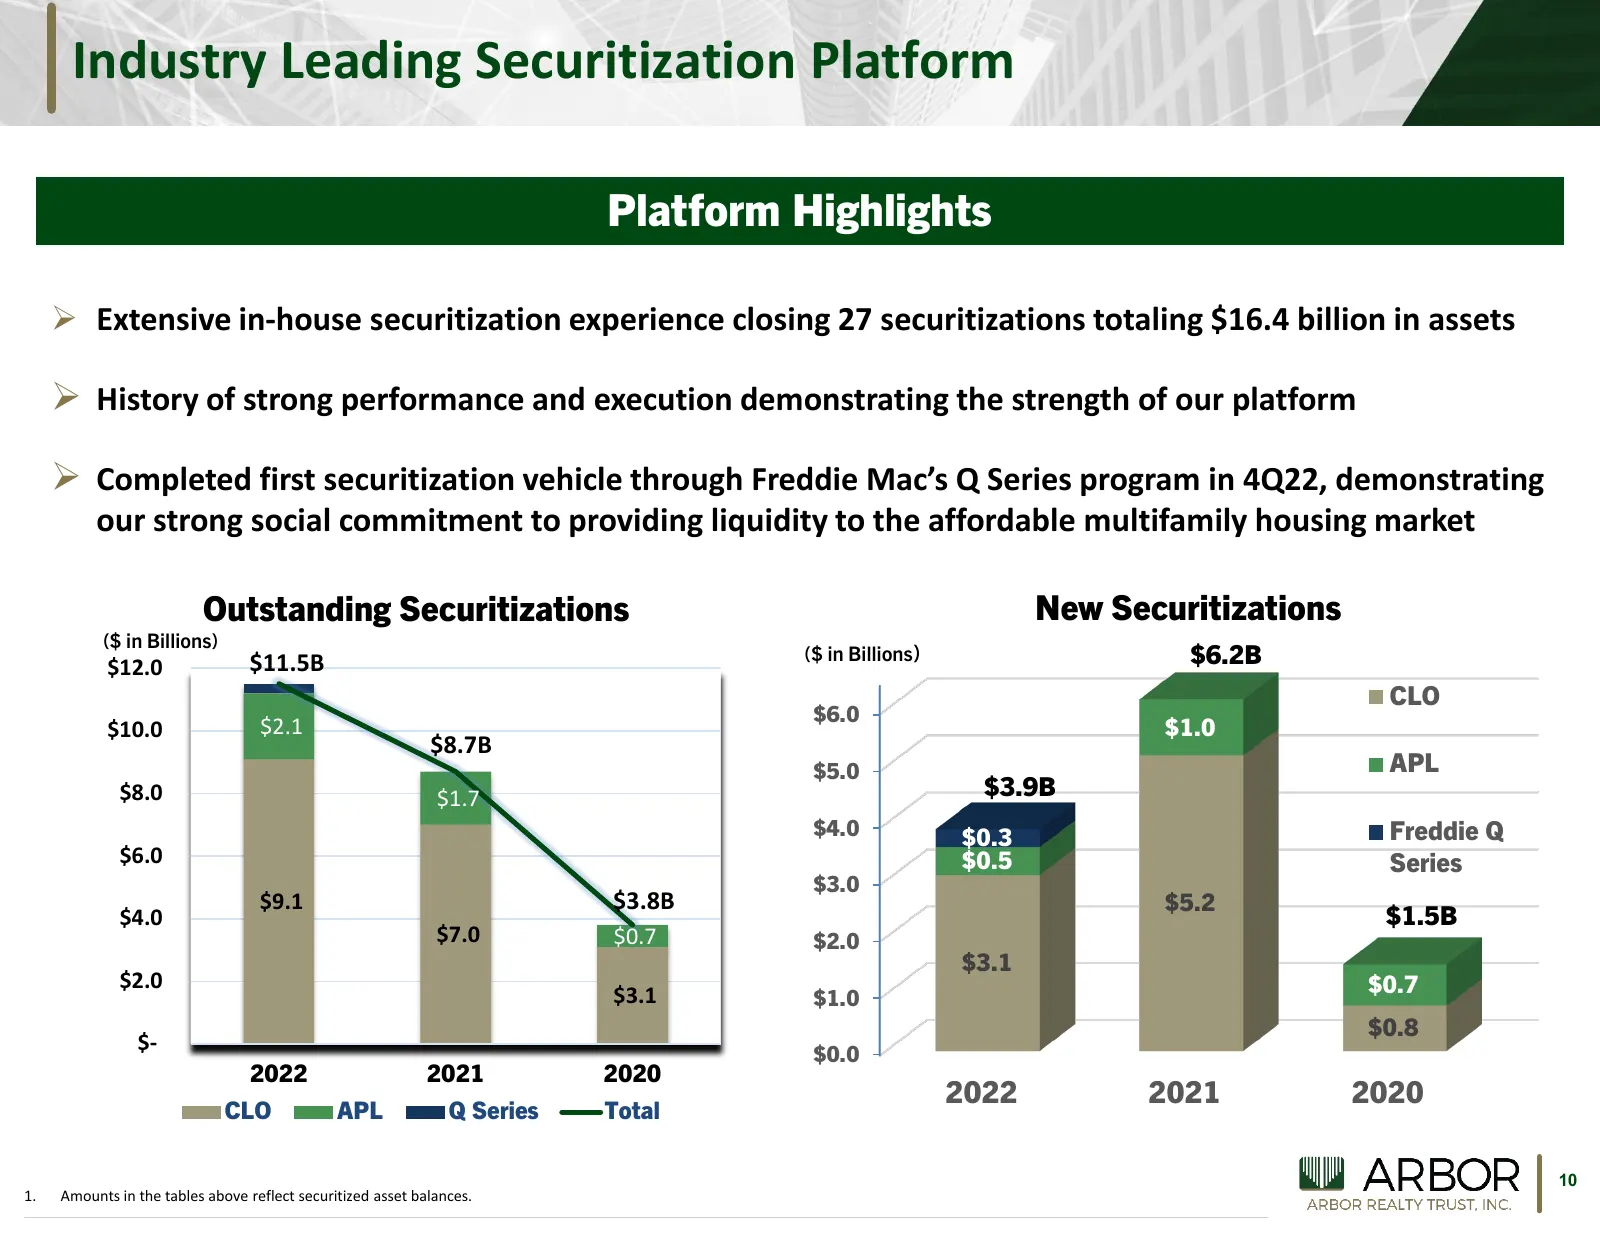
Industry Leading Securitization Platform Platform Highlights Extensive in-house securitization experience closing 27 securitizations totaling $16.4 billion in assets History of strong performance and execution demonstrating the strength of our platform Completed first securitization vehicle th
Slide 11: Diversified Platform with Significant Opportunities
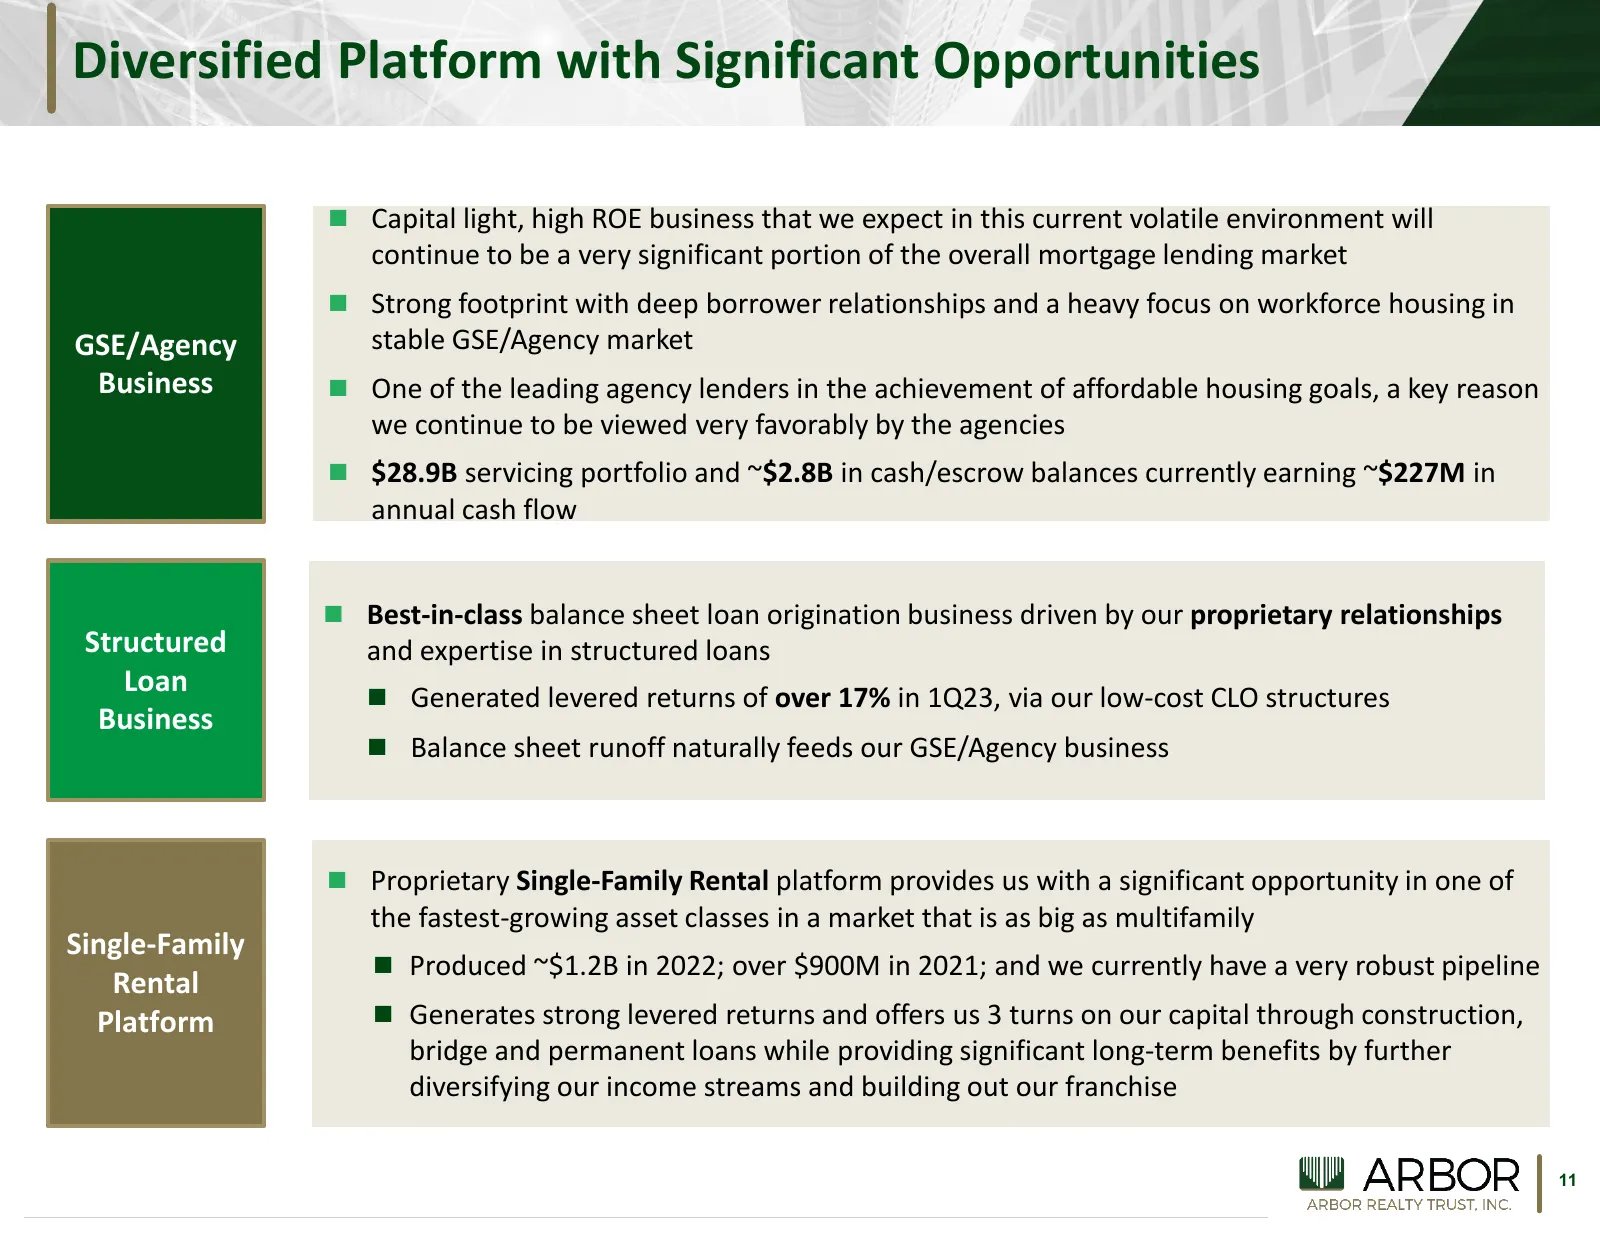
Diversified Platform with Significant Opportunities Capital light, high ROE business that we expect in this current volatile environment will continue to be a very significant portion of the overall mortgage lending market Strong footprint with deep borrower relationships and a heavy focus on wo
Slide 12: Highly Diversified Capital Structure
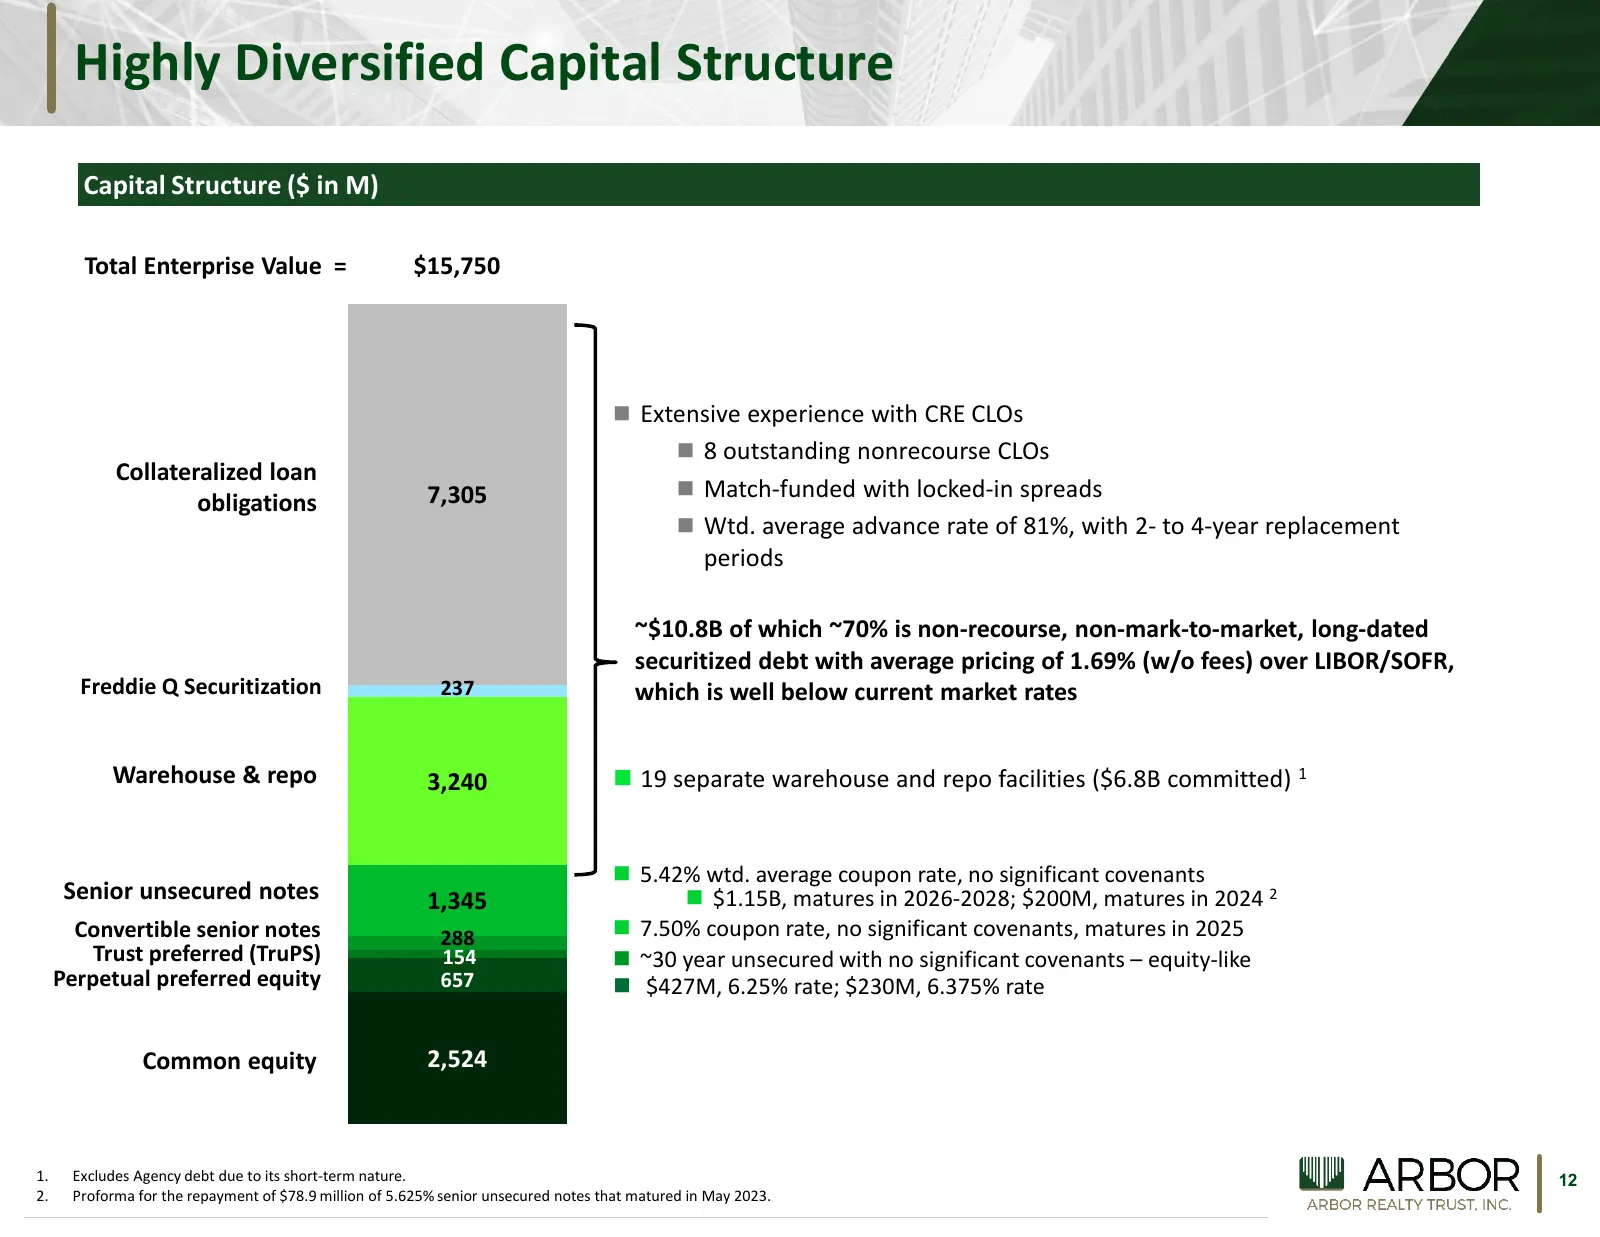
Highly Diversified Capital Structure Capital Structure ($ in M) Total Enterprise Value = $15,750 Extensive experience with CRE CLOs 8 outstanding nonrecourse CLOs Collateralized loan 7,305 Match-funded with locked-in spreads obligations Wtd. average advance rate of 81%, with 2- to 4-year rep
Slide 13: Financial Performance
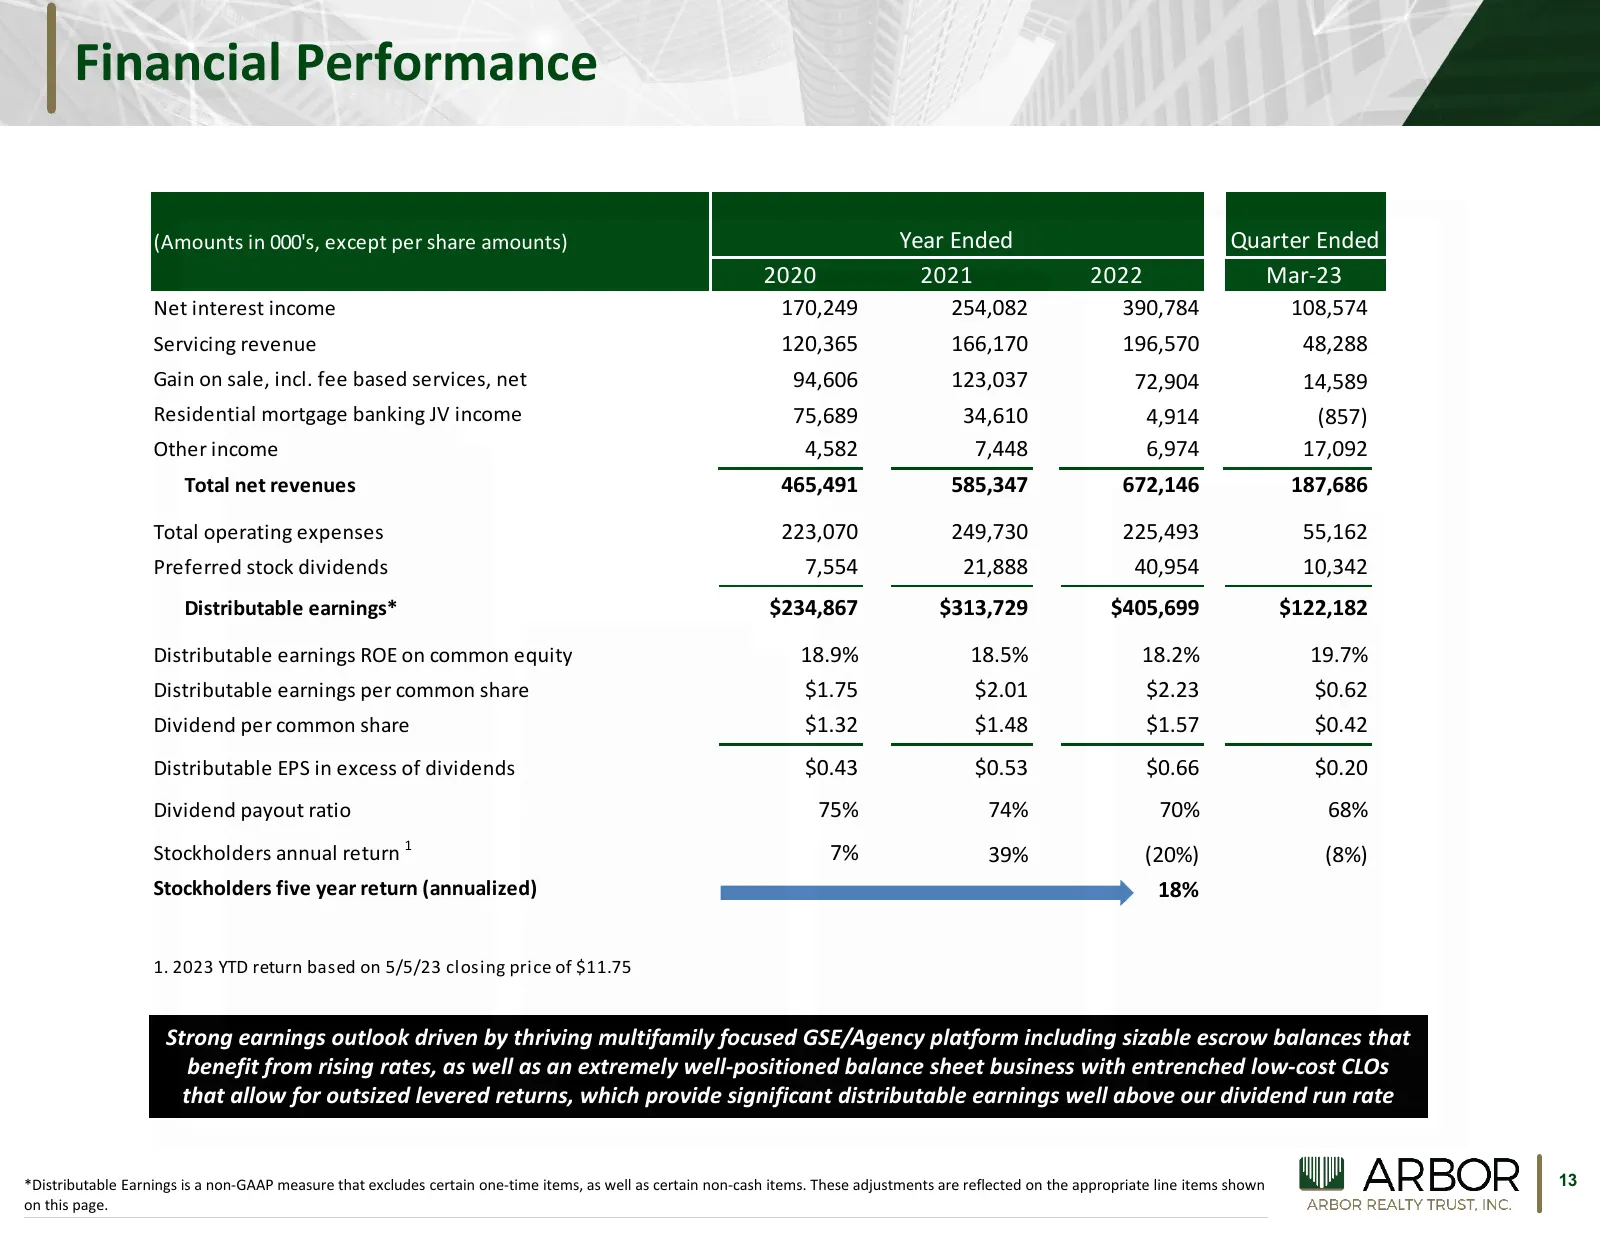
Financial Performance (Amounts in 000's, except per share amounts) Year Ended Quarter Ended 2020 2021 2022 Mar-23 Net interest income 170,249 254,082 390,784 108,574 Servicing revenue 120,365 166,170 196,570 48,288 Gain on sale, incl. fee based services, net 94,606 123,037 72,904 14,589 Residential
Slide 14: Leading Asset Management Platform
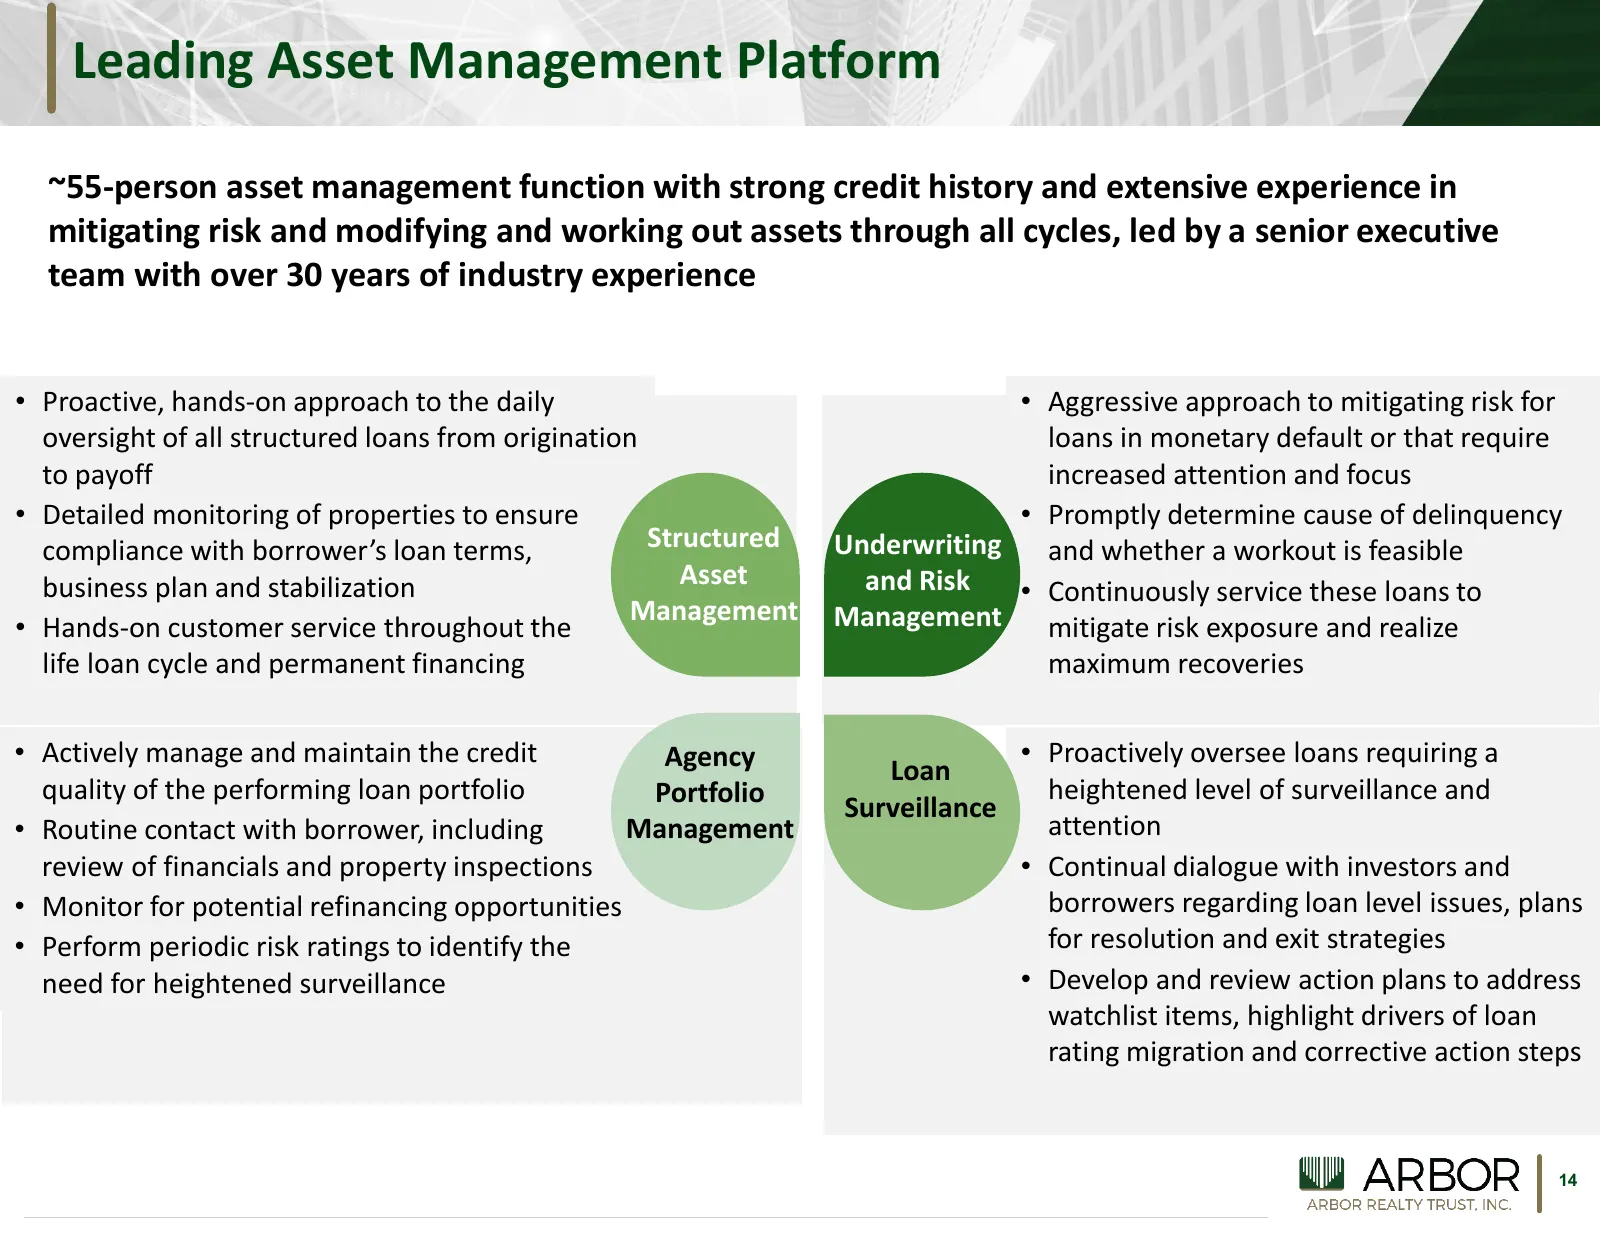
Leading Asset Management Platform ~55-person asset management function with strong credit history and extensive experience in mitigating risk and modifying and working out assets through all cycles, led by a senior executive team with over 30 years of industry experience • Proactive, hands-on approa
Slide 15: Best-in-Class, Highly Aligned Management Team
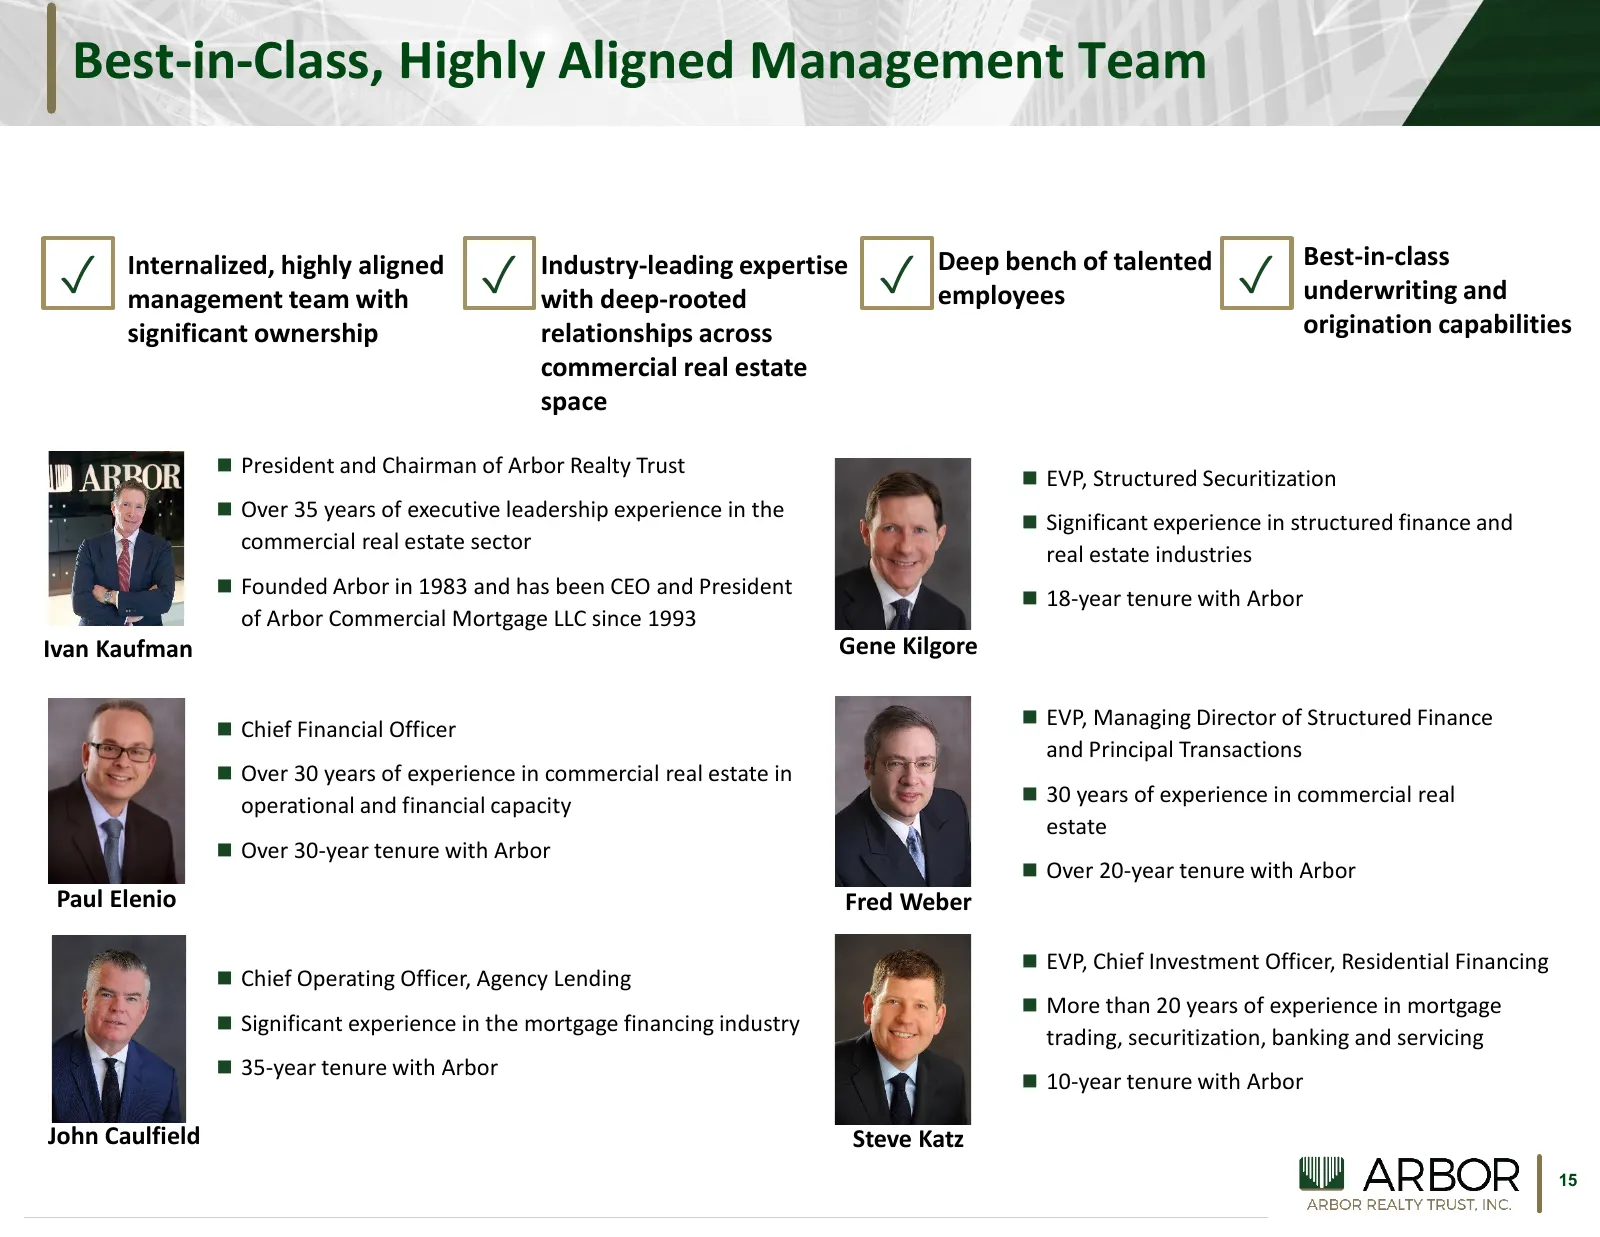
Best-in-Class, Highly Aligned Management Team ✓ ✓ ✓ ✓ Internalized, highly aligned Industry-leading expertise Deep bench of talented Best-in-class management team with with deep-rooted employees underwriting and significant ownership relationships across origination capabilities commercial real esta
Source: 6ix earnings call
More decks from Arbor Realty Trust
 Investor Presentation (October 2026)21 slides · Oct 30, 2026
 Investor Presentation (August 2026)21 slides · August 2026
 Investor Presentation (May 2026)21 slides · May 2026
 Investor Presentation (March 2026)22 slides · March 2026
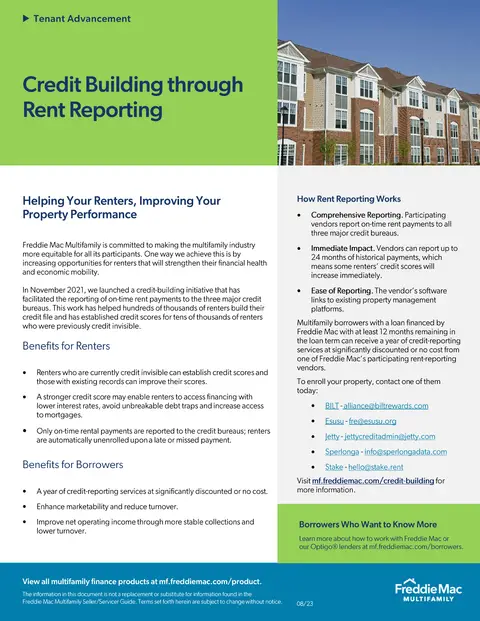 Freddie Mac Multifamily — Fact Sheet (January 2024)1 slide · January 2024
 Q4 2022 Earnings Presentation16 slides · Feb 17, 2023