Grenergy Renovables S.A · BME:GRE
Grenergy Renovables — Investor Presentation (May 2021)
36 slides from Grenergy Renovables's investor presentation, May 2021
Slide 1: Investor Presentation May 2021
INVESTOR PRESENTATION May 2021
Slide 2: Disclaimer
DISCLAIMER By attending this presentation and/or by accepting this presentation you will be cial condition or results of operations by the Company and should not be relied upon taken to have represented, warranted and undertaken that you have read and when making an investment decision. Certain finan
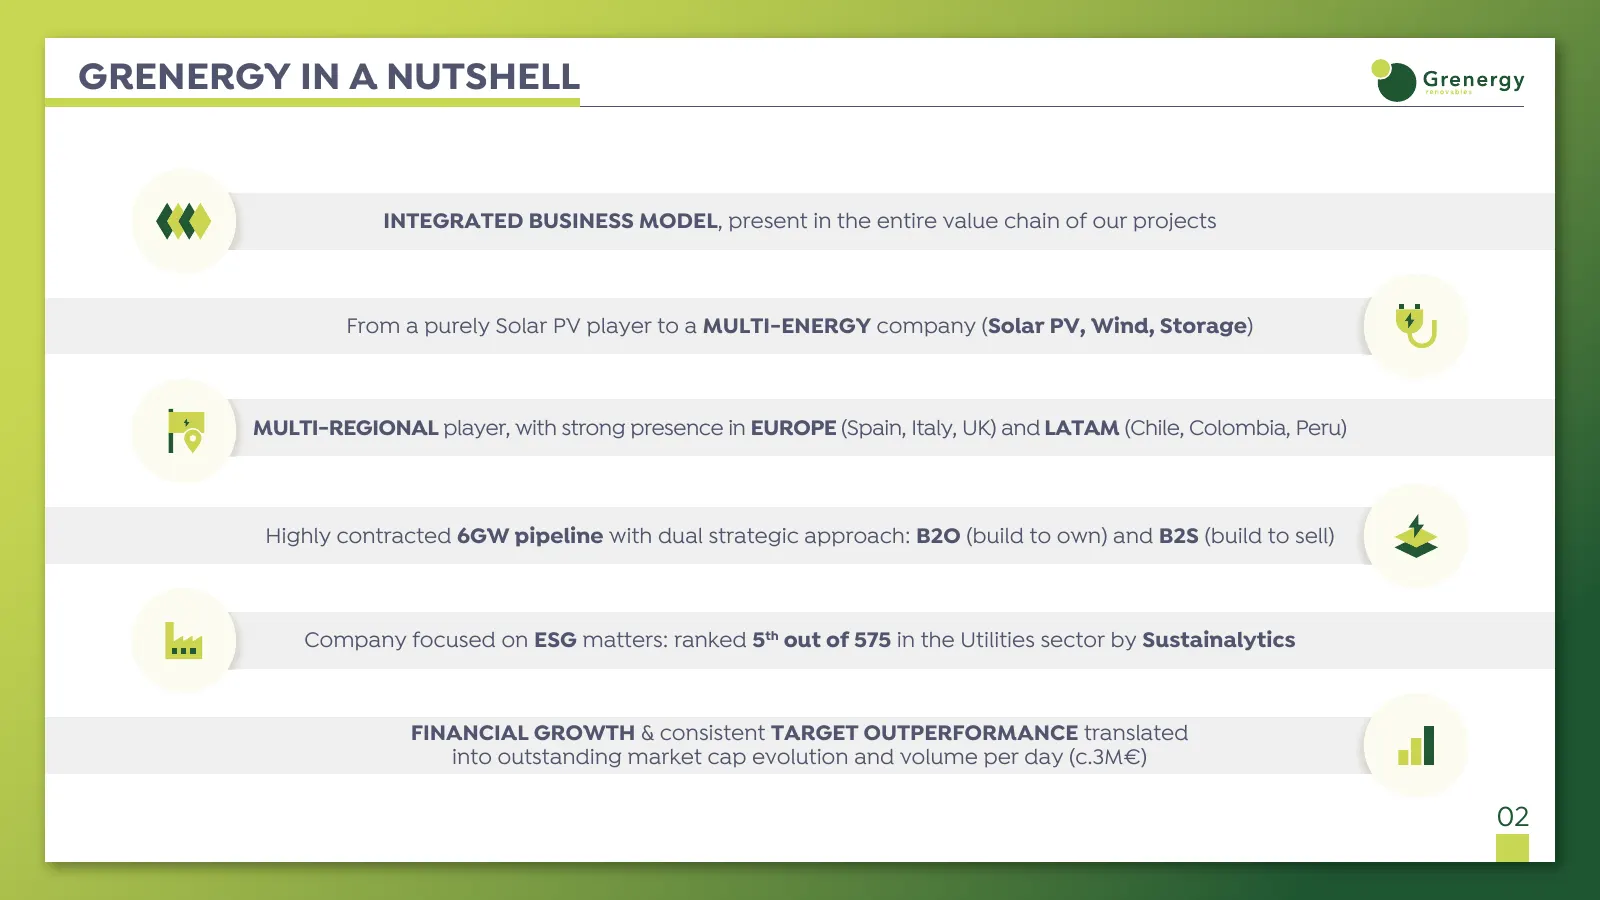
Slide 3: Grenergy in a Nutshell
GRENERGY IN A NUTSHELL INTEGRATED BUSINESS MODEL, present in the entire value chain of our projects From a purely Solar PV player to a MULTI-ENERGY company (Solar PV, Wind, Storage) MULTI-REGIONAL player, with strong presence in EUROPE (Spain, Italy, UK) and LATAM (Chile, Colombia, Peru) Highly cont
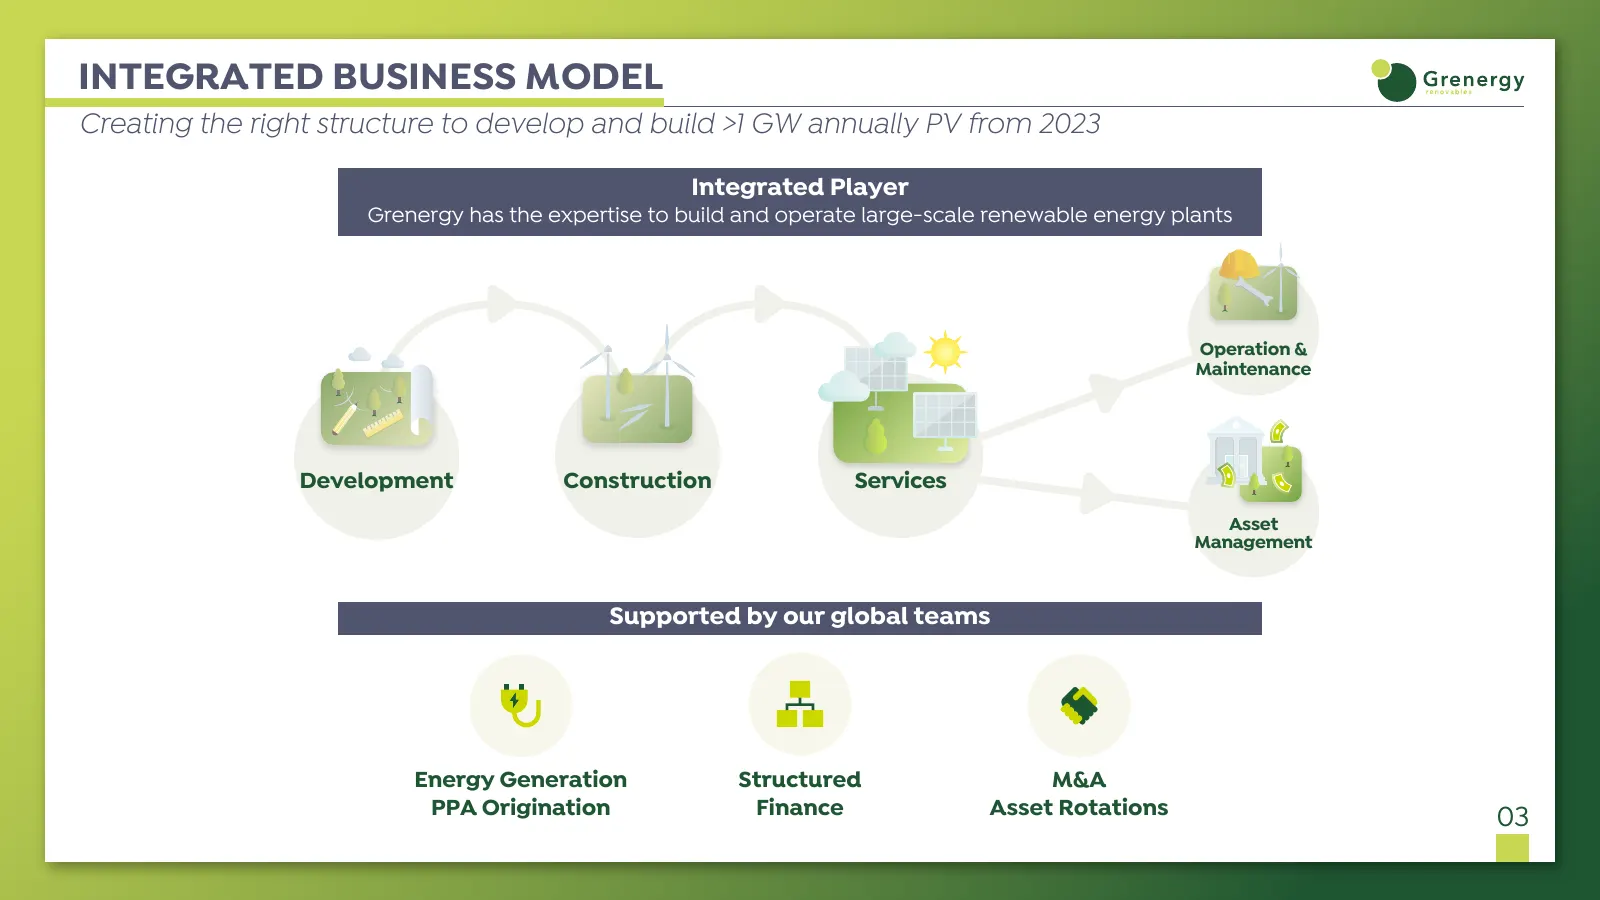
Slide 4: Integrated Business Model
INTEGRATED BUSINESS MODEL Creating the right structure to develop and build >1 GW annually PV from 2023 Integrated Player Grenergy has the expertise to build and operate large-scale renewable energy plants Operation & Maintenance Development Construction Services Asset Management Supported by our gl
Slide 5: A Story of Growth with a Proven Track Record
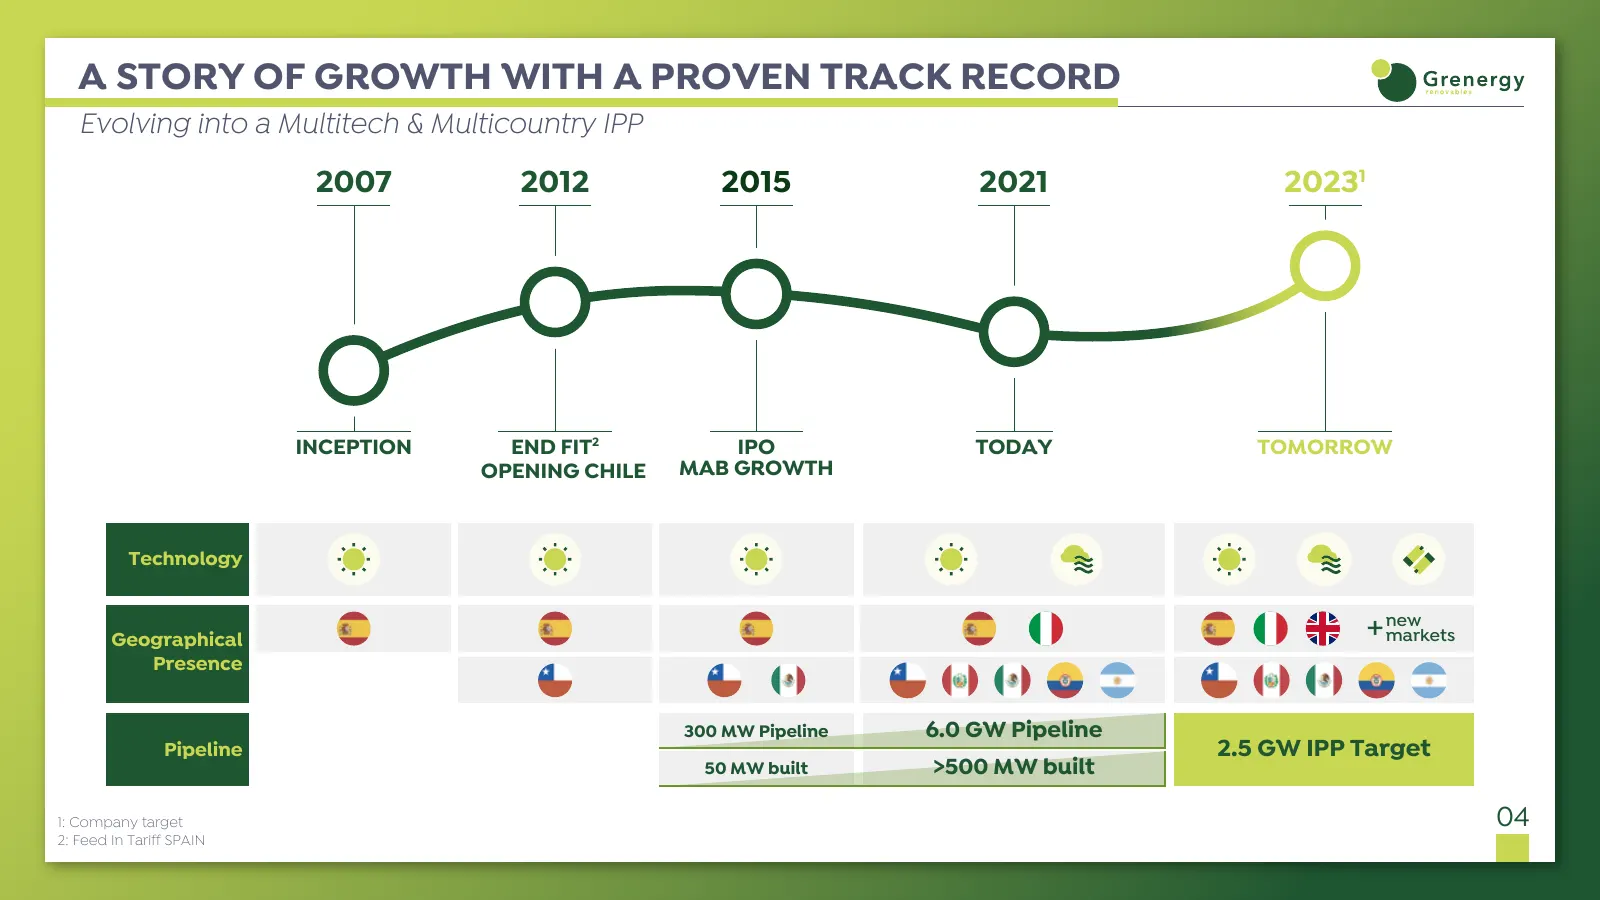
A STORY OF GROWTH WITH A PROVEN TRACK RECORD Evolving into a Multitech & Multicountry IPP 2007 2012 2015 2021 20231 INCEPTION END FIT2 IPO TODAY TOMORROW OPENING CHILE MAB GROWTH Technology Geographical + new markets Presence 300 MW Pipeline 6.0 GW Pipeline Pipeline 2.5 GW IPP Target 50 MW built >50
Slide 6: Key Figures
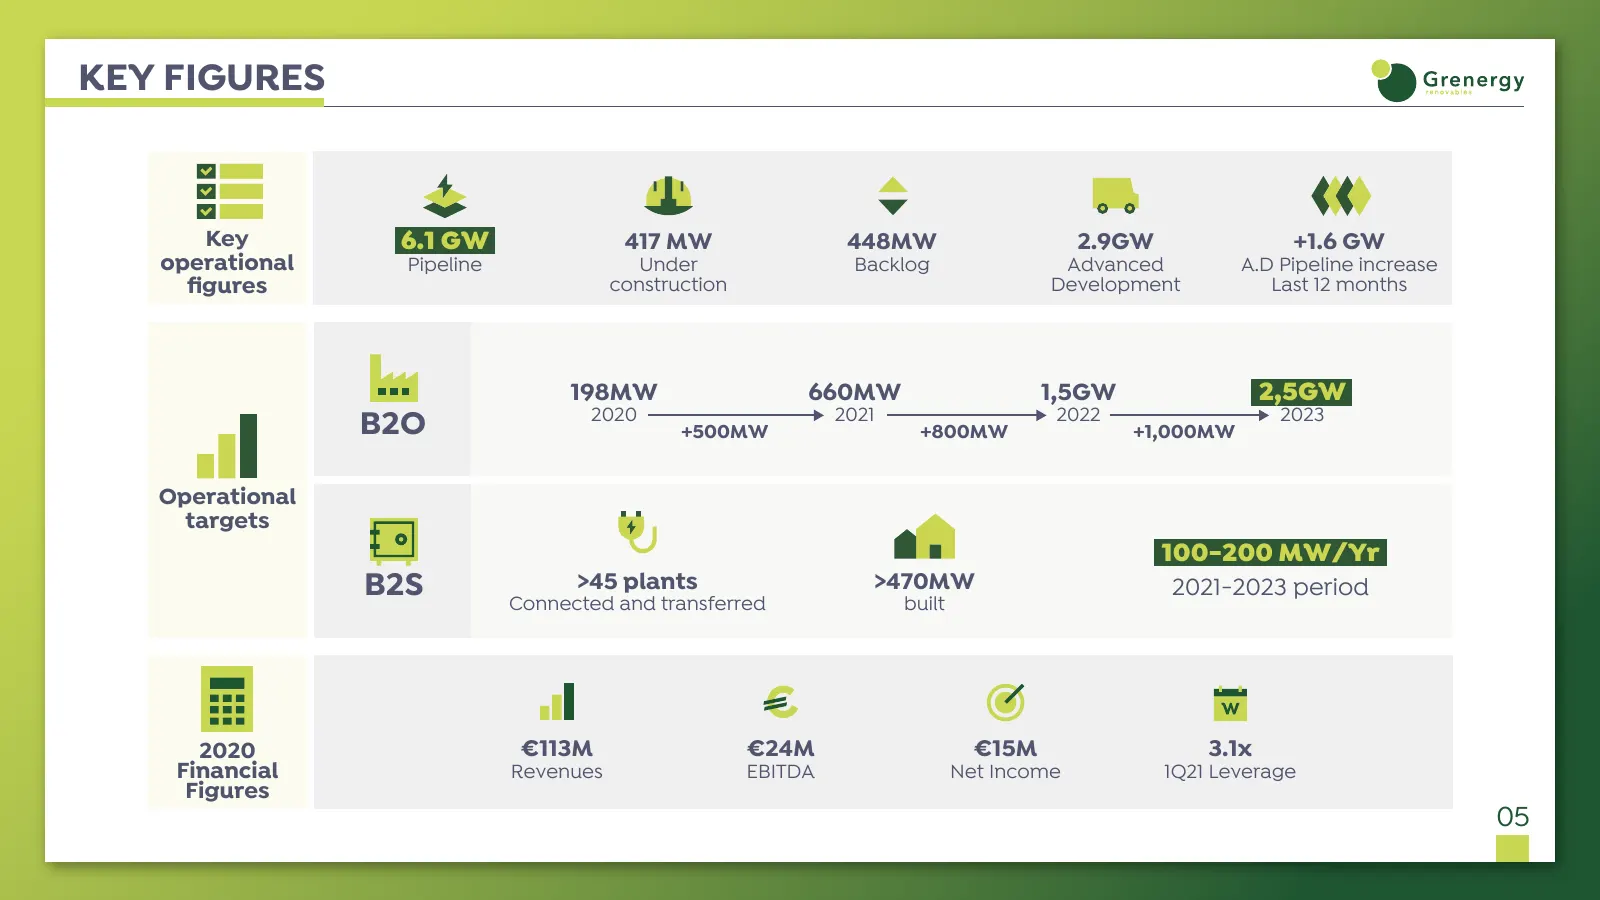
KEY FIGURES Key 6.1 GW 417 MW 448MW 2.9GW +1.6 GW operational Pipeline Under Backlog Advanced A.D Pipeline increase figures construction Development Last 12 months 198MW 660MW 1,5GW 2,5GW B2O 2020 +500MW 2021 +800MW 2022 +1,000MW 2023 Operational targets 100-200 MW/Yr B2S >45 plants Connected and tra
Slide 7: Key Investment Highlights
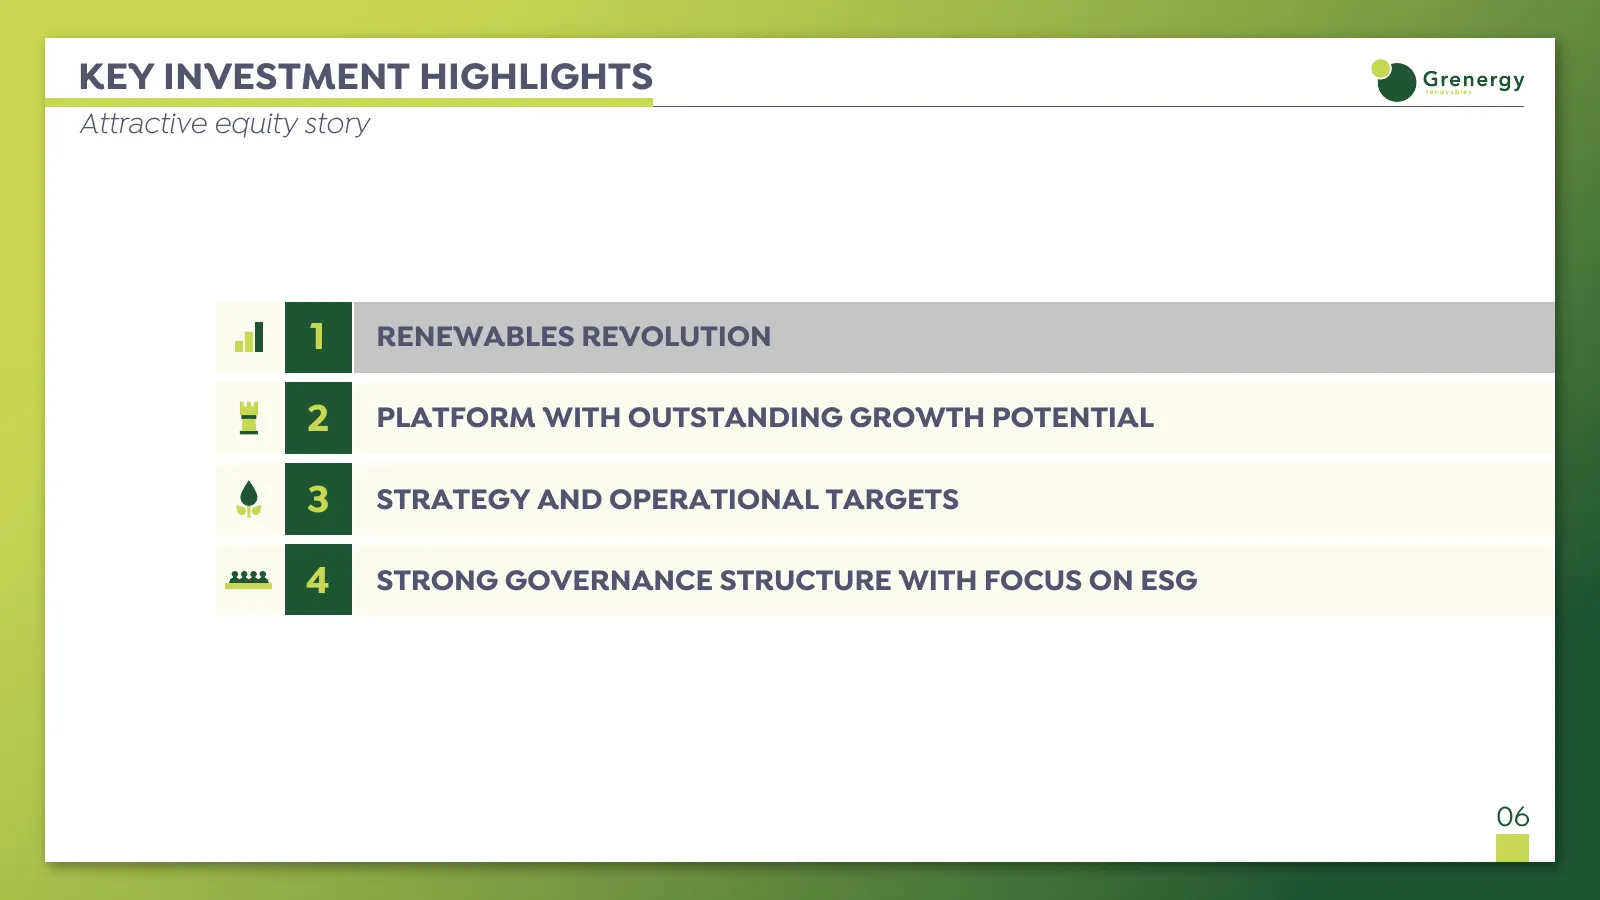
KEY INVESTMENT HIGHLIGHTS Attractive equity story 1 RENEWABLES REVOLUTION 2 PLATFORM WITH OUTSTANDING GROWTH POTENTIAL 3 STRATEGY AND OPERATIONAL TARGETS 4 STRONG GOVERNANCE STRUCTURE WITH FOCUS ON ESG 06
Slide 8: 1-Renewables Revolution
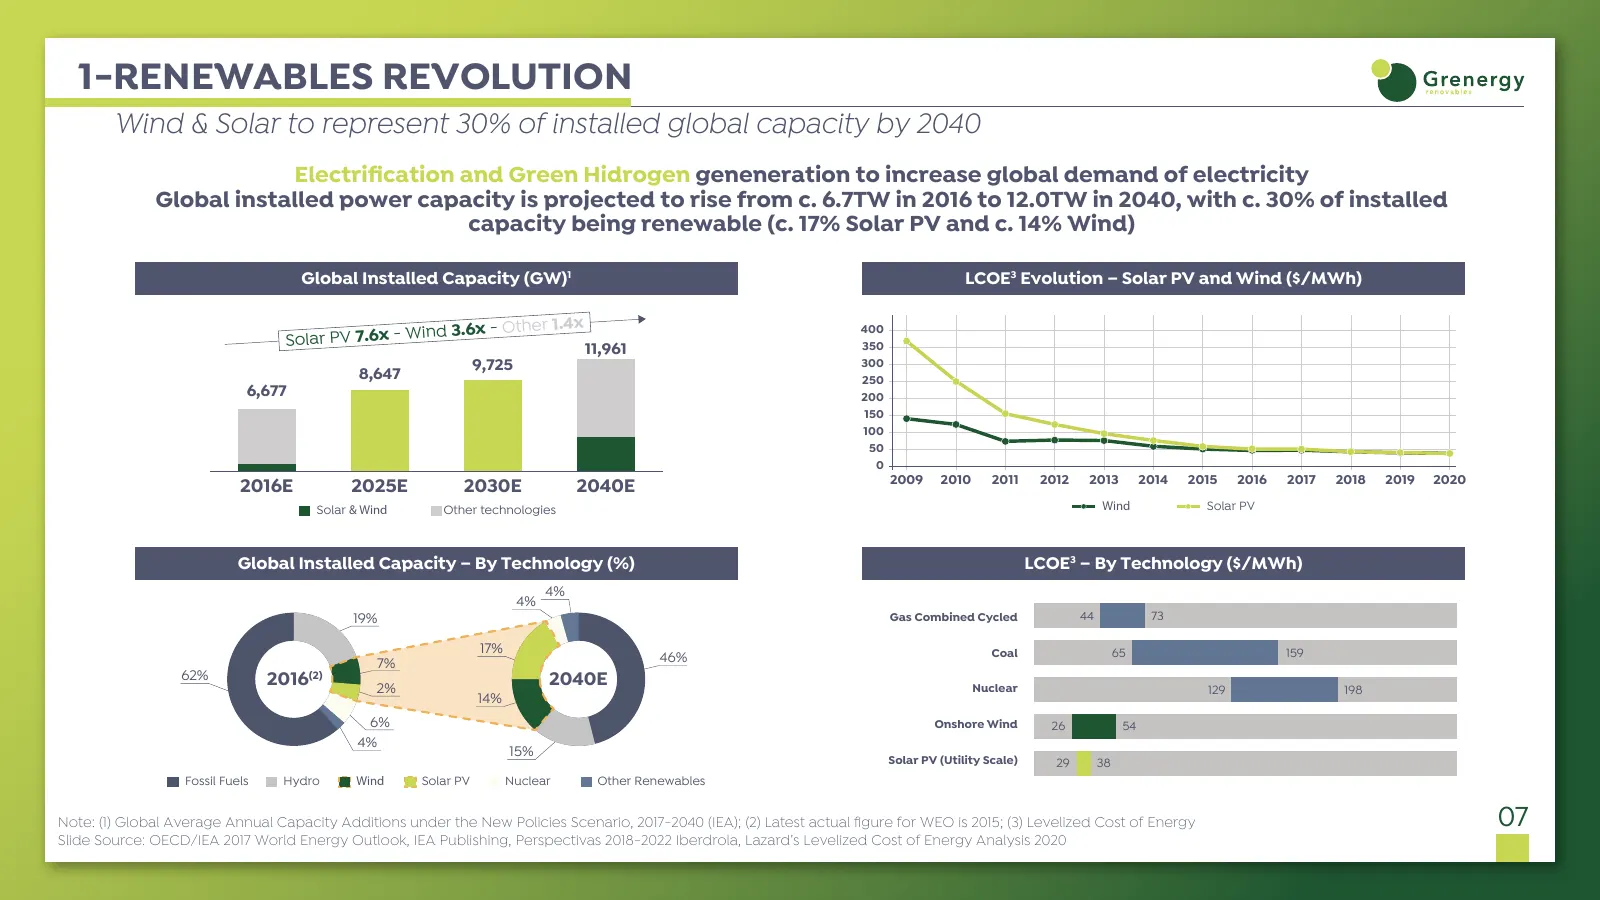
1-RENEWABLES REVOLUTION Wind & Solar to represent 30% of installed global capacity by 2040 Electrification and Green Hidrogen geneneration to increase global demand of electricity Global installed power capacity is projected to rise from c. 6.7TW in 2016 to 12.0TW in 2040, with c. 30% of installed ca
Slide 9: 1-Renewables Revolution in Europe
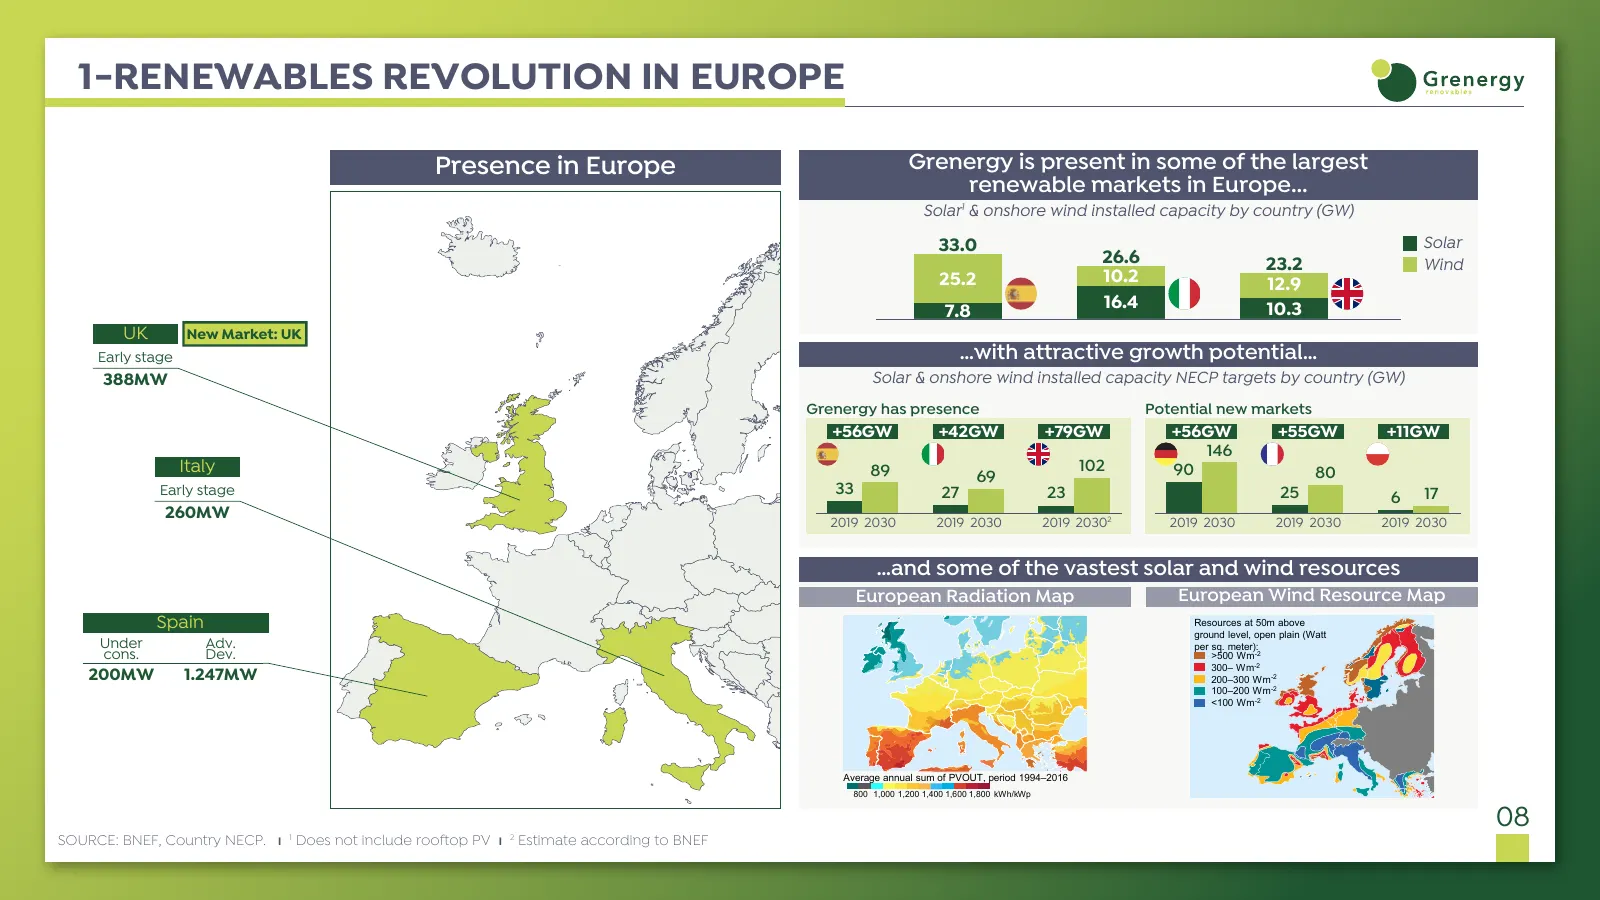
1-RENEWABLES REVOLUTION IN EUROPE Presence in Europe Grenergy is present in some of the largest renewable markets in Europe... Solar1 & onshore wind installed capacity by country (GW) 33.0 Solar 26.6 23.2 Wind 25.2 10.2 12.9 7.8 16.4 10.3 UK New Market: UK Early stage …with attractive growth potenti
Slide 10: 1-Renewables Revolution in LatAm
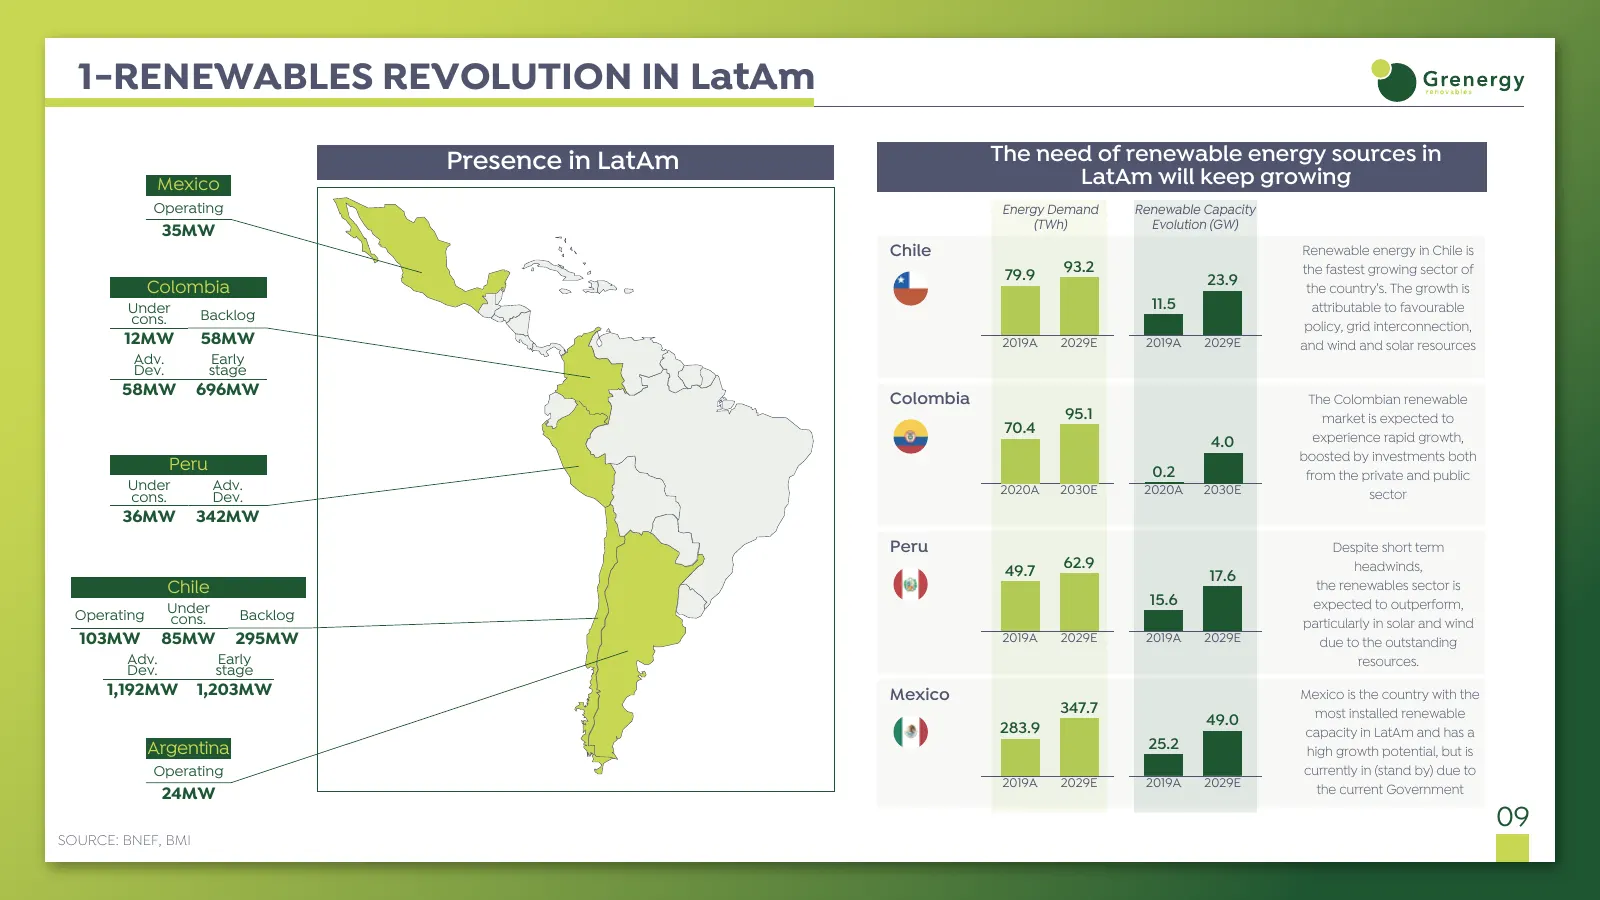
1-RENEWABLES REVOLUTION IN LatAm Presence in LatAm The need of renewable energy sources in Mexico LatAm will keep growing Operating Energy Demand Renewable Capacity 35MW (TWh) Evolution (GW) Chile Renewable energy in Chile is 79.9 93.2 the fastest growing sector of Colombia 23.9 the country’s. The g
Slide 11: Key Investment Highlights
KEY INVESTMENT HIGHLIGHTS Attractive equity story 1 RENEWABLES REVOLUTION 2 PLATFORM WITH OUTSTANDING GROWTH POTENTIAL 3 STRATEGY AND OPERATIONAL TARGETS 4 STRONG GOVERNANCE STRUCTURE WITH FOCUS ON ESG 10
Slide 12: 2-Pipeline Update
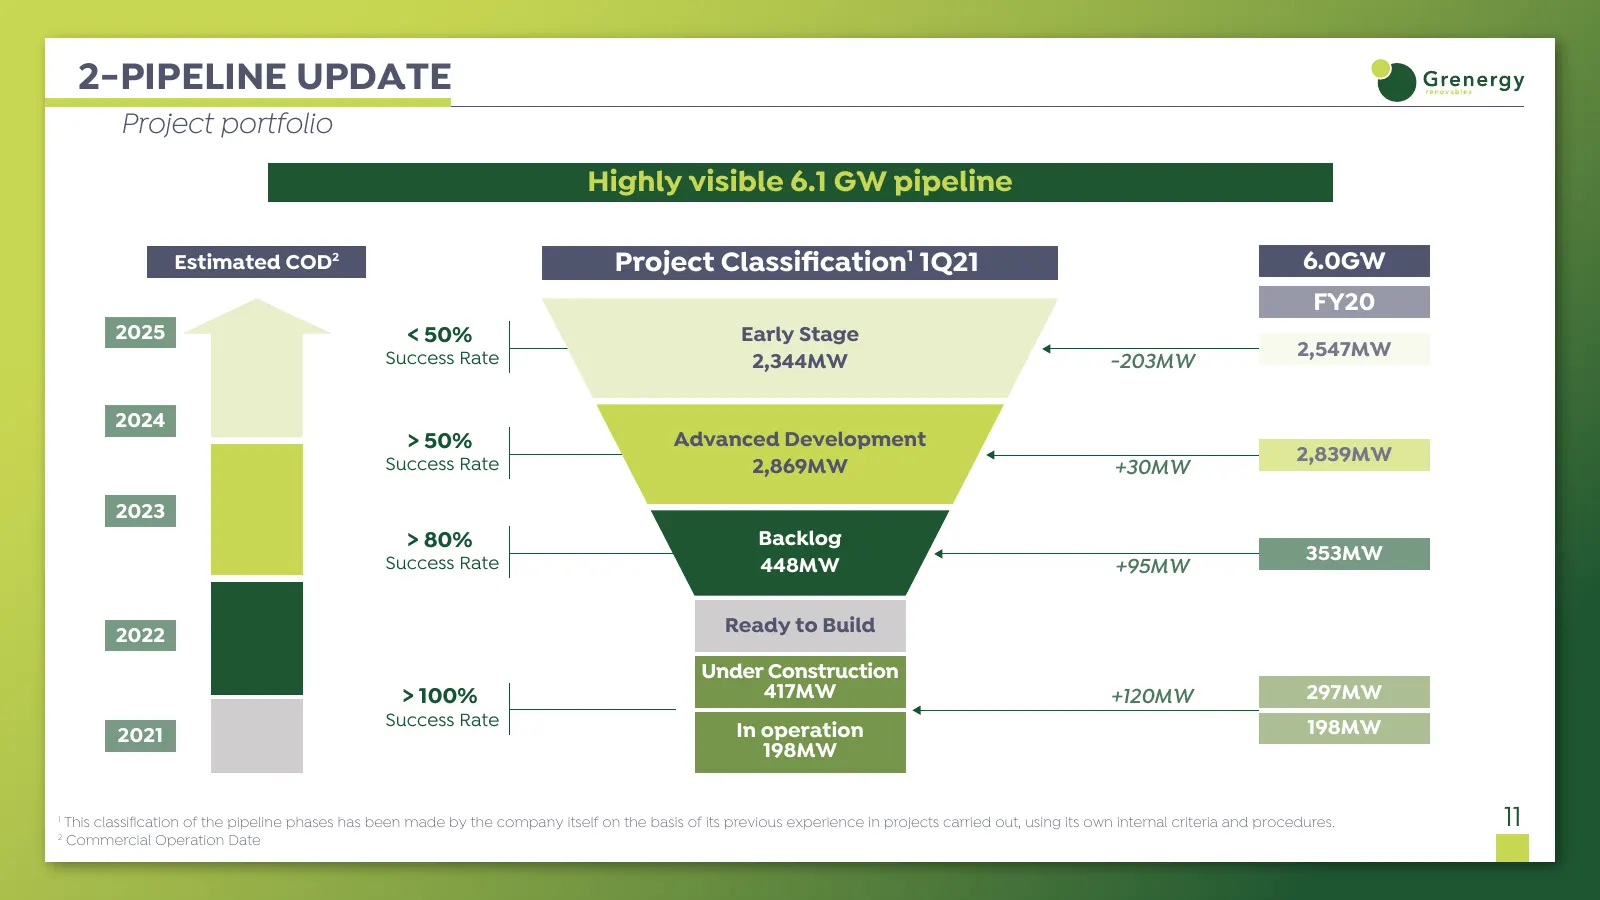
2-PIPELINE UPDATE Project portfolio Highly visible 6.1 GW pipeline Estimated COD2 Project Classification1 1Q21 6.0GW FY20 2025 < 50% Early Stage 2,547MW Success Rate 2,344MW -203MW 2024 > 50% Advanced Development 2,839MW Success Rate 2,869MW +30MW 2023 > 80% Backlog 353MW Success Rate 448MW +95MW 202
Slide 13: 2-Pipeline Update
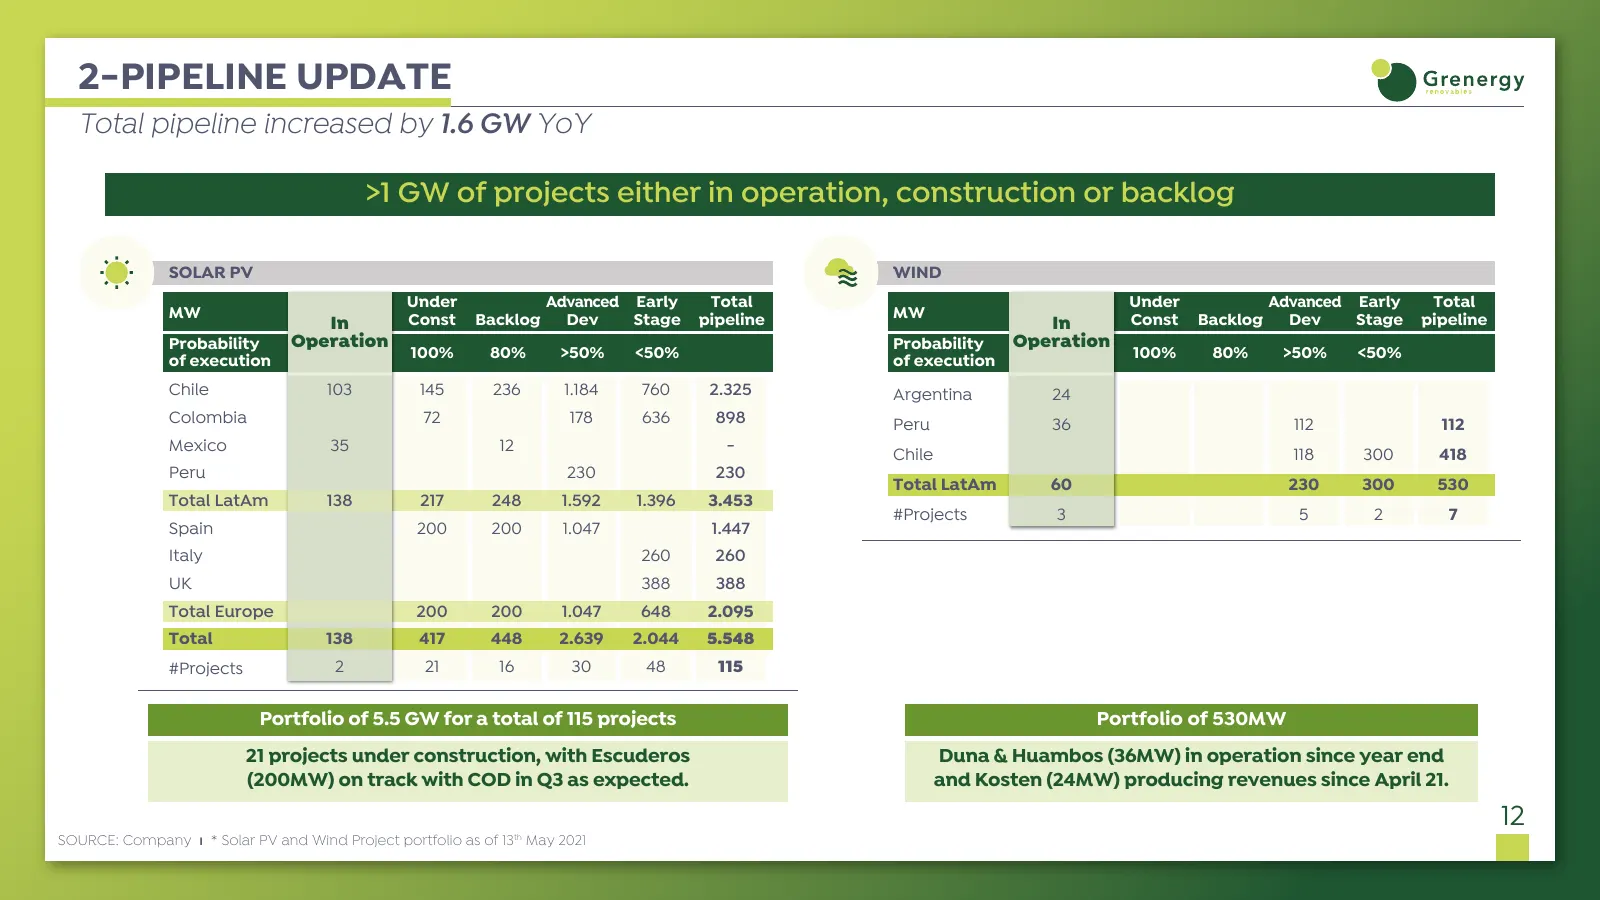
2-PIPELINE UPDATE Total pipeline increased by 1.6 GW YoY >1 GW of projects either in operation, construction or backlog SOLAR PV WIND Under Advanced Early Total Under Advanced Early Total MW Const Backlog Dev Stage pipeline MW Const Backlog Dev Stage pipeline In In Probability Operation Probability
Slide 14: Projects Under Construction & Backlog
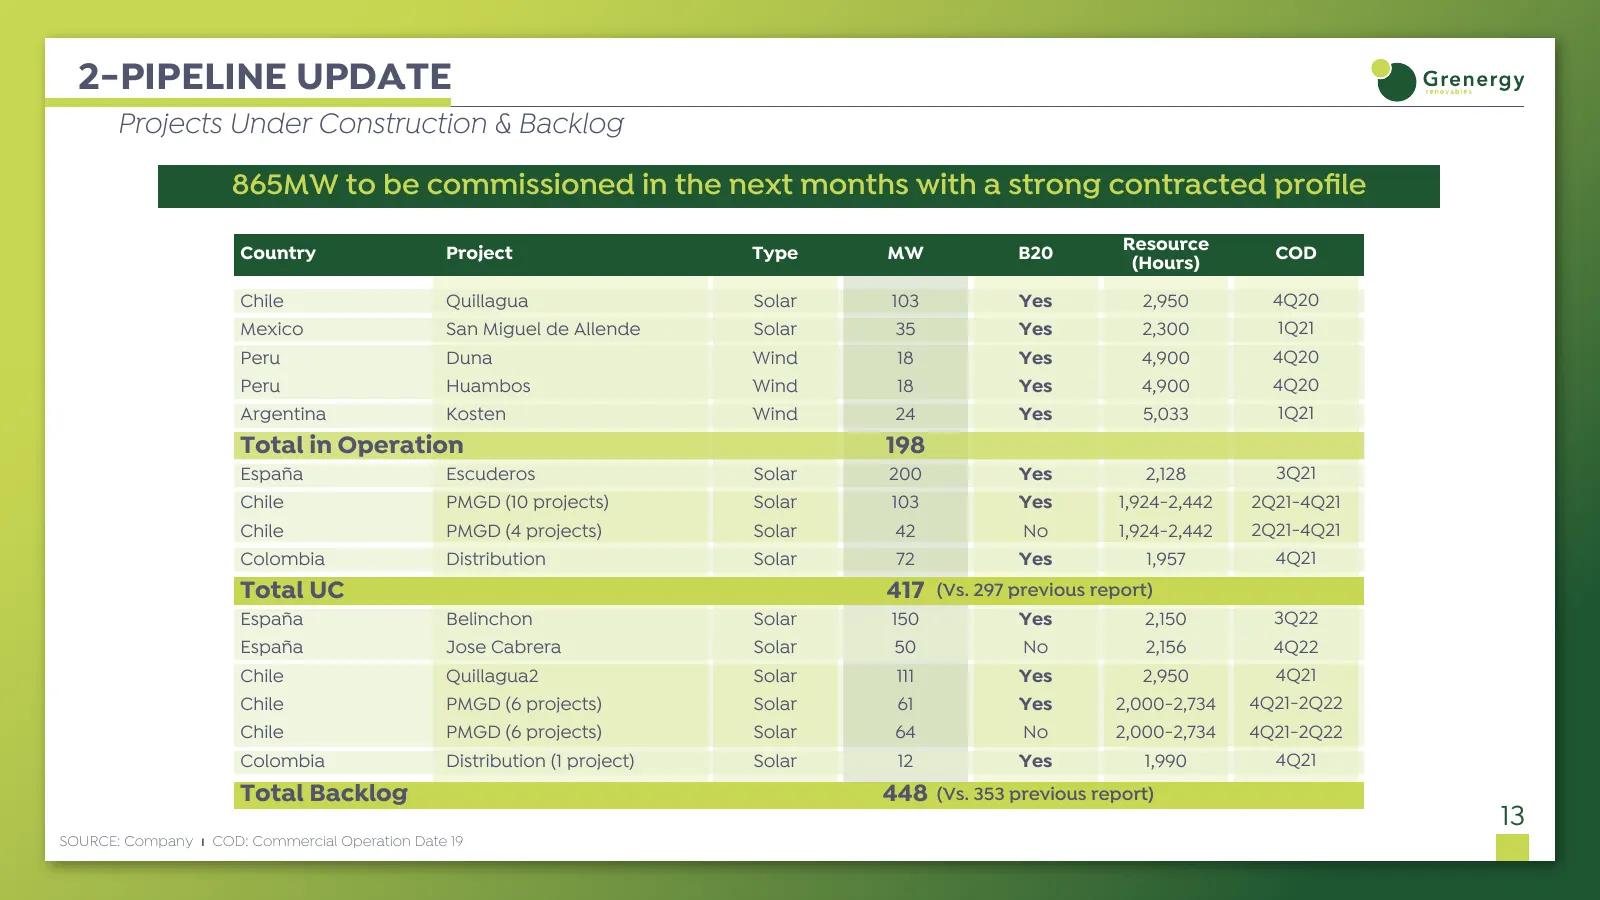
2-PIPELINE UPDATE Projects Under Construction & Backlog 865MW to be commissioned in the next months with a strong contracted profile Country Project Type MW B20 Resource COD (Hours) Chile Quillagua Solar 103 Yes 2,950 4Q20 Mexico San Miguel de Allende Solar 35 Yes 2,300 1Q21 Peru Duna Wind 18 Yes 4,
Slide 15: Projects in Advanced Development
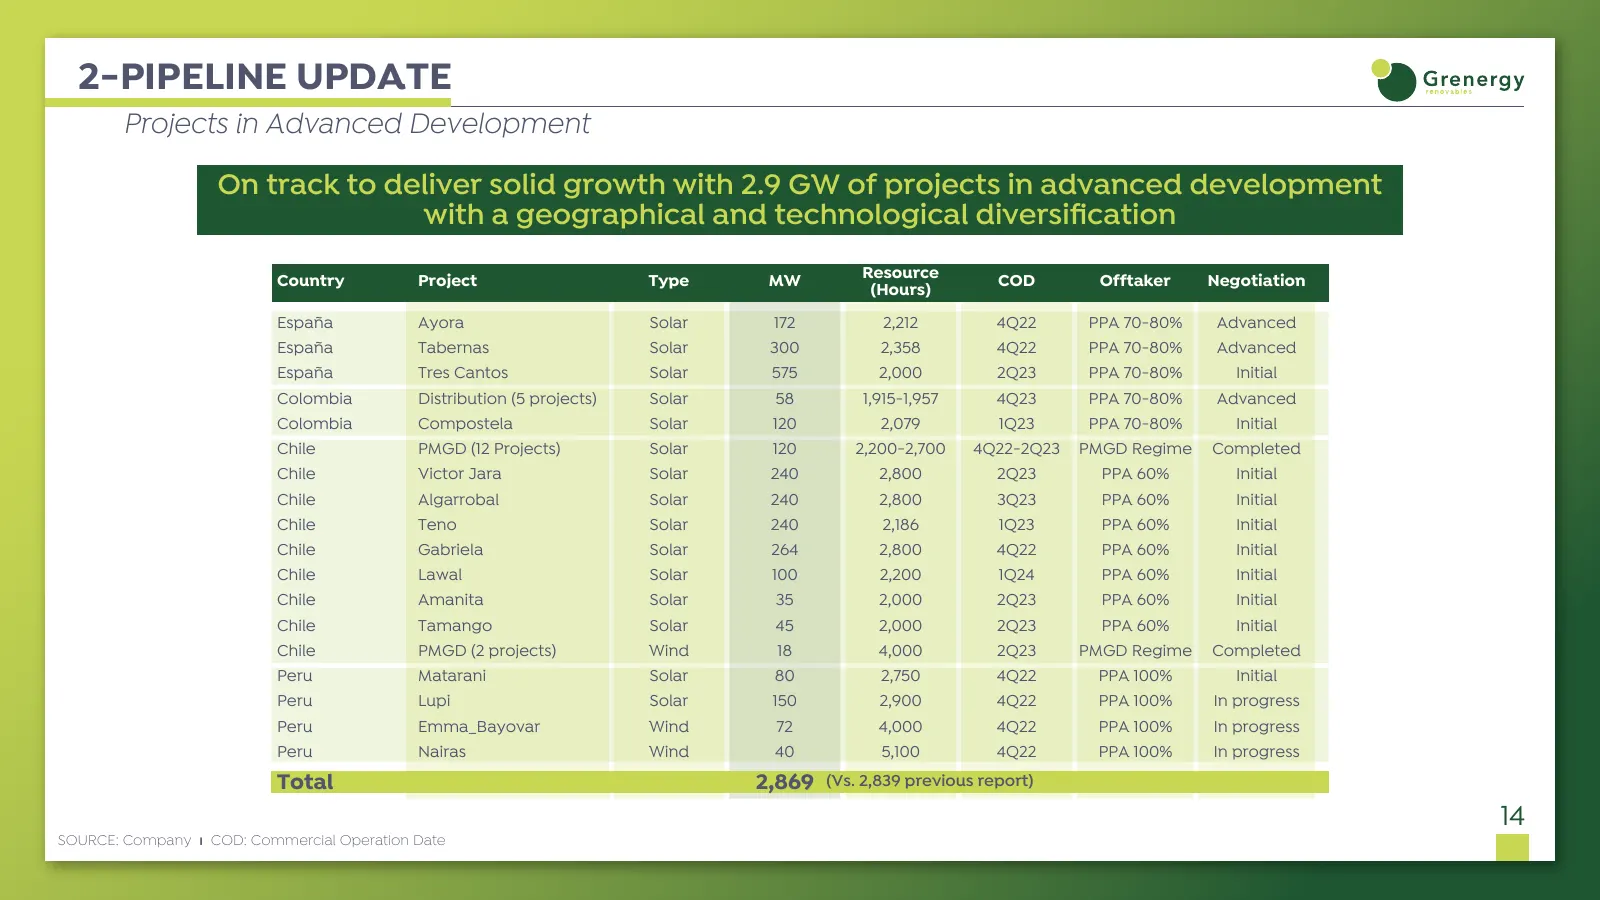
2-PIPELINE UPDATE Projects in Advanced Development On track to deliver solid growth with 2.9 GW of projects in advanced development with a geographical and technological diversification Resource Country Project Type MW COD Offtaker Negotiation (Hours) España Ayora Solar 172 2,212 4Q22 PPA 70-80% Adv
Slide 16: Focus - Solar PV Capex
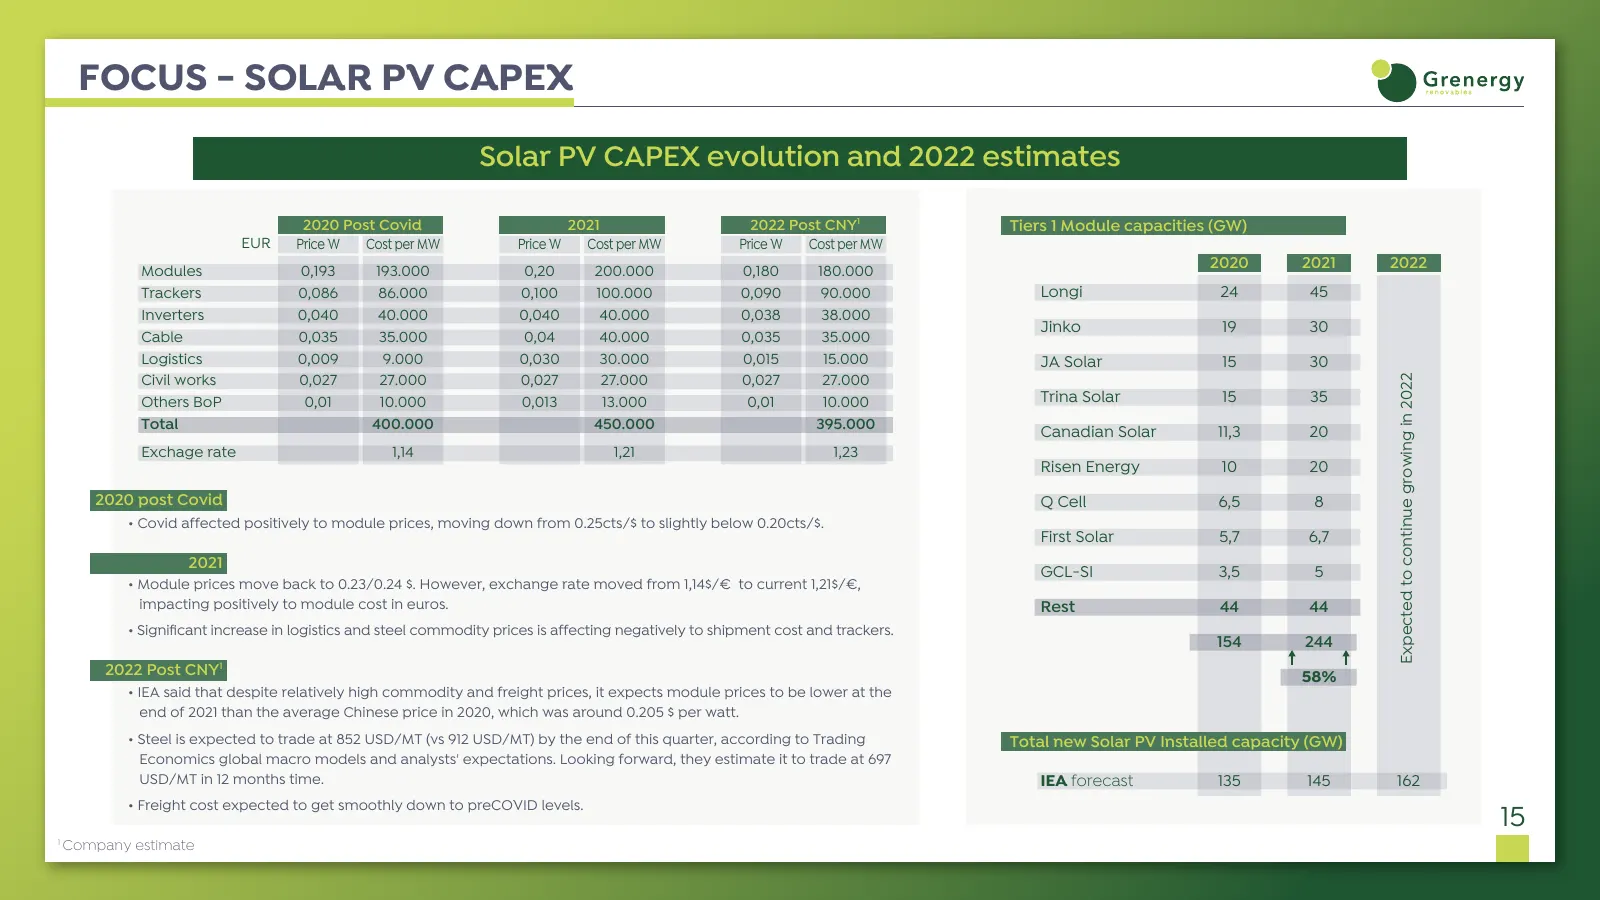
FOCUS - SOLAR PV CAPEX Solar PV CAPEX evolution and 2022 estimates 2020 Post Covid 2021 2022 Post CNY1 Tiers 1 Module capacities (GW) EUR Price W Cost per MW Price W Cost per MW Price W Cost per MW Modules 0,193 193.000 0,20 200.000 0,180 180.000 2020 2021 2022 Trackers 0,086 86.000 0,100 100.000 0,
Slide 17: Key Investment Highlights
KEY INVESTMENT HIGHLIGHTS Attractive equity story 1 RENEWABLES REVOLUTION 2 PLATFORM WITH OUTSTANDING GROWTH POTENTIAL 3 STRATEGY AND OPERATIONAL TARGETS 4 STRONG GOVERNANCE STRUCTURE WITH FOCUS ON ESG 16
Slide 18: Strategy and Operational Targets - B2O
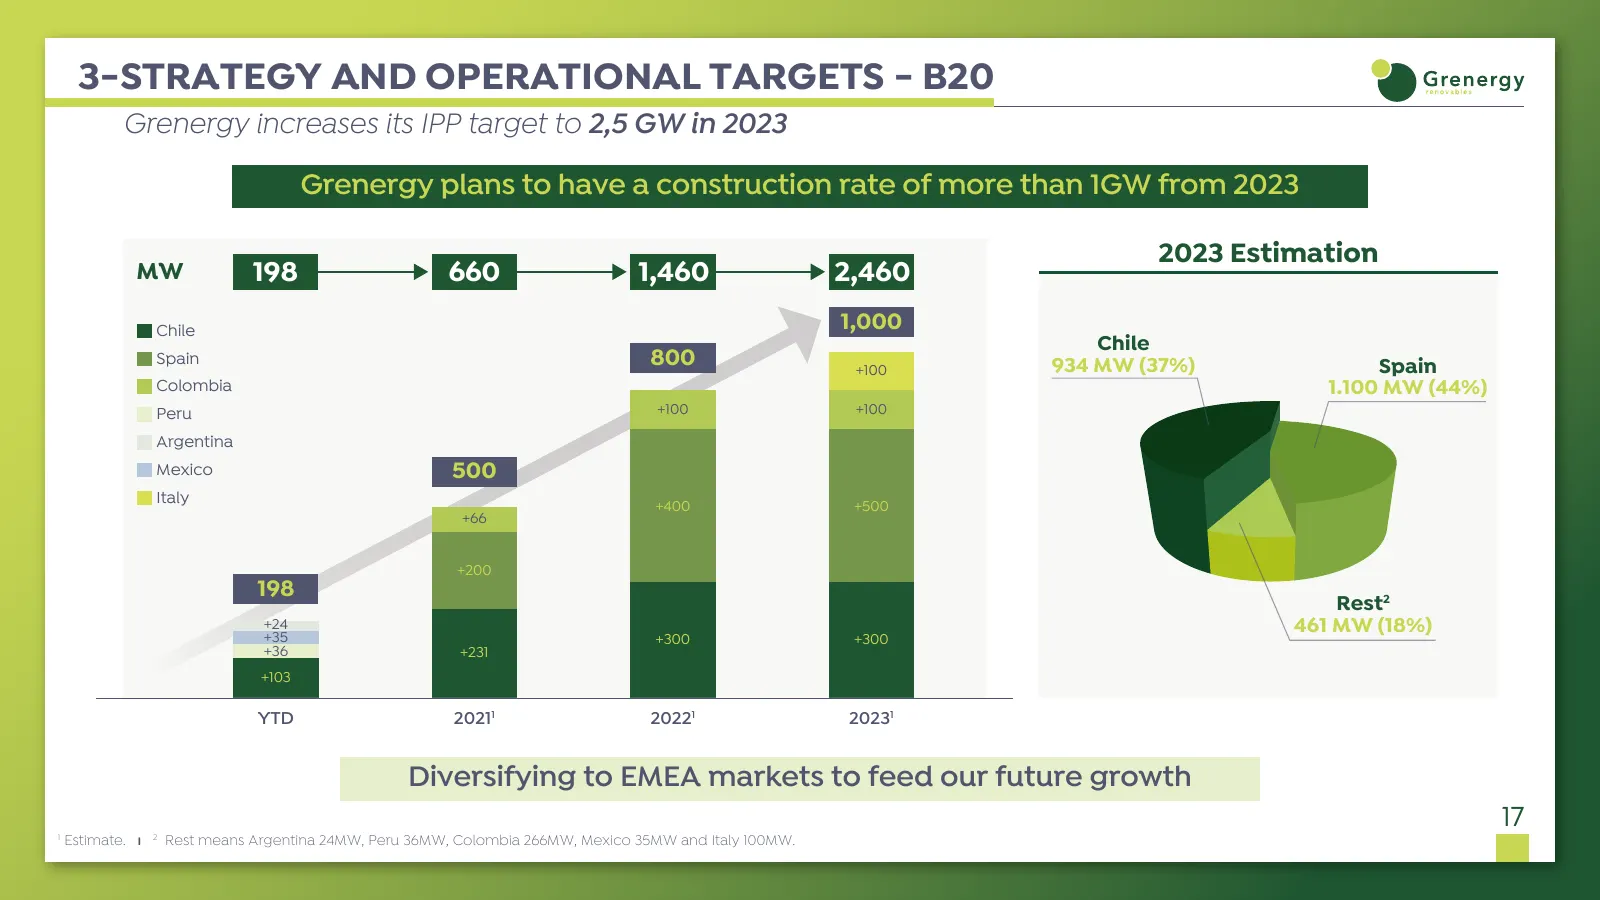
3-STRATEGY AND OPERATIONAL TARGETS - B20 Grenergy increases its IPP target to 2,5 GW in 2023 Grenergy plans to have a construction rate of more than 1GW from 2023 2023 Estimation MW 198 660 1,460 2,460 Chile 1,000 Chile Spain 800 +100 934 MW (37%) Spain Colombia 1.100 MW (44%) Peru +100 +100 Argenti
Slide 19: Strategy and Operational Targets - B2O
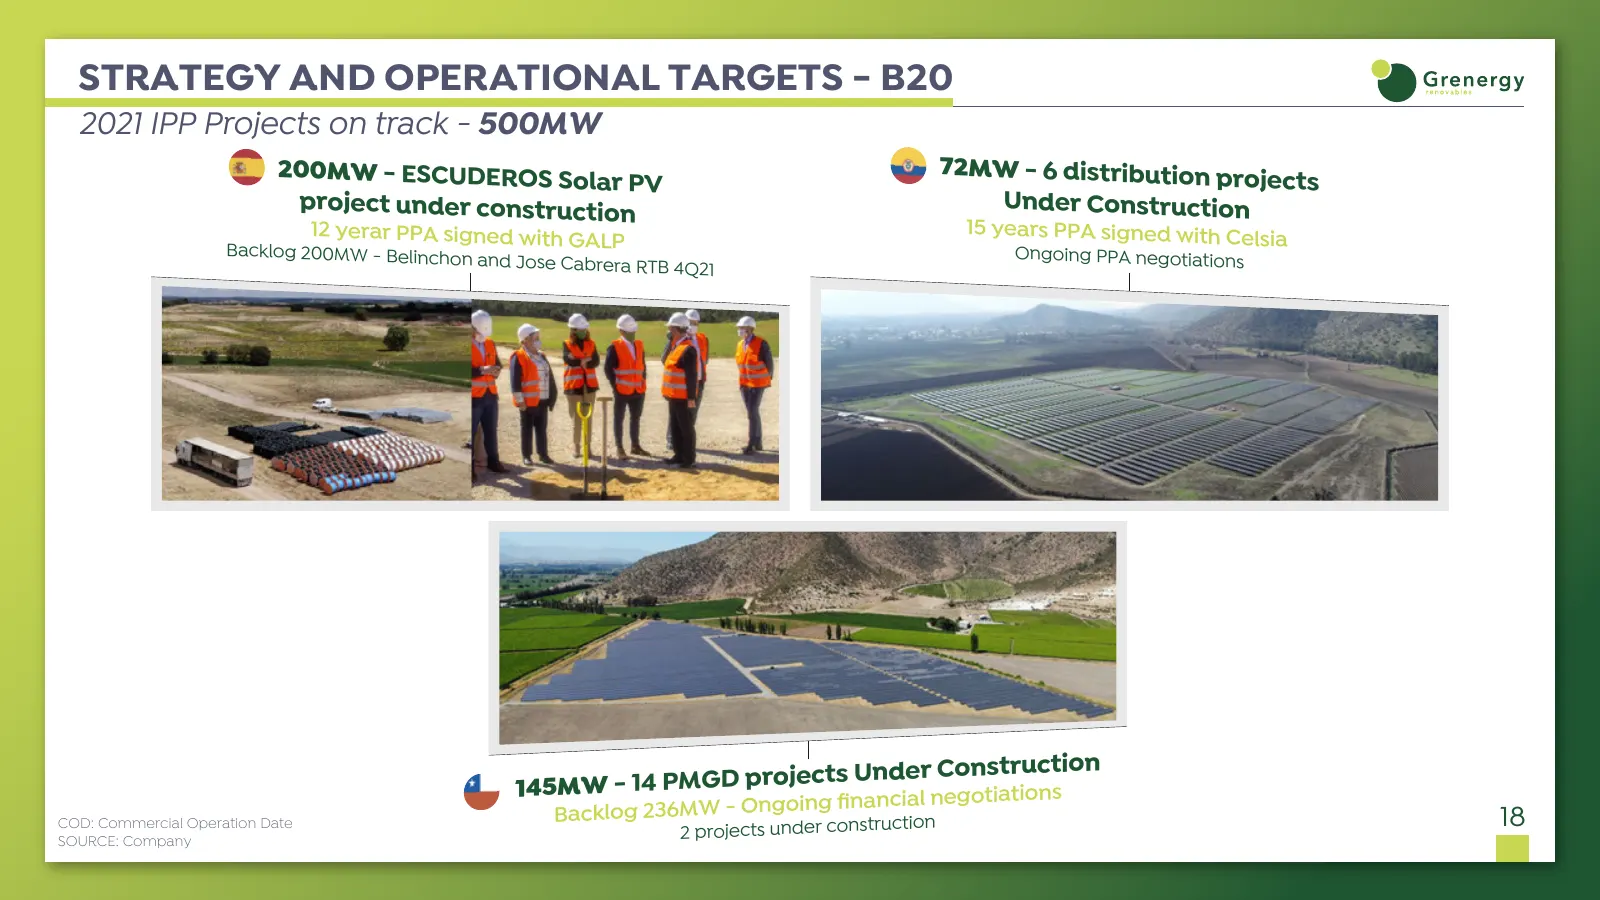
STRATEGY AND OPERATIONAL TARGETS - B20 2021 IPP Projects on track - 500MW 200MW - ESCUDEROS Sola 72MW - 6 distribution proj r PV ects project under constructio Under Construction n 15 years PPA signed with Ce 12 yerar PPA signed with GA lsia Backlog 200MW - Belincho LP Ongoing PPA negotiations n and
Slide 20: Built to Own: D&C Margin Covering Equity
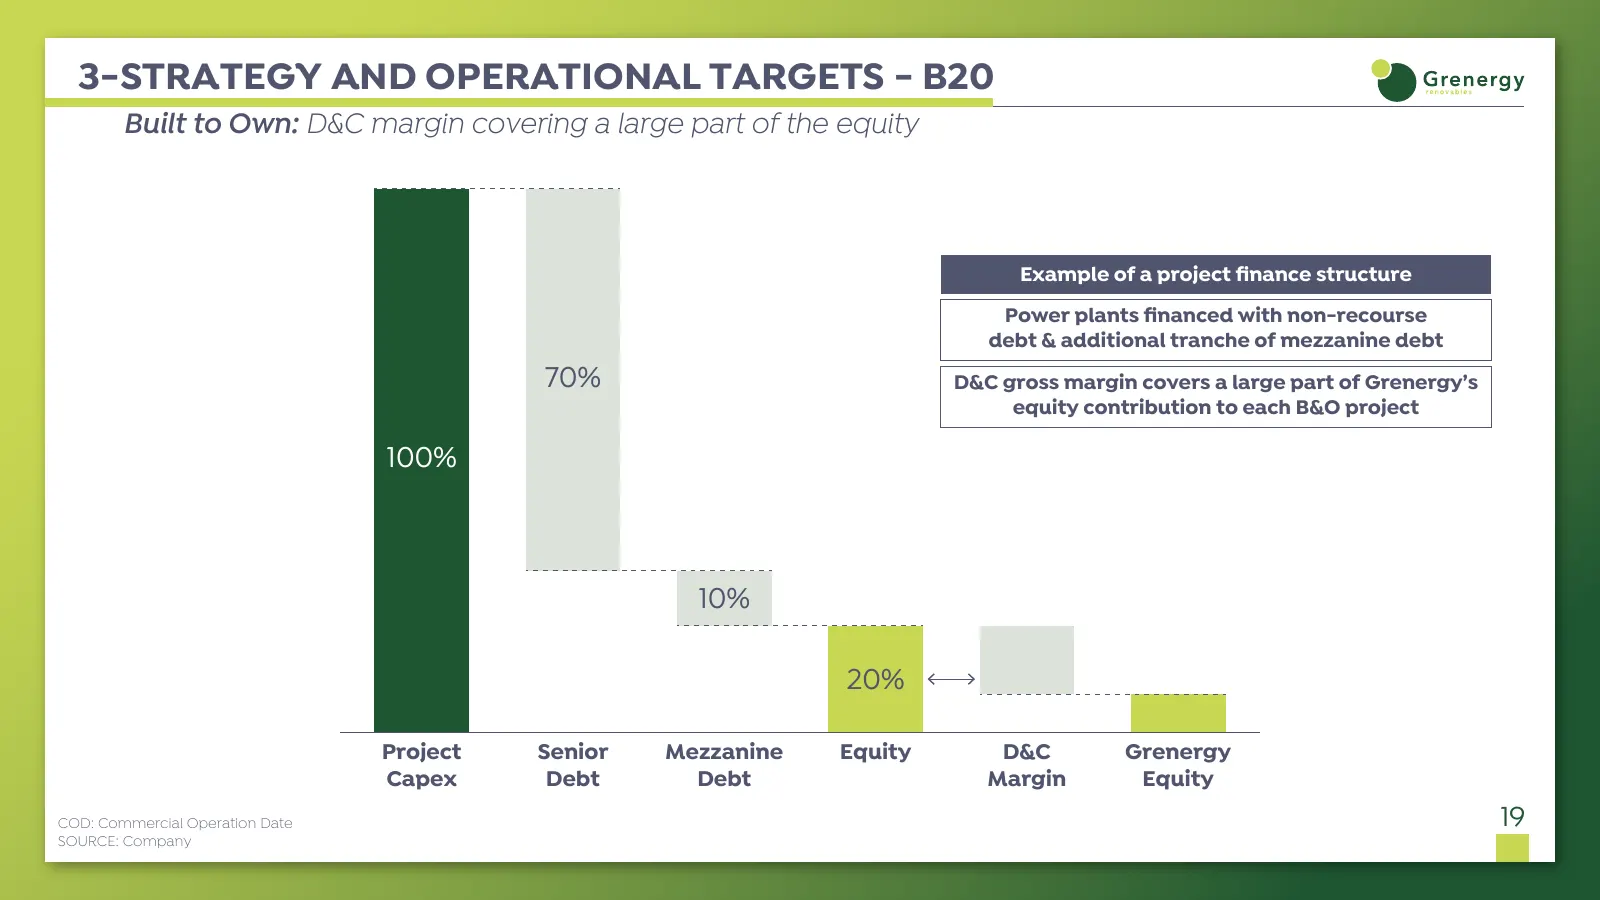
3-STRATEGY AND OPERATIONAL TARGETS - B20 Built to Own: D&C margin covering a large part of the equity Example of a project finance structure Power plants financed with non-recourse debt & additional tranche of mezzanine debt 70% D&C gross margin covers a large part of Grenergy’s equity contribution to
Slide 21: Focus: Structured Finance
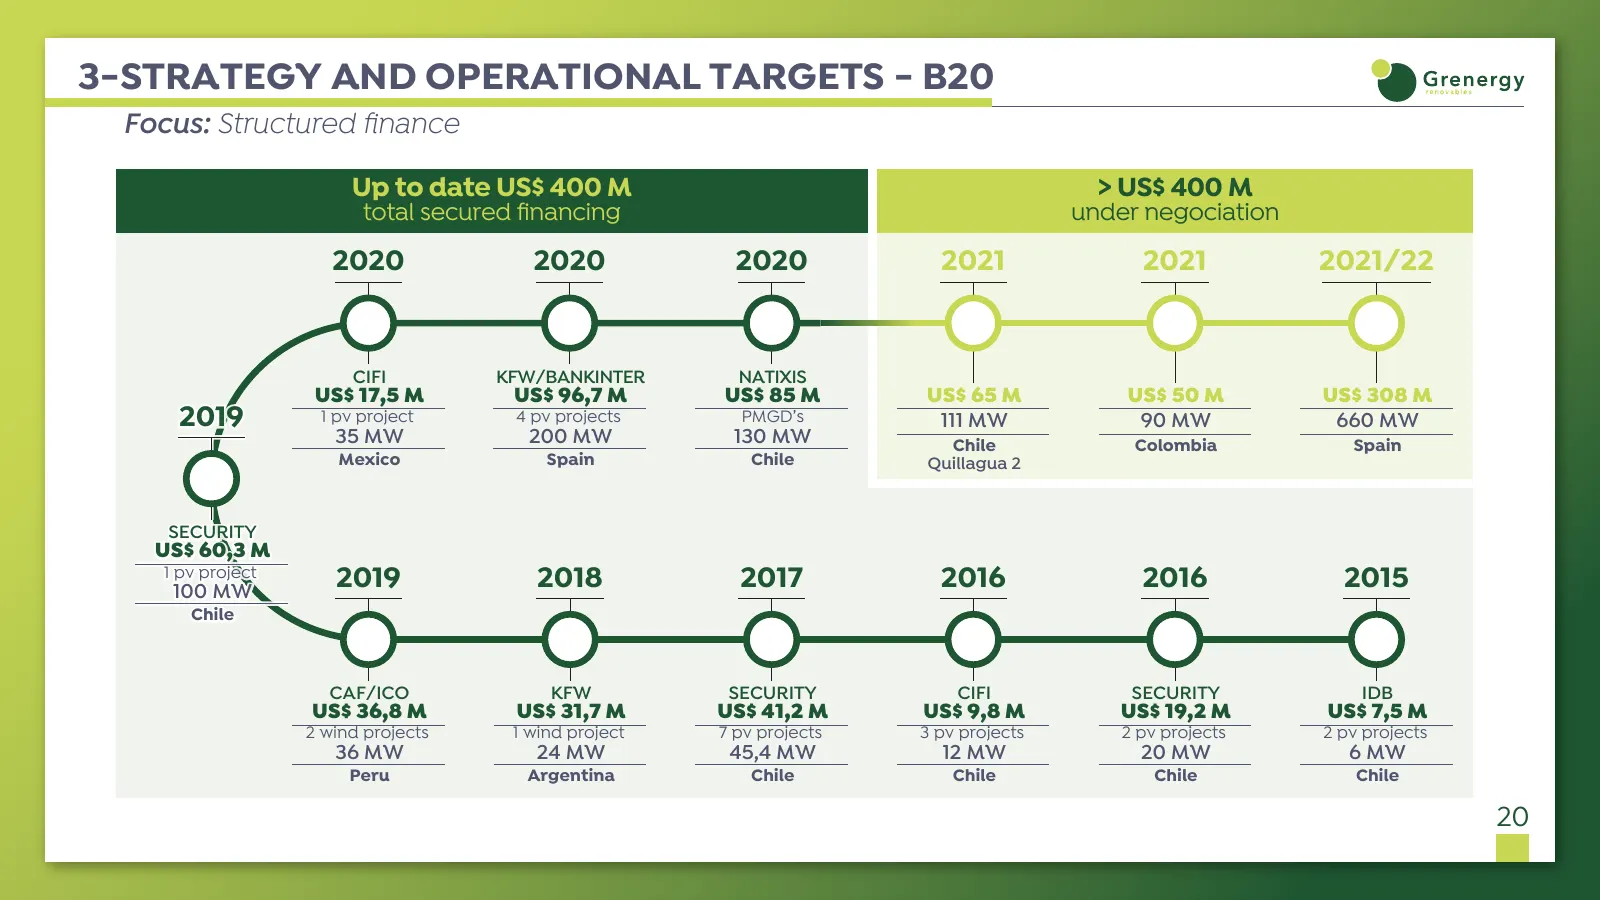
3-STRATEGY AND OPERATIONAL TARGETS - B20 Focus: Structured finance Up to date US$ 400 M > US$ 400 M total secured financing under negociation 2020 2020 2020 2021 2021 2021/22 CIFI KFW/BANKINTER NATIXIS US$ 17,5 M US$ 96,7 M US$ 85 M US$ 65 M US$ 50 M US$ 308 M 2019 1 pv project 4 pv projects PMGD’s
Slide 22: Strategy and Operational Targets - B2S
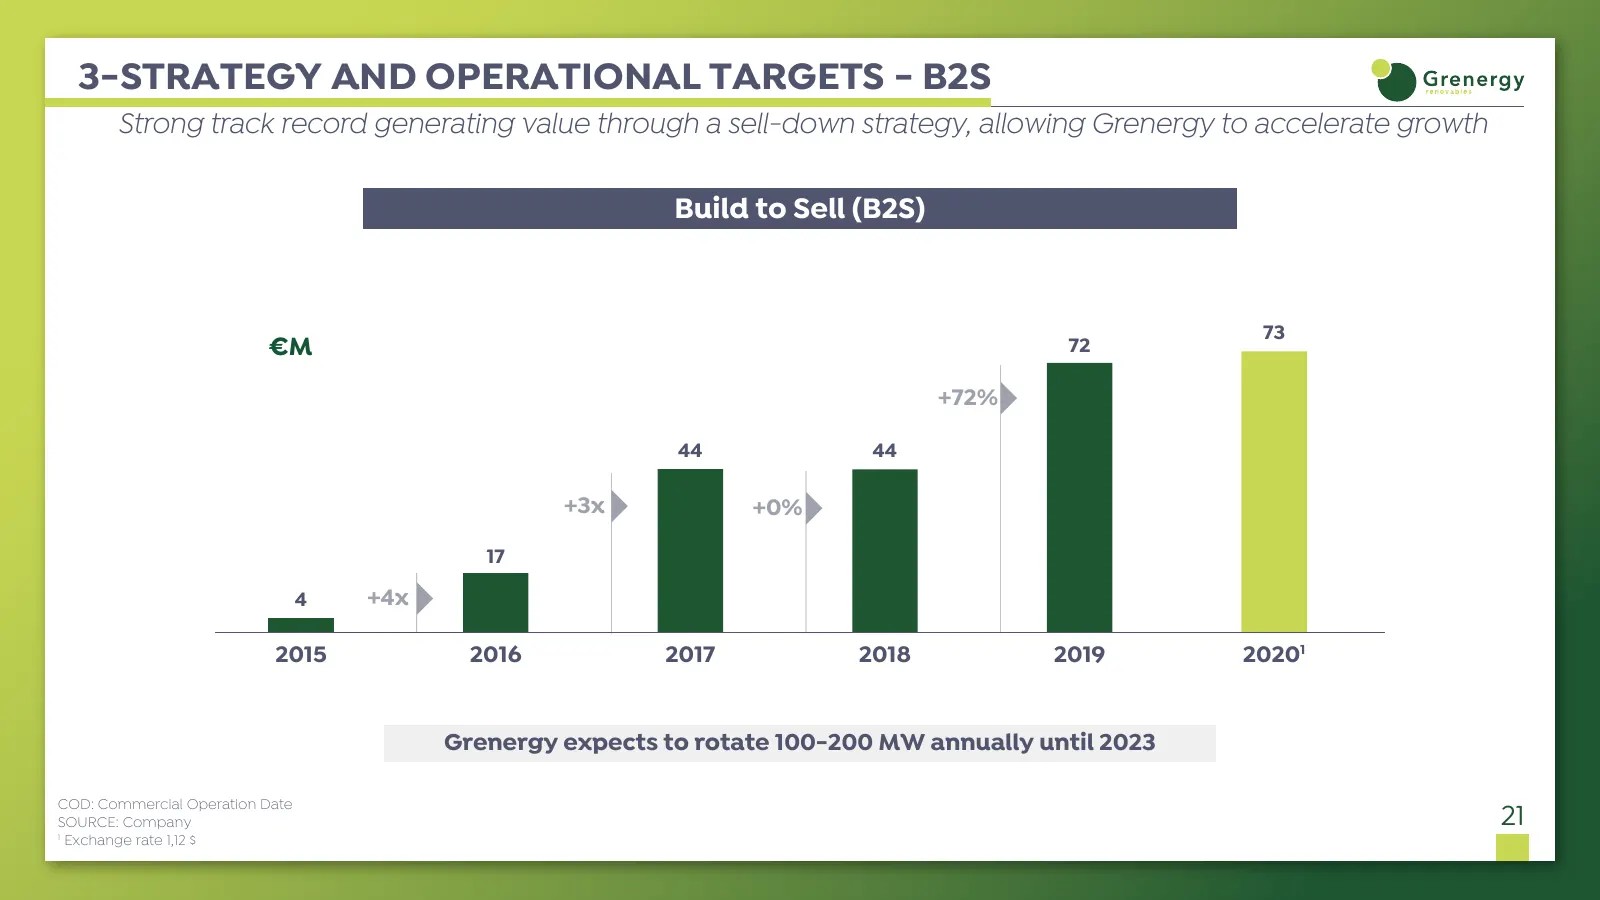
3-STRATEGY AND OPERATIONAL TARGETS - B2S Strong track record generating value through a sell-down strategy, allowing Grenergy to accelerate growth Build to Sell (B2S) 73 €M 72 +72% 44 44 +3x +0% 17 4 +4x 2015 2016 2017 2018 2019 20201 Grenergy expects to rotate 100-200 MW annually until 2023 COD: Co
Slide 23: Key Investment Highlights
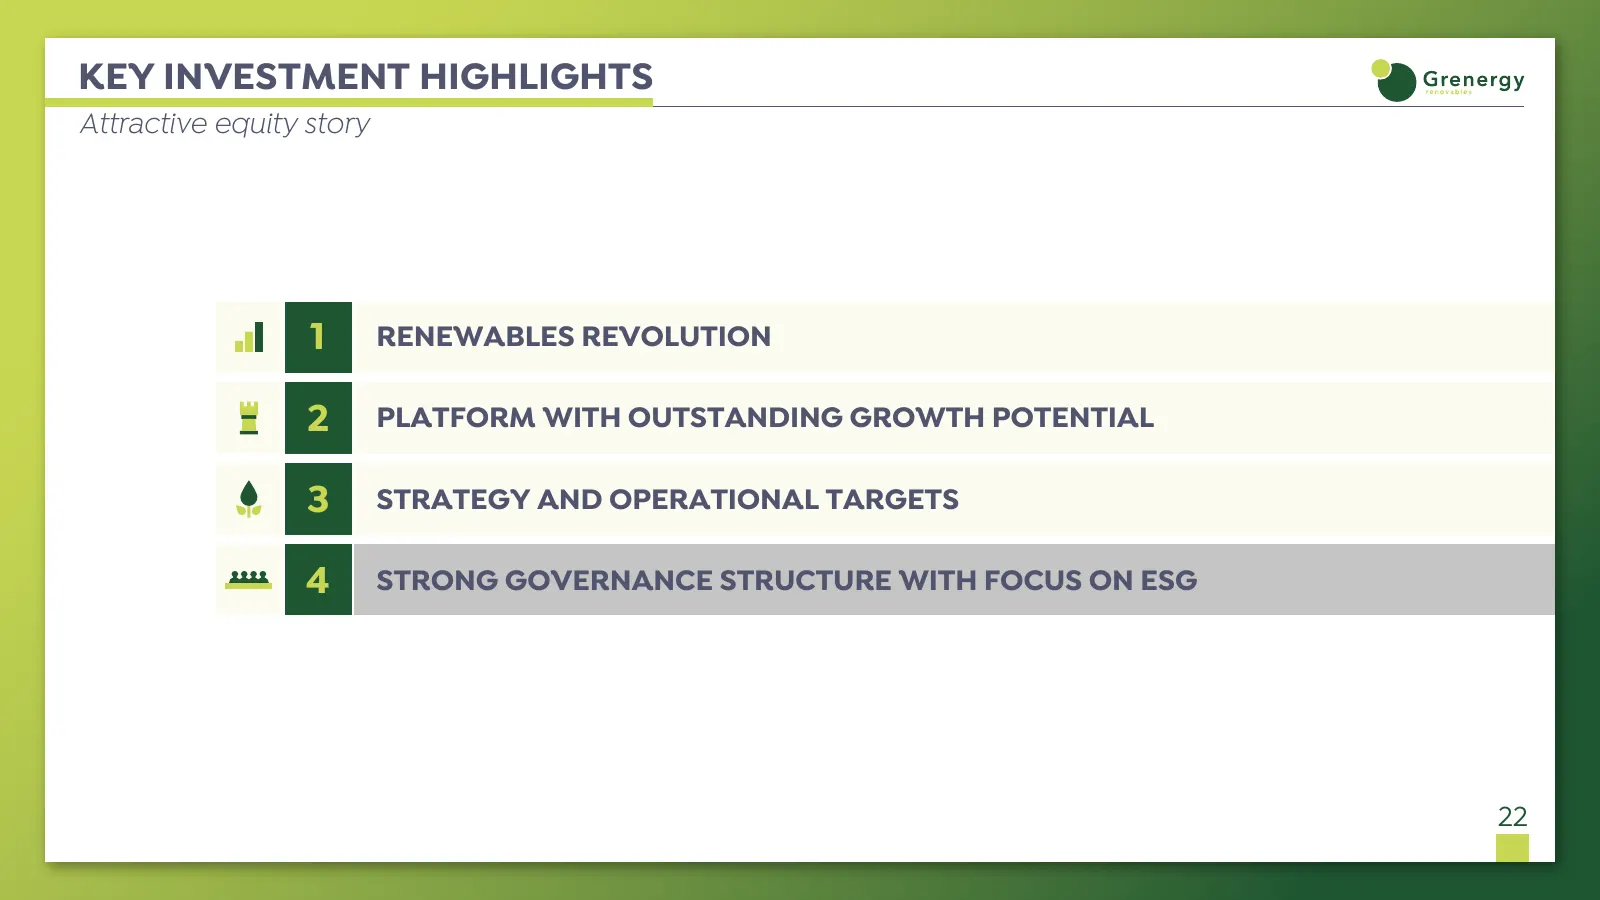
KEY INVESTMENT HIGHLIGHTS Attractive equity story 1 RENEWABLES REVOLUTION 2 PLATFORM WITH OUTSTANDING GROWTH POTENTIAL 3 STRATEGY AND OPERATIONAL TARGETS 4 STRONG GOVERNANCE STRUCTURE WITH FOCUS ON ESG 22
Slide 24: Strong Governance with Focus on ESG
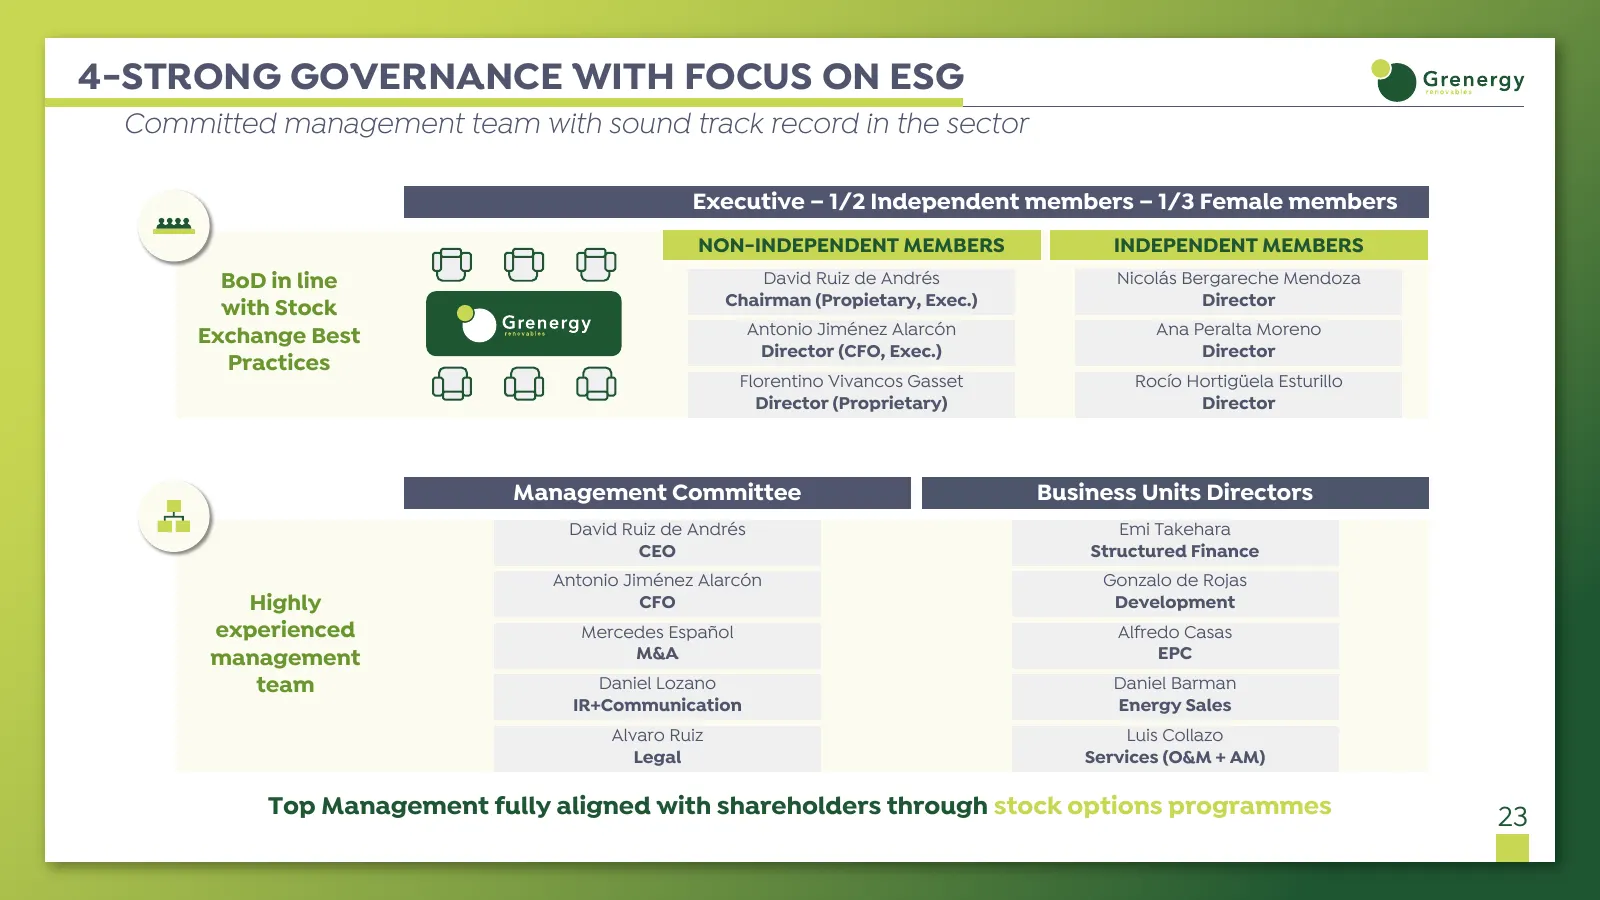
4-STRONG GOVERNANCE WITH FOCUS ON ESG Committed management team with sound track record in the sector Executive – 1/2 Independent members – 1/3 Female members NON-INDEPENDENT MEMBERS INDEPENDENT MEMBERS BoD in line David Ruiz de Andrés Nicolás Bergareche Mendoza Chairman (Propietary, Exec.) Director
Slide 25: ESG Action Plan - 2023 Roadmap
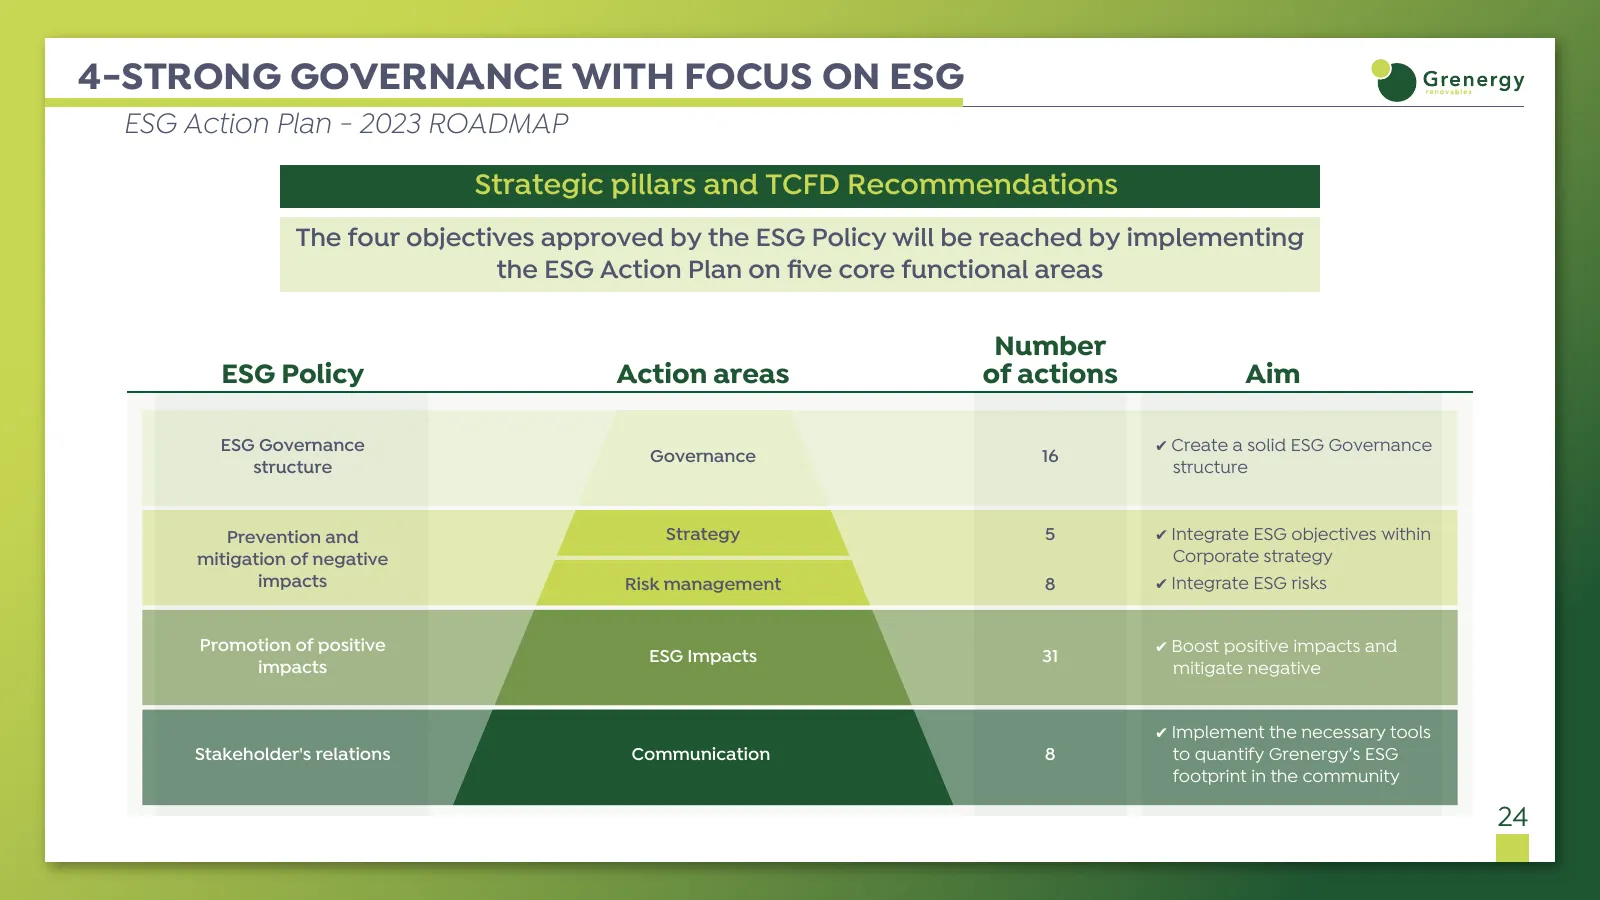
4-STRONG GOVERNANCE WITH FOCUS ON ESG ESG Action Plan - 2023 ROADMAP Strategic pillars and TCFD Recommendations The four objectives approved by the ESG Policy will be reached by implementing the ESG Action Plan on five core functional areas Number ESG Policy Action areas of actions Aim ESG Governanc
Slide 26: ESG - Carbon Footprint 2020
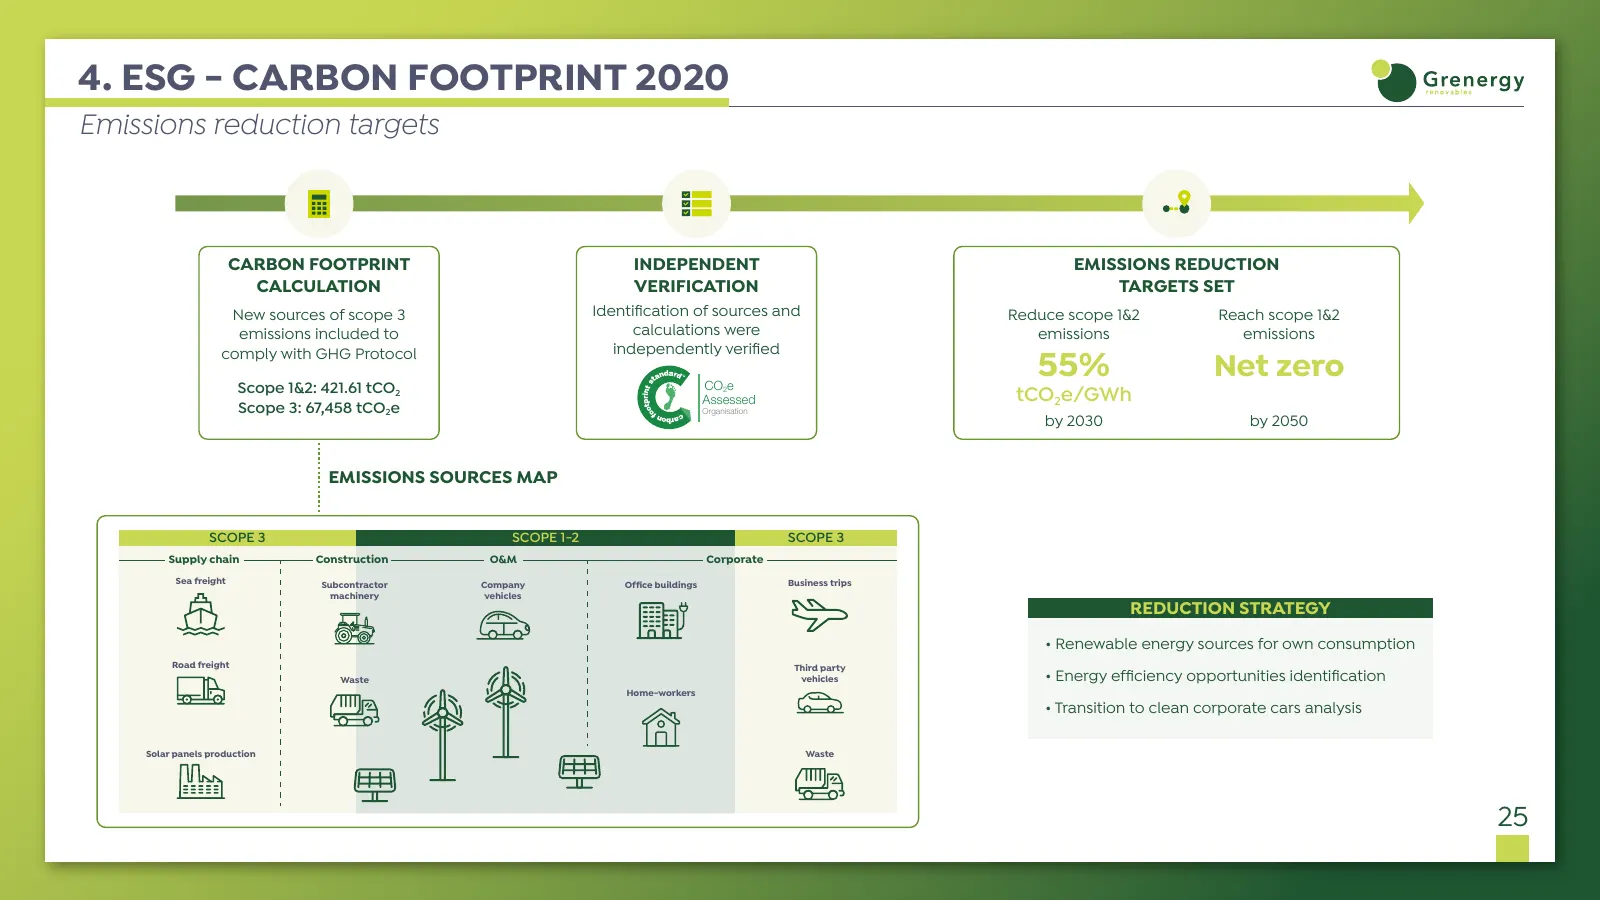
4. ESG - CARBON FOOTPRINT 2020 Emissions reduction targets CARBON FOOTPRINT INDEPENDENT EMISSIONS REDUCTION CALCULATION VERIFICATION TARGETS SET New sources of scope 3 Identification of sources and Reduce scope 1&2 Reach scope 1&2 emissions included to calculations were emissions emissions independe
Slide 27: ESG - External Recognition
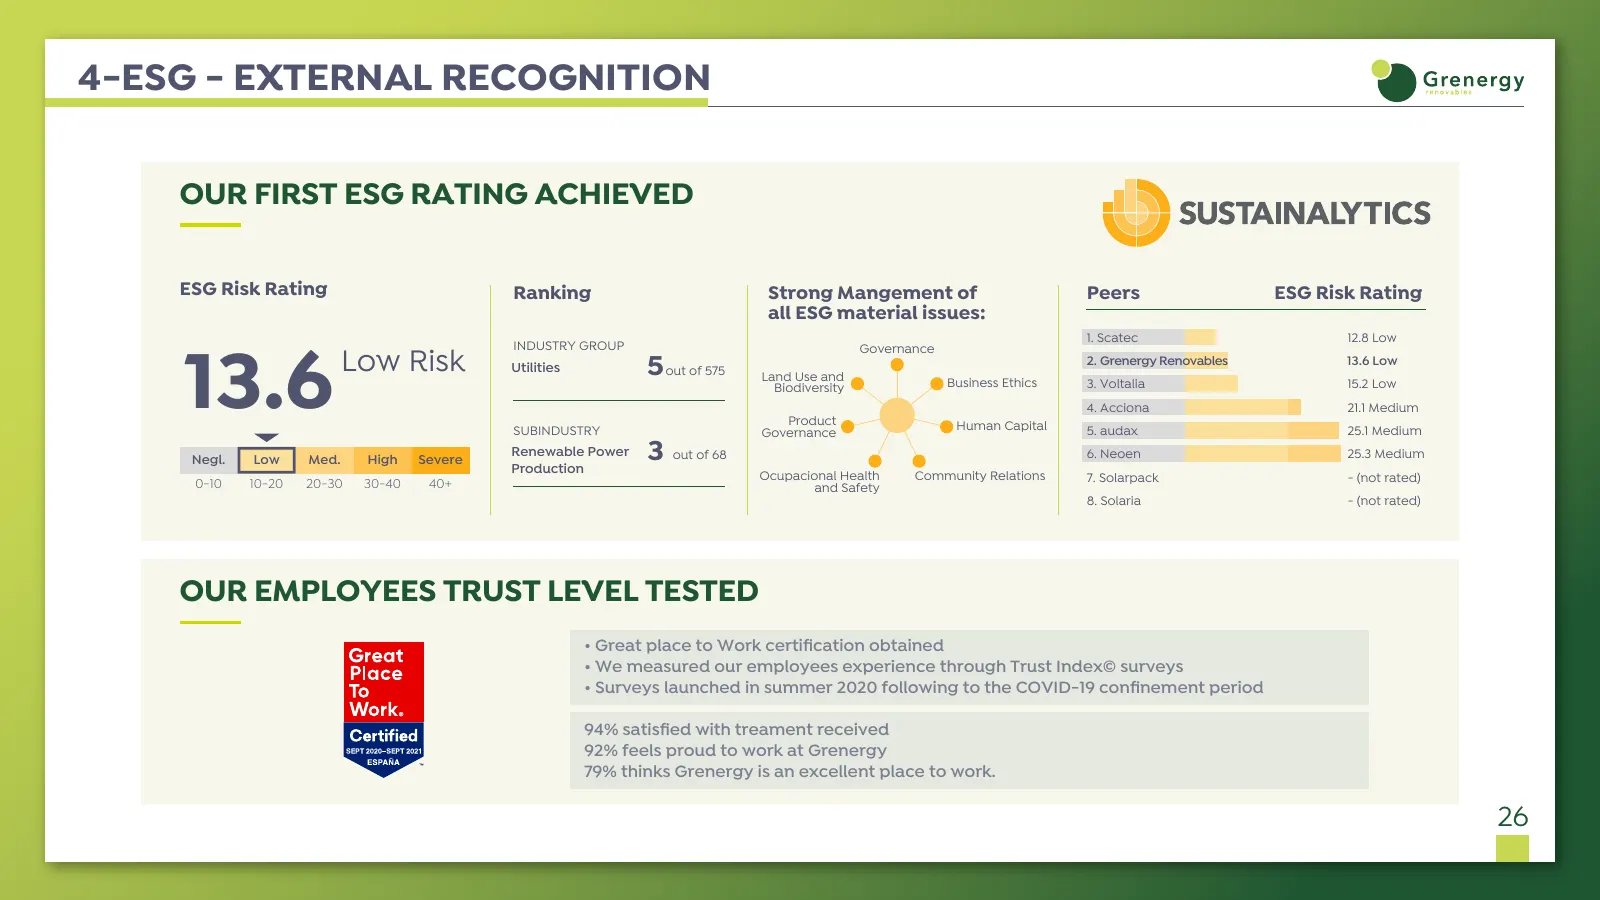
4-ESG - EXTERNAL RECOGNITION OUR FIRST ESG RATING ACHIEVED ESG Risk Rating Ranking Strong Mangement of Peers ESG Risk Rating all ESG material issues: 13.6 1. Scatec 12.8 Low INDUSTRY GROUP Governance Low Risk Utilities 5 out of 575 Land Use and 2. Grenergy Renovables 13.6 Low Biodiversity Business E
Slide 28: ESG Case Study Quillagua
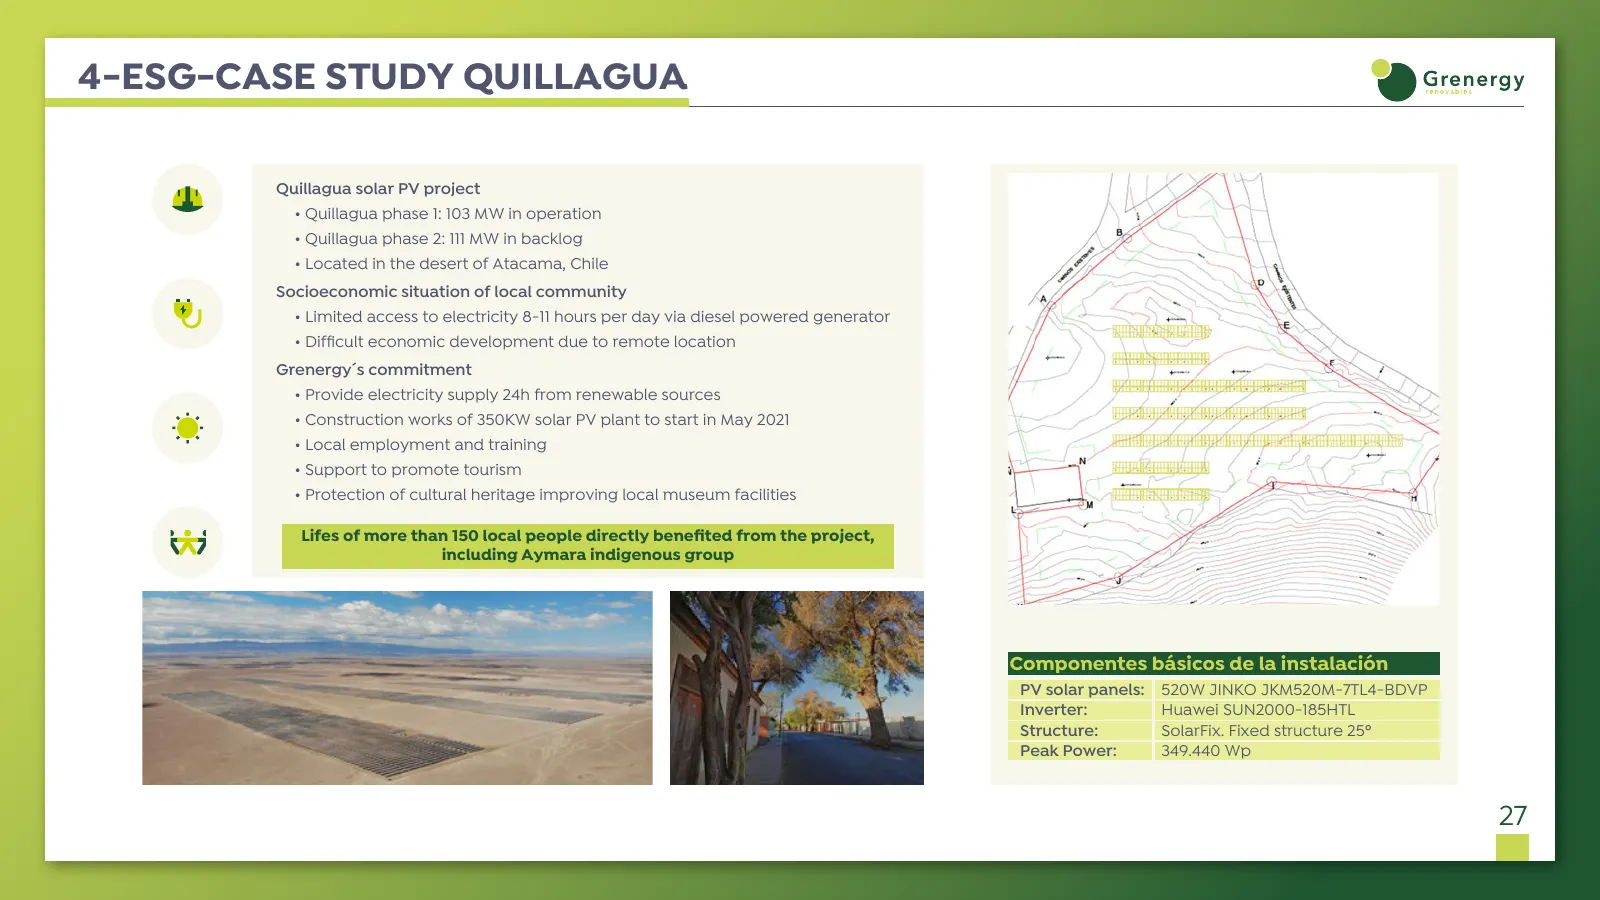
4-ESG-CASE STUDY QUILLAGUA Quillagua solar PV project • Quillagua phase 1: 103 MW in operation • Quillagua phase 2: 111 MW in backlog • Located in the desert of Atacama, Chile Socioeconomic situation of local community • Limited access to electricity 8-11 hours per day via diesel powered generator •
Slide 29: Translating into Solid Value Creation for Shareholders
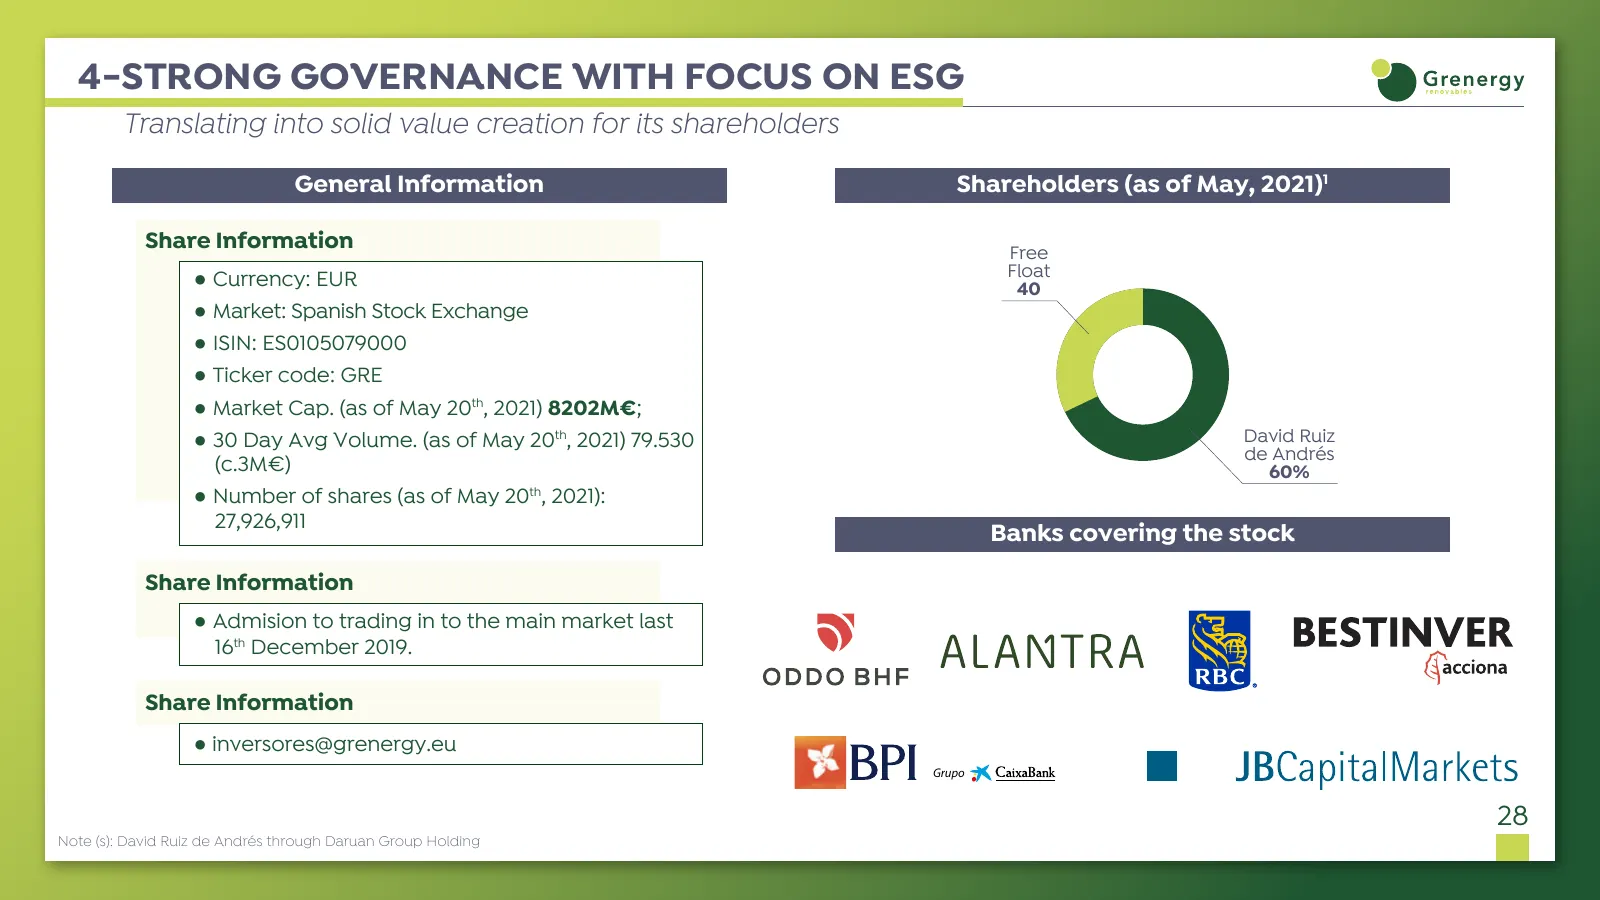
4-STRONG GOVERNANCE WITH FOCUS ON ESG Translating into solid value creation for its shareholders General Information Shareholders (as of May, 2021)1 Share Information Free ● Currency: EUR Float 40 ● Market: Spanish Stock Exchange ● ISIN: ES0105079000 ● Ticker code: GRE ● Market Cap. (as of May 20th,
Slide 30: Appendices
@ Grenersy APPENDICES
Slide 31: Platform with Relevant Growth Potential
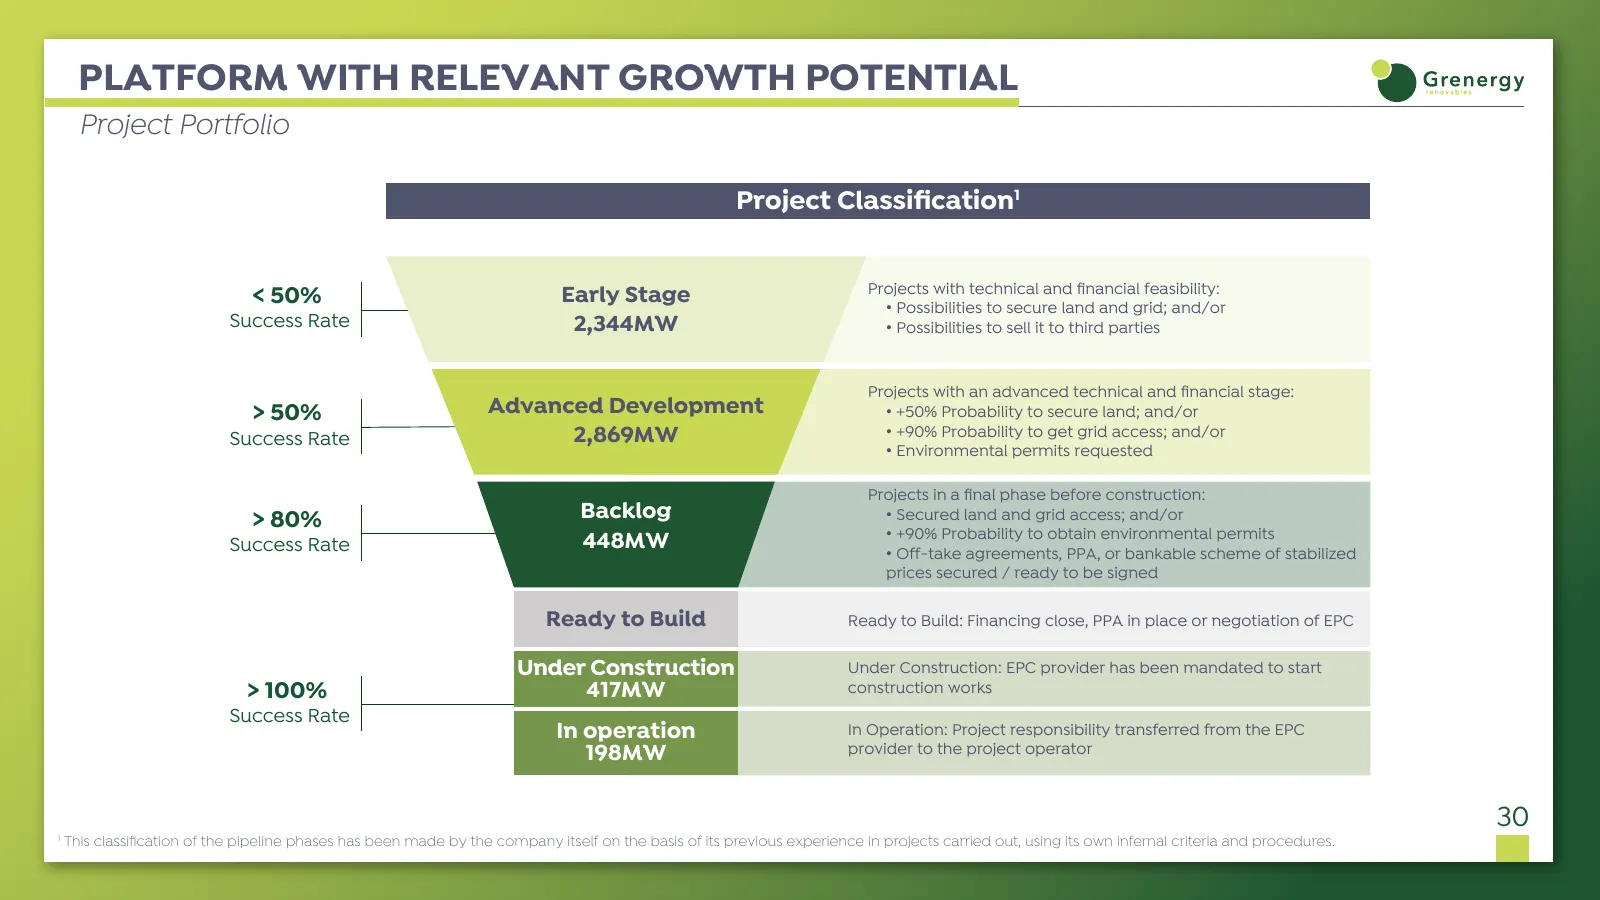
PLATFORM WITH RELEVANT GROWTH POTENTIAL Project Portfolio Project Classification1 Early Stage Projects with technical and financial feasibility: < 50% • Possibilities to secure land and grid; and/or Success Rate 2,344MW • Possibilities to sell it to third parties Projects with an advanced technical an
Slide 32: 1Q21 Results - Profit and Losses
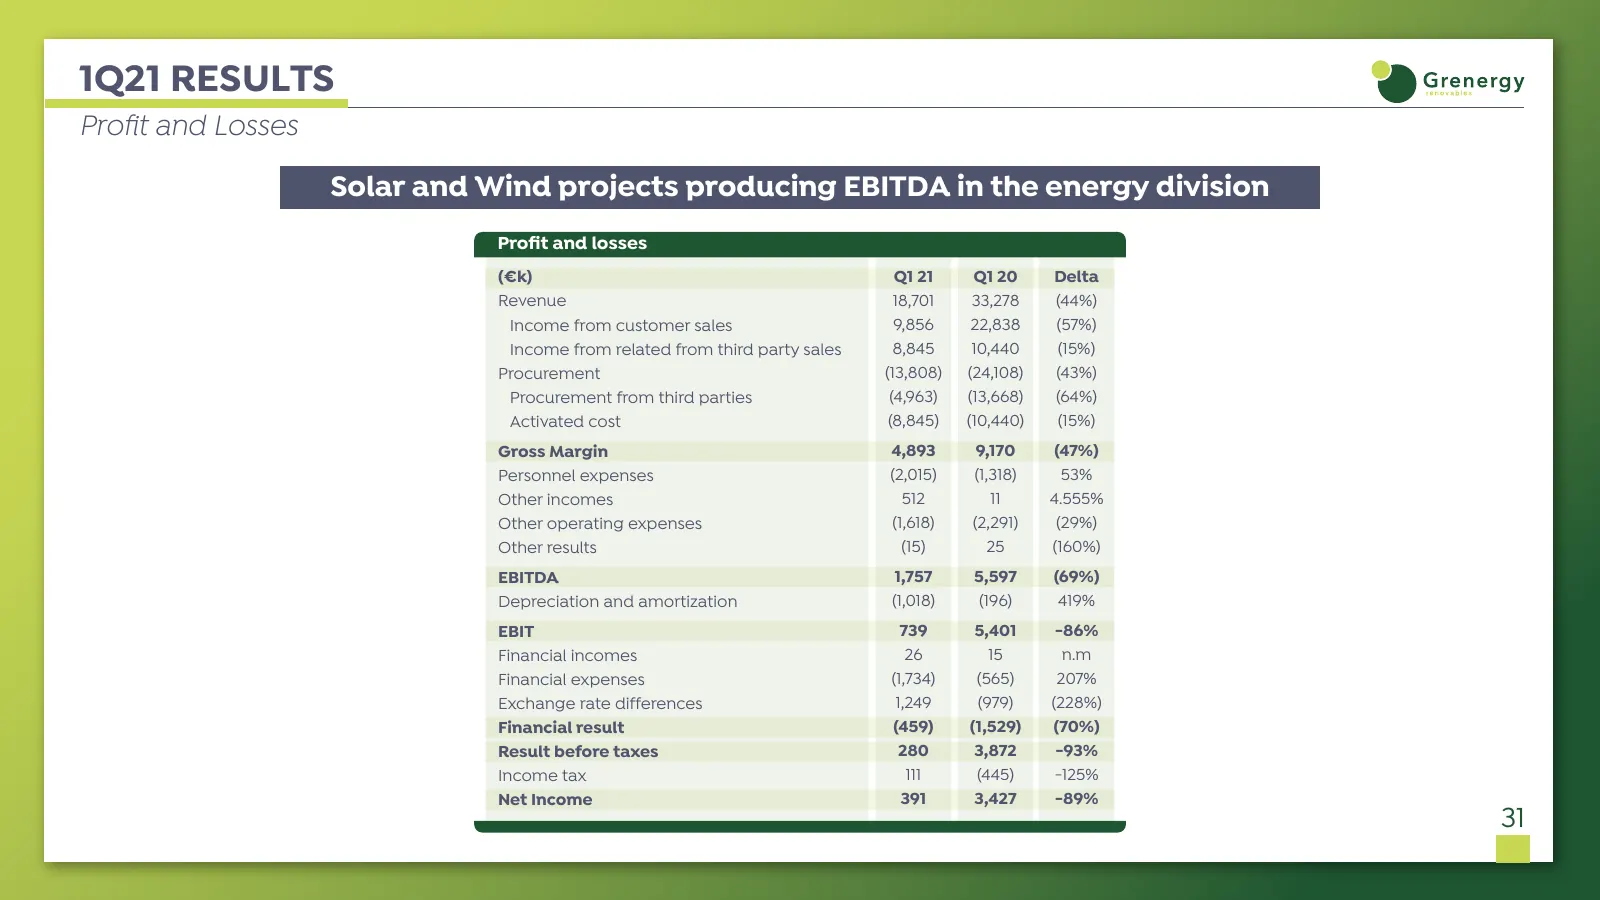
1Q21 RESULTS Profit and Losses Solar and Wind projects producing EBITDA in the energy division Profit and losses (€k) Q1 21 Q1 20 Delta Revenue 18,701 33,278 (44%) Income from customer sales 9,856 22,838 (57%) Income from related from third party sales 8,845 10,440 (15%) Procurement (13,808) (24,108)
Slide 33: 1Q21 Results - Balance Sheet
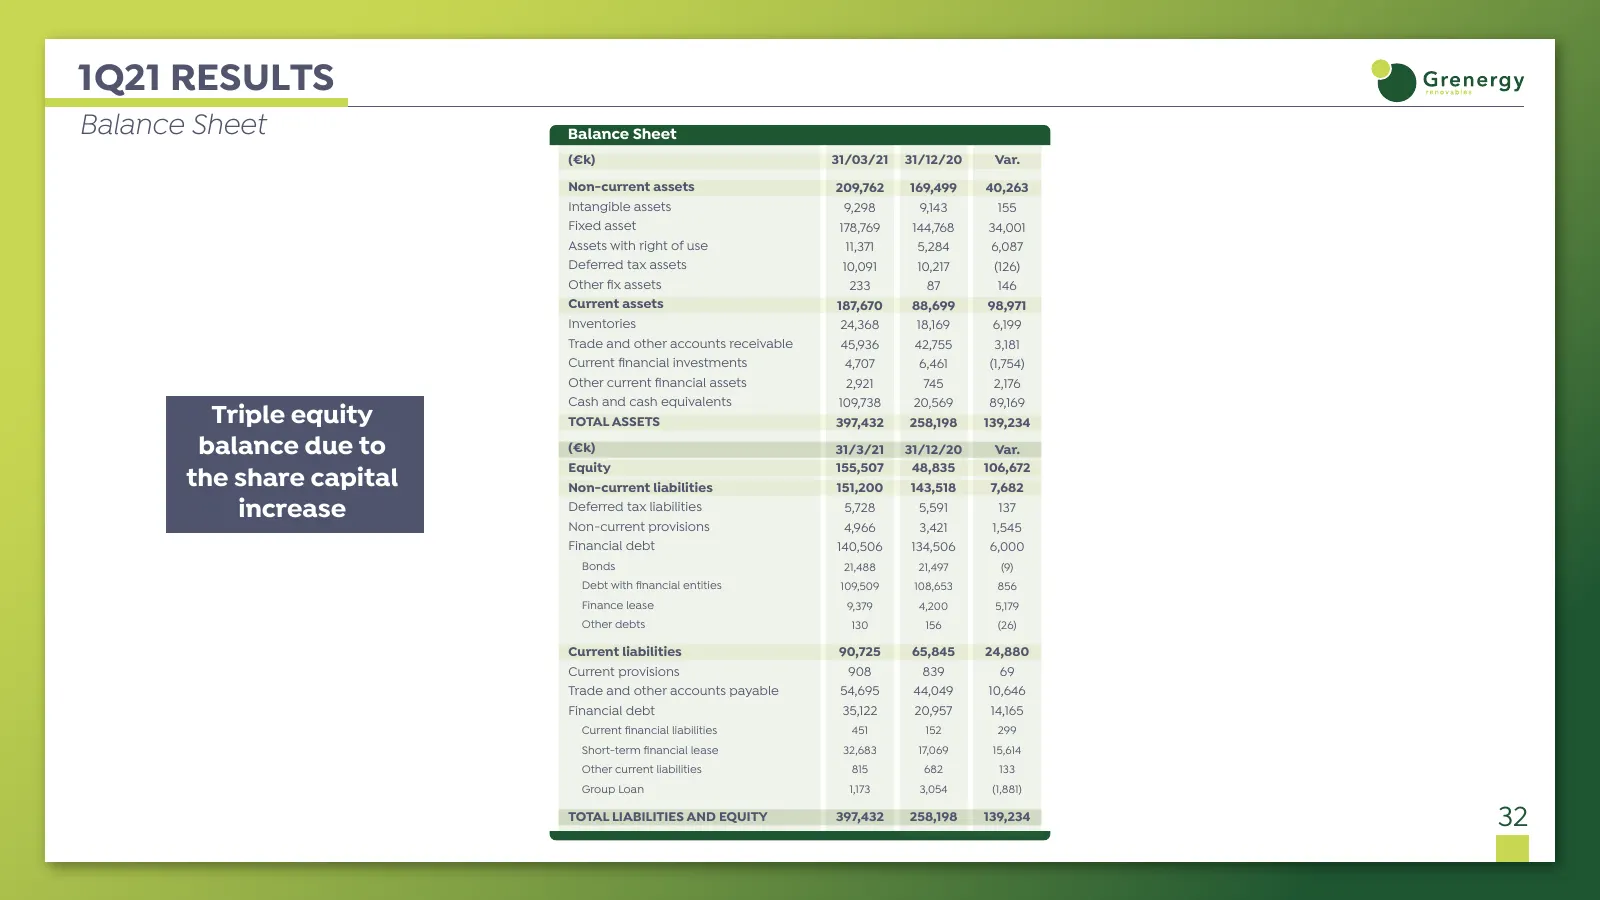
1Q21 RESULTS Balance Sheet Balance Sheet (€k) 31/03/21 31/12/20 Var. Non-current assets 209,762 169,499 40,263 Intangible assets 9,298 9,143 155 Fixed asset 178,769 144,768 34,001 Assets with right of use 11,371 5,284 6,087 Deferred tax assets 10,091 10,217 (126) Other fix assets 233 87 146 Current
Slide 34: 1Q21 Results - Net Debt
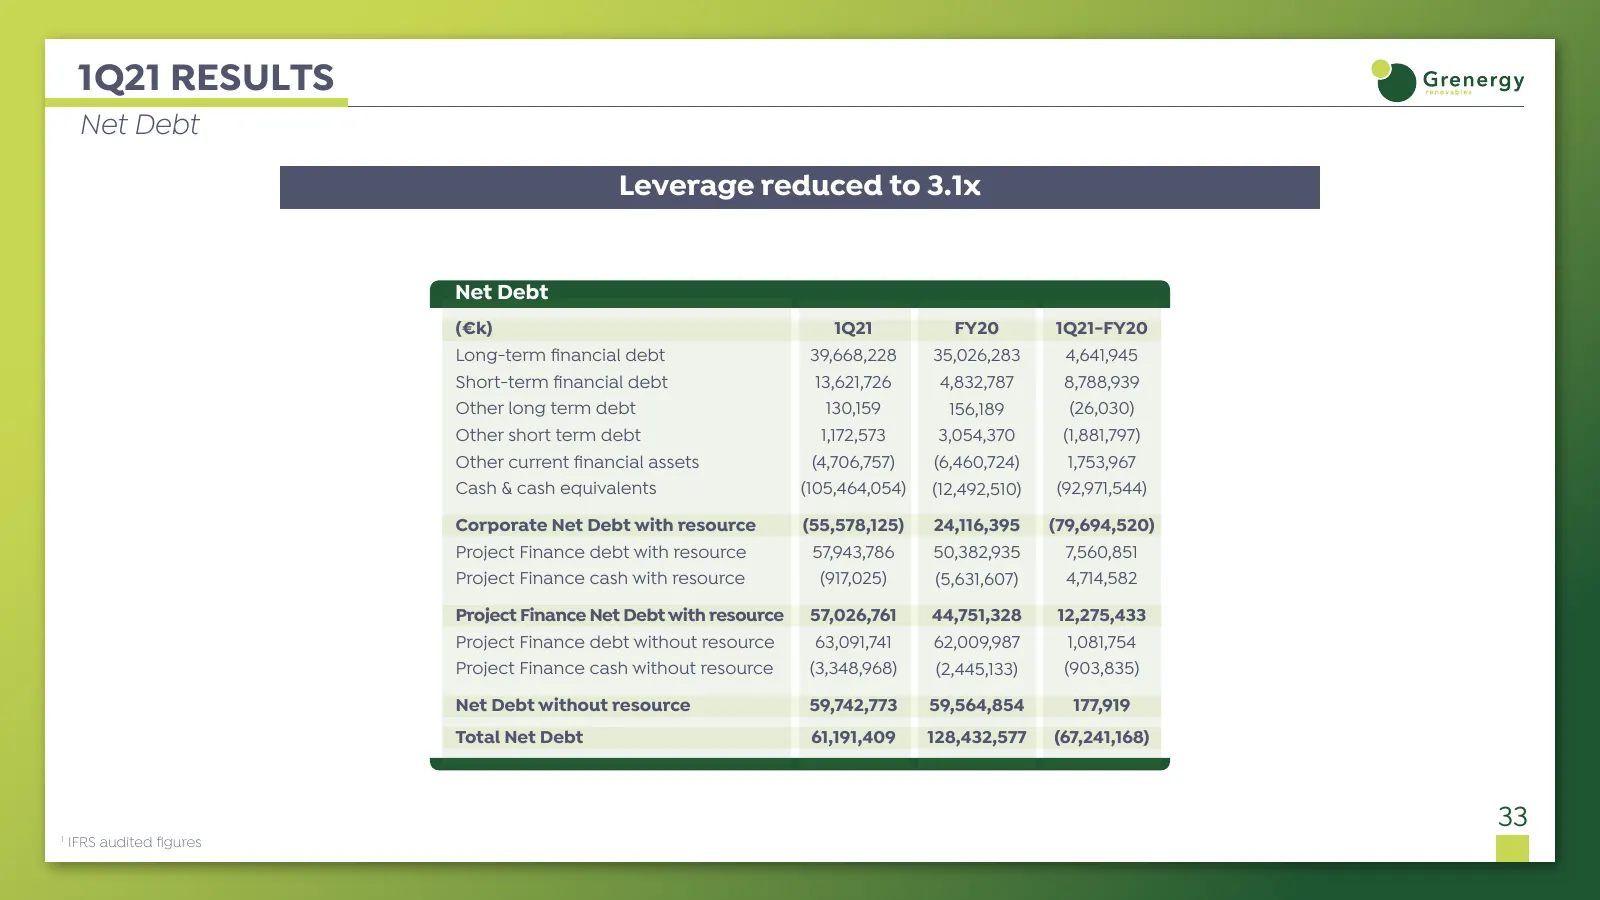
1Q21 RESULTS Net Debt Leverage reduced to 3.1x Net Debt (€k) 1Q21 FY20 1Q21-FY20 Long-term financial debt 39,668,228 35,026,283 4,641,945 Short-term financial debt 13,621,726 4,832,787 8,788,939 Other long term debt 130,159 156,189 (26,030) Other short term debt 1,172,573 3,054,370 (1,881,797) Other
Slide 35: Share Capital Increase: Use of Proceeds
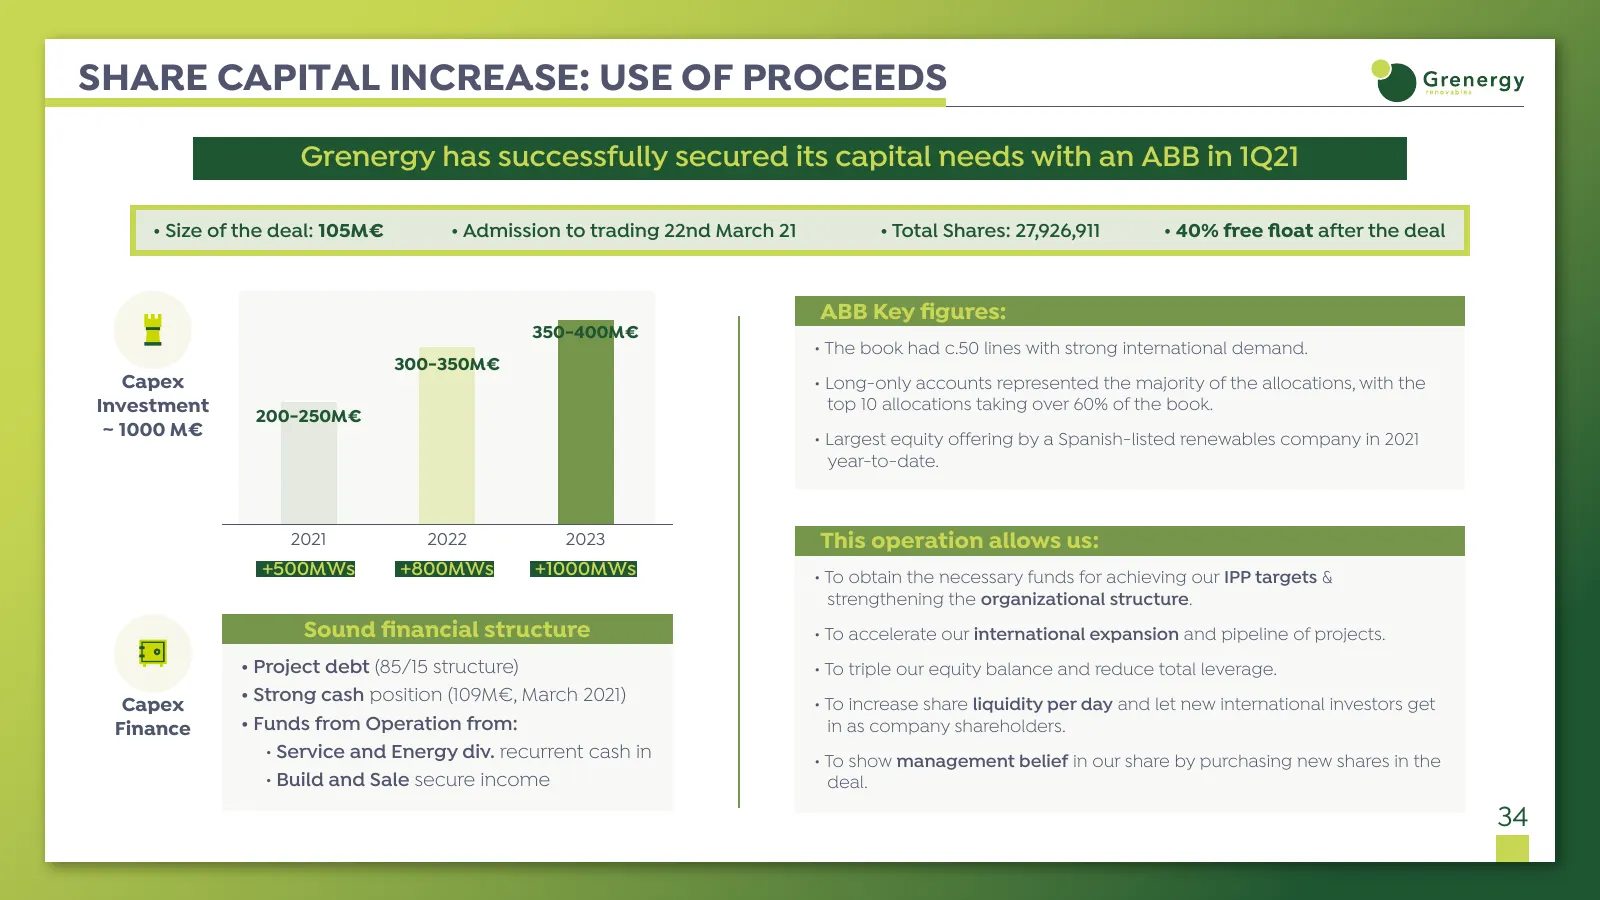
SHARE CAPITAL INCREASE: USE OF PROCEEDS Grenergy has successfully secured its capital needs with an ABB in 1Q21 • Size of the deal: 105M€ • Admission to trading 22nd March 21 • Total Shares: 27,926,911 • 40% free float after the deal ABB Key figures: 350-400M€ • The book had c.50 lines with strong i
Slide 36: Developers and IPP of Solar PV & Wind Projects
Developers and IPP of SOLAR PV & WIND projects Chile - Spain - Peru - Colombia - Italy - Mexico - Argentina - UK
Source: Internet Archive copy of grenergy.eu
More decks from Grenergy Renovables S.A
 H1 2026 Earnings Presentation38 slides · Sep 16, 2026
 Investor Presentation (September 2026)55 slides · September 2026
 Investor Presentation (July 2026)46 slides · July 2026
 Q1 2026 Earnings Presentation50 slides · May 27, 2026
 9M 2025 Earnings Presentation36 slides · Nov 27, 2025
 Investor Day (May 2025)50 slides · May 28, 2025