National Financial Partners Corp
National Financial Partners — Sandler O'Neill Financial Services Conference 2005
25 slides from National Financial Partners's conference presentation, Jun 8, 2005
Slide 1: National Financial Partners Corp. - Sandler O'Neill Financial Services Conference
Ex99 National Sandler Financial June 8, 2005 O’Neill Financial Services & Conference Partners Corp.
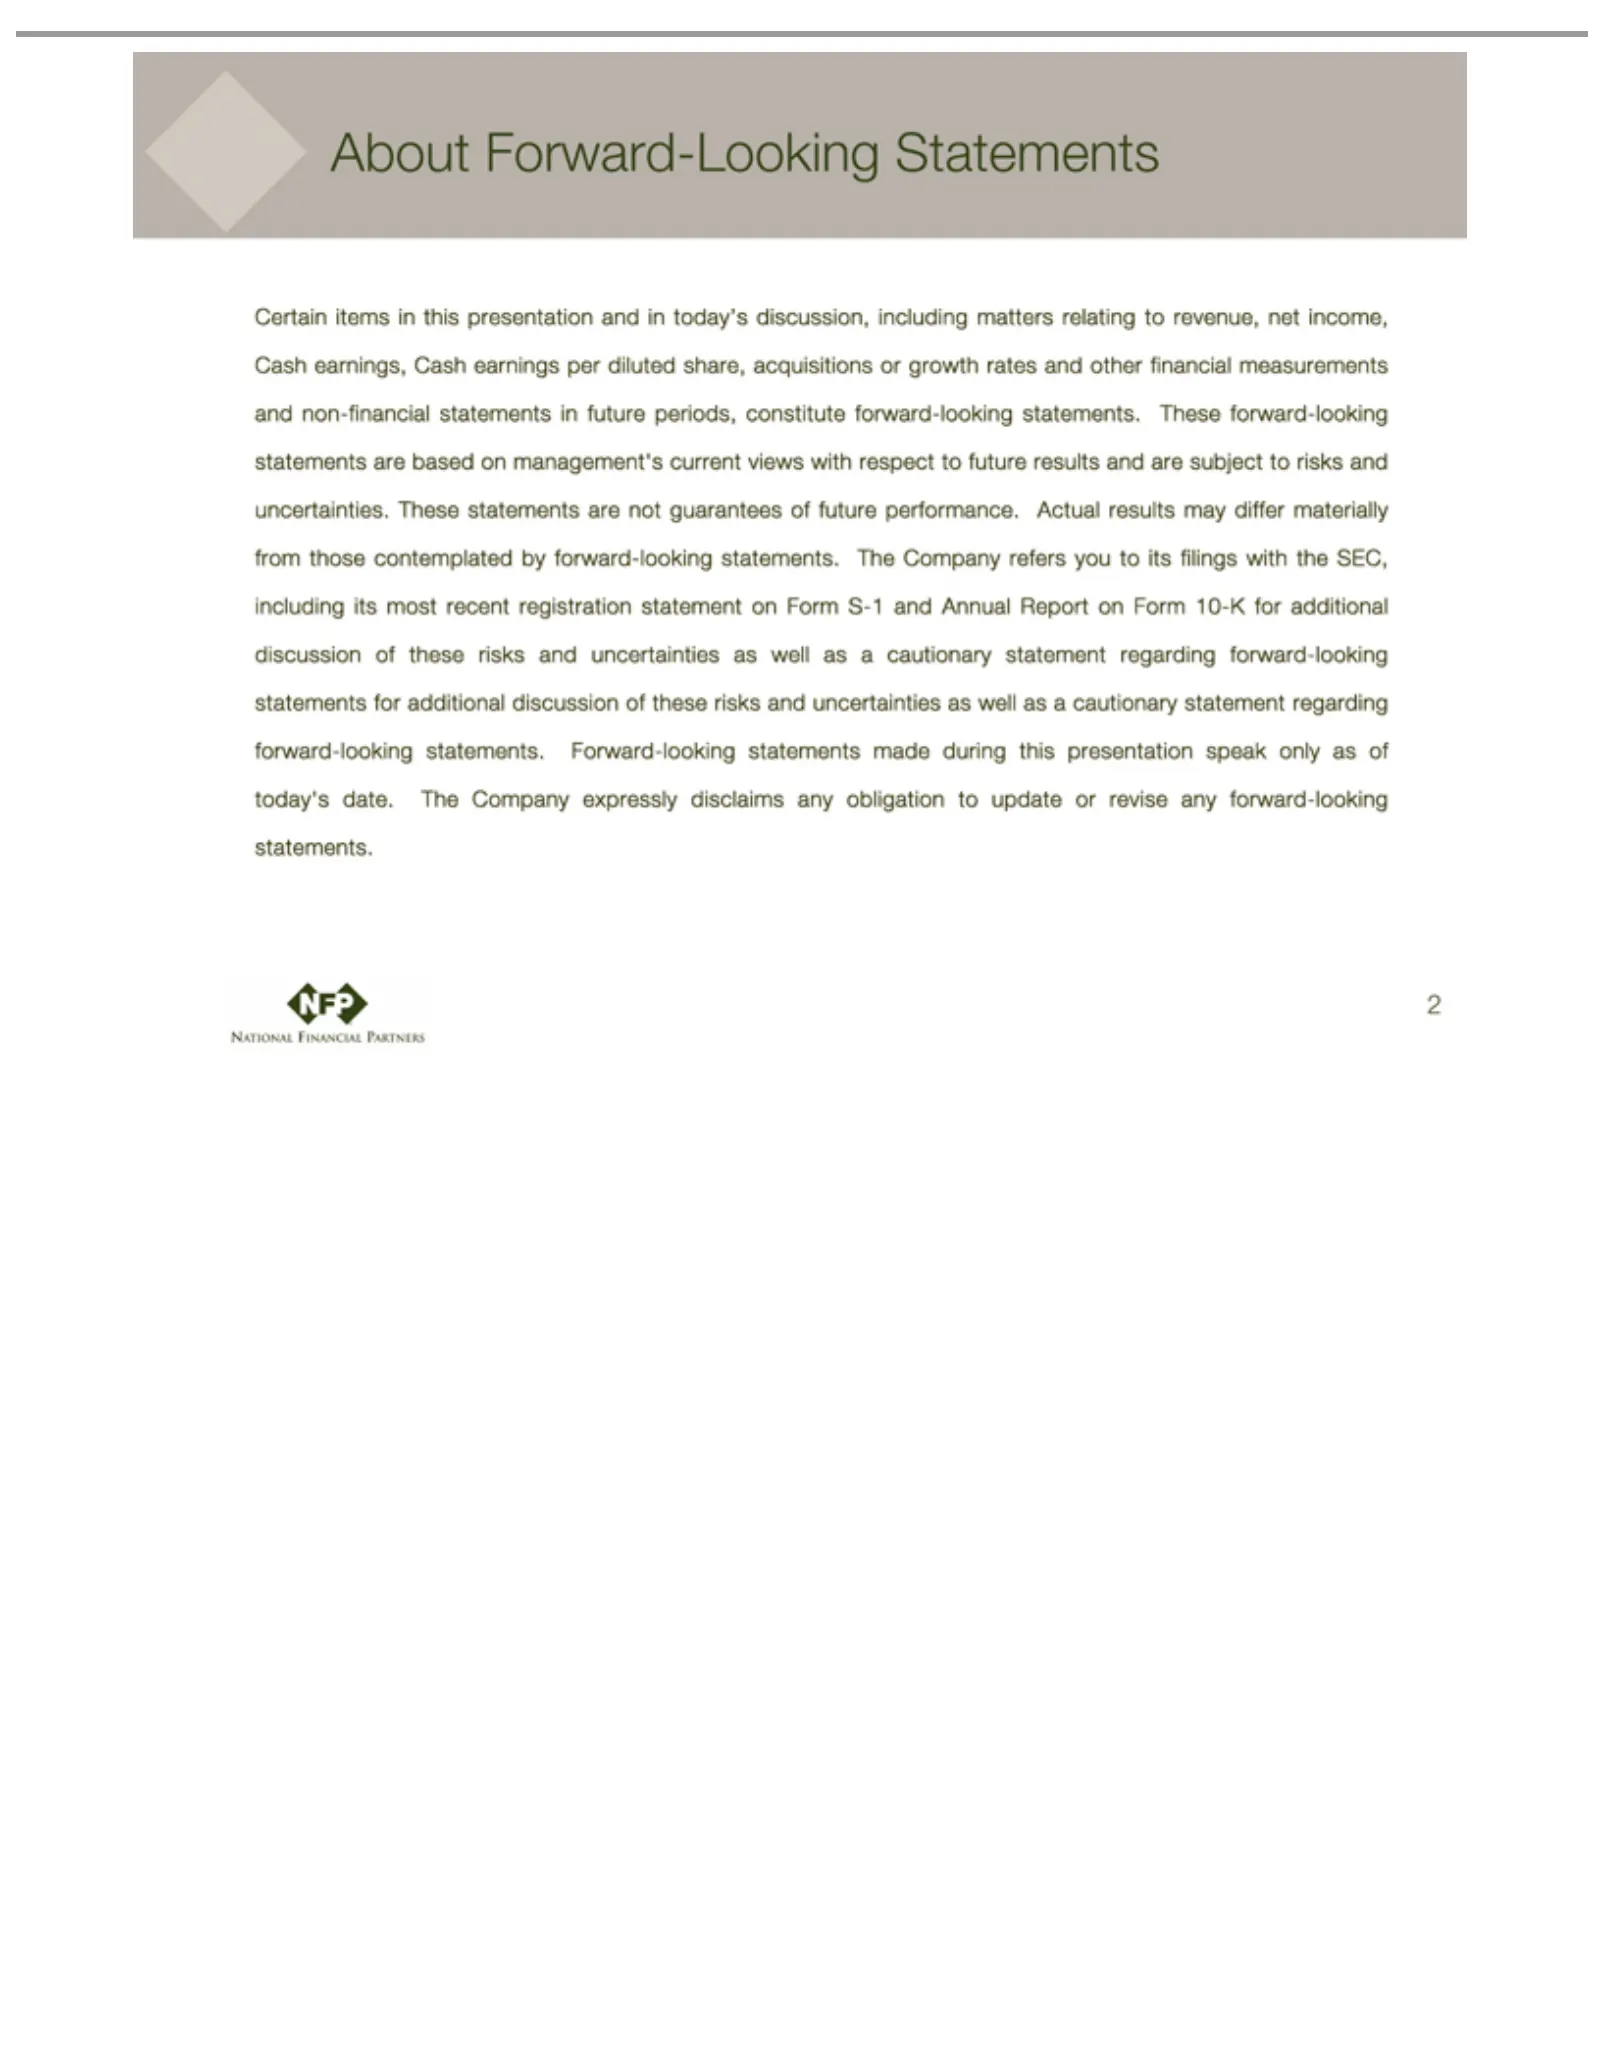
Slide 2: About Forward-Looking Statements
About Certain financial to and looking 2 statements. future uncertainties Forward-Looking items statements. results measurements The in Company and this as Forward-looking well are presentation subject and as Statements refers anon-financial cautionary toyou and risks to statements inand its today’s
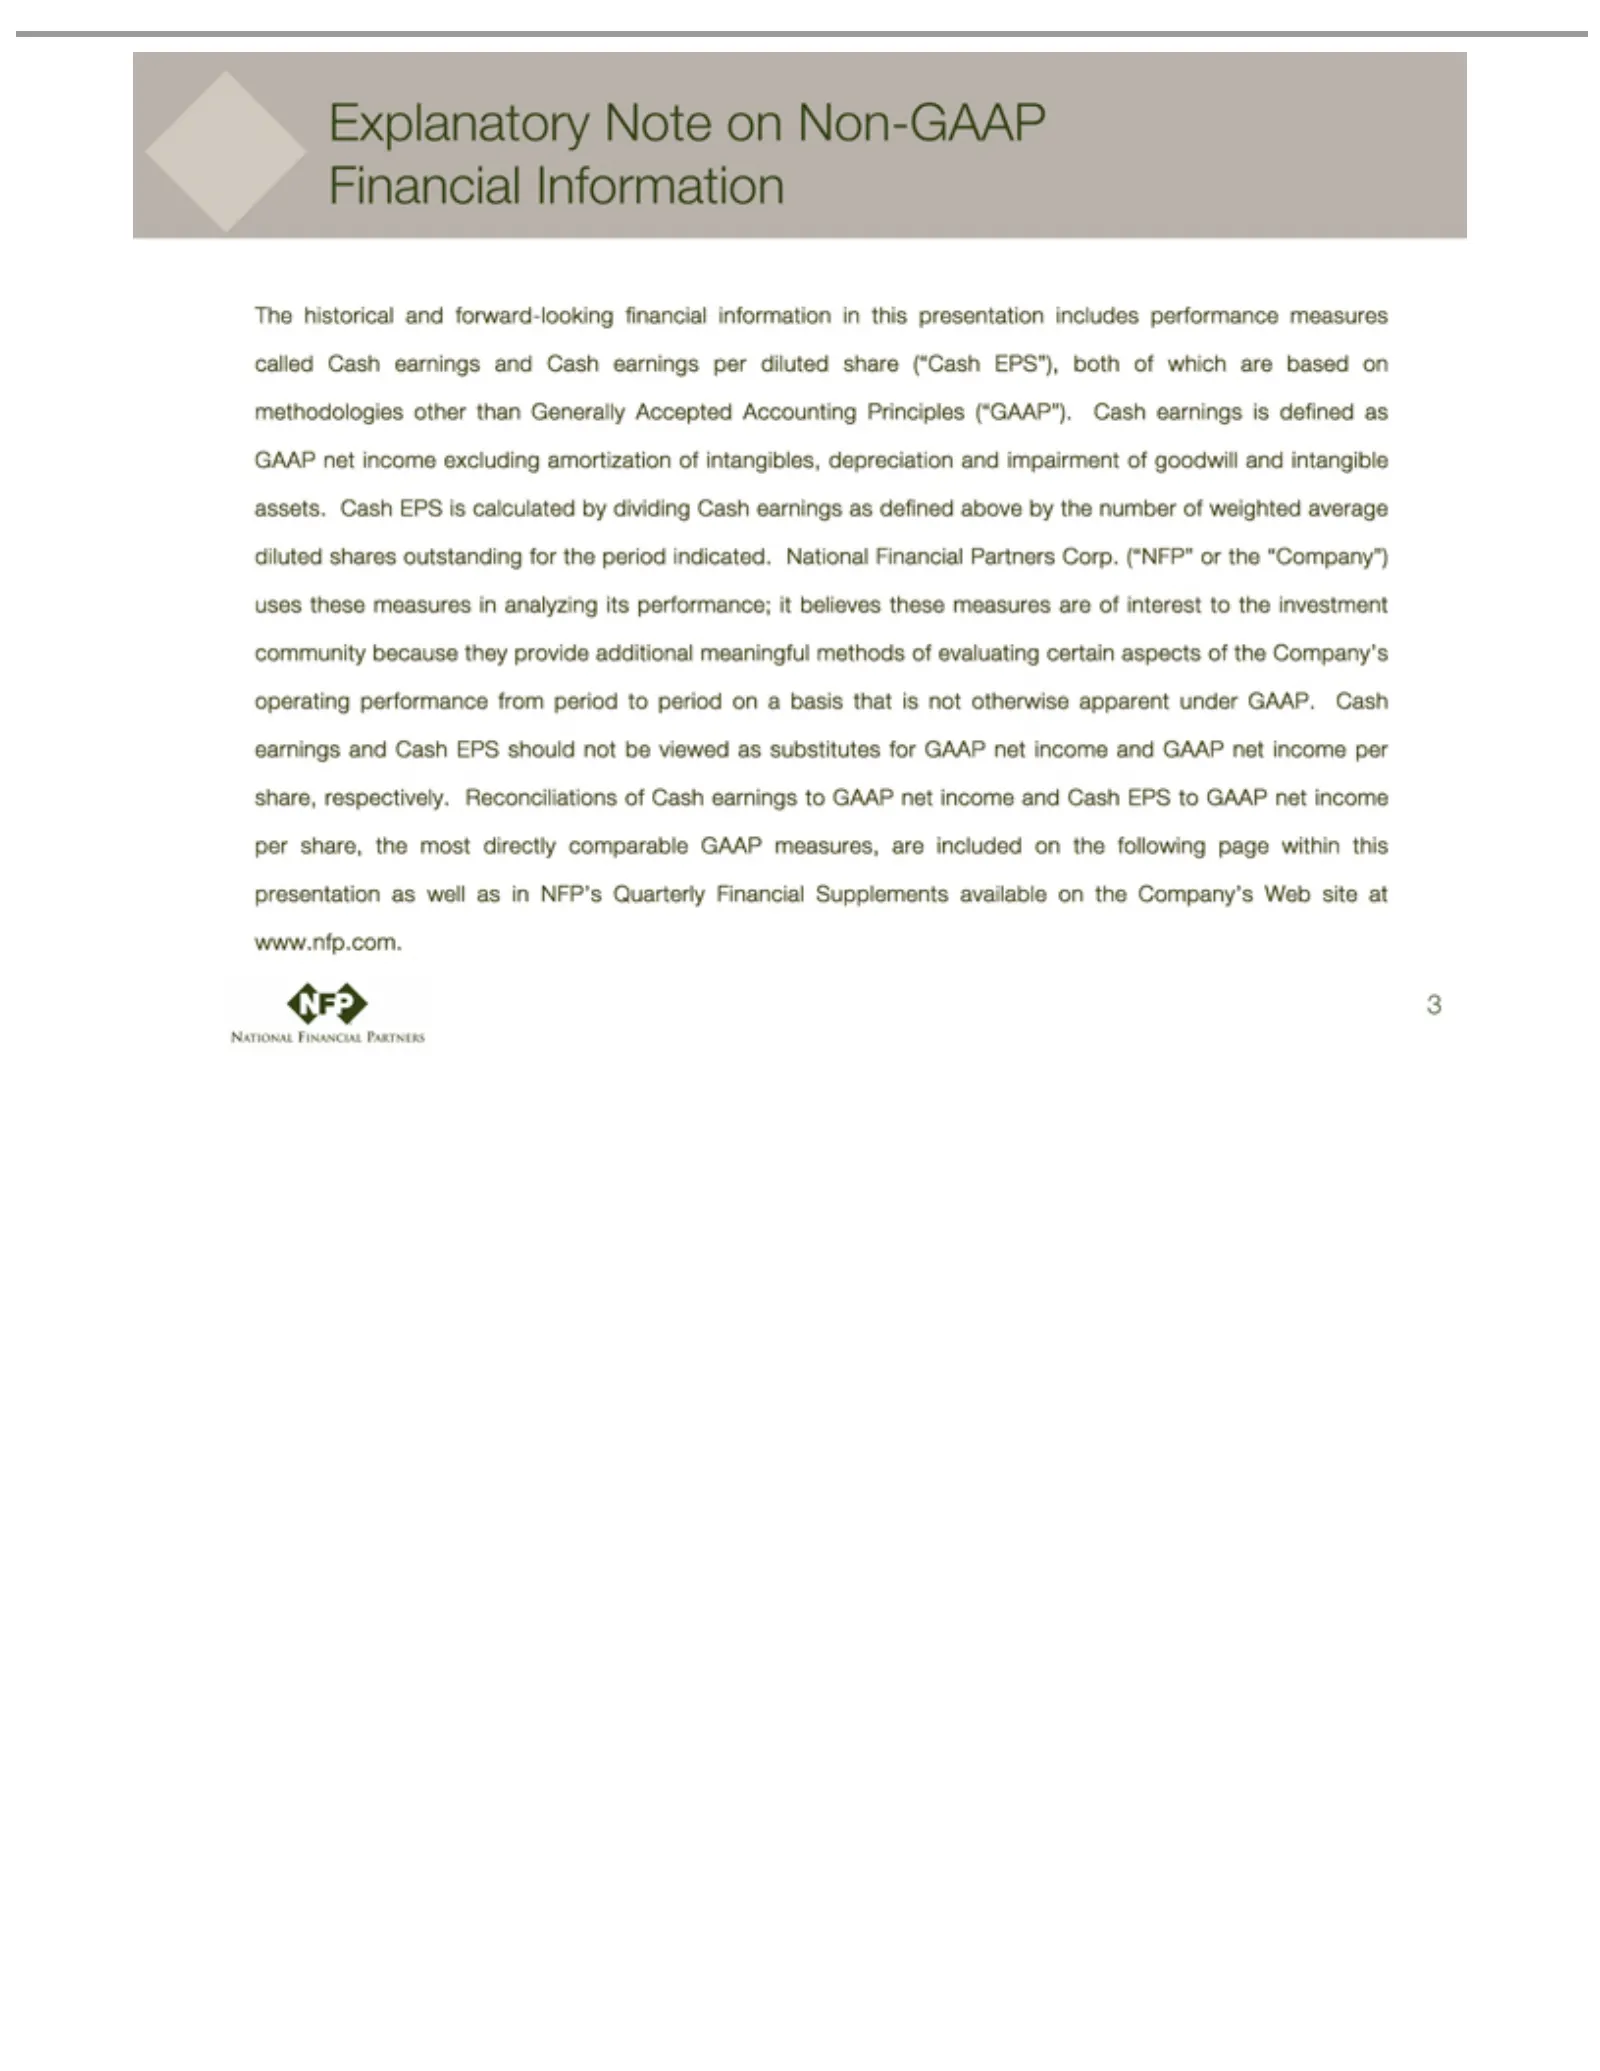
Slide 3: Explanatory Note on Non-GAAP Financial Information
Explanatory The based impairment indicated. because GAAP. and Supplements 3 Cash historical onCash they methodologies EPS National of Note earnings provide available and to goodwill GAAP on forward-looking Financial Non-GAAP additional and on and net other the Cash income intangible Partners Company
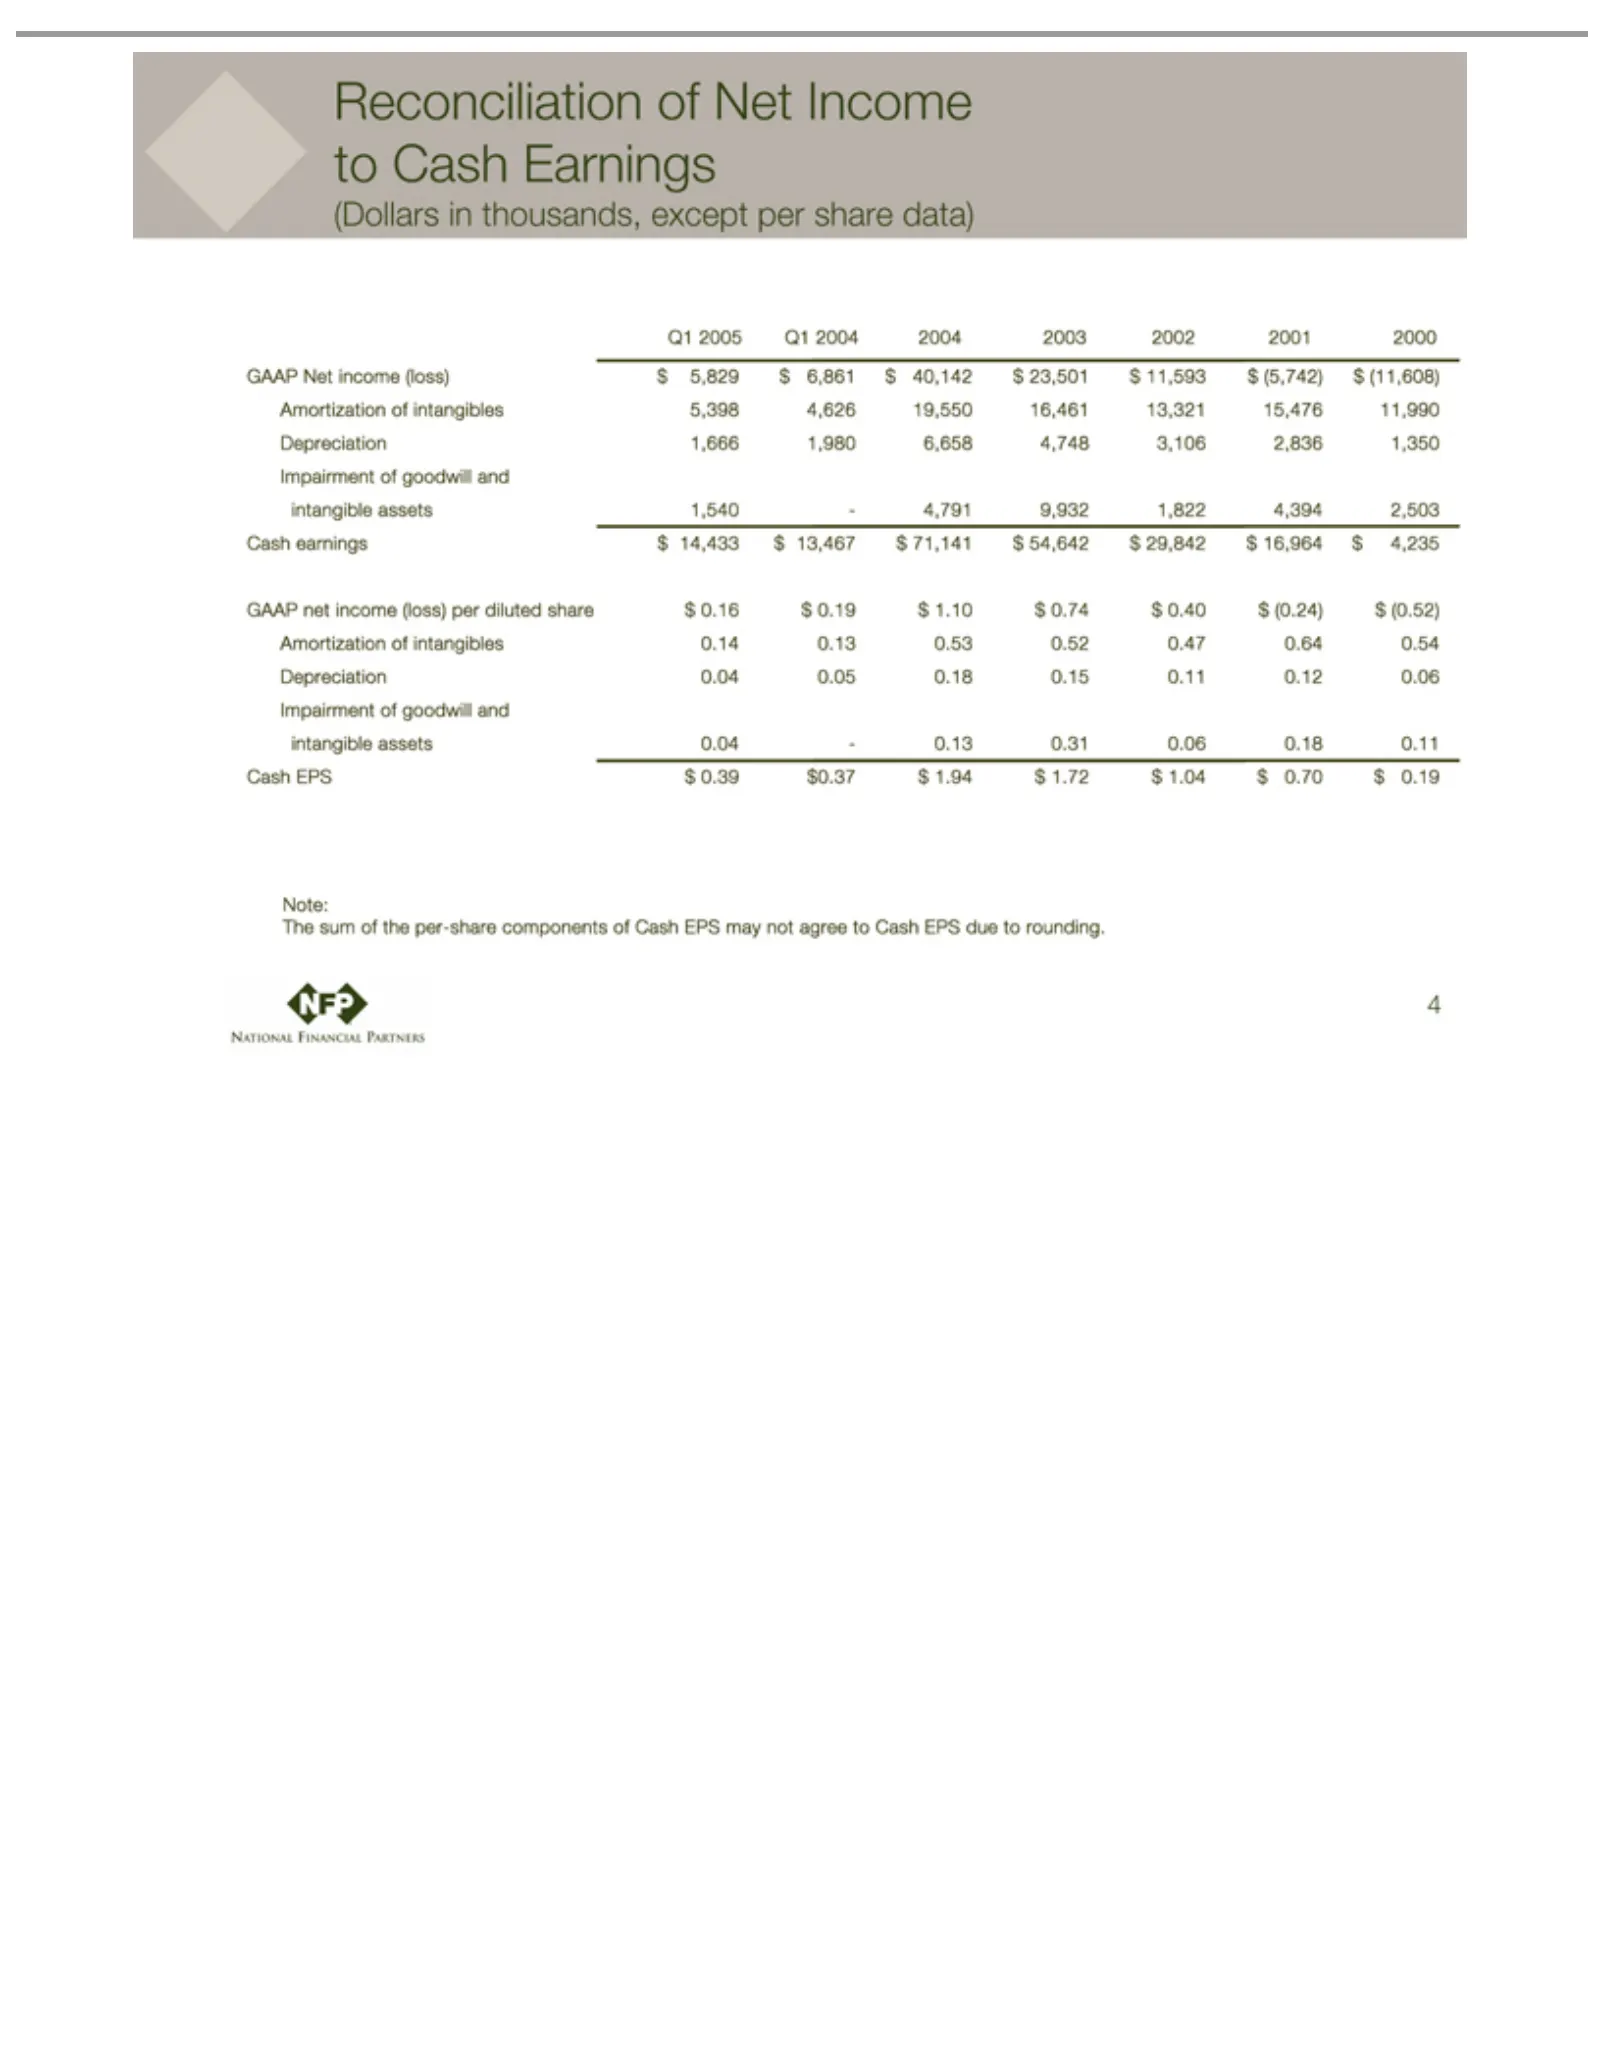
Slide 4: Reconciliation of GAAP net income to Cash Earnings and Cash EPS
Reconciliation (Dollars Q1 GAAP Amortization Depreciation Impairment intangible Cash The Note: 4 2005 sum earnings EPS Net net in of Q1$assets income thousands, income the of 0.39 2004 1,666 0.04 of $goodwill of per-share 14,433 intangibles 1,540 0.04 $Net 0.05 2004 (loss) 0.37 (loss) 1,980 -Income
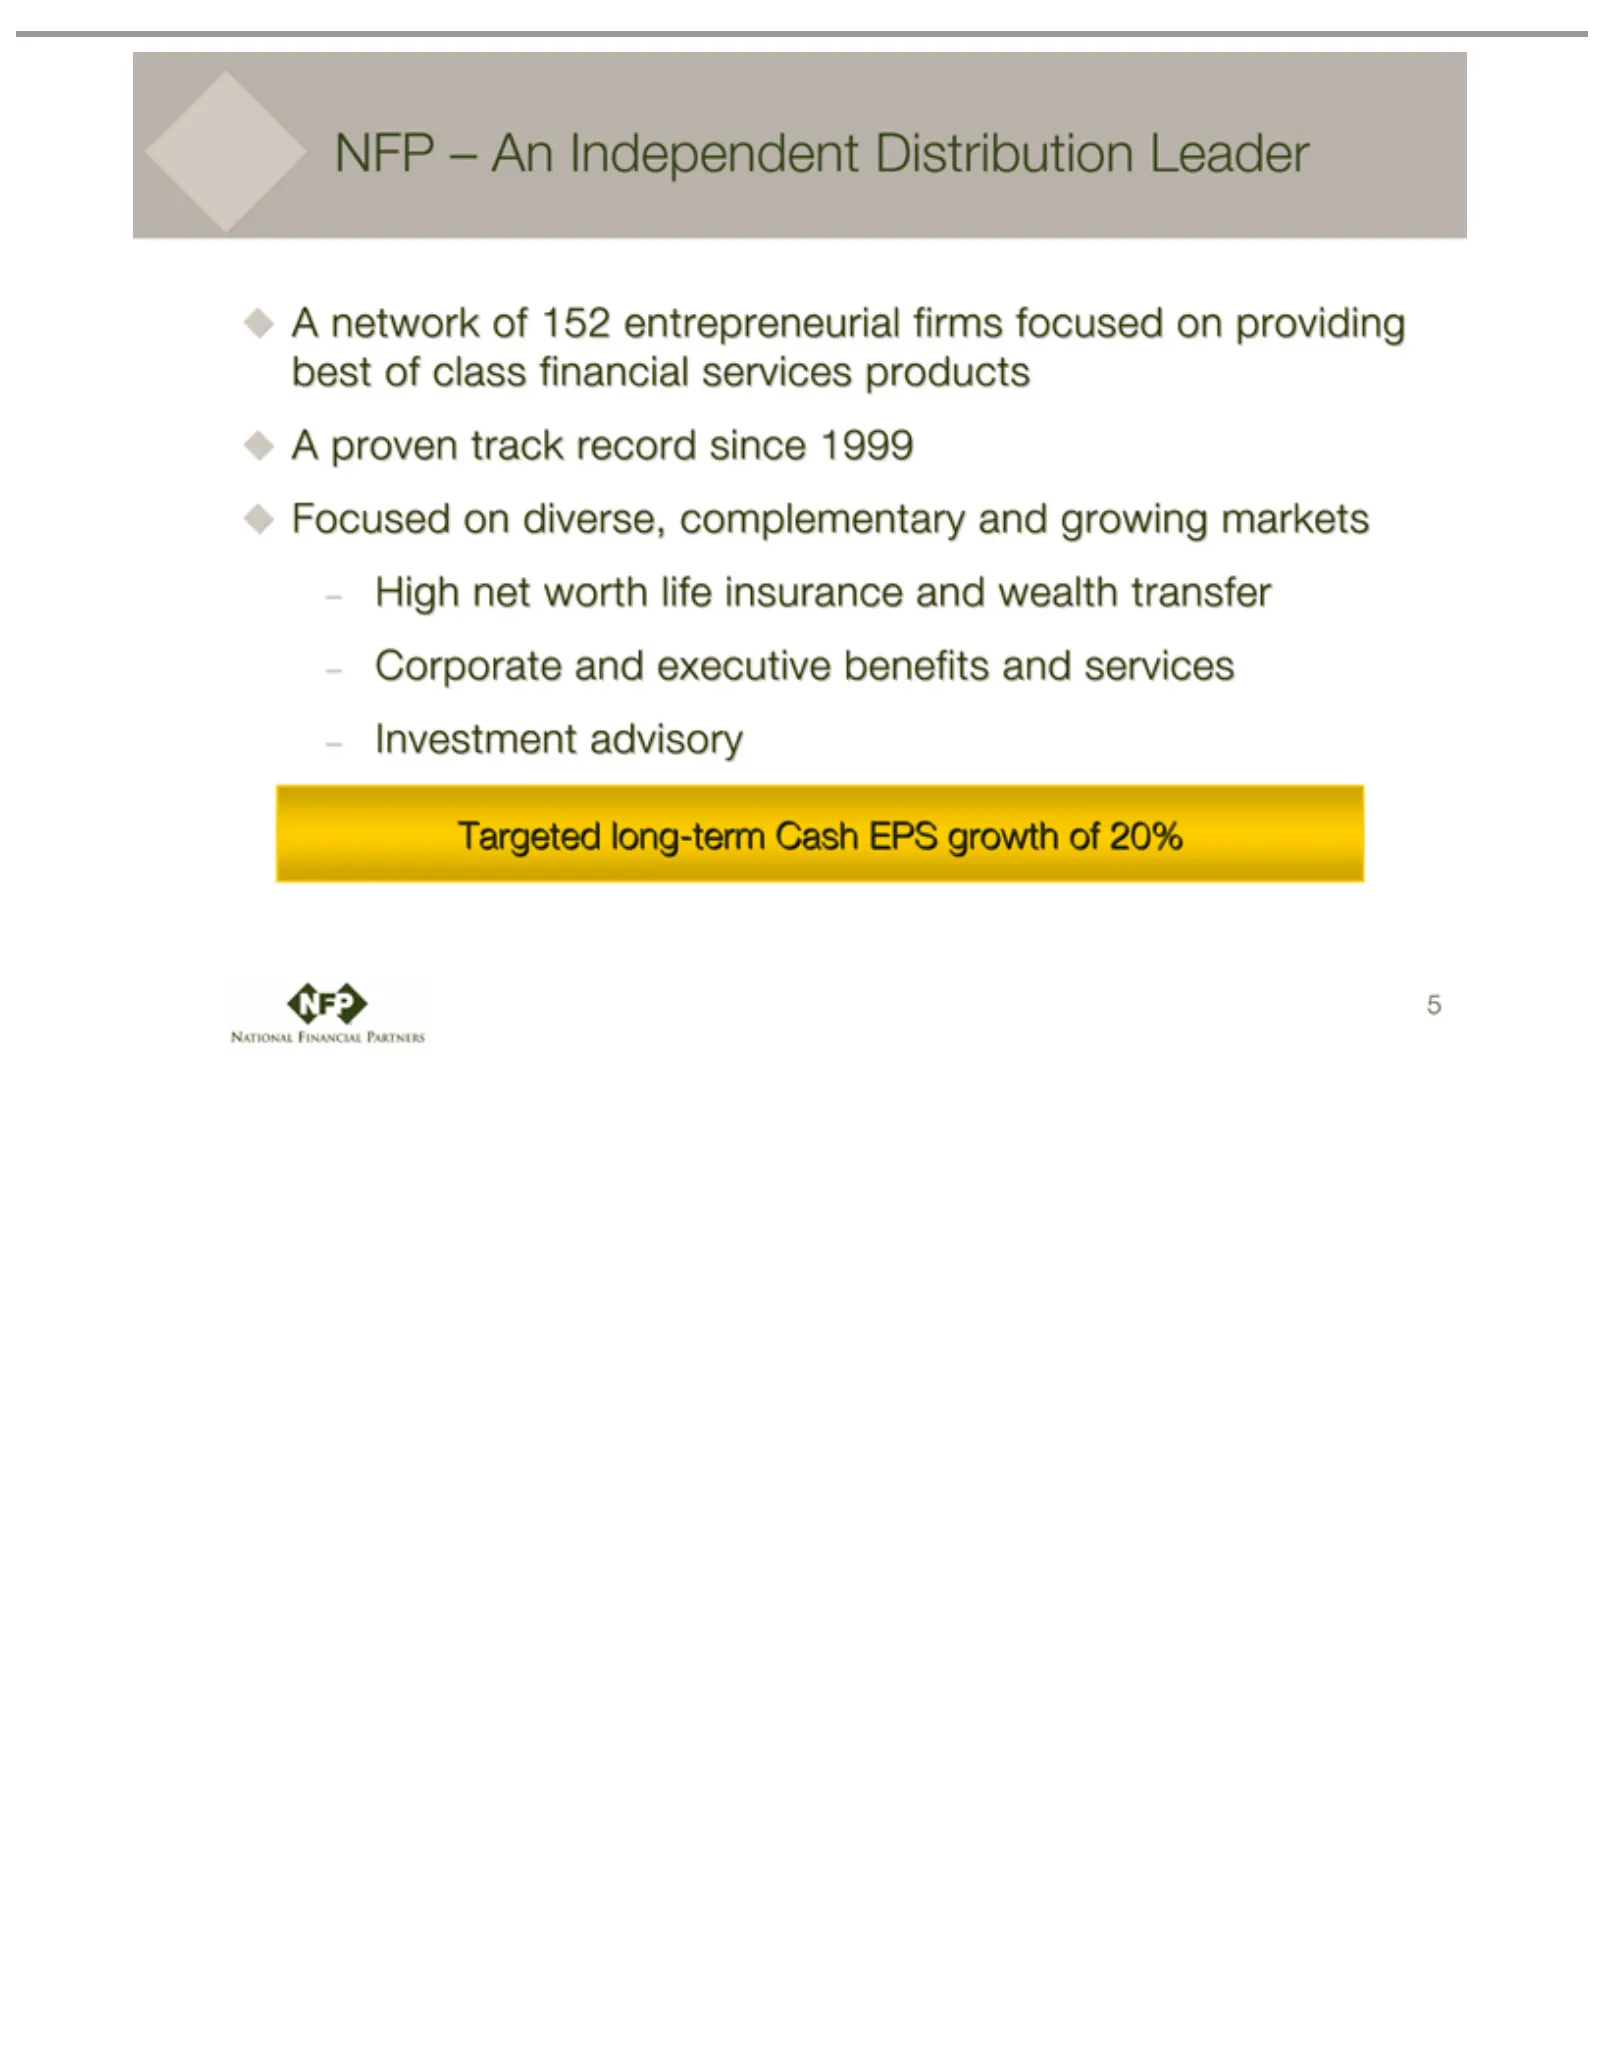
Slide 5: NFP: A Focused Leader in Financial Services Distribution
NFP A Focused High Targeted 5 network proven –net Anon long-term worth track Independent ofdiverse, 152 record lifeentrepreneurial insurance Cash complementary since Distribution EPS1999 and growth firms wealth Leader and offocused 20% growing transferonCorporate markets providingand bestexecutive o
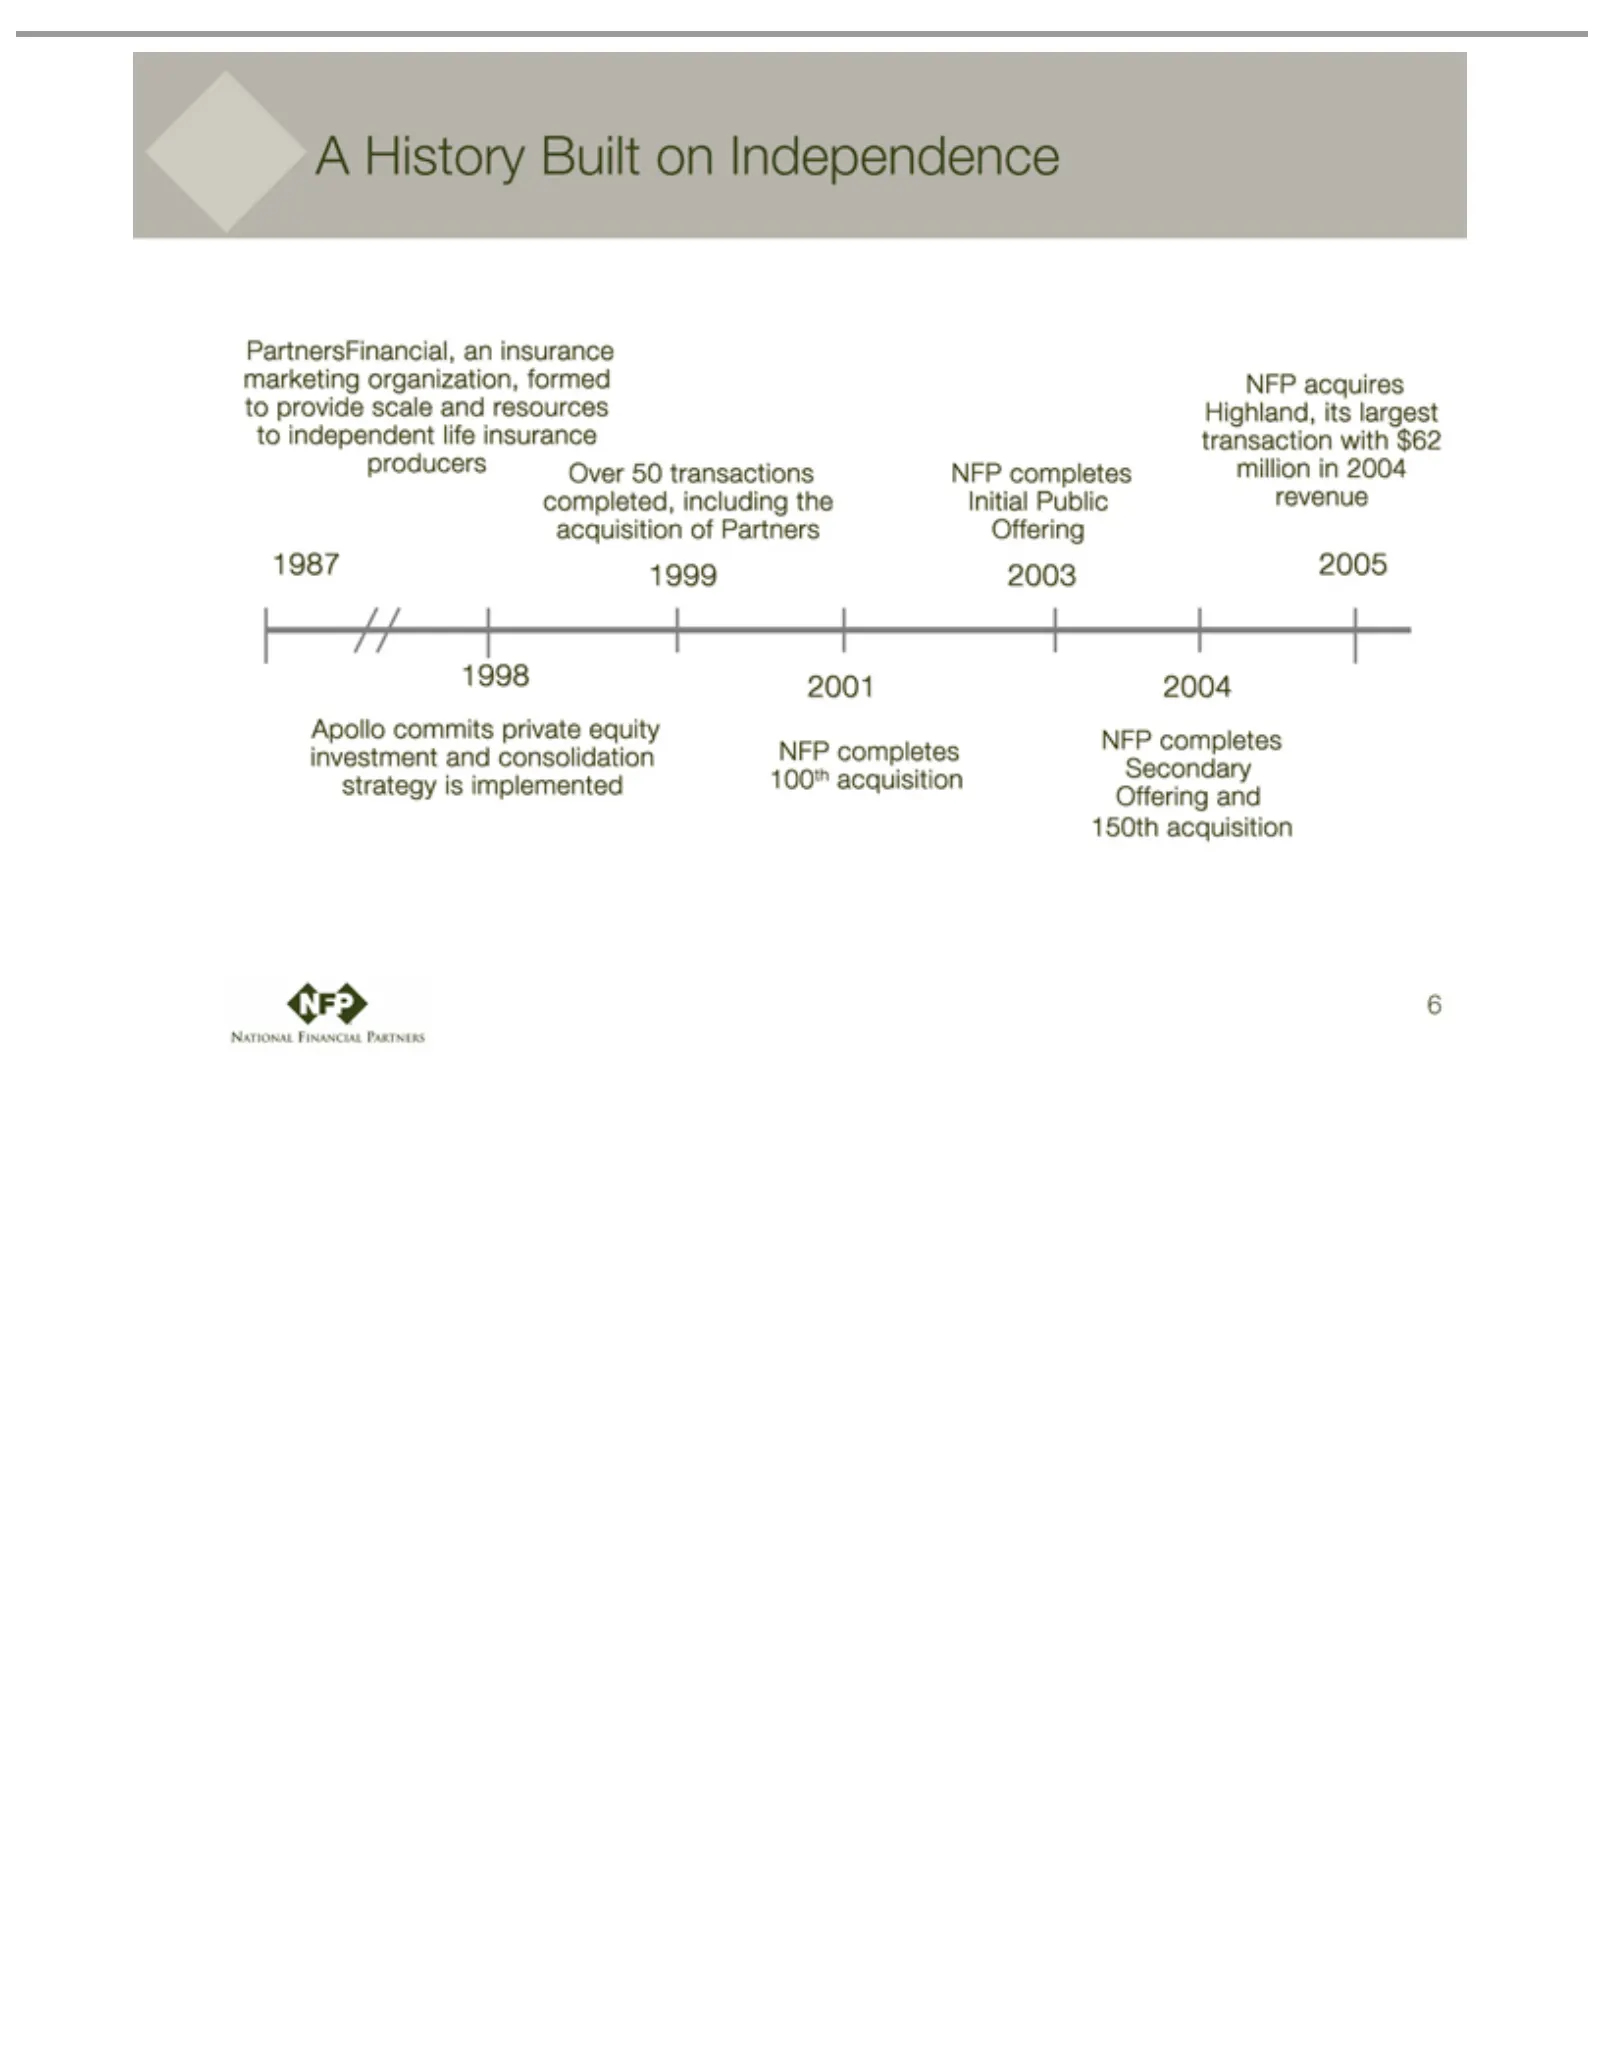
Slide 6: A History of Growth Built Over Time
A History PartnersFinancial, Over 1987 Apollo NFP 6 acquires completes 50 1998 commits transactions Built 1999 Highland, Initial 100th on private 2001 an Independence completed, insurance acquisition Public 2003 equity its largest 2004 Offering investment marketing including 2005 NFP transaction com
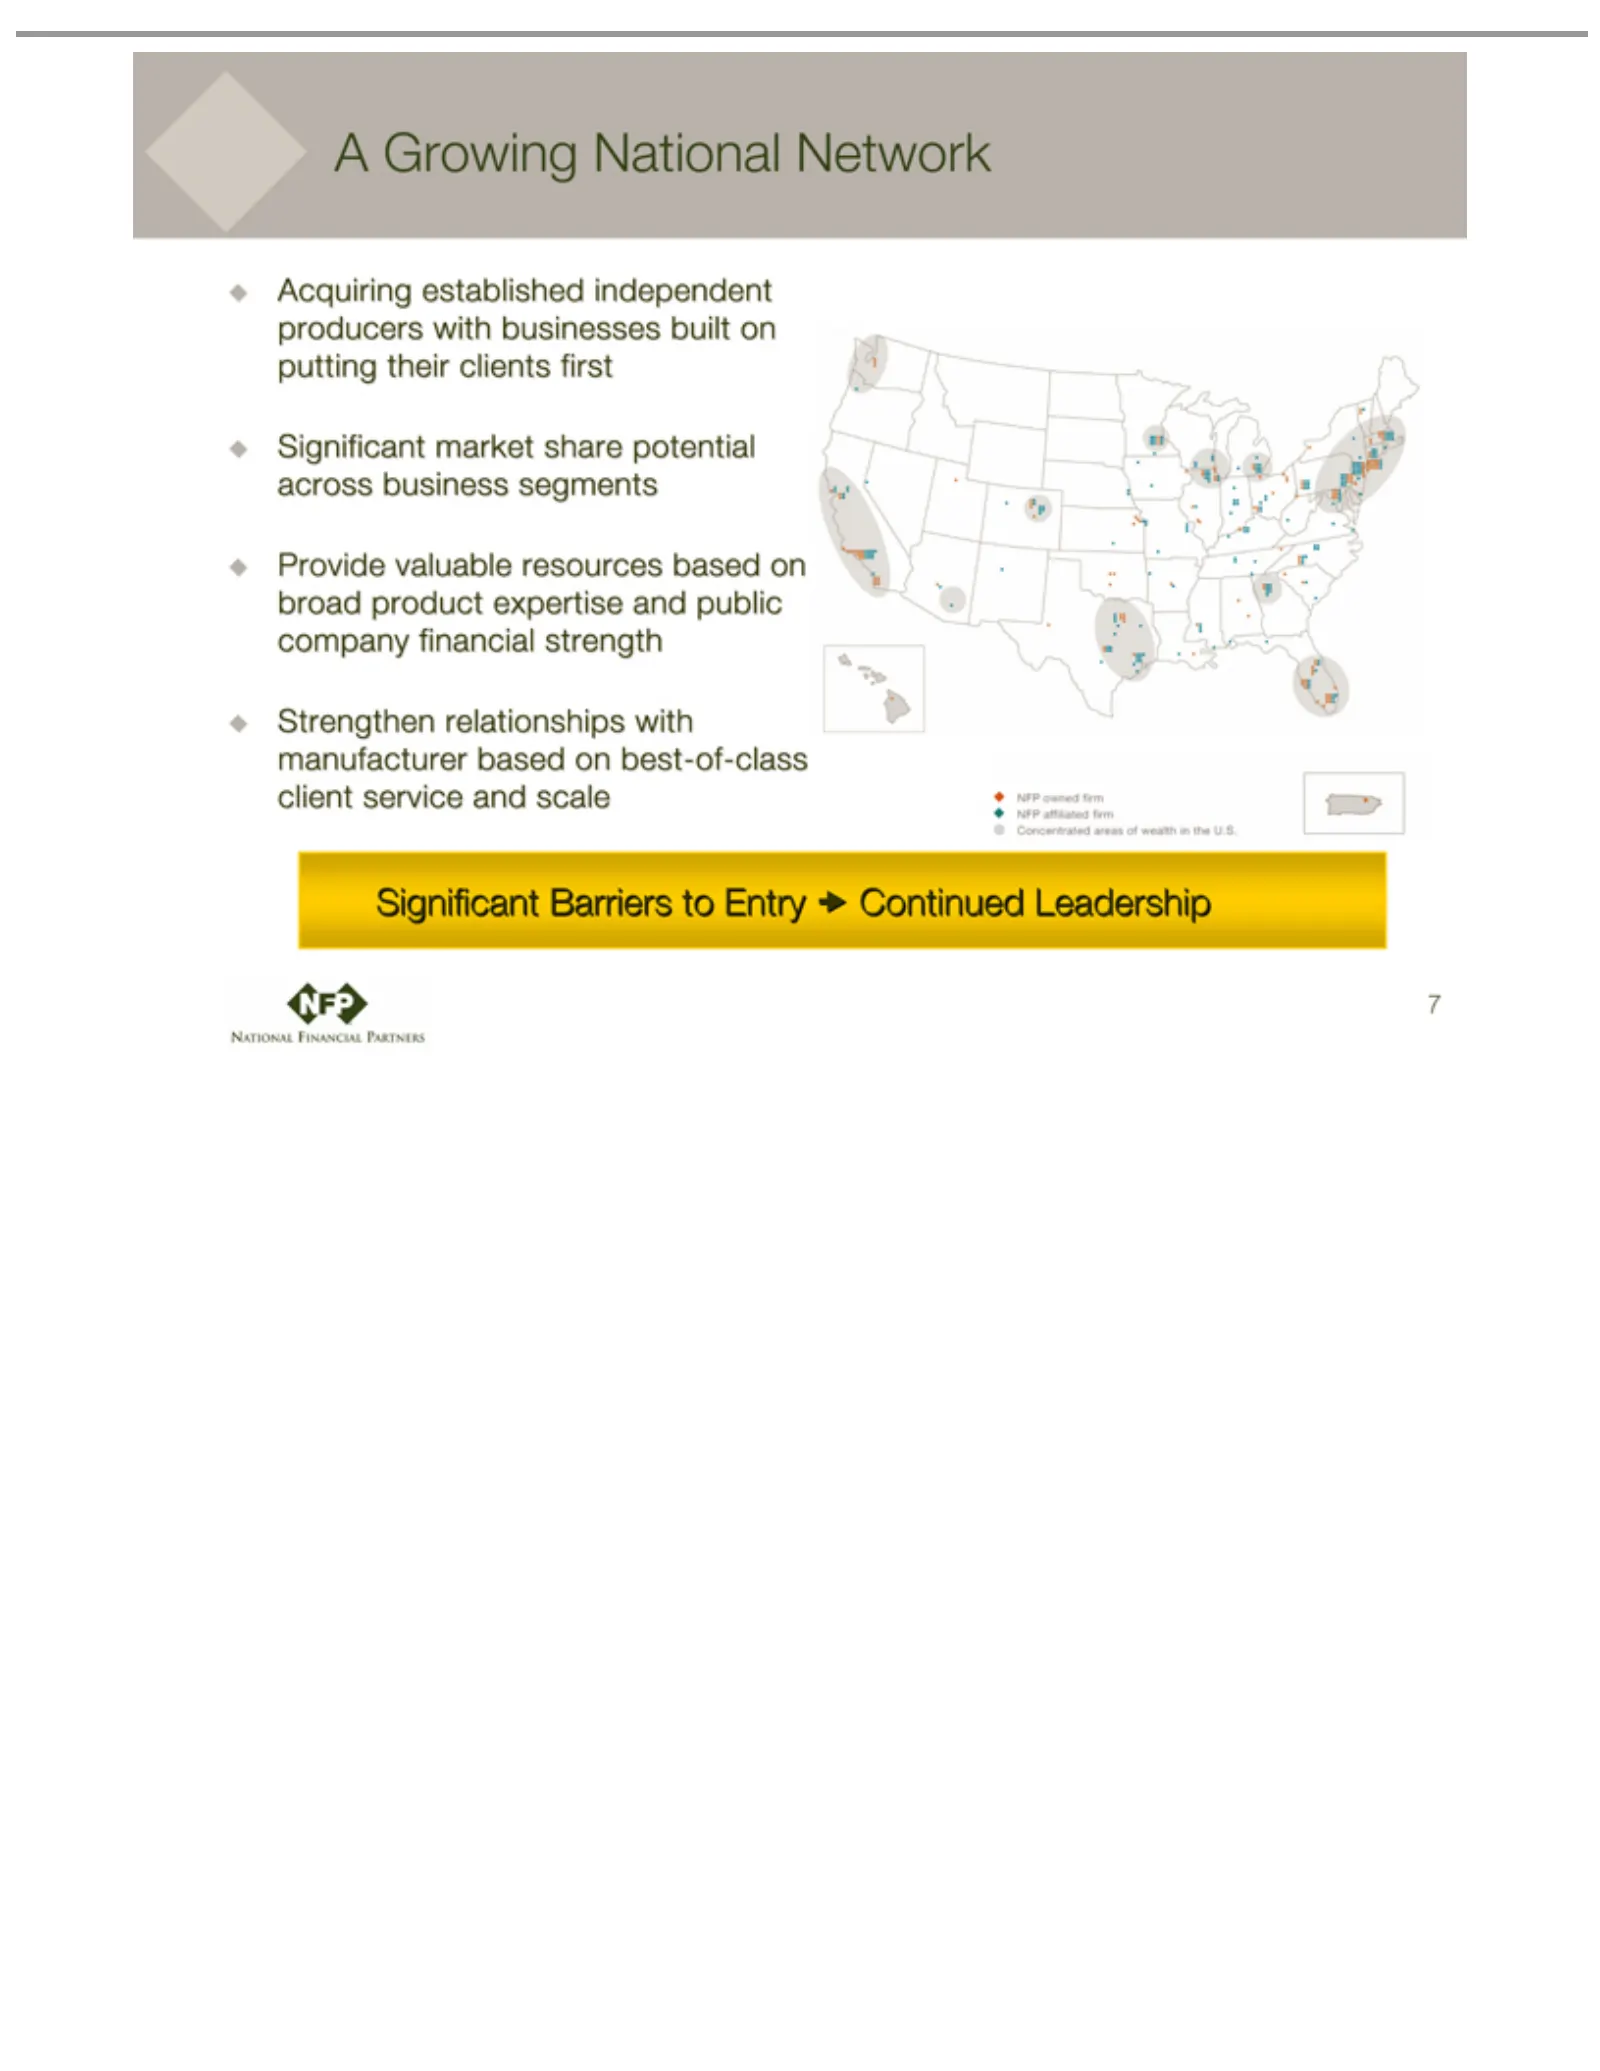
Slide 7: A Growing Network with Significant Barriers to Entry
A Growing Acquiring Provide Strengthen Significant NFP Concentrated 7 owned affiliated valuable established relationships market Barriers National firm areas firm resources share of toNetwork wealth independent Entry with potential based xContinued in manufacturer the on across producers U.S. broad
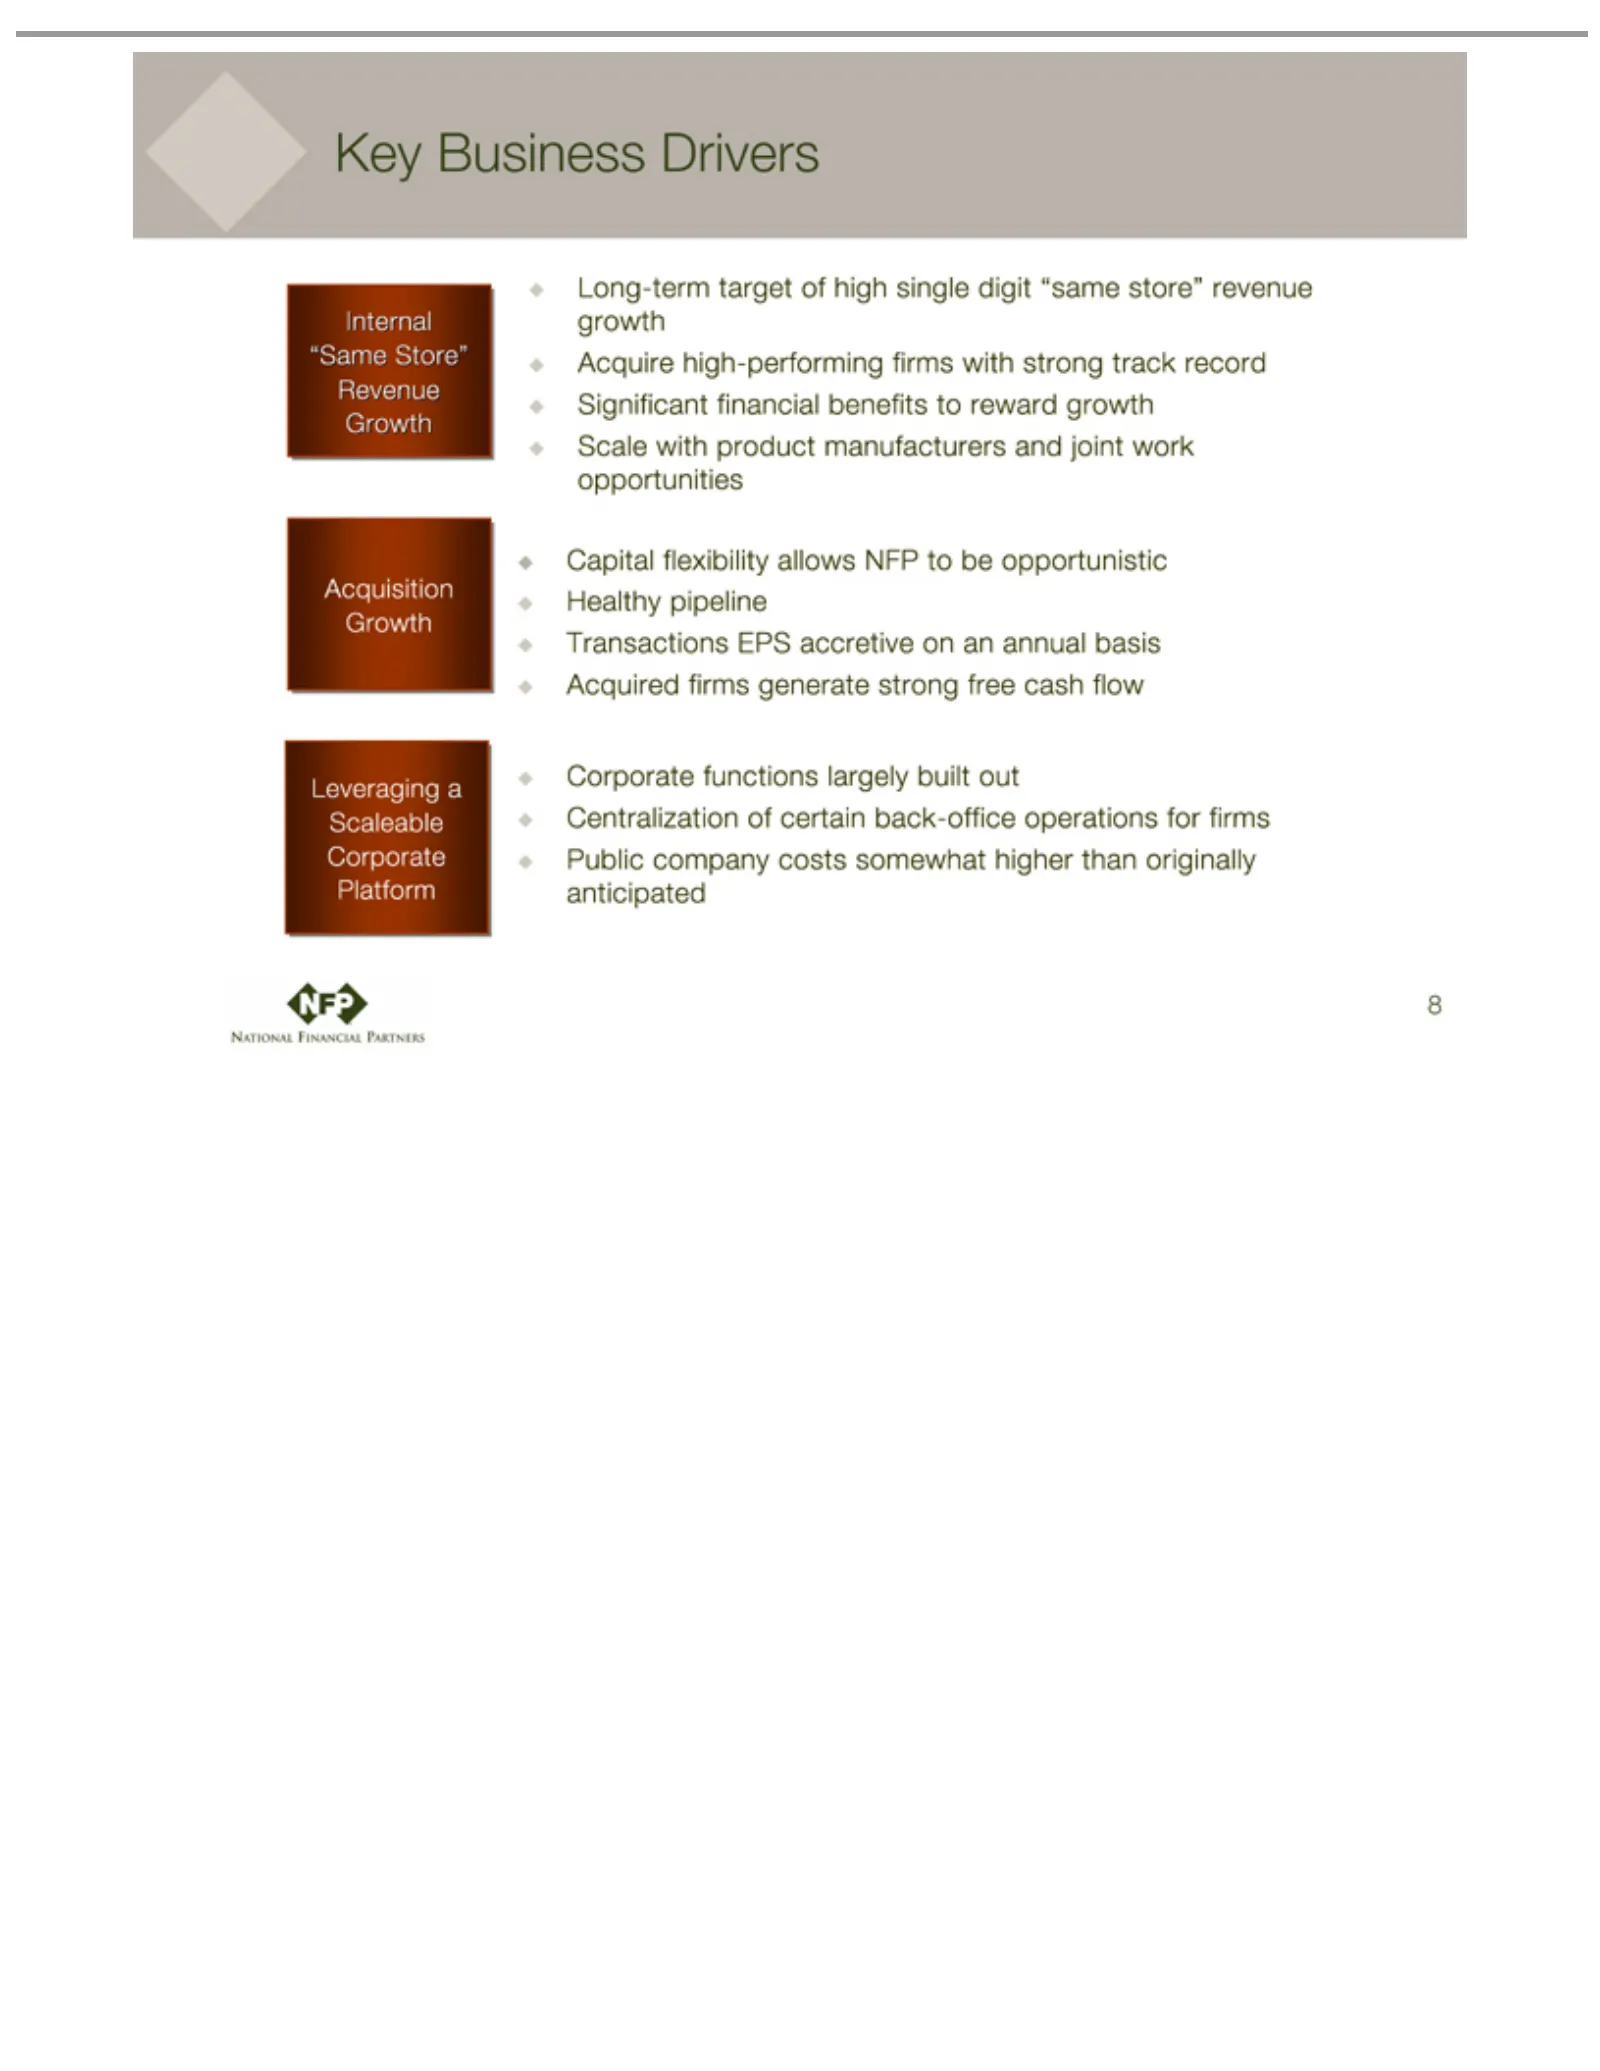
Slide 8: Key Business Drivers
Key Business Internal Long-term manufacturers Acquisition Capital Leveraging Corporate Centralization Public 8 company flexibility “Same functions target aGrowth Scaleable Drivers of and Store” costs certain of allows joint high largely somewhat Revenue Corporate work back-office single NFPbuilt opp
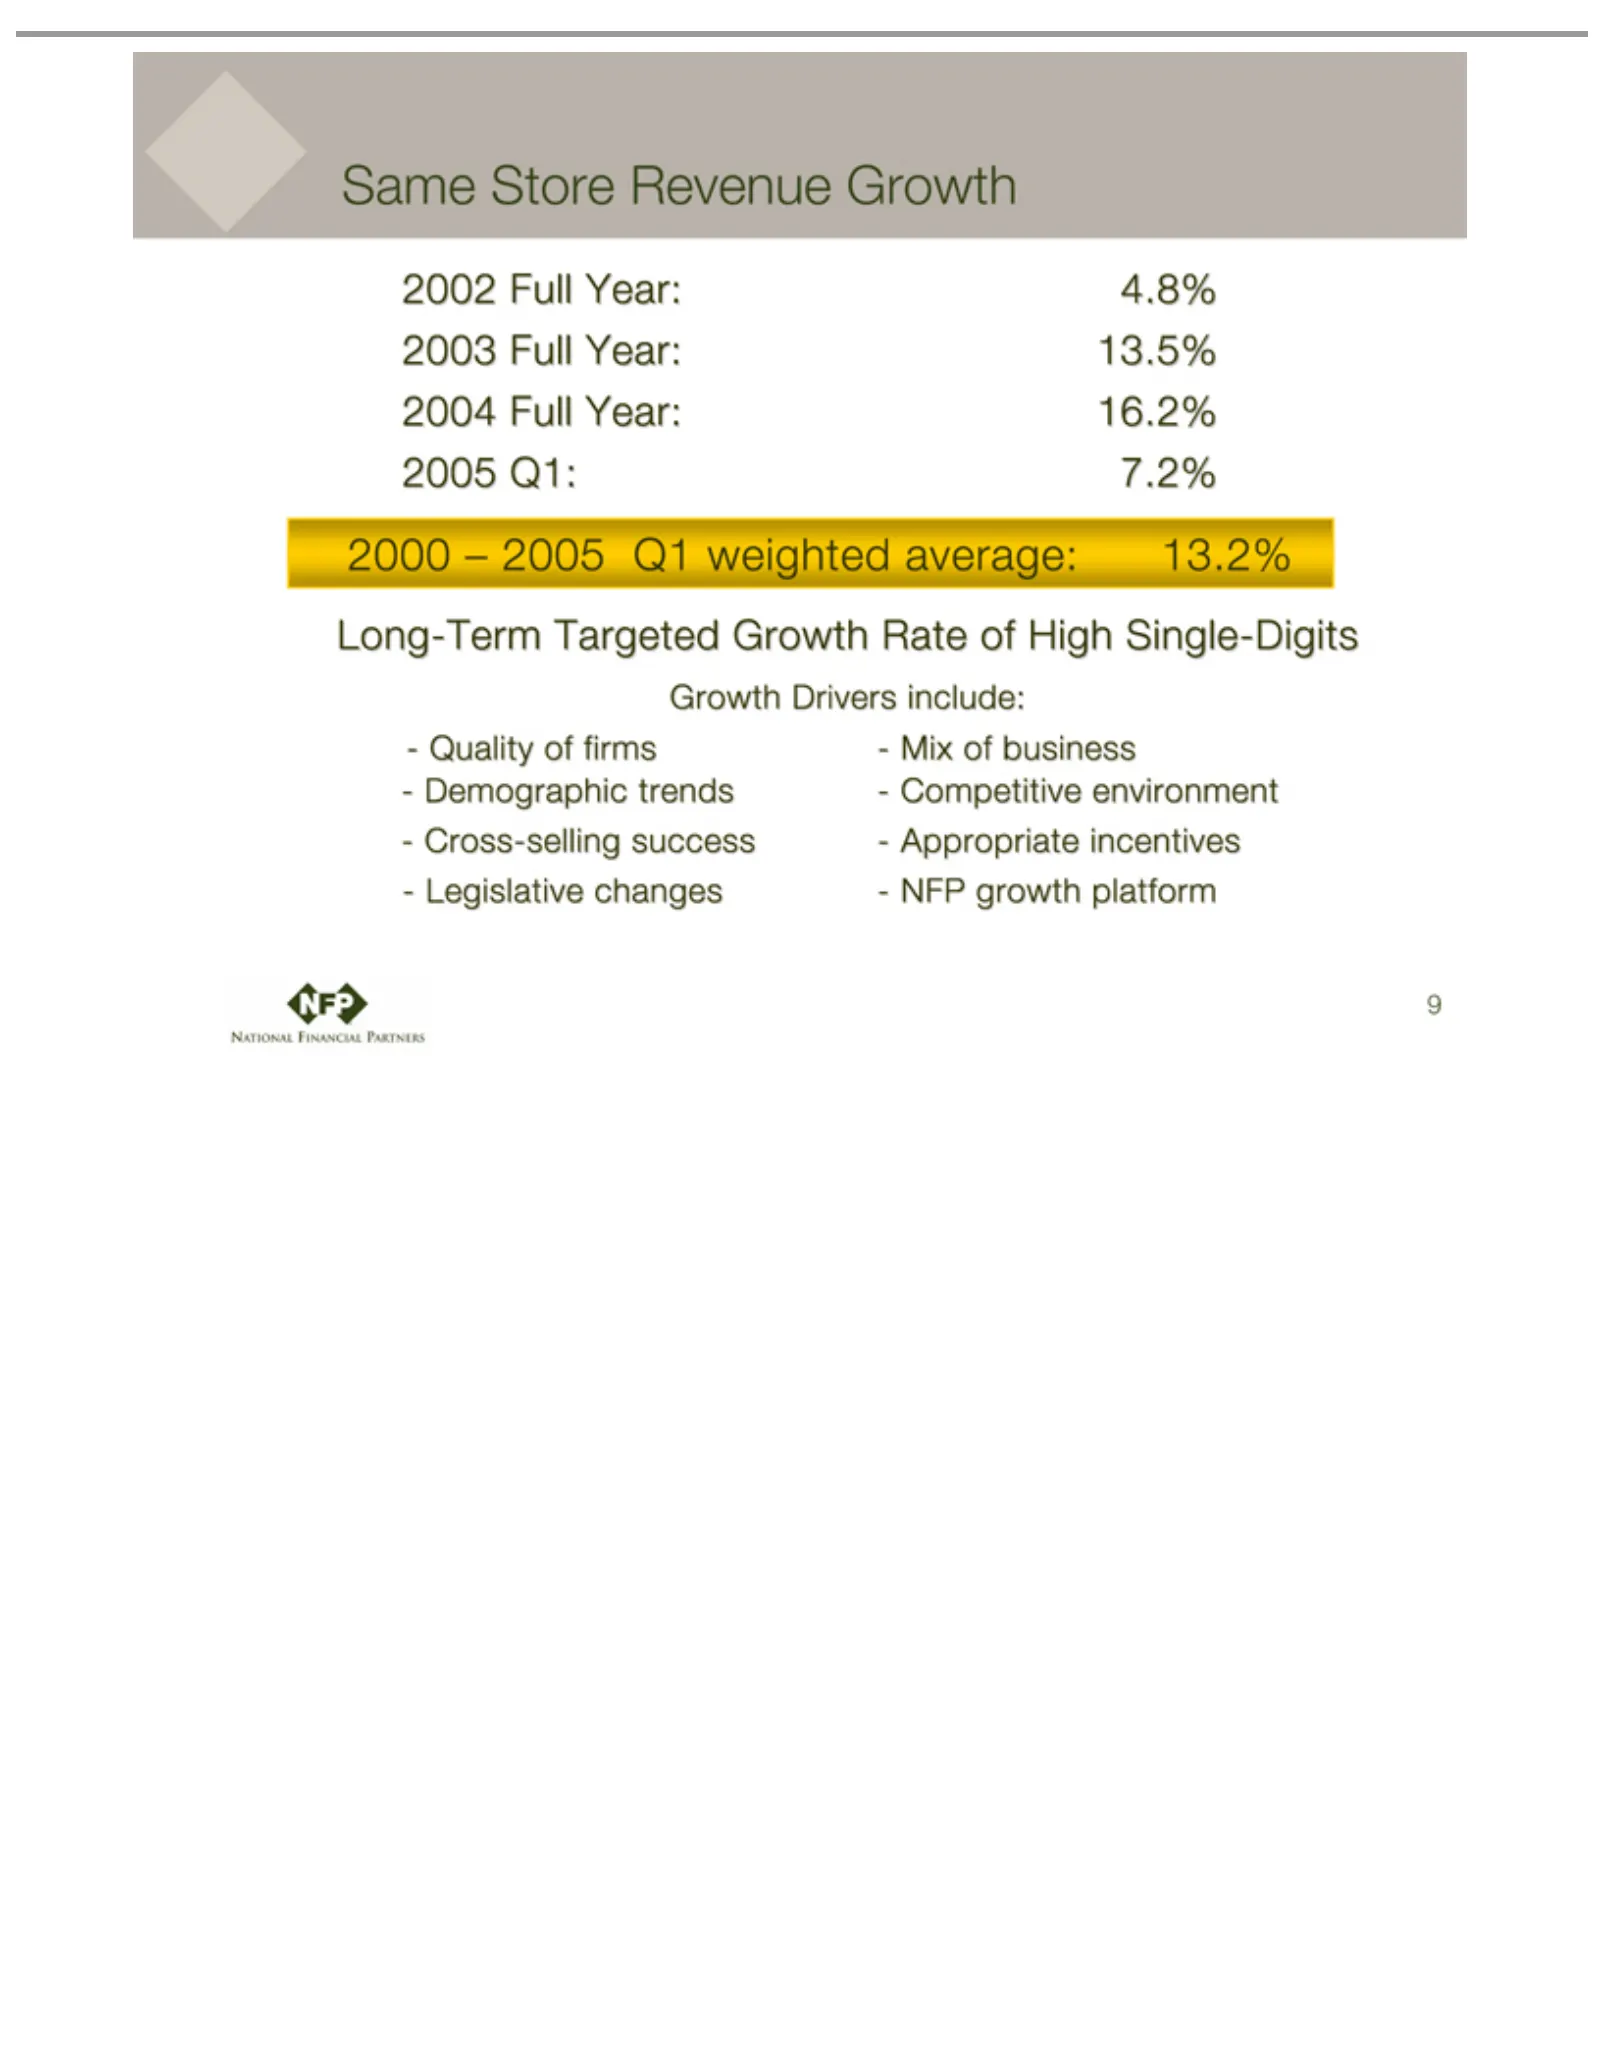
Slide 9: Same Store Revenue Growth and Long-Term Growth Drivers
Sameof 2002 2003 2004 2005 2000 Long-Term Growth Quality Mix Competitive 9 Full –Q1: Store 2005 business of Drivers 7.2% Year: firms Targeted Revenue environment Q116.2% 4.8% 13.5% include: Demographic weighted Growth Appropriate average: Rate trends of13.2% High Cross-selling incentives Single-Digi
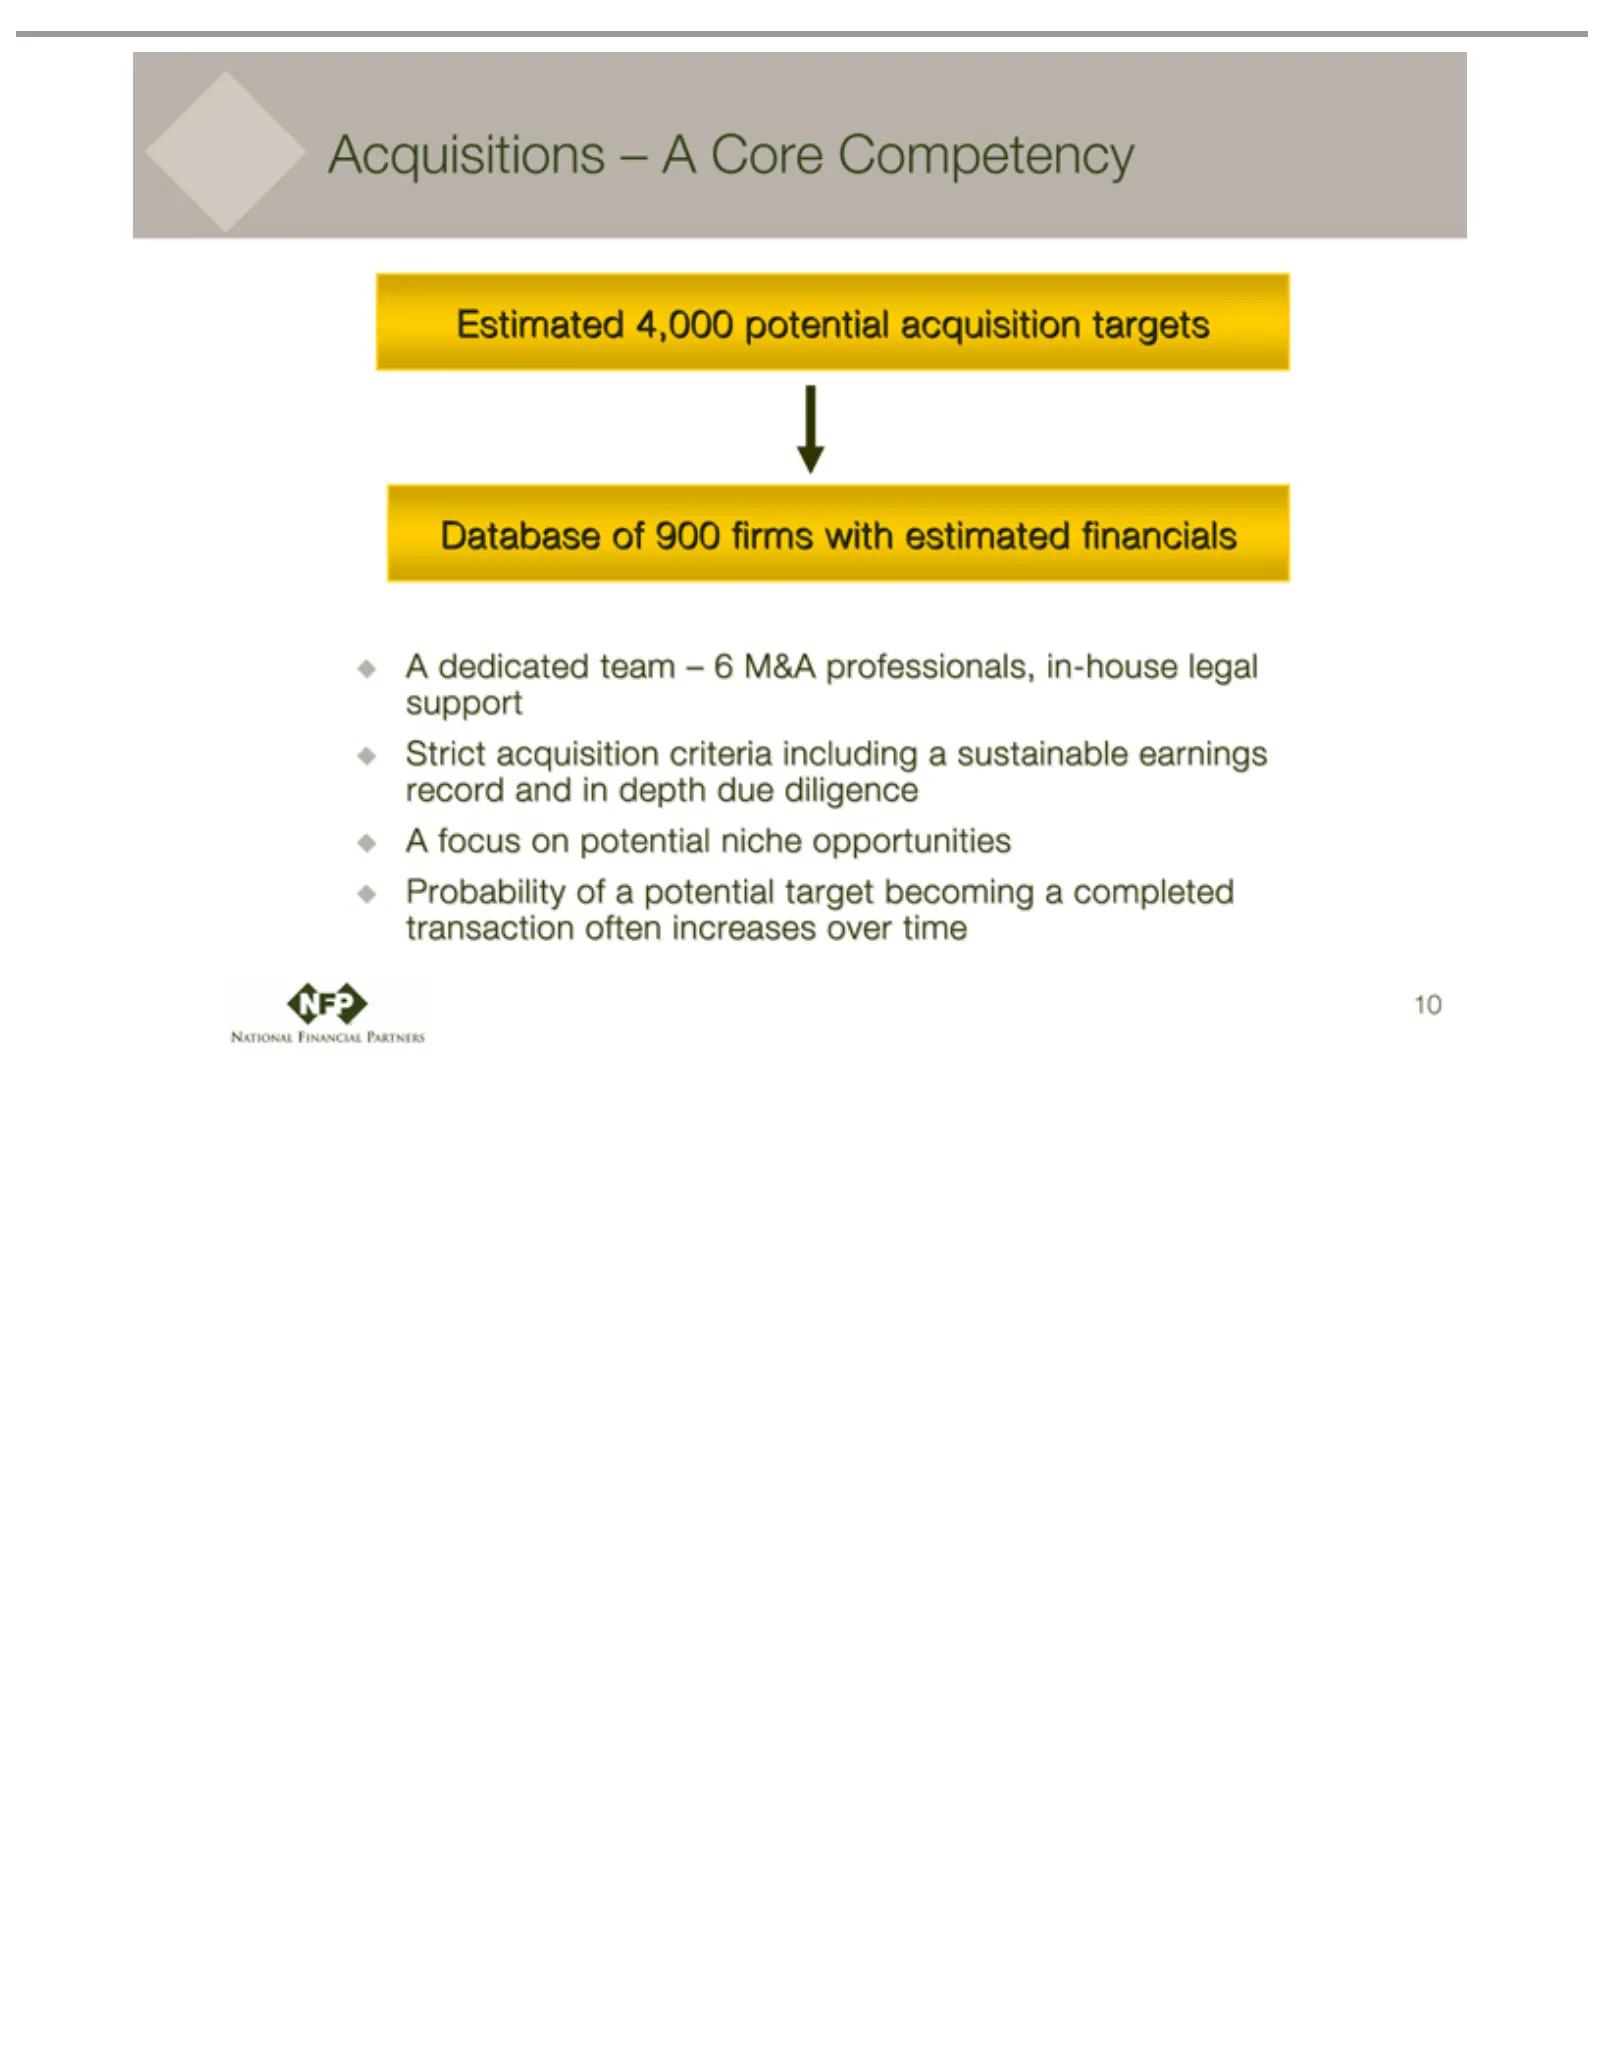
Slide 10: Acquisitions: A Core Competency
Acquisitions Estimated Database A Probability 10dedicated of4,000 of 900 team –aApotential firms potential Core – 6 M&A with Competency target acquisition estimated professionals, becoming targets financials ain-house completed legal transaction support Strict oftenacquisition increases over criteri
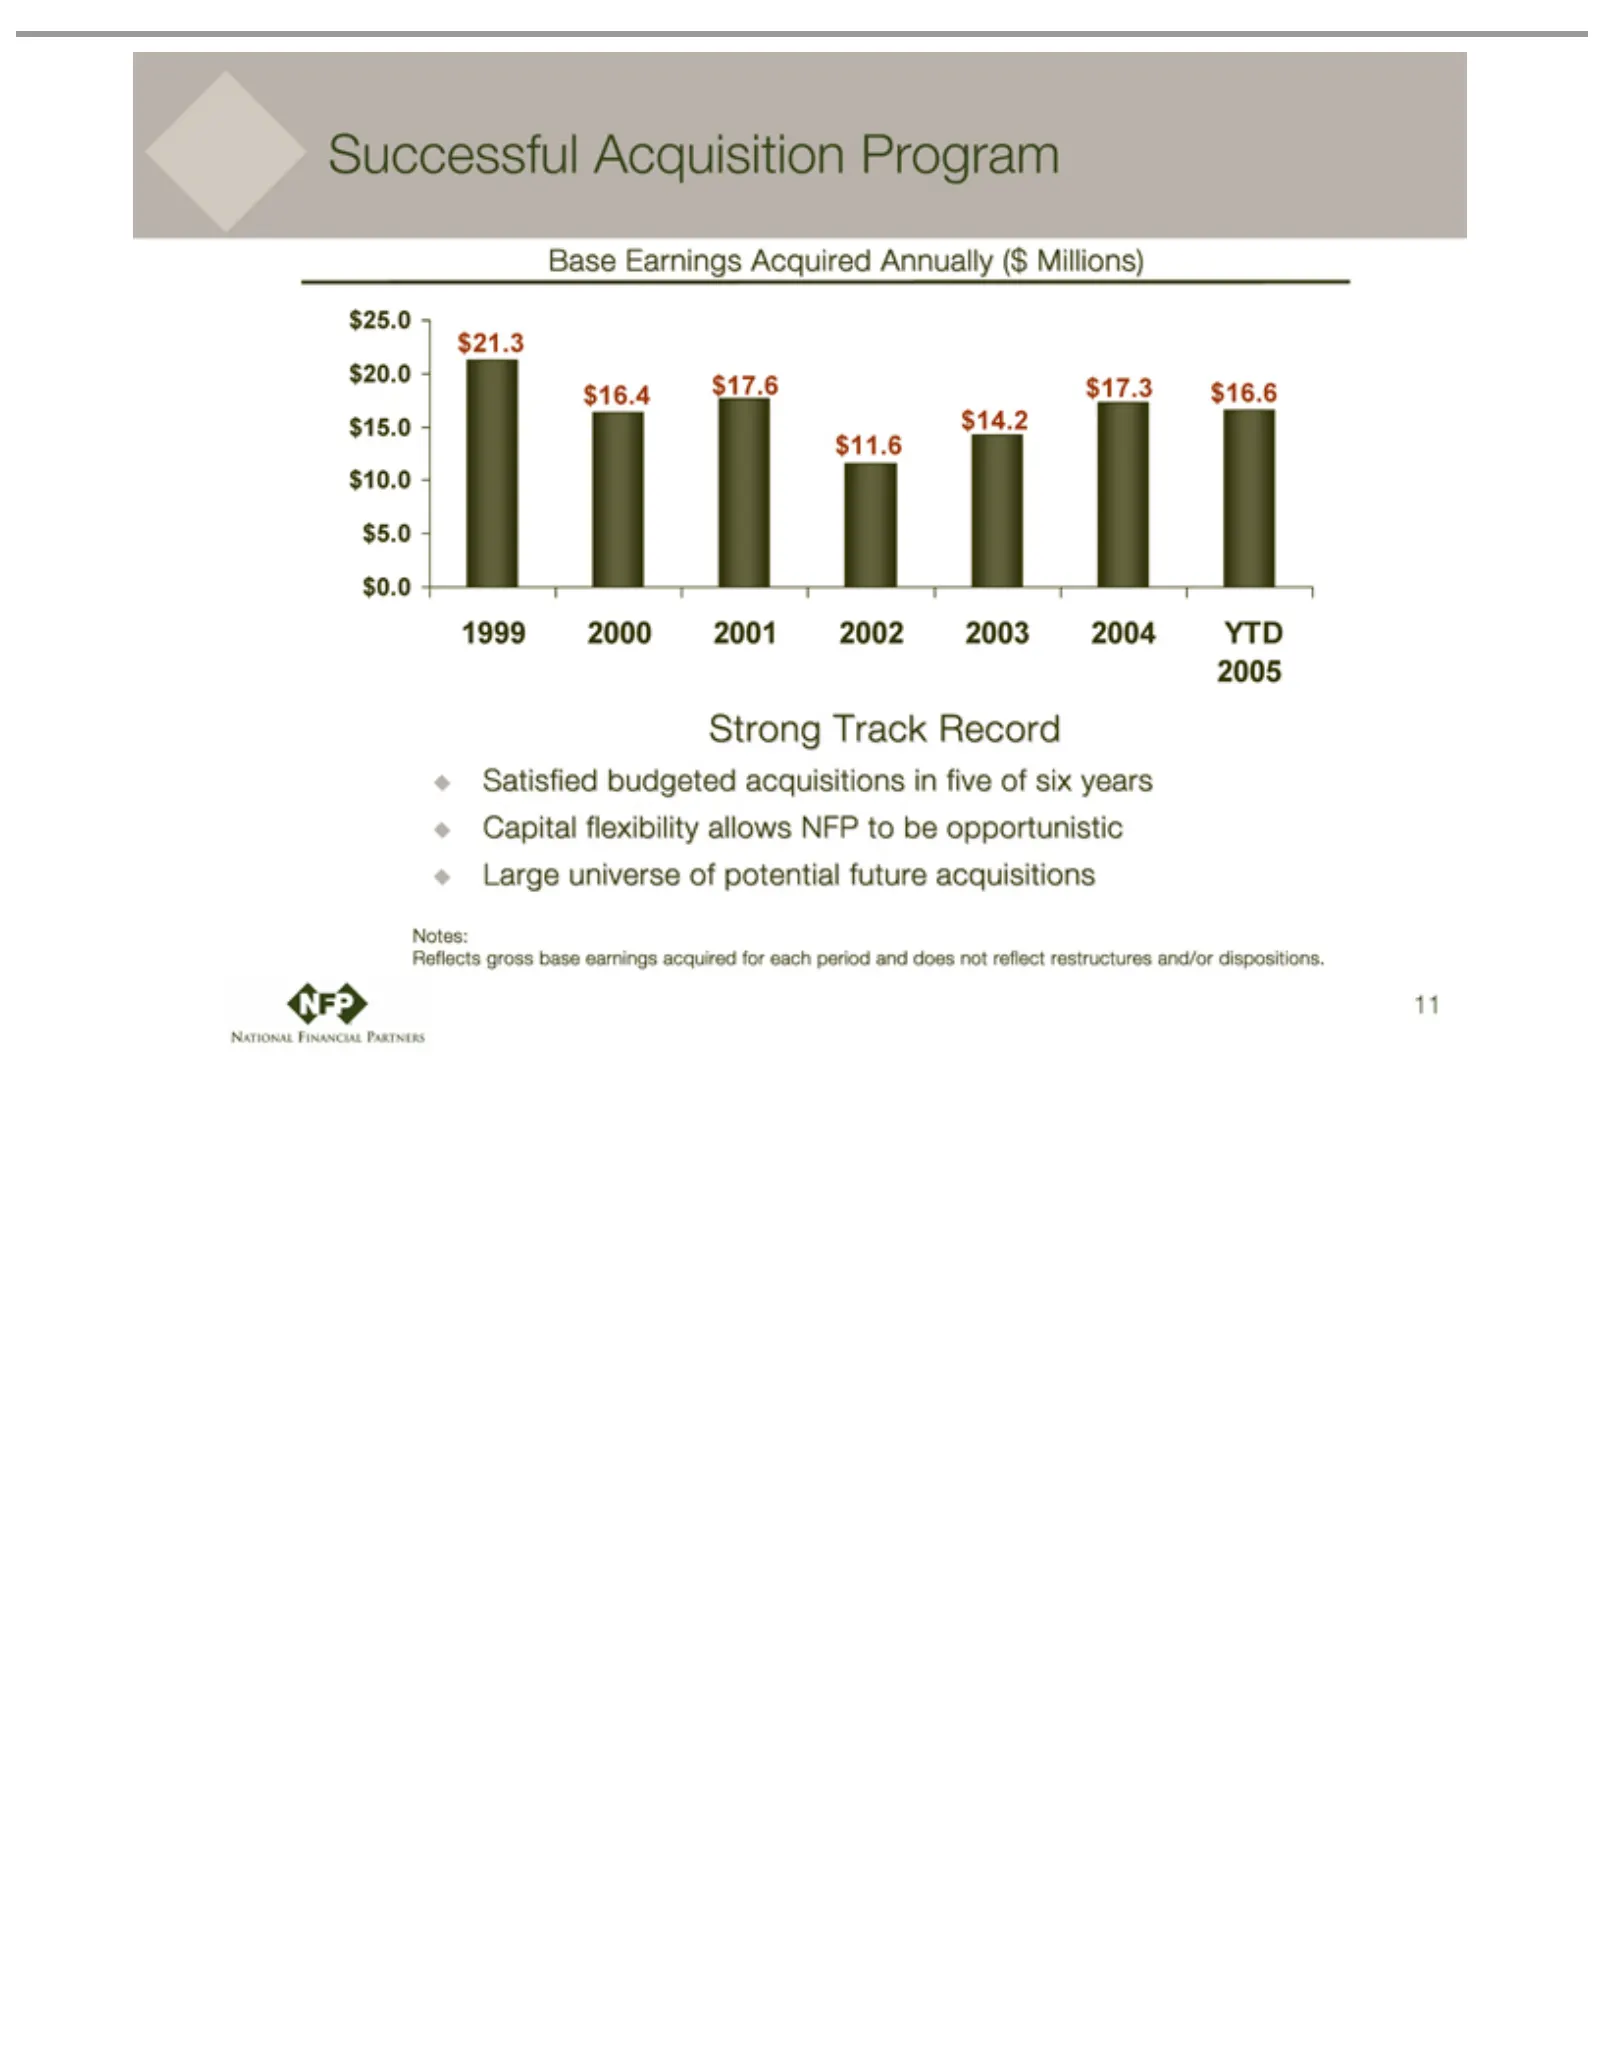
Slide 11: Successful Acquisition Program Track Record
Successful Base 1999 YTD Strong Satisfied Reflects Notes: 11 Earnings 2000 2005 Track gross budgeted Acquisition 2001 Record base Acquired 2002 acquisitions earnings 2003 Program Annually 2004 acquired in five ($Millions) for of six eachyears $25.0 period Capital $20.0 and does flexibility $15.0not$
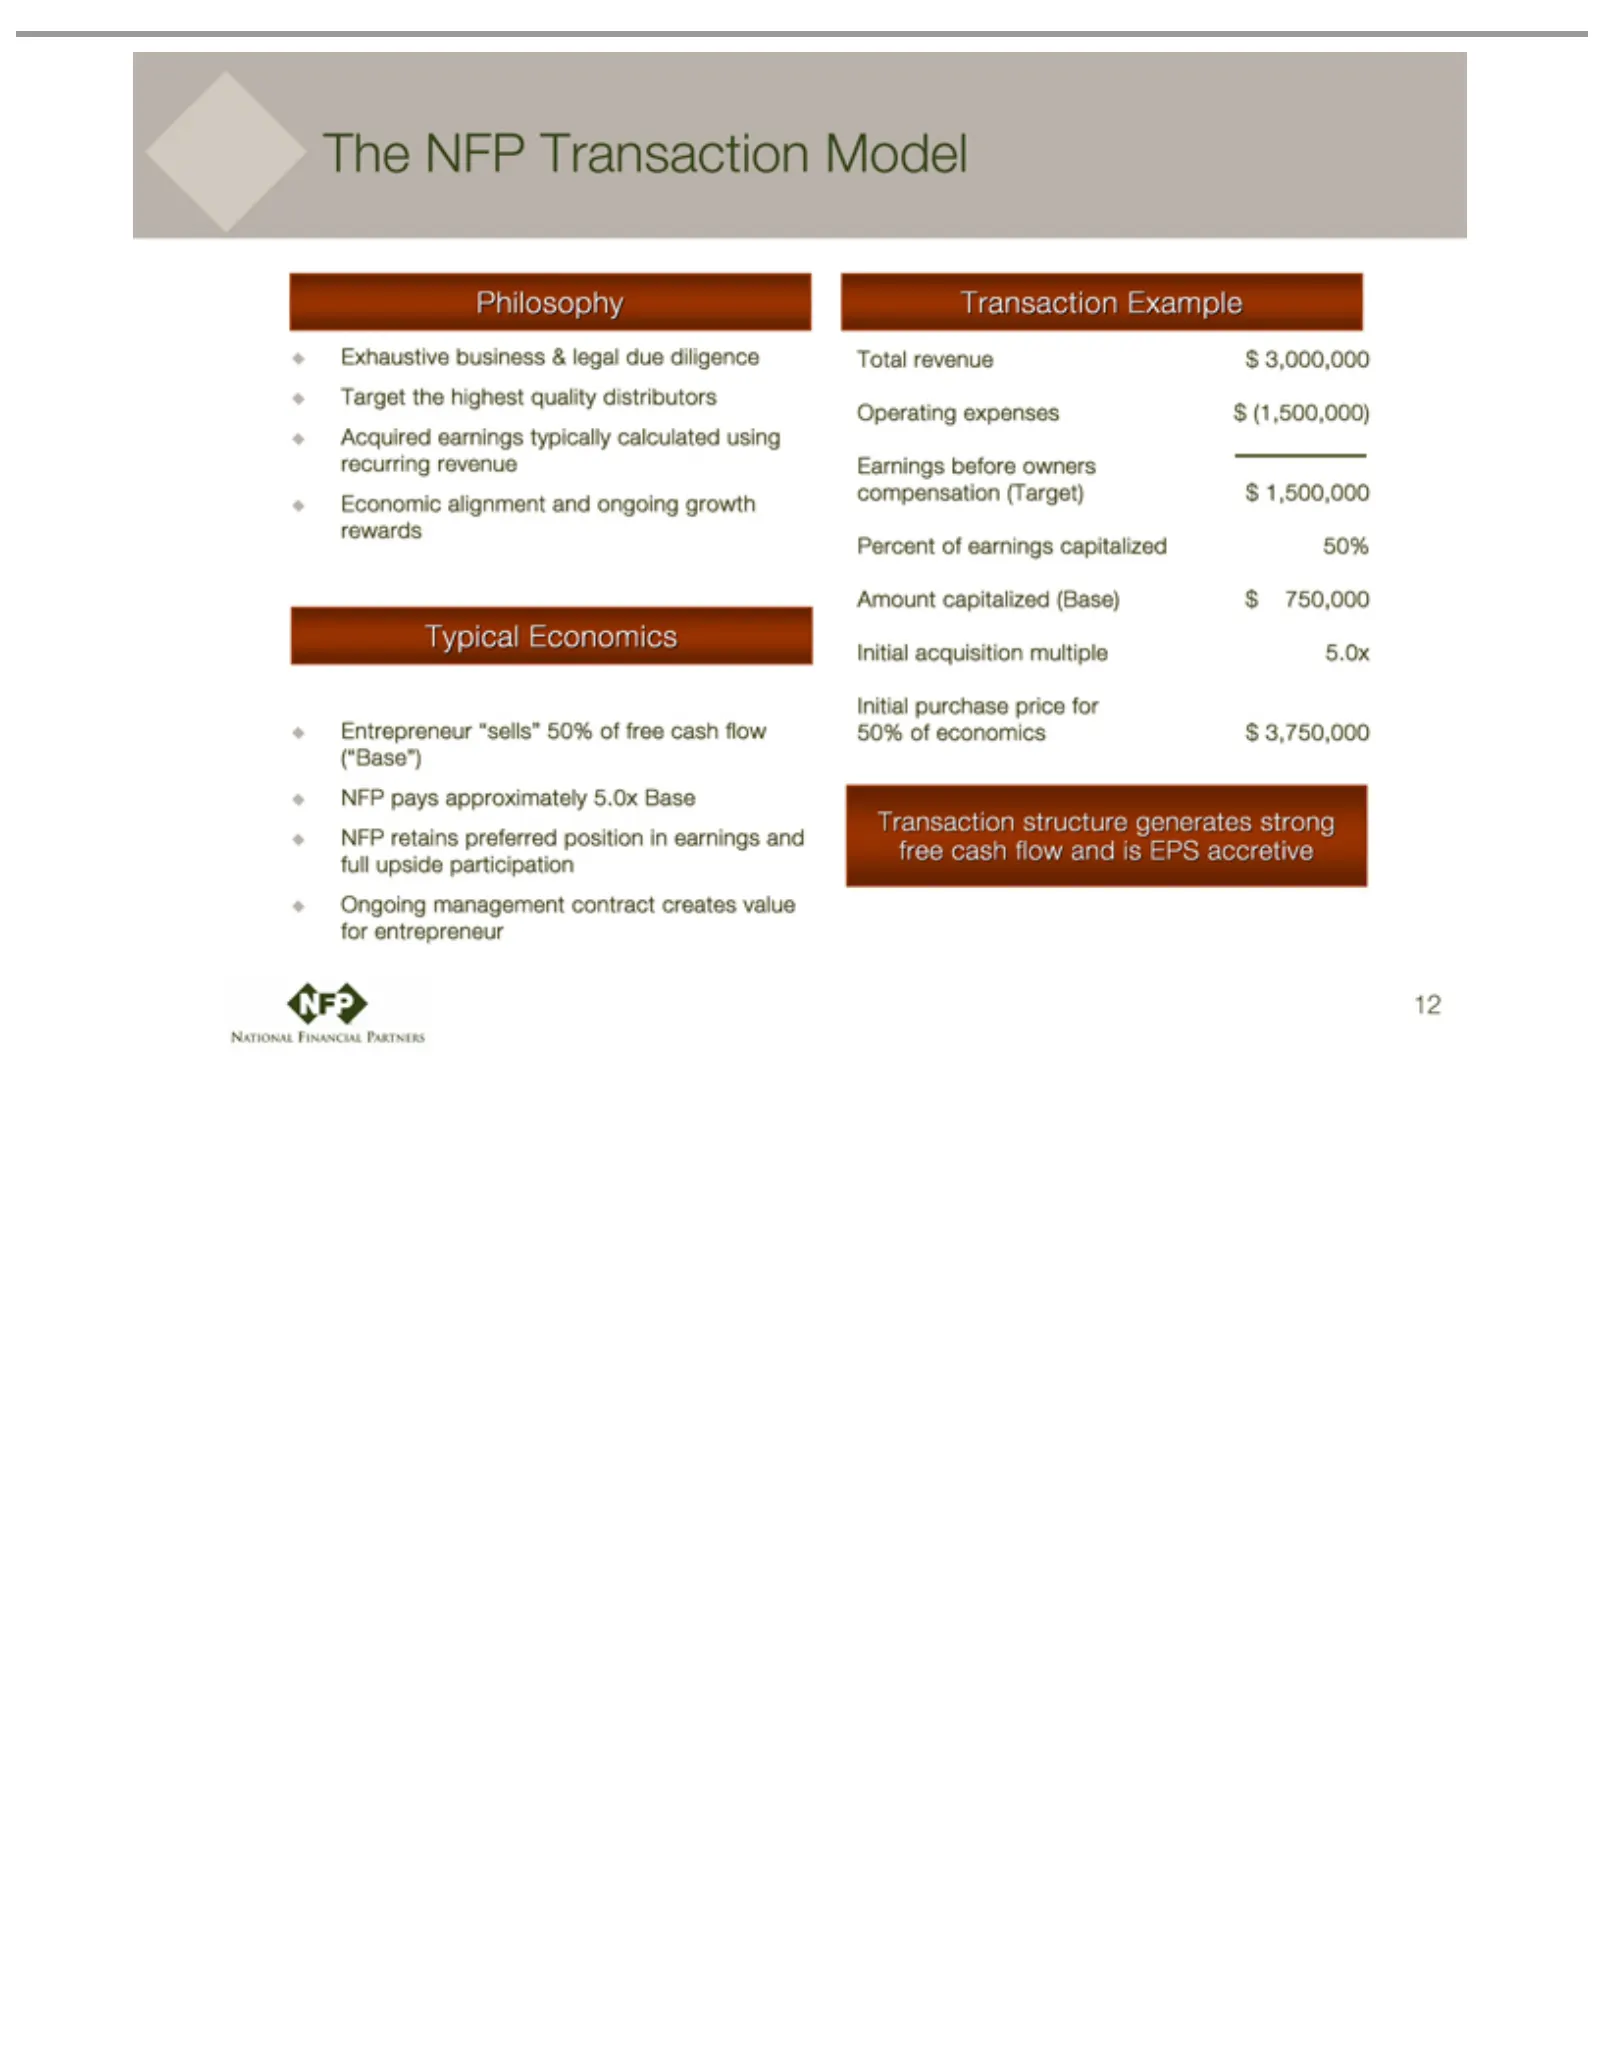
Slide 12: The NFP Economic Model: Transaction Philosophy
The NFP Exhaustive Philosophy Target Acquired Economic Typical Entrepreneur NFP Ongoing Total Operating Earnings compensation Percent Amount Initial 50% Transaction 12 pays retains of revenue acquisition purchase the economics Economics of capitalized management before Transaction earnings approxima
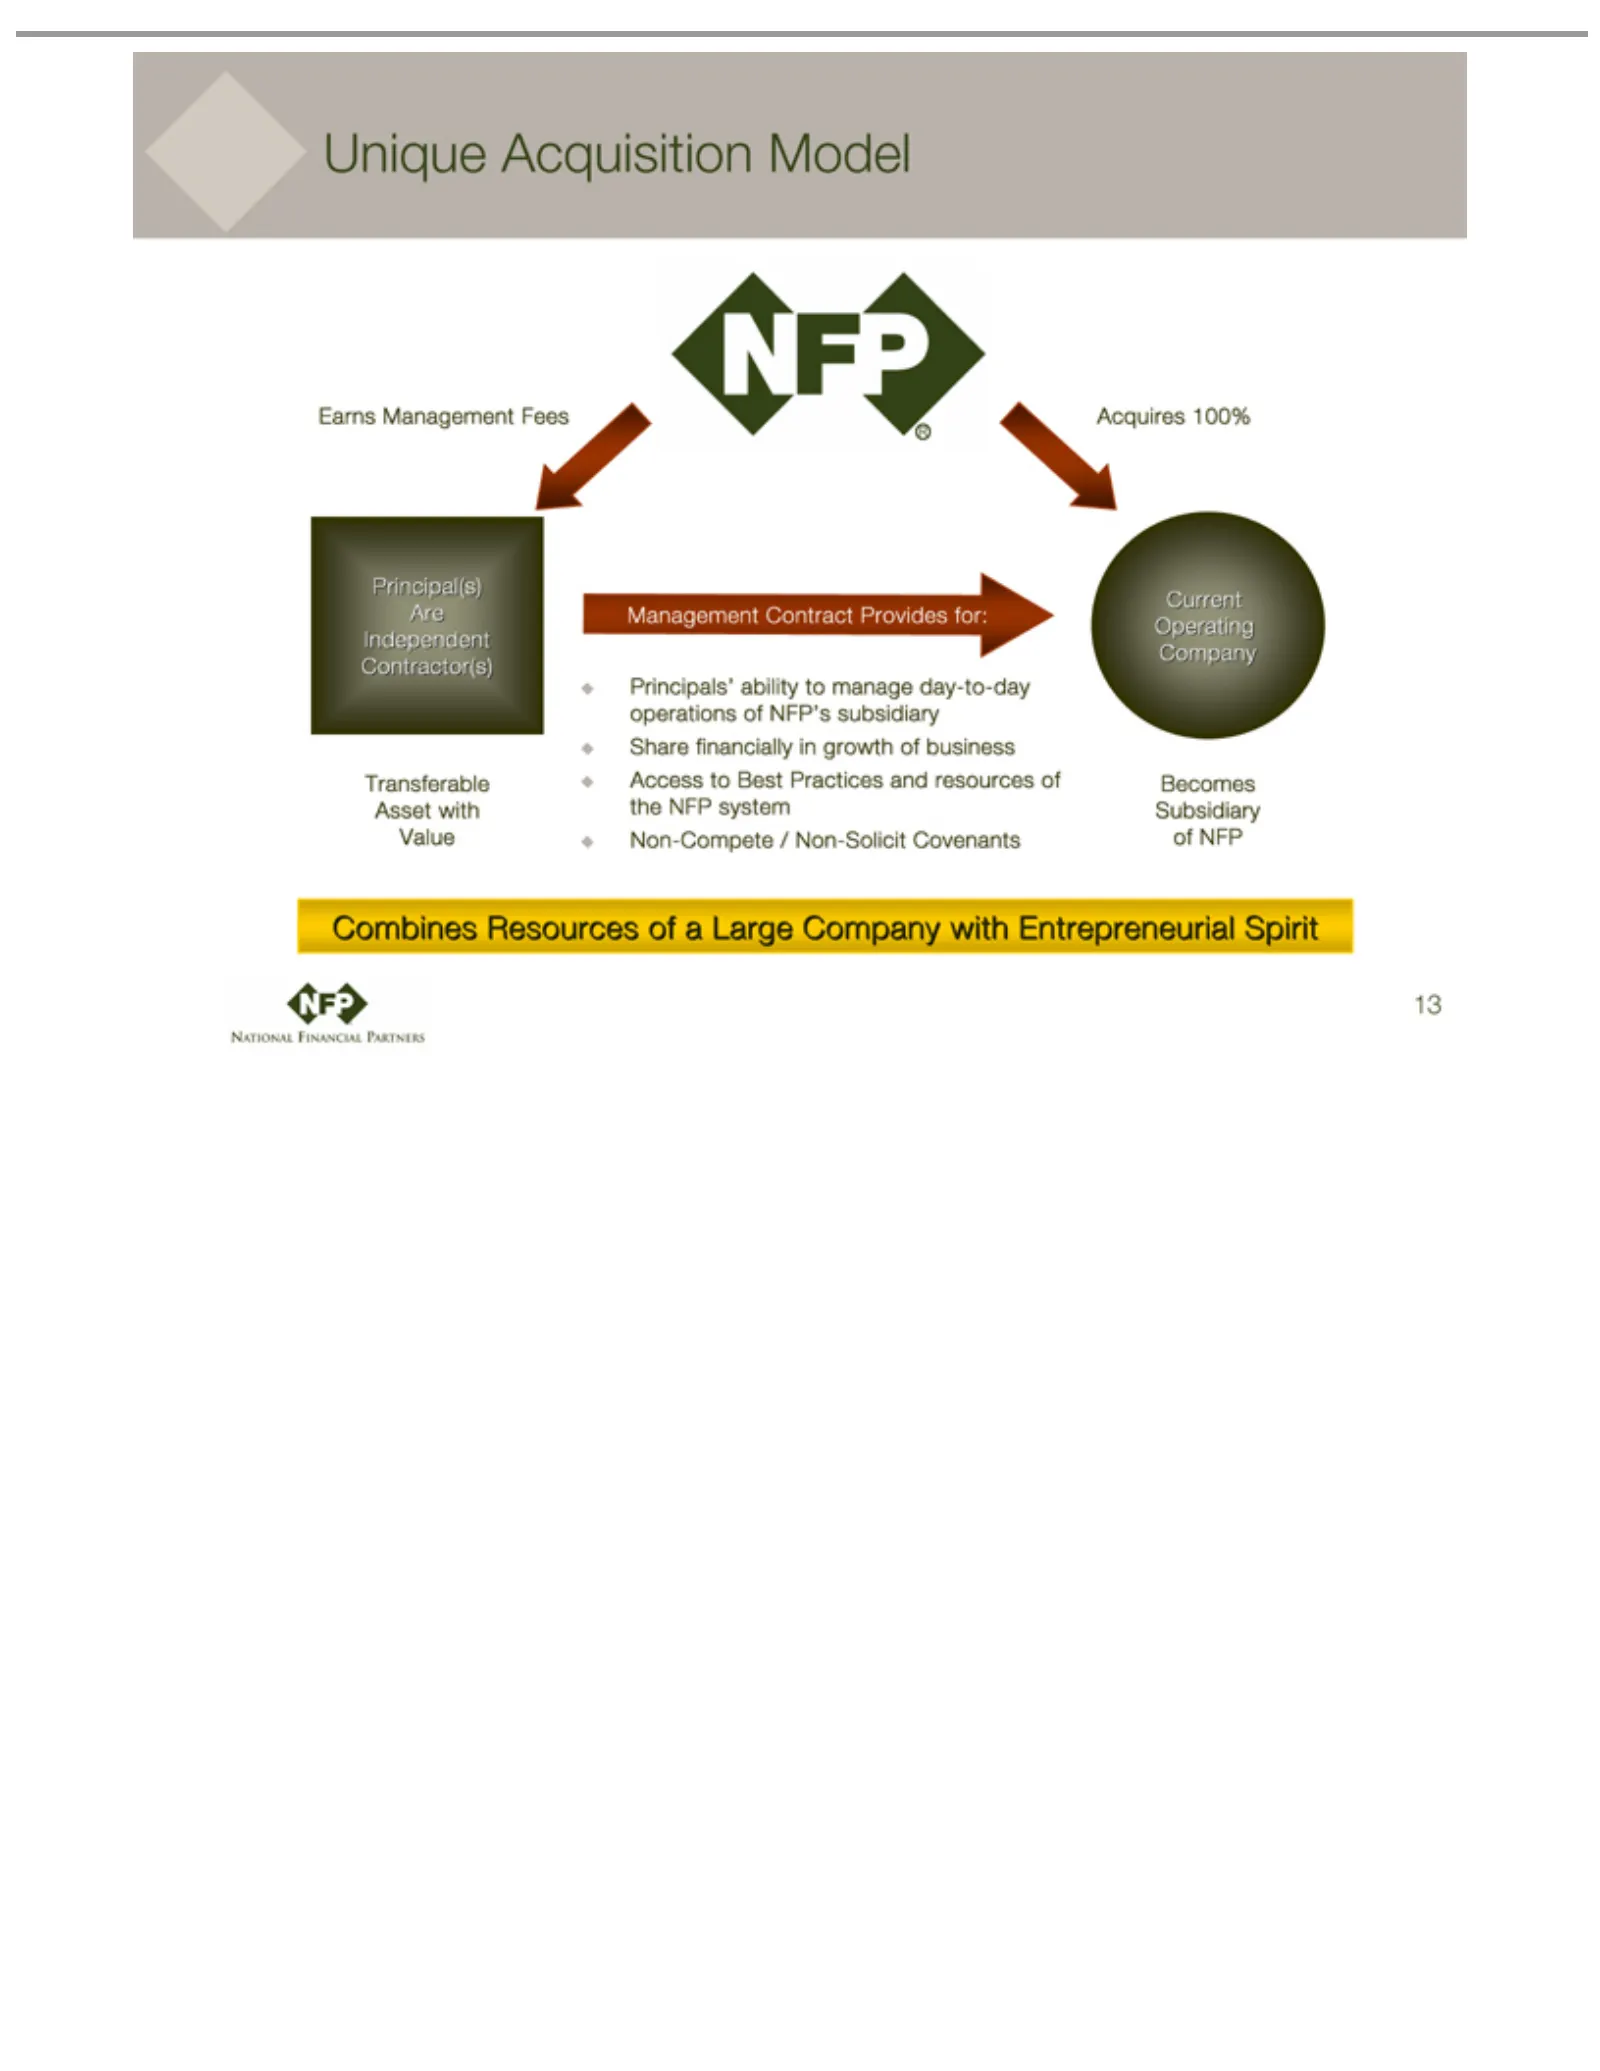
Slide 13: Unique Management Acquisition Model
UniqueManagement Earns Principal(s) Transferable Management Acquires Current Principals’ Becomes Covenants Combines 13 Acquisition Operating 100% Subsidiary Resources ability Are Asset Contract Independent to Company with fees Model manage of ofProvides NFP Value a Large day-to-day Contractor(s) for
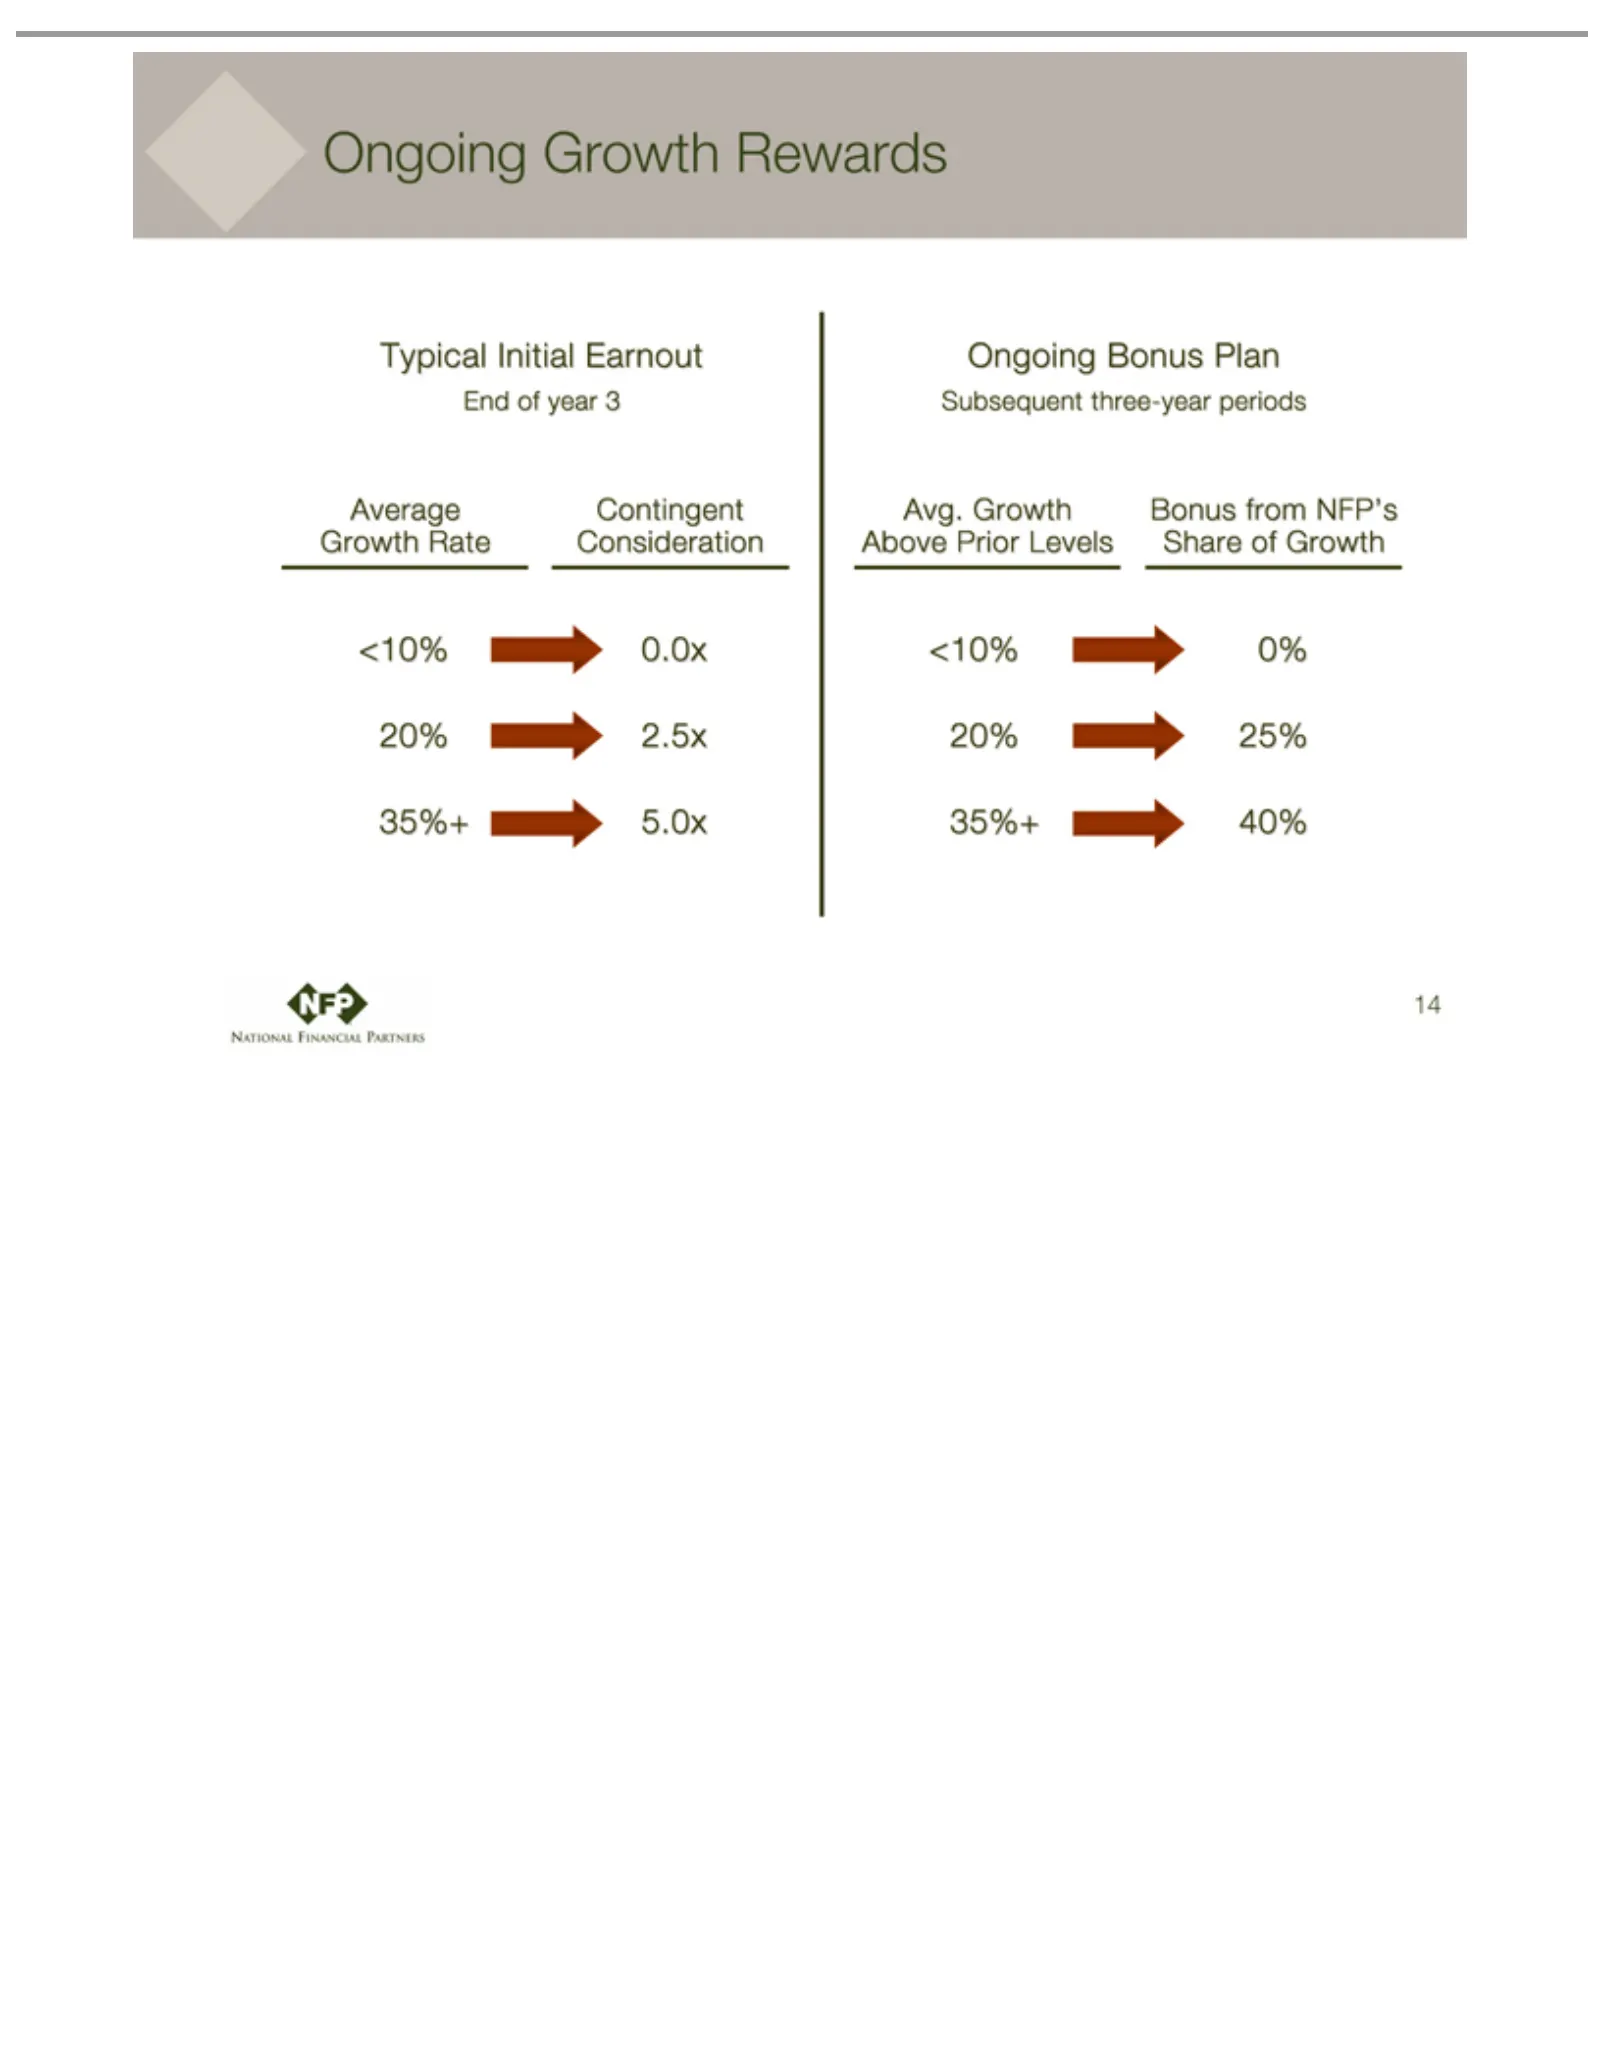
Slide 14: Typical Earnout Growth Rewards
Typical End Average Growth Ongoing Subsequent Avg. Above <10% 20% 35%+ 14 of 2.5x 25% Growth 0.0x 5.0x 0% 40% Prior year Initial Rate Contingent Growth Bonus three-year 3Levels Consideration Bonus Earnout Plan Rewards Share from periods NFP’s of Growth
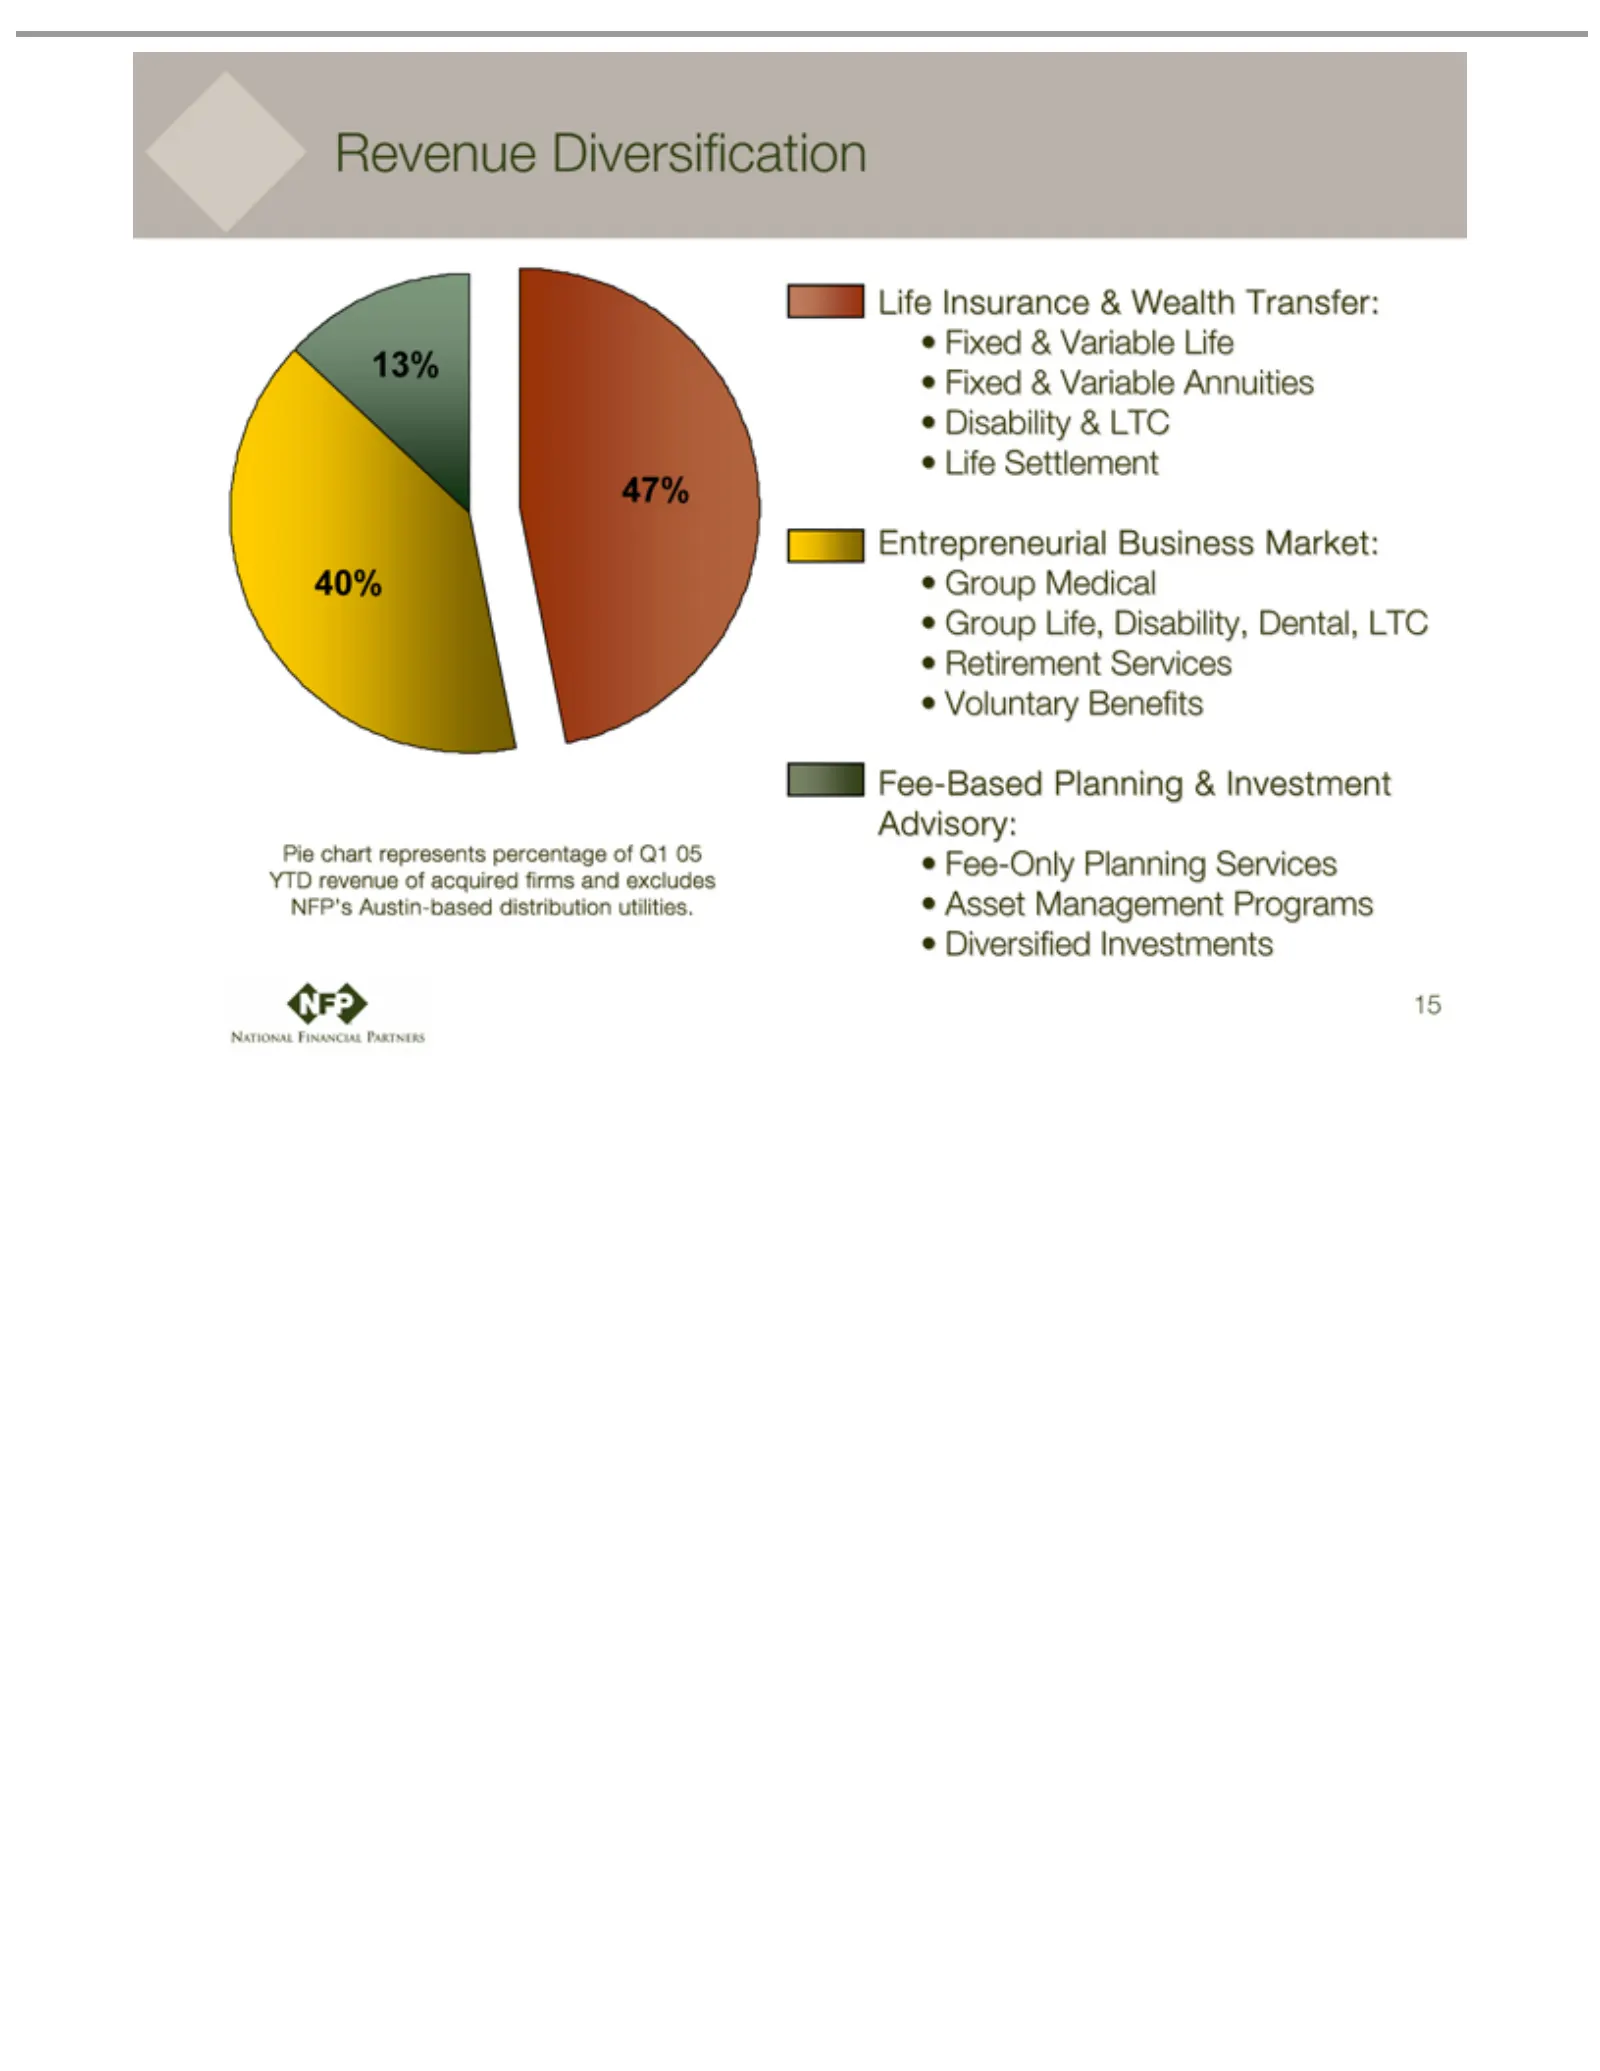
Slide 15: Revenue Diversification
Revenue 40% 47% 13% Fixed Life Entrepreneurial Group Fee-Based Fee-Only Pie 15 chart Insurance Settlement & Medical Life, Variable Diversification represents Planning Planning Disability, &Business Wealth Life Services percentage &Fixed Investment Dental, Transfer: Market: Asset & LTC Variable of Q1
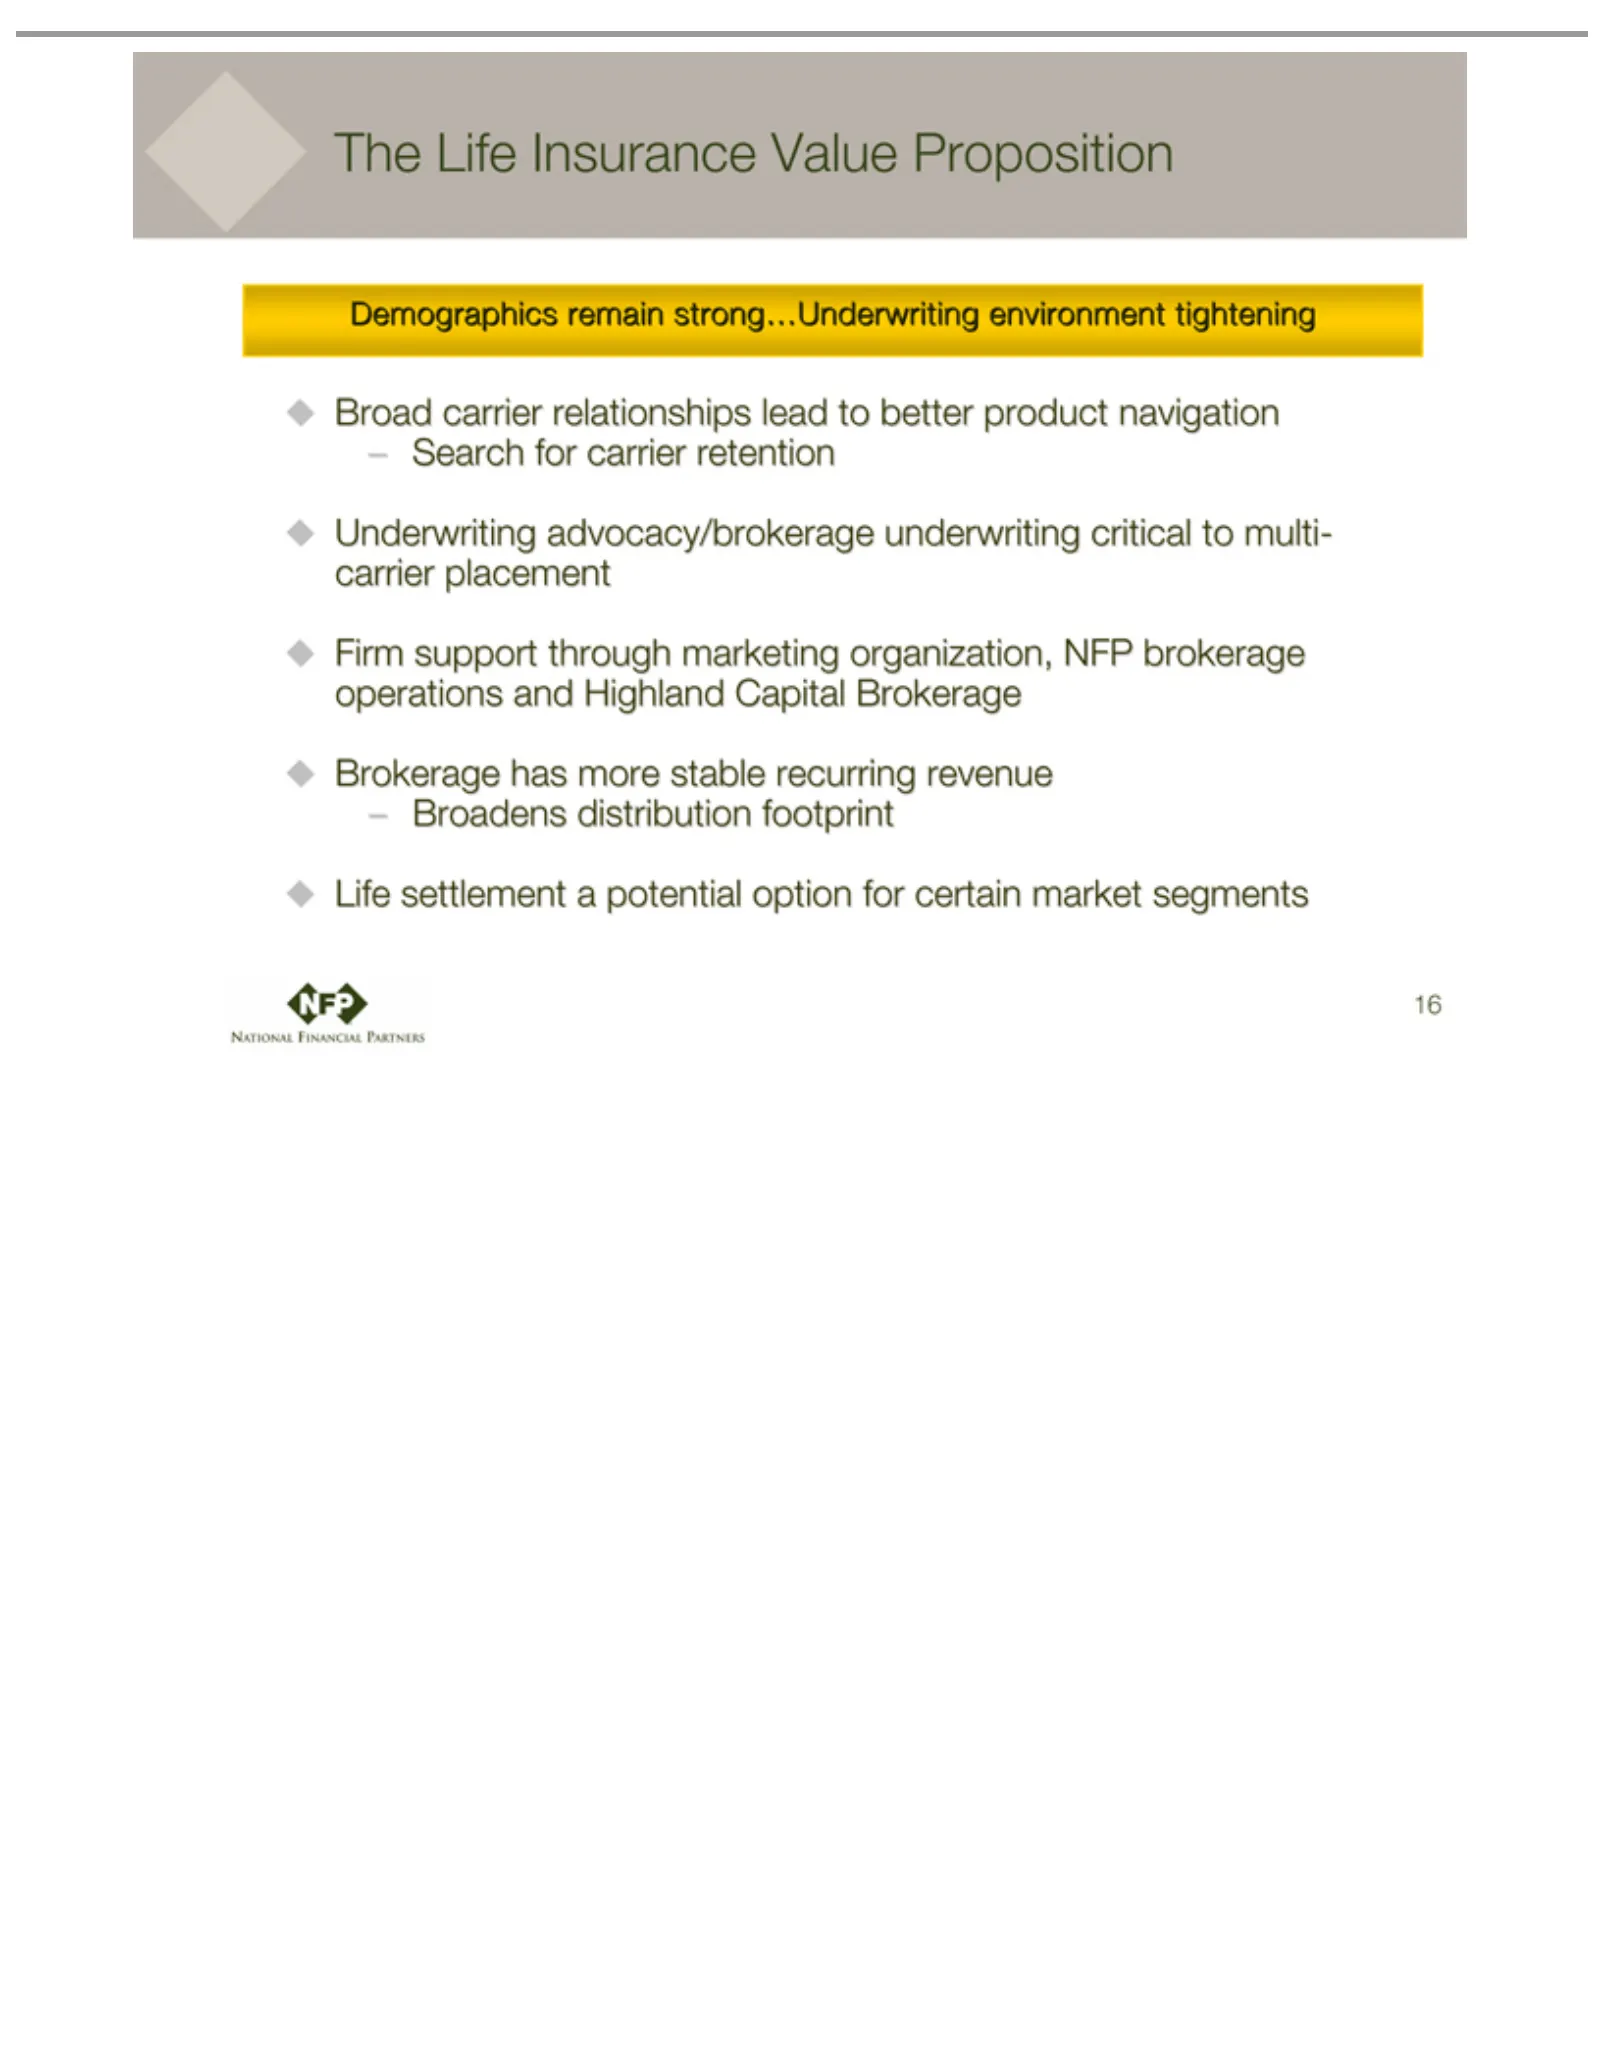
Slide 16: Life Insurance Demographics and Broad Distribution
The Life Demographics Broad Search Underwriting Firm Brokerage Broadens Life 16 settlement support carrier forInsurance distribution carrier hasthrough relationships advocacy/brokerage more remain a potential retention Value stable marketing footprint strong…Underwriting Proposition option recurring
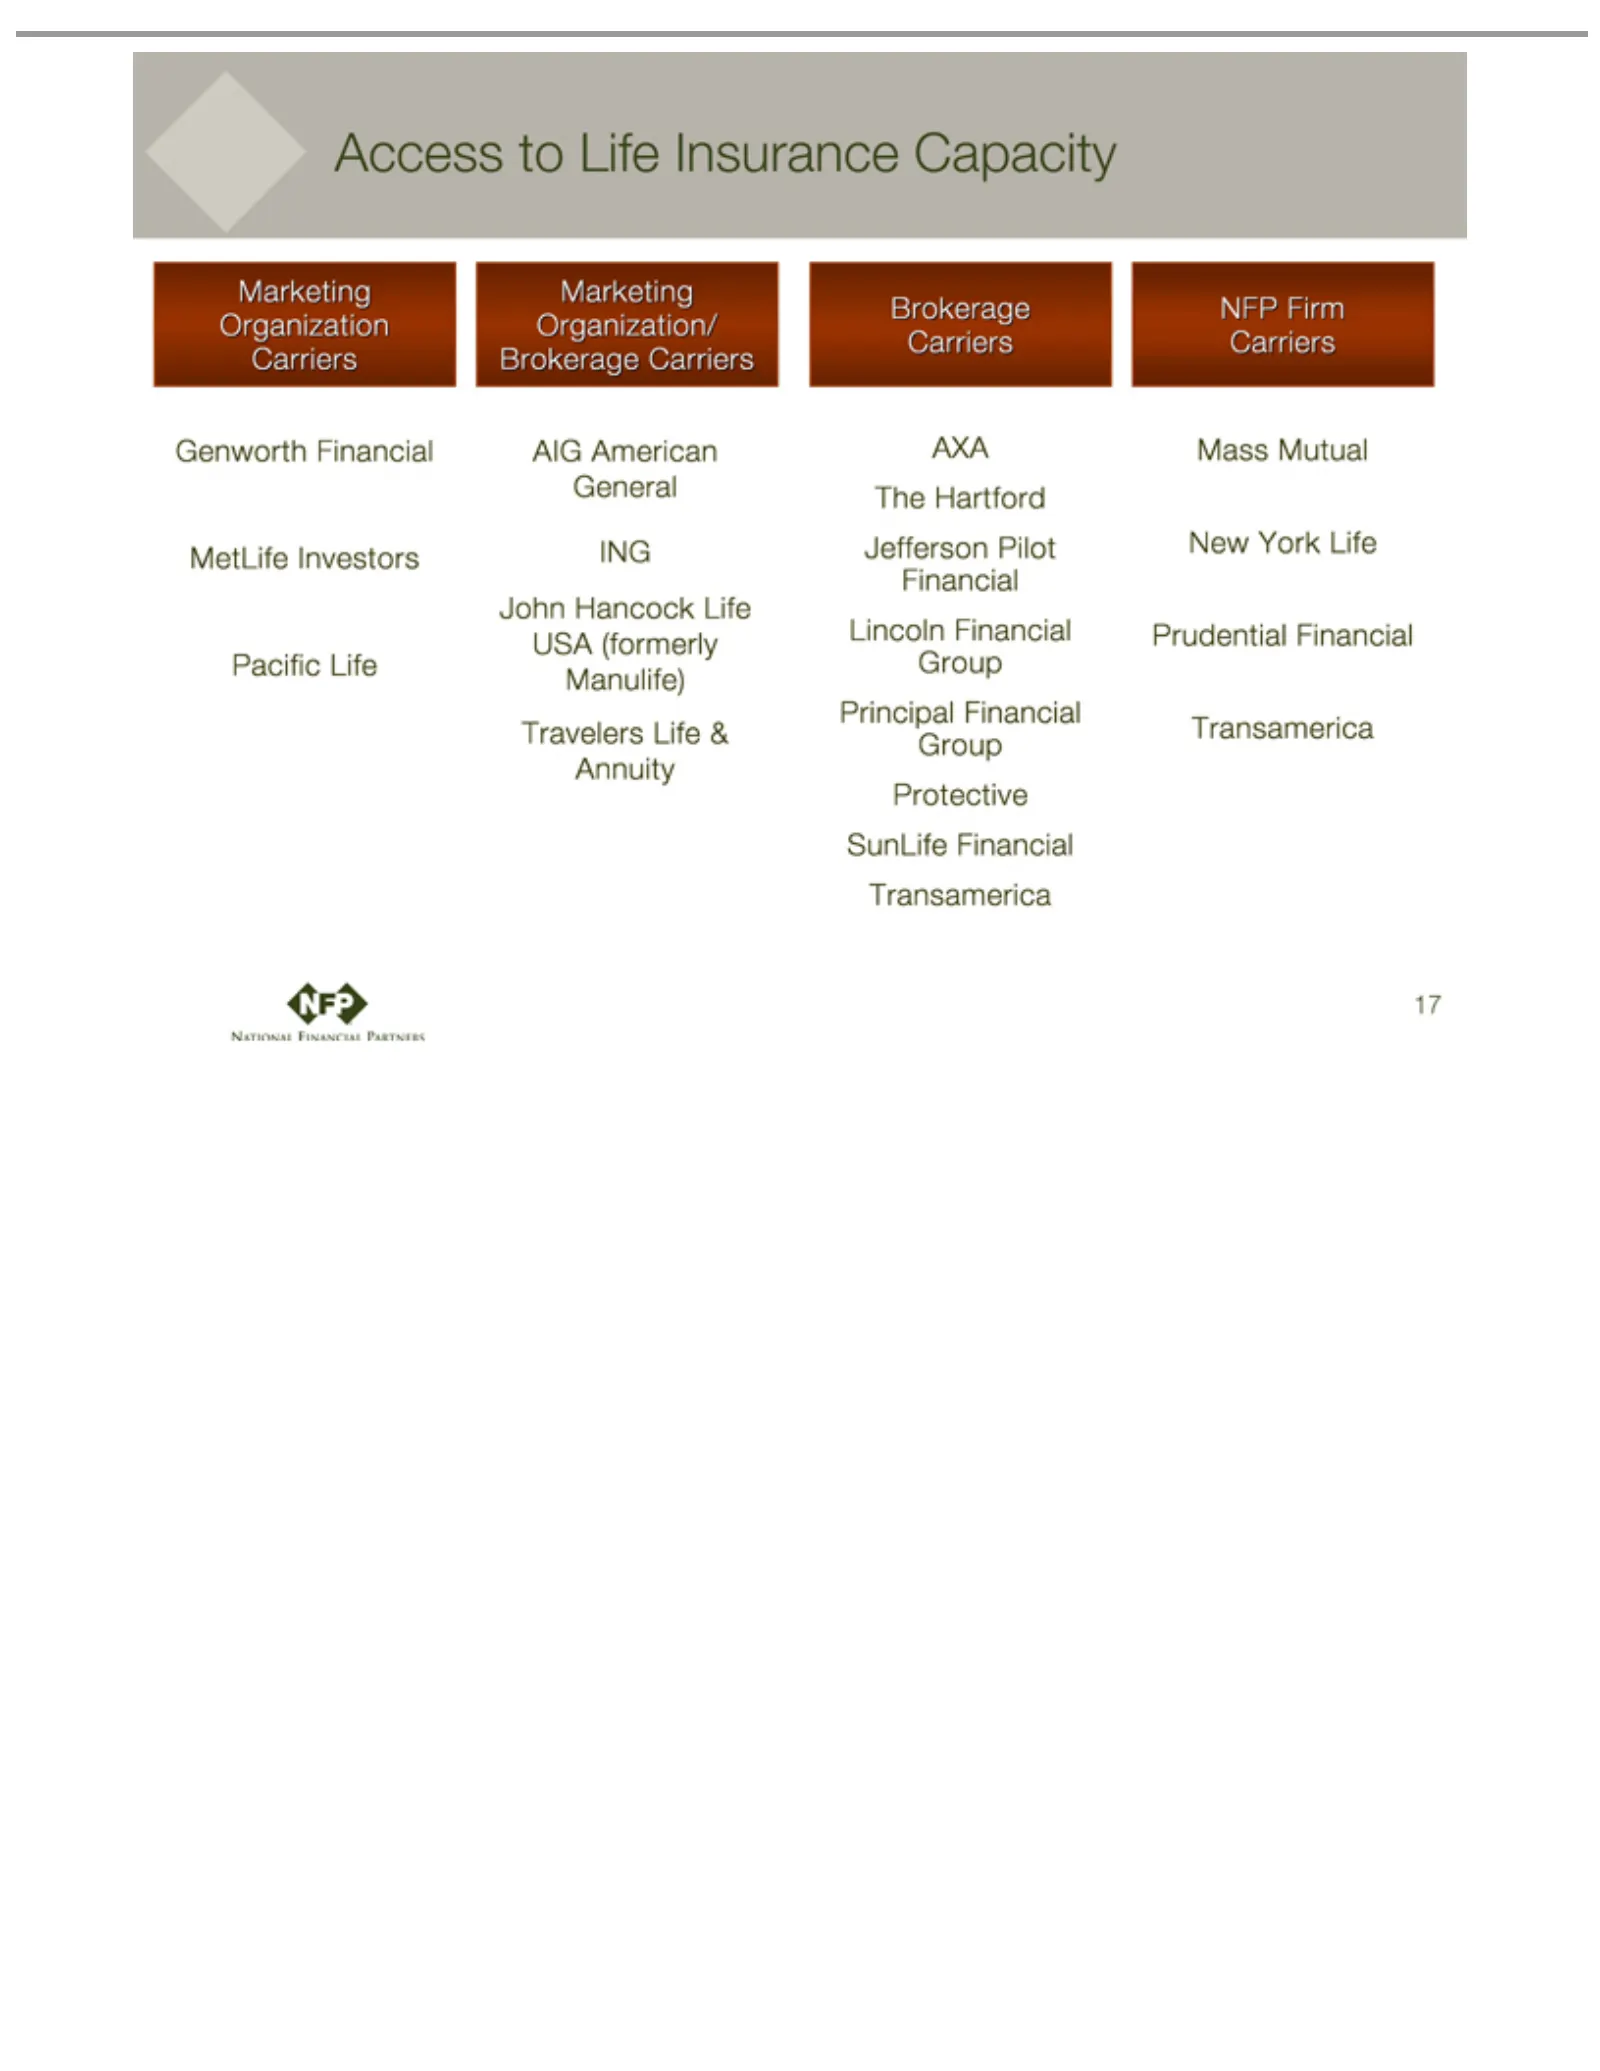
Slide 17: Access to Marketing Organization and Carriers
Access Marketing Brokerage NFP Genworth AIG The AXA Mass MetLife Jefferson ING New Pacific Travelers John Lincoln Principal Protective Prudential 17 Transamerica Hartford American Firms York Hancock Mutual Life toFinancial Investors Financial Pilot Life Life Financial SunLife Life Financial Carriers
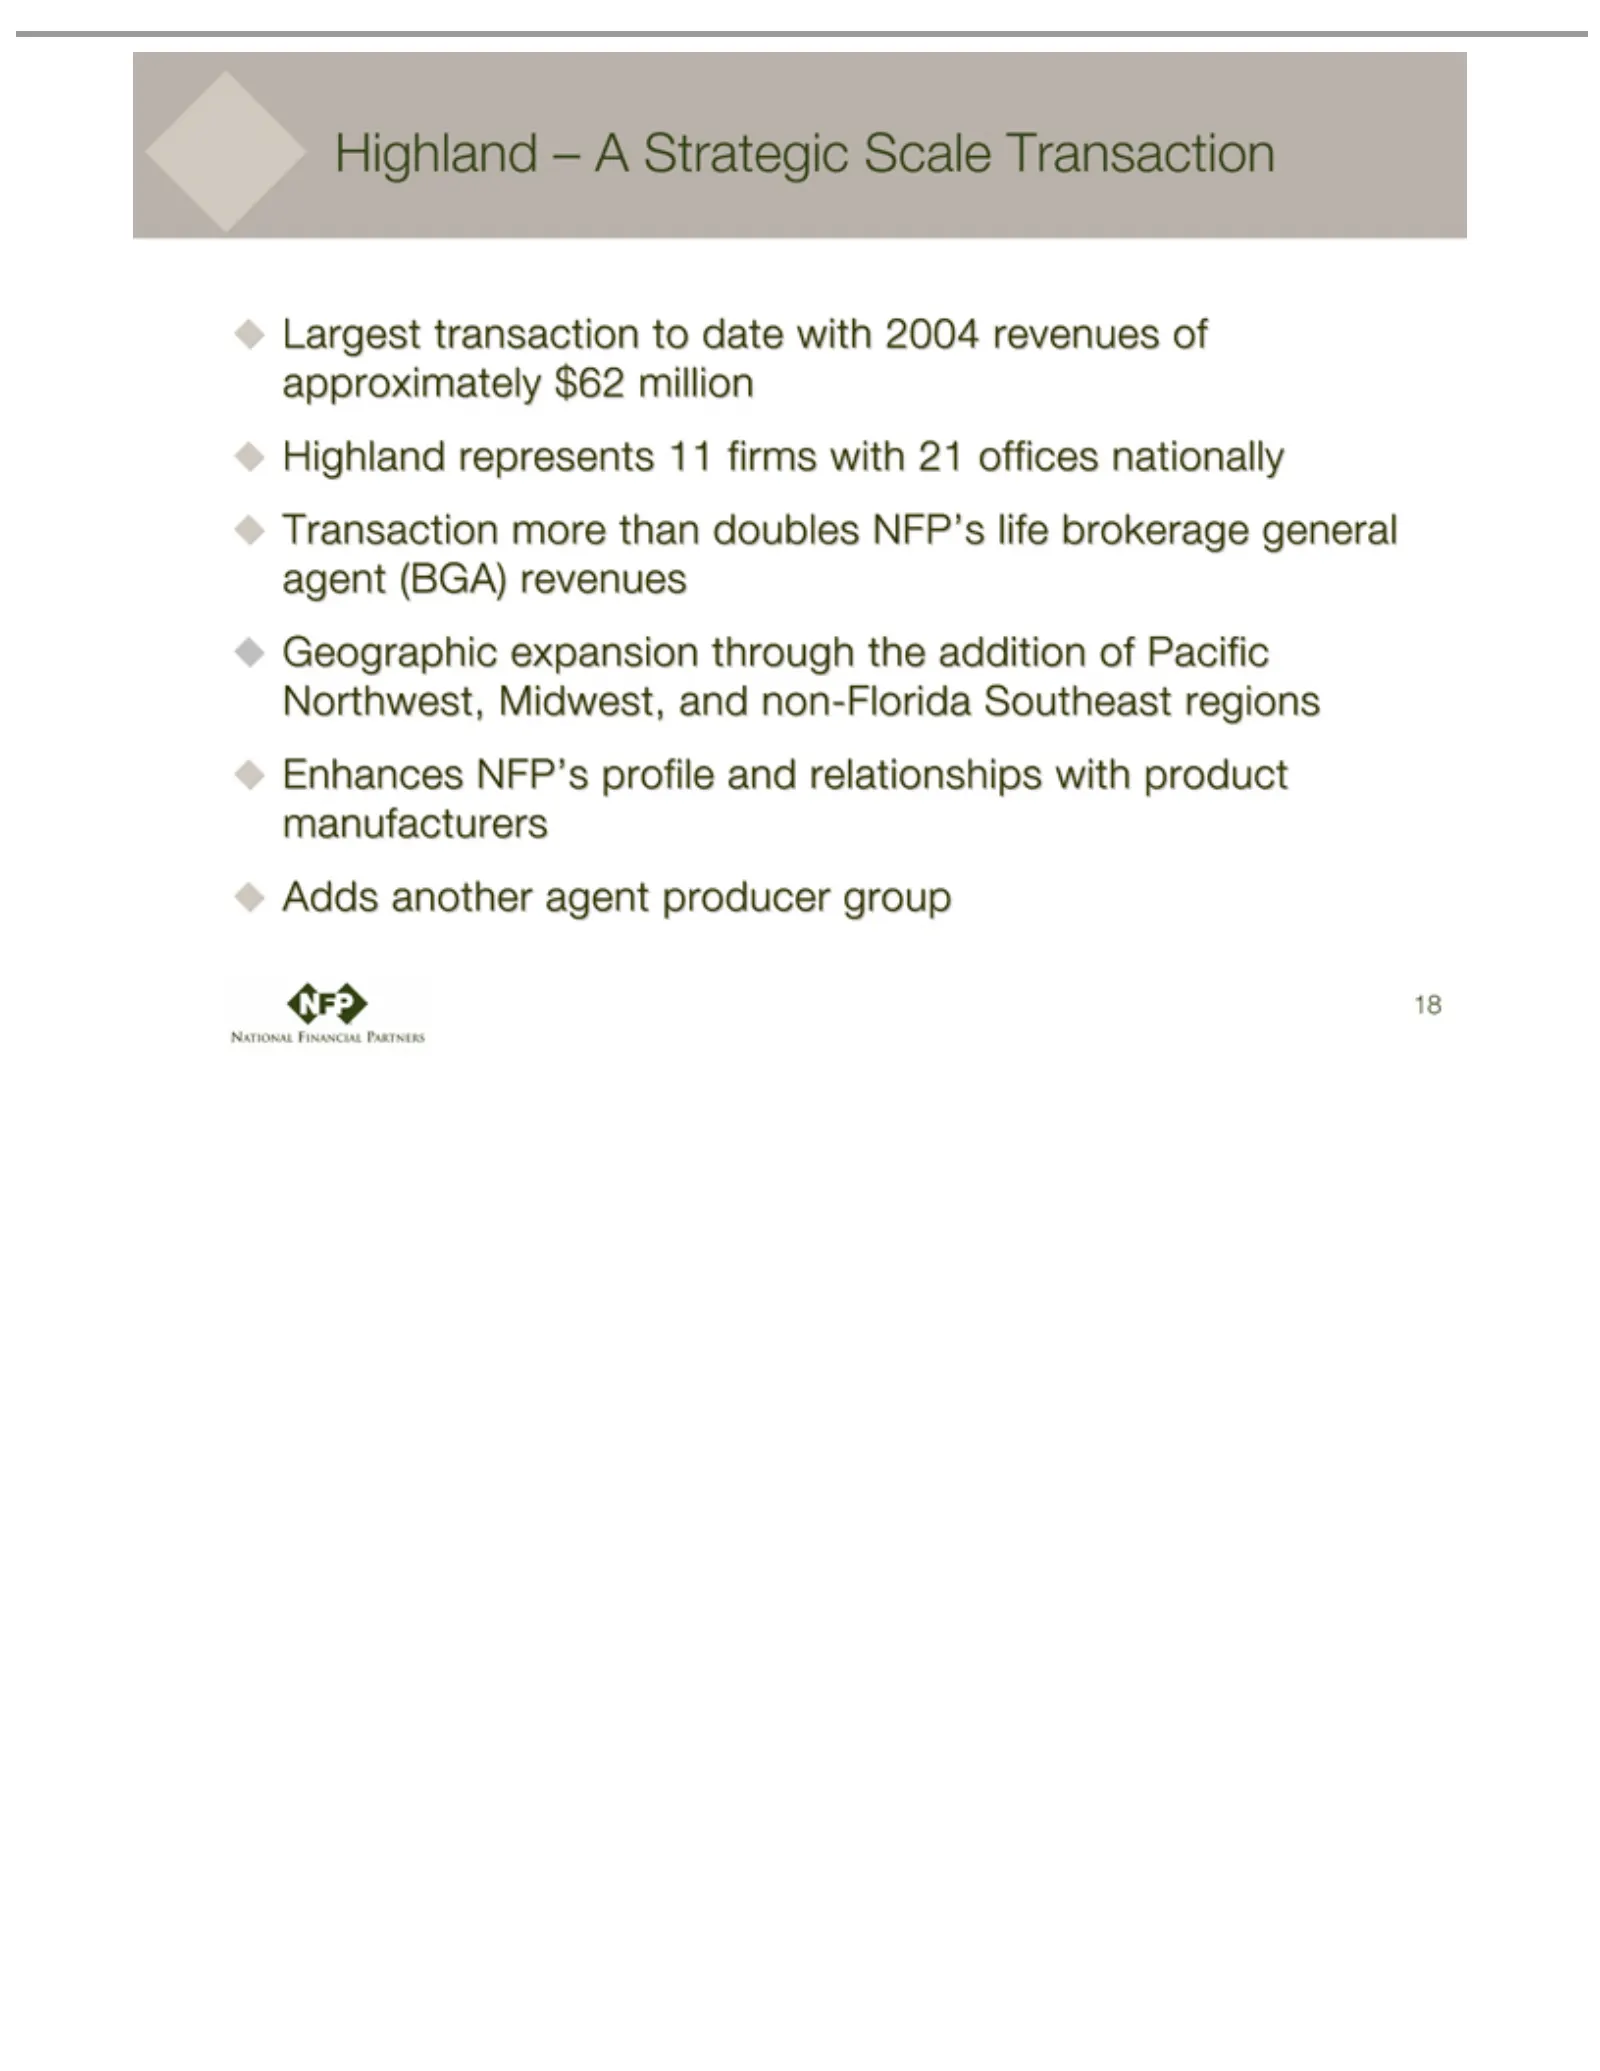
Slide 18: Highland: Largest Transaction to Date
Largest Highland Transaction Geographic Enhances Adds 18 another transaction –NFP’s represents Aexpansion more Strategic agent profile than to producer 11date doubles through Scale firms andwith relationships Transaction group with NFP’s the 2004 21 addition revenues offices life with brokerage ofna
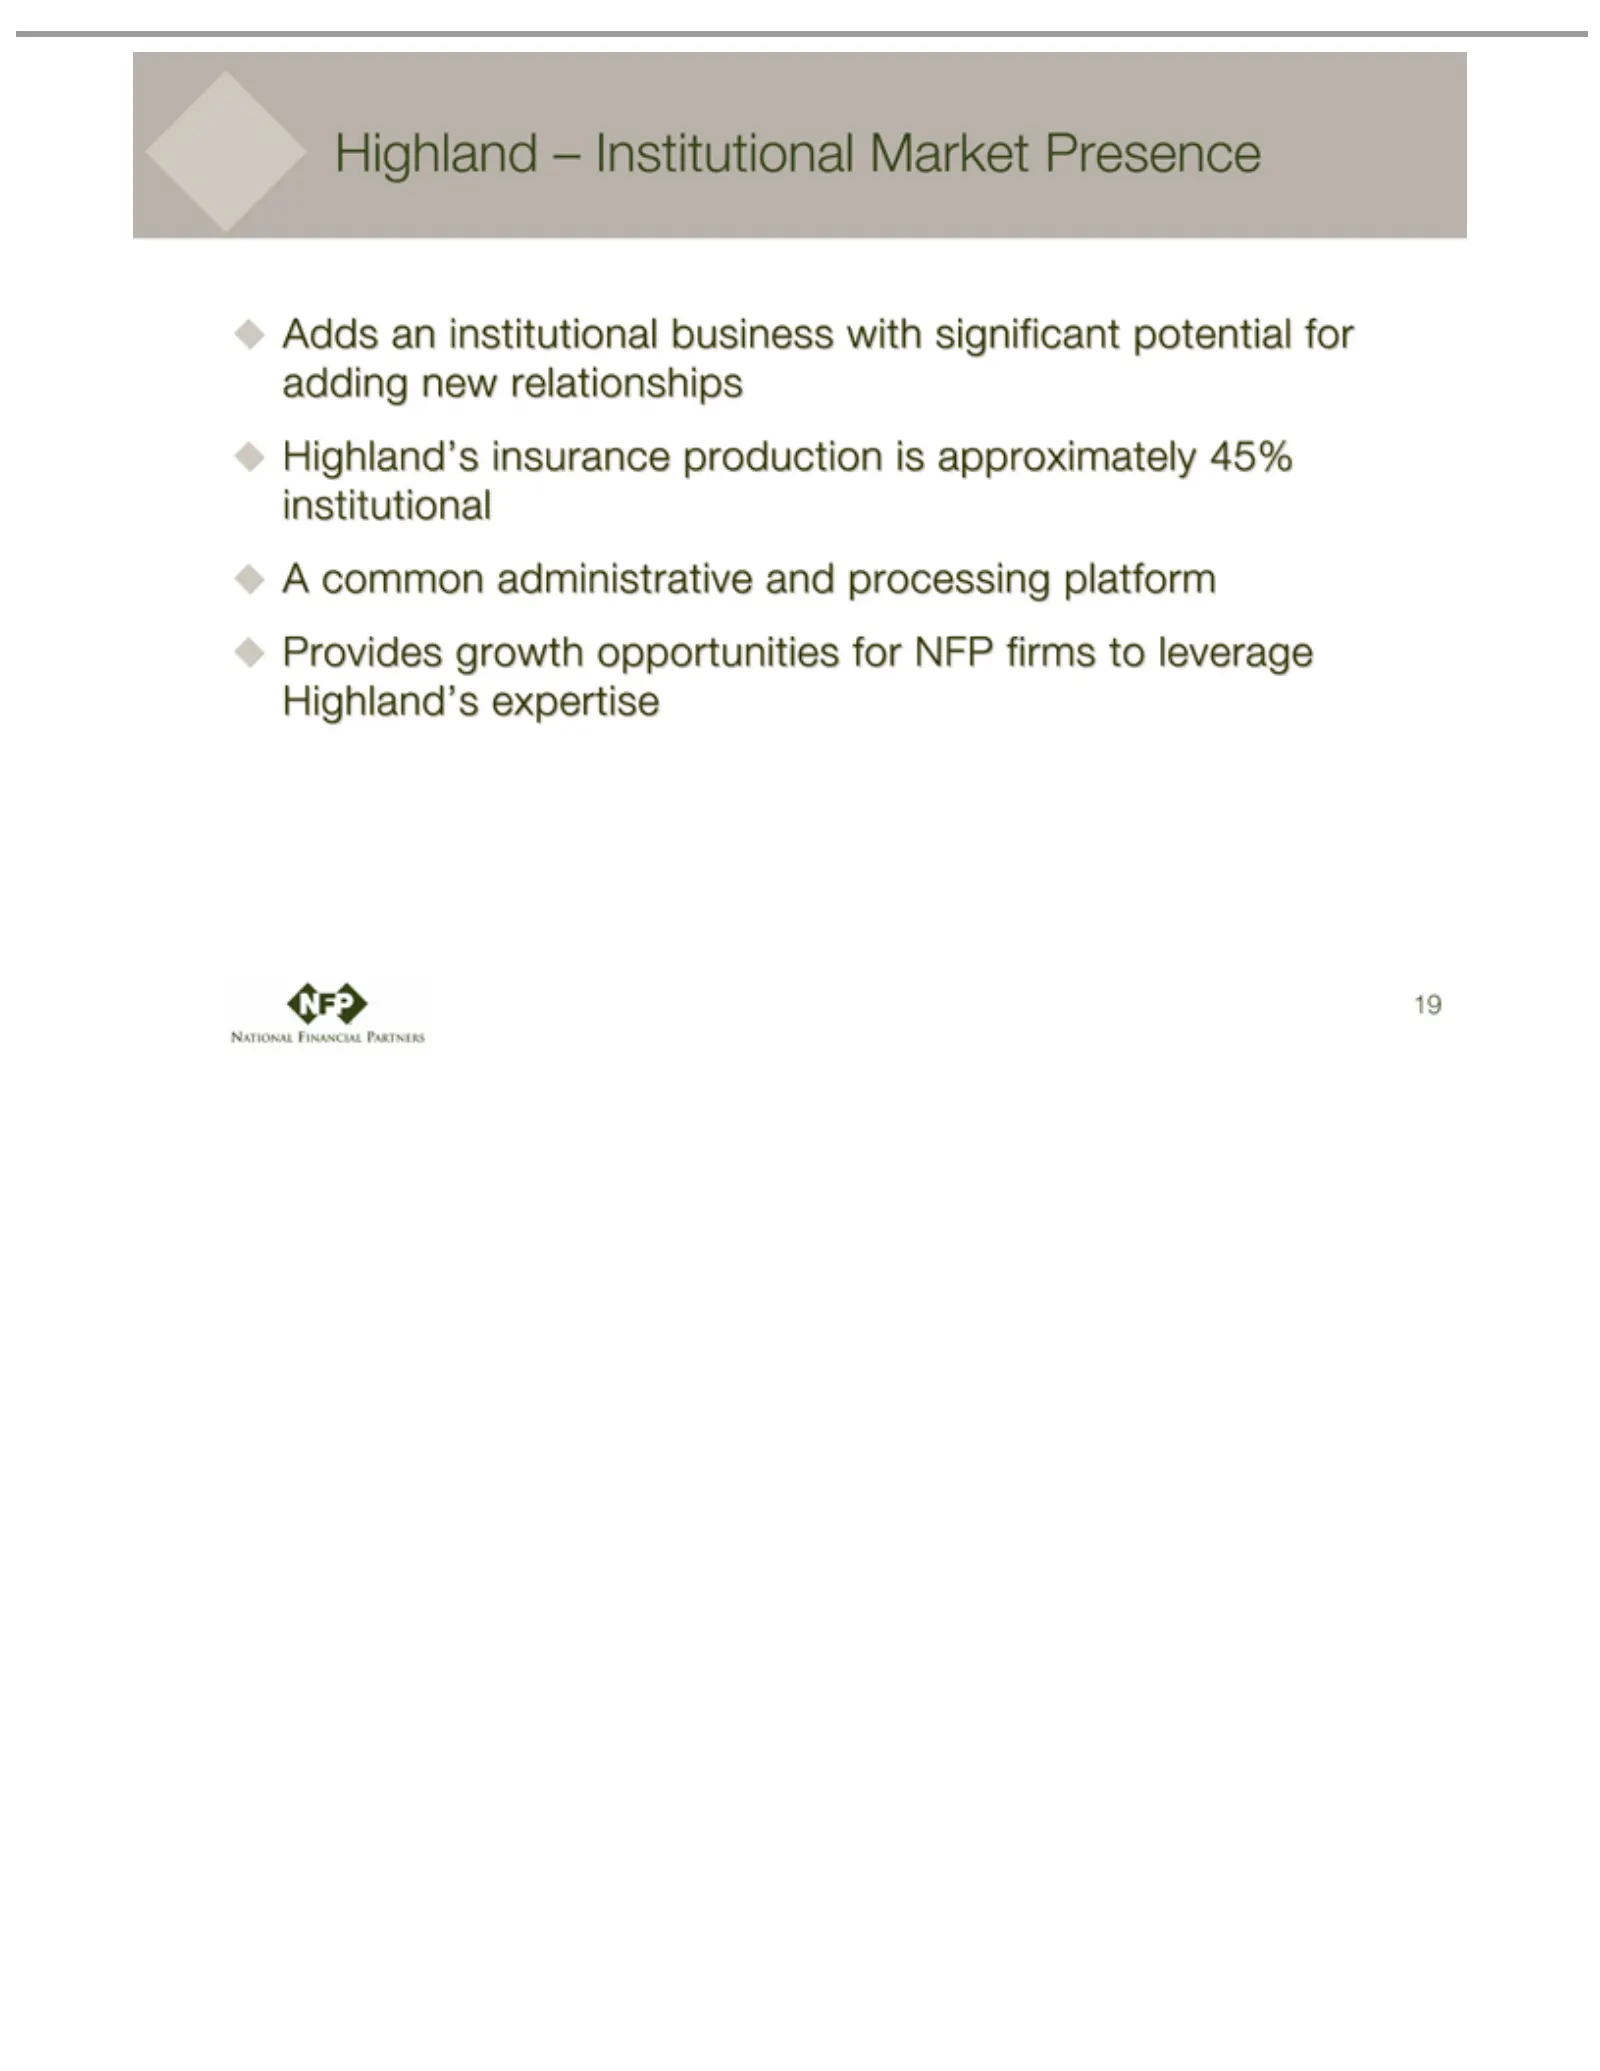
Slide 19: Highland Adds Institutional Market Presence
Highland Adds Highland’s A Provides 19common an institutional growth – insurance administrative Institutional opportunities business production Market and with processing for Presence isNFP approximately significant firms platform topotential leverage 45% institutional for Highland’s adding new expe
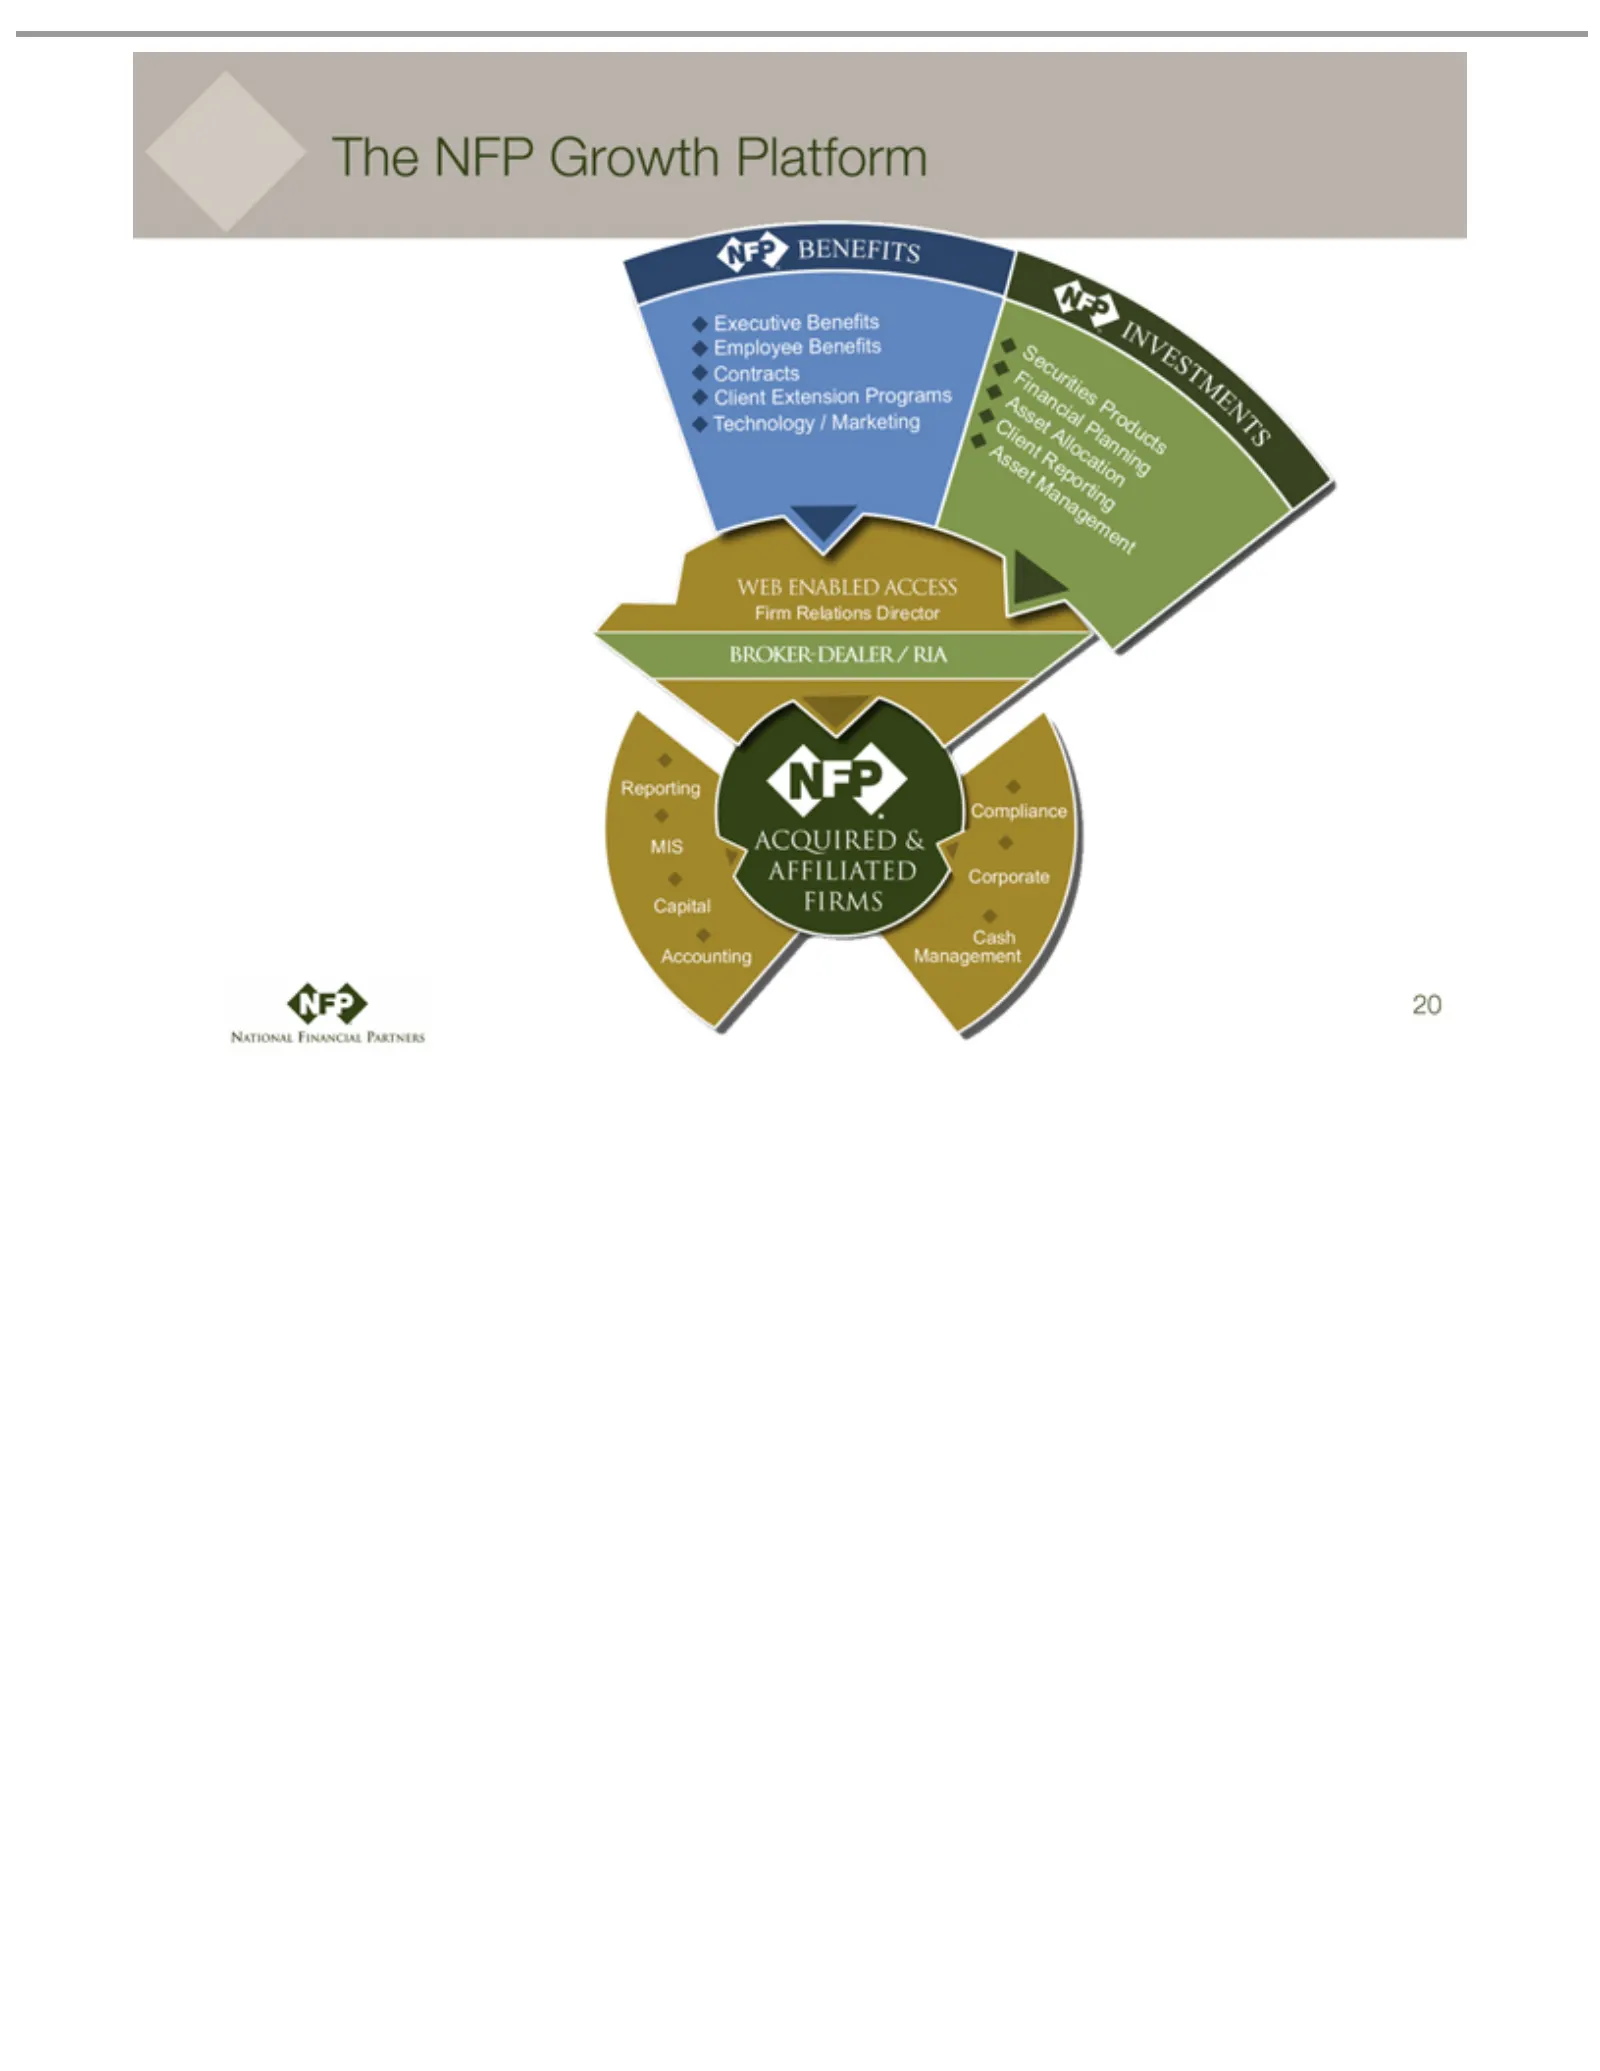
Slide 20: The NFP Executive Platform
The NFP Executive BENEFITS Employee Contracts Technology Securities INVESTMENTS Financial Client Asset WEB Firm ACQUIRED BROKER-DEALER/RIA Cash Corporate Compliance Accounting Capital MIS Reporting 20 Relations Management Allocation ENABLED Management Extension Reporting Growth Planning Products Ben
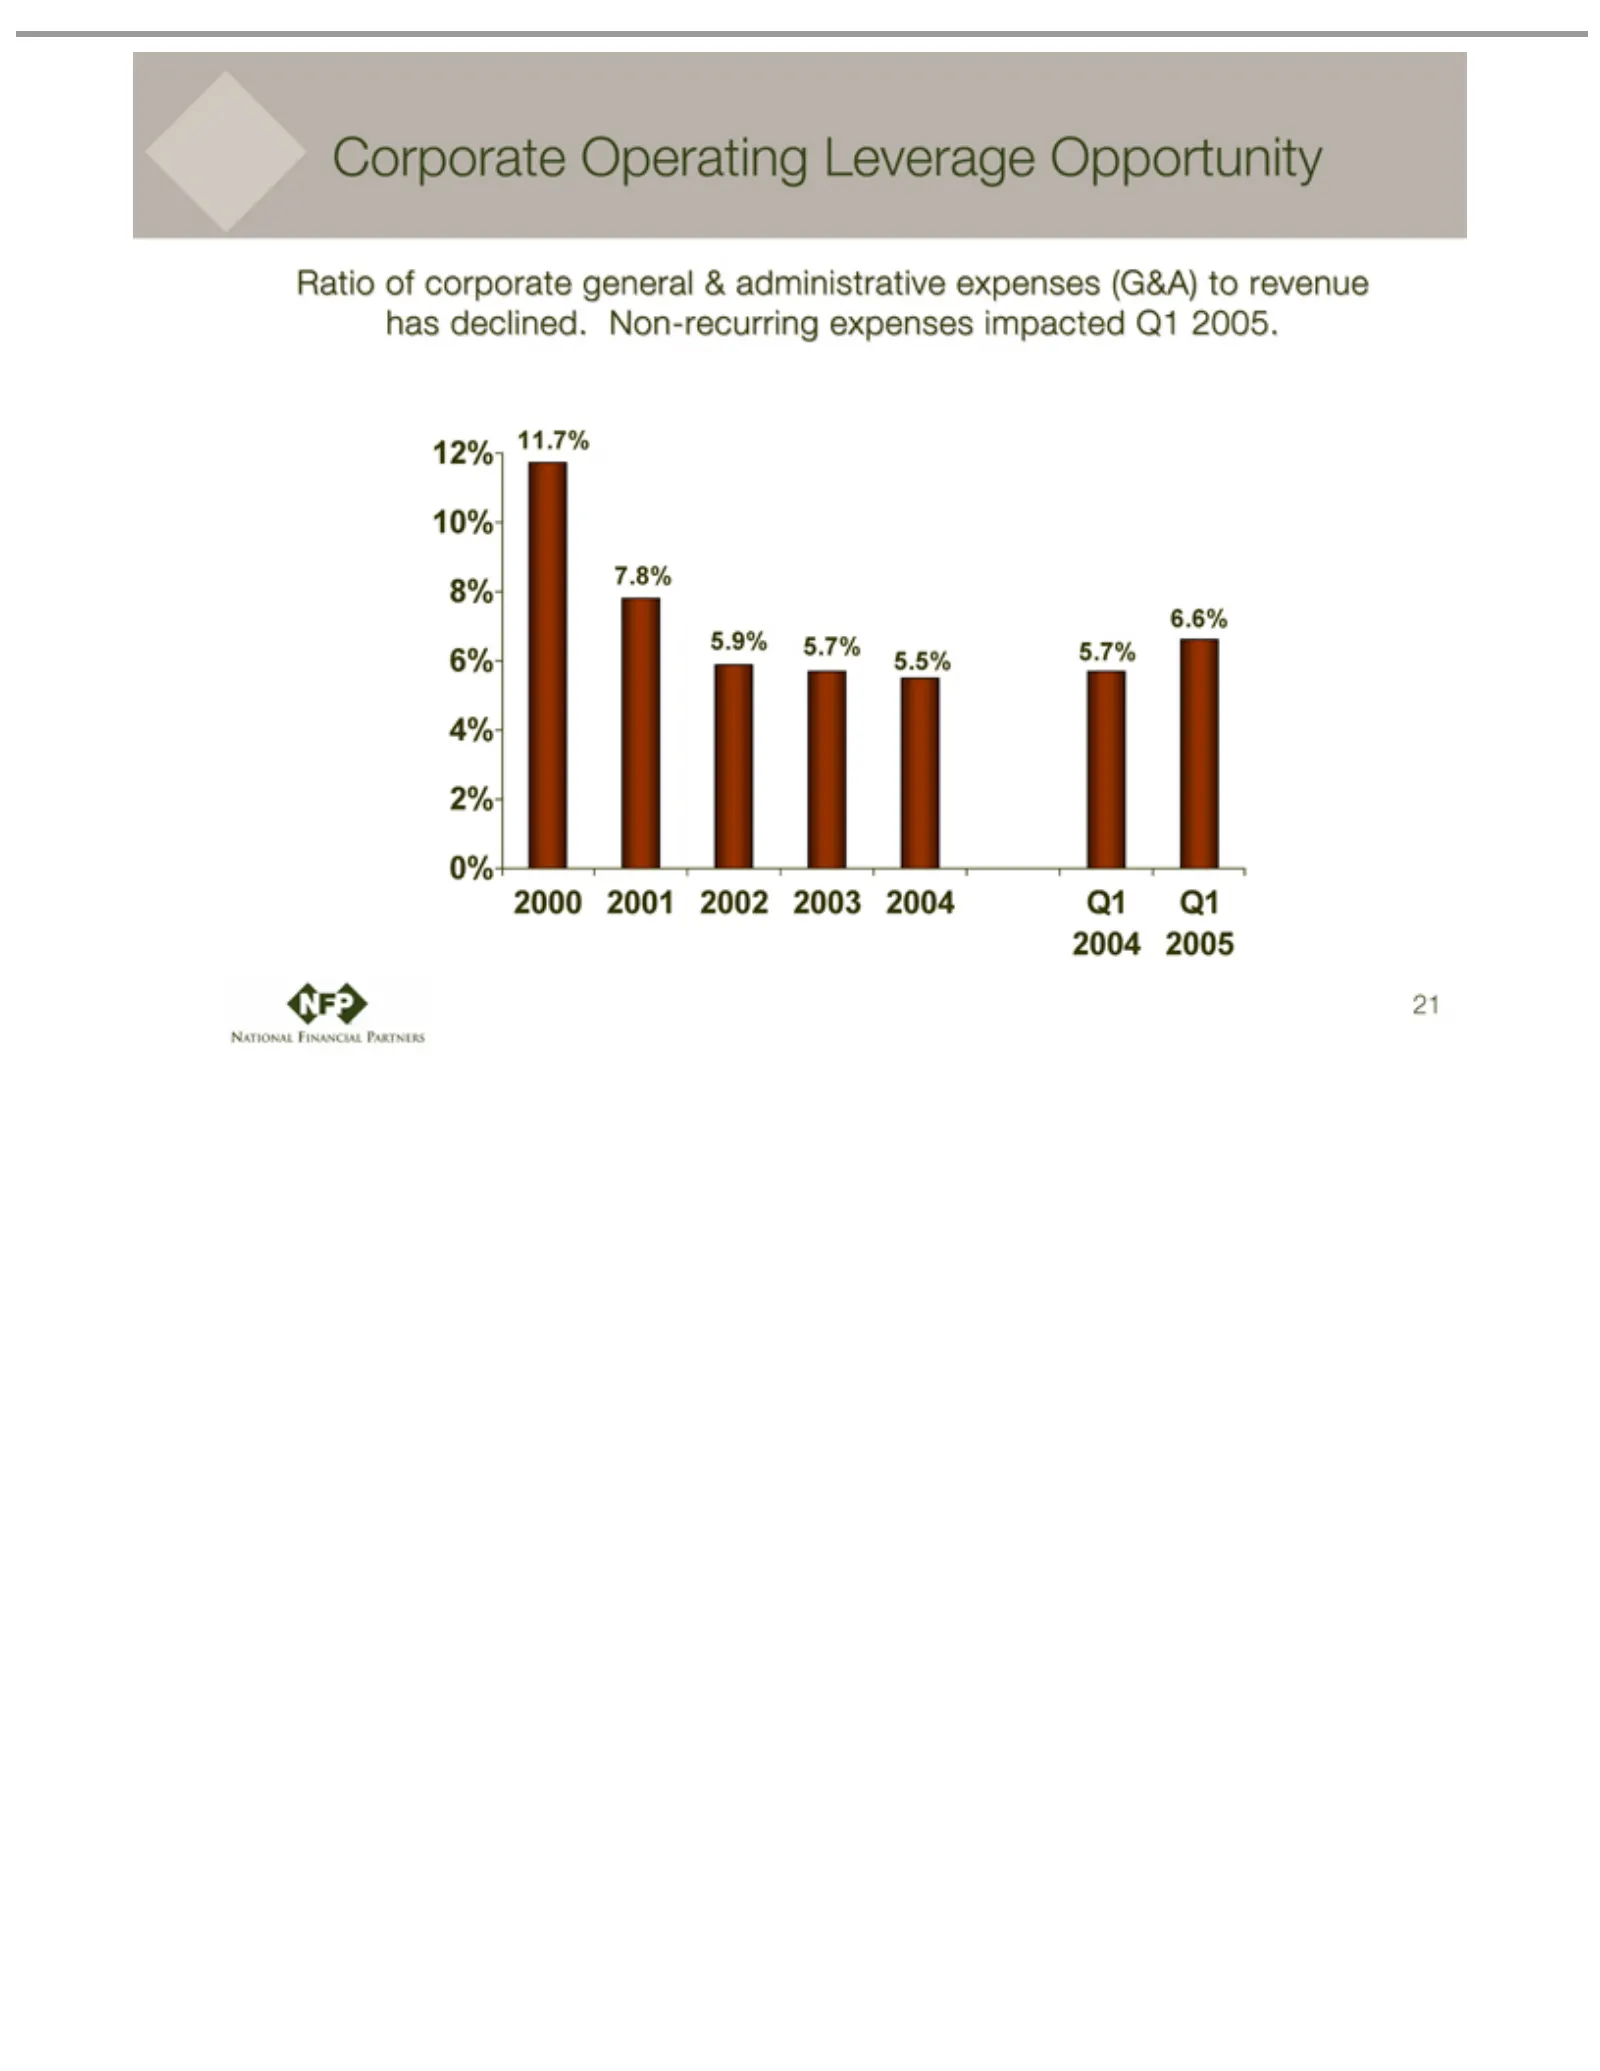
Slide 21: Corporate G&A Ratio and Operating Leverage Opportunity
Corporate Ratio 12% 2000 6.6% 5.5% 5.7% 5.9% 7.8% 11.7% Q1 21 Q1 10% 2001 of2004 corporate 8% Operating 2002 2005 6%2003 4% general Leverage 2% 2004 0% & administrative Opportunity expenses (G&A) to revenue has declined. Non-recurring expenses impacted Q1 2005.
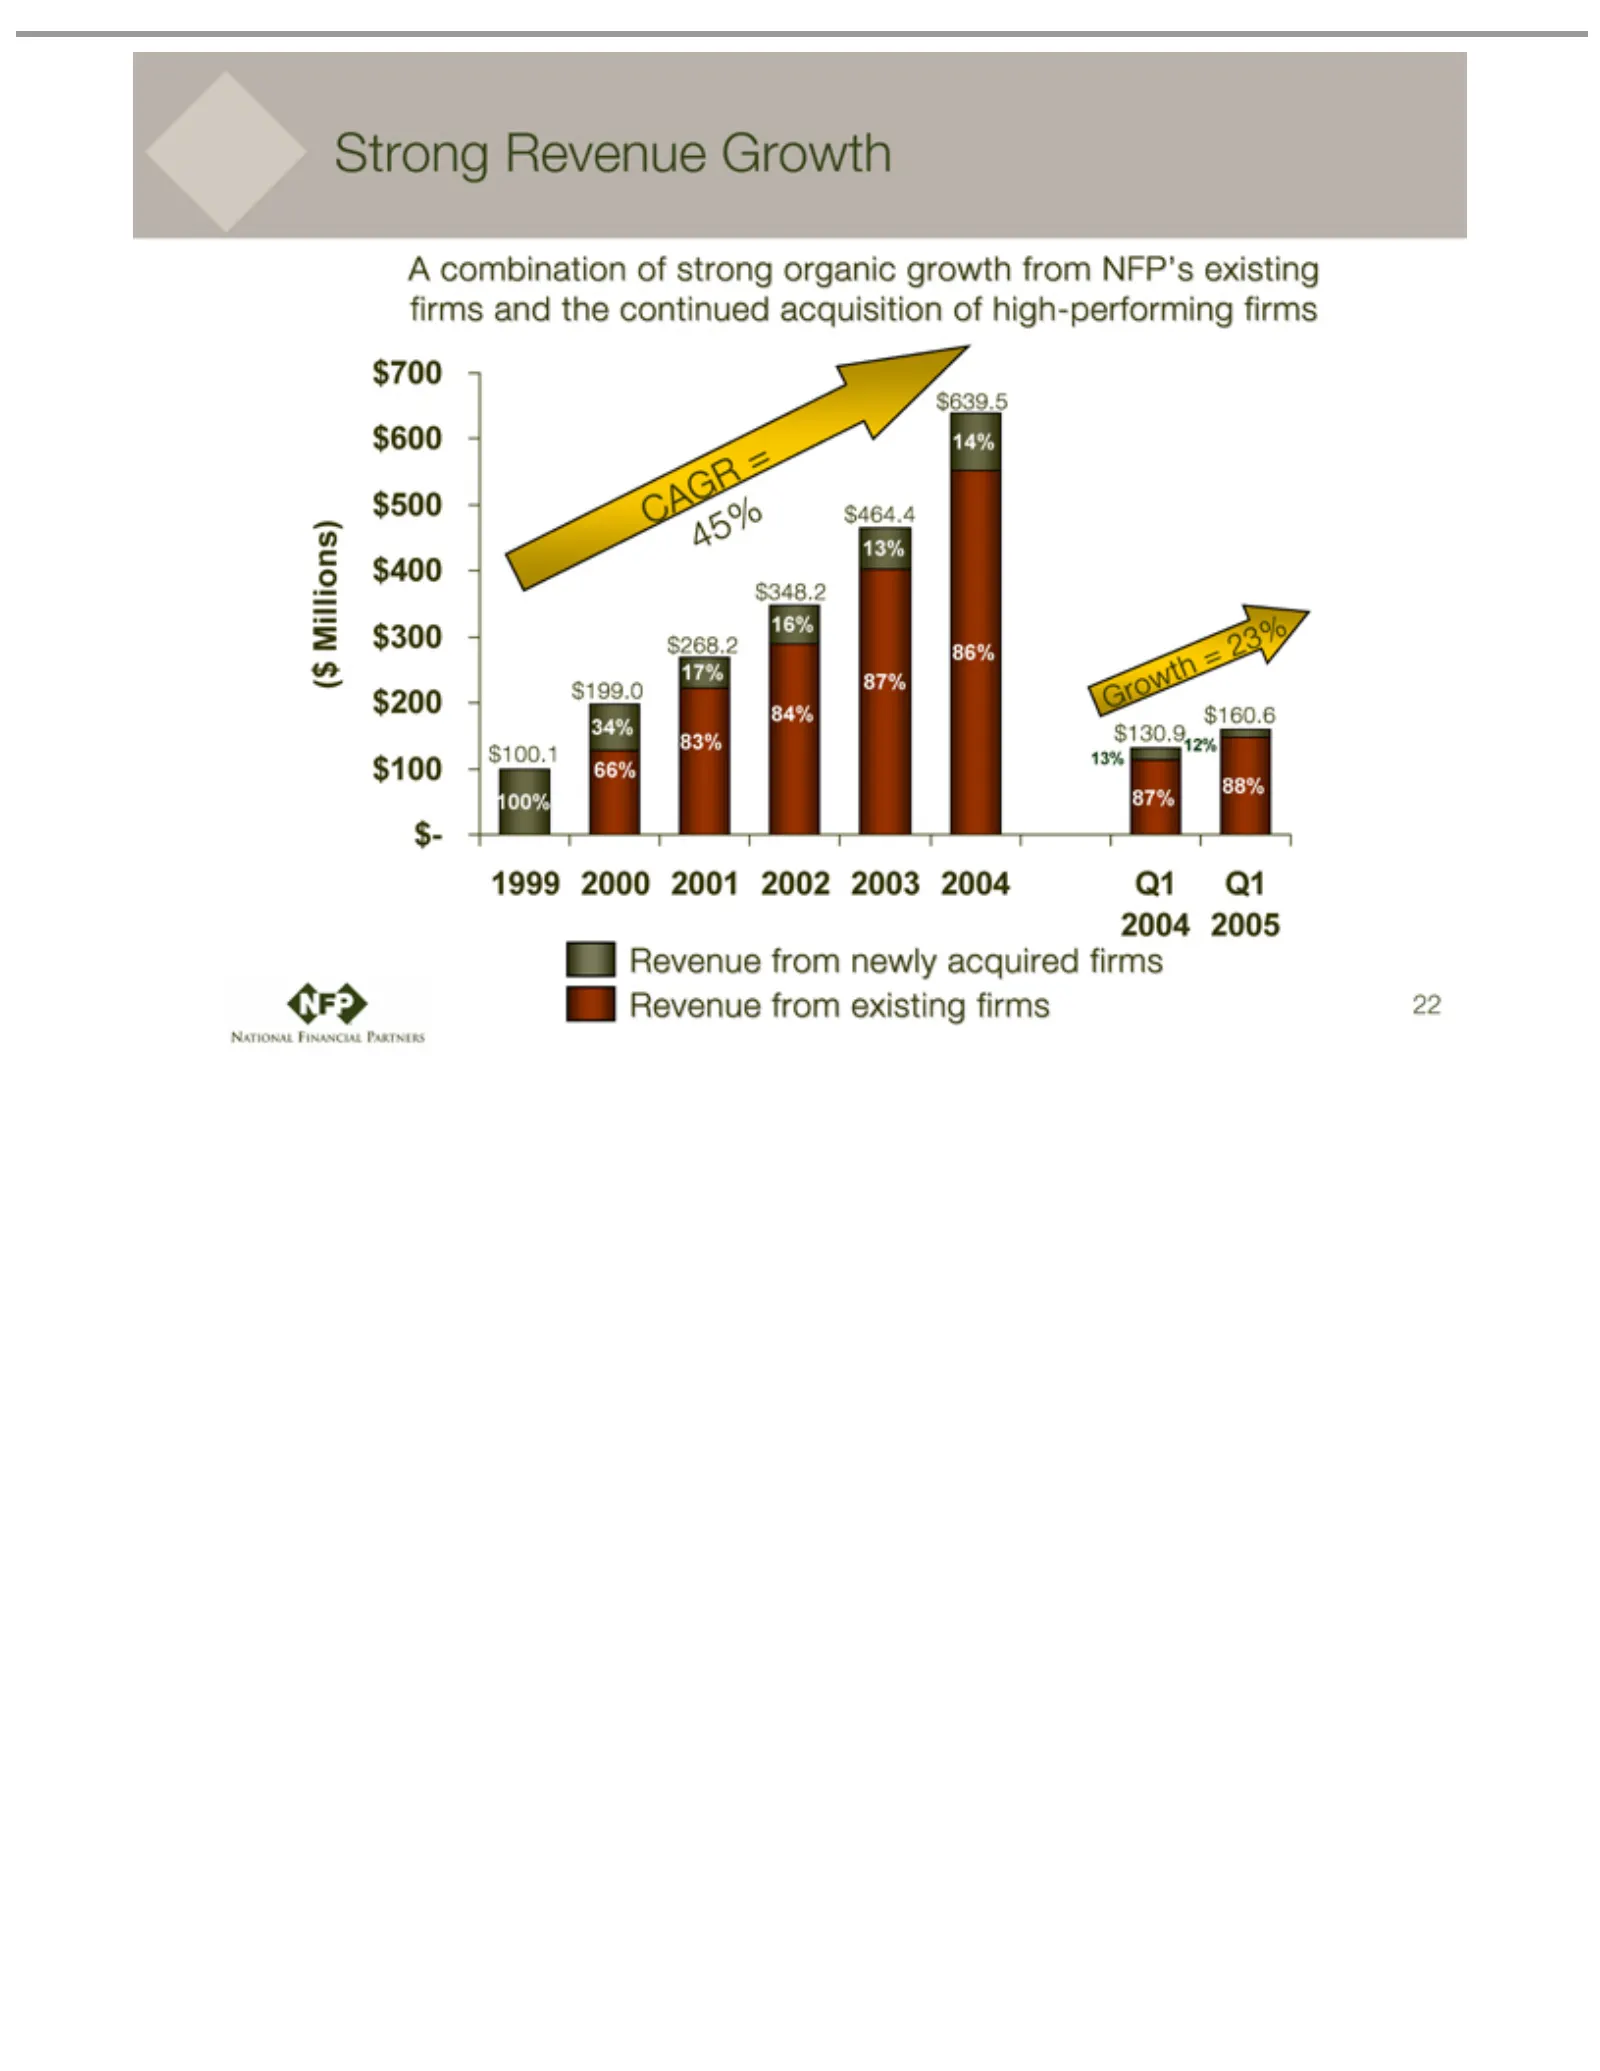
Slide 22: Strong Revenue Growth
Strong A ($ 100% 34% CAGR 83% 17% 84% 16% 5% 87% 13% 45% Growth 86% 14% 12% $130.9 $160.6 88% 1999 Q1 Revenue 22 combination Millions) 2004 2005 66% $464.4 $639.5 13% 87% 2000 $199.0 Revenue ==from $348.2 23% $268.2 2001 $700 newly ofGrowth 2002 strong $600acquired 2003 $500 organic 2004 $400 firms
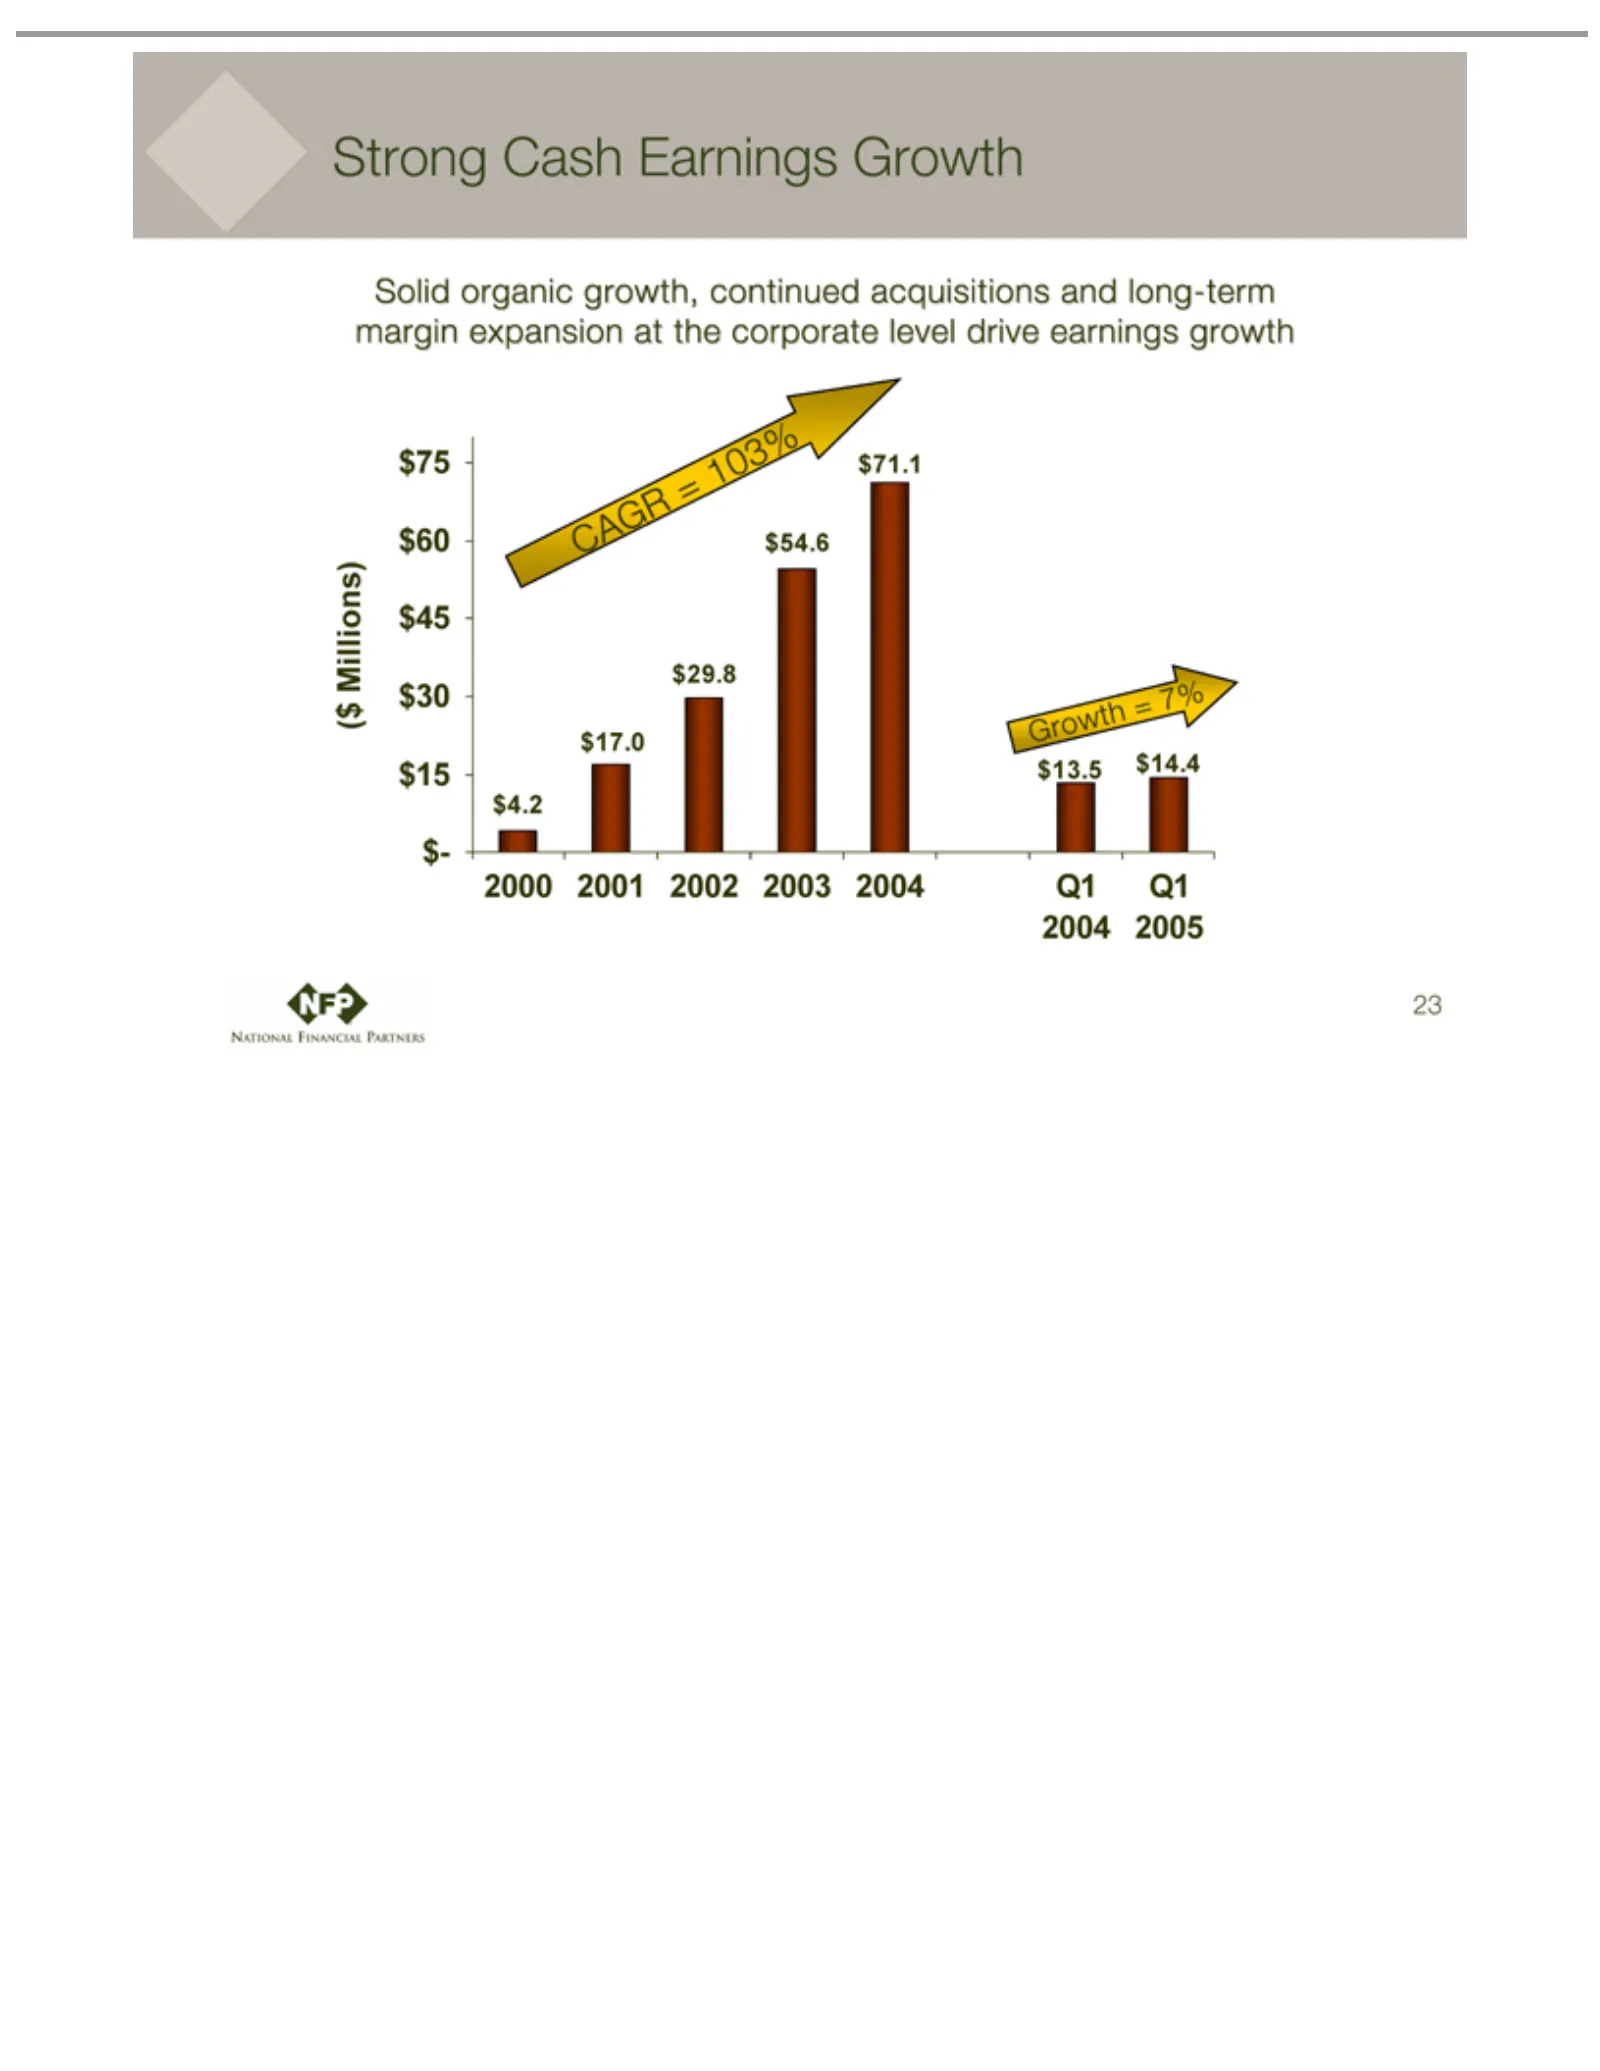
Slide 23: Solid Cash Earnings Growth
Strong Solid $75 ($ 2000 Q1 CAGR Growth 23 Millions) 2004 $60 2001 organic Cash ==$45 Q1 103% 72002 % $4.2 Earnings 2005 $30 growth, 2003 $15 $17.0 $- continued Growth 2004 $29.8 $54.6 acquisitions $71.1 $13.5 and$14.4 long-term margin expansion at the corporate level drive earnings growth
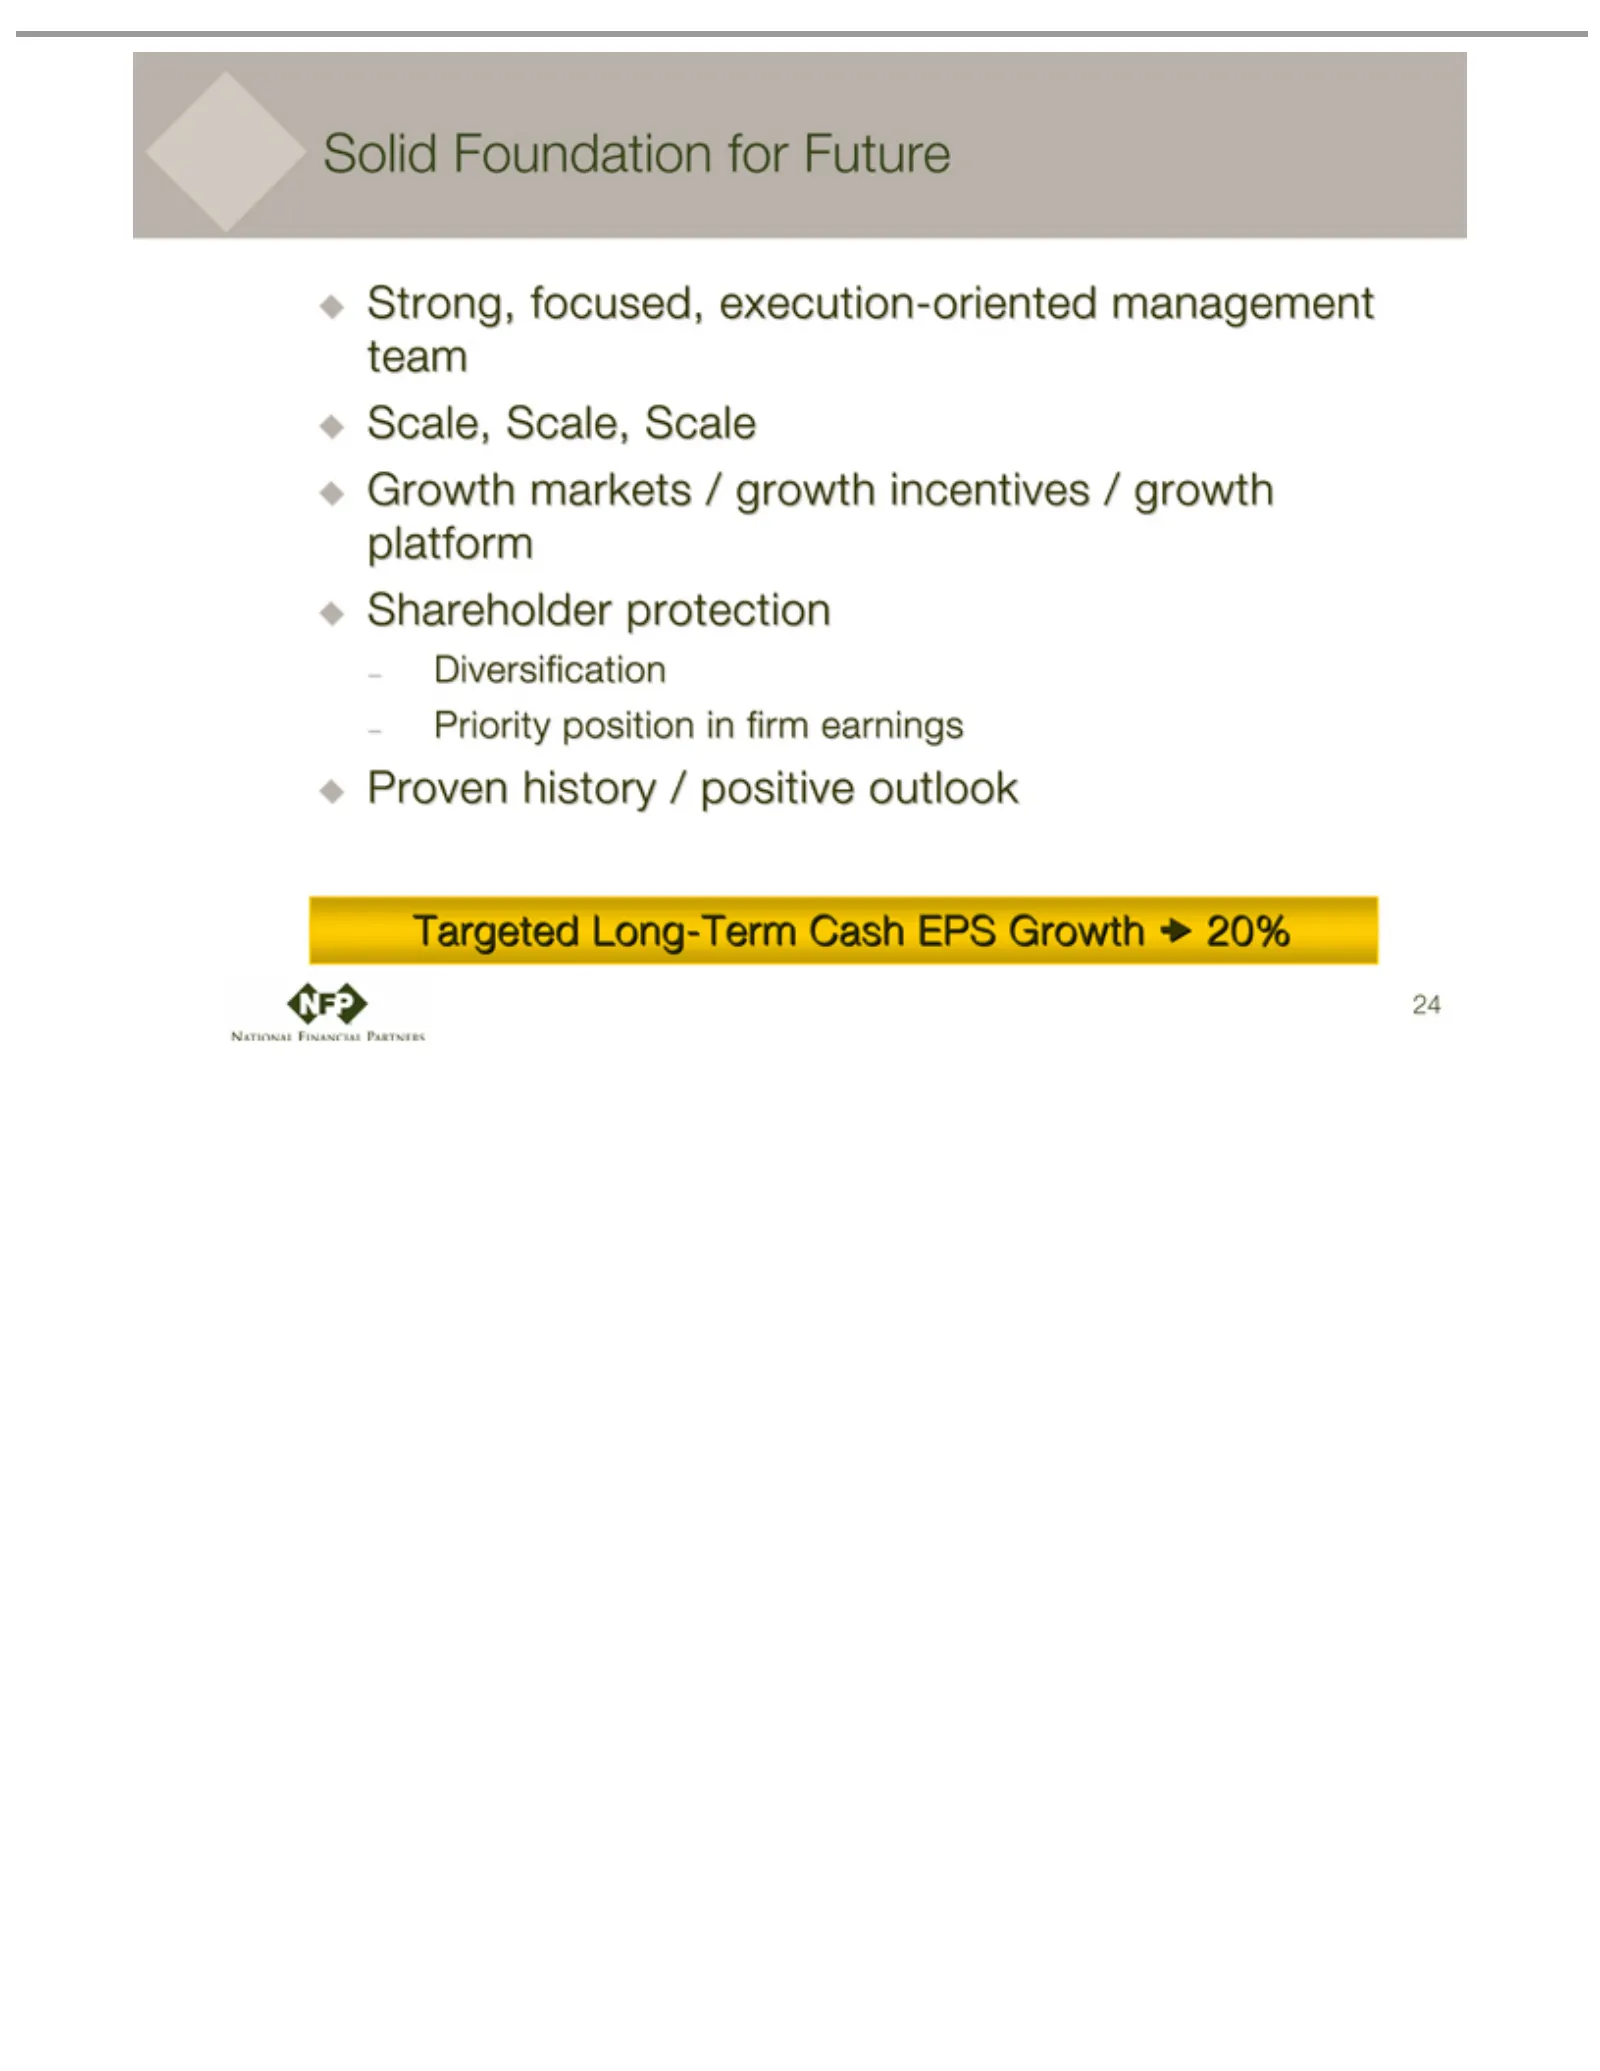
Slide 24: Solid Foundation, Strong Priority for Cash EPS Growth
Solid Foundation Strong, Priority Diversification Proven Targeted 24 history focused, position Long-Term / positive execution-oriented infor firm Cash Future earnings outlook EPS Growth management 20% team Scale, Scale, Scale Growth markets / growth incentives / growth platform Shareholder protectio

Slide 25: Corporate Headquarters
Corporate Headquarters National Financial Partners 787 7th Avenue, 11th Floor New York, NY 10036 phone 212.301.4000 www.nfp.com
Source: SEC EDGAR · 8-K filed Jun 8, 2005
More decks from National Financial Partners Corp
 Q4 2012 Earnings Presentation19 slides · Feb 15, 2013
 Q3 2012 Earnings Presentation18 slides · Oct 31, 2012
 Q2 2012 Earnings Presentation19 slides · Jul 31, 2012
 Q1 2012 Earnings Presentation19 slides · Apr 27, 2012
 Q4 2011 Earnings Presentation18 slides · Feb 8, 2012
 Q3 2011 Earnings Presentation19 slides · Oct 28, 2011