Talmer Bancorp — KBW Community Bank Investor Conference 2016
39 slides from Talmer Bancorp's conference presentation, Aug 2, 2016
Slide 1: Creating a Preeminent Midwest Community Bank
Creating a Preeminent Midwest Community Bank August 2, 2016 KBW Community Bank Investor Conference David B. Ramaker Chief Executive Officer Chemical Financial Corporation Dennis Klaeser Chief Financial Officer Talmer Bancorp, Inc.
Slide 2: Forward-Looking Statements
2 Forward – Looking Statements This presentation contains forward‐looking statements regarding the outlook and expectations of Chemical Financial Corporation (“Chemical” or “CHFC”) and Talmer Bancorp, Inc. (“Talmer” or “TLMR”) with respect to their planned strategic partnership, including the benefi
Slide 3: Overview: Joining Two High Performing Banks
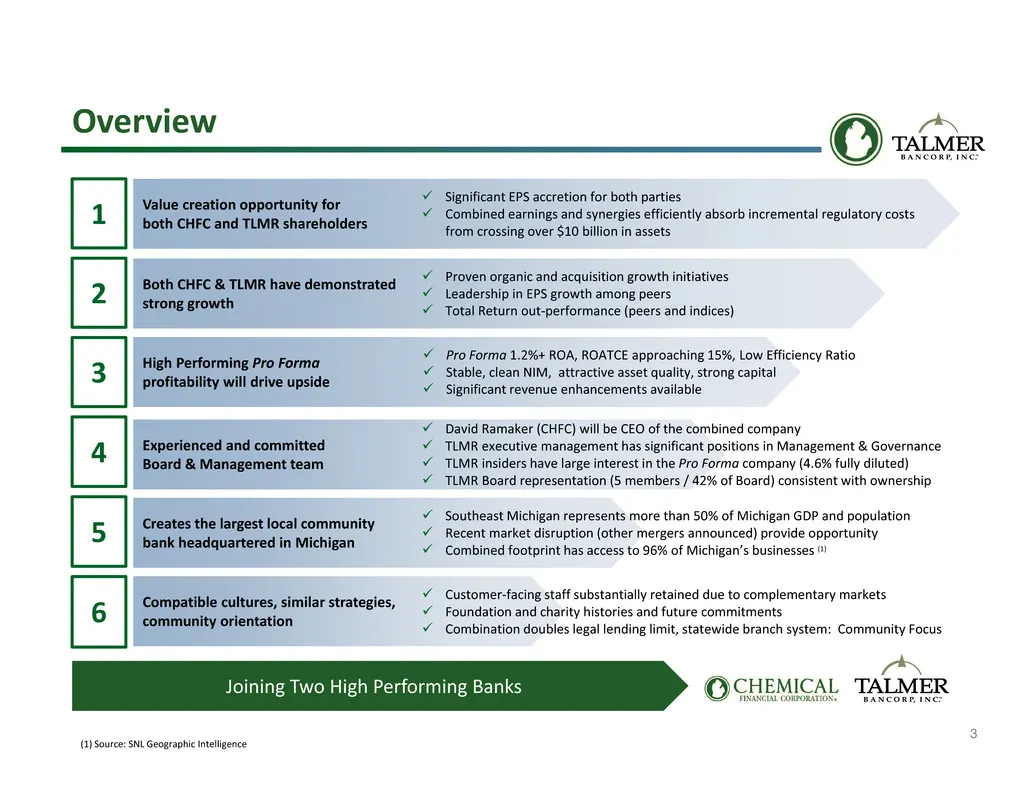
3 Overview Joining Two High Performing Banks Value creation opportunity for both CHFC and TLMR shareholders 5 6 4 1 Both CHFC & TLMR have demonstrated strong growth2 High Performing Pro Forma profitability will drive upside3 Experienced and committed Board & Management team Creates the largest local
Slide 4: High Performing, Complementary Banks
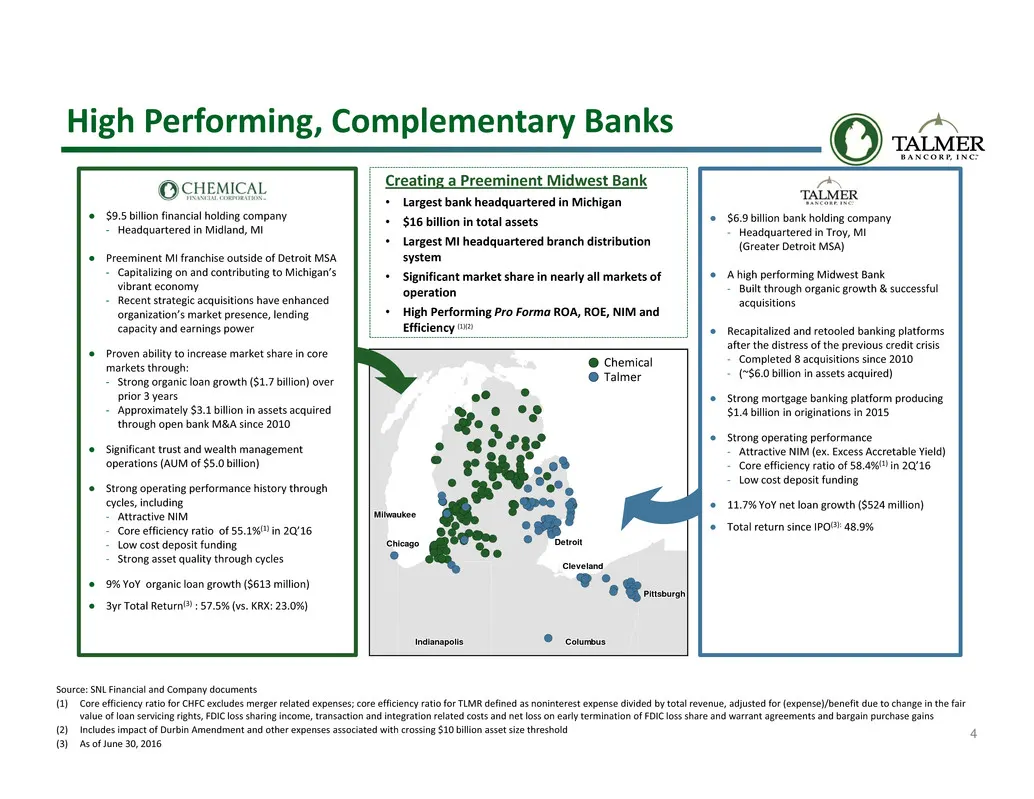
4 High Performing, Complementary Banks Source: SNL Financial and Company documents (1) Core efficiency ratio for CHFC excludes merger related expenses; core efficiency ratio for TLMR defined as noninterest expense divided by total revenue, adjusted for (expense)/benefit due to change in the fair val
Slide 5: Rationale: Logical Fit
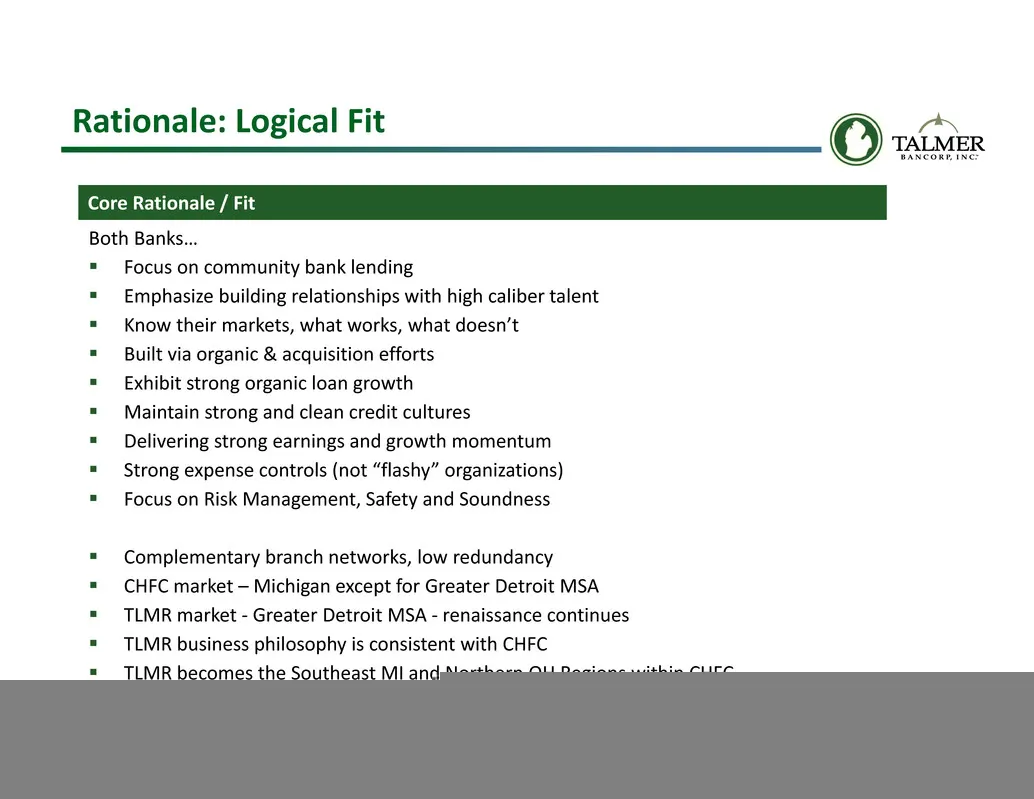
5 Rationale: Logical Fit Both Banks… Focus on community bank lending Emphasize building relationships with high caliber talent Know their markets, what works, what doesn’t Built via organic & acquisition efforts Exhibit strong organic loan growth Maintain strong and clean credit cultures
Slide 6: Vision: Creating a Preeminent Midwest Bank
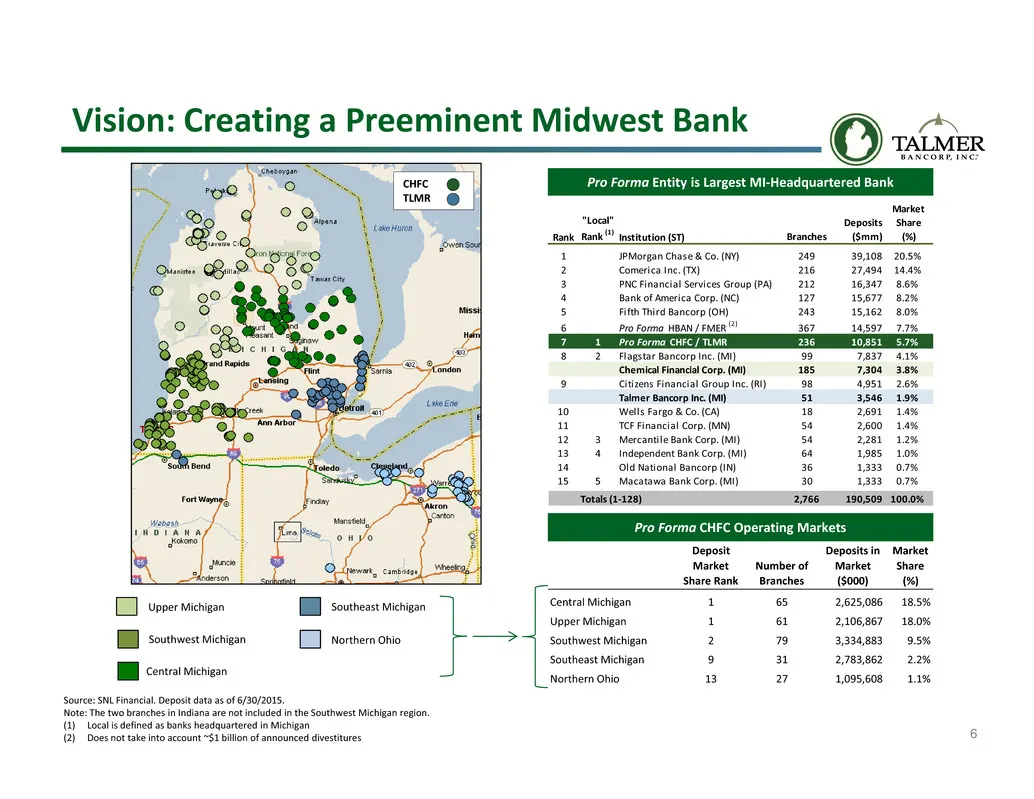
6 Vision: Creating a Preeminent Midwest Bank Pro Forma Entity is Largest MI‐Headquartered Bank Pro Forma CHFC Operating Markets Source: SNL Financial. Deposit data as of 6/30/2015. Note: The two branches in Indiana are not included in the Southwest Michigan region. (1) Local is defined as banks head
Slide 7: All Major MI Markets & OH Growth Opportunity
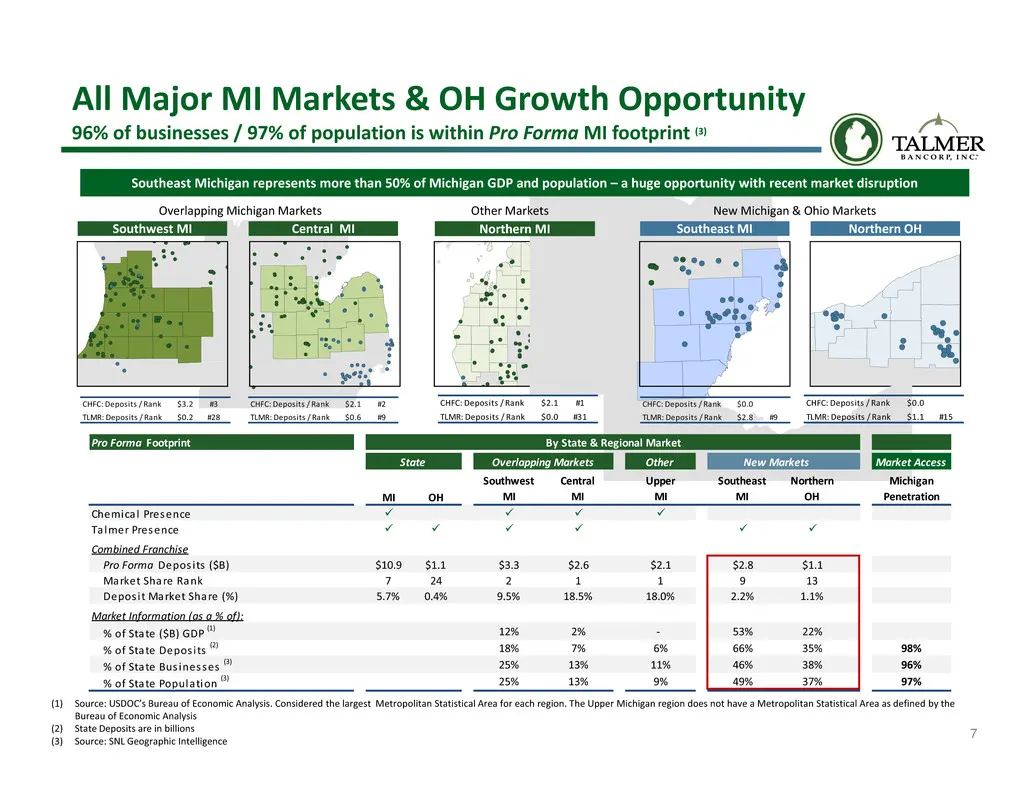
7 All Major MI Markets & OH Growth Opportunity 96% of businesses / 97% of population is within Pro Forma MI footprint (3) Overlapping Michigan Markets New Michigan & Ohio MarketsOther Markets CHFC: Deposits / Rank $3.2 #3 TLMR: Deposits / Rank $0.2 #28 CHFC: Deposits / Rank $2.1 #2 TLMR: Deposits /
Slide 8: Rationale: Clear Opportunities
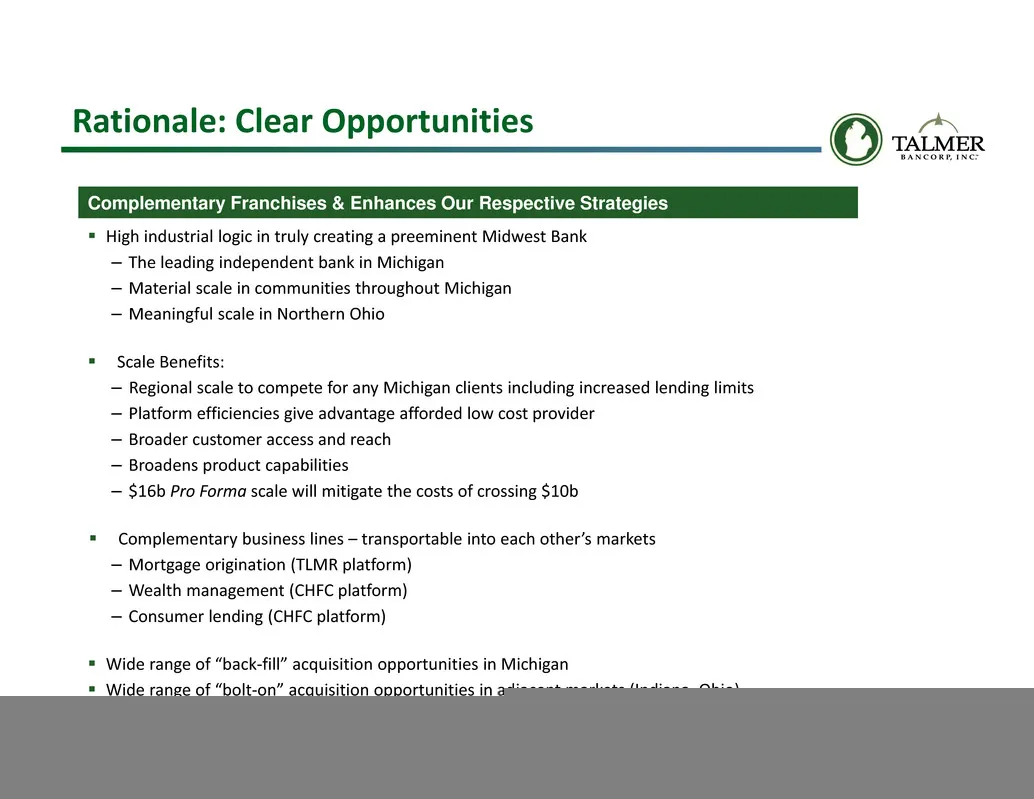
8 Rationale: Clear Opportunities Complementary Franchises & Enhances Our Respective Strategies High industrial logic in truly creating a preeminent Midwest Bank – The leading independent bank in Michigan – Material scale in communities throughout Michigan – Meaningful scale in Northern Ohio Scal
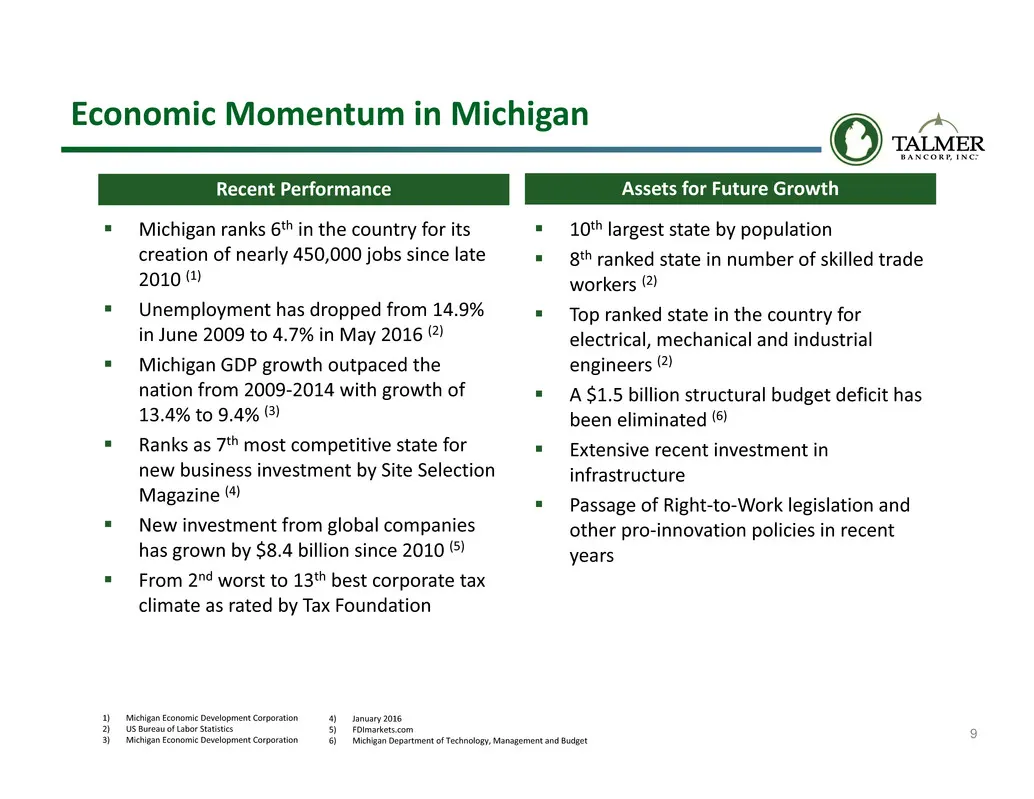
Slide 9: Economic Momentum in Michigan
9 Economic Momentum in Michigan Michigan ranks 6th in the country for its creation of nearly 450,000 jobs since late 2010 (1) Unemployment has dropped from 14.9% in June 2009 to 4.7% in May 2016 (2) Michigan GDP growth outpaced the nation from 2009‐2014 with growth of 13.4% to 9.4% (3) Ranks
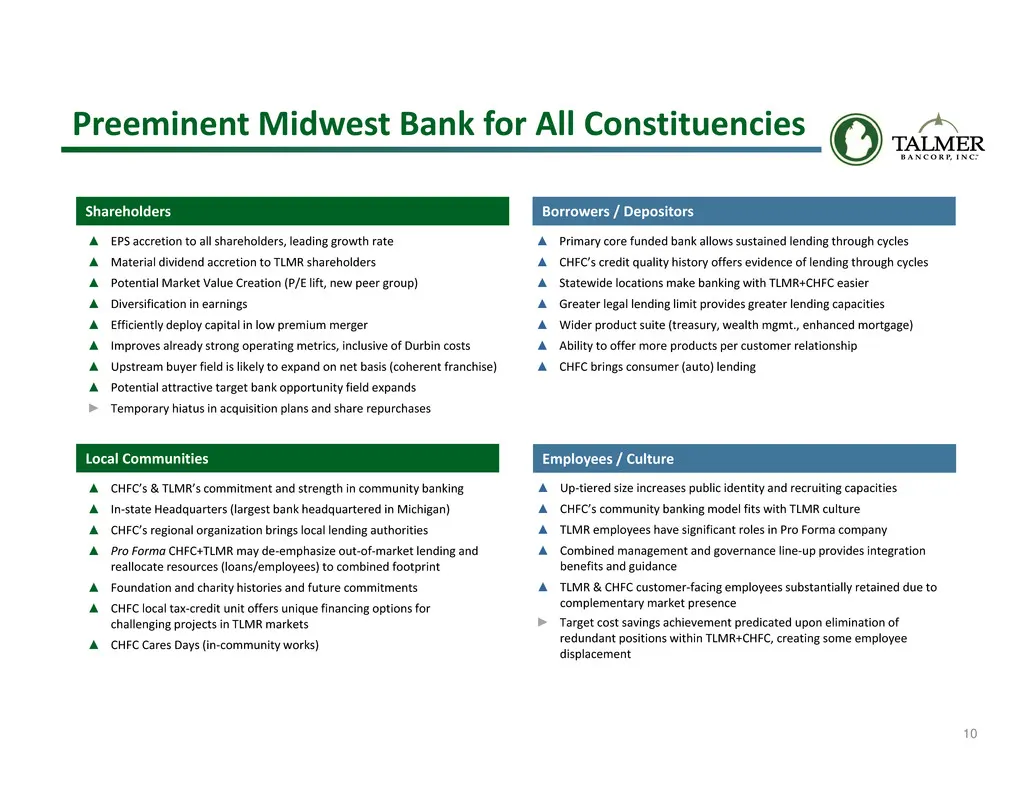
Slide 10: Preeminent Midwest Bank for All Constituencies
10 Preeminent Midwest Bank for All Constituencies Shareholders Local Communities ▲ EPS accretion to all shareholders, leading growth rate ▲ Material dividend accretion to TLMR shareholders ▲ Potential Market Value Creation (P/E lift, new peer group) ▲ Diversification in earnings ▲ Efficiently deploy
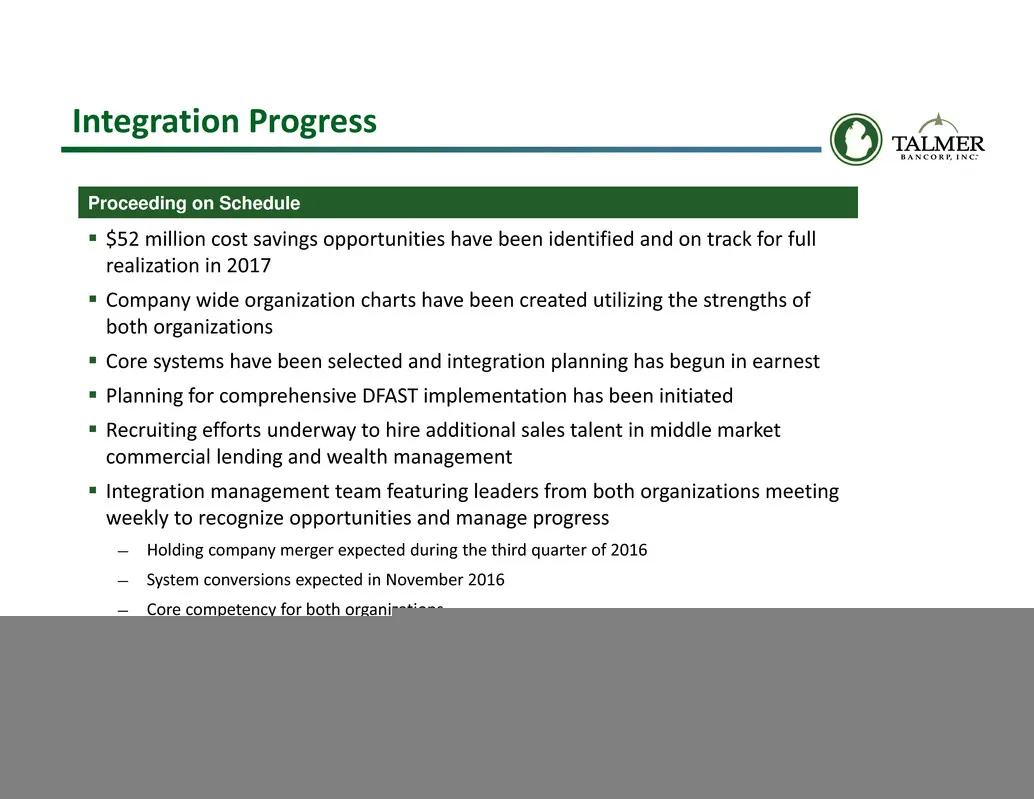
Slide 11: Integration Progress Proceeding on Schedule
11 Integration Progress Proceeding on Schedule $52 million cost savings opportunities have been identified and on track for full realization in 2017 Company wide organization charts have been created utilizing the strengths of both organizations Core systems have been selected and integration
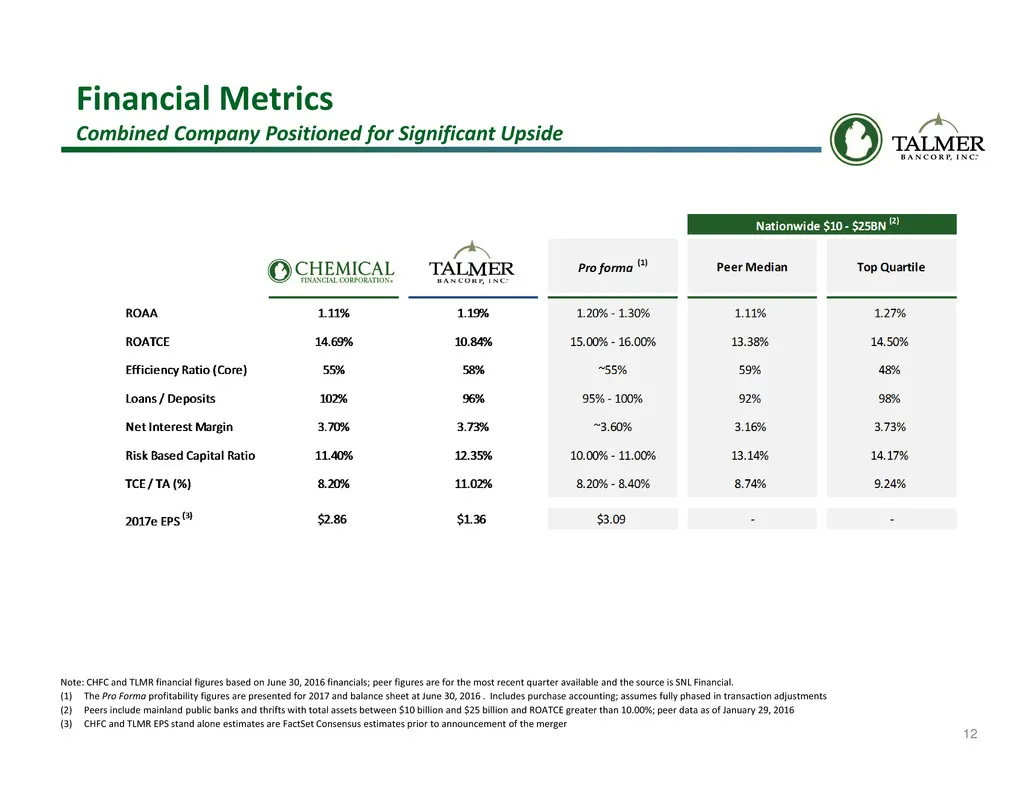
Slide 12: Financial Metrics: Combined Company Positioned for Significant Upside
12 Financial Metrics Combined Company Positioned for Significant Upside Note: CHFC and TLMR financial figures based on June 30, 2016 financials; peer figures are for the most recent quarter available and the source is SNL Financial. (1) The Pro Forma profitability figures are presented for 2017 and
Slide 13: Diversified Loan Portfolio and Low Cost Core Deposit Base
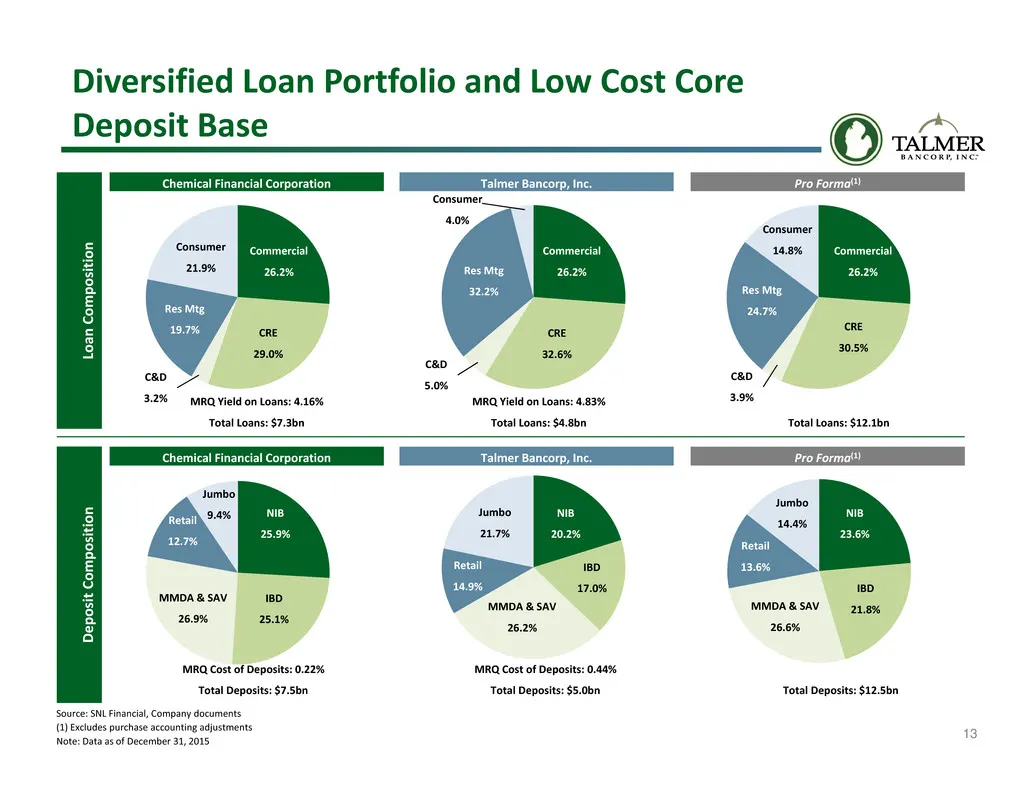
13 Diversified Loan Portfolio and Low Cost Core Deposit Base Source: SNL Financial, Company documents (1) Excludes purchase accounting adjustments Note: Data as of December 31, 2015 Commercial 26.2% CRE 32.6% C&D 5.0% Res Mtg 32.2% Jumbo 9.4% NIB 25.9% IBD 25.1% MMDA & SAV 26.9% Retail 12.7% Jumbo 2
Slide 14: Consistent EPS Growth Performance
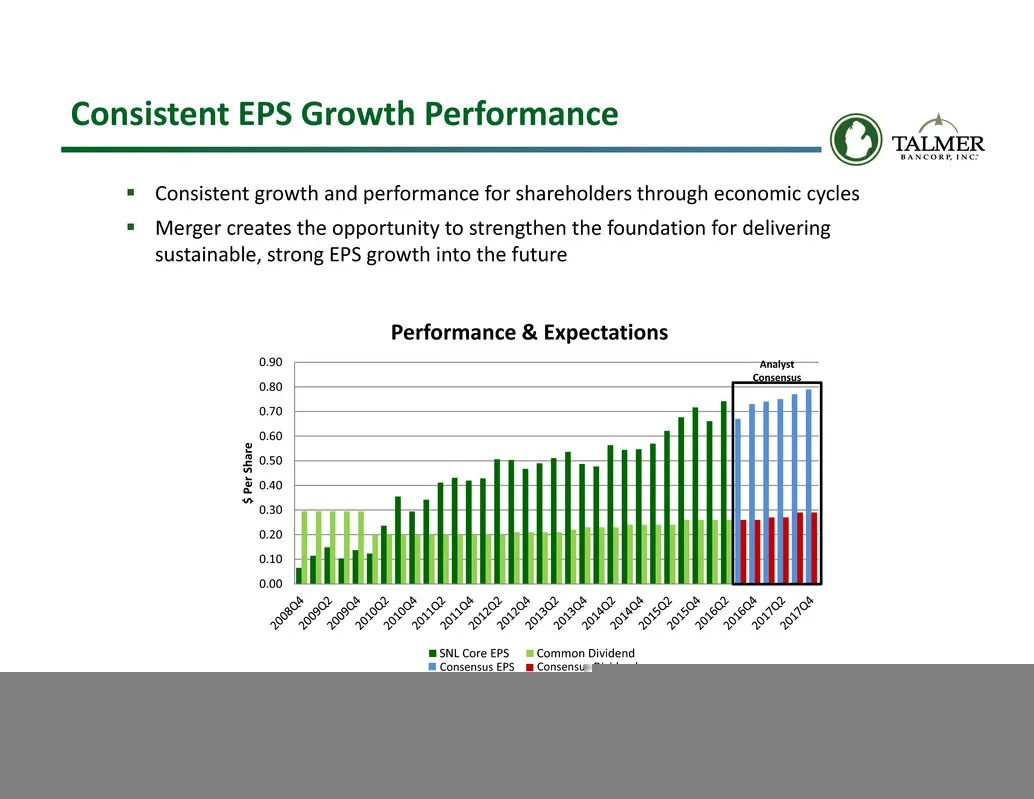
14 0.00 0.10 0.20 0.30 0.40 0.50 0.60 0.70 0.80 0.90 $ P e r S h a r e Performance & Expectations SNL Core EPS Common Dividend Consistent EPS Growth Performance Analyst Consensus Consistent growth and performance for shareholders through economic cycles Merger creates the opportunity to strength
Slide 15: Merger Transaction Summary
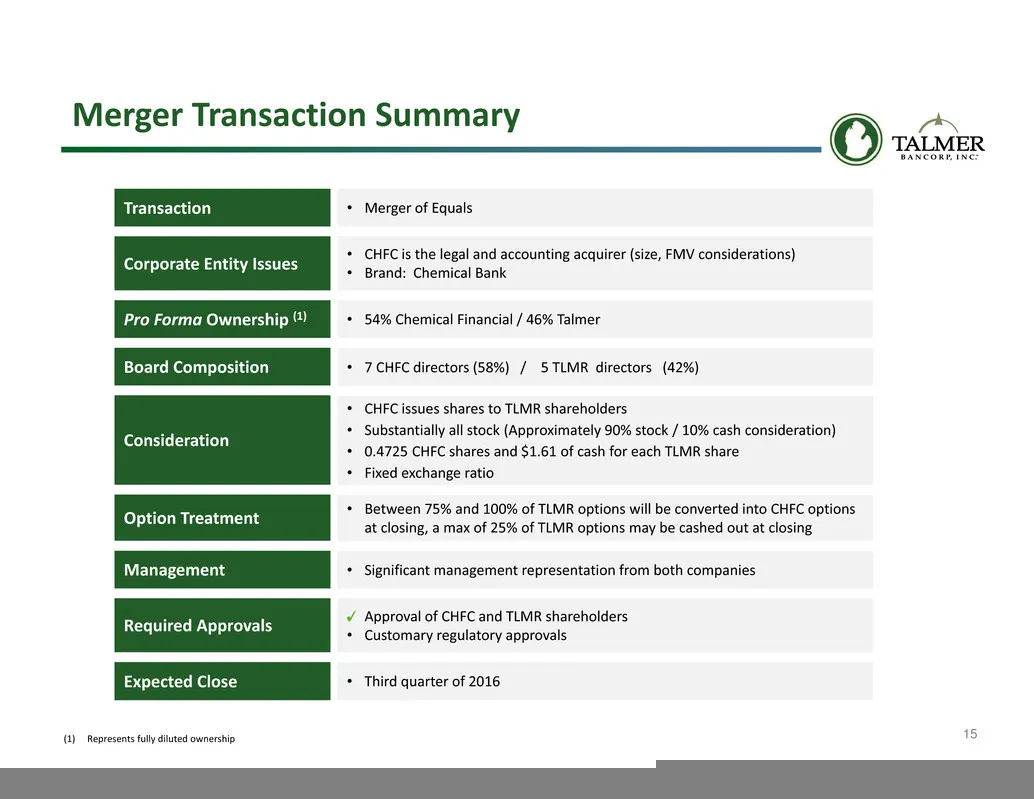
15 Merger Transaction Summary Corporate Entity Issues Consideration Management Board Composition Required Approvals Expected Close • Third quarter of 2016 Approval of CHFC and TLMR shareholders • Customary regulatory approvals • 7 CHFC directors (58%) / 5 TLMR directors (42%) • Significant managemen
Slide 16: Closing Remarks and Questions
Closing Remarks and Questions KBW Community Bank Investor Conference
Slide 17: Appendix I
Appendix I
Slide 18: Chemical Financial Corporation 2016 Second Quarter Earnings Results
Chemical Financial Corporation 2016 Second Quarter Earnings Results
Slide 19: Q2 2016 Highlights
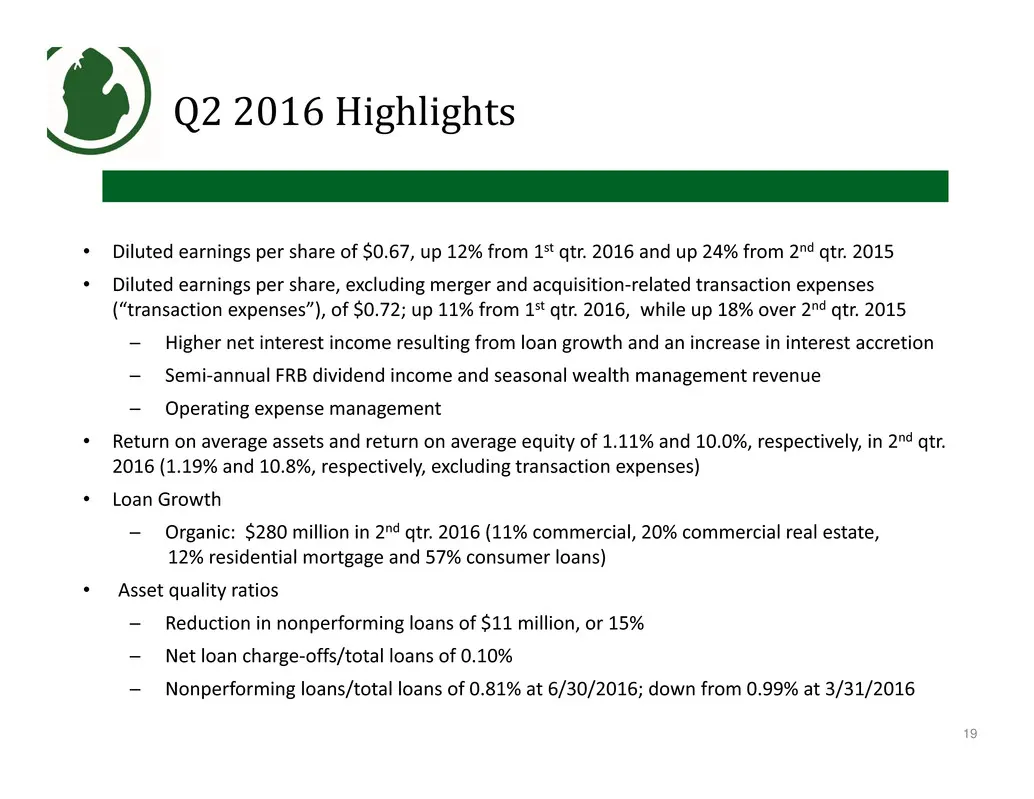
Q2 2016 Highlights 19 • Diluted earnings per share of $0.67, up 12% from 1st qtr. 2016 and up 24% from 2nd qtr. 2015 • Diluted earnings per share, excluding merger and acquisition‐related transaction expenses (“transaction expenses”), of $0.72; up 11% from 1st qtr. 2016, while up 18% over 2nd qtr. 2
Slide 20: Income Statement and Financial Highlights
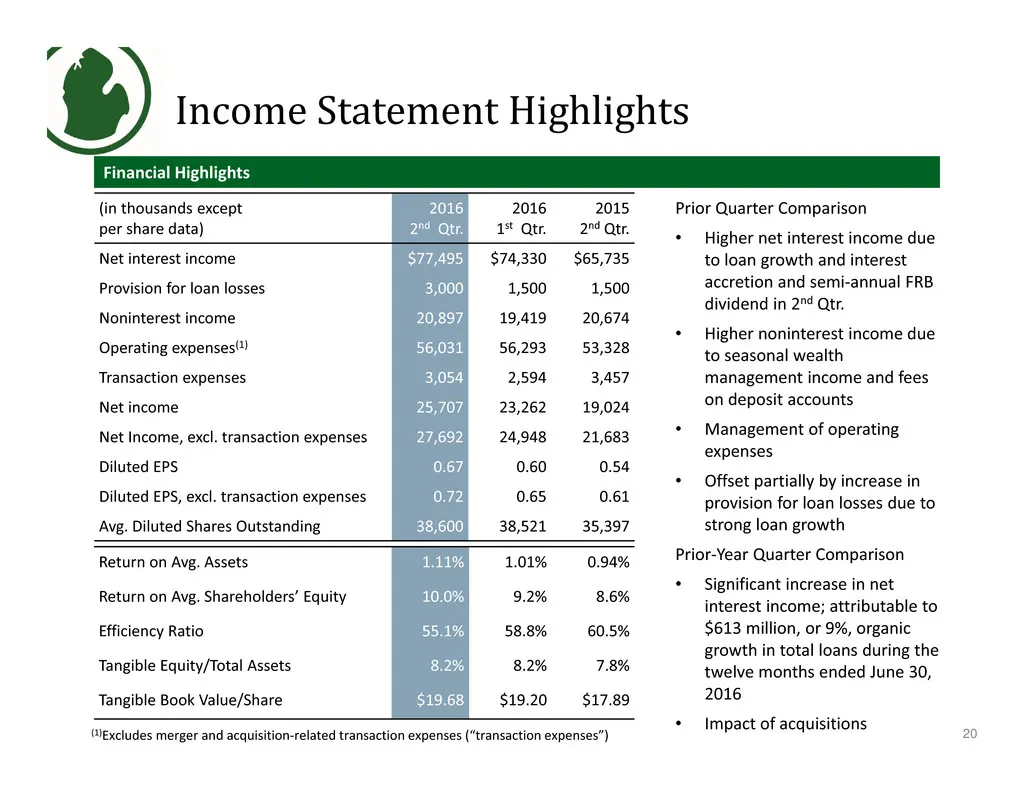
(in thousands except per share data) 2016 2nd Qtr. 2016 1st Qtr. 2015 2nd Qtr. Net interest income $77,495 $74,330 $65,735 Provision for loan losses 3,000 1,500 1,500 Noninterest income 20,897 19,419 20,674 Operating expenses(1) 56,031 56,293 53,328 Transaction expenses 3,054 2,594 3,457 Net income
Slide 21: Net Income Trending Upward
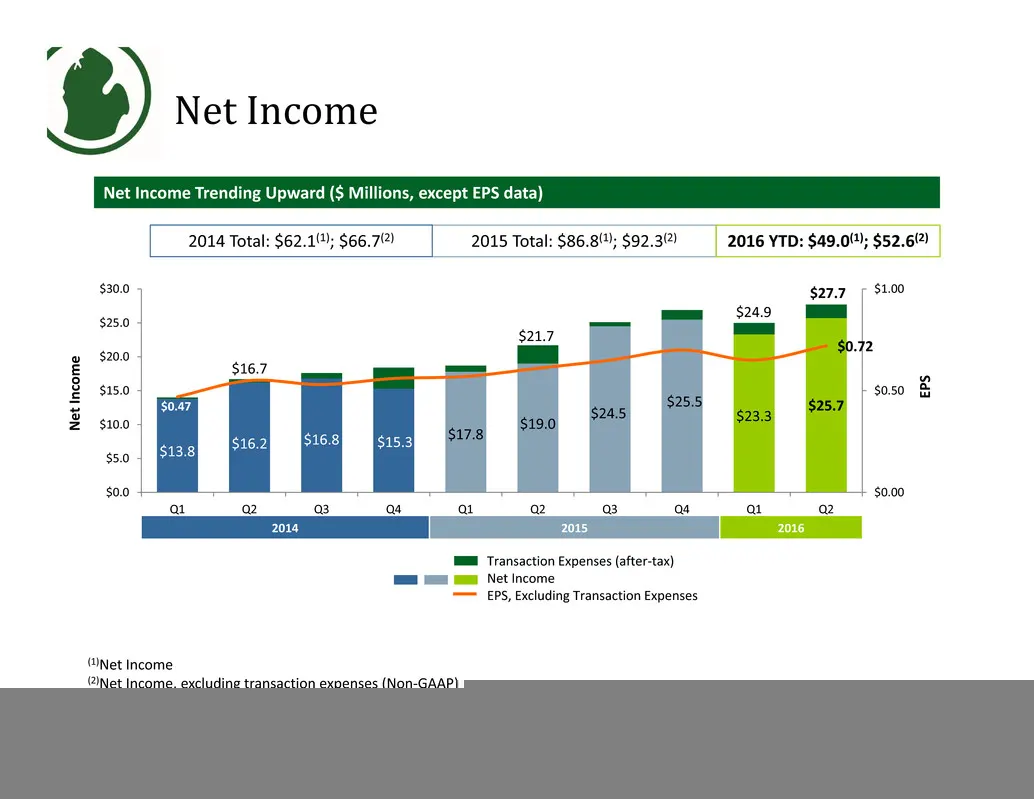
$13.8 $16.2 $16.8 $15.3 $17.8 $19.0 $24.5 $25.5 $23.3 $25.7$0.47 $0.72 $0.00 $0.50 $1.00 $0.0 $5.0 $10.0 $15.0 $20.0 $25.0 $30.0 Q1 Q2 Q3 Q4 Q1 Q2 Q3 Q4 Q1 Q2 EP S N e t I n c o m e Transaction Expenses (after‐tax) Net Income EPS, Excluding Transaction Expenses Net Income 2014 2015 2016 Net Income T
Slide 22: Organic Loan Growth
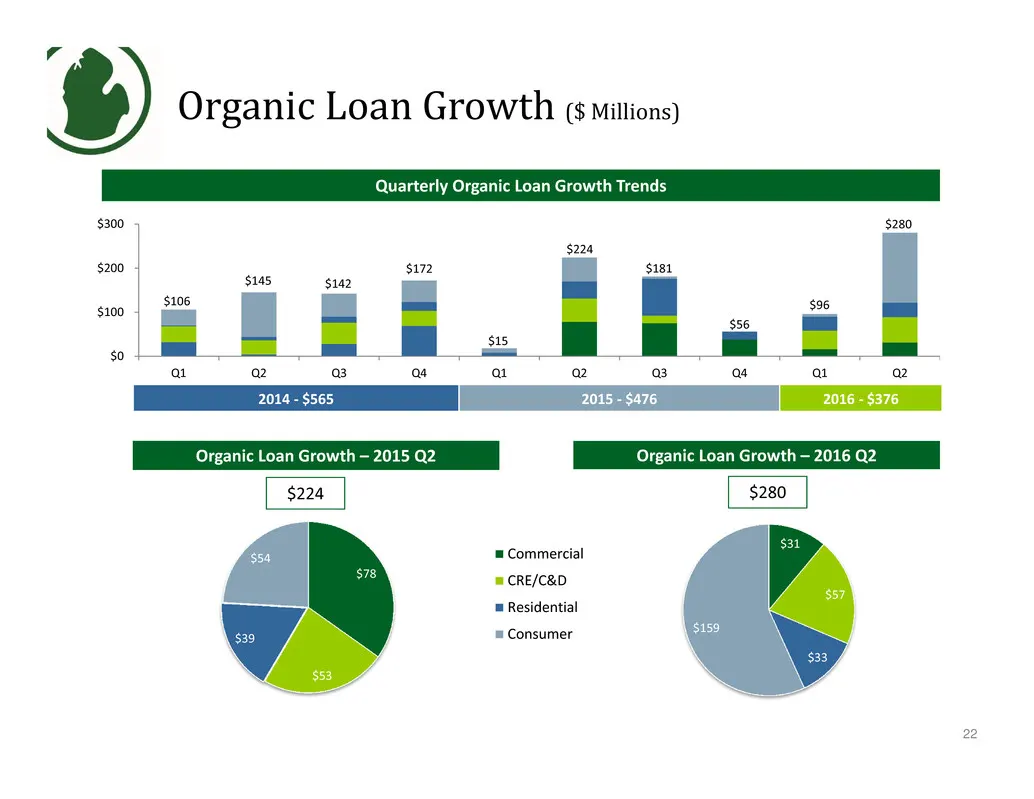
$78 $53 $39 $54 $31 $57 $33 $159 Commercial CRE/C&D Residential Consumer $0 $100 $200 $300 Q1 Q2 Q3 Q4 Q1 Q2 Q3 Q4 Q1 Q2 Organic Loan Growth ($ Millions) 22 Quarterly Organic Loan Growth Trends Organic Loan Growth – 2016 Q2Organic Loan Growth – 2015 Q2 2014 ‐ $565 2015 ‐ $476 2016 ‐ $376 $106 $145 $
Slide 23: Deposit Composition
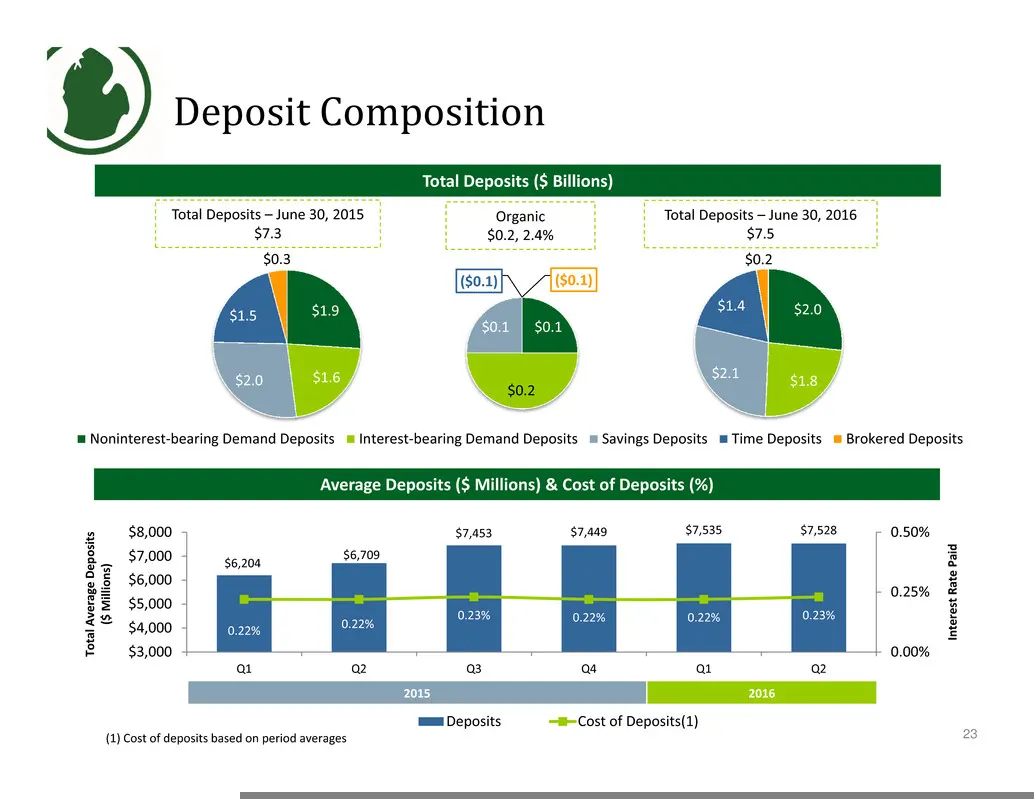
$2.0 $1.8 $2.1 $1.4 $0.2 Noninterest‐bearing Demand Deposits Interest‐bearing Demand Deposits Savings Deposits Time Deposits Brokered Deposits $6,204 $6,709 $7,453 $7,449 $7,535 $7,528 0.22% 0.22% 0.23% 0.22% 0.22% 0.23% 0.00% 0.25% 0.50% $3,000 $4,000 $5,000 $6,000 $7,000 $8,000 Q1 Q2 Q3 Q4 Q1 Q2 I
Slide 24: Funding Breakdown
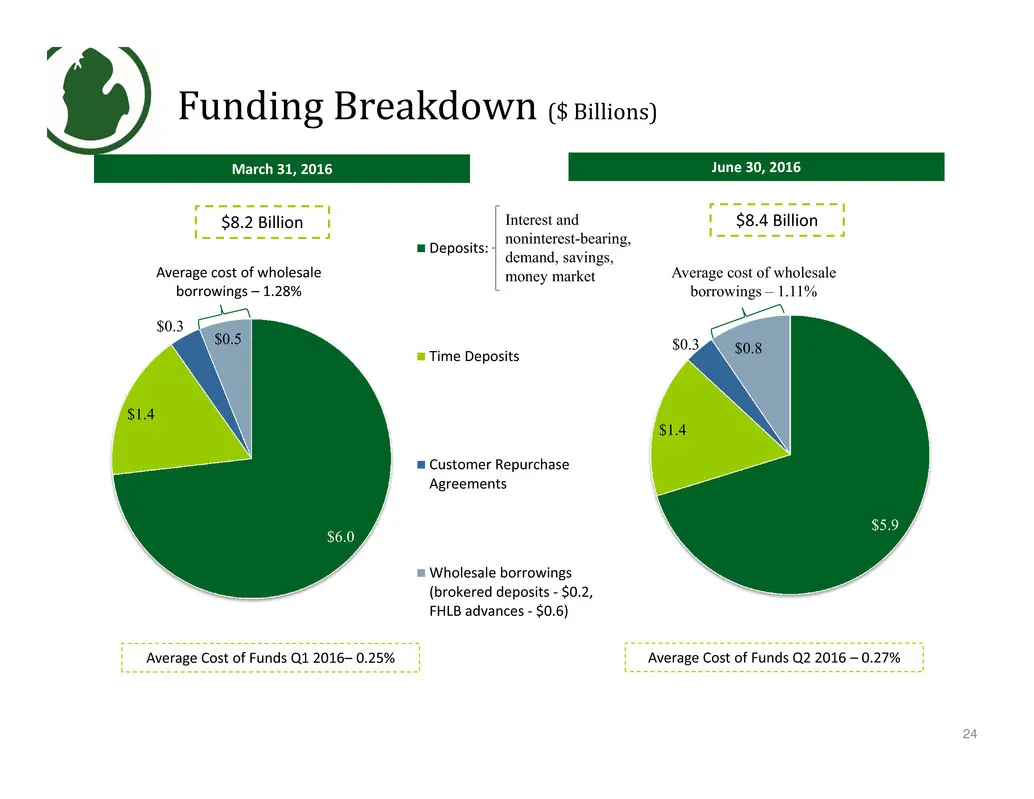
Funding Breakdown ($ Billions) 24 +11.3% March 31, 2016 June 30, 2016 Average Cost of Funds Q2 2016 – 0.27%Average Cost of Funds Q1 2016– 0.25% $8.2 Billion $8.4 Billion $6.0 $1.4 $0.3 $0.5 $5.9 $1.4 $0.3 $0.8 Deposits: Time Deposits Customer Repurchase Agreements Wholesale borrowings (brokered depo
Slide 25: Credit Quality
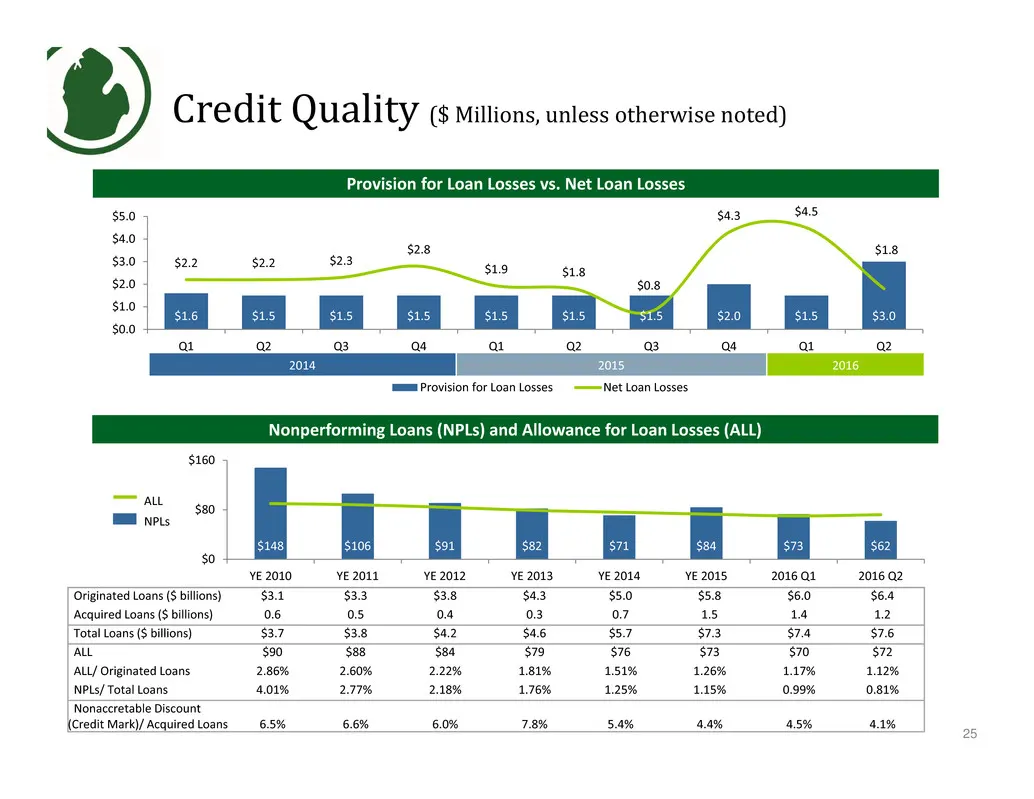
$1.6 $1.5 $1.5 $1.5 $1.5 $1.5 $1.5 $2.0 $1.5 $3.0 $2.2 $2.2 $2.3 $2.8 $1.9 $1.8 $0.8 $4.3 $4.5 $1.8 $0.0 $1.0 $2.0 $3.0 $4.0 $5.0 Q1 Q2 Q3 Q4 Q1 Q2 Q3 Q4 Q1 Q2 Provision for Loan Losses Net Loan Losses $148 $106 $91 $82 $71 $84 $73 $62 $0 $80 $160 YE 2010 YE 2011 YE 2012 YE 2013 YE 2014 YE 2015 2016
Slide 26: Net Interest Income, Net Interest Margin and Loan Yields
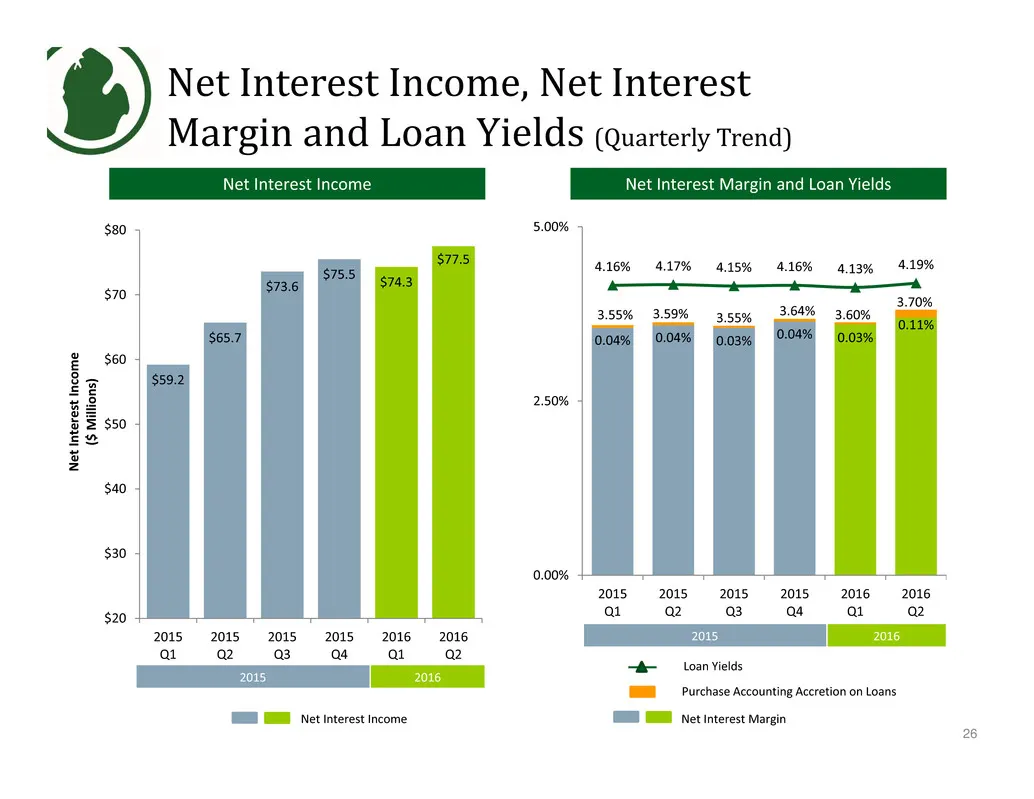
Net Interest Income, Net Interest Margin and Loan Yields (Quarterly Trend) Net Interest Income 26 3.55% 3.59% 3.55% 3.64% 3.60% 3.70% 0.04% 0.04% 0.03% 0.04% 0.03% 0.11% 4.16% 4.17% 4.15% 4.16% 4.13% 4.19% 0.00% 2.50% 5.00% 2015 Q1 2015 Q2 2015 Q3 2015 Q4 2016 Q1 2016 Q2 Net Interest Margin and Loan
Slide 27: Non-Interest Income
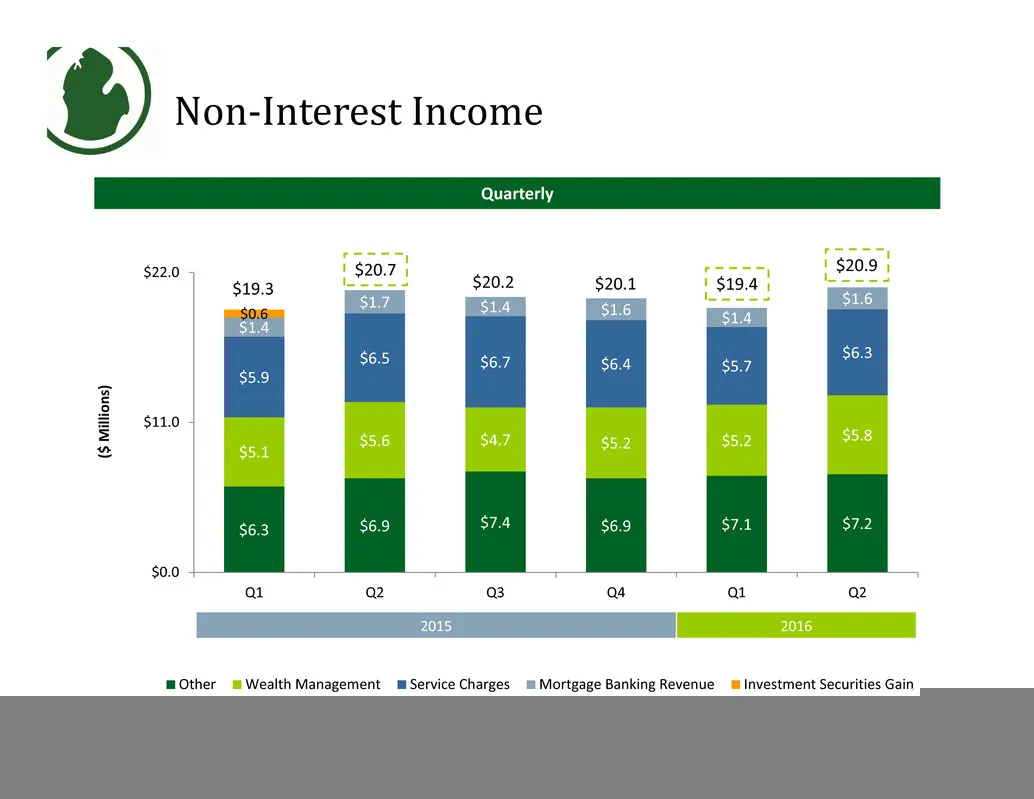
$6.3 $6.9 $7.4 $6.9 $7.1 $7.2 $5.1 $5.6 $4.7 $5.2 $5.2 $5.8 $5.9 $6.5 $6.7 $6.4 $5.7 $6.3 $1.4 $1.7 $1.4 $1.6 $1.4 $1.6 $0.6 $0.0 $11.0 $22.0 Q1 Q2 Q3 Q4 Q1 Q2 Other Wealth Management Service Charges Mortgage Banking Revenue Investment Securities Gain Non‐Interest Income 2015 2016 Quarterly ( $ M i
Slide 28: Operating Expenses
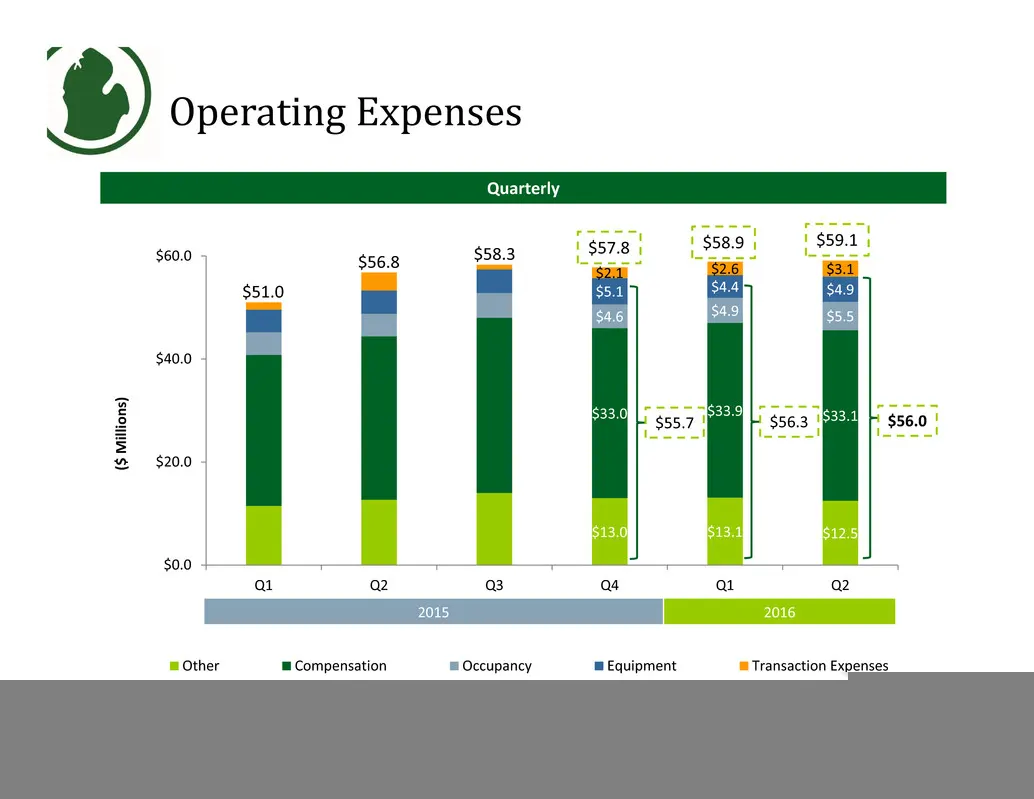
$13.0 $13.1 $12.5 $33.0 $33.9 $33.1 $4.6 $4.9 $5.5 $5.1 $4.4 $4.9 $2.1 $2.6 $3.1 $0.0 $20.0 $40.0 $60.0 Q1 Q2 Q3 Q4 Q1 Q2 Other Compensation Occupancy Equipment Transaction Expenses Operating Expenses 2015 2016 Quarterly 28 ( $ M i l l i o n s ) $56.8 $51.0 $58.3 $56.0 $57.8 $59.1 $56.3 $58.9 $55.7
Slide 29: Capital Ratios
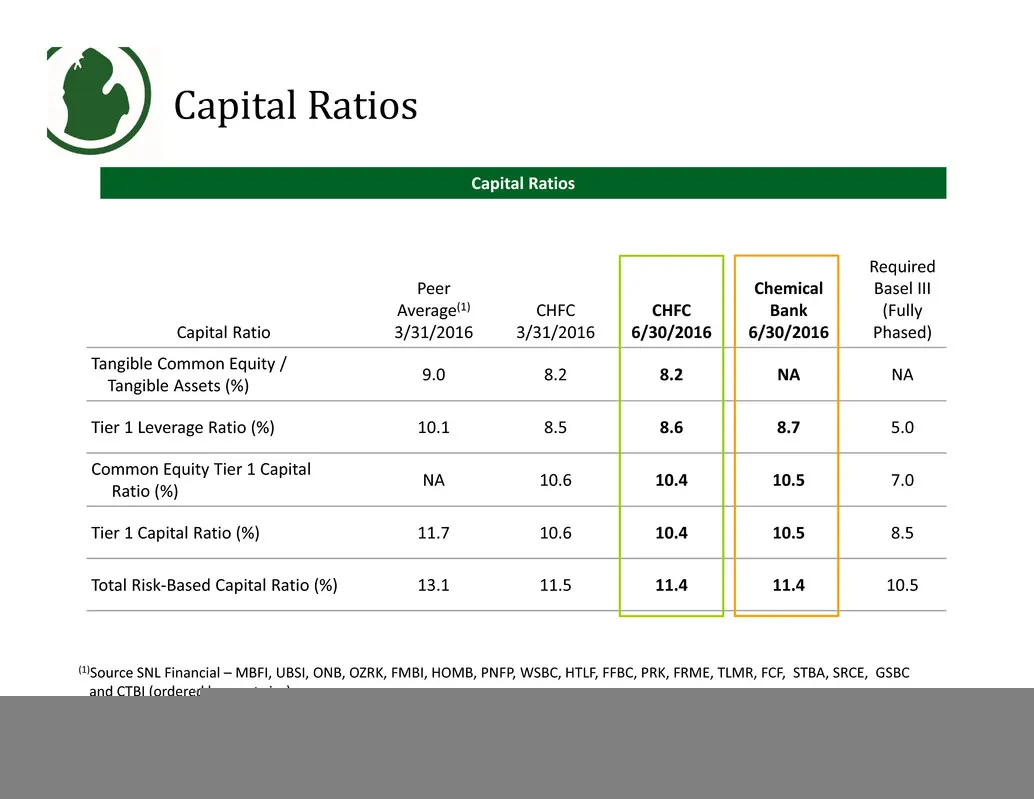
Capital Ratio Peer Average(1) 3/31/2016 CHFC 3/31/2016 CHFC 6/30/2016 Chemical Bank 6/30/2016 Required Basel III (Fully Phased) Tangible Common Equity / Tangible Assets (%) 9.0 8.2 8.2 NA NA Tier 1 Leverage Ratio (%) 10.1 8.5 8.6 8.7 5.0 Common Equity Tier 1 Capital Ratio (%) NA 10.6 10.4 10.5 7.0 T
Slide 30: Tangible Book Value and Capital Ratios
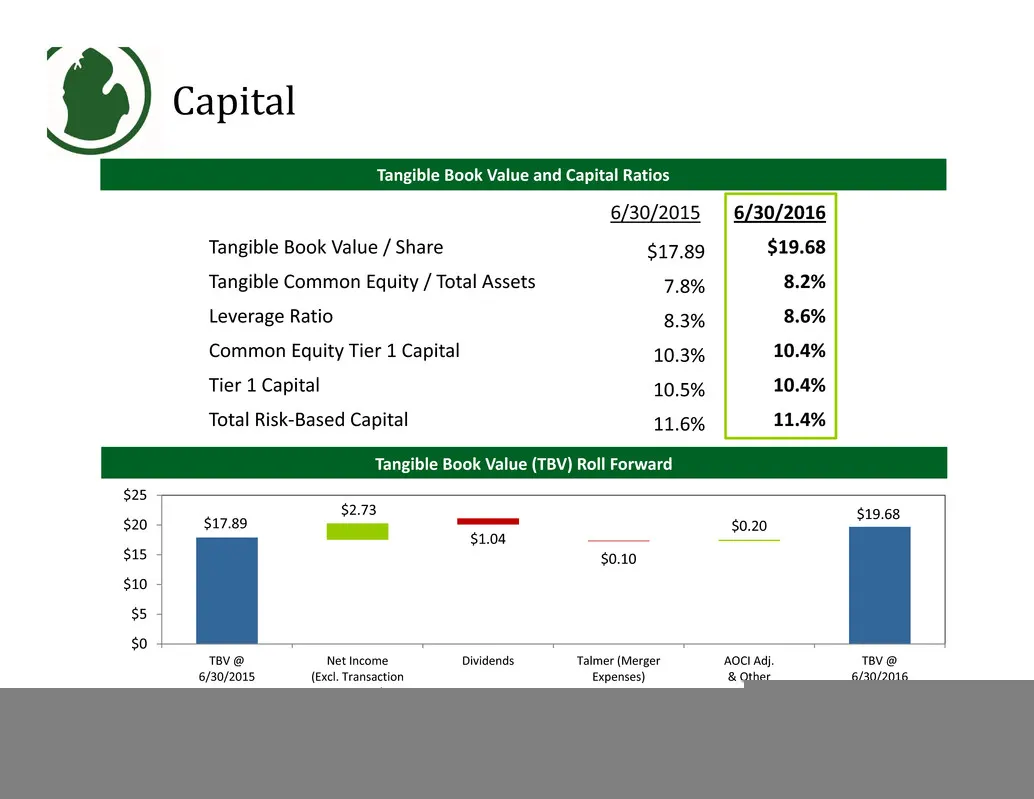
6/30/2015 6/30/2016 Tangible Book Value / Share $17.89 $19.68 Tangible Common Equity / Total Assets 7.8% 8.2% Leverage Ratio 8.3% 8.6% Common Equity Tier 1 Capital 10.3% 10.4% Tier 1 Capital 10.5% 10.4% Total Risk‐Based Capital 11.6% 11.4% Capital $19.68 $1.04 $0.10 $17.89 $2.73 $0.20 $0 $5 $10 $15
Slide 31: Appendix: Non-GAAP Reconciliation
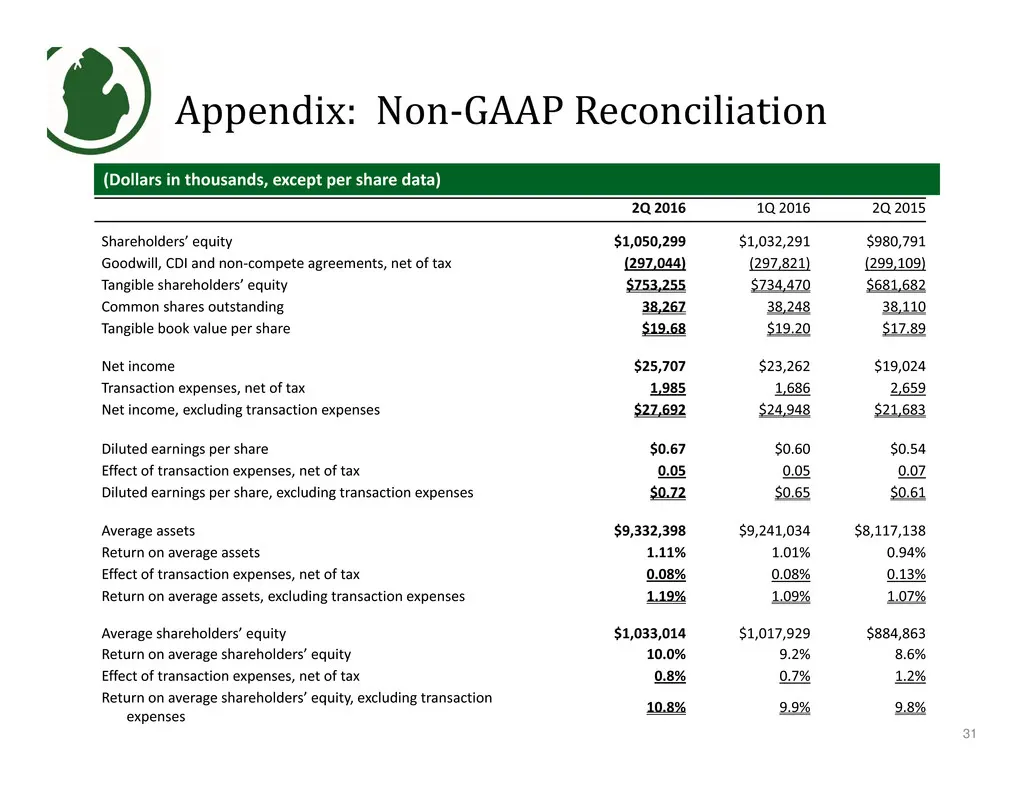
Appendix: Non‐GAAP Reconciliation (Dollars in thousands, except per share data) 2Q 2016 1Q 2016 2Q 2015 Shareholders’ equity $1,050,299 $1,032,291 $980,791 Goodwill, CDI and non‐compete agreements, net of tax (297,044) (297,821) (299,109) Tangible shareholders’ equity $753,255 $734,470 $681,682 Comm
Slide 32: Appendix II
Appendix II
Slide 33: Talmer Bancorp 2016 Second Quarter Earnings Results
Talmer Bancorp 2016 Second Quarter Earnings Results
Slide 34: Income Statement Highlights
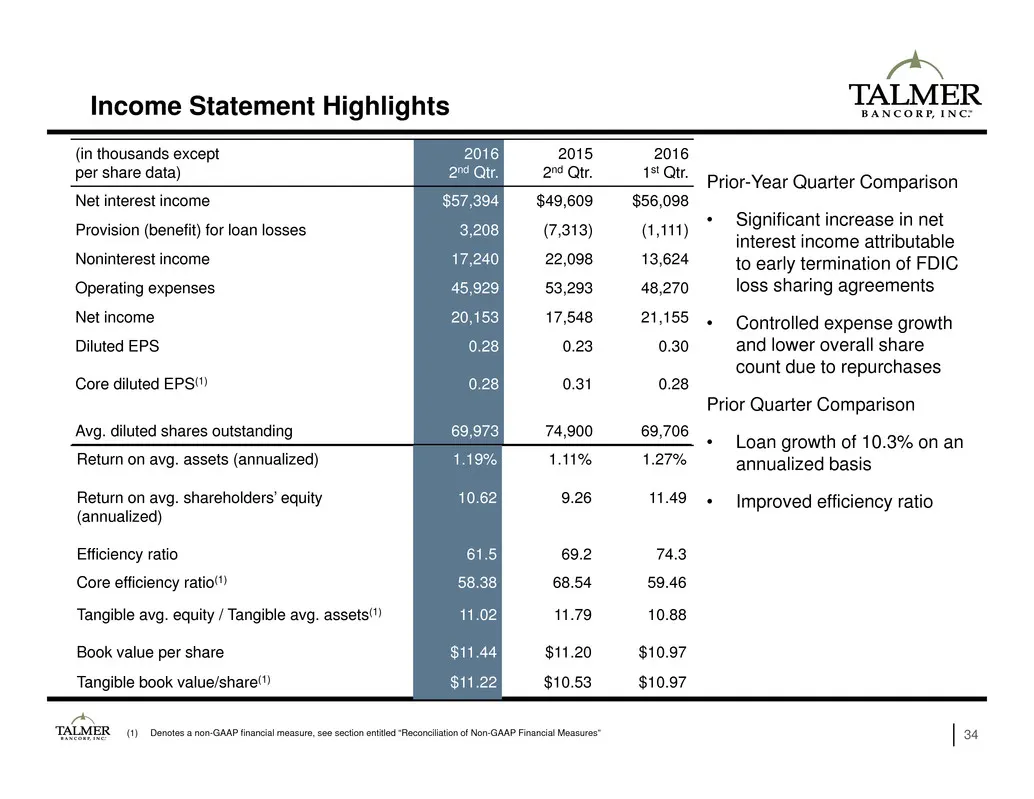
(1) Denotes a non-GAAP financial measure, see section entitled “Reconciliation of Non-GAAP Financial Measures” Income Statement Highlights 34 (in thousands except per share data) 2016 2nd Qtr. 2015 2nd Qtr. 2016 1st Qtr. Net interest income $57,394 $49,609 $56,098 Provision (benefit) for loan losses
Slide 35: Net Interest Margin Trends
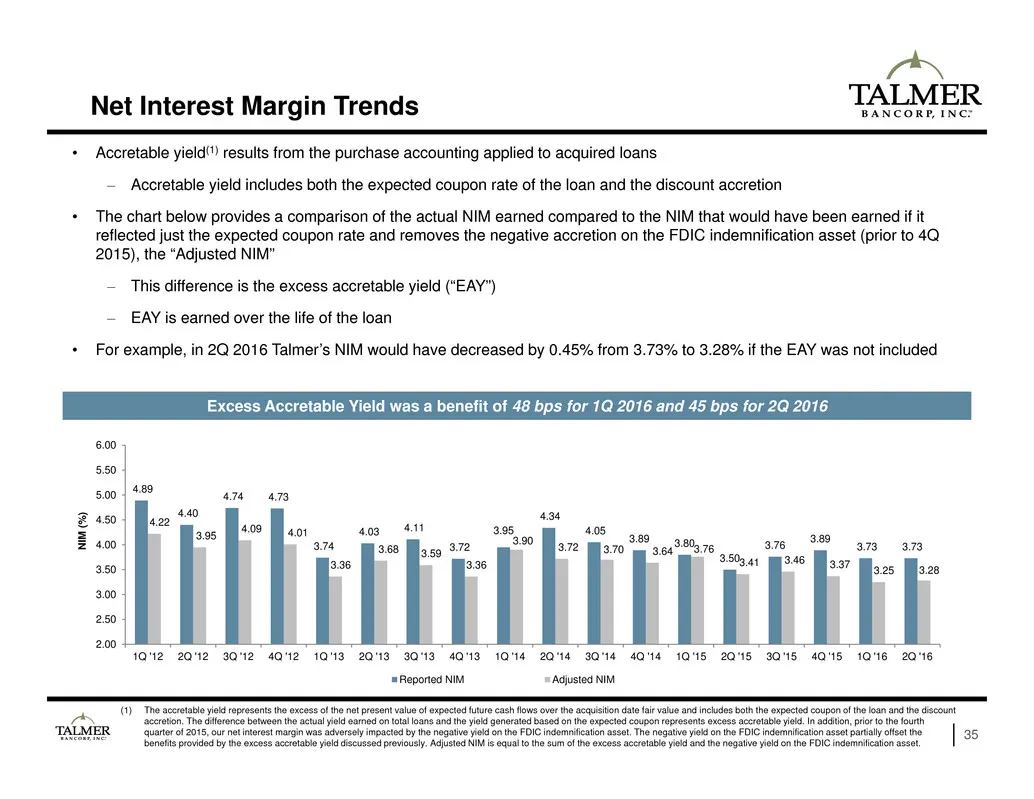
• Accretable yield(1) results from the purchase accounting applied to acquired loans – Accretable yield includes both the expected coupon rate of the loan and the discount accretion • The chart below provides a comparison of the actual NIM earned compared to the NIM that would have been earned if it
Slide 36: Effectiveness in Building Recurring Earnings Streams
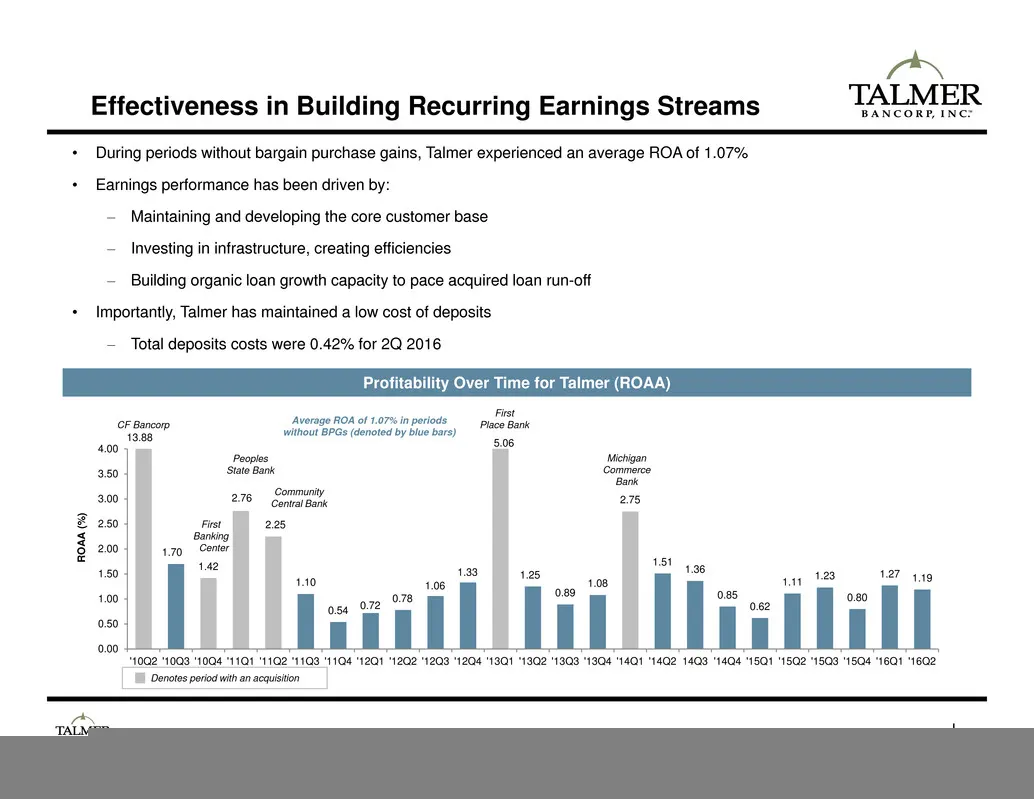
36 Effectiveness in Building Recurring Earnings Streams • During periods without bargain purchase gains, Talmer experienced an average ROA of 1.07% • Earnings performance has been driven by: – Maintaining and developing the core customer base – Investing in infrastructure, creating efficiencies – Bu
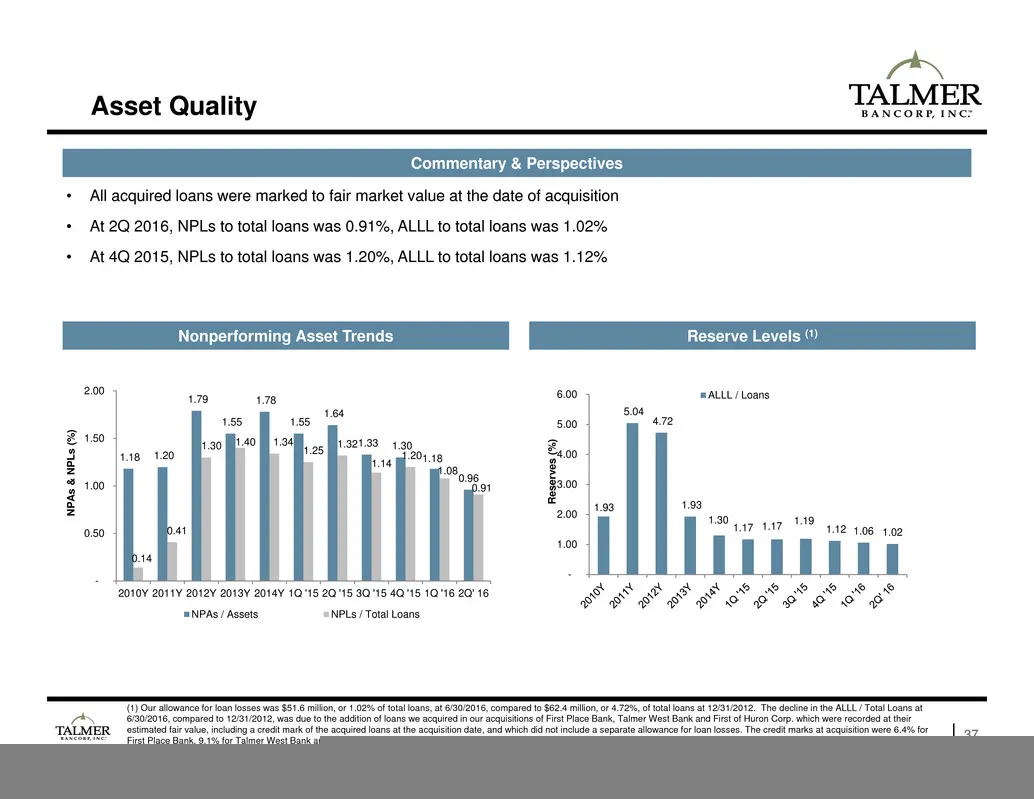
Slide 37: Asset Quality
(1) Our allowance for loan losses was $51.6 million, or 1.02% of total loans, at 6/30/2016, compared to $62.4 million, or 4.72%, of total loans at 12/31/2012. The decline in the ALLL / Total Loans at 6/30/2016, compared to 12/31/2012, was due to the addition of loans we acquired in our acquisitions
Slide 38: Appendix: Non-GAAP Reconciliation
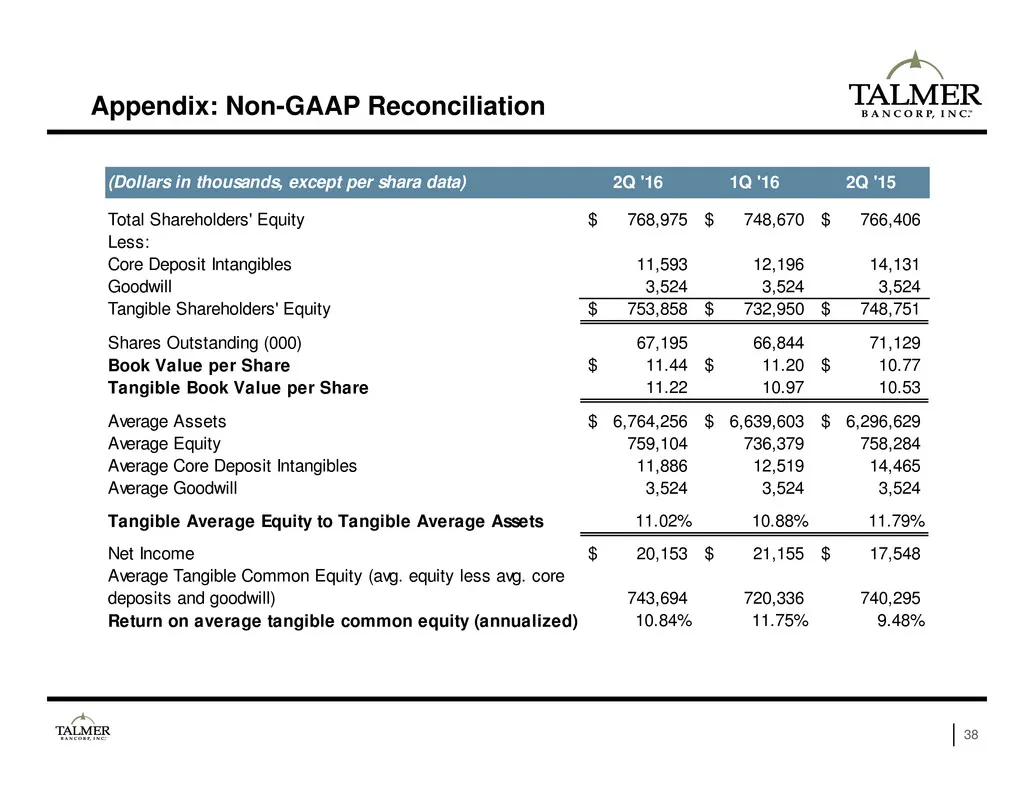
38 Appendix: Non-GAAP Reconciliation (Dollars in thousands, except per shara data) 2Q '16 1Q '16 2Q '15 Total Shareholders' Equity 768,975$ 748,670$ 766,406$ Less: Core Deposit Intangibles 11,593 12,196 14,131 Goodwill 3,524 3,524 3,524 Tangible Shareholders' Equity 753,858$ 732,950$ 748,751$ Shares
Slide 39: Appendix: Non-GAAP Reconciliation
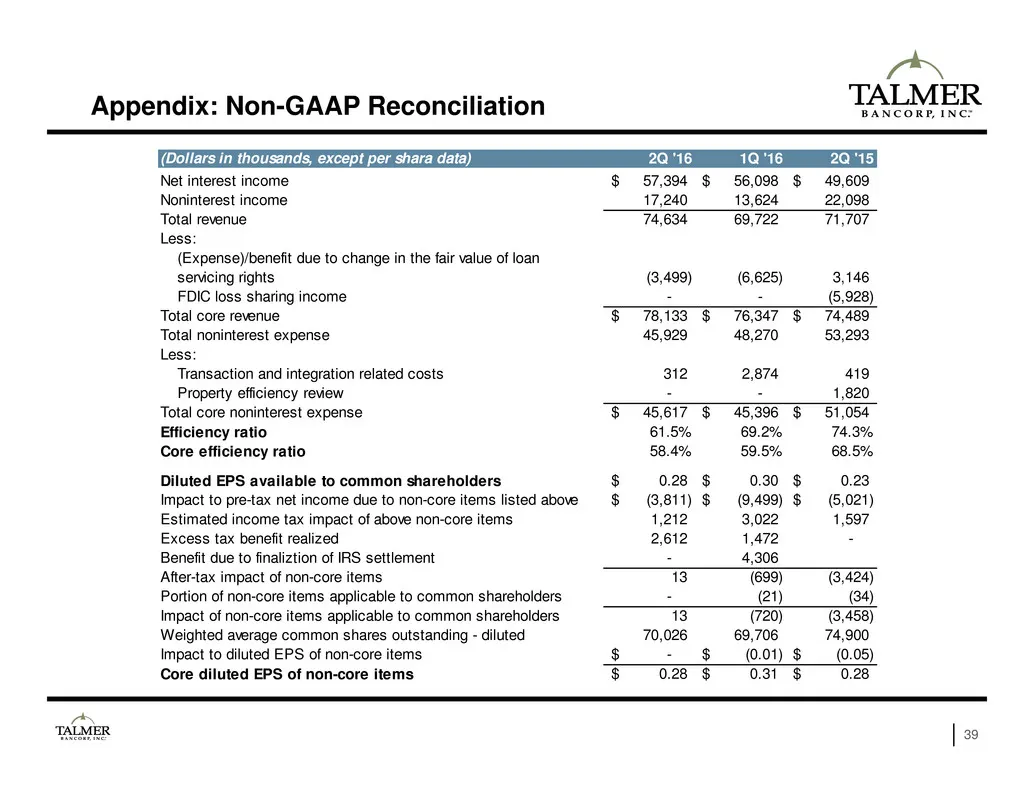
39 Appendix: Non-GAAP Reconciliation (Dollars in thousands, except per shara data) 2Q '16 1Q '16 2Q '15 Net interest income 57,394$ 56,098$ 49,609$ Noninterest income 17,240 13,624 22,098 Total revenue 74,634 69,722 71,707 Less: (Expense)/benefit due to change in the fair value of loan servicing rig
Source: SEC EDGAR · 8-K filed Aug 2, 2016
More decks from Talmer Bancorp Inc
 Q1 2016 Earnings Presentation22 slides · Apr 15, 2016
 Merger or Acquisition (February 2016)50 slides · Feb 11, 2016
 Merger or Acquisition (February 2016)50 slides · Feb 11, 2016
 Merger or Acquisition (February 2016)32 slides · Feb 1, 2016
 Merger or Acquisition (January 2016)19 slides · Jan 26, 2016
 Q3 2015 Earnings Presentation16 slides · Nov 10, 2015