National Penn Bancshares — FIG Partners Dandy Dozen 2009 Conference
29 slides from National Penn Bancshares's conference presentation, Jan 8, 2009
Slide 1: National Penn Bancshares, Inc. Engineered for Success
& #160; EXHIBIT 99.1 Presentation - January 8, 2009 - 2:00 pm (ET) National Penn Bancshares, Inc. Engineered for Success FIG Partners Dandy Dozen 2009 Conference January 2009 Thank you to FIG Partners for inviting us to present today and good afternoon to all of you. I’m Glenn Moyer, President and C
Slide 2: Investor Relations Information
Investor Relations Information l The following information can be found on our Investor Relations Web site at www.nationalpennbancshares.com l SEC Filings l Corporate News l Analyst Estimates l and much more l Contact information – Michael R. Reinhard, Chief Financial Officer 610.369.6342 | mike.rei
Slide 3: Safe Harbor Regarding Forward-Looking Statements
Safe Harbor Regarding Forward-Looking Statements This presentation contains forward-looking information about National Penn Bancshares, Inc. that is intended to be covered by the safe harbor for forward-looking statements provided by the Private Securities Litigation Reform Act of 1995. Forward-look
Slide 4: Today’s Discussion
Today’s Discussion l National Penn Overview l National Penn’s Focus l Investment Considerations For today’s discussion, I will provide an overview of National Penn, Mike will review our strategic focus, and then I’ll return for a wrap-up of investment considerations. We will also review the details
Slide 5: Profile as of December 31, 2008
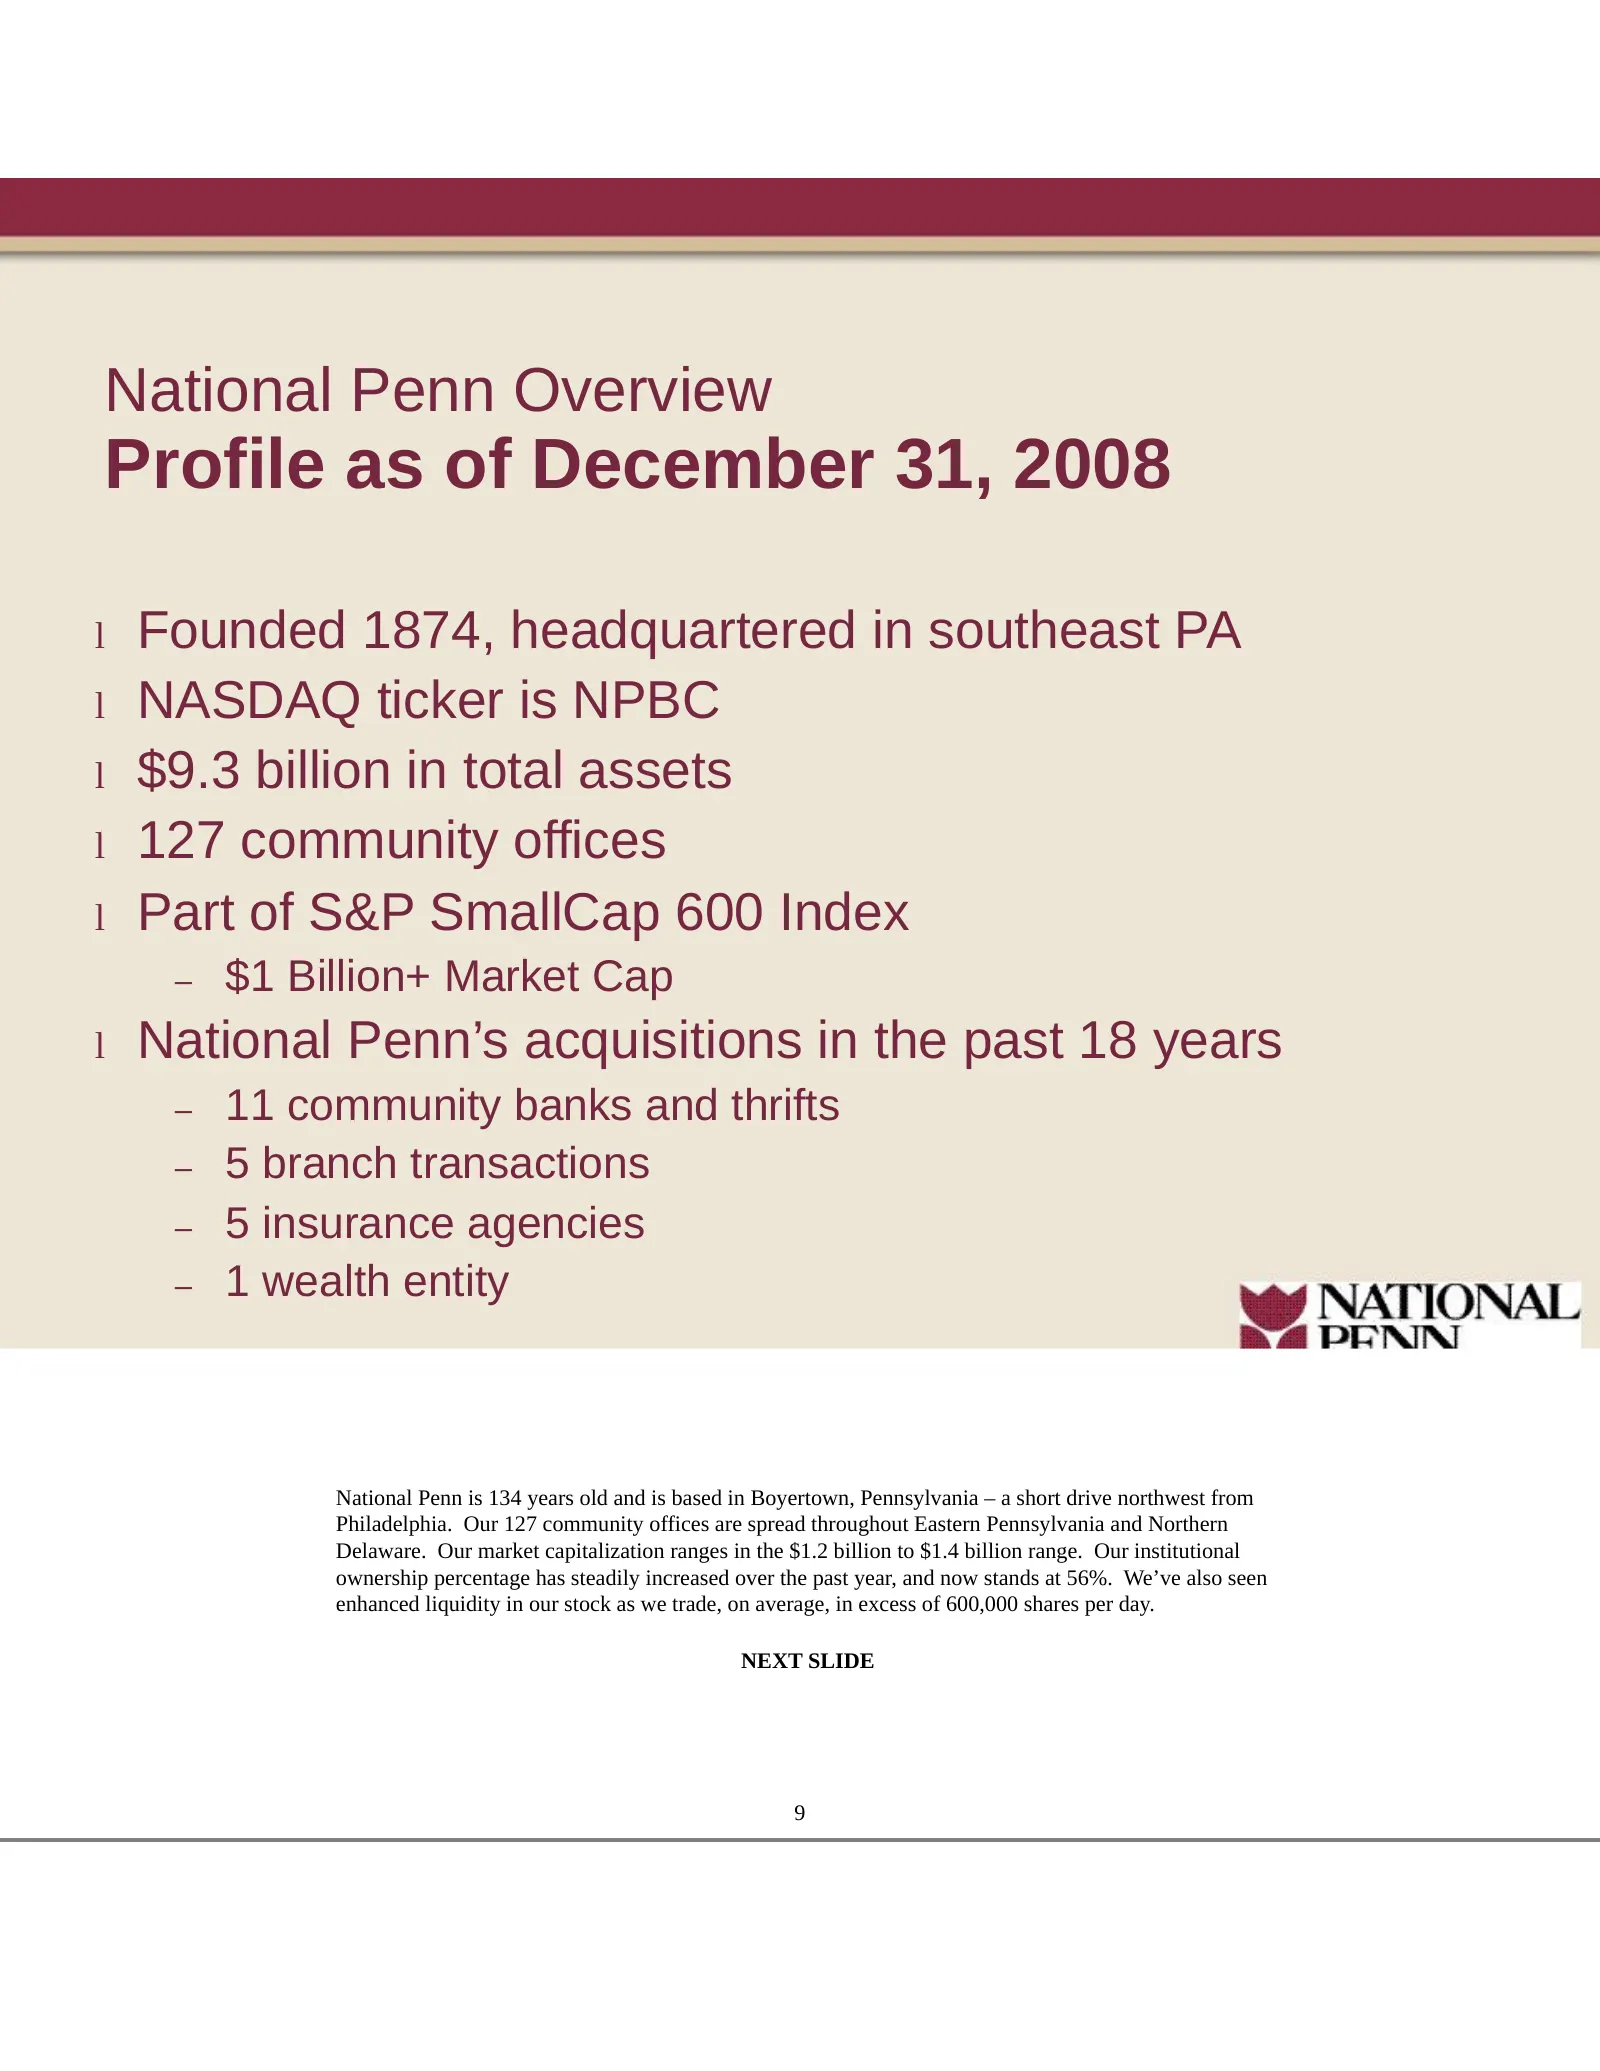
National Penn Overview Profile as of December 31, 2008 l Founded 1874, headquartered in southeast PA l NASDAQ ticker is NPBC l $9.3 billion in total assets l 127 community offices l Part of S&P SmallCap 600 Index – $1 Billion+ Market Cap l National Penn’s acquisitions in the past 18 years – 11 commu
Slide 6: Primary Market
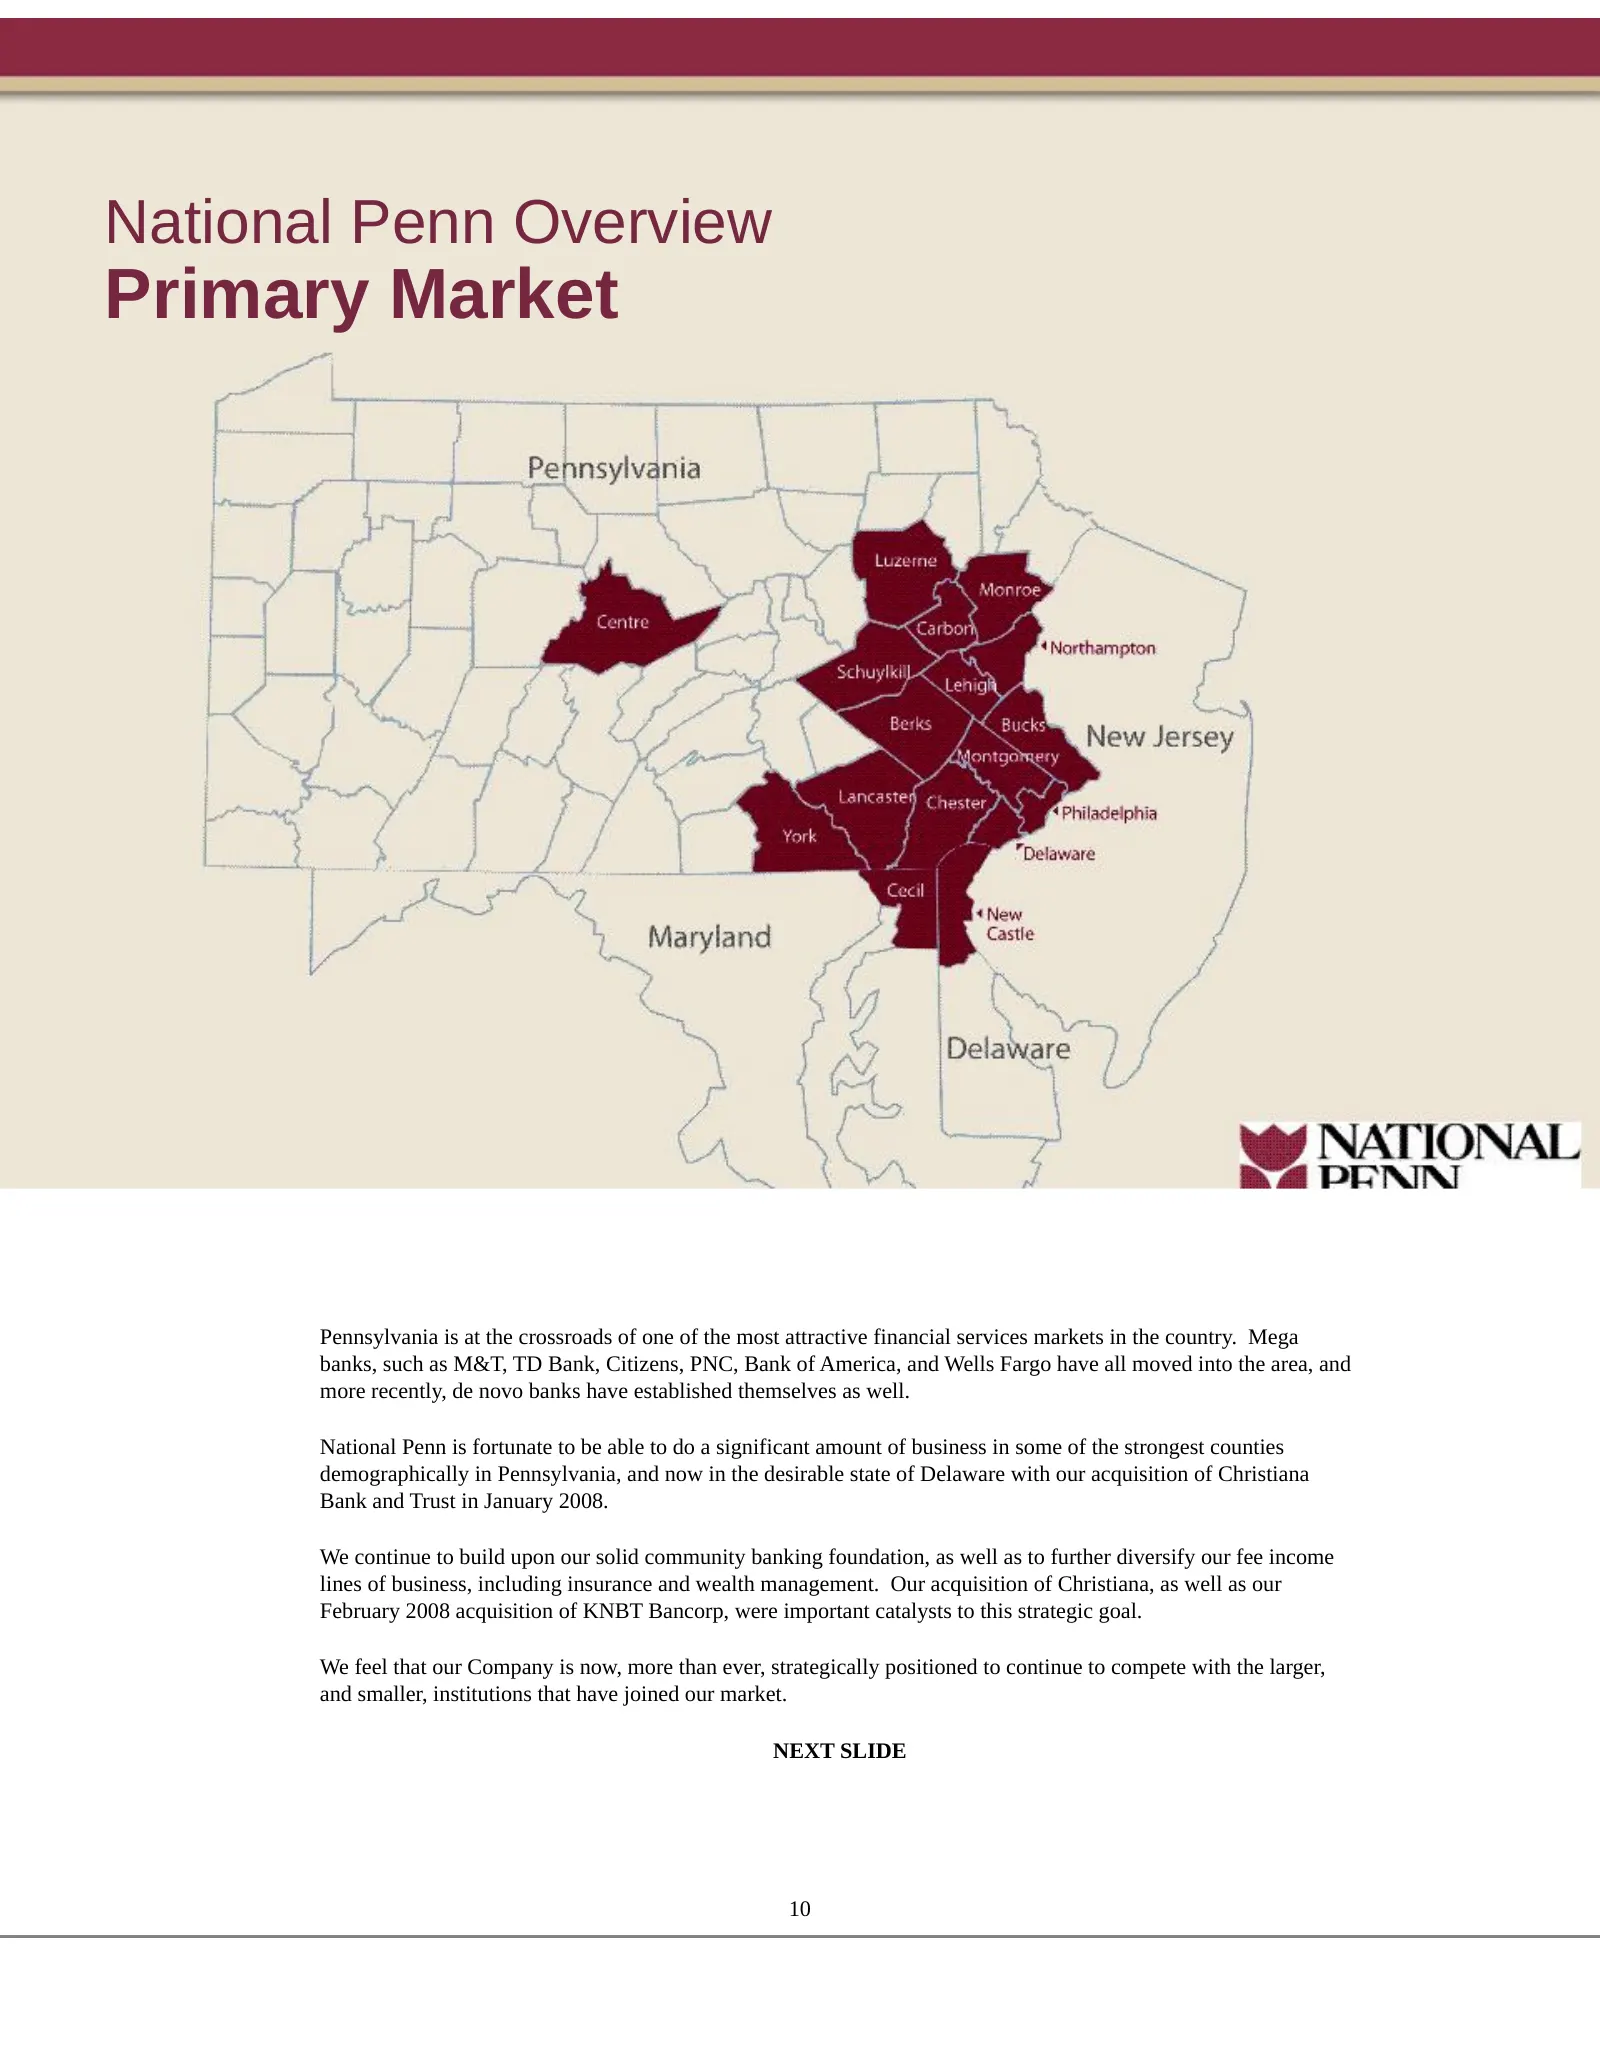
National Penn Overview Primary Market Pennsylvania is at the crossroads of one of the most attractive financial services markets in the country. Mega banks, such as M&T, TD Bank, Citizens, PNC, Bank of America, and Wells Fargo have all moved into the area, and more recently, de novo banks have estab
Slide 7: Business Organization
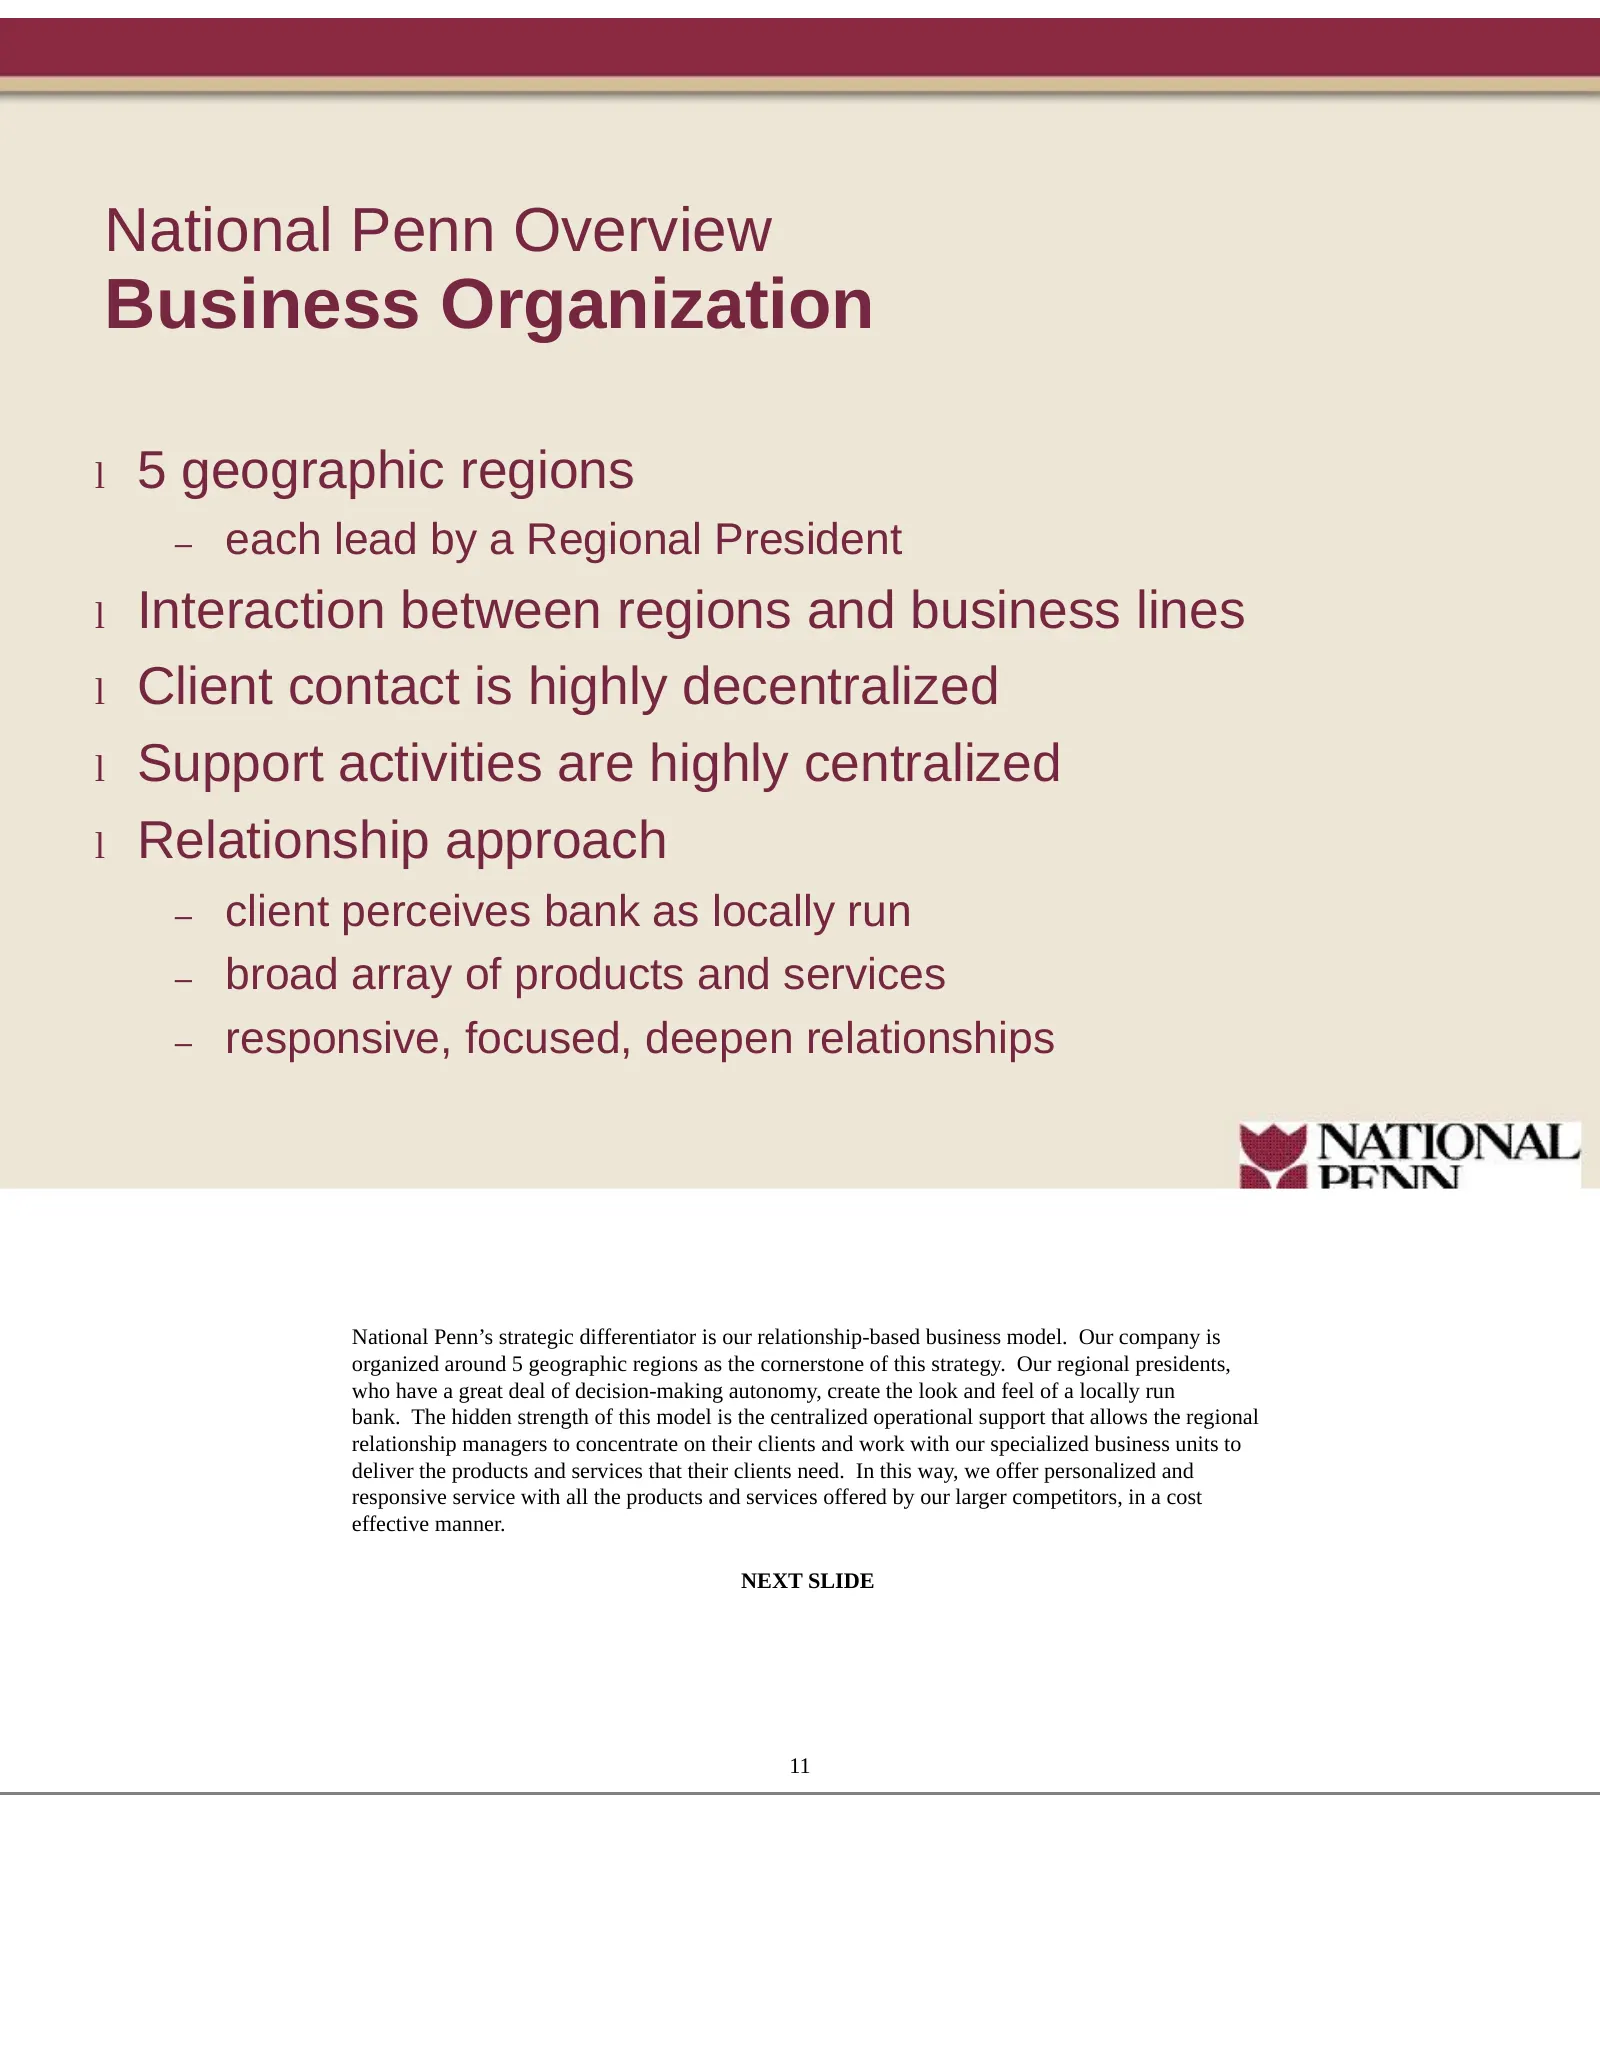
National Penn Overview Business Organization l 5 geographic regions – each lead by a Regional President l Interaction between regions and business lines l Client contact is highly decentralized l Support activities are highly centralized l Relationship approach – client perceives bank as locally run
Slide 8: Banking
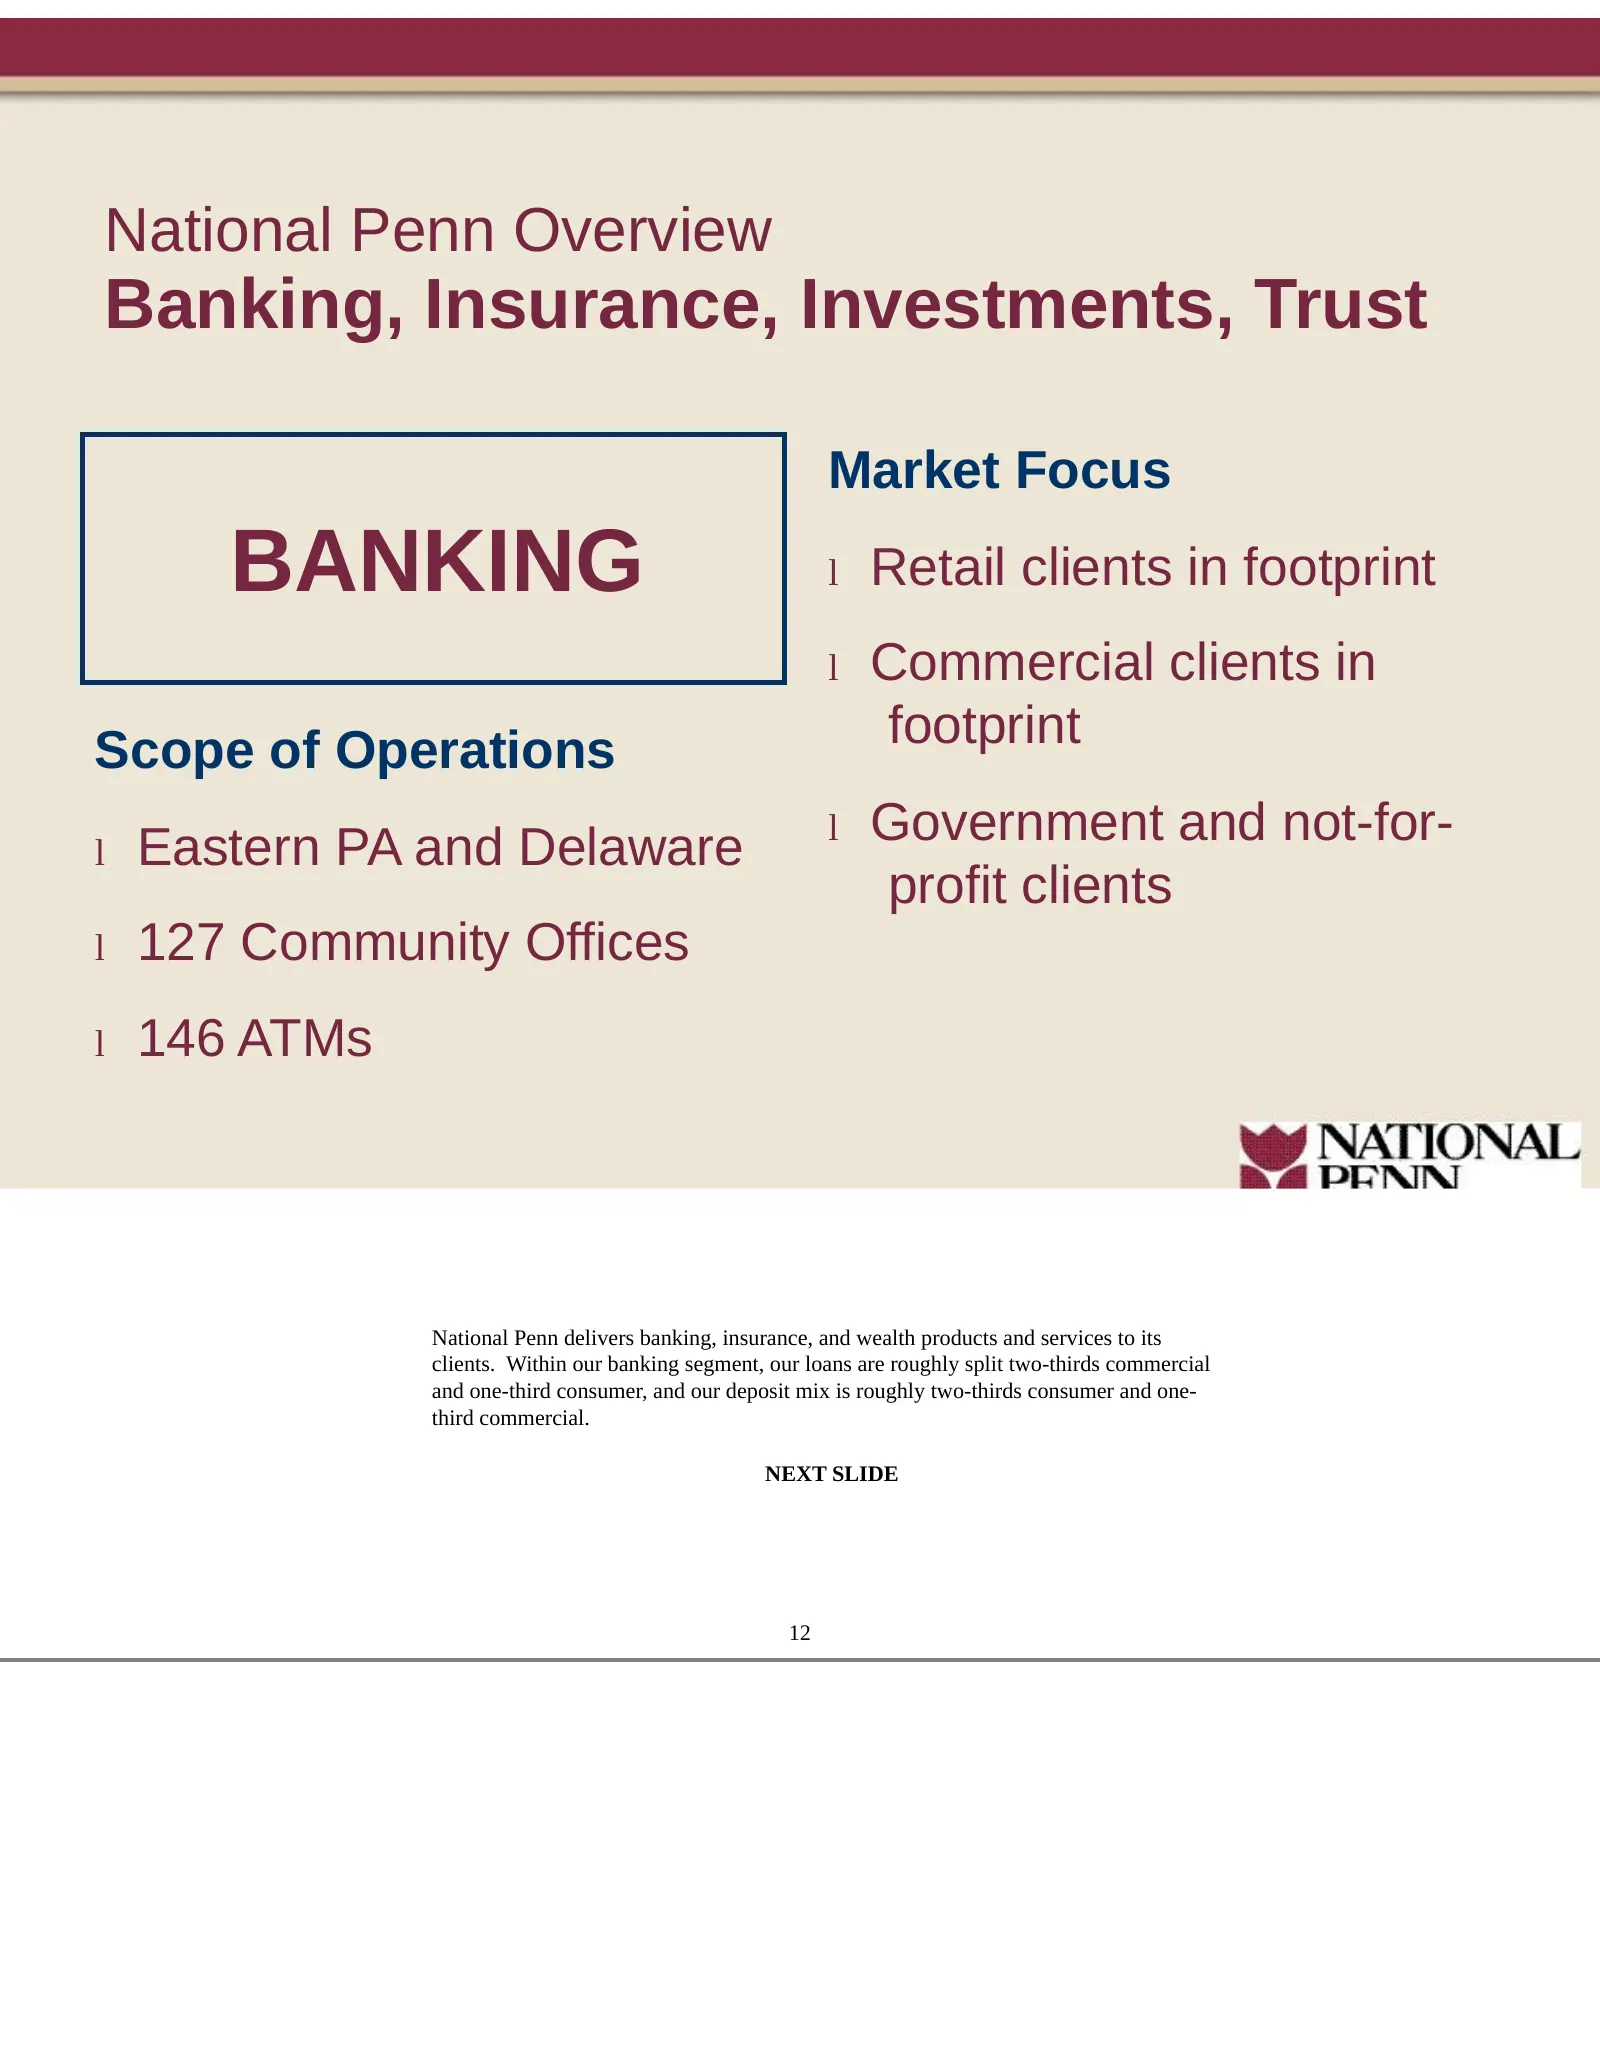
National Penn Overview Banking, Insurance, Investments, Trust Market Focus BANKING l Retail clients in footprint l Commercial clients in Scope of Operations footprint l Eastern PA and Delaware l Government and not-for- profit clients l 127 Community Offices l 146 ATMs National Penn delivers banking,
Slide 9: Insurance
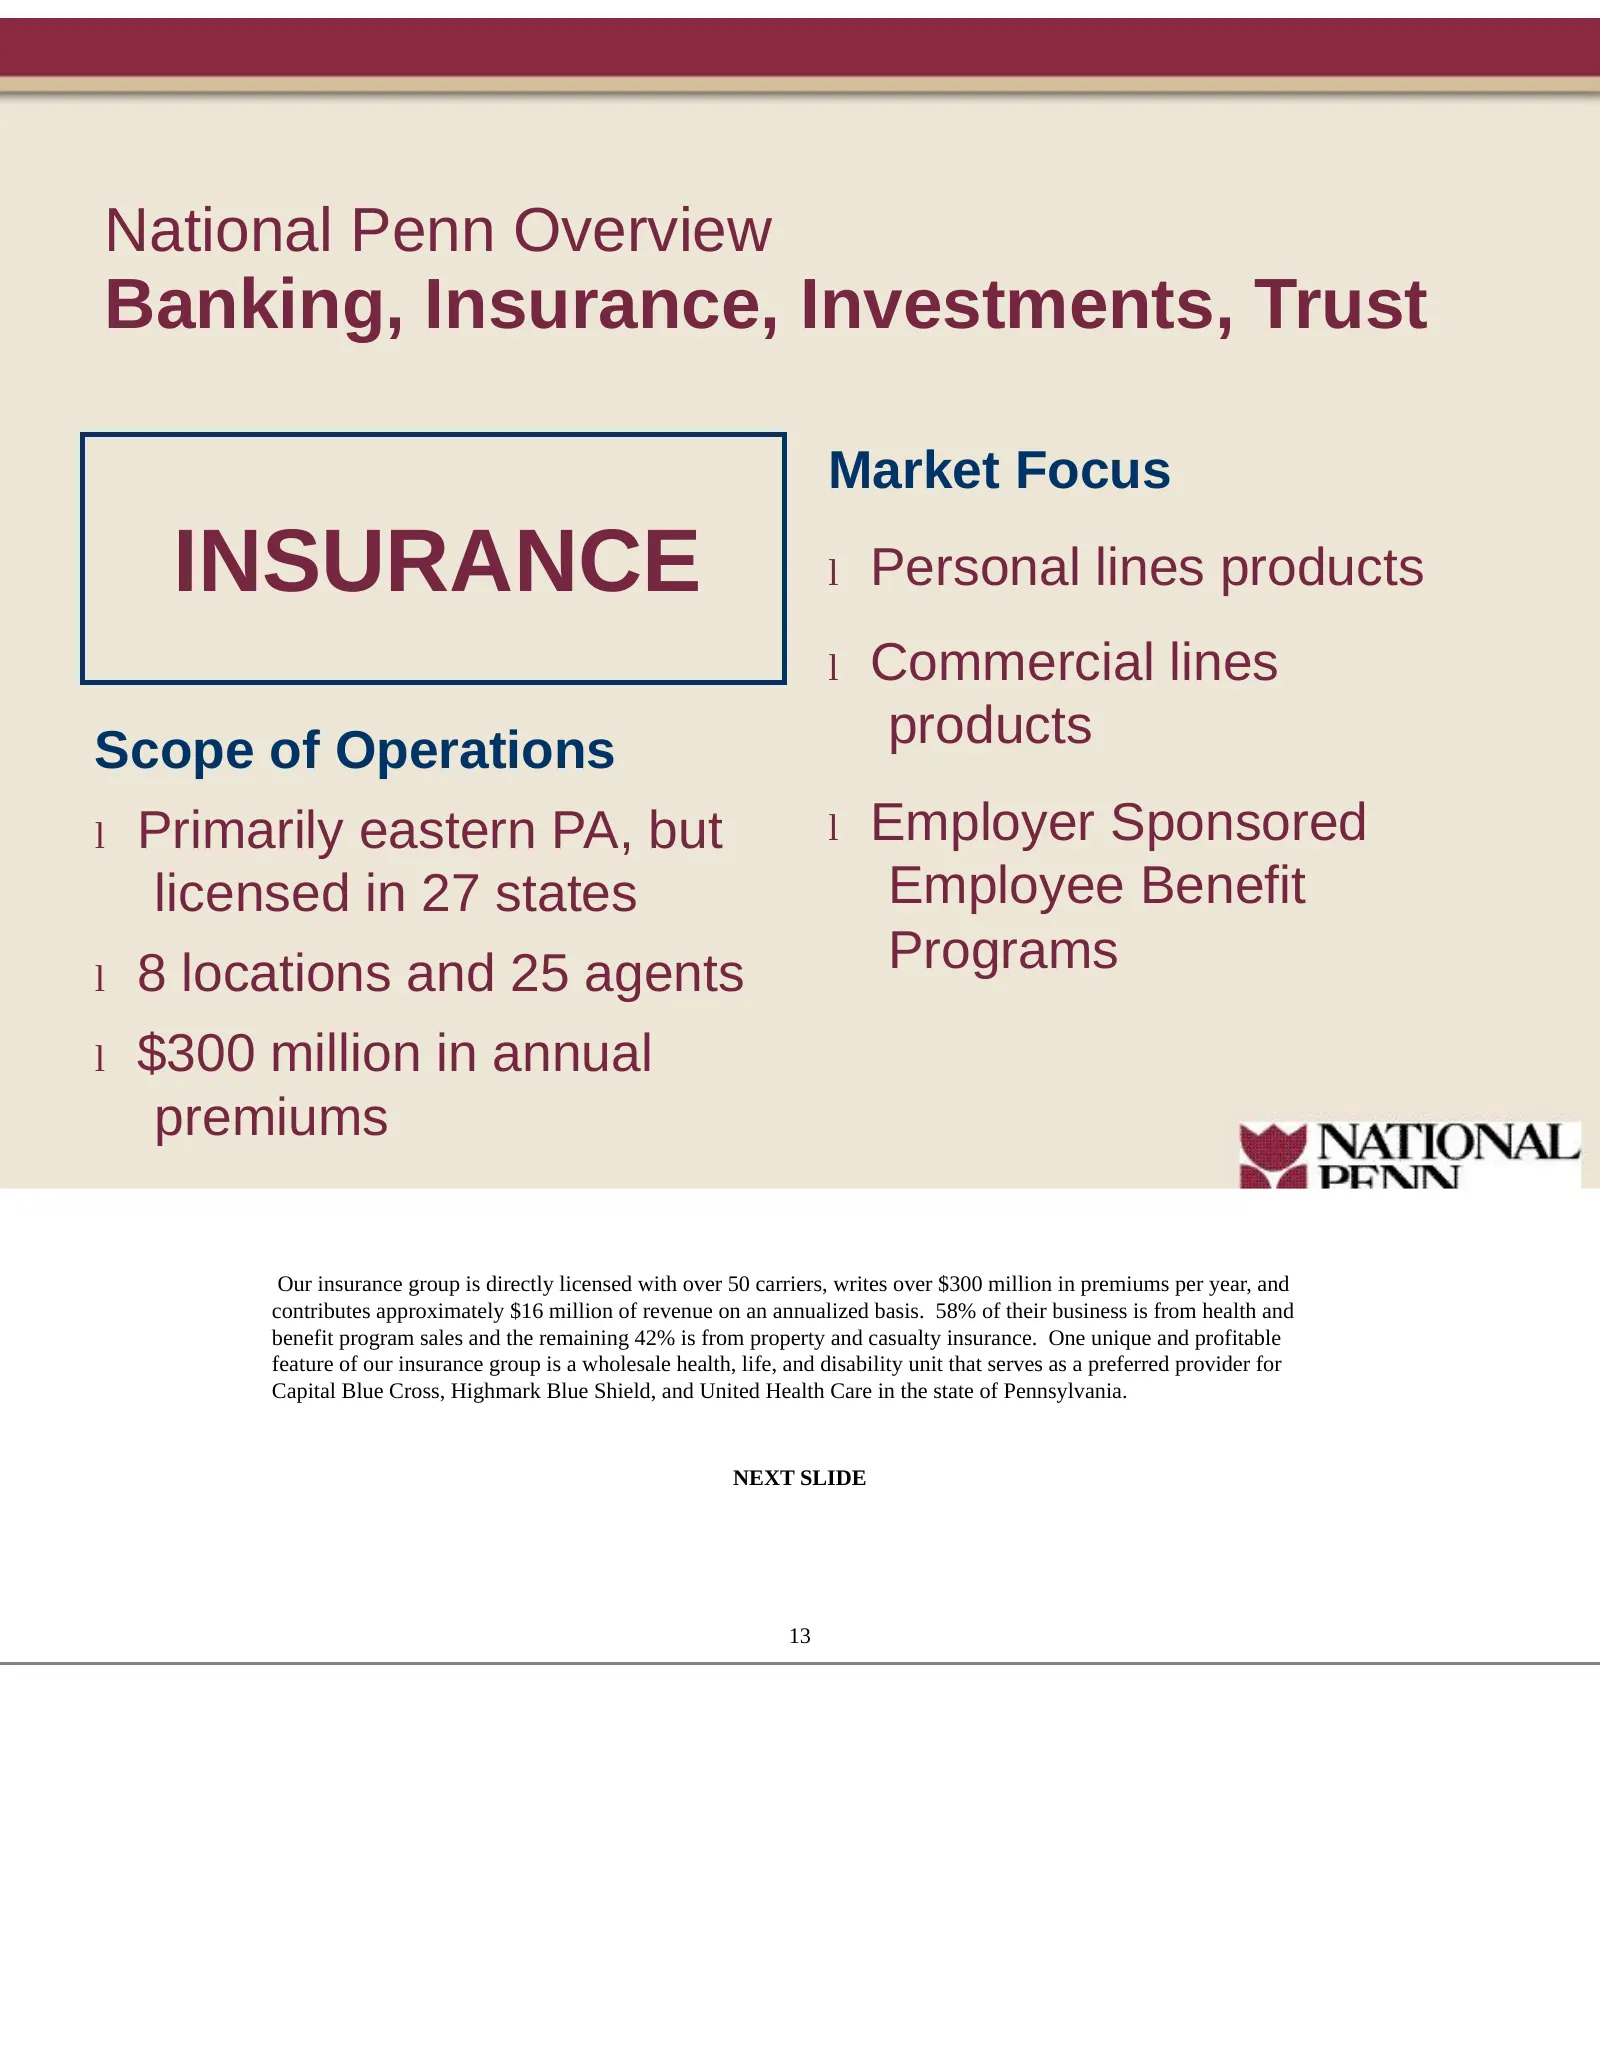
National Penn Overview Banking, Insurance, Investments, Trust Market Focus INSURANCE l Personal lines products l Commercial lines Scope of Operations products l Primarily eastern PA, but l Employer Sponsored licensed in 27 states Employee Benefit l 8 locations and 25 agents Programs l $300 million i
Slide 10: Wealth
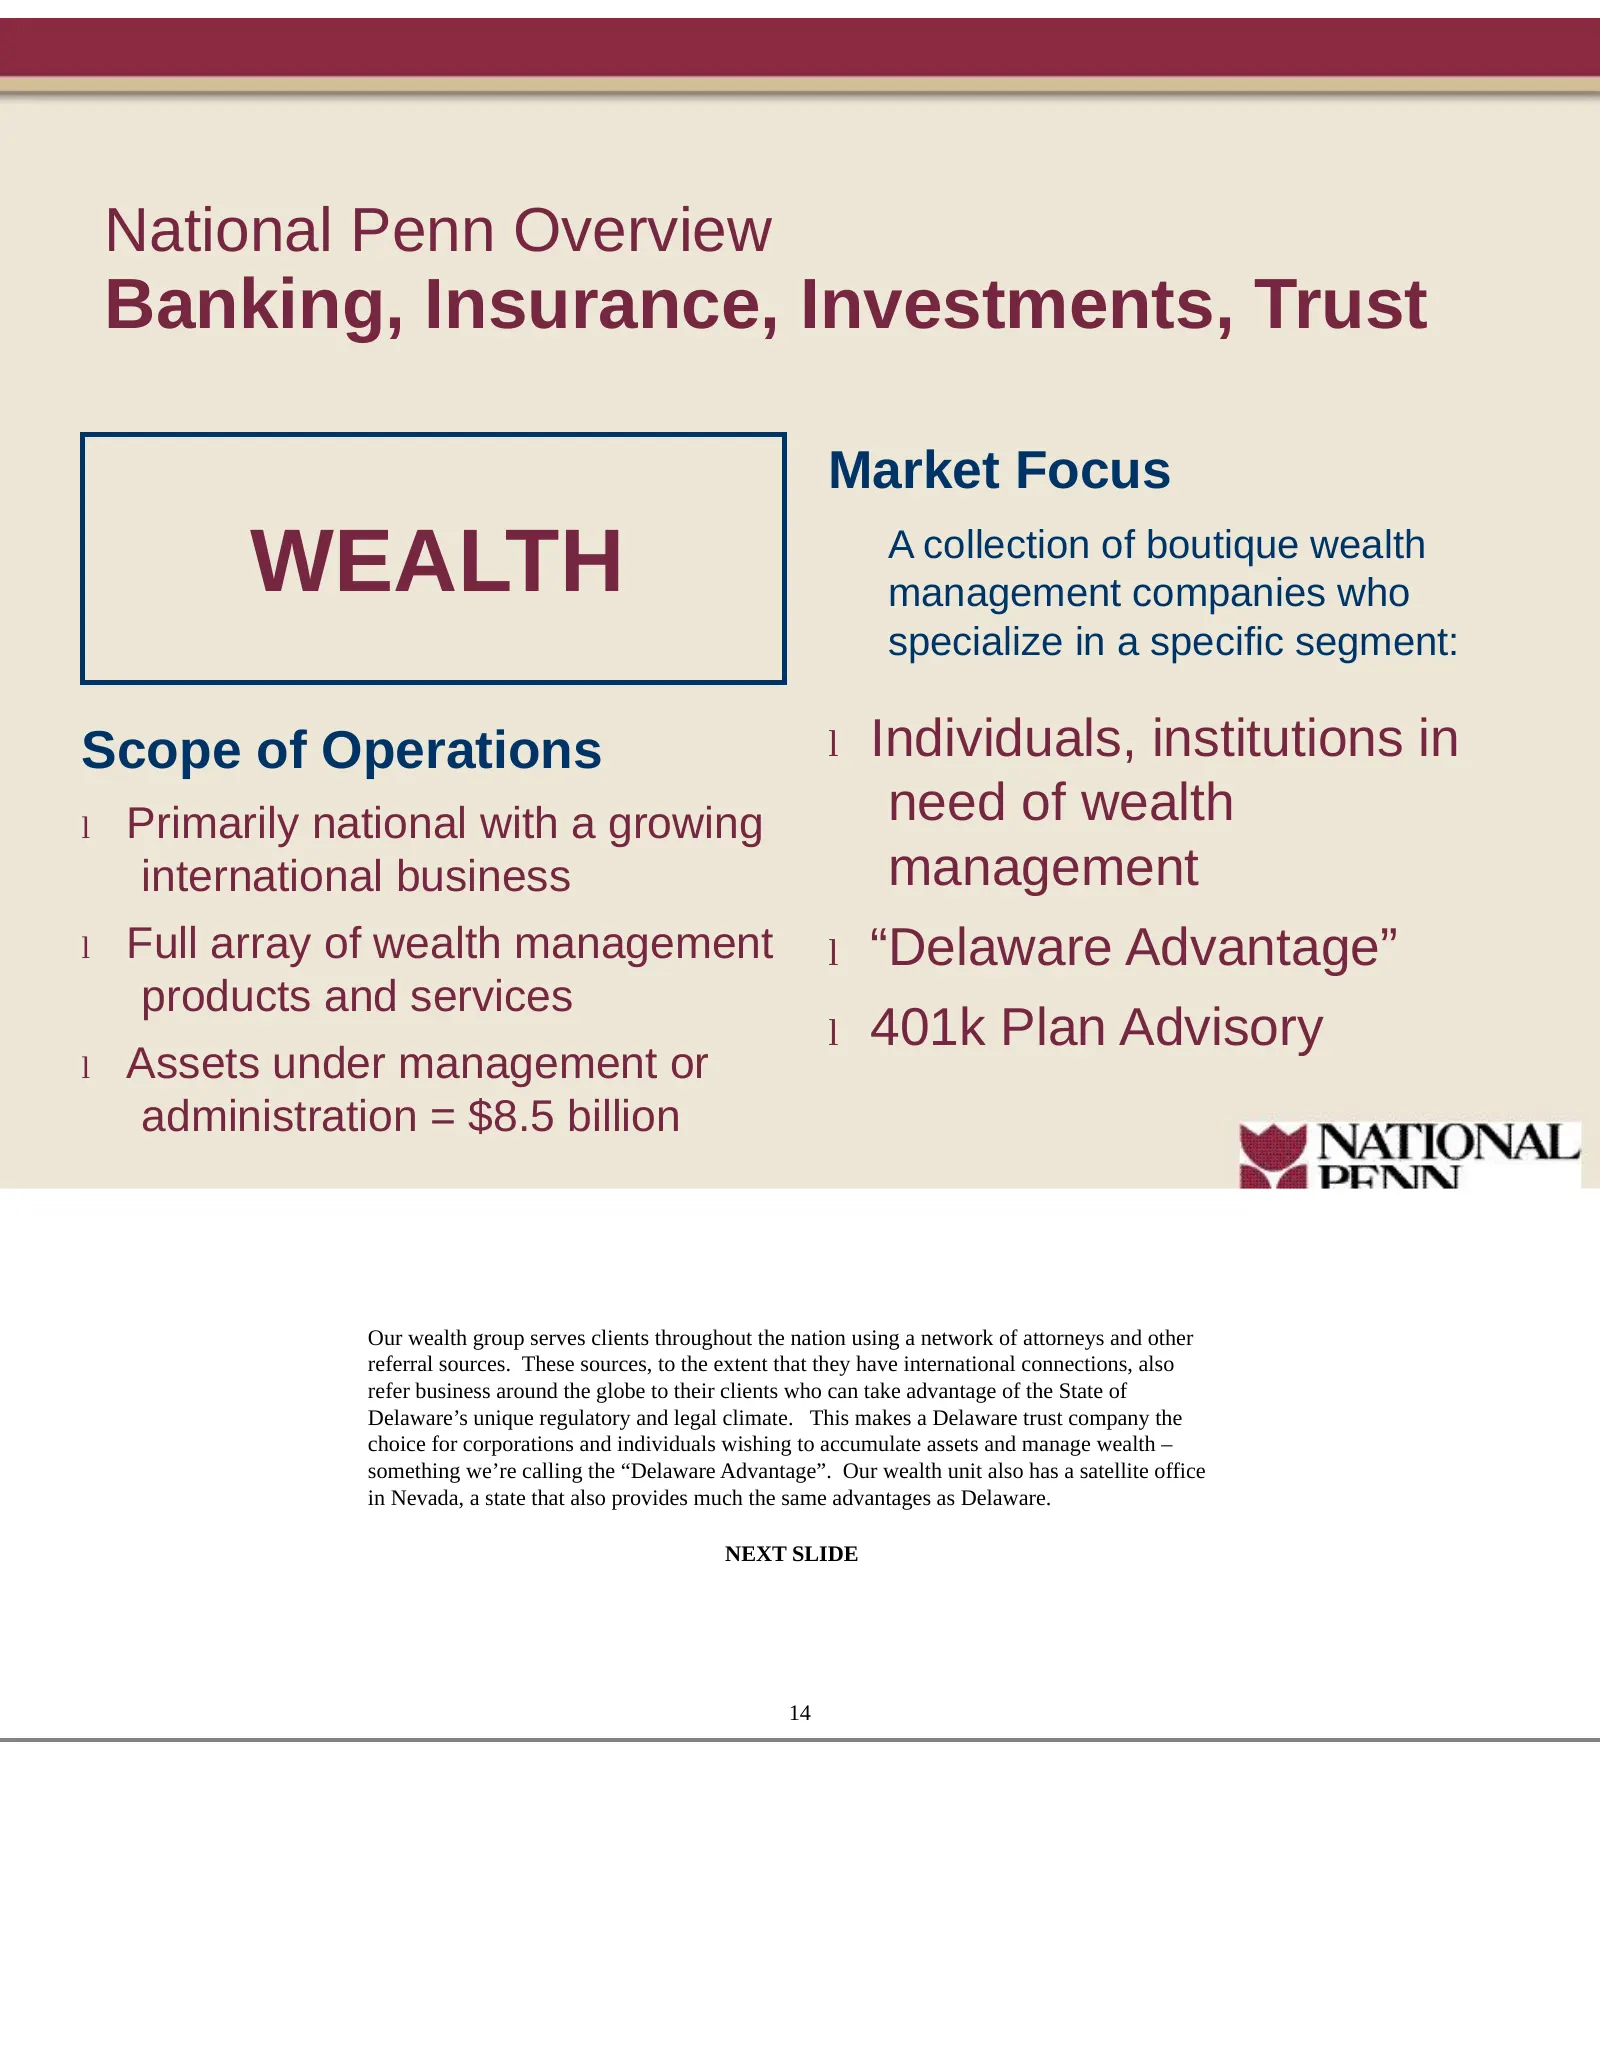
National Penn Overview Banking, Insurance, Investments, Trust Market Focus WEALTH A collection of boutique wealth management companies who specialize in a specific segment: Scope of Operations l Individuals, institutions in l Primarily national with a growing need of wealth international business ma
Slide 11: Loan and Deposit Growth
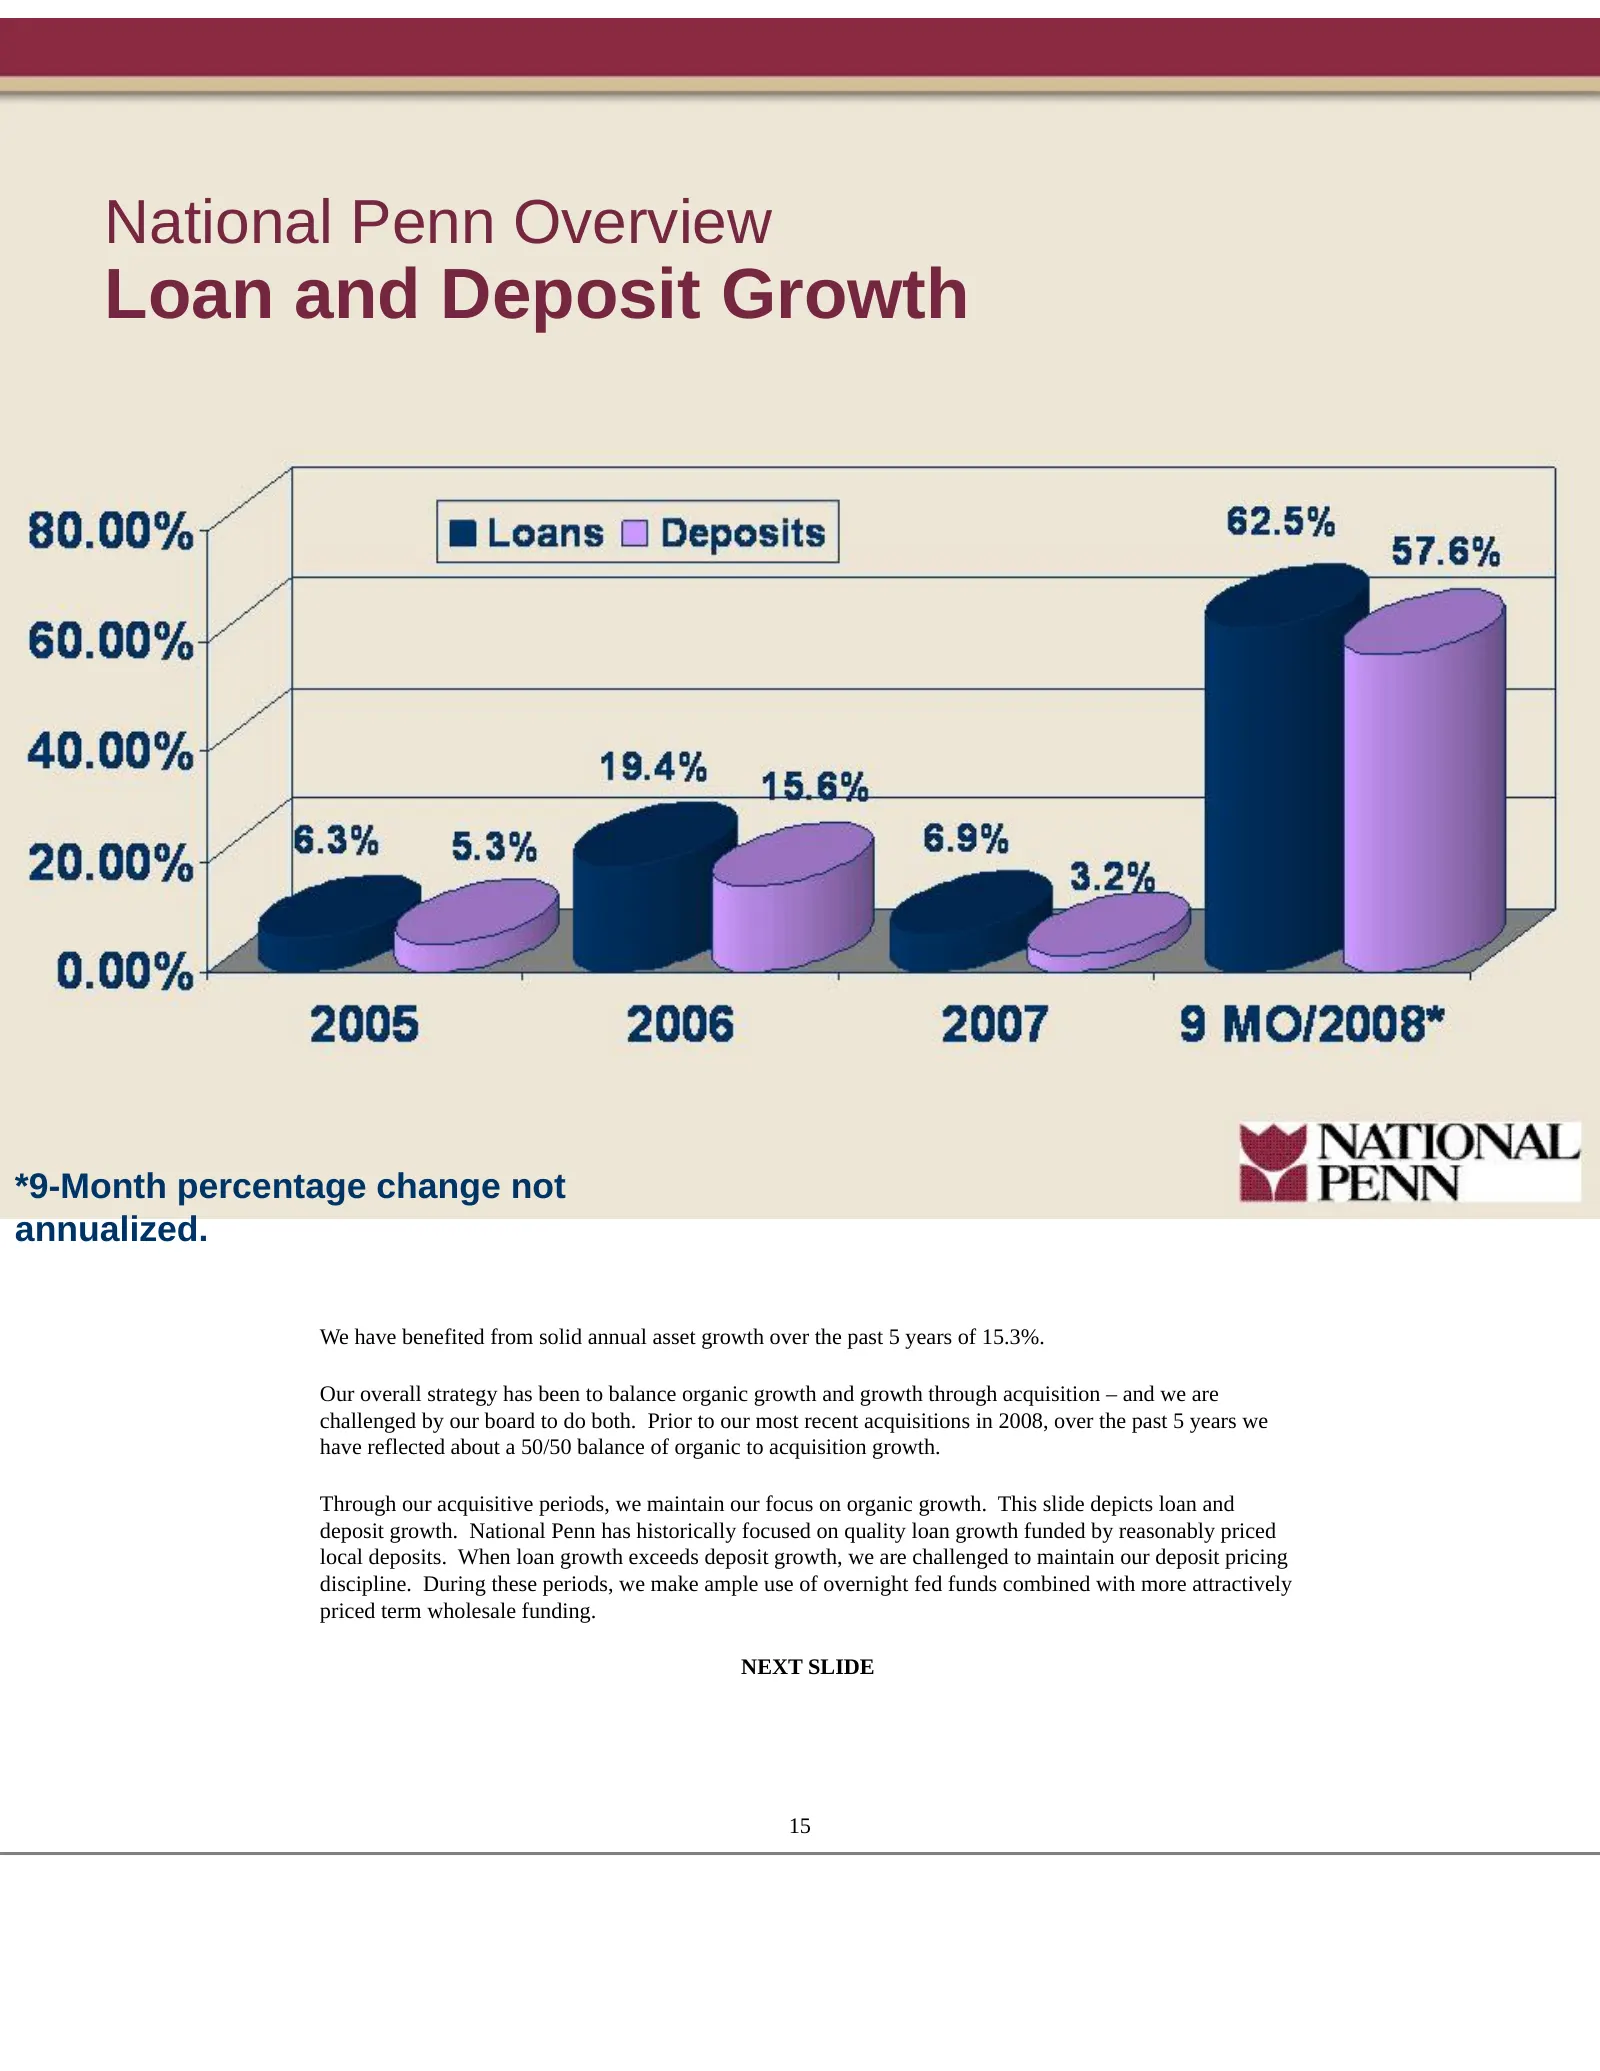
National Penn Overview Loan and Deposit Growth *9-Month percentage change not annualized. We have benefited from solid annual asset growth over the past 5 years of 15.3%. Our overall strategy has been to balance organic growth and growth through acquisition – and we are challenged by our board to do
Slide 12: Strong Market Share in Core Counties
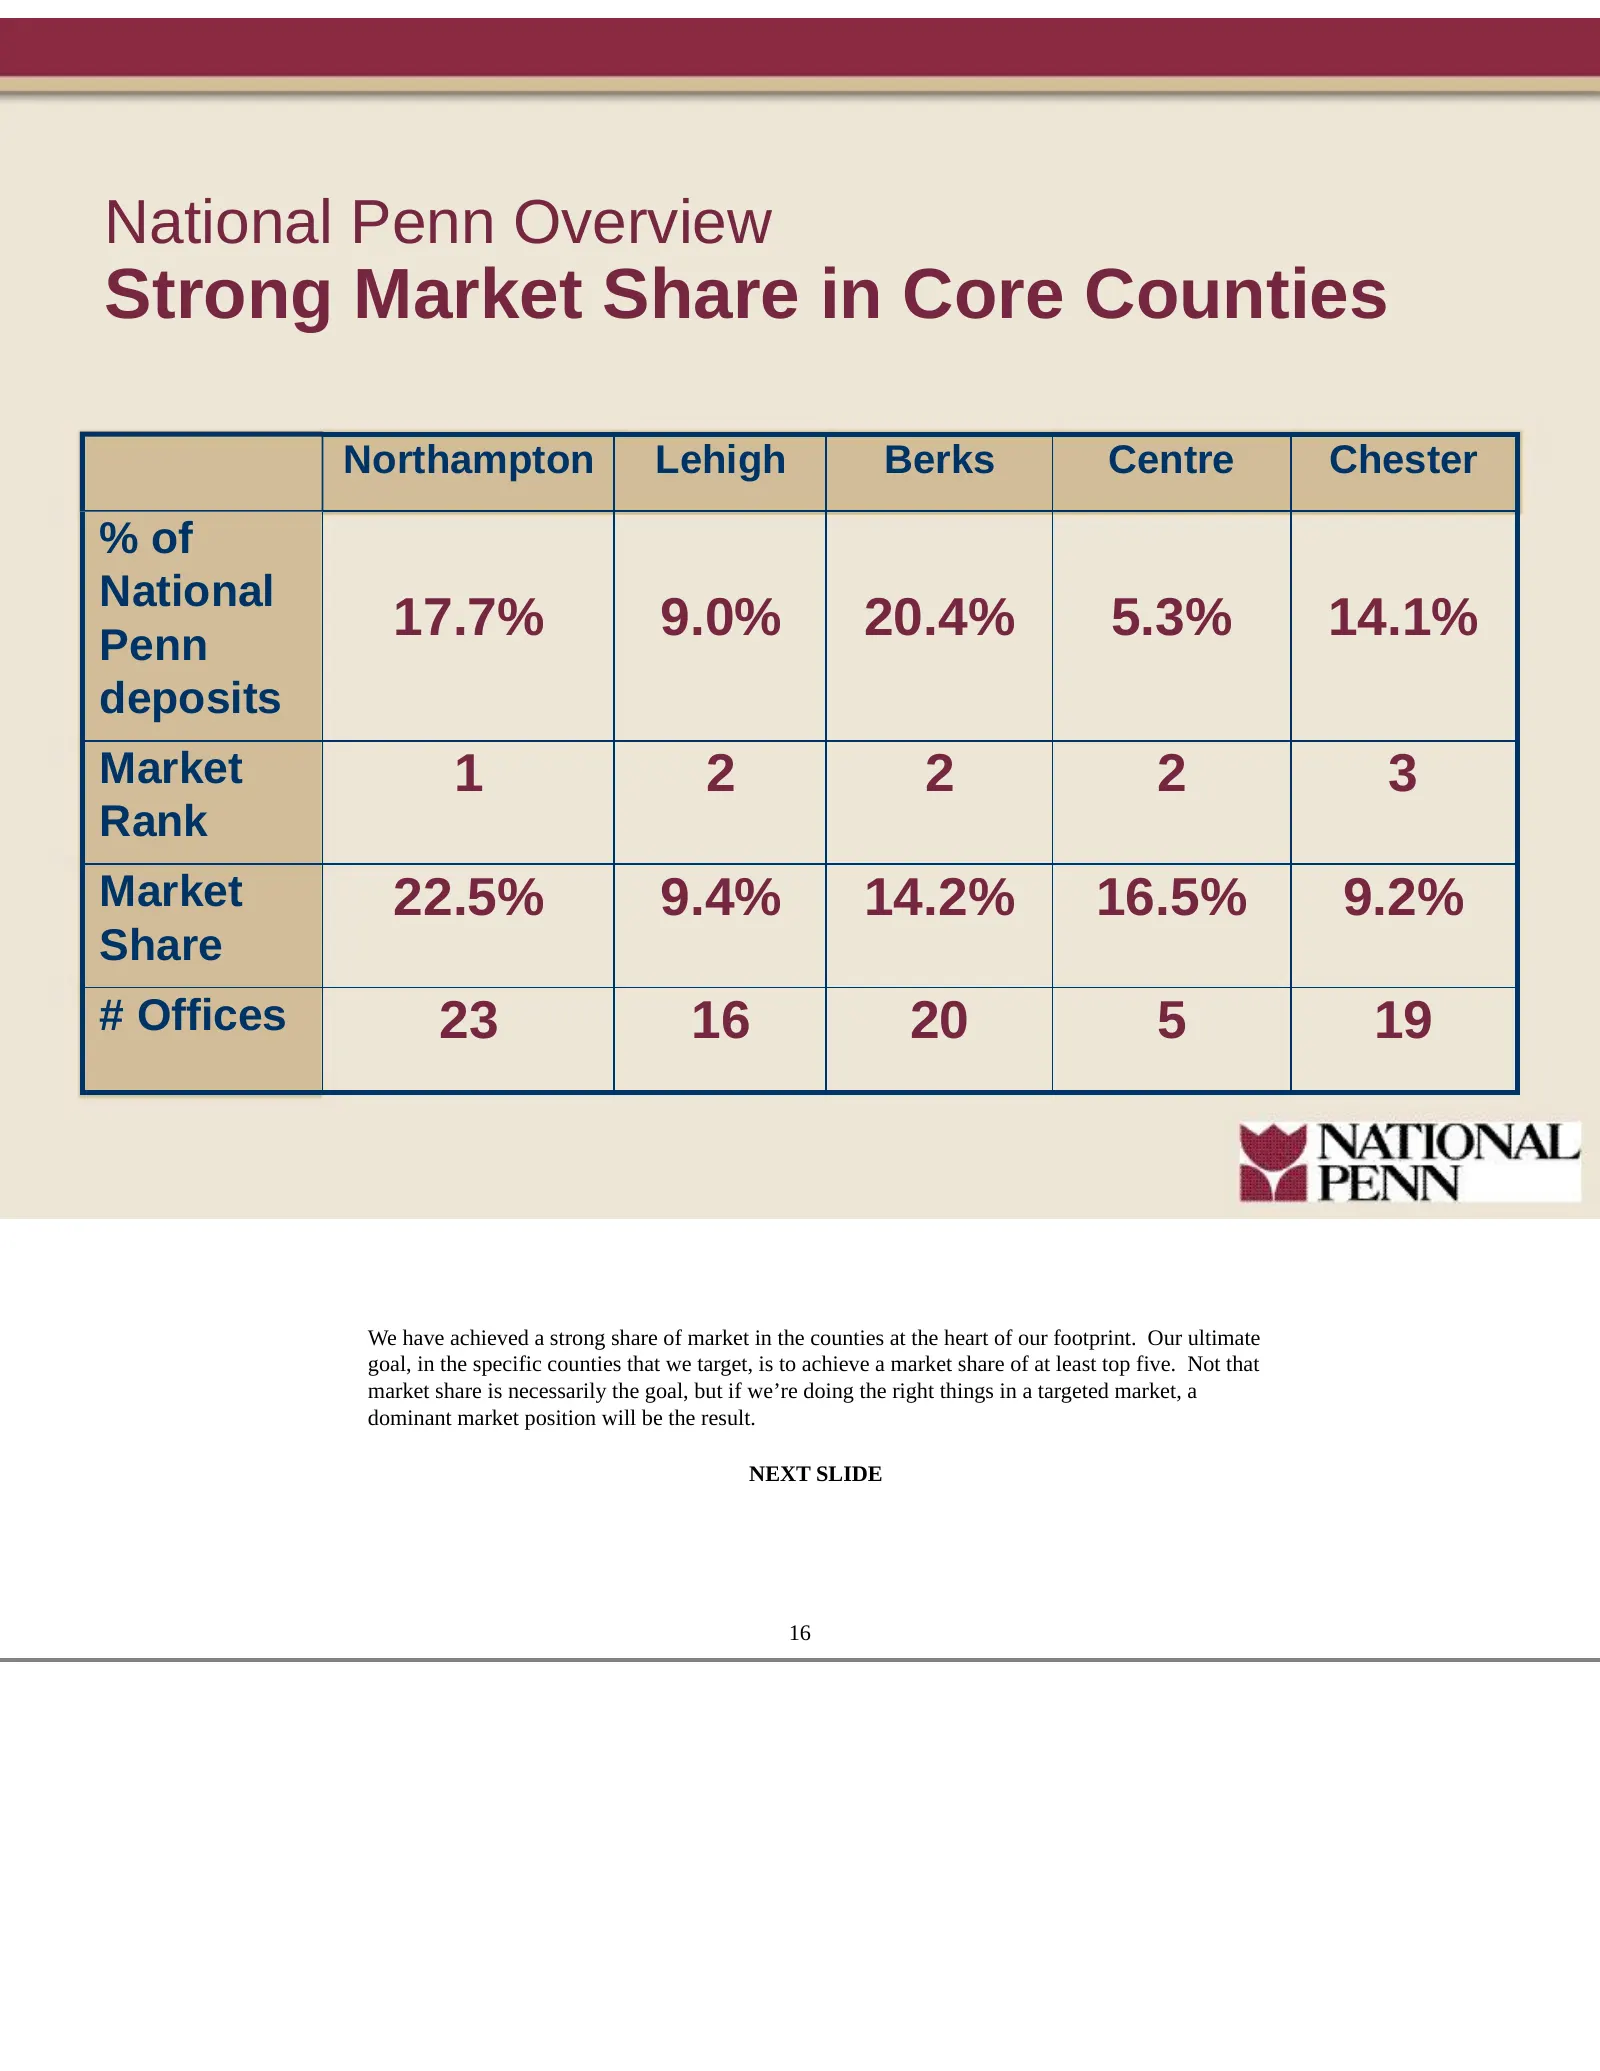
National Penn Overview Strong Market Share in Core Counties Northampton Lehigh Berks Centre Chester % of National Penn 17.7% 9.0% 20.4% 5.3% 14.1% deposits Market 1 2 2 2 3 Rank Market 22.5% 9.4% 14.2% 16.5% 9.2% Share # Offices 23 16 20 5 19 We have achieved a strong share of market in the counties
Slide 13: Total Revenues by Source, Nine Months Ended September 30, 2008
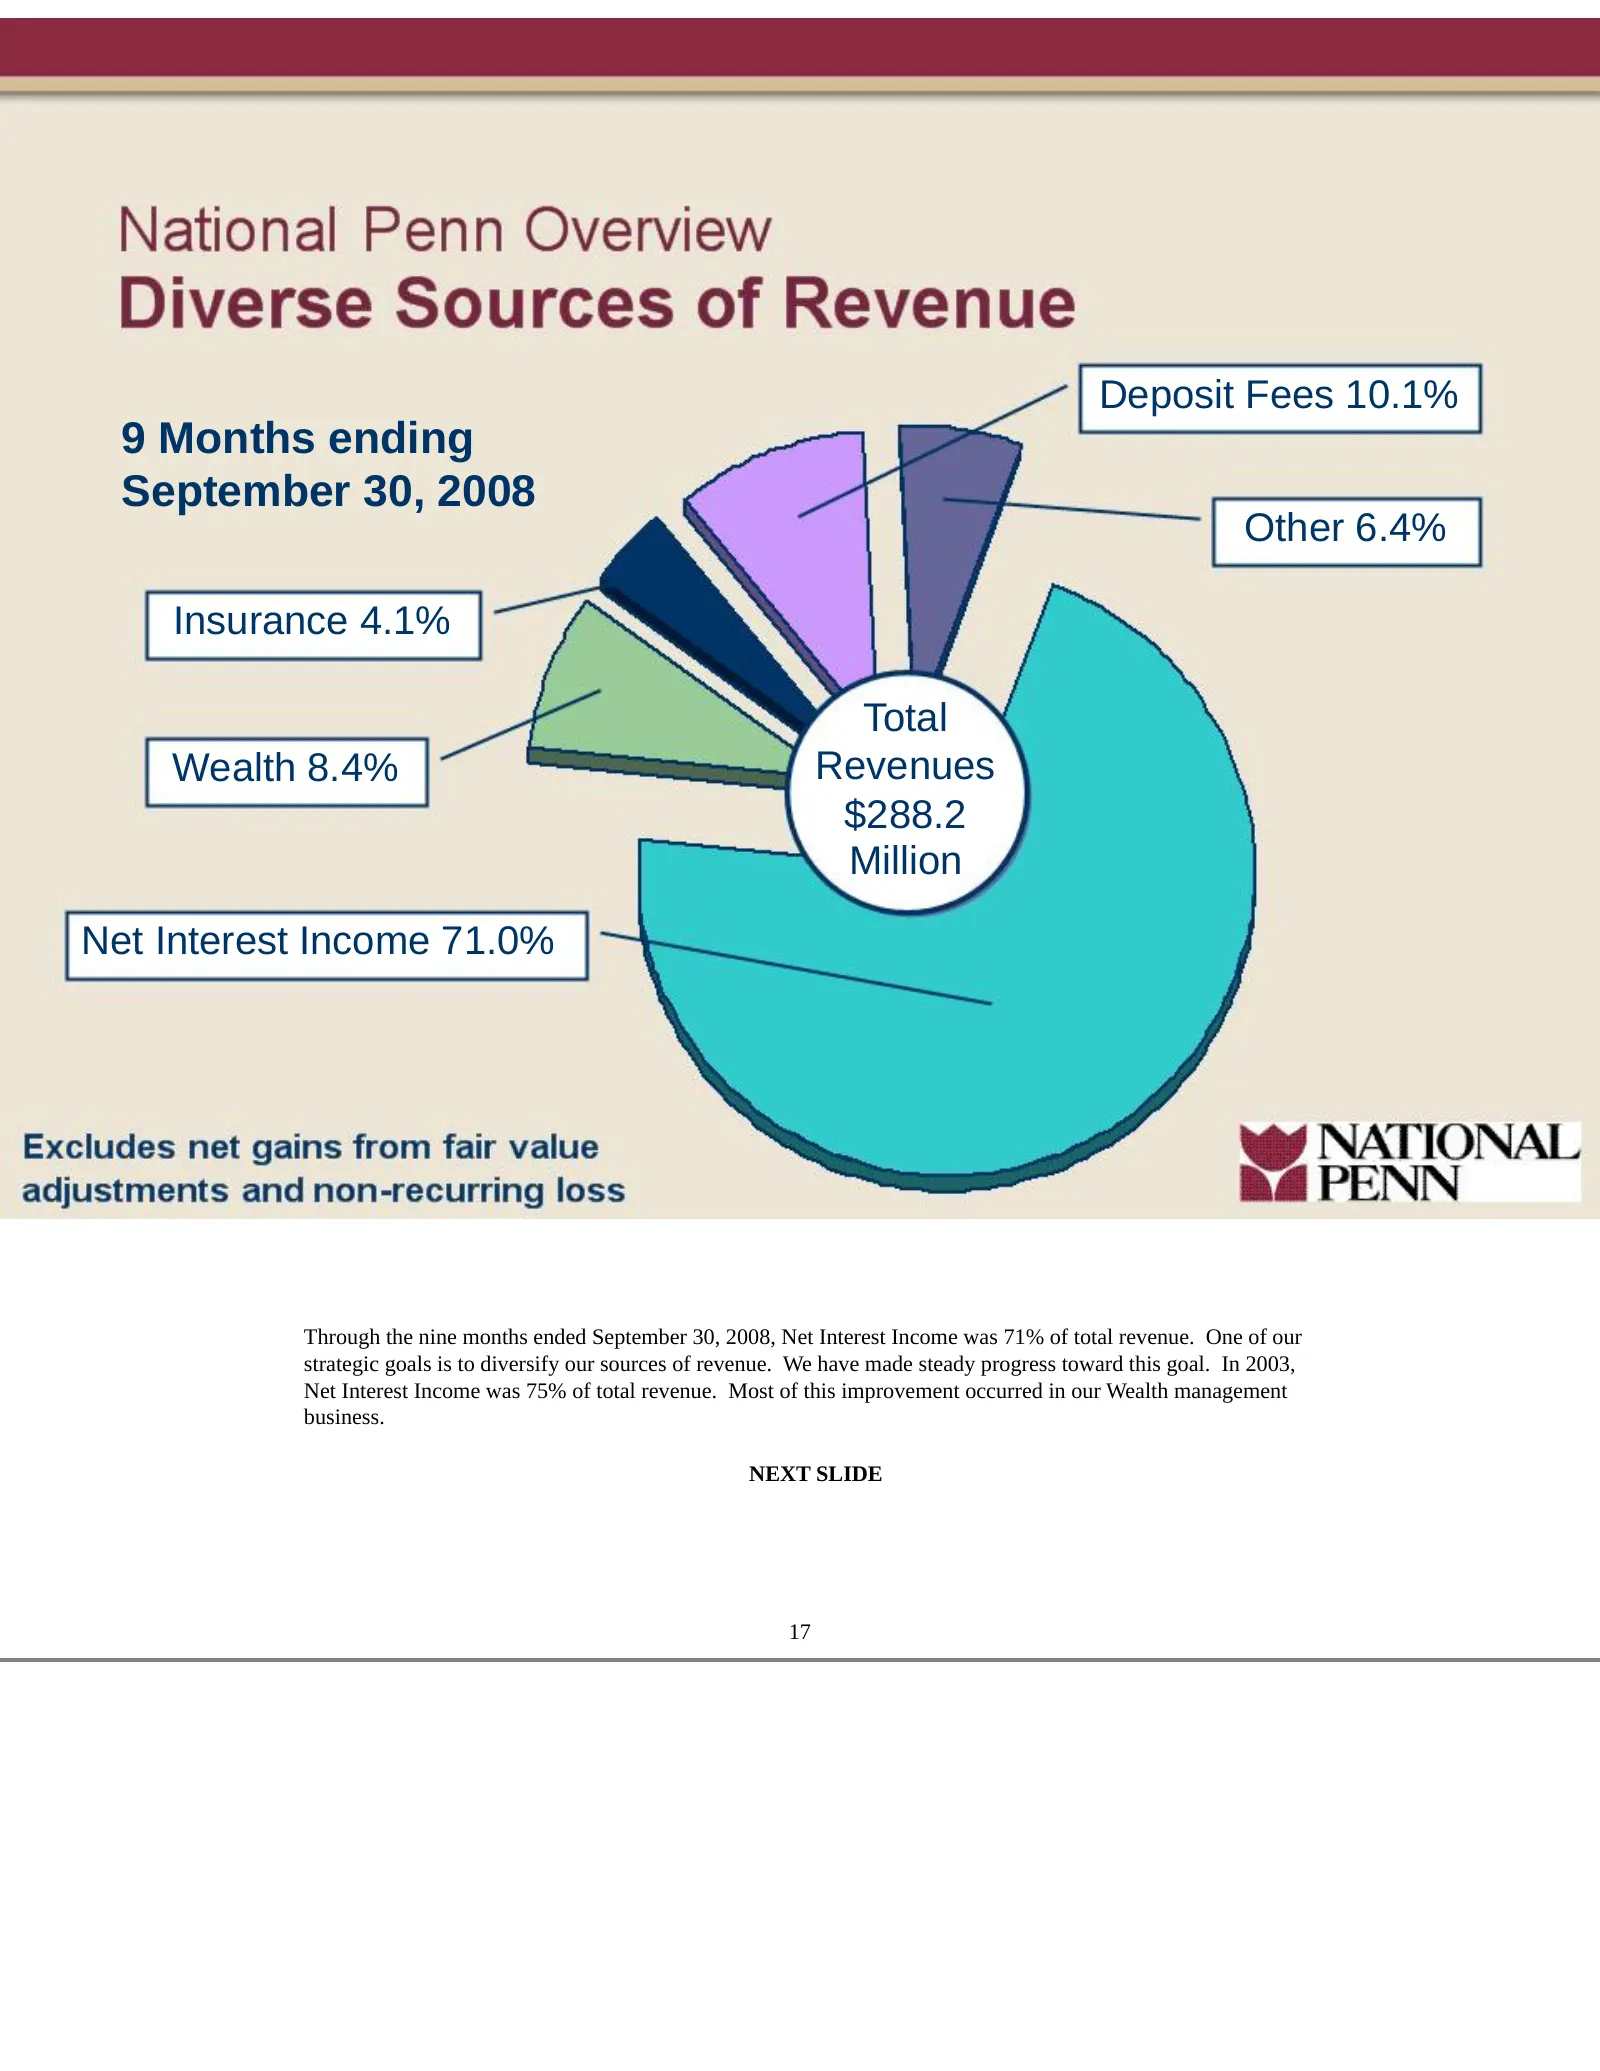
Deposit Fees 10.1% 9 Months ending September 30, 2008 Other 6.4% Insurance 4.1% Total Wealth 8.4% Revenues $288.2 Million Net Interest Income 71.0% Through the nine months ended September 30, 2008, Net Interest Income was 71% of total revenue. One of our strategic goals is to diversify our sources o
Slide 14: Total Revenue - Quarterly Growth
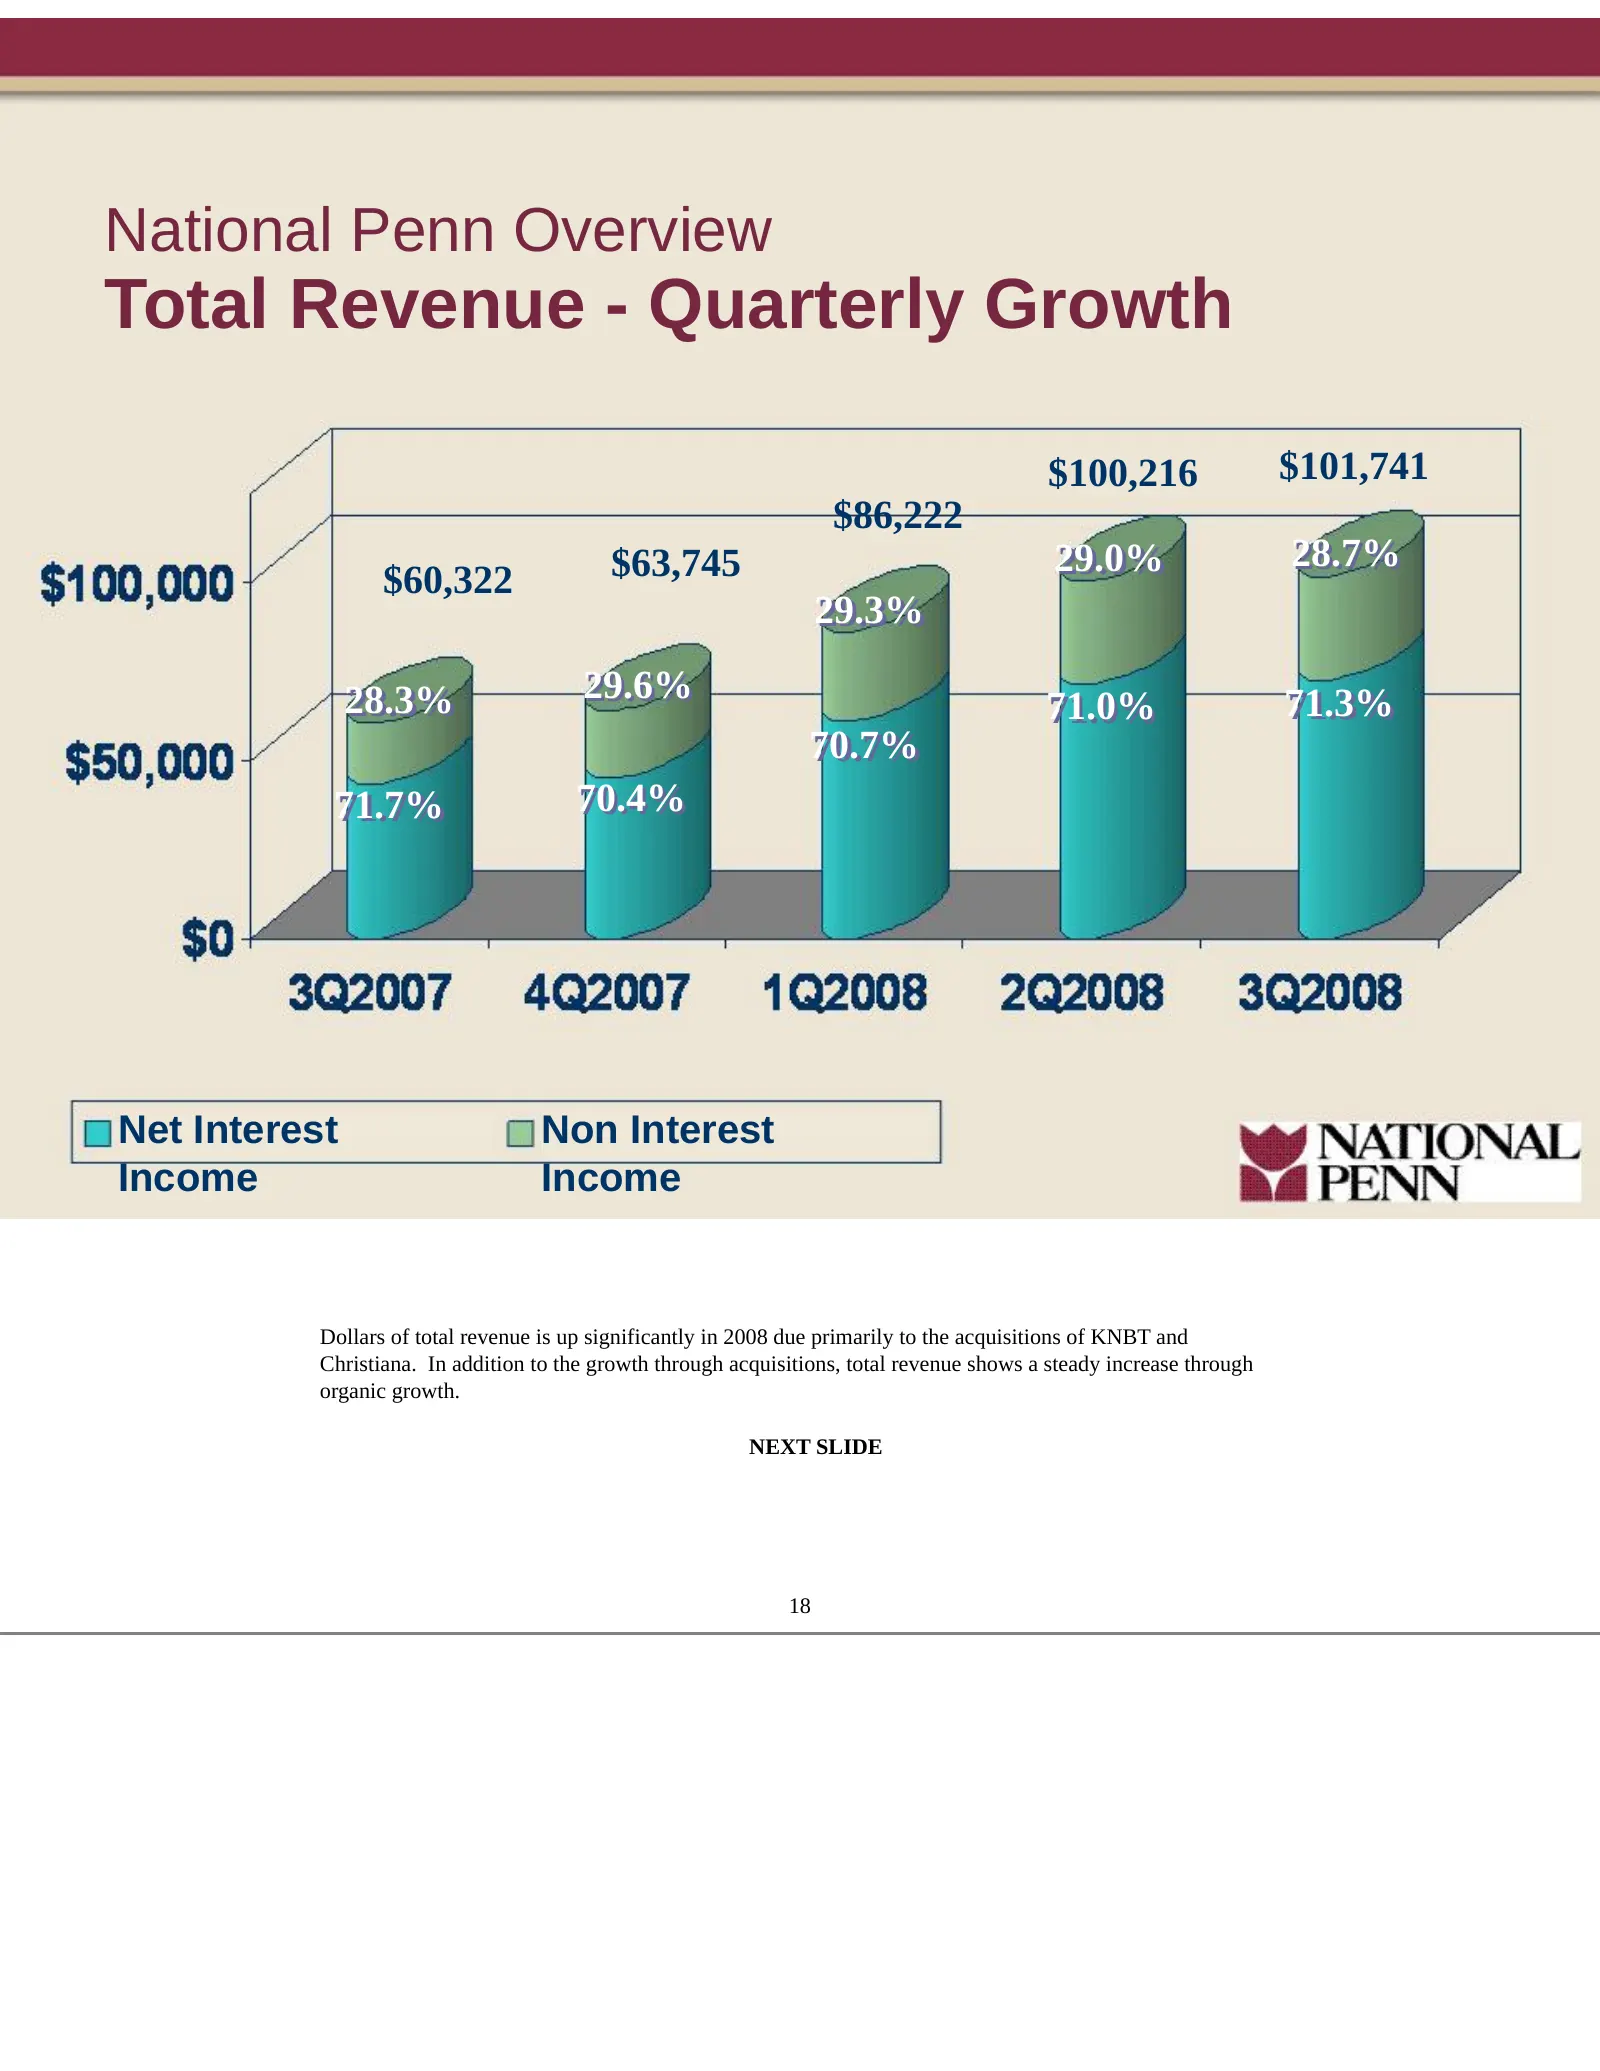
National Penn Overview Total Revenue - Quarterly Growth $100,216 $101,741 $86,222 $63,745 29.0% 28.7% $60,322 29.3% 28.3% 29.6% 71.3% 71.0% 70.7% 71.7% 70.4% Net Interest Non Interest Income Income Dollars of total revenue is up significantly in 2008 due primarily to the acquisitions of KNBT and Chr
Slide 15: Focus on Cost Control
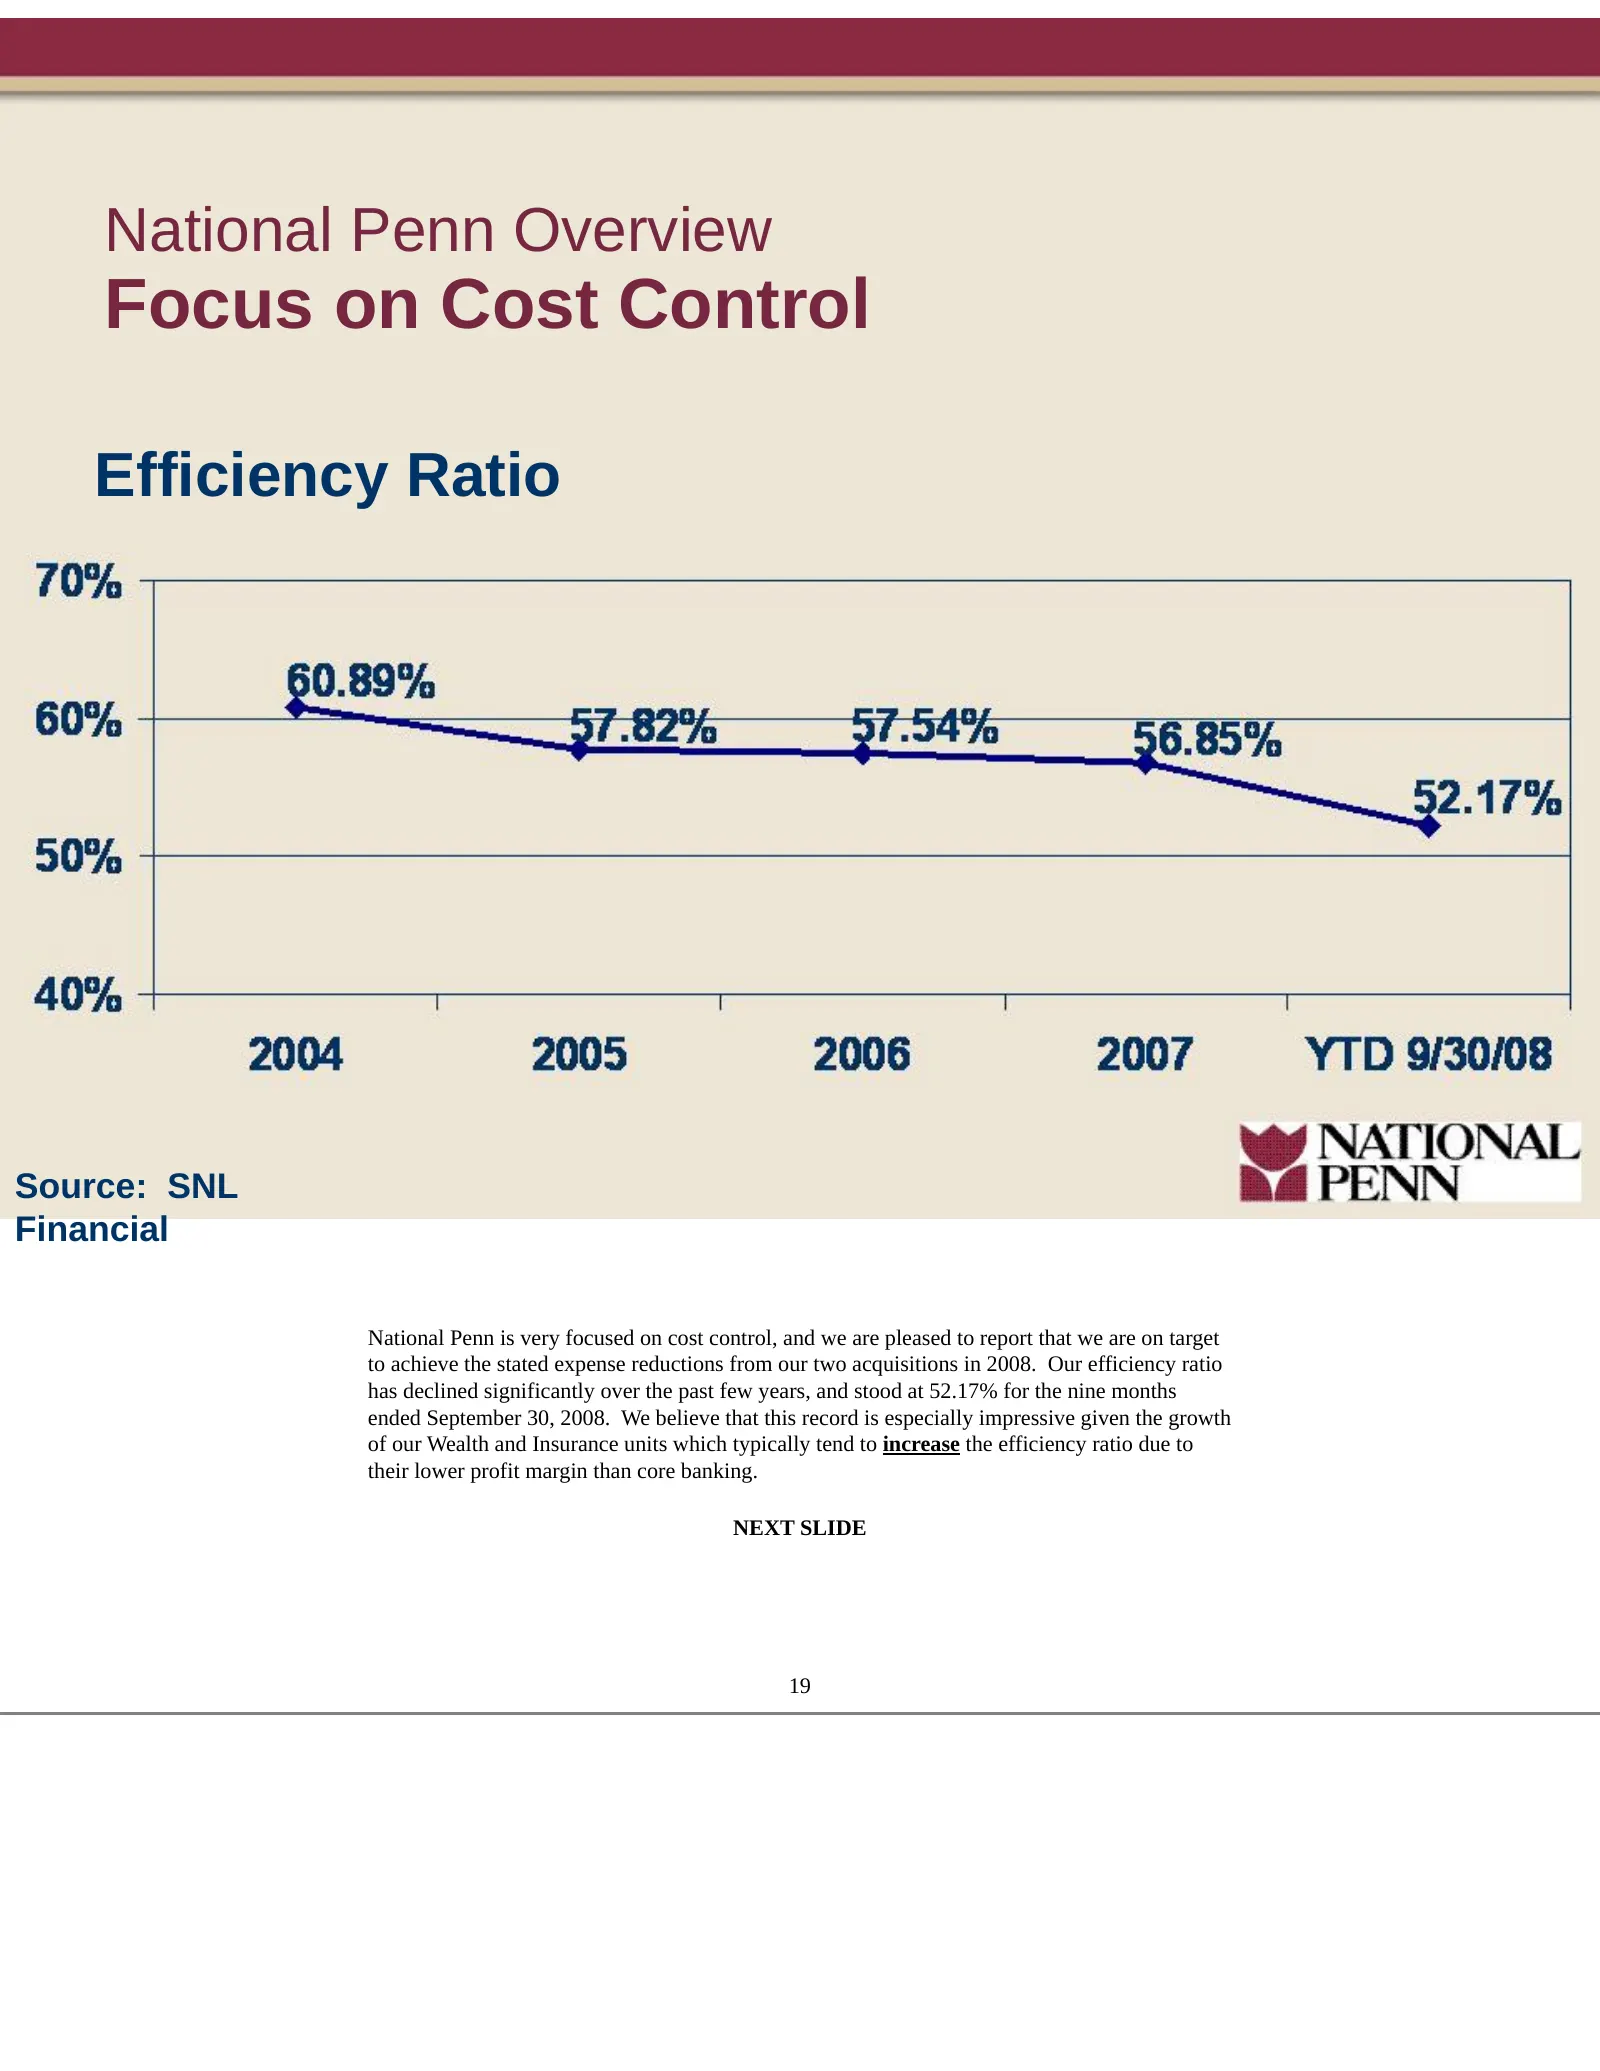
National Penn Overview Focus on Cost Control Efficiency Ratio Source: SNL Financial National Penn is very focused on cost control, and we are pleased to report that we are on target to achieve the stated expense reductions from our two acquisitions in 2008. Our efficiency ratio has declined signific
Slide 16: Consistent Business Strategies
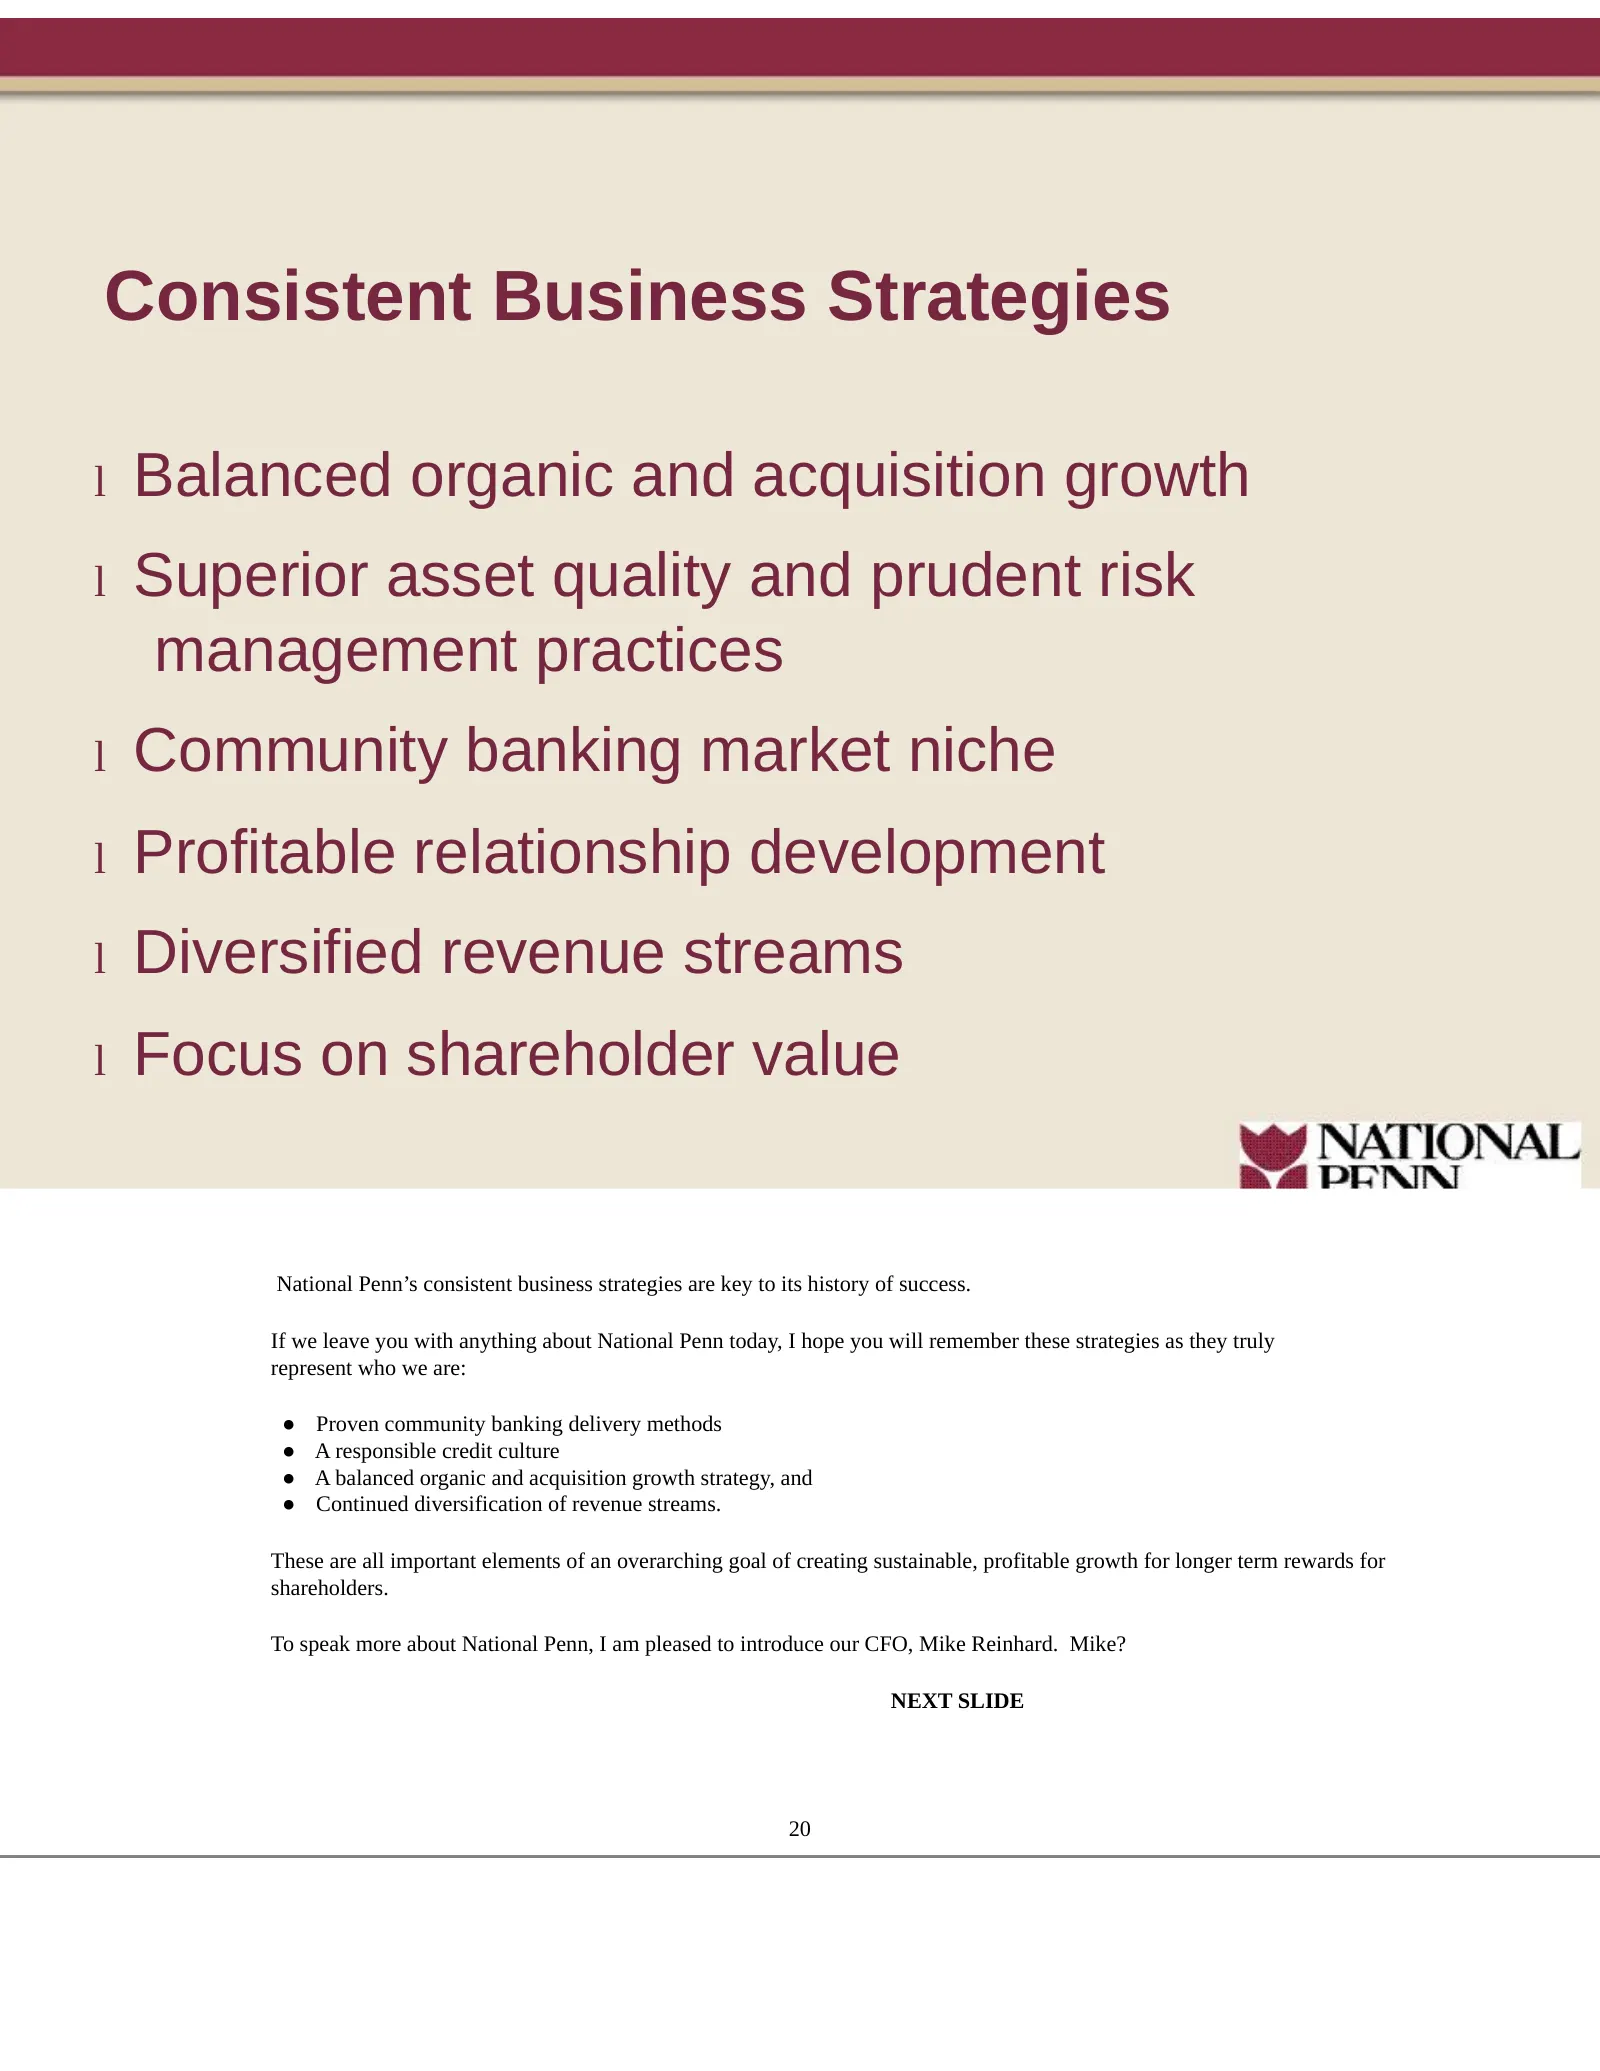
Consistent Business Strategies l Balanced organic and acquisition growth l Superior asset quality and prudent risk management practices l Community banking market niche l Profitable relationship development l Diversified revenue streams l Focus on shareholder value National Penn’s consistent busines
Slide 17: National Penn’s Focus
National Penn’s Focus l Capital Management l Liquidity Management l Credit Quality Management Thank-you Glenn. National Penn has a long history of consistent earnings growth with solid credit quality. This has been our primary focus. Our earnings growth strategy has included leveraging capital and l
Slide 18: Capital Management
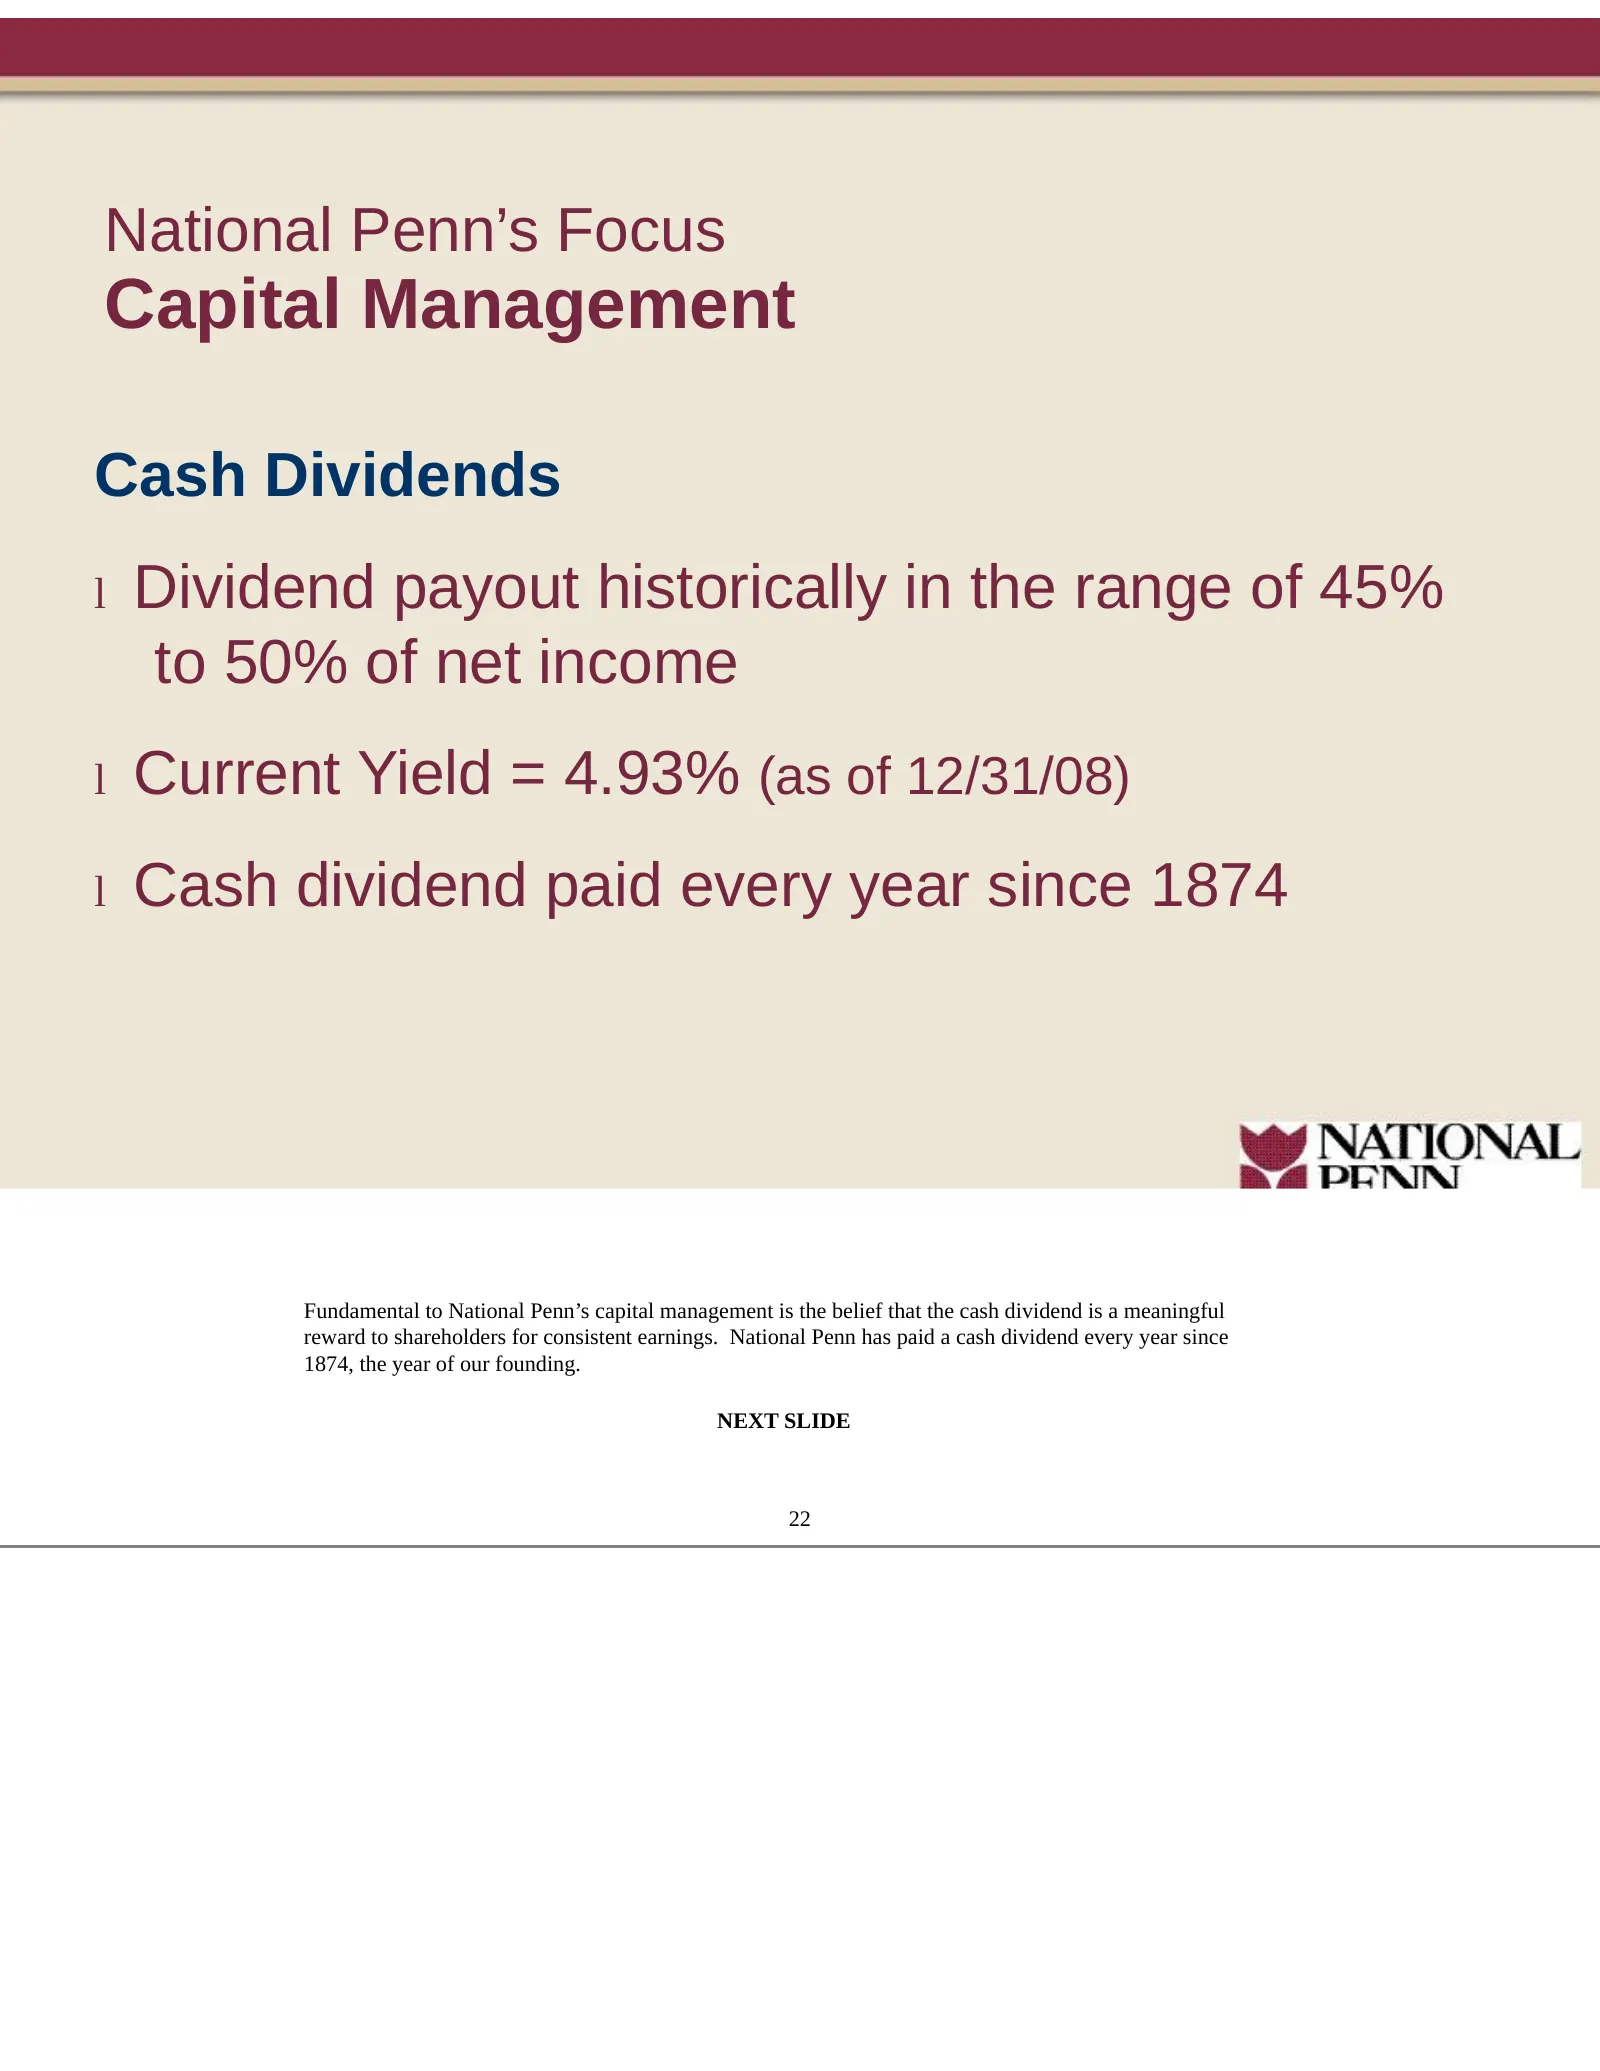
National Penn’s Focus Capital Management Cash Dividends l Dividend payout historically in the range of 45% to 50% of net income l Current Yield = 4.93% (as of 12/31/08) l Cash dividend paid every year since 1874 Fundamental to National Penn’s capital management is the belief that the cash dividend i
Slide 19: Capital Management
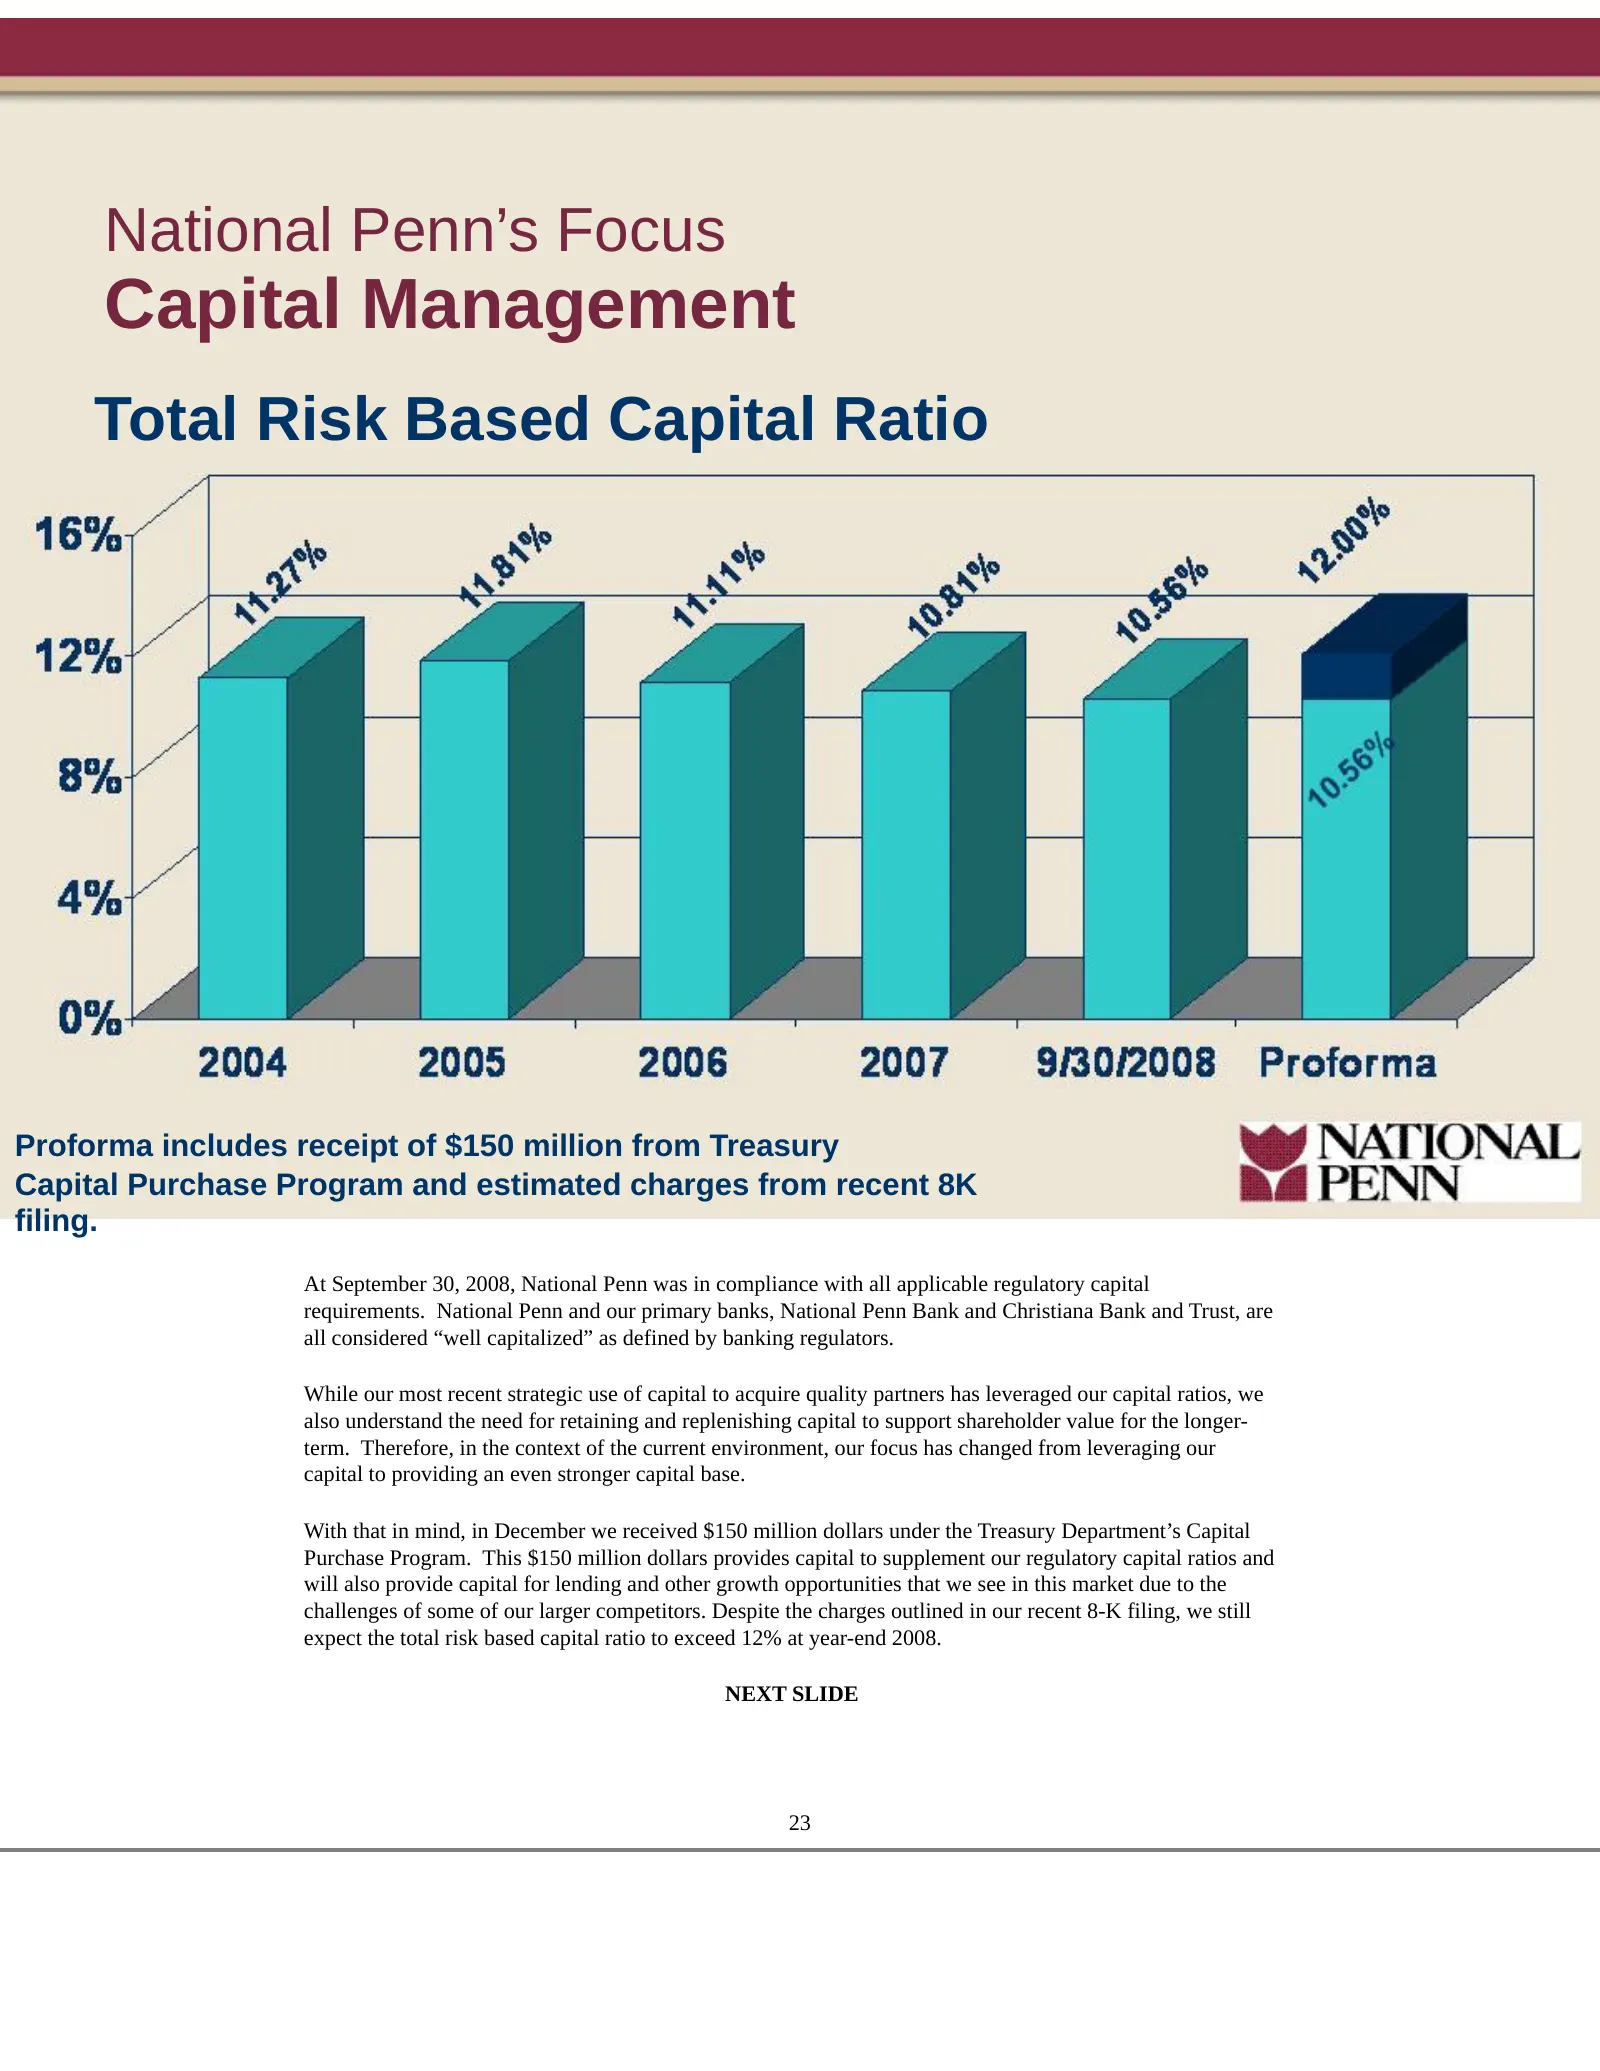
National Penn’s Focus Capital Management Total Risk Based Capital Ratio Proforma includes receipt of $150 million from Treasury Capital Purchase Program and estimated charges from recent 8K filing. At September 30, 2008, National Penn was in compliance with all applicable regulatory capital requirem
Slide 20: Liquidity Management
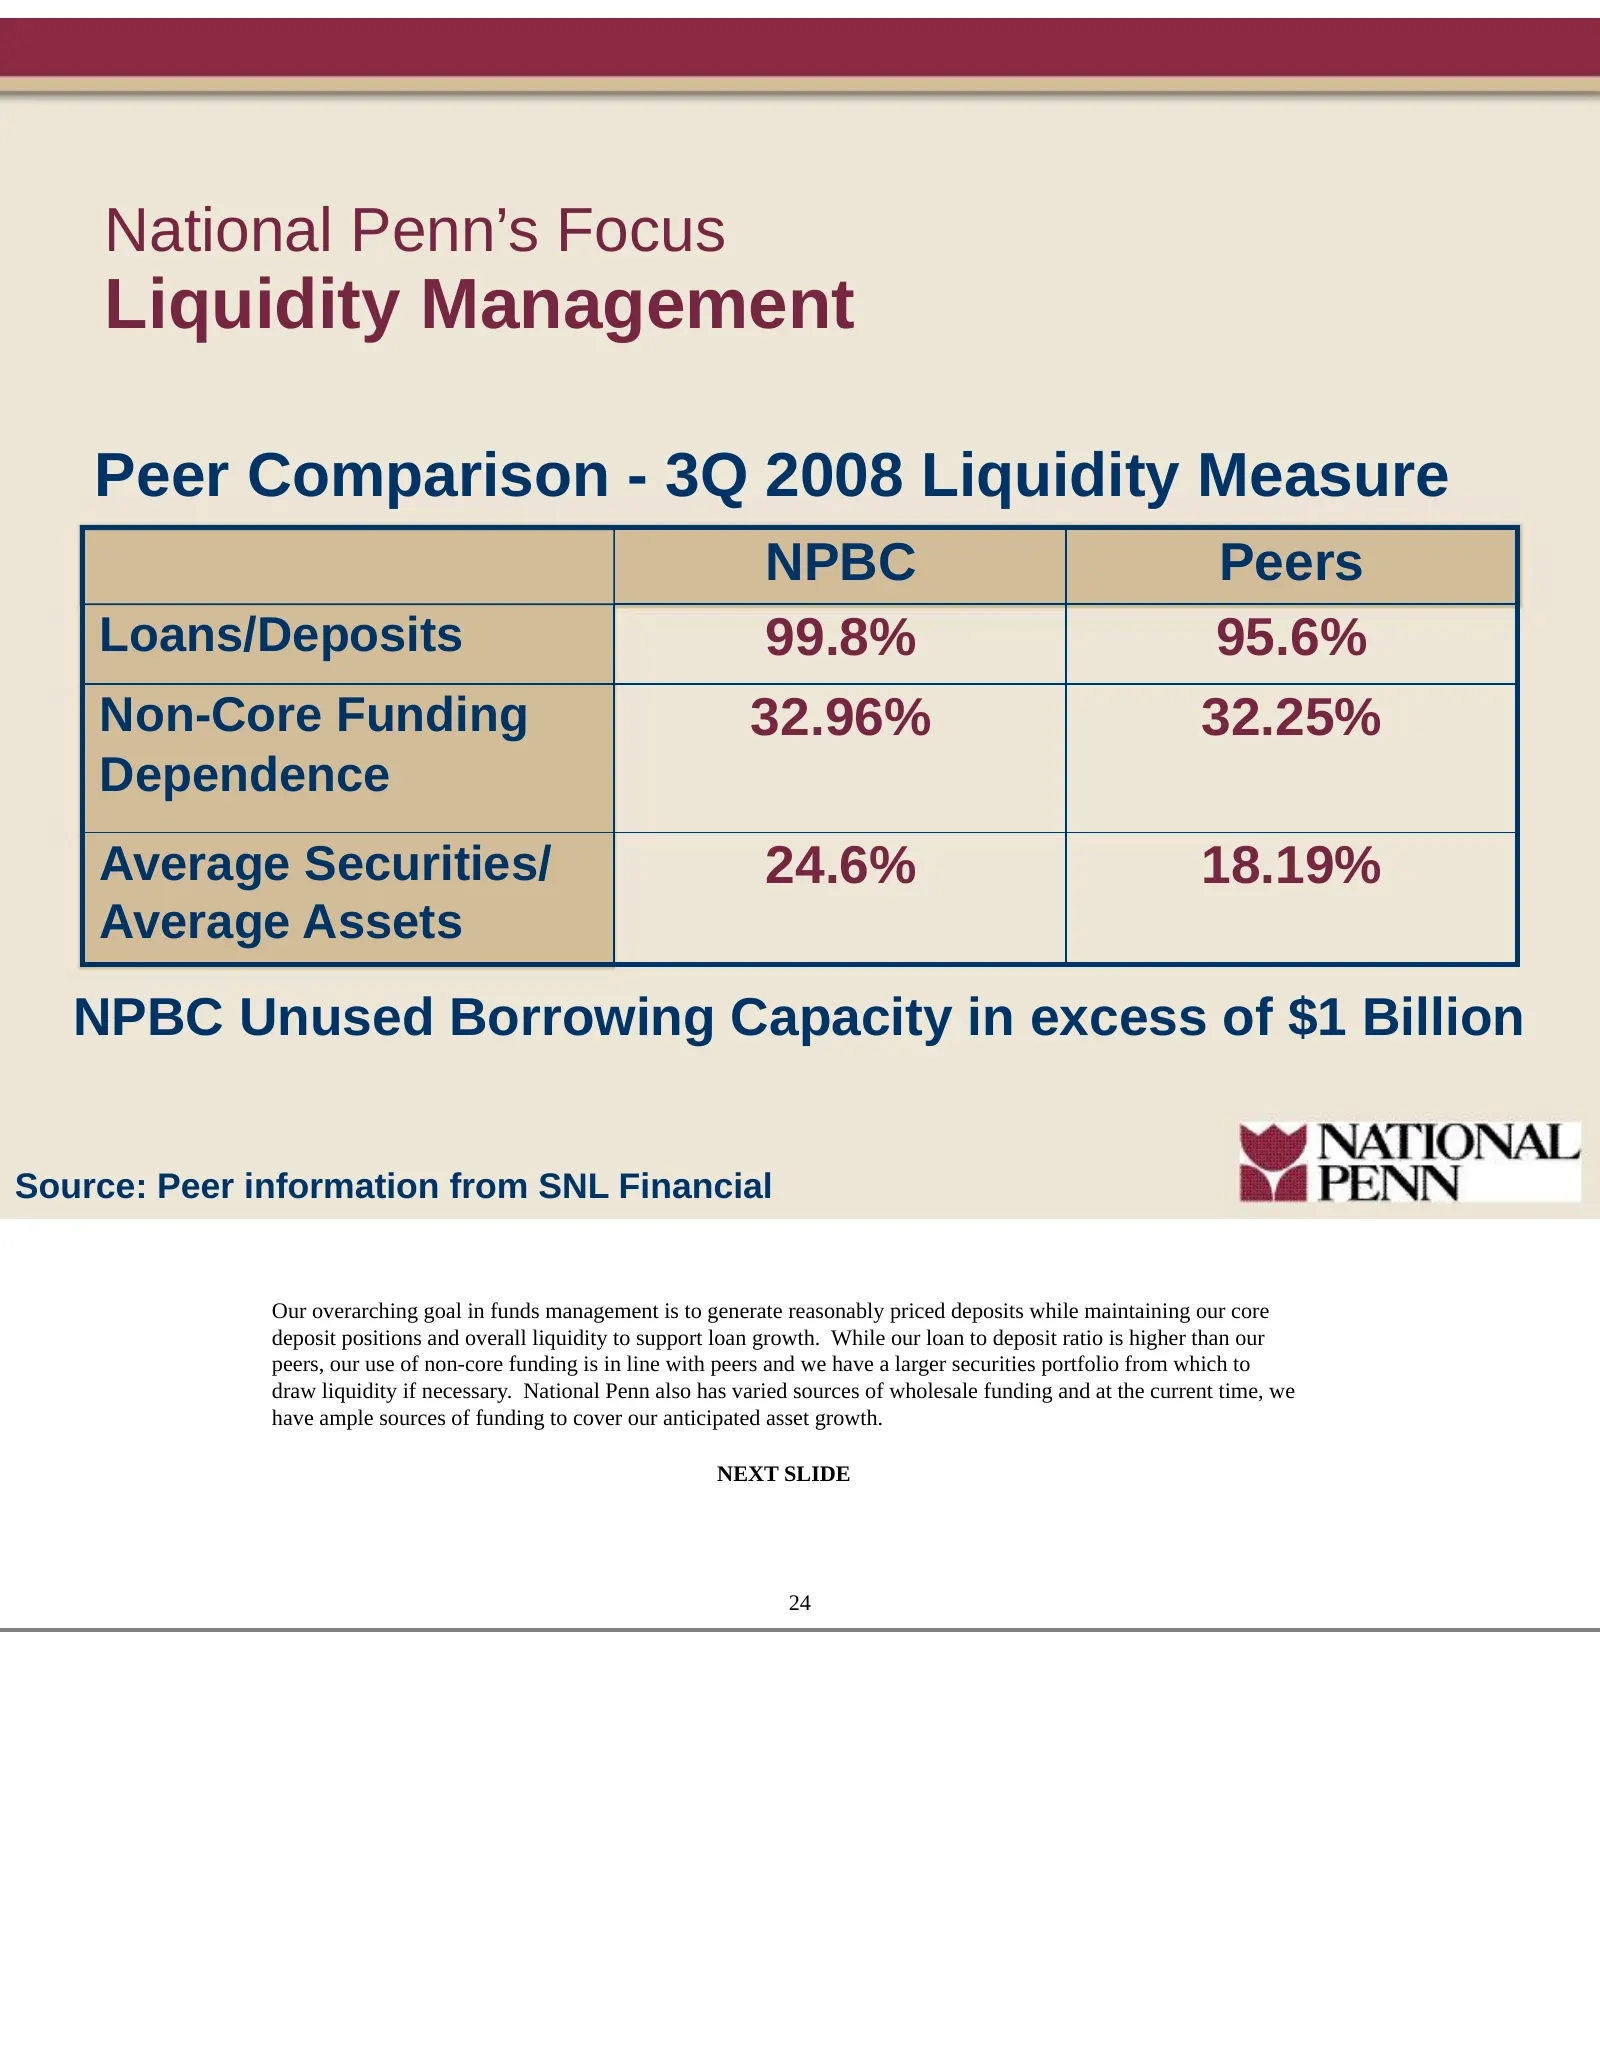
National Penn’s Focus Liquidity Management Peer Comparison - 3Q 2008 Liquidity Measure NPBC Peers Loans/Deposits 99.8% 95.6% Non-Core Funding 32.96% 32.25% Dependence Average Securities/ 24.6% 18.19% Average Assets NPBC Unused Borrowing Capacity in excess of $1 Billion Source: Peer information from
Slide 21: Liquidity Management
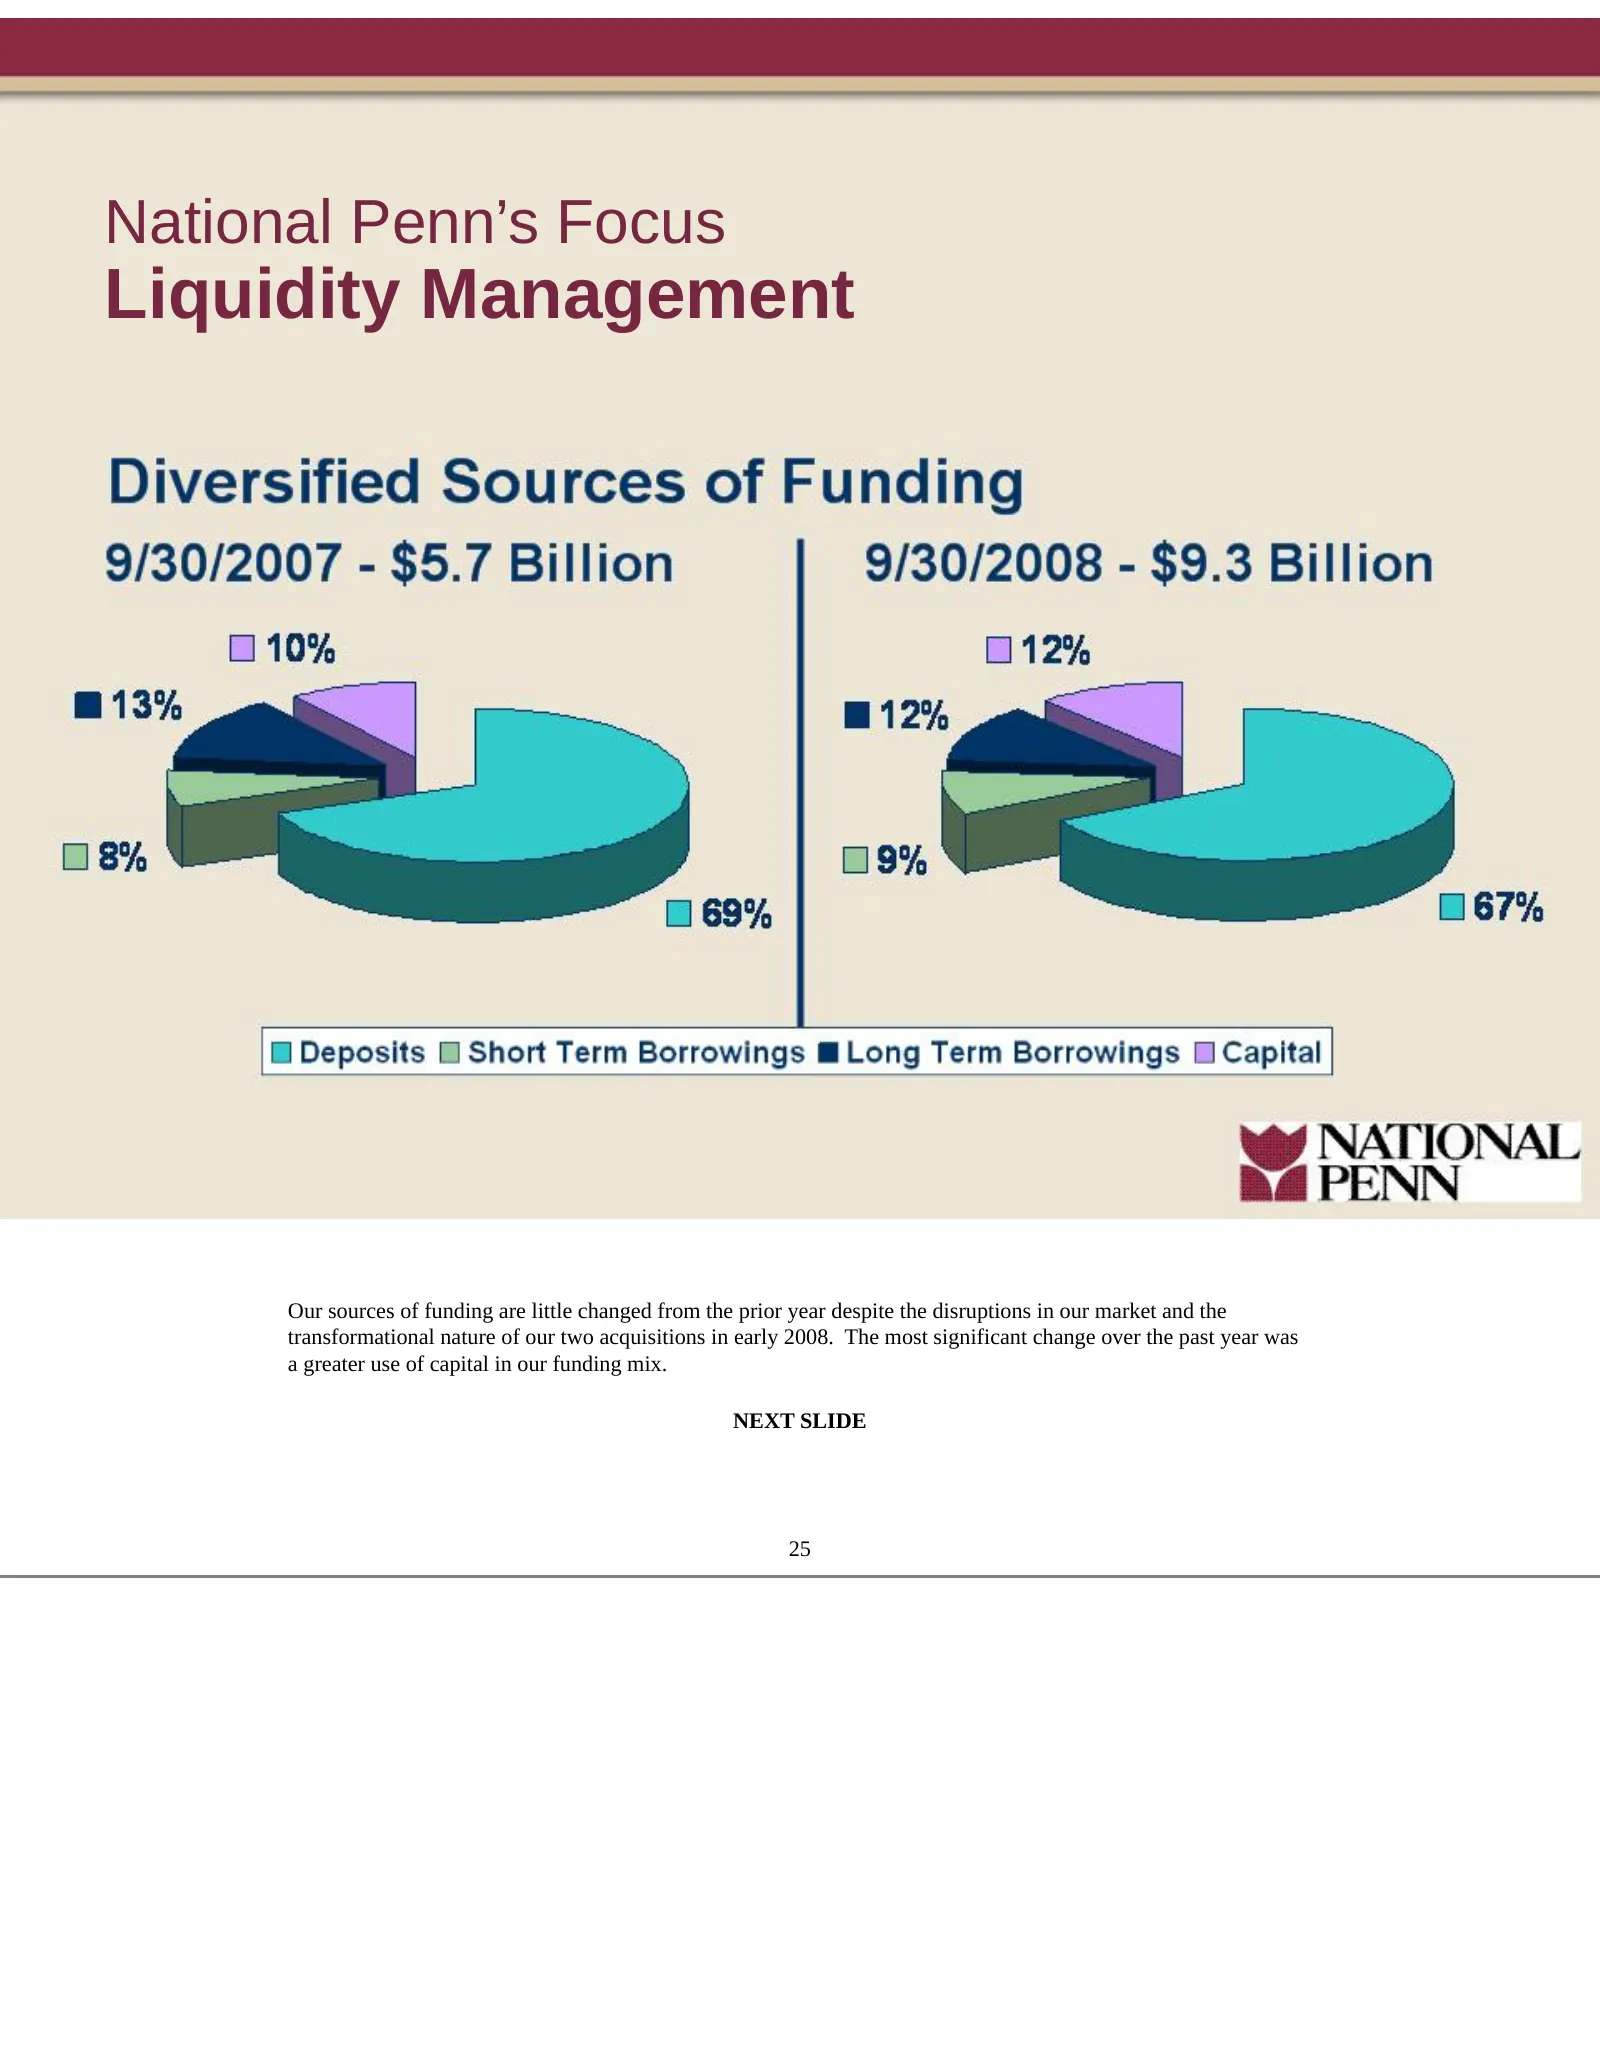
National Penn’s Focus Liquidity Management Our sources of funding are little changed from the prior year despite the disruptions in our market and the transformational nature of our two acquisitions in early 2008. The most significant change over the past year was a greater use of capital in our fun
Slide 22: Credit Quality Management
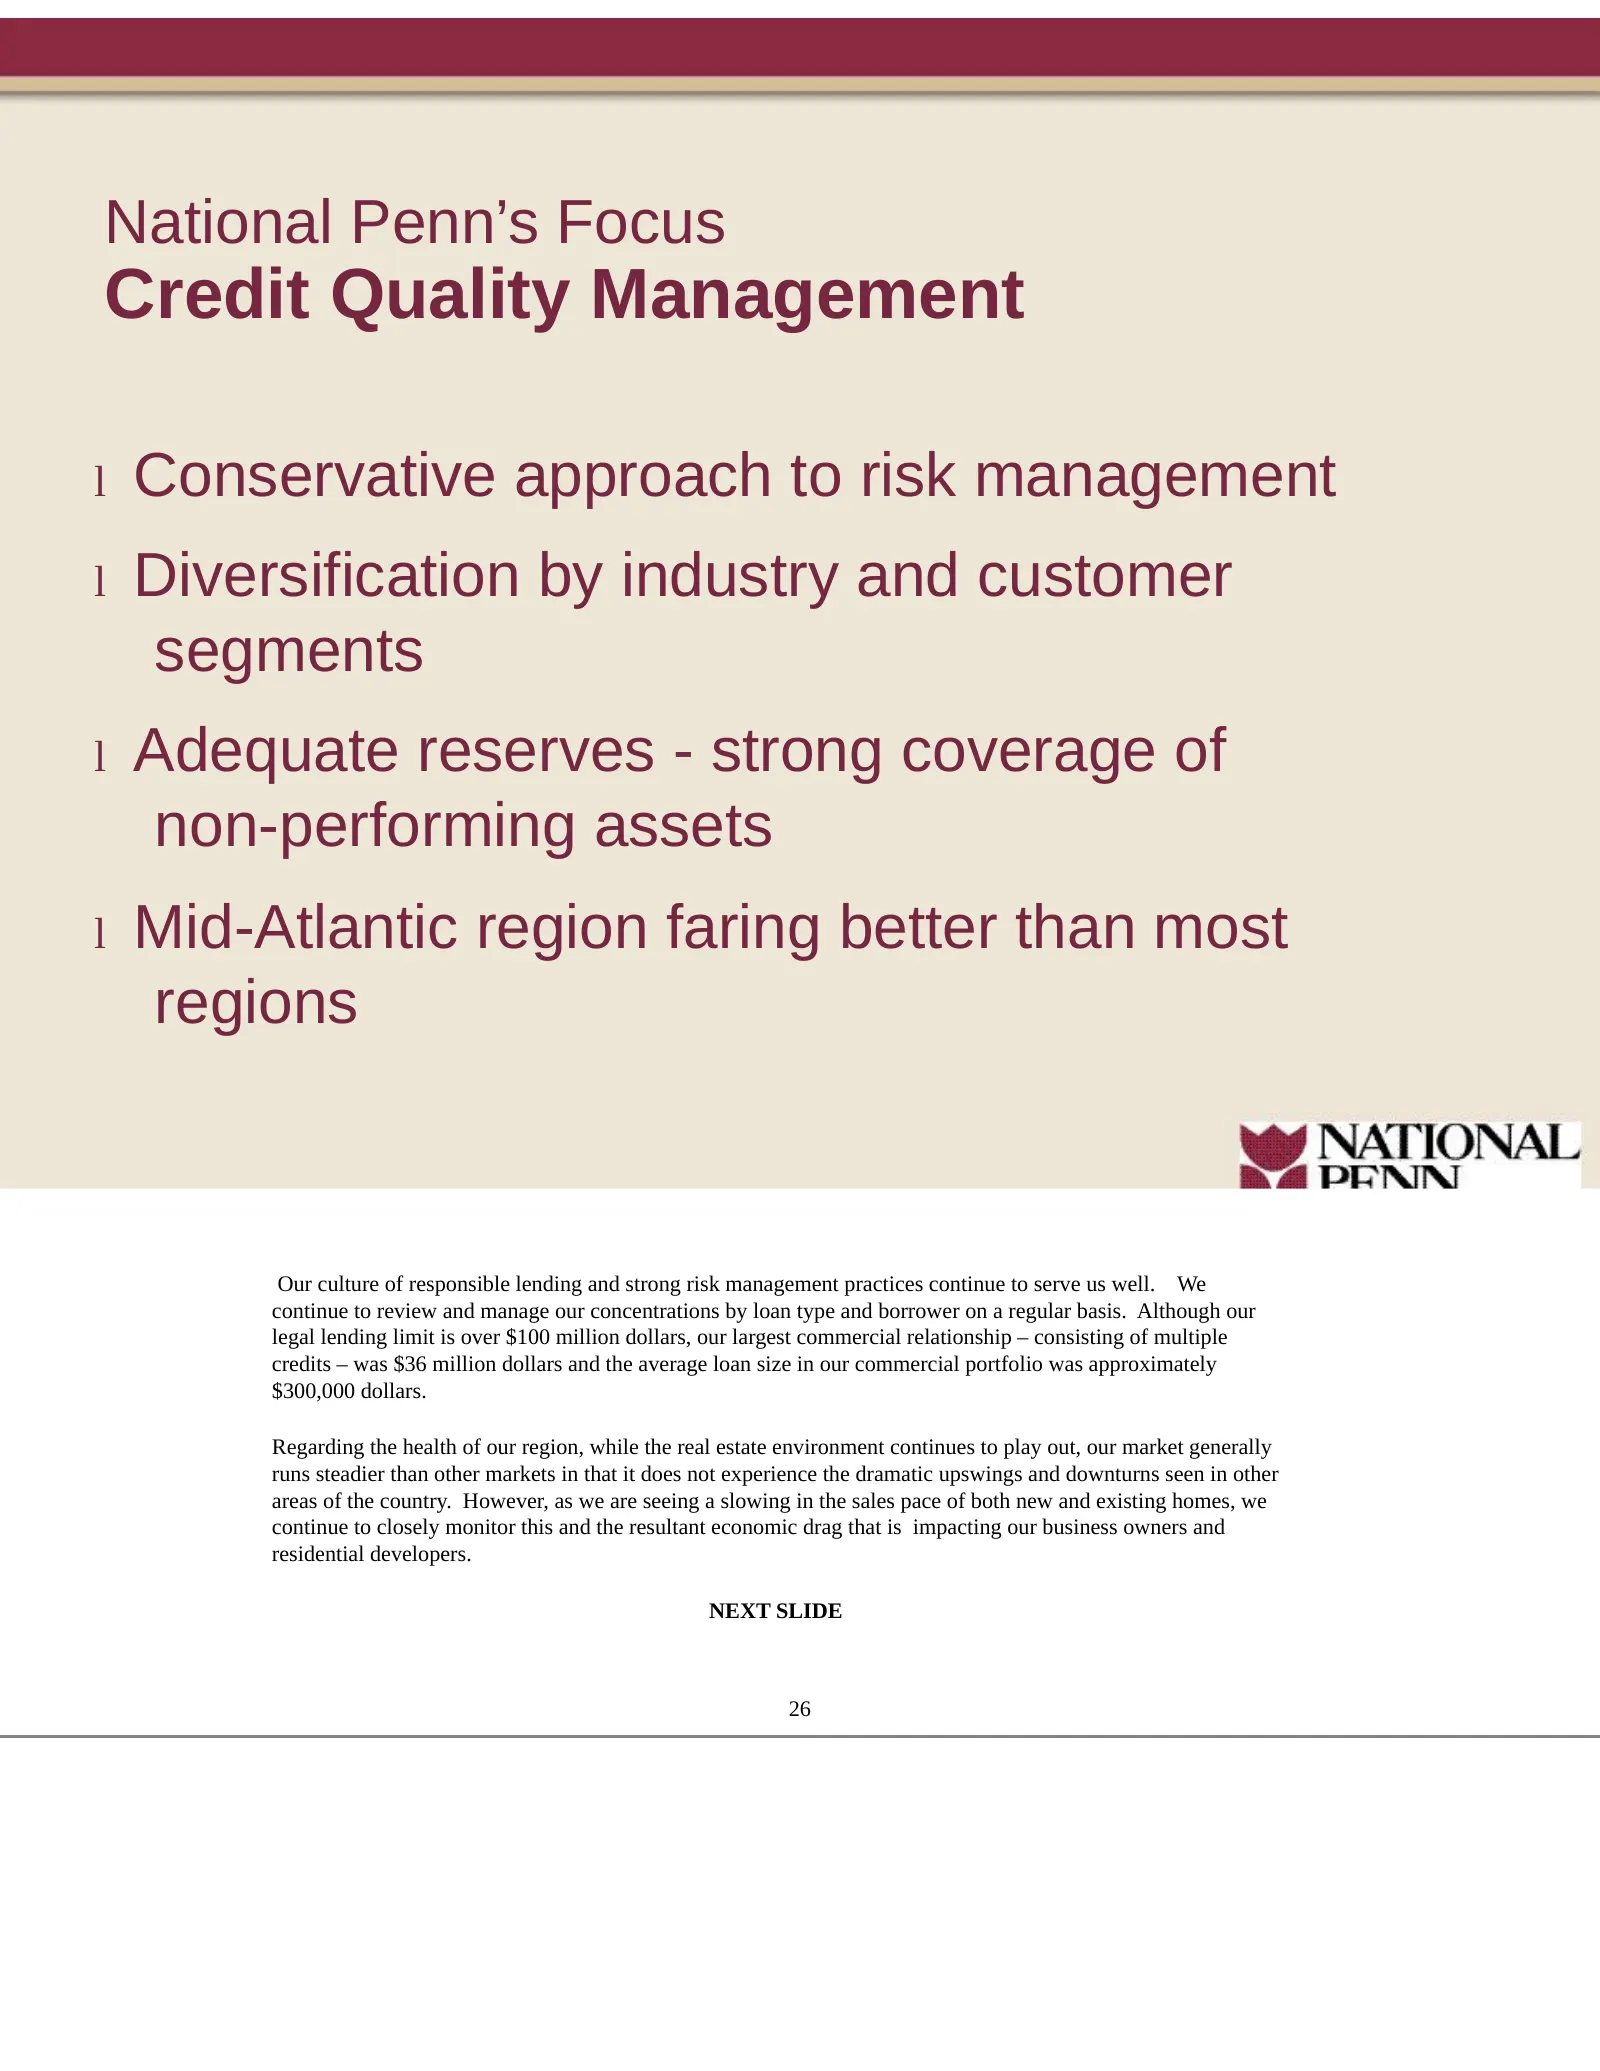
National Penn’s Focus Credit Quality Management l Conservative approach to risk management l Diversification by industry and customer segments l Adequate reserves - strong coverage of non-performing assets l Mid-Atlantic region faring better than most regions Our culture of responsible lending and s
Slide 23: Loan Portfolio as of September 30, 2008
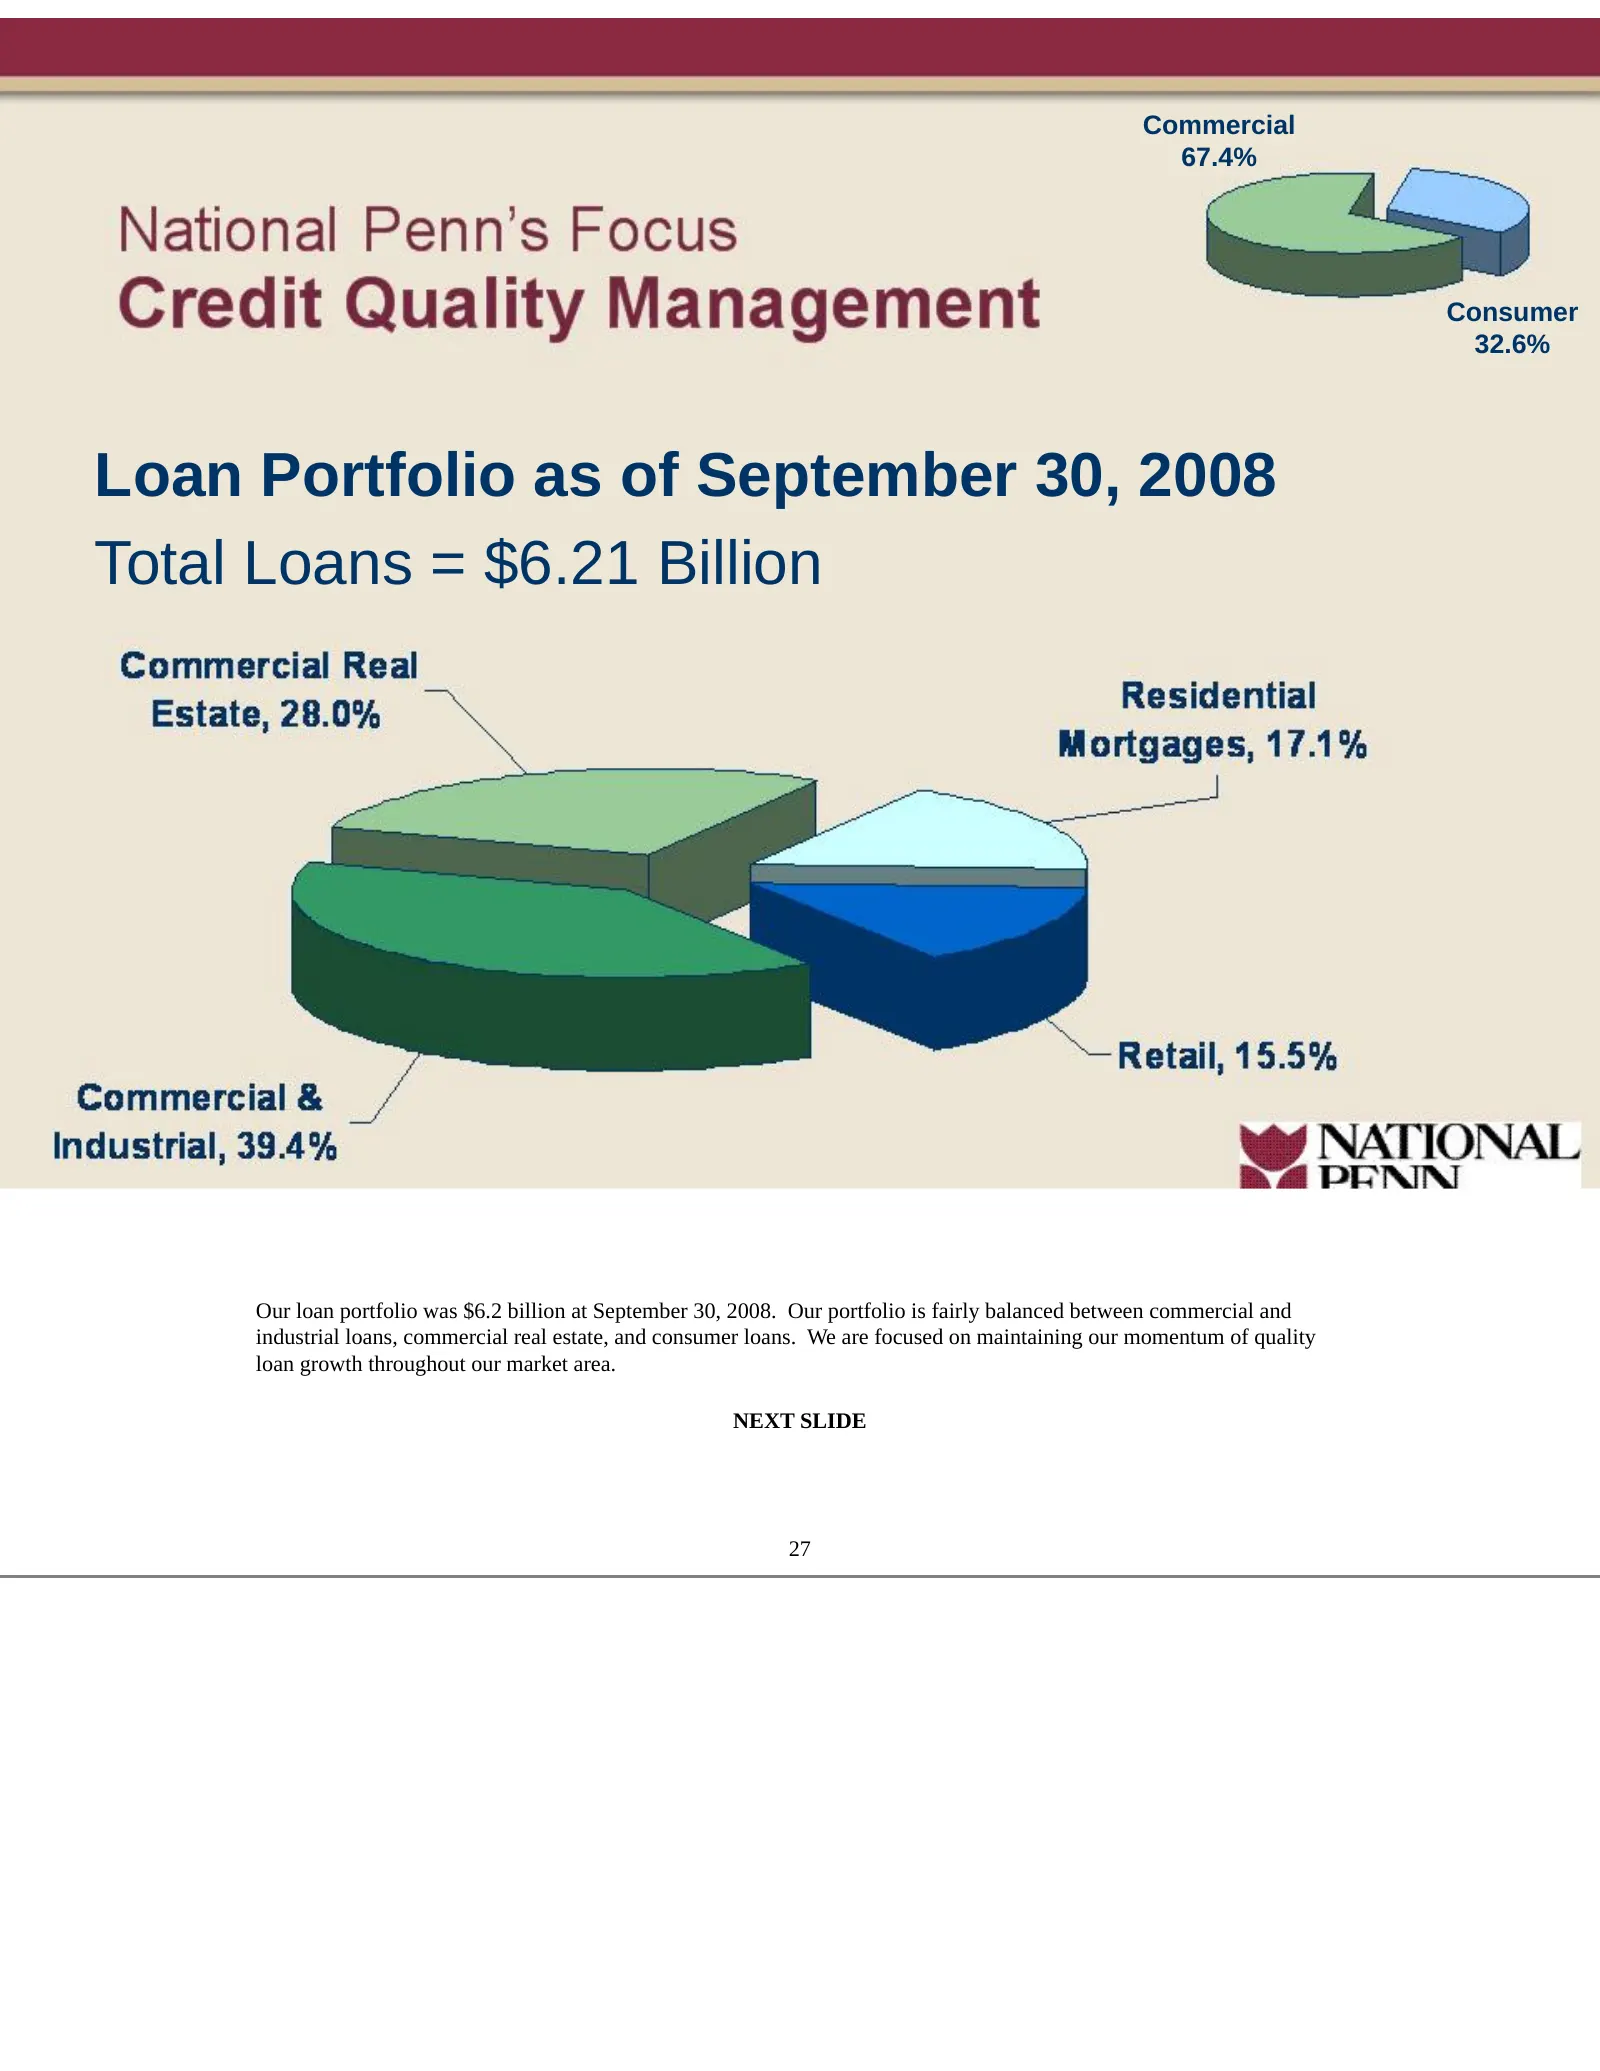
Commercial 67.4% Consumer 32.6% Loan Portfolio as of September 30, 2008 Total Loans = $6.21 Billion Our loan portfolio was $6.2 billion at September 30, 2008. Our portfolio is fairly balanced between commercial and industrial loans, commercial real estate, and consumer loans. We are focused on maint
Slide 24: Credit Quality Management
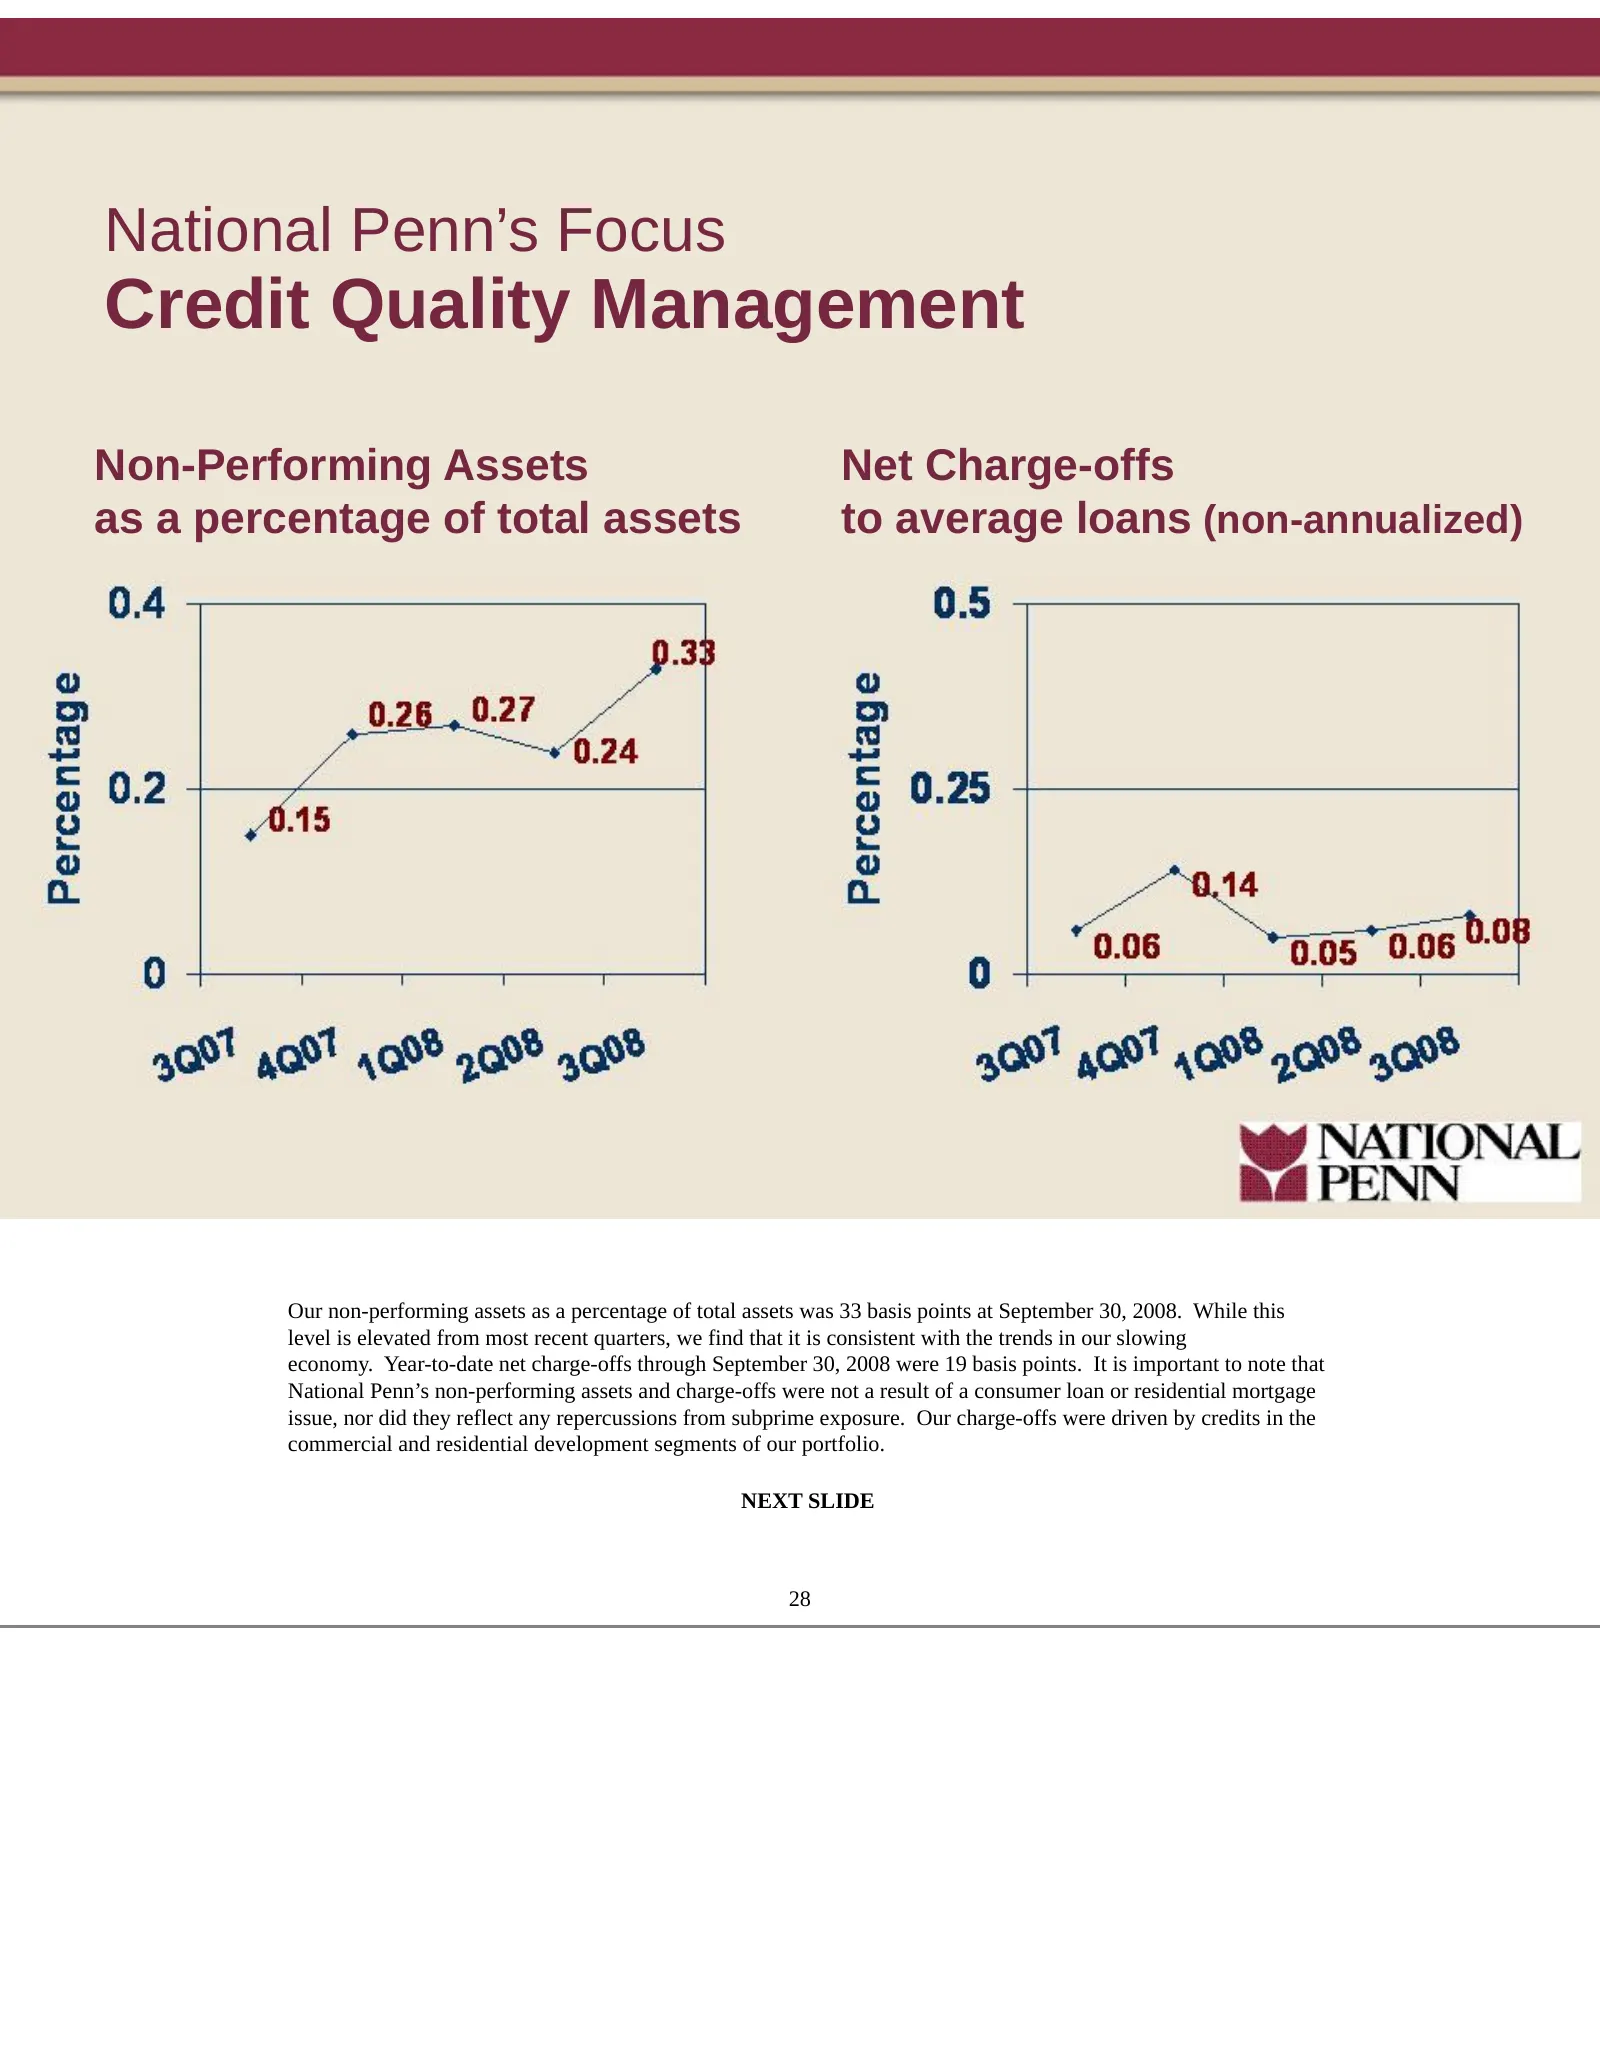
National Penn’s Focus Credit Quality Management Non-Performing Assets Net Charge-offs as a percentage of total assets to average loans (non-annualized) Our non-performing assets as a percentage of total assets was 33 basis points at September 30, 2008. While this level is elevated from most recent q
Slide 25: Credit Quality Management
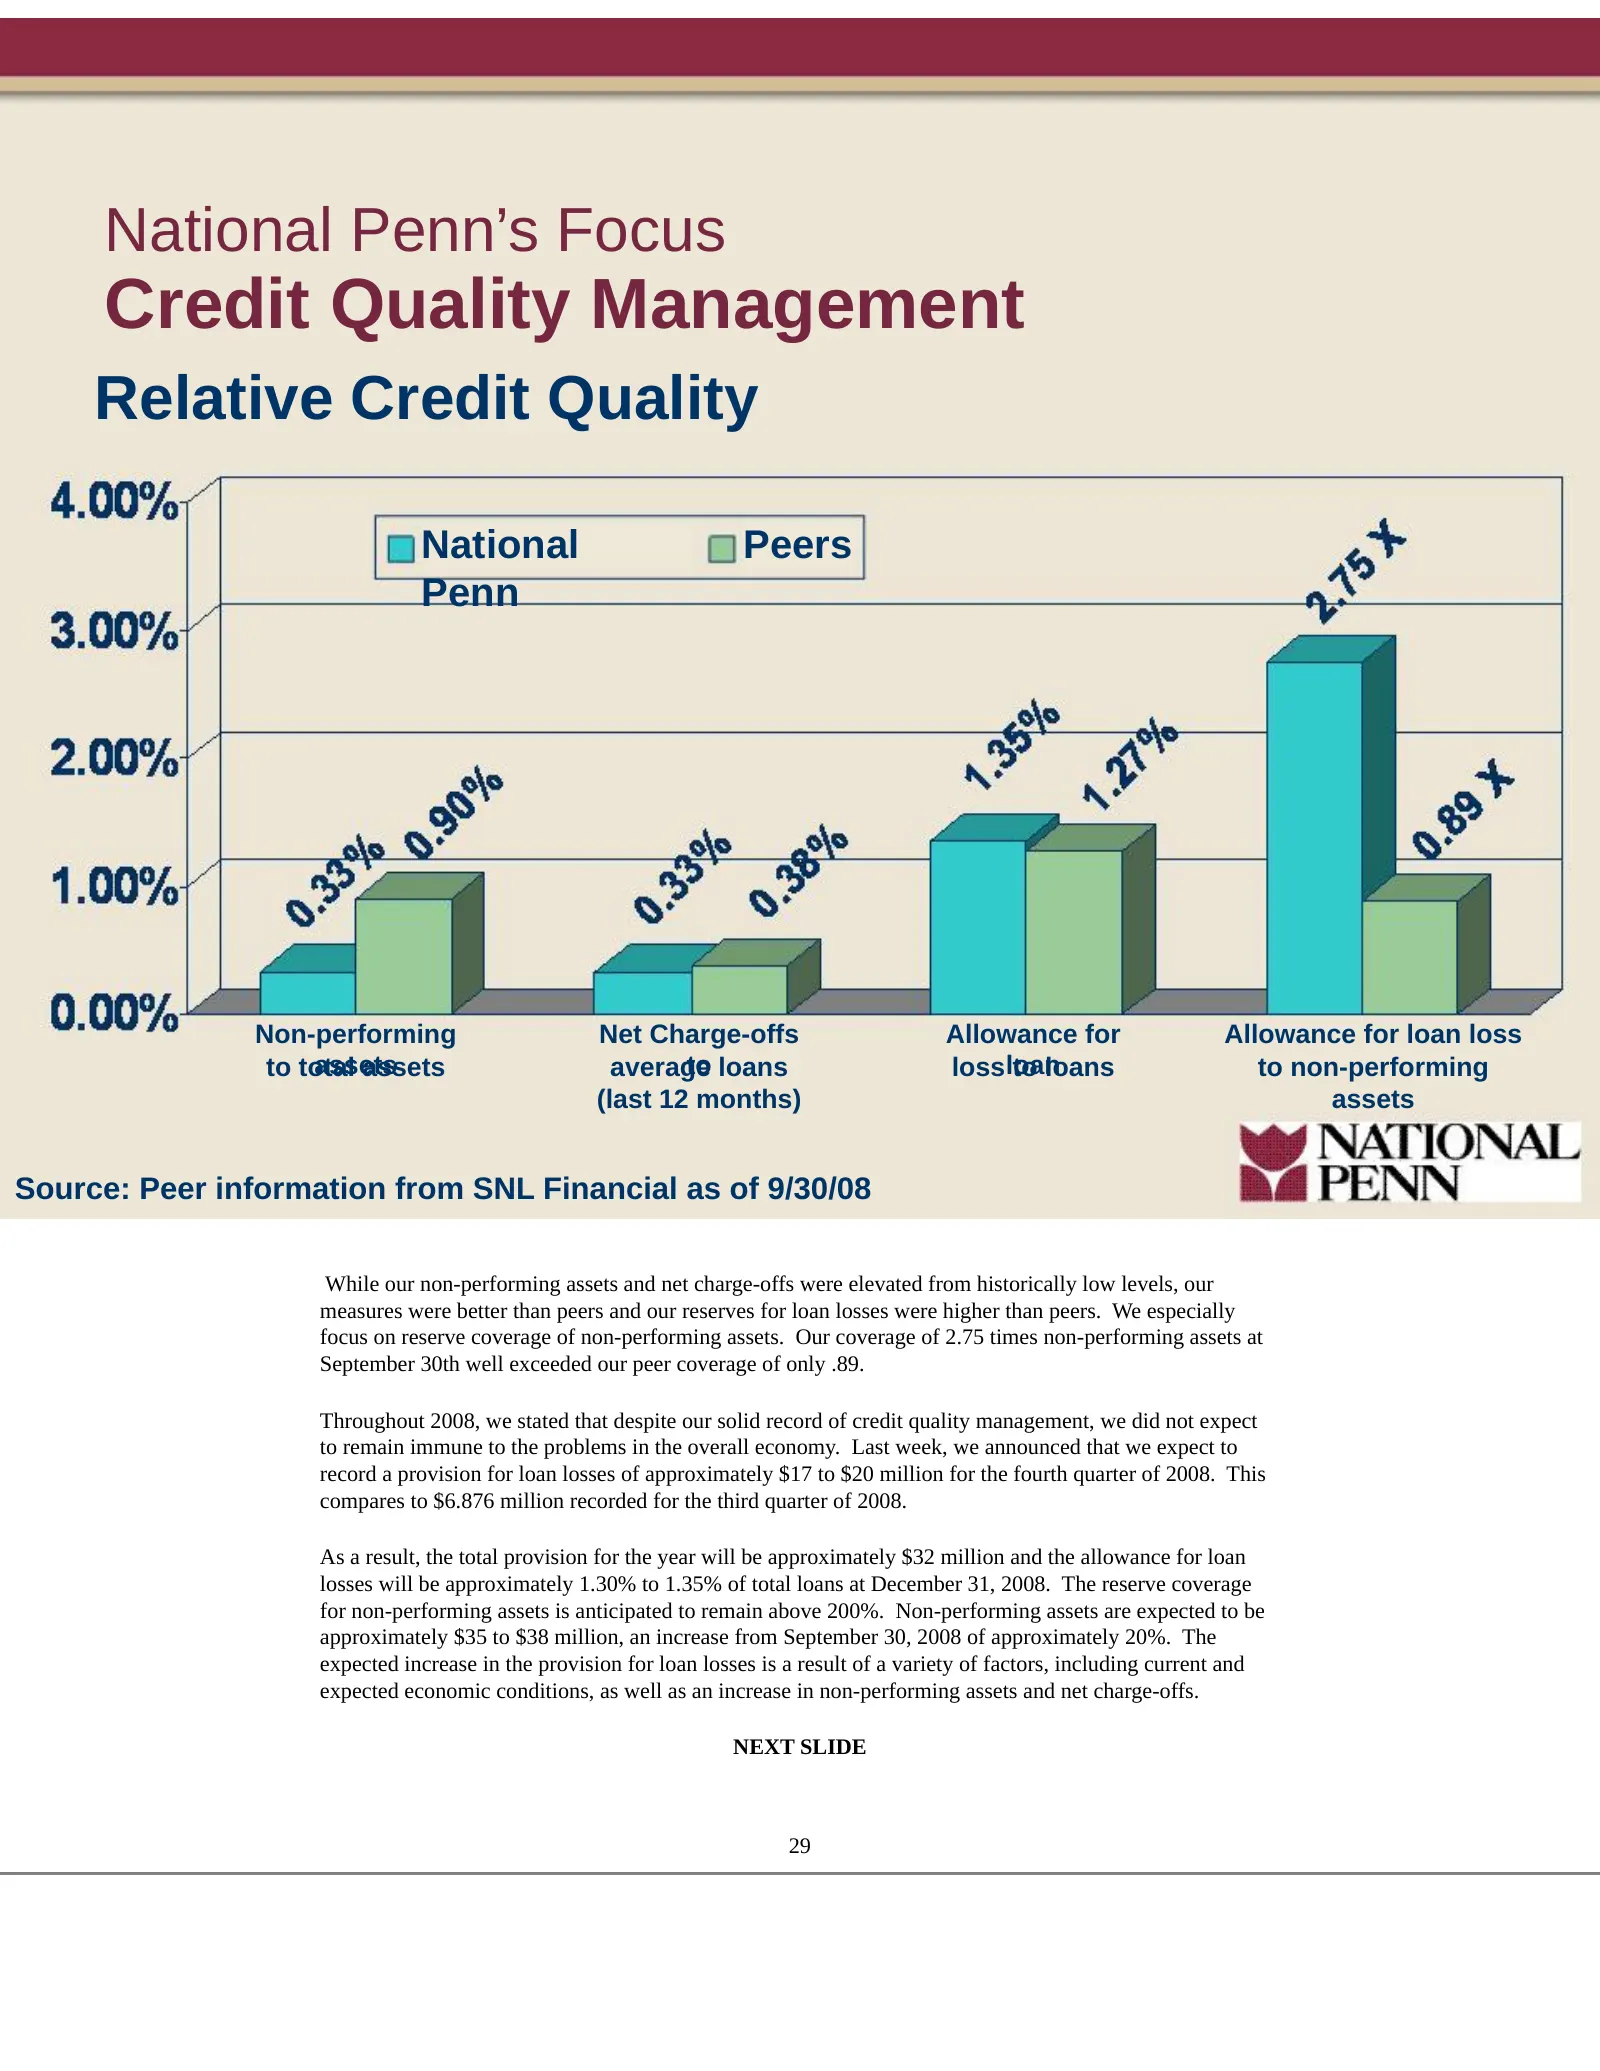
National Penn’s Focus Credit Quality Management Relative Credit Quality National Peers Penn Non-performing Net Charge-offs Allowance for Allowance for loan loss assets to total assets to loans average lossloan to loans to non-performing (last 12 months) assets Source: Peer information from SNL Finan
Slide 26: Investment Portfolio
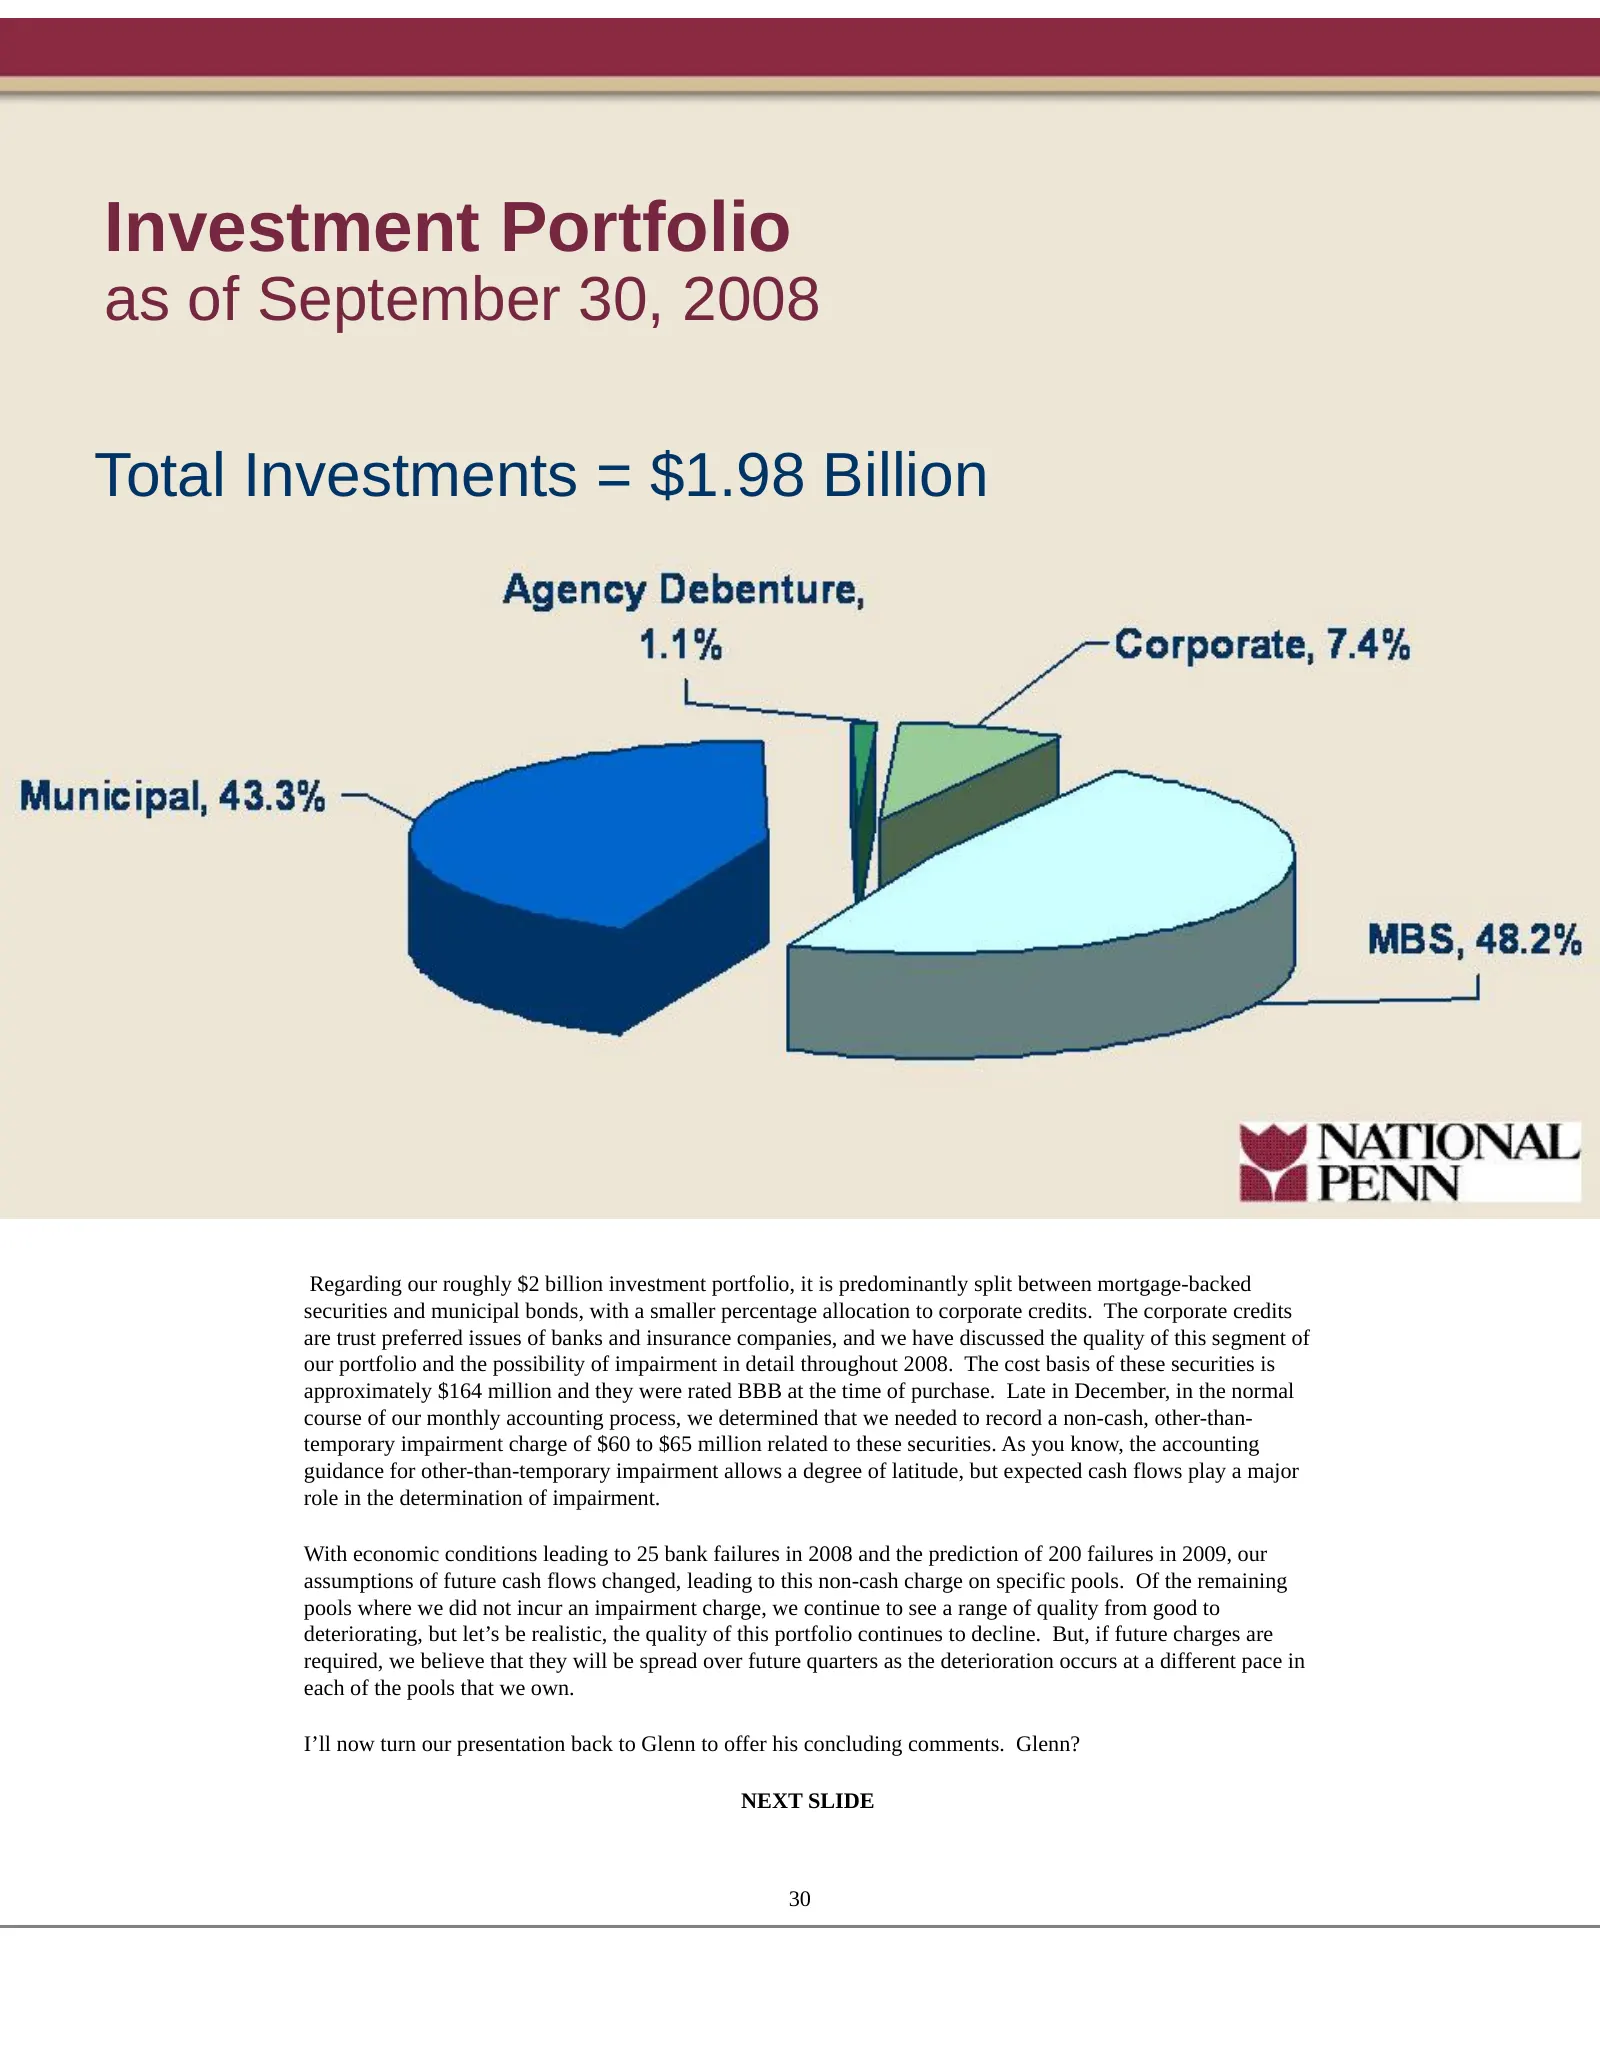
Investment Portfolio as of September 30, 2008 Total Investments = $1.98 Billion Regarding our roughly $2 billion investment portfolio, it is predominantly split between mortgage-backed securities and municipal bonds, with a smaller percentage allocation to corporate credits. The corporate credits ar
Slide 27: Investment Considerations
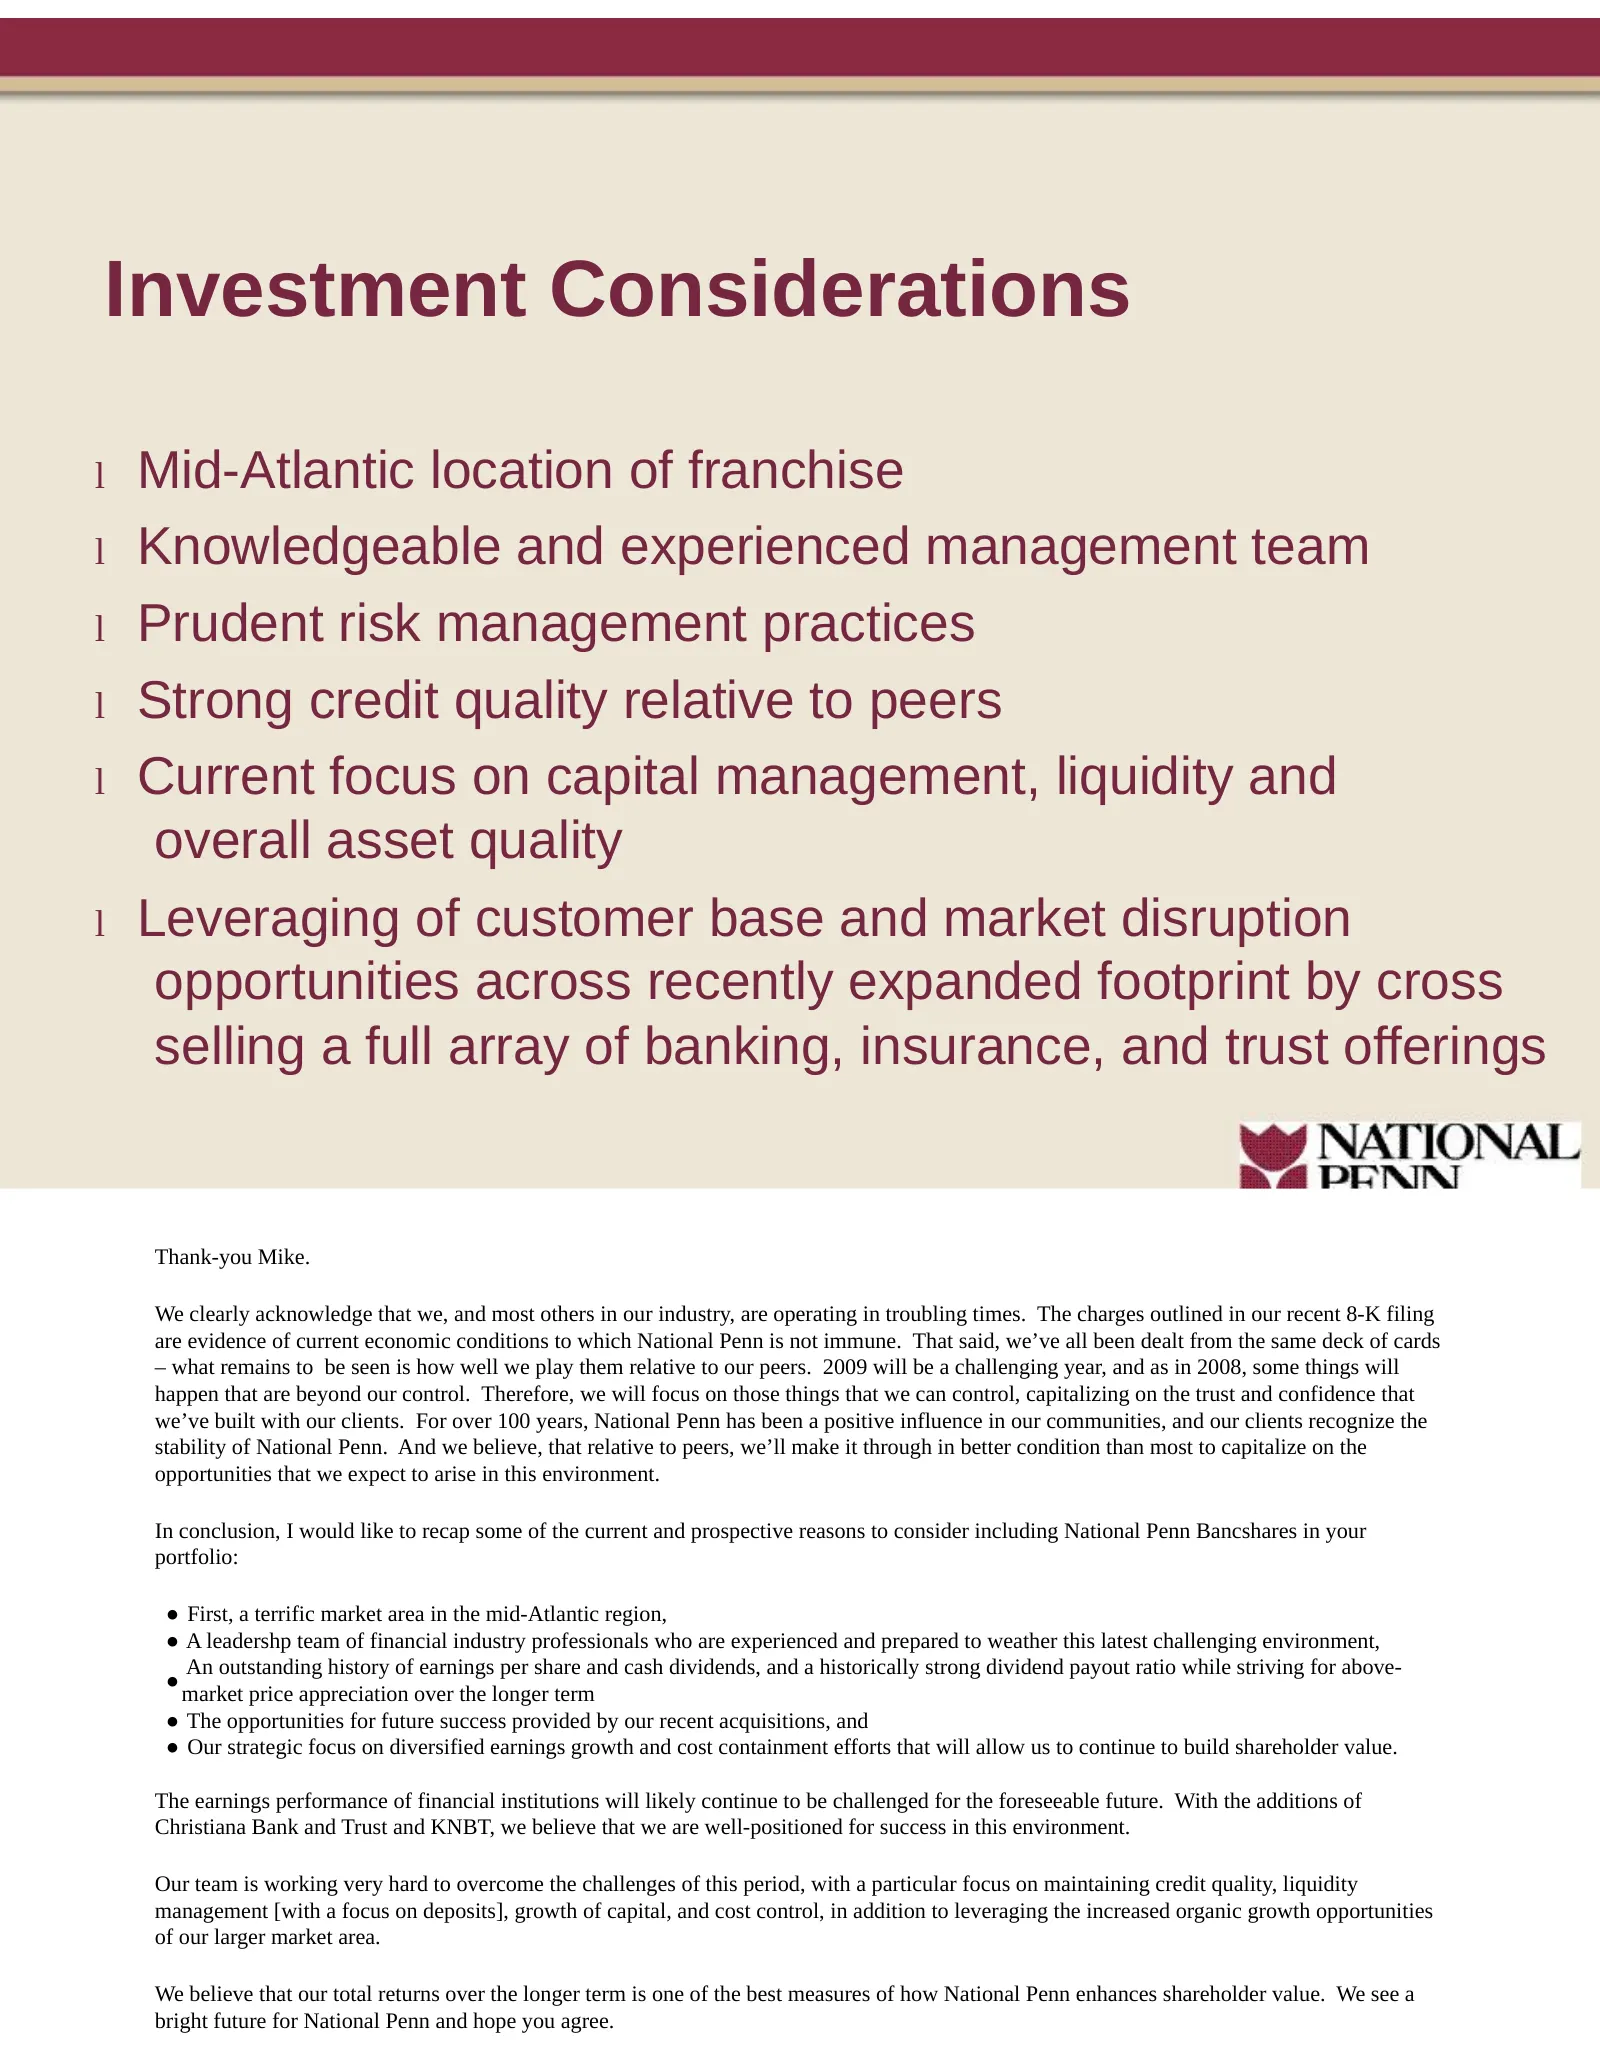
Investment Considerations l Mid-Atlantic location of franchise l Knowledgeable and experienced management team l Prudent risk management practices l Strong credit quality relative to peers l Current focus on capital management, liquidity and overall asset quality l Leveraging of customer base and ma

Slide 28: Thank-you for your time today
Thank-you for your time today. We would be pleased to answer any questions. 31

Slide 29
Source: SEC EDGAR · 8-K filed Jan 8, 2009
More decks from National Penn Bancshares
 BB&T Global Financial Services Conference (September 2015)33 slides · Sep 16, 2015
 Merger or Acquisition (August 2015)13 slides · Aug 18, 2015
 Q2 2015 Earnings Presentation17 slides · Jul 23, 2015
 Q1 2015 Earnings Presentation18 slides · Apr 24, 2015
 Investor Presentation (February 2015)36 slides · Feb 11, 2015
 Q4 2014 Earnings Presentation16 slides · Jan 22, 2015