Air Canada · TSX:AC
Air Canada — Shareholder Meeting (April 2018)
55 slides from Air Canada's shareholder meeting presentation, Apr 30, 2018
Slide 1: Air Canada's Annual Meeting of Shareholders
Air Canada’s Annual Meeting of Shareholders Calin Rovinescu President and Chief Executive Officer, Air Canada Montréal, April 30, 2018

Slide 2: Doing WELL = Doing GOOD
Doing Doing WELL = GOOD 2

Slide 3: Doing Good
Doing Good • Air Canada Foundation • Syrian refugees • Haiti earthquakes • Caribbean hurricanes • Fort McMurray fires • Quebec floods 3
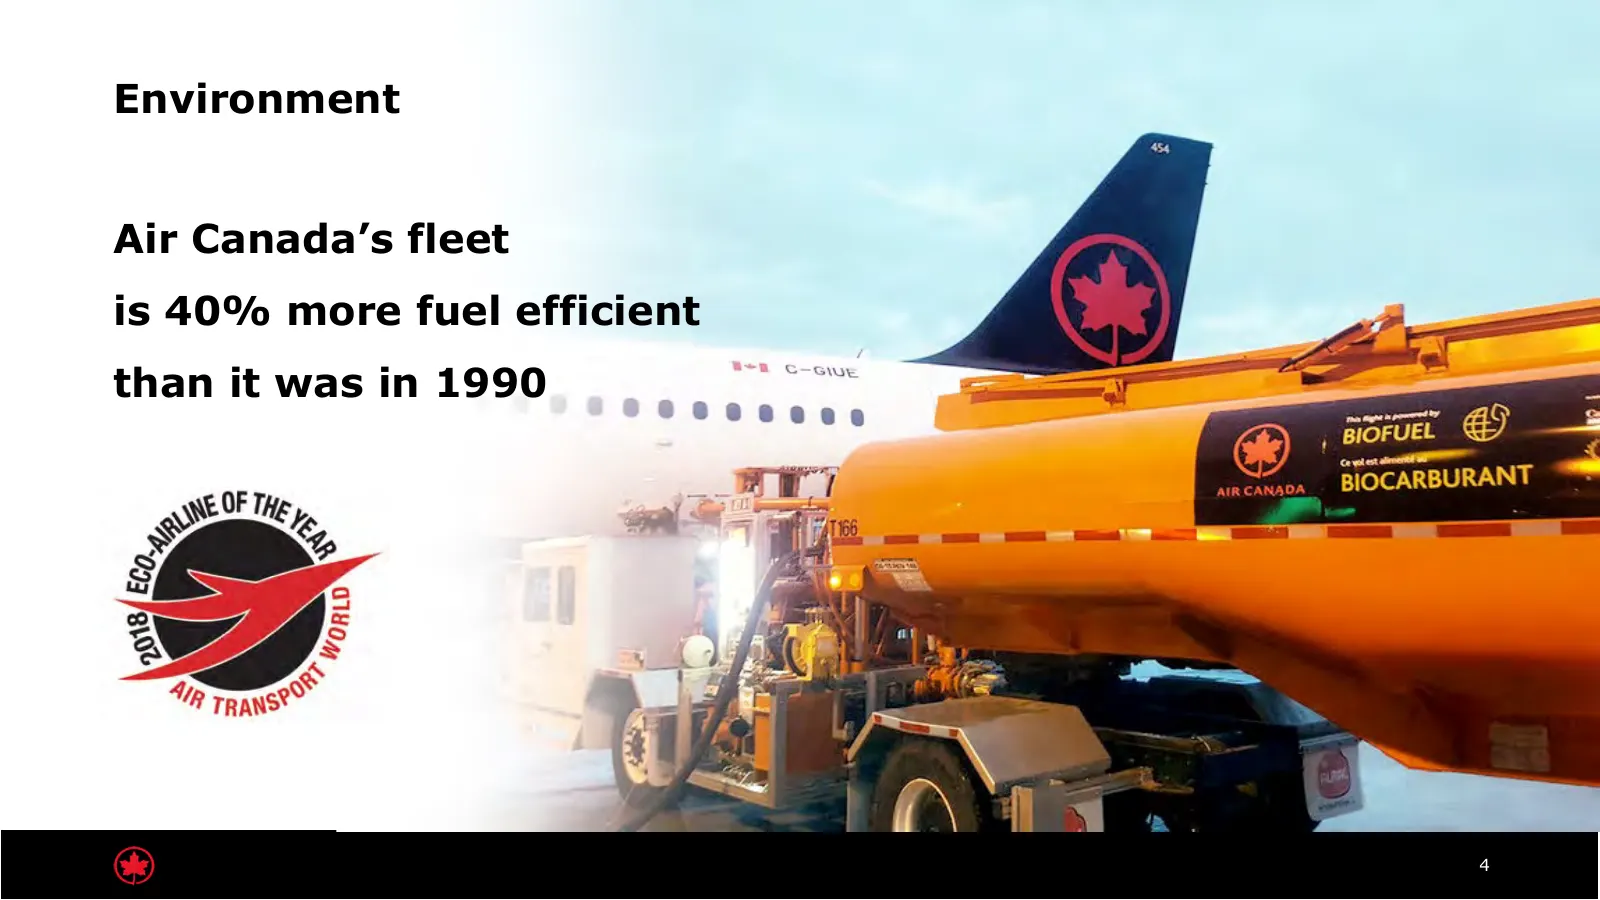
Slide 4: Environment
Environment Air Canada’s fleet is 40% more fuel efficient than it was in 1990 4

Slide 5: Safety and Ethics
Safety and Ethics • Safety First, Last and Always – Robust SMS • Solid ethical foundation 5

Slide 6: 6
6
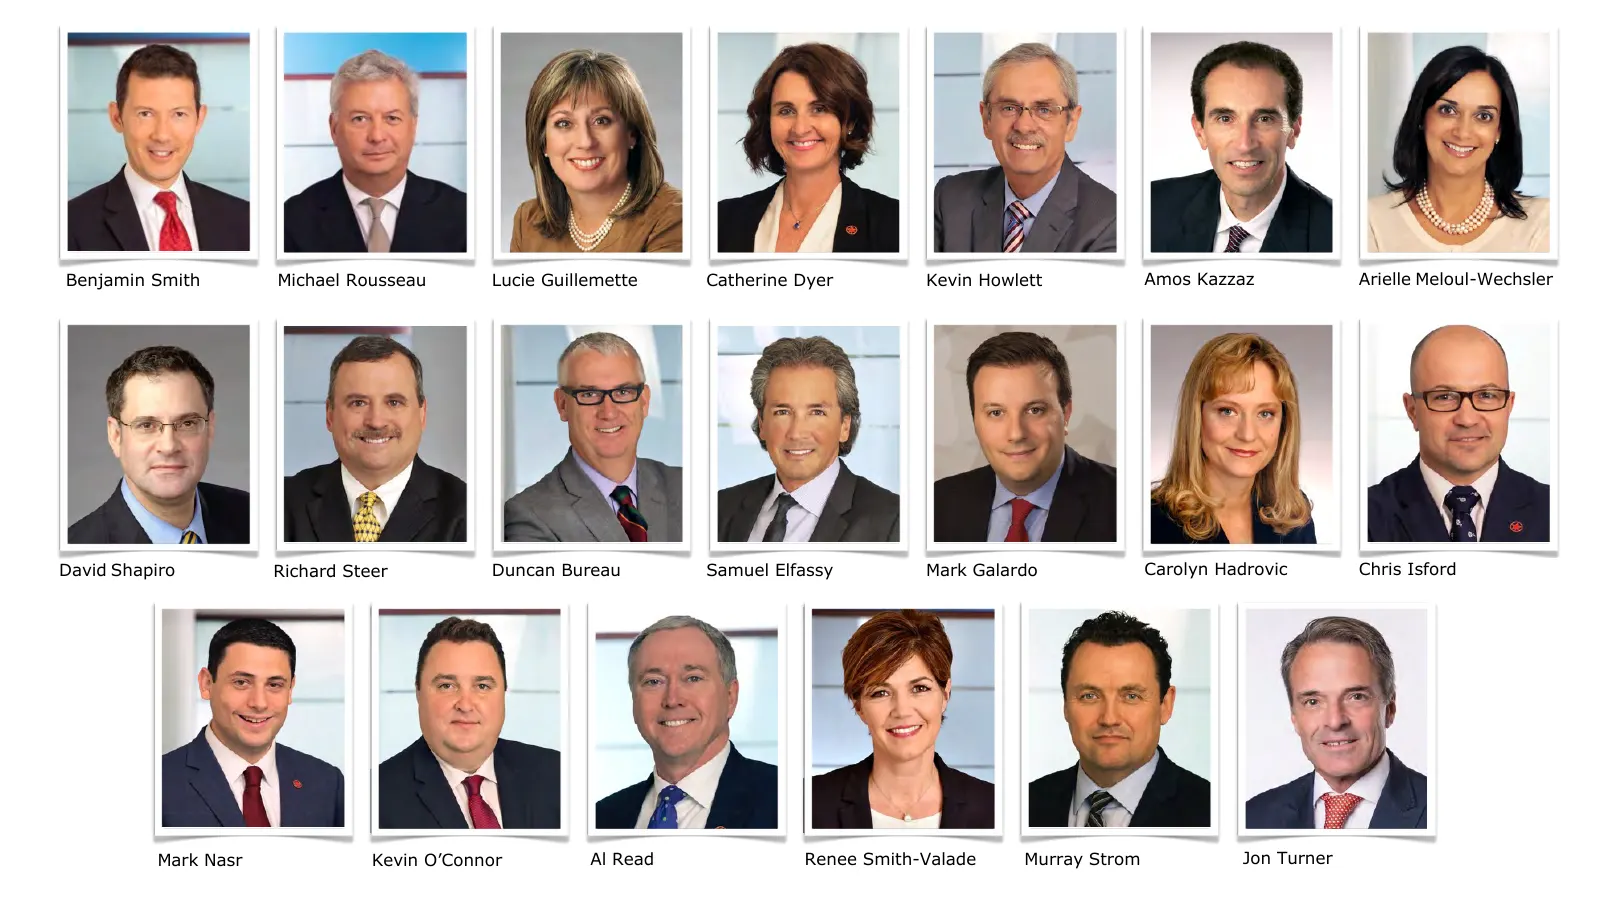
Slide 7: Benjamin Smith Michael Rousseau Lucie Guillemette
Benjamin Smith Michael Rousseau Lucie Guillemette Catherine Dyer Kevin Howlett Amos Kazzaz Arielle Meloul-Wechsler David Shapiro Richard Steer Duncan Bureau Samuel Elfassy Mark Galardo Carolyn Hadrovic Chris Isford Mark Nasr Kevin O’Connor Al Read Renee Smith-Valade Murray Strom Jon Turner
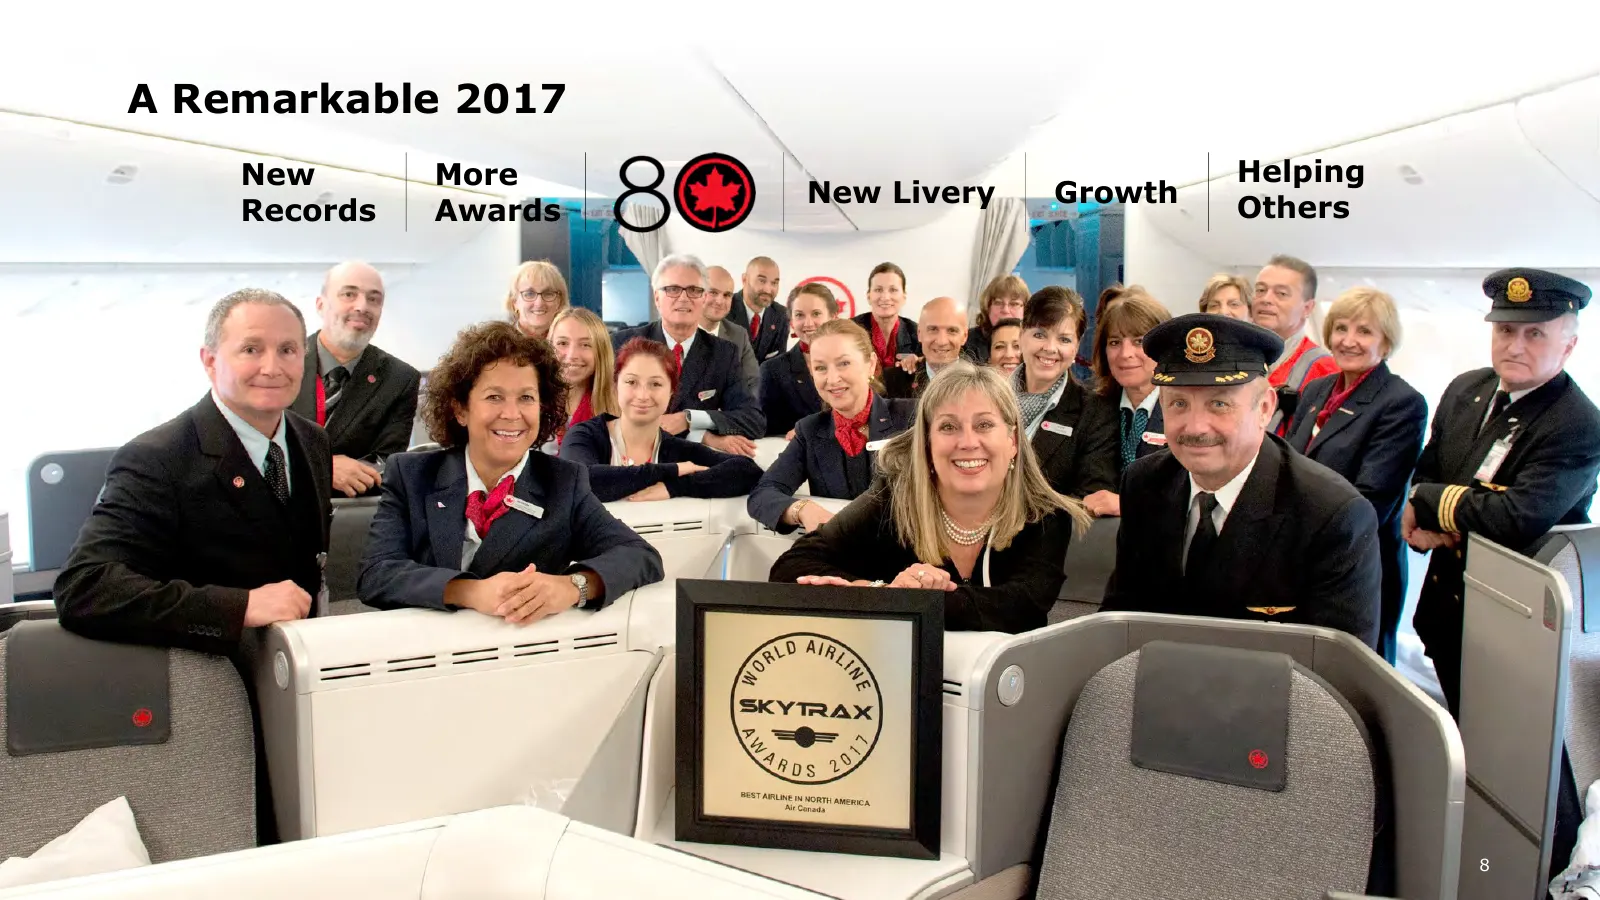
Slide 8: A Remarkable 2017
A Remarkable 2017 New More Helping New Livery Growth Others Records Awards 8

Slide 9: We get to play multi-dimensional chess, in full view of the public
We get to play multi-dimensional chess, in full view of the public

Slide 10: We convey everything good about Canada
We convey everything good about Canada

Slide 11: * pe Se
| | » * pe Se »Polaroid
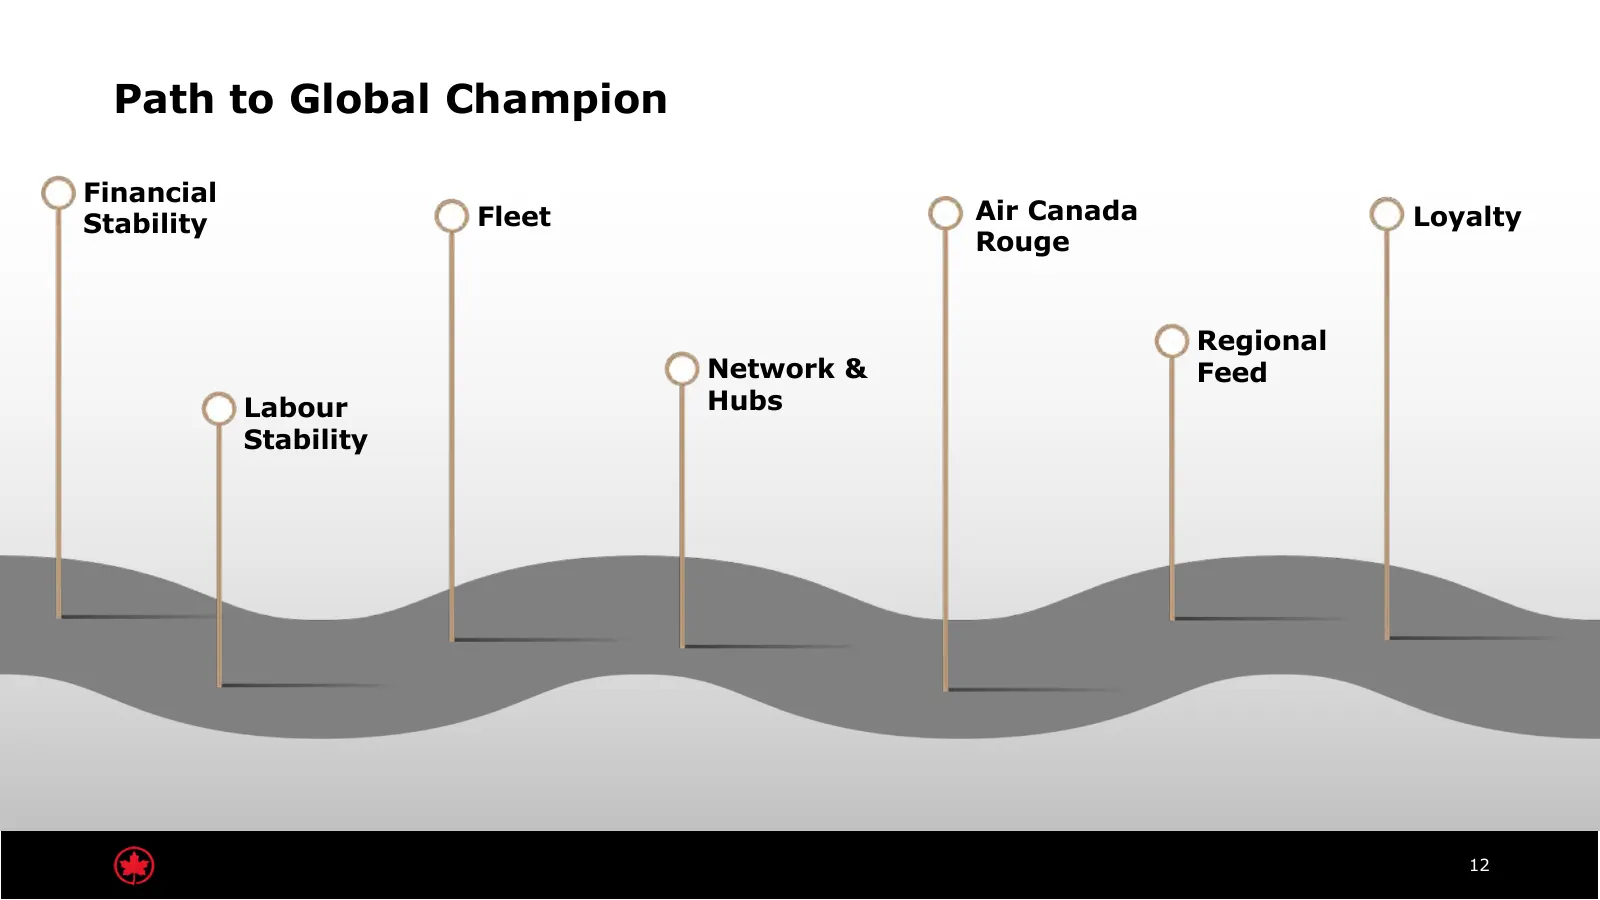
Slide 12: Path to Global Champion
Path to Global Champion Financial Fleet Air Canada Loyalty Stability Rouge Regional Network & Feed Labour Hubs Stability 12

Slide 13: Lessons Learned: Take some RISK
Lessons Learned Take some RISK 13

Slide 14: Lessons Learned: Invest in BRAINPOWER
Lessons Learned Invest in BRAINPOWER 14

Slide 15: Lessons Learned: Invest in DIVERSITY
Lessons Learned Invest in DIVERSITY 15

Slide 16: Lessons Learned: Leave the room BETTER
Lessons Learned Leave the room BETTER 16
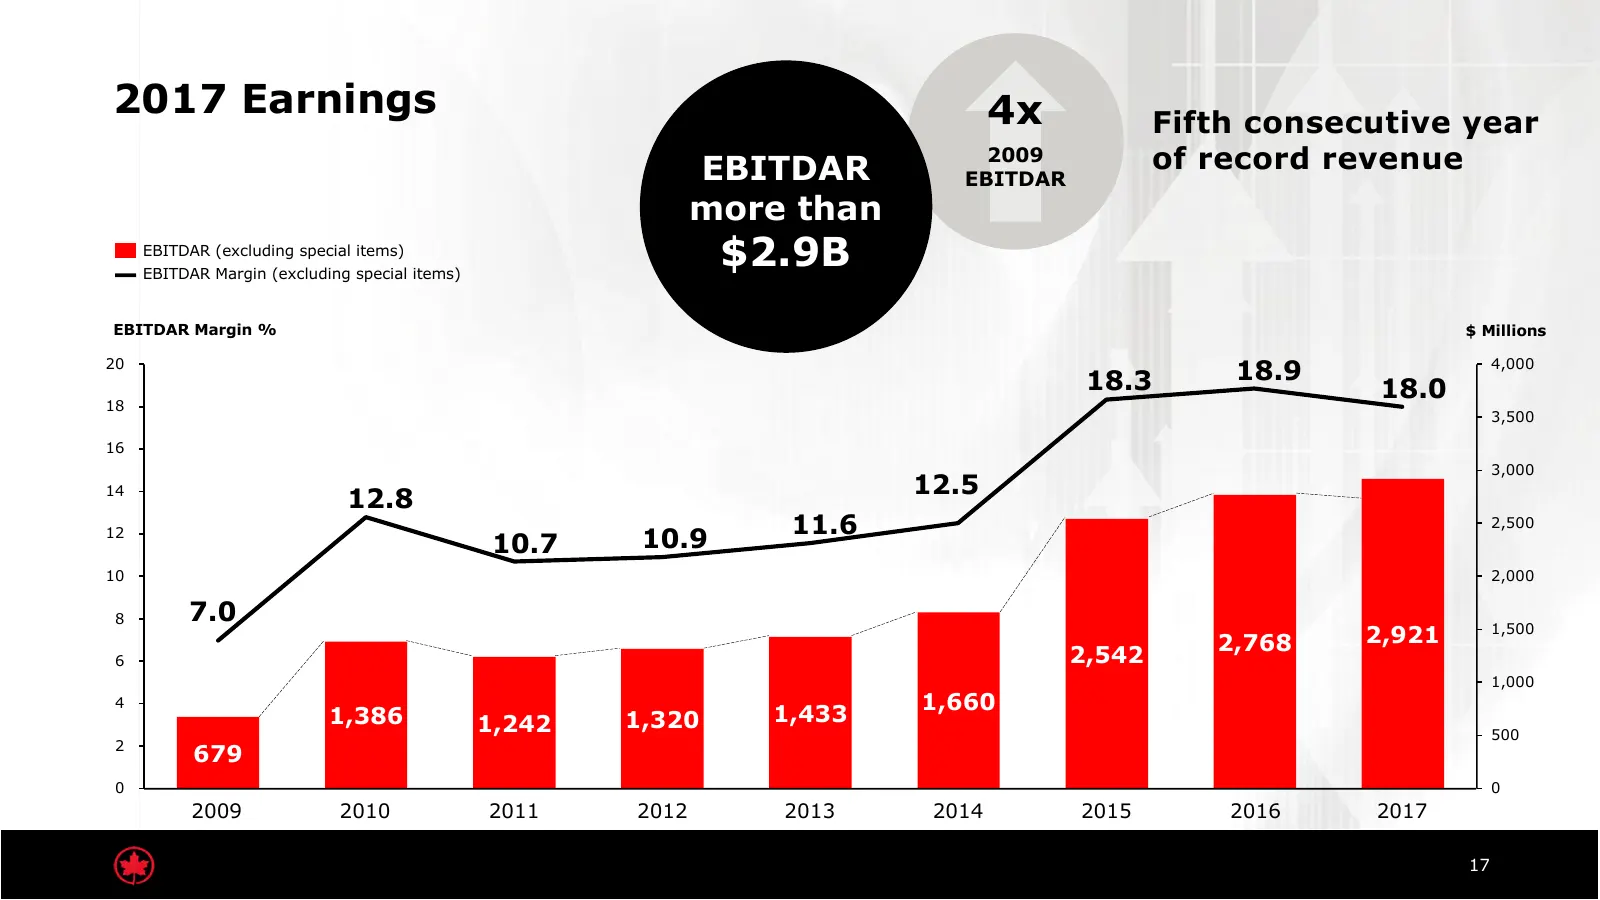
Slide 17: 2017 Earnings: EBITDAR $2.9B
2017 Earnings 4x Fifth consecutive year EBITDAR 2009 of record revenue EBITDAR more than EBITDAR (excluding special items) EBITDAR Margin (excluding special items) $2.9B EBITDAR Margin % $ Millions 20 18.3 18.9 4,000 18 18.0 3,500 16 3,000 12.5 14 12.8 11.6 2,500 12 10.7 10.9 10 2,000 8 7.0 1,500 2,
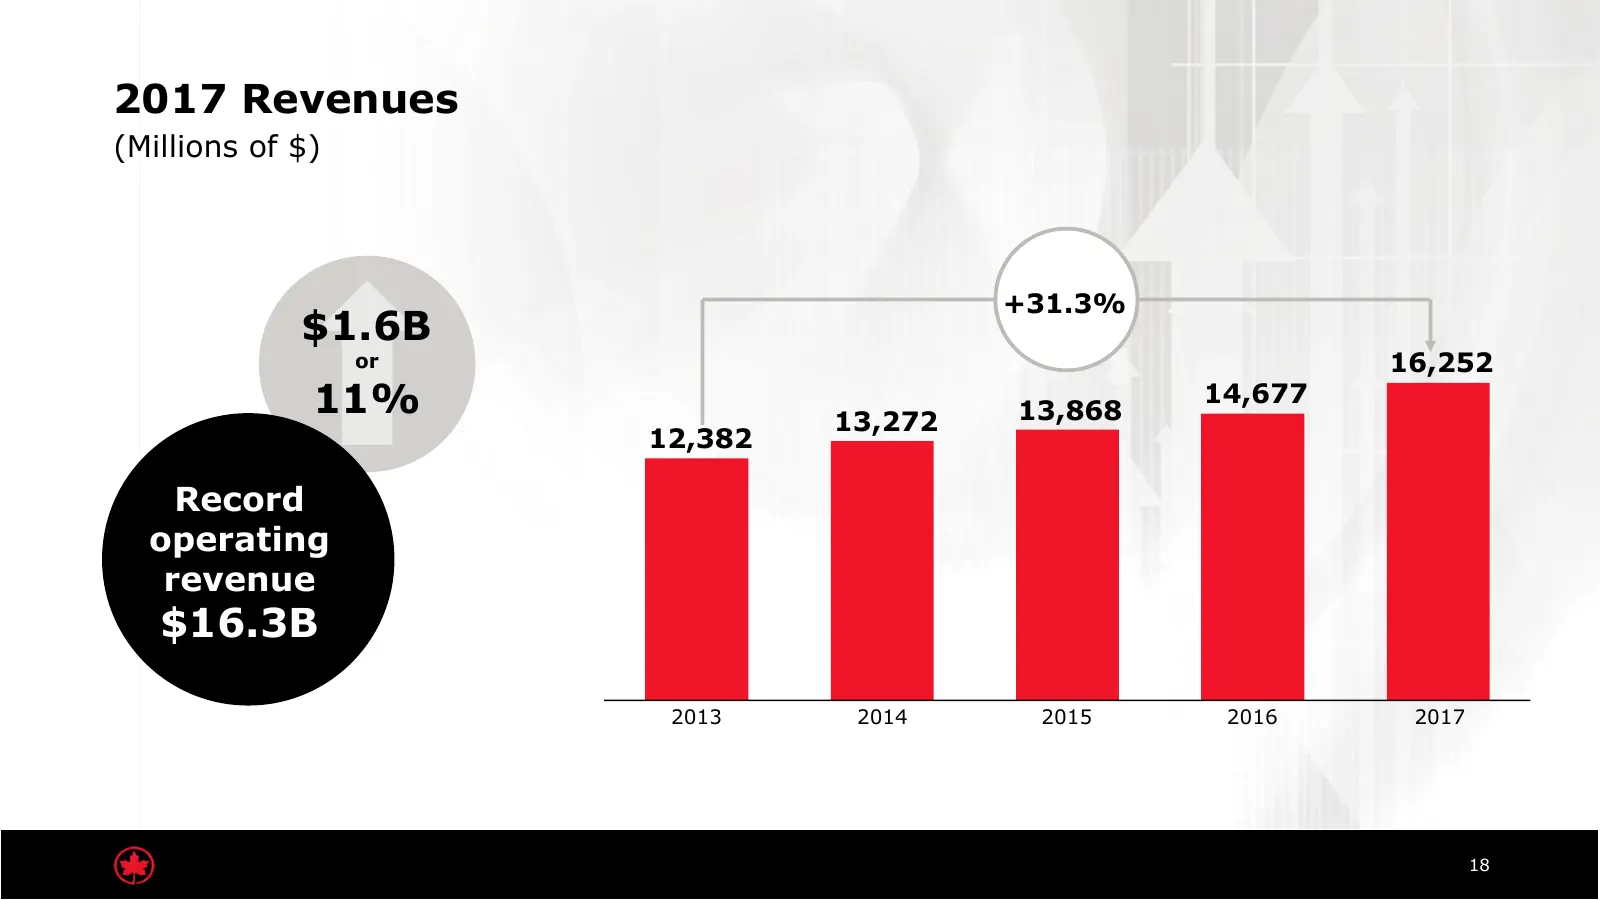
Slide 18: 2017 Revenues $16.3B
2017 Revenues (Millions of $) +31.3% $1.6B or 16,252 11% 13,272 13,868 14,677 12,382 Record operating revenue $16.3B 2013 2014 2015 2016 2017 18
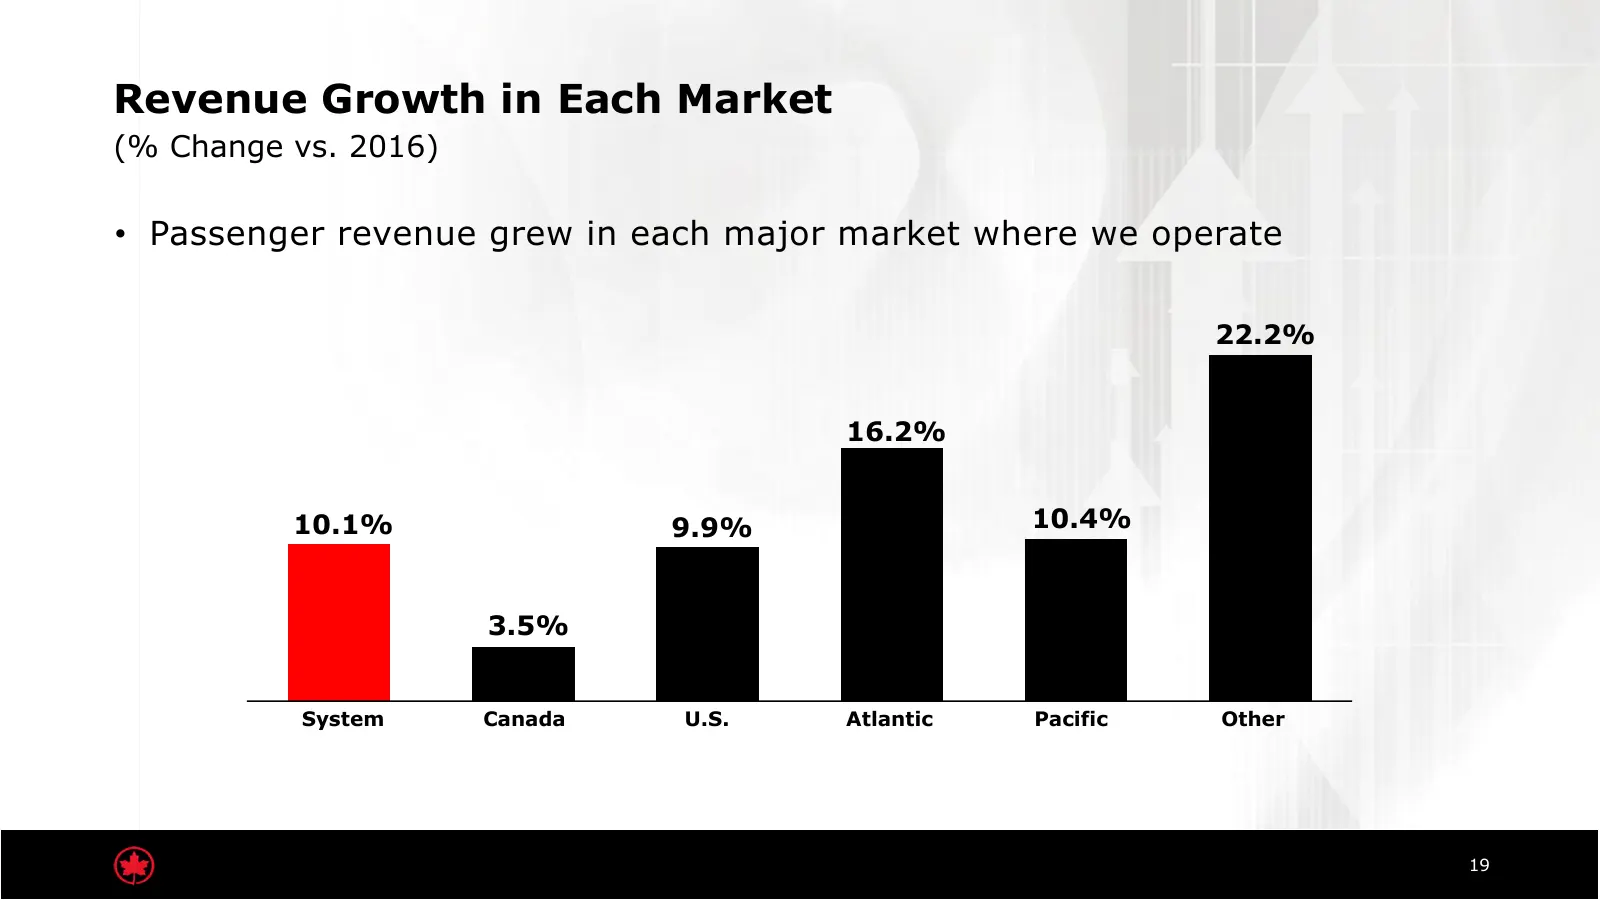
Slide 19: Revenue Growth in Each Market
Revenue Growth in Each Market (% Change vs. 2016) • Passenger revenue grew in each major market where we operate 22.2% 16.2% 10.1% 9.9% 10.4% 3.5% System Canada U.S. Atlantic Pacific Other 19
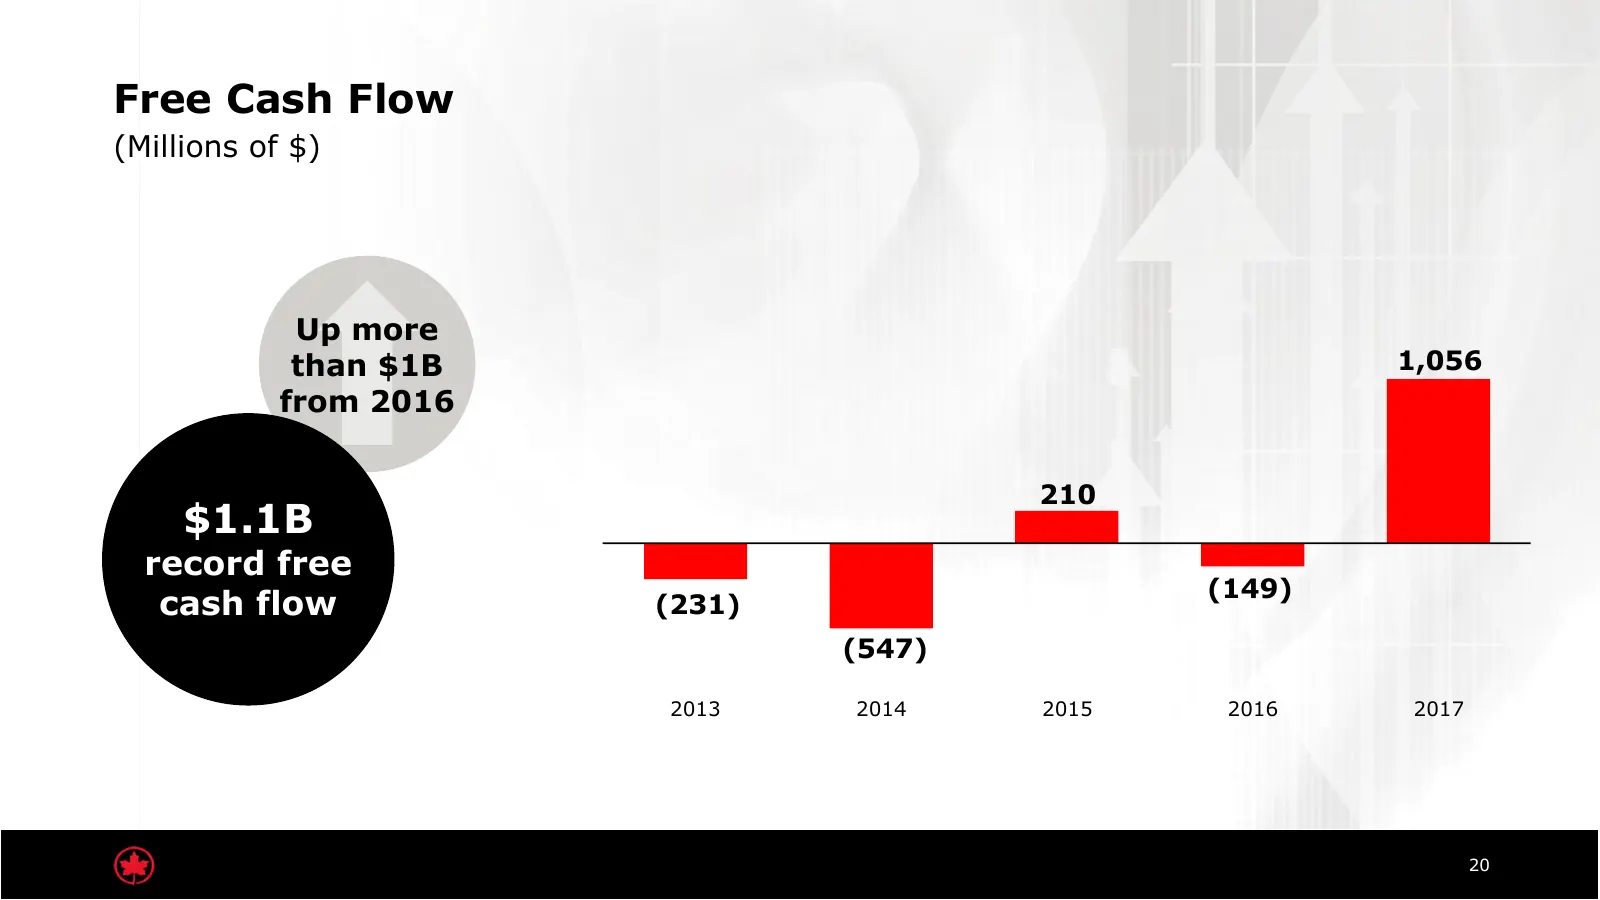
Slide 20: Free Cash Flow $1.1B
Free Cash Flow (Millions of $) Up more than $1B 1,056 from 2016 210 $1.1B record free (149) cash flow (231) (547) 2013 2014 2015 2016 2017 20
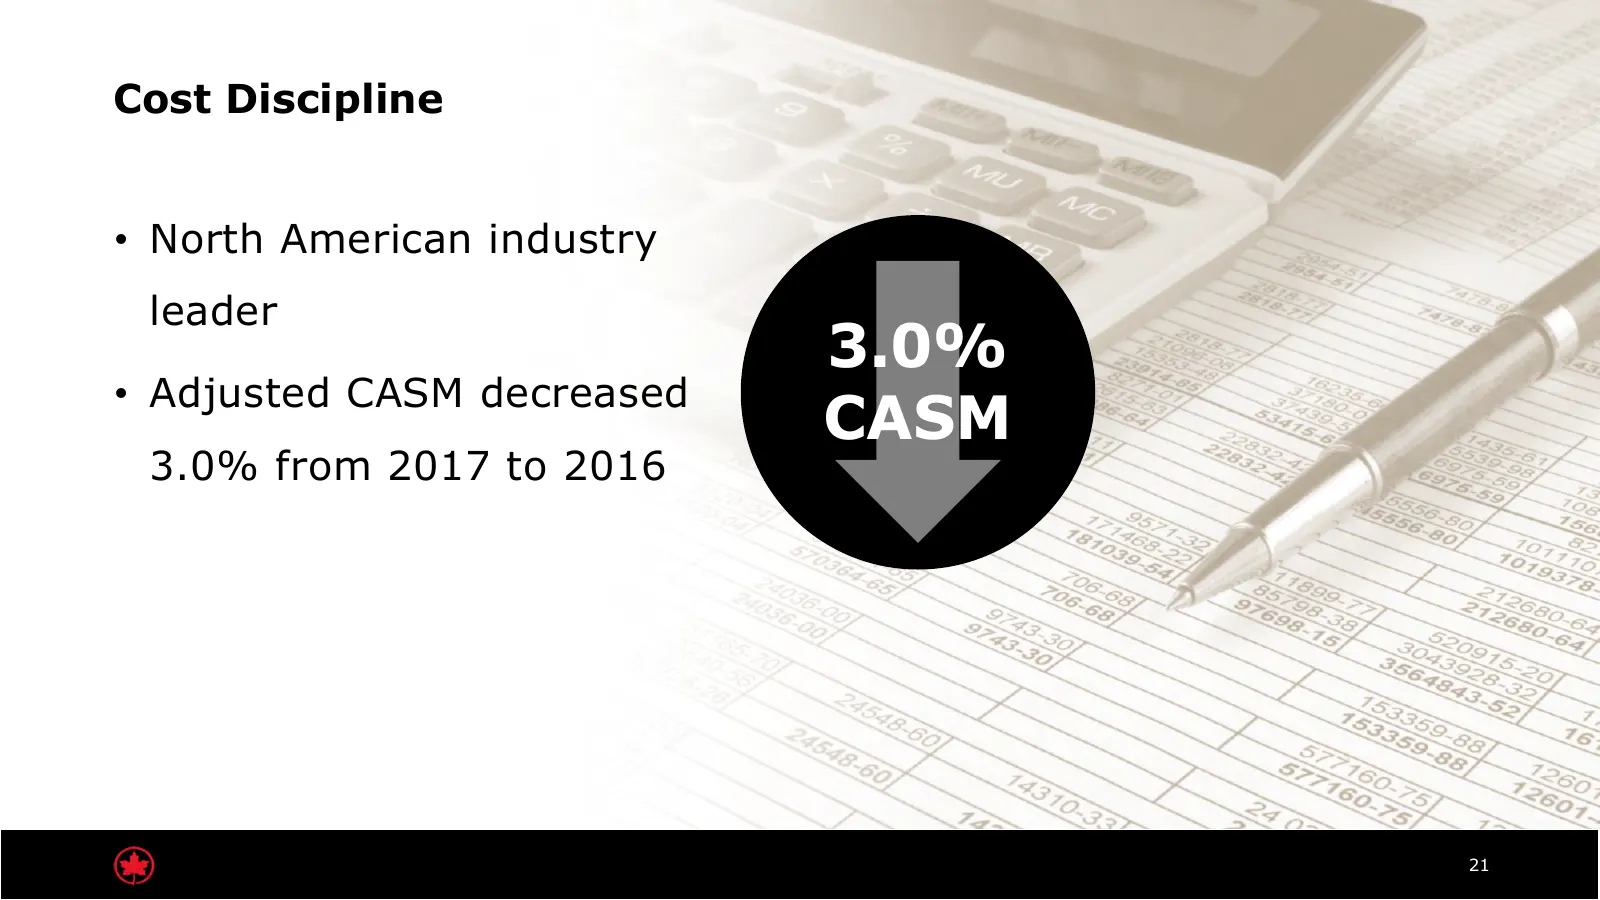
Slide 21: Cost Discipline
Cost Discipline • North American industry leader 3.0% • Adjusted CASM decreased CASM 3.0% from 2017 to 2016 21
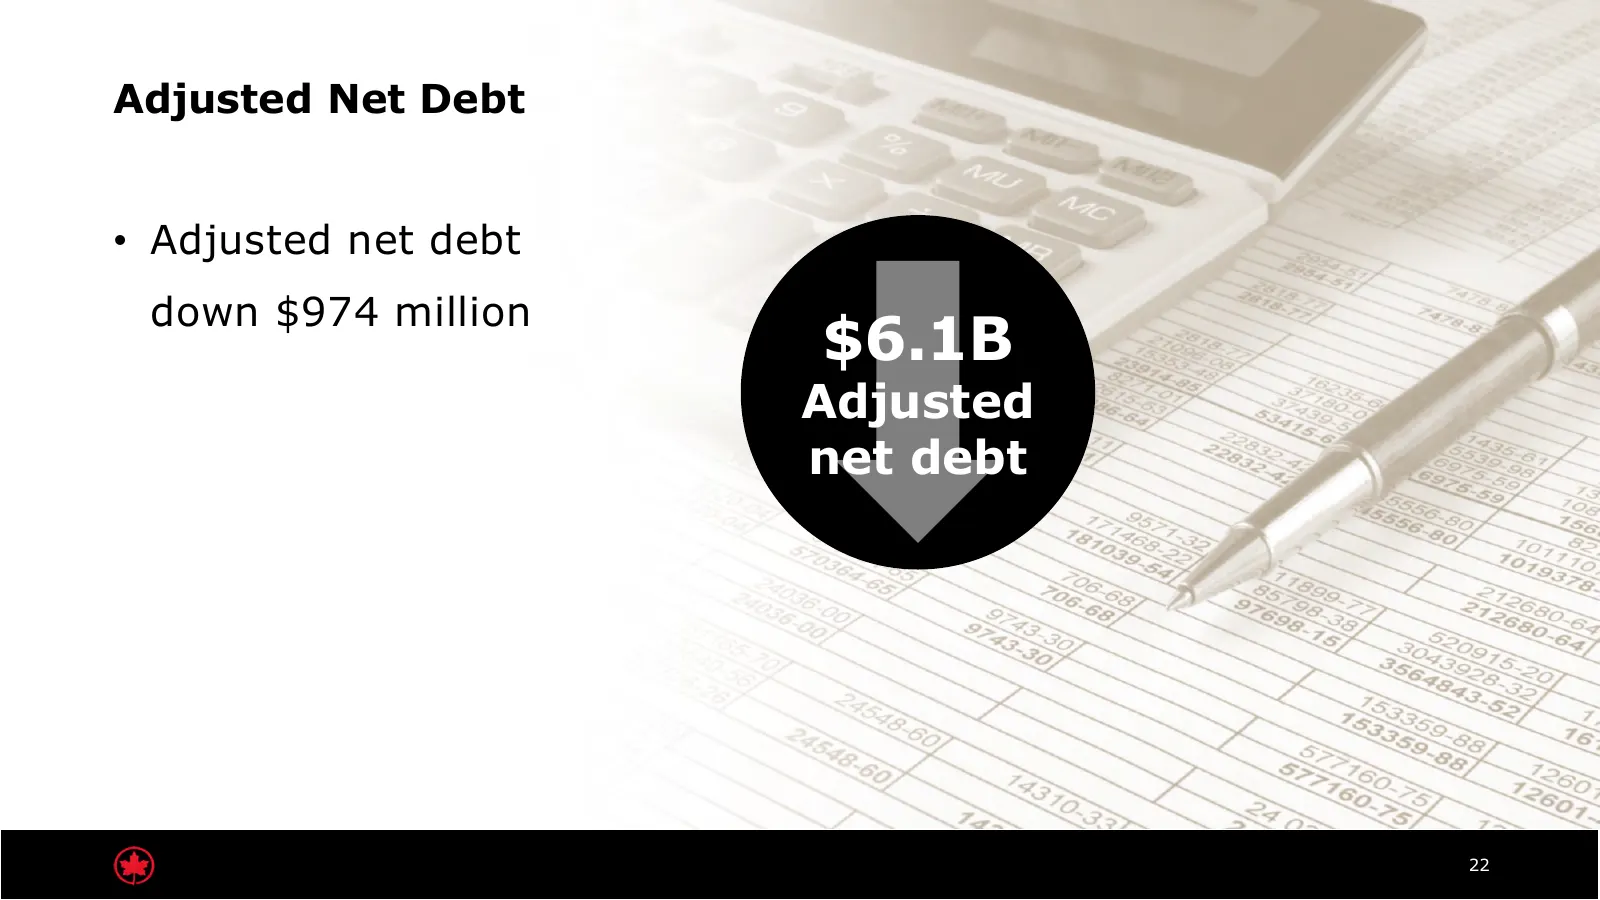
Slide 22: Adjusted Net Debt $6.1B
Adjusted Net Debt • Adjusted net debt down $974 million $6.1B Adjusted net debt 22
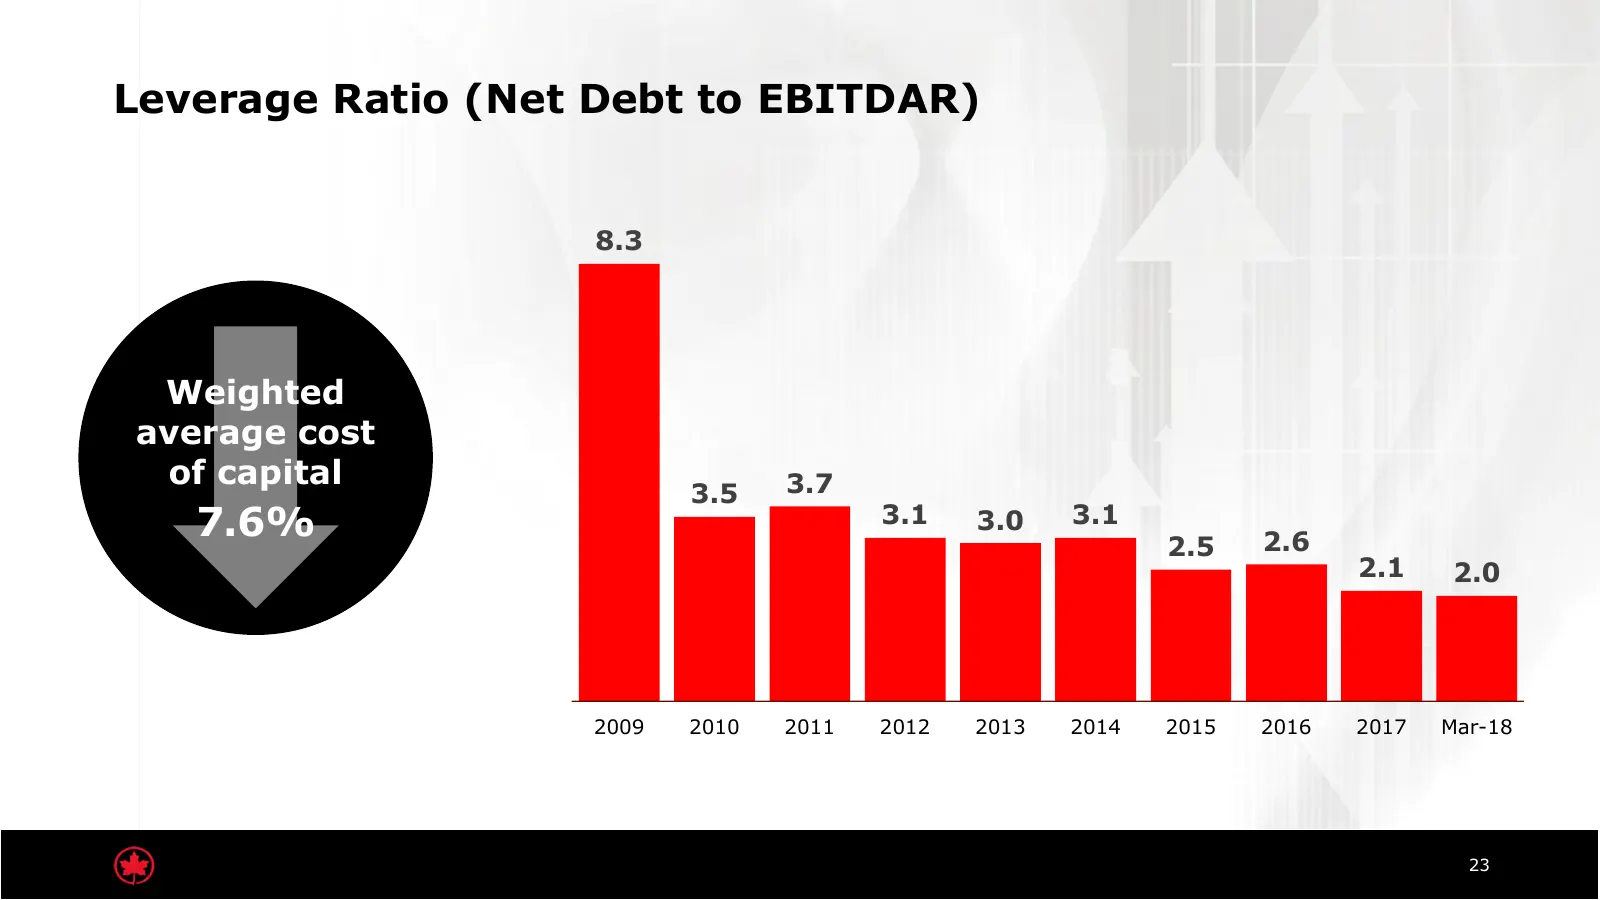
Slide 23: Leverage Ratio (Net Debt to EBITDAR)
Leverage Ratio (Net Debt to EBITDAR) 8.3 Weighted average cost of capital 3.7 3.5 7.6% 3.1 3.0 3.1 2.6 2.5 2.1 2.0 2009 2010 2011 2012 2013 2014 2015 2016 2017 Mar-18 23
Slide 24: Air Canada Rouge
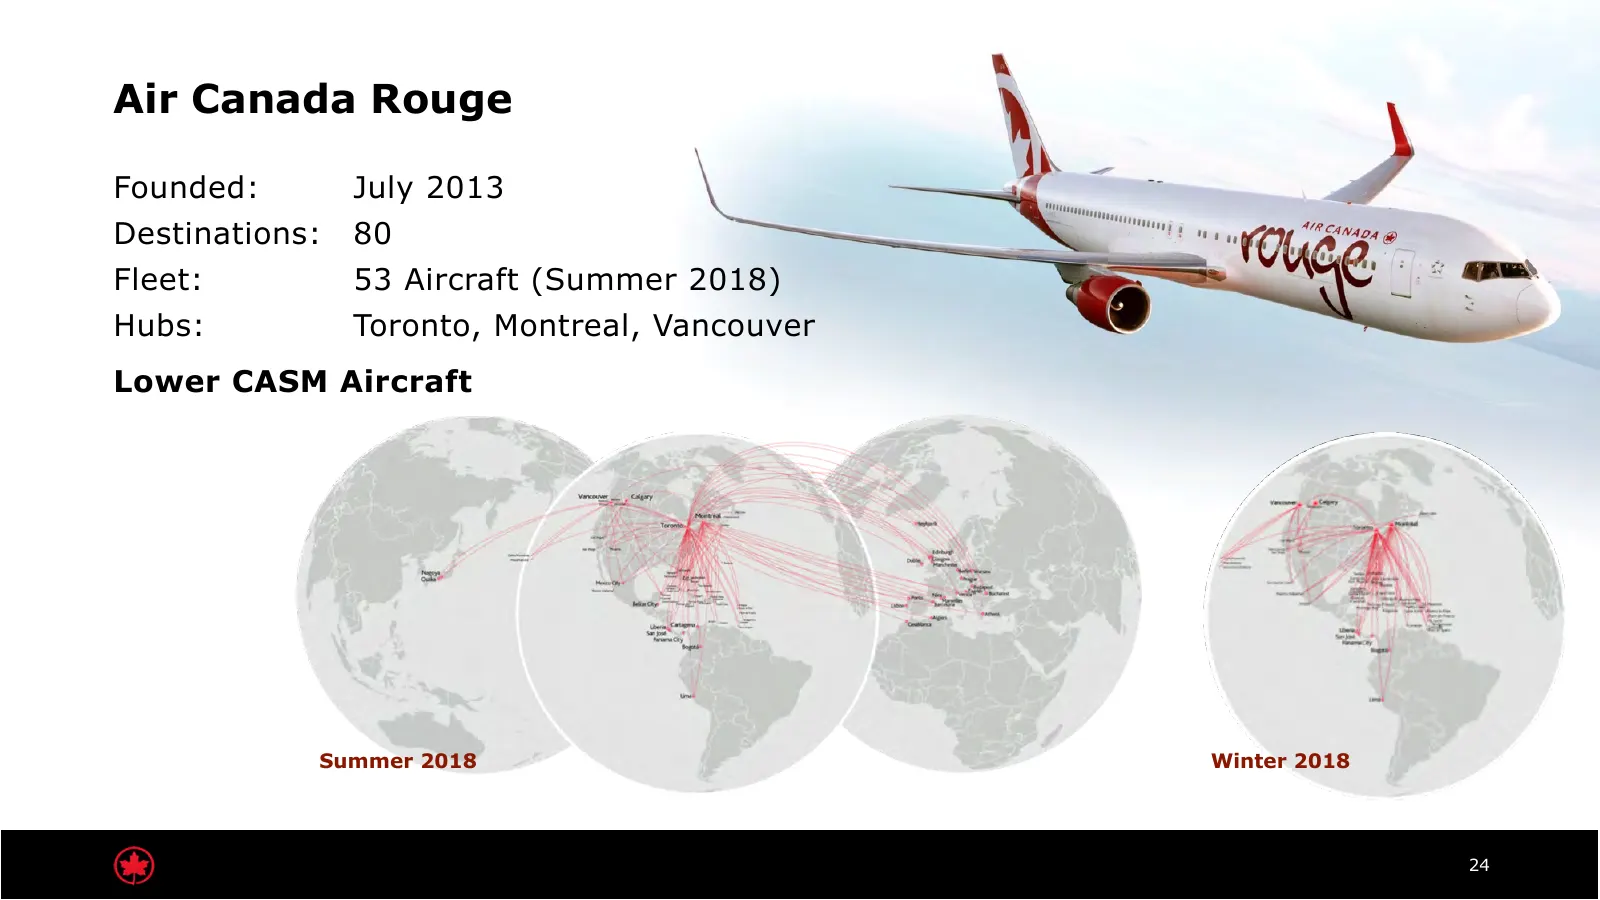
Air Canada Rouge Founded: July 2013 Destinations: 80 Fleet: 53 Aircraft (Summer 2018) Hubs: Toronto, Montreal, Vancouver Lower CASM Aircraft Summer 2018 Winter 2018 24
Slide 25: Passenger Loads
Passenger Loads Record Average 48.1M load factor passengers 82.3% 50% more than 2009 25
Slide 26: Delivering Best Airline in North America
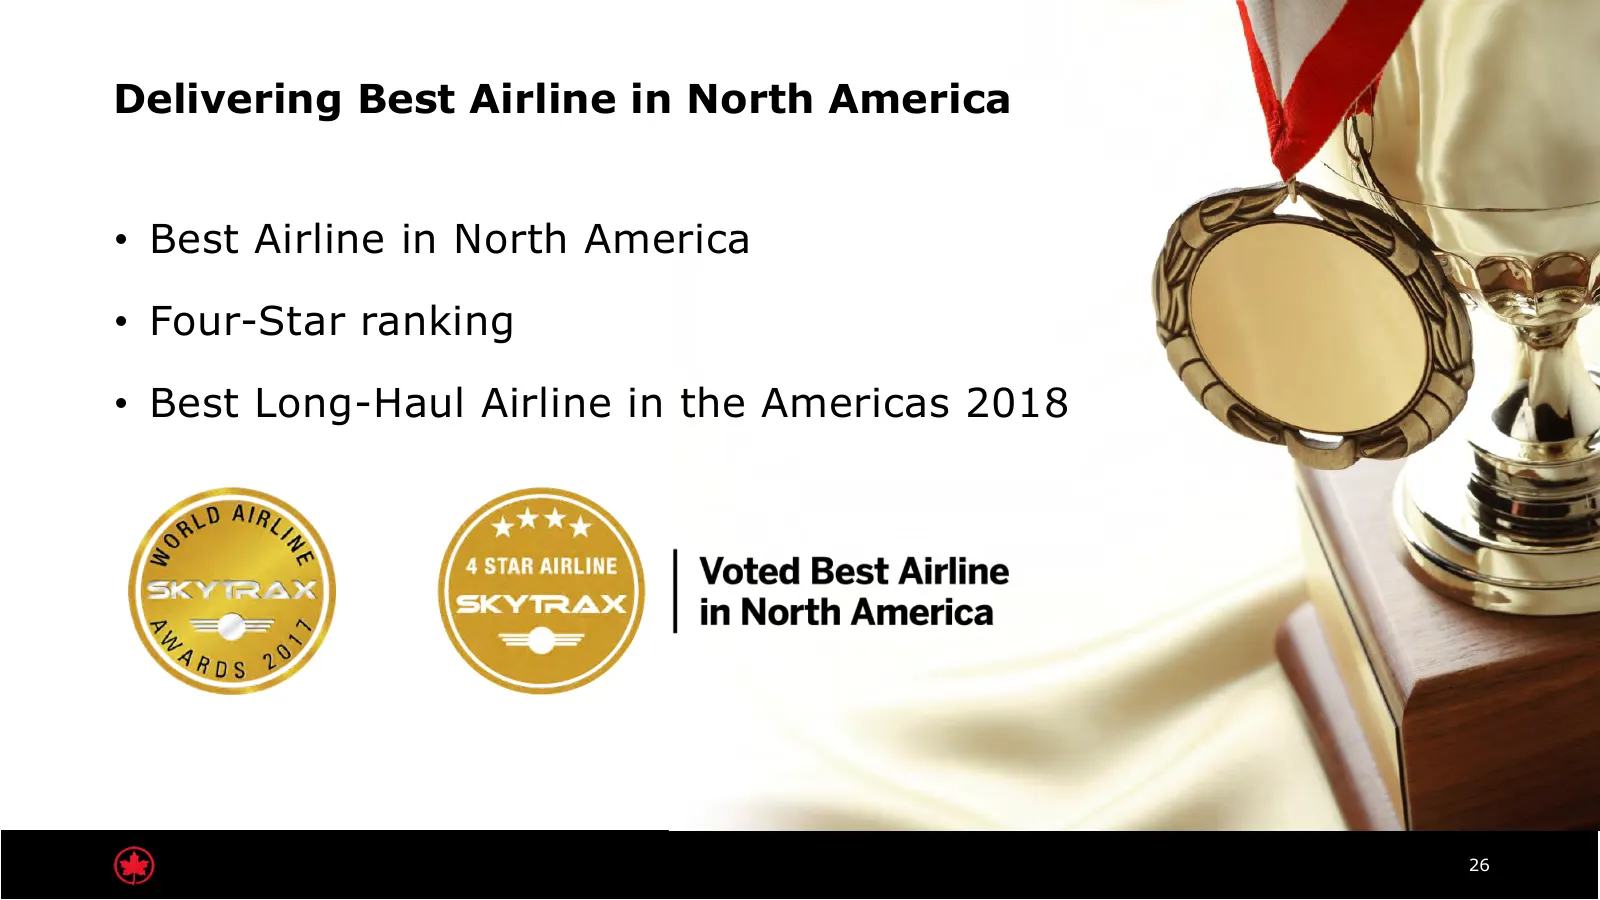
Delivering Best Airline in North America • Best Airline in North America • Four-Star ranking • Best Long-Haul Airline in the Americas 2018 26
Slide 27: Share Price Appreciation
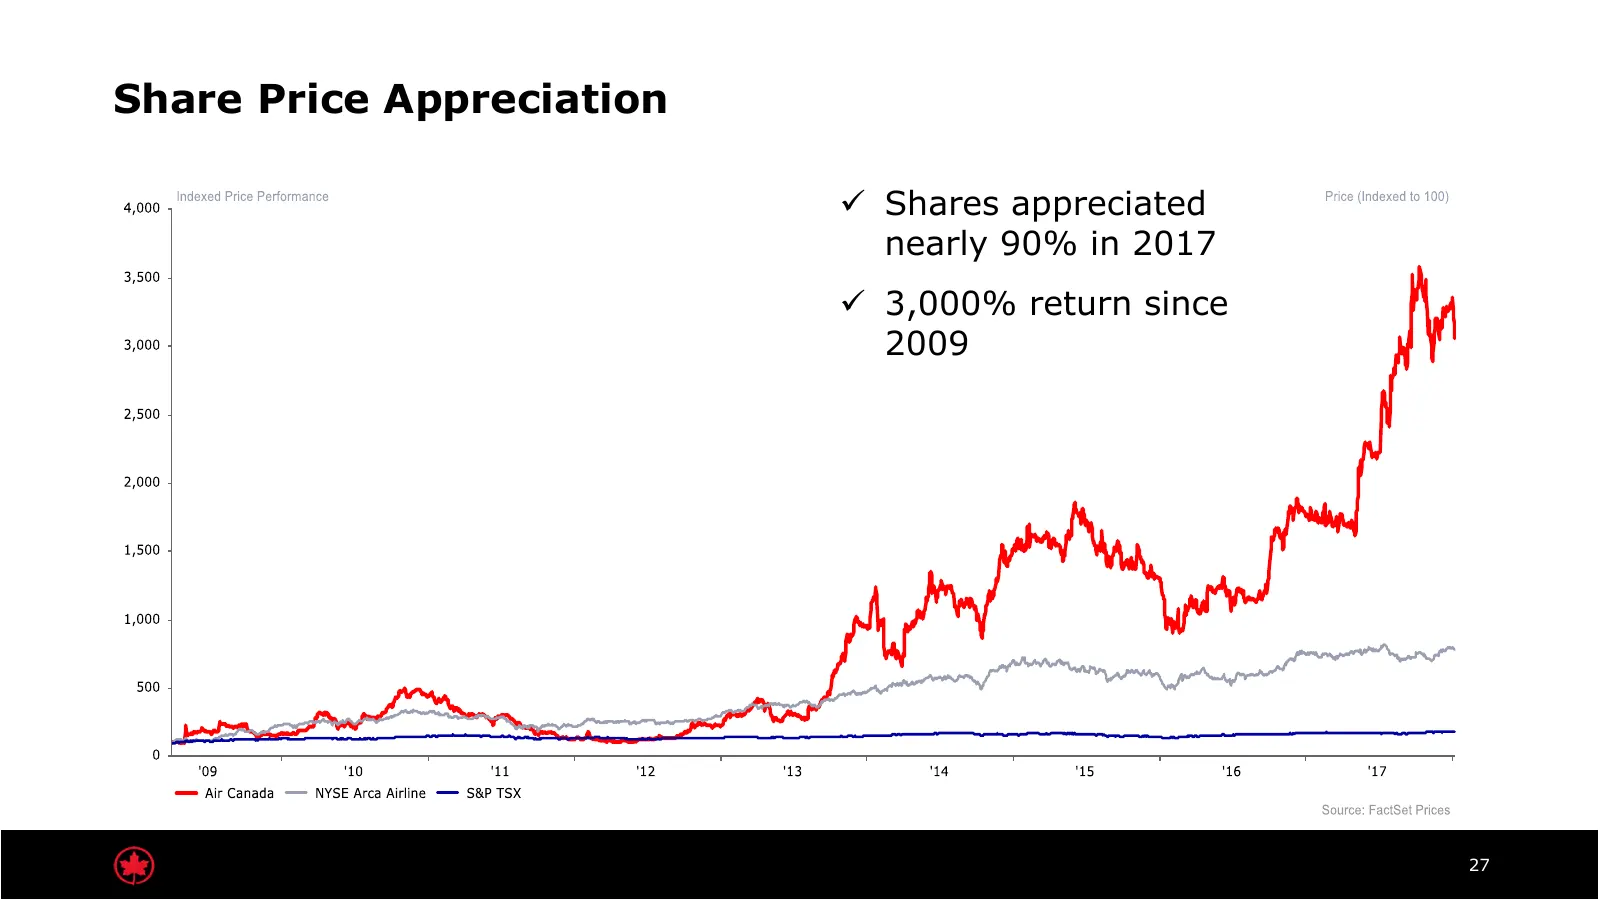
Share Price Appreciation ü Shares appreciated nearly 90% in 2017 ü 3,000% return since 2009 27
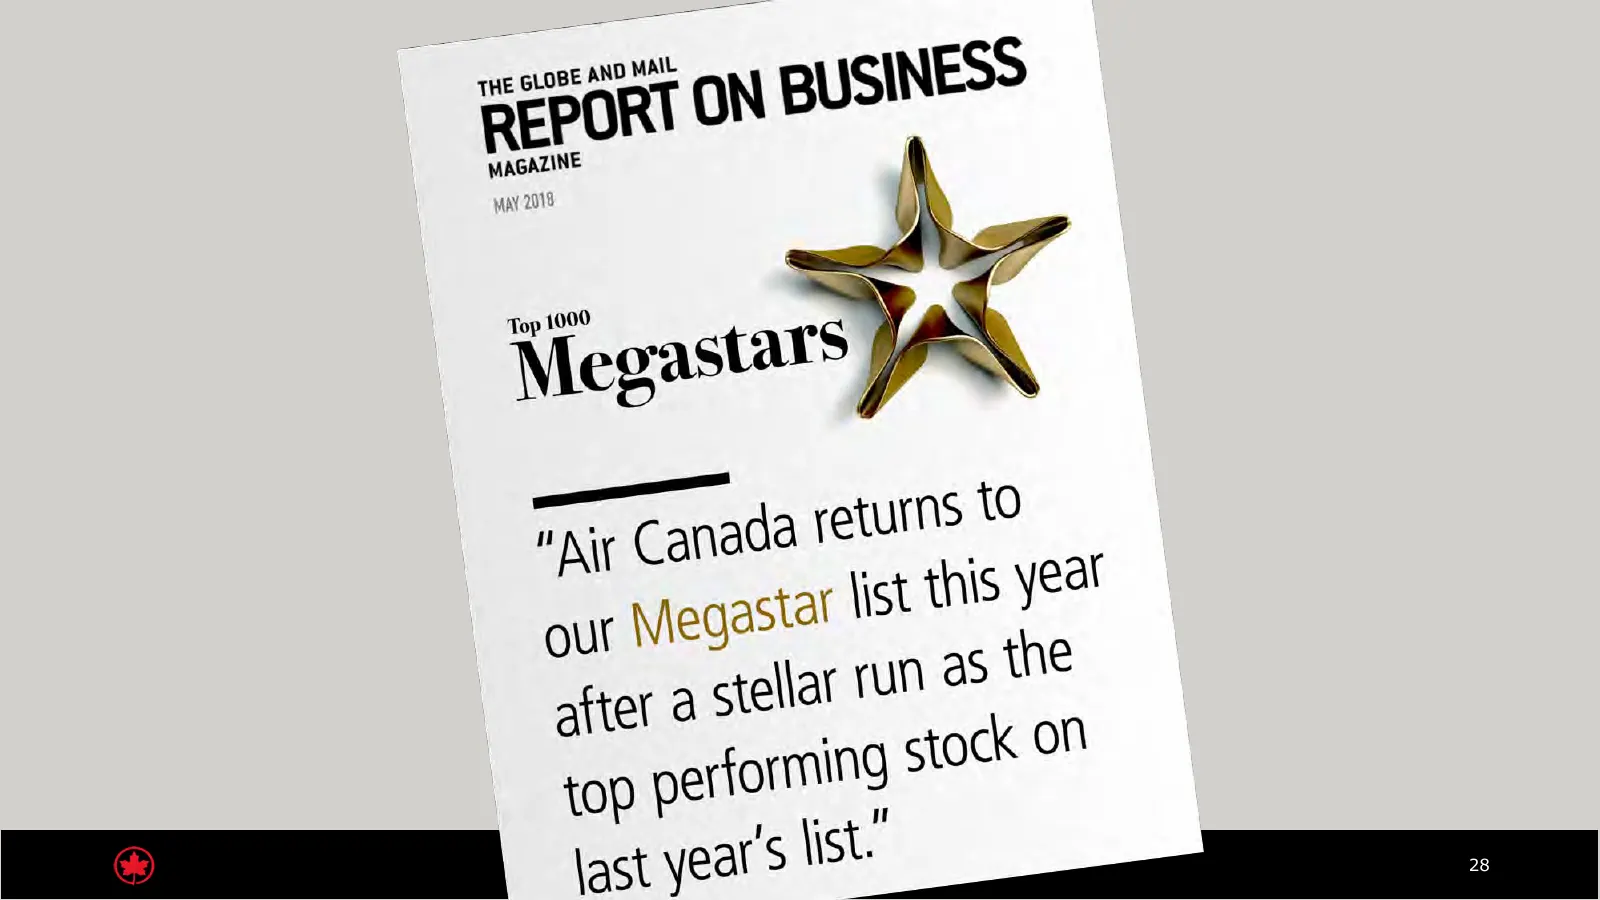
Slide 28: Top performing stock
top performing stock on eo] last yeat’S list.
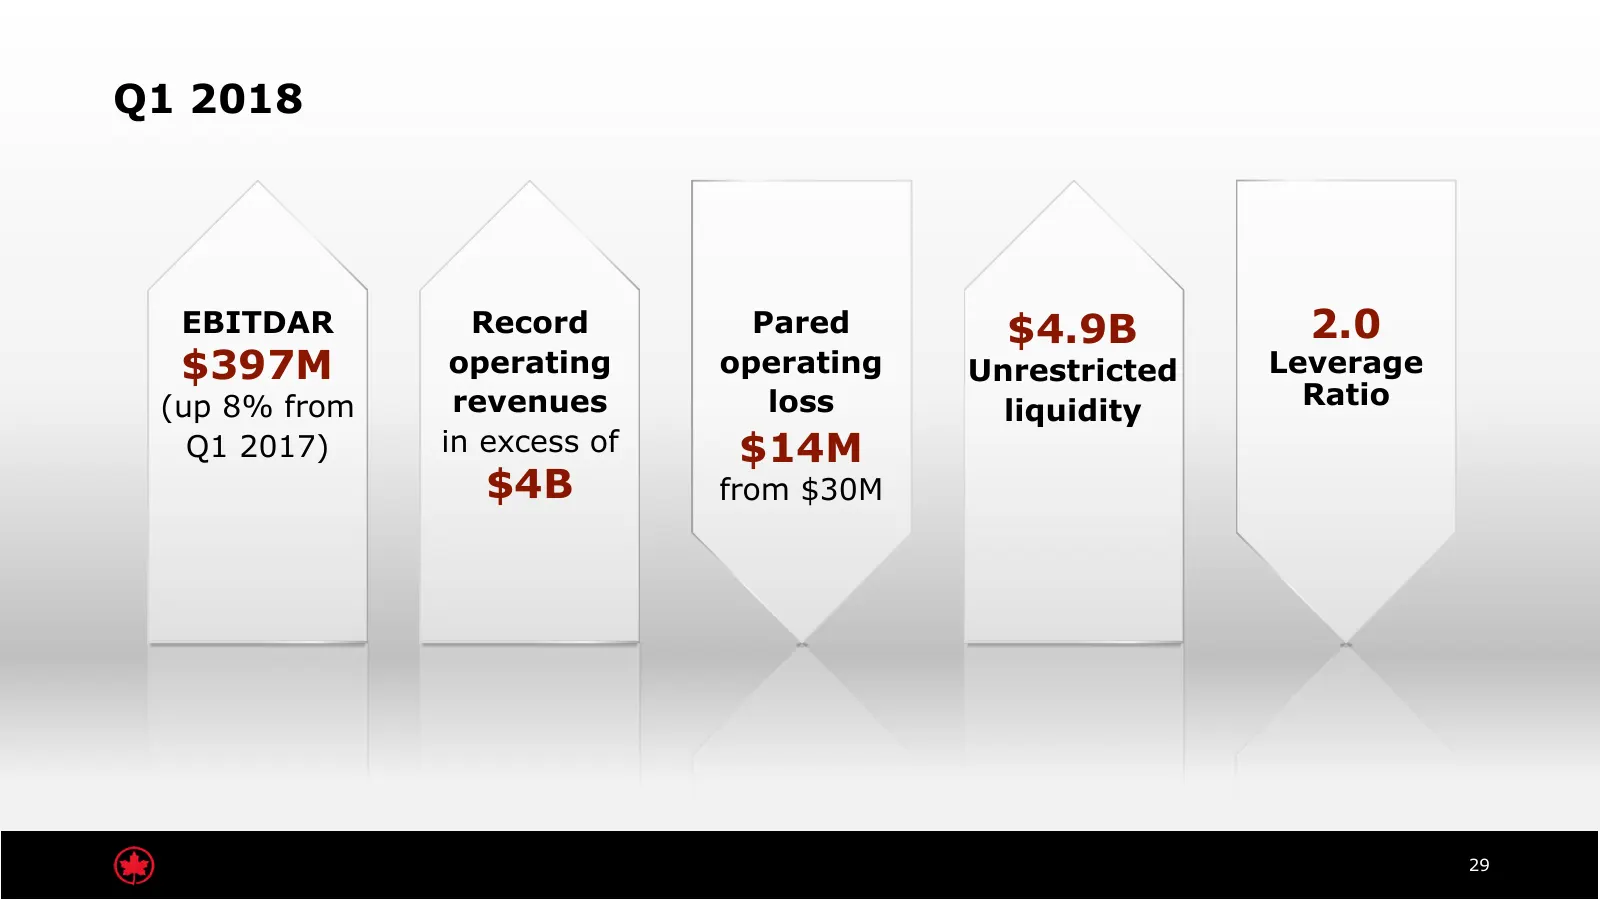
Slide 29: Q1 2018
Q1 2018 EBITDAR Record Pared $4.9B 2.0 $397M operating operating Unrestricted Leverage (up 8% from revenues loss Ratio liquidity Q1 2017) in excess of $14M $4B from $30M 29
Slide 30: Start-up Culture
Start-up Culture Air Canada – a growth-orientated global champion, amongst the best on the planet 30
Slide 31: Strategy
Strategy • Selectively and profitably compete for global traffic flows • Exploit our inherent competitive advantages 31
Slide 32: Cost Transformation Programs (CTP)
Cost Transformation Programs (CTP) • 2009 CTP $500M • 2018-2019 CTP $250M 32
Slide 33: 2017 in Review
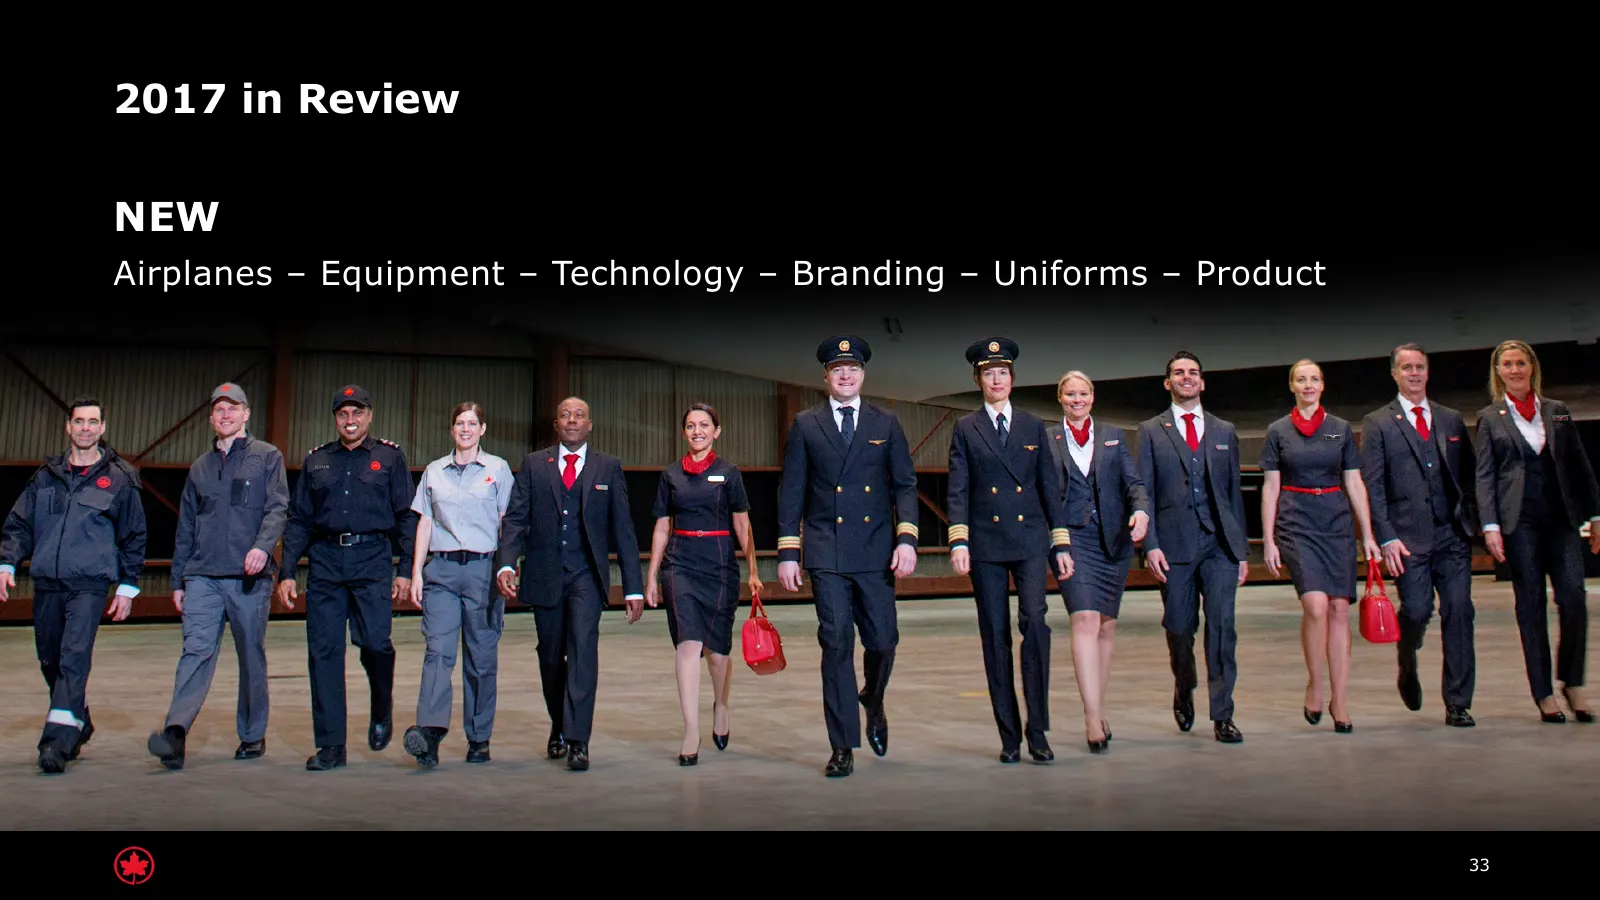
2017 in Review NEW Airplanes – Equipment – Technology – Branding – Uniforms – Product 33
Slide 34: Passenger Service System (PSS) Program
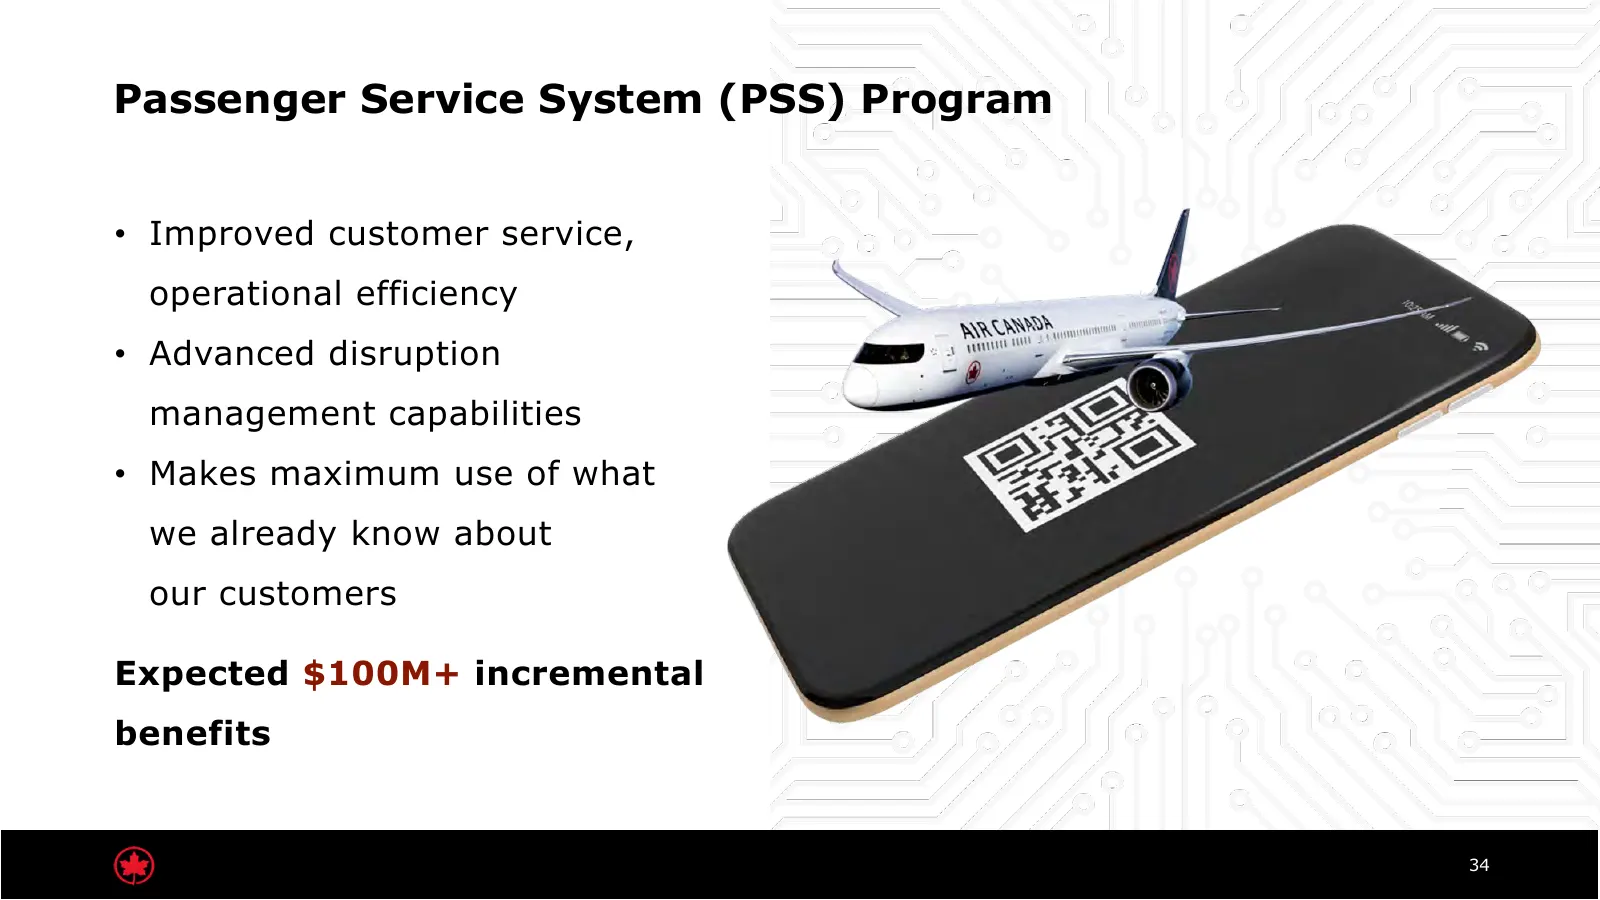
Passenger Service System (PSS) Program • Improved customer service, operational efficiency • Advanced disruption management capabilities • Makes maximum use of what we already know about our customers Expected $100M+ incremental benefits 34
Slide 35: Aircraft re-fleeting
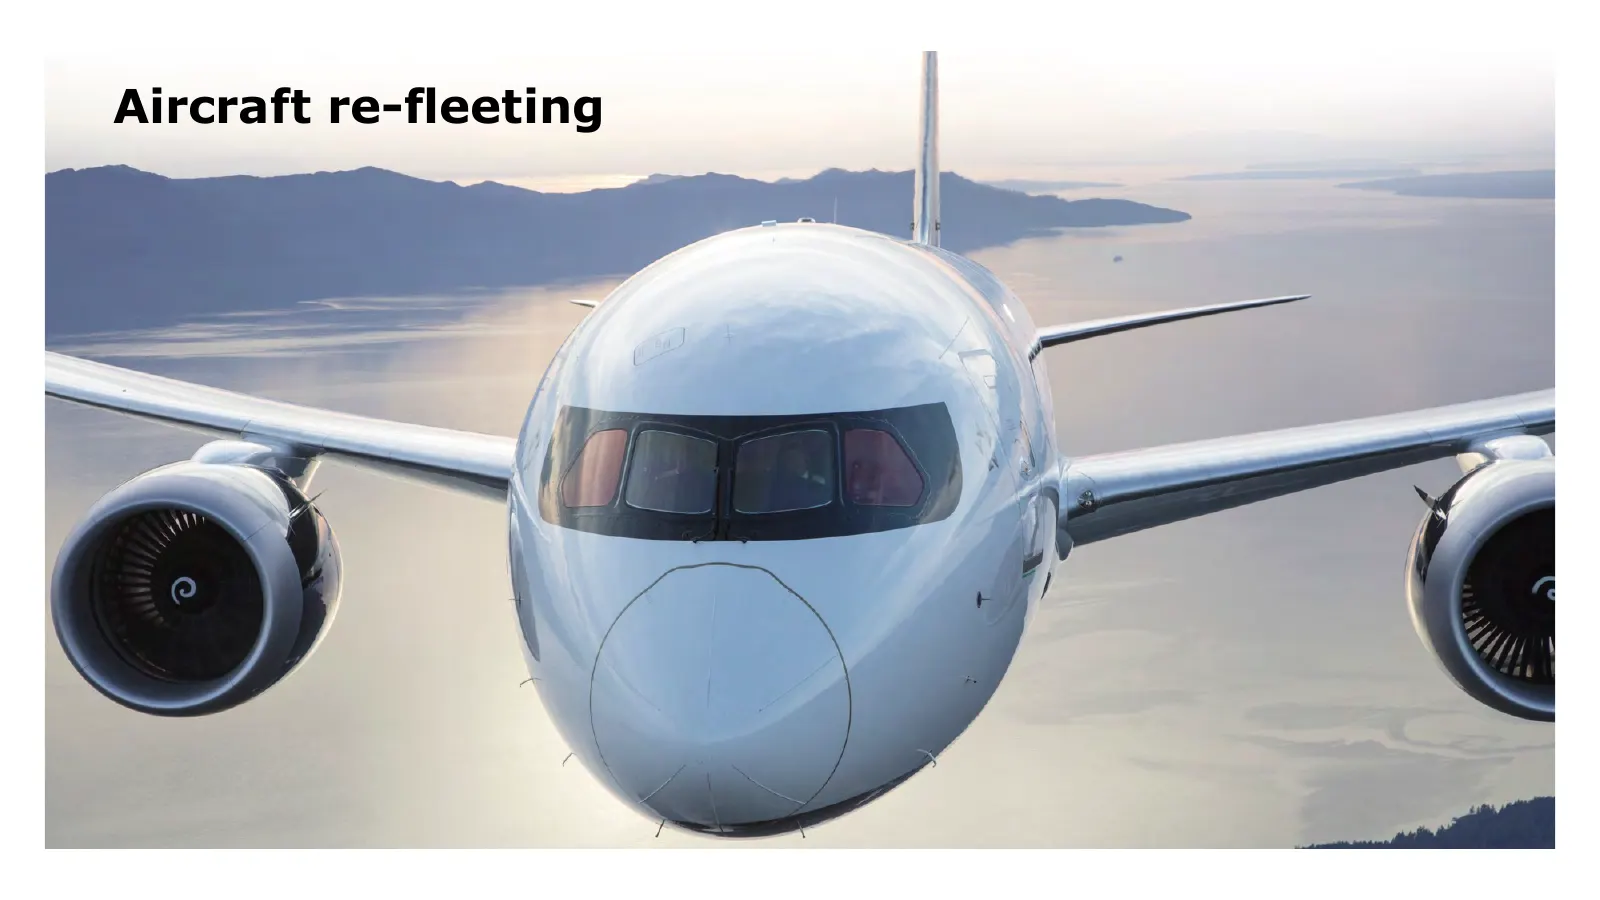
Aircraft re-fleeting 35
Slide 36: Aircraft re-fleeting
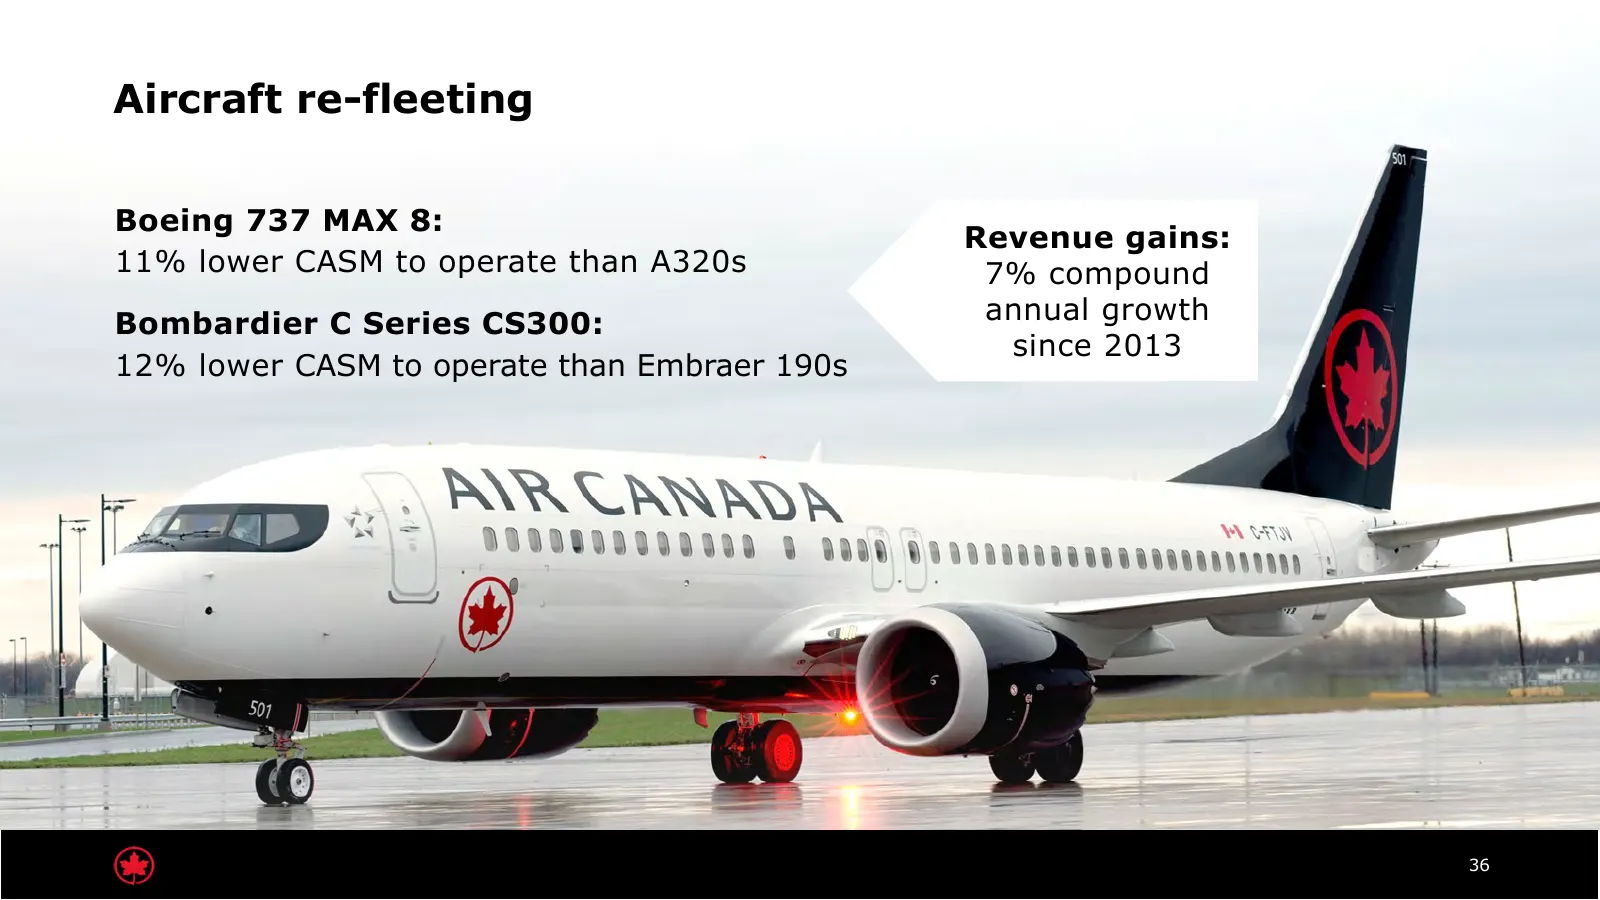
Aircraft re-fleeting Boeing 737 MAX 8: Revenue gains: 11% lower CASM to operate than A320s 7% compound Bombardier C Series CS300: annual growth since 2013 12% lower CASM to operate than Embraer 190s 36
Slide 37: Record Revenues in 2017
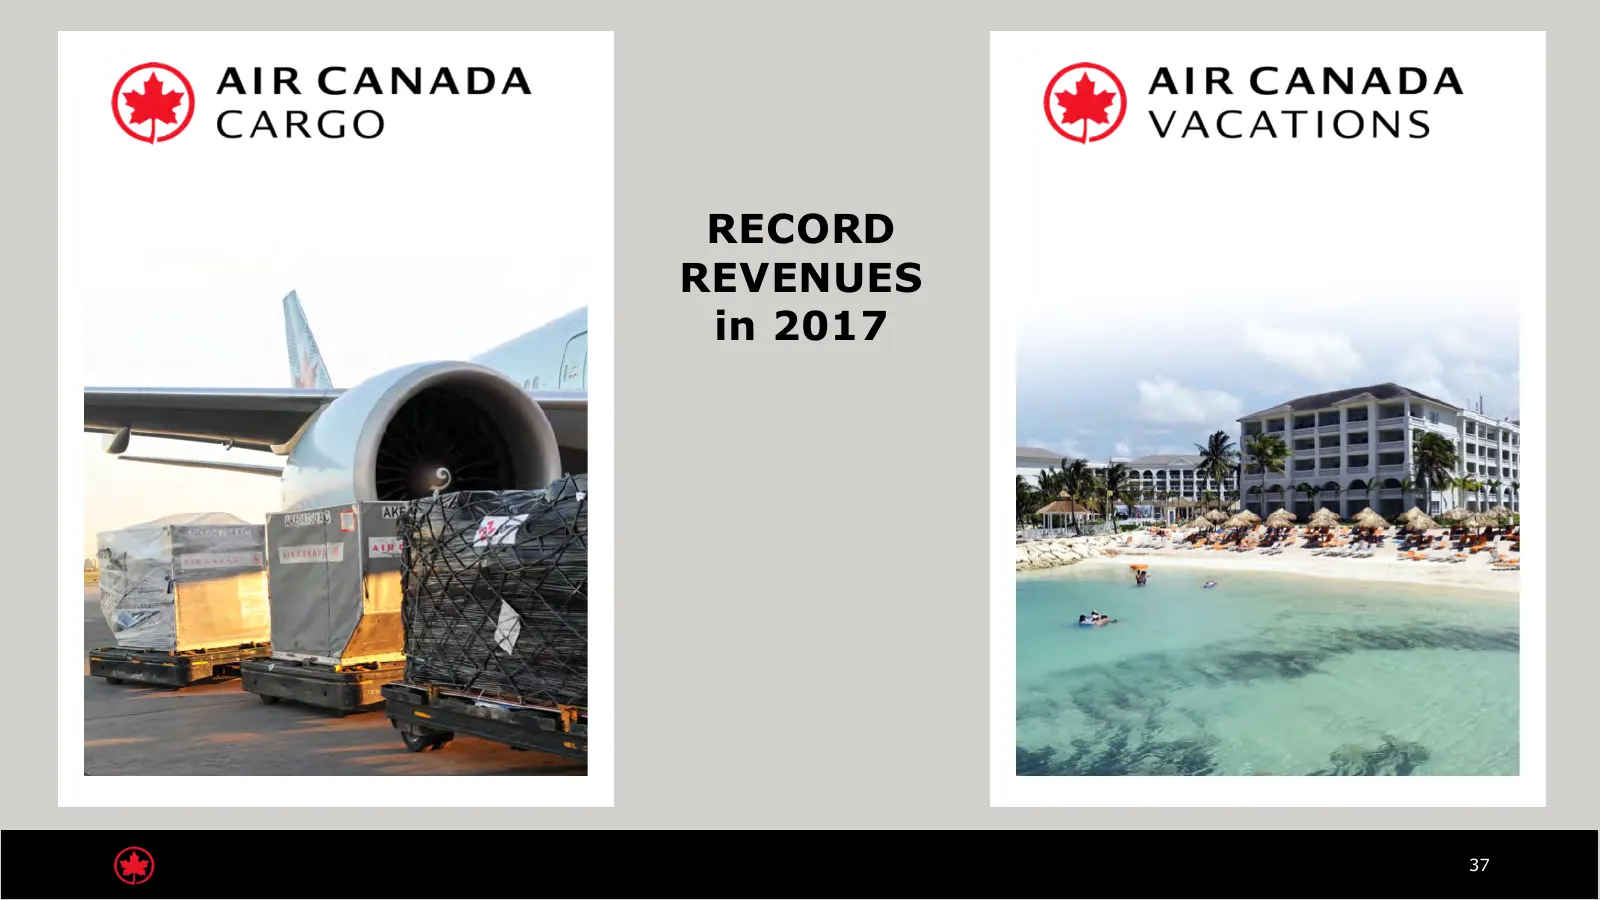
AIR CANADA AIR CANADA CARGO VACATIONS RECORD REVENUES Z in 2017
Slide 38: Our Path to the New Loyalty Program in 2020
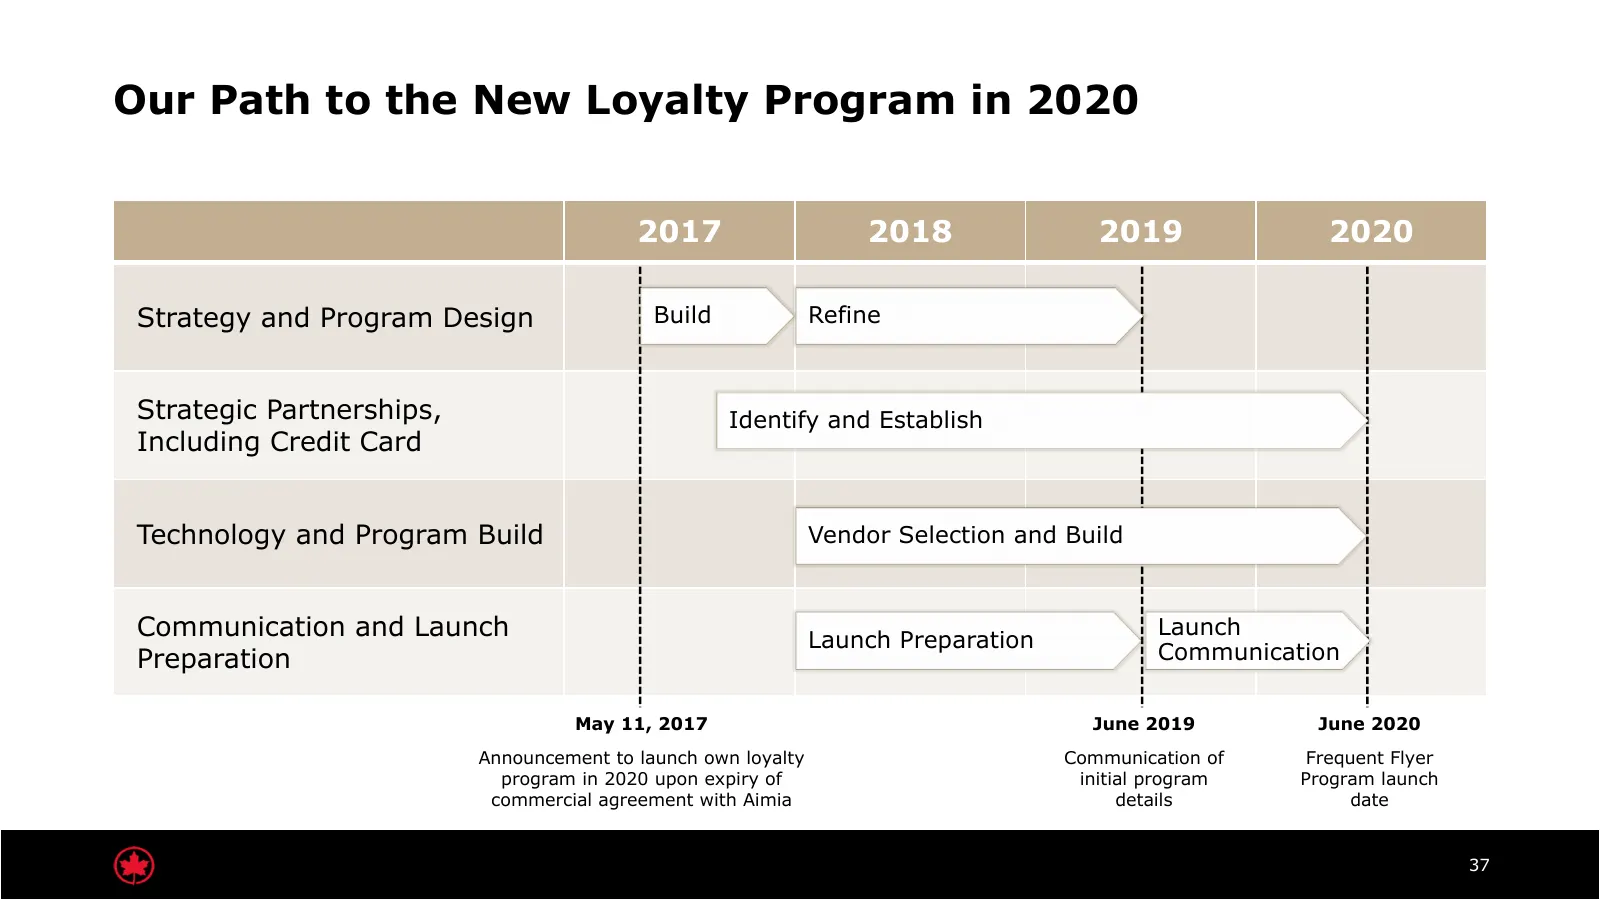
Our Path to the New Loyalty Program in 2020 2017 2018 2019 2020 Strategy and Program Design Build Refine Strategic Partnerships, Identify and Establish Including Credit Card Technology and Program Build Vendor Selection and Build Communication and Launch Launch Preparation Launch Preparation Communi
Slide 39: International Growth
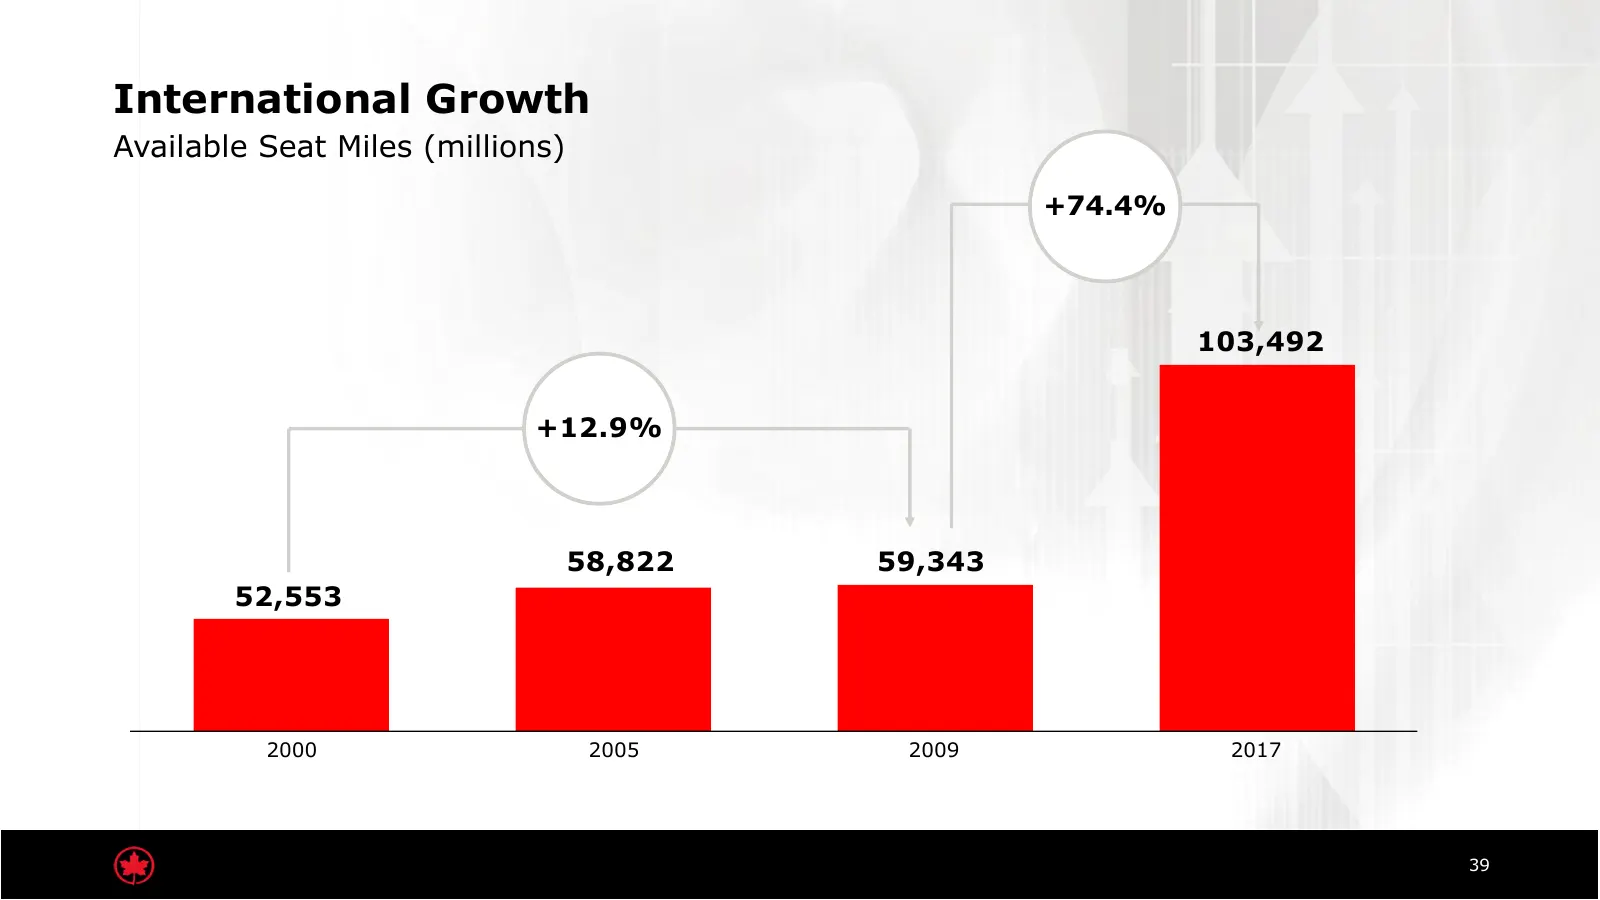
International Growth Available Seat Miles (millions) +74.4% 103,492 +12.9% 58,822 59,343 52,553 2000 2005 2009 2017 39
Slide 40: Expanding our Reach
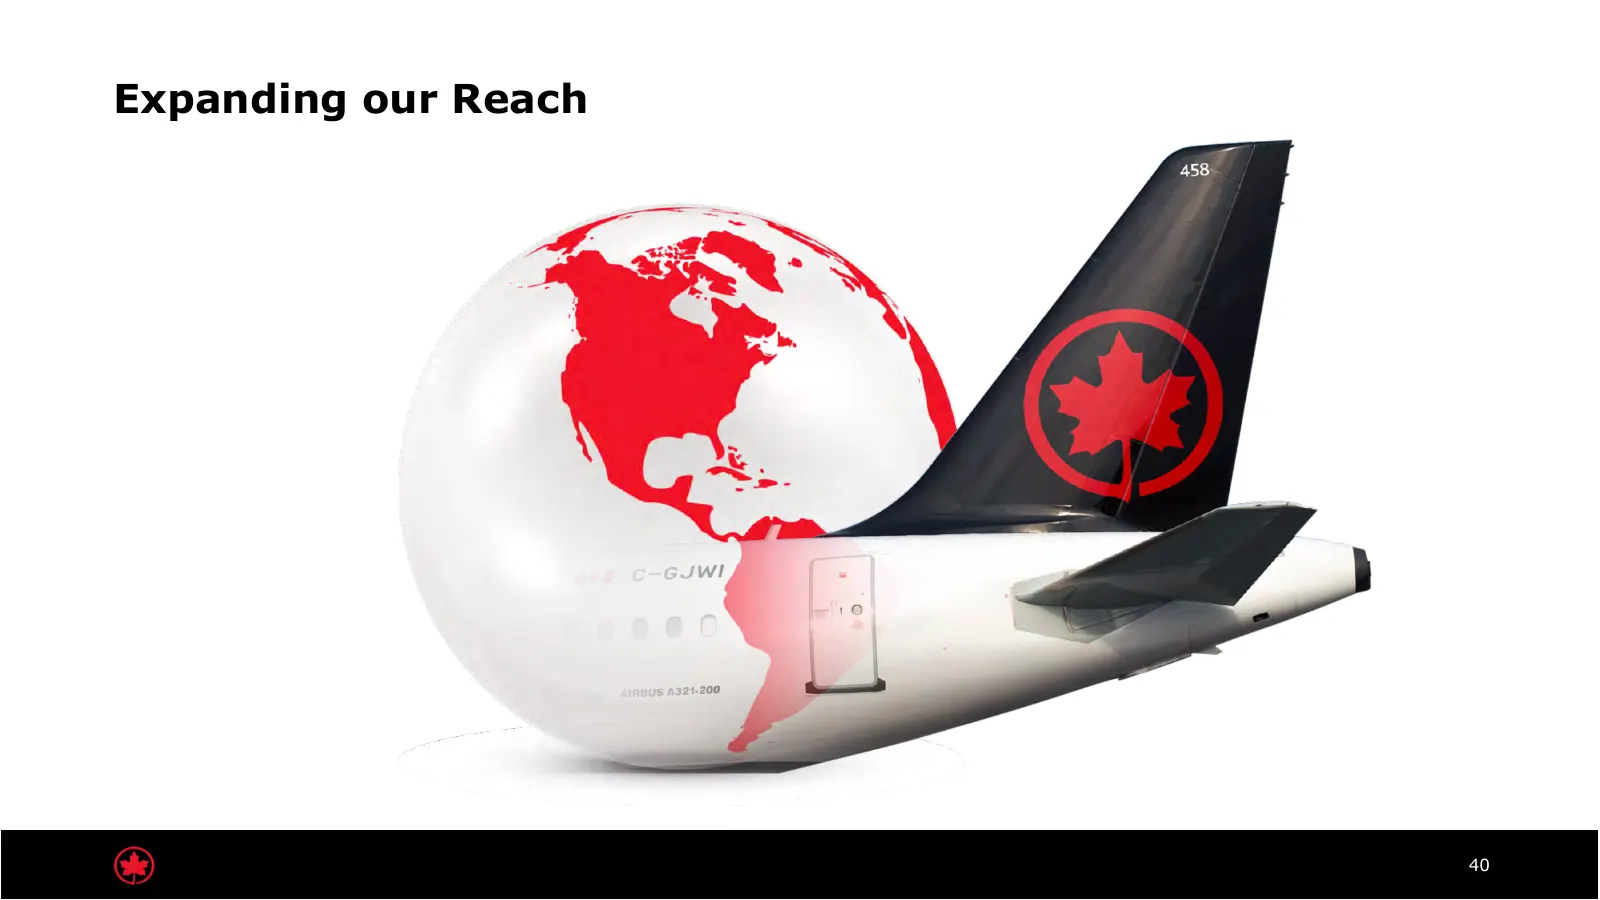
Expanding our Reach 40
Slide 41: 20% Increase in International Connecting Traffic Since 2016
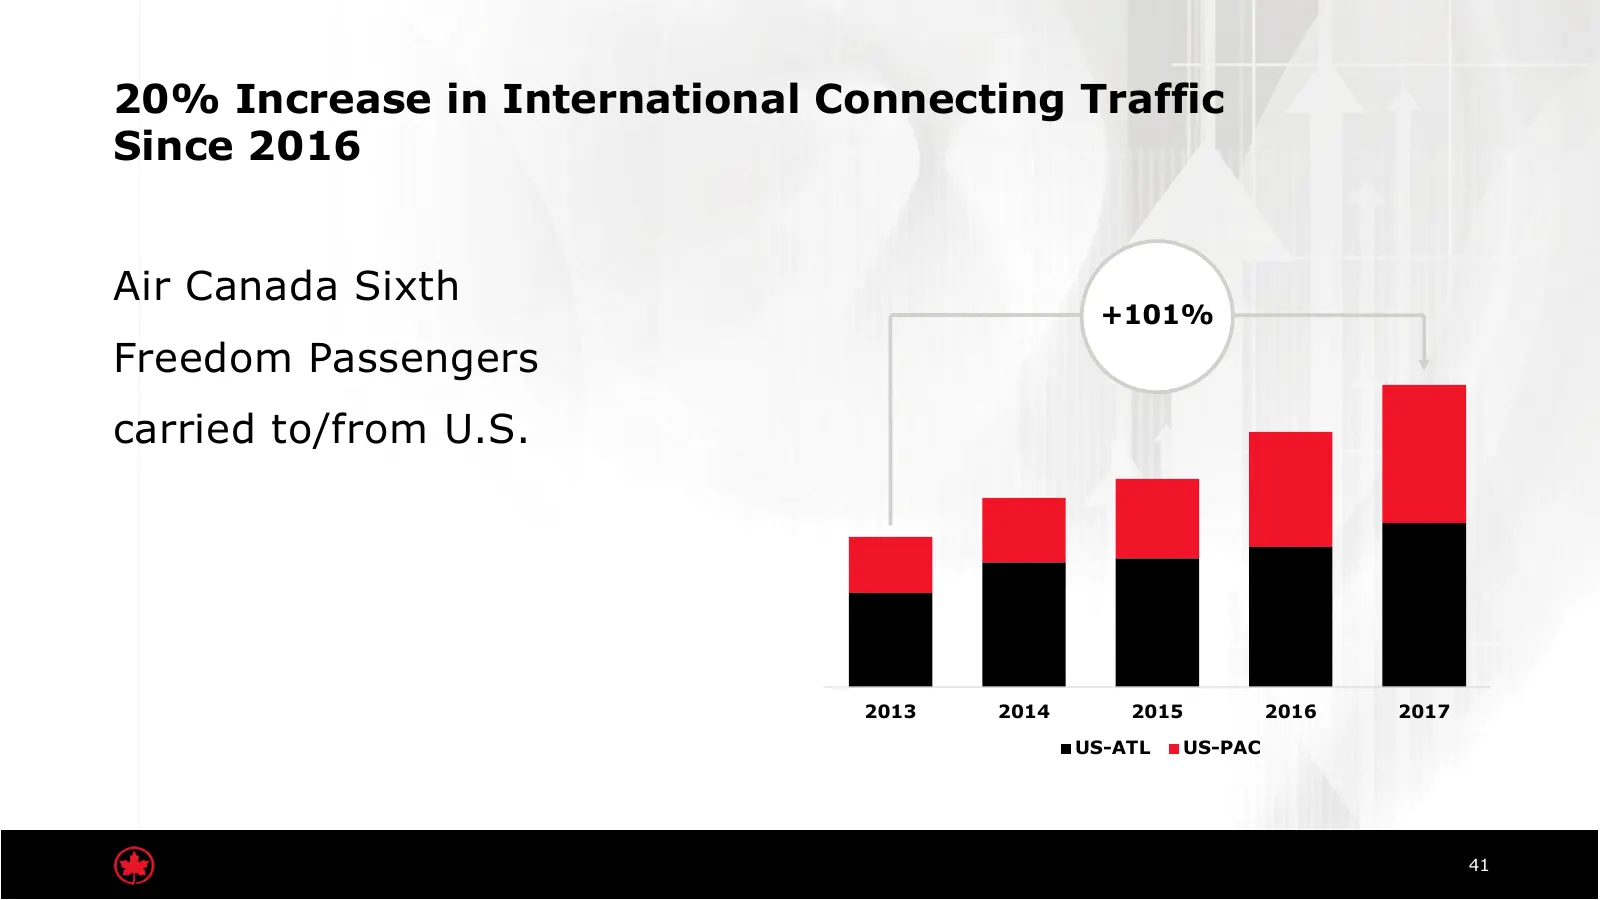
20% Increase in International Connecting Traffic Since 2016 Air Canada Sixth +101% Freedom Passengers carried to/from U.S. 2013 2014 2015 2016 2017 US-ATL US-PAC 41
Slide 42: 42
42
Slide 43: Culture Change: Win as One Air Canada
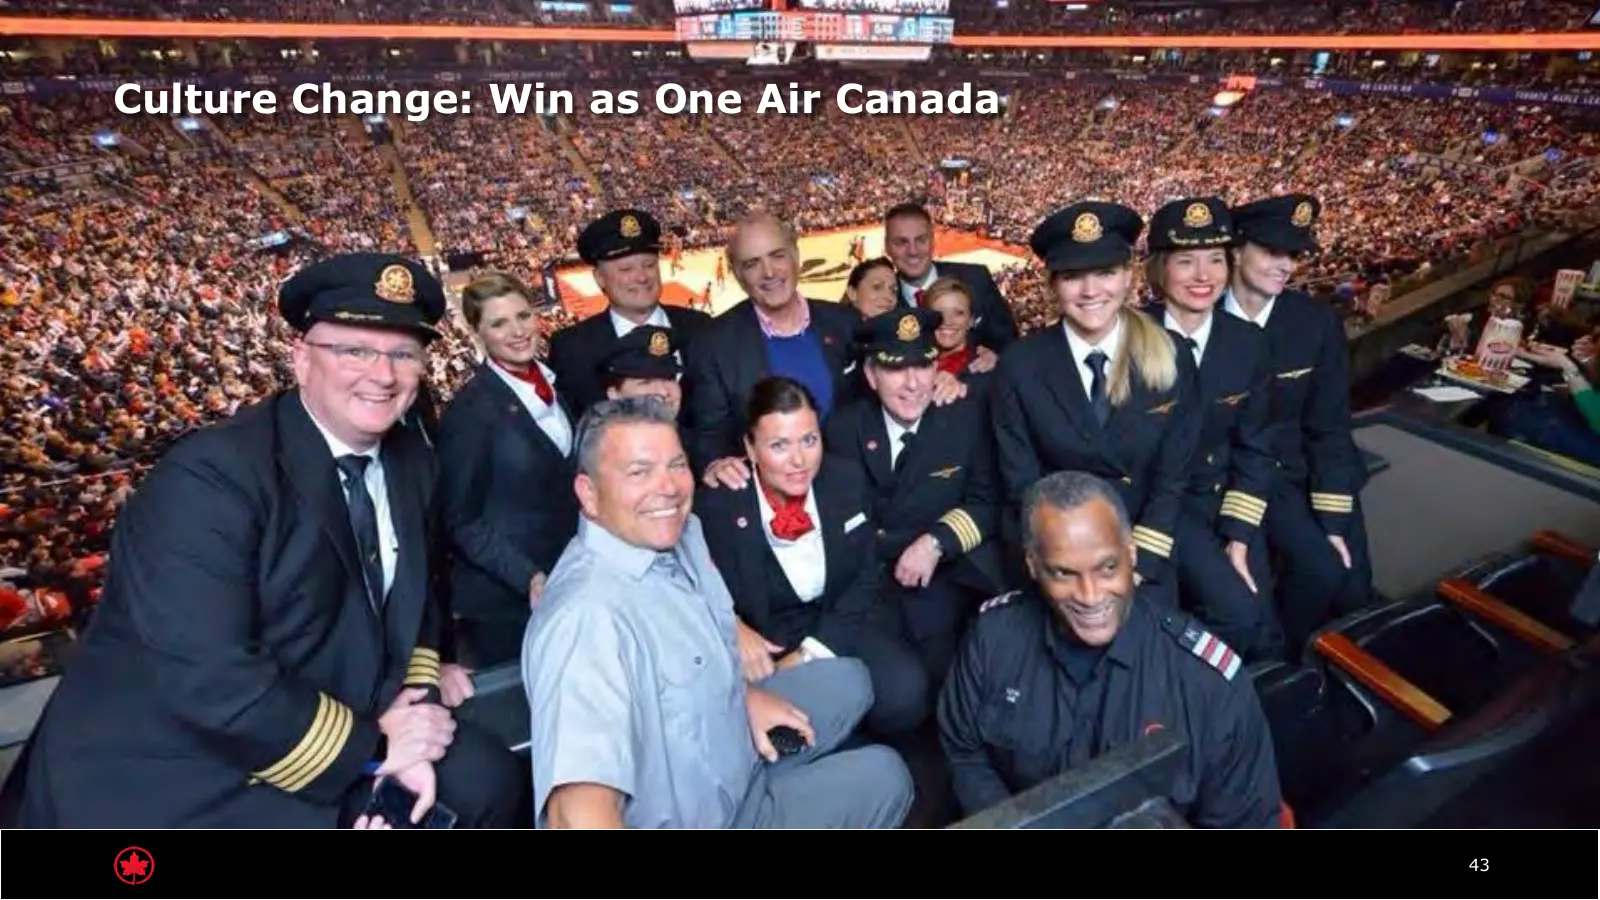
Culture Change: Win as One Air Canada 43
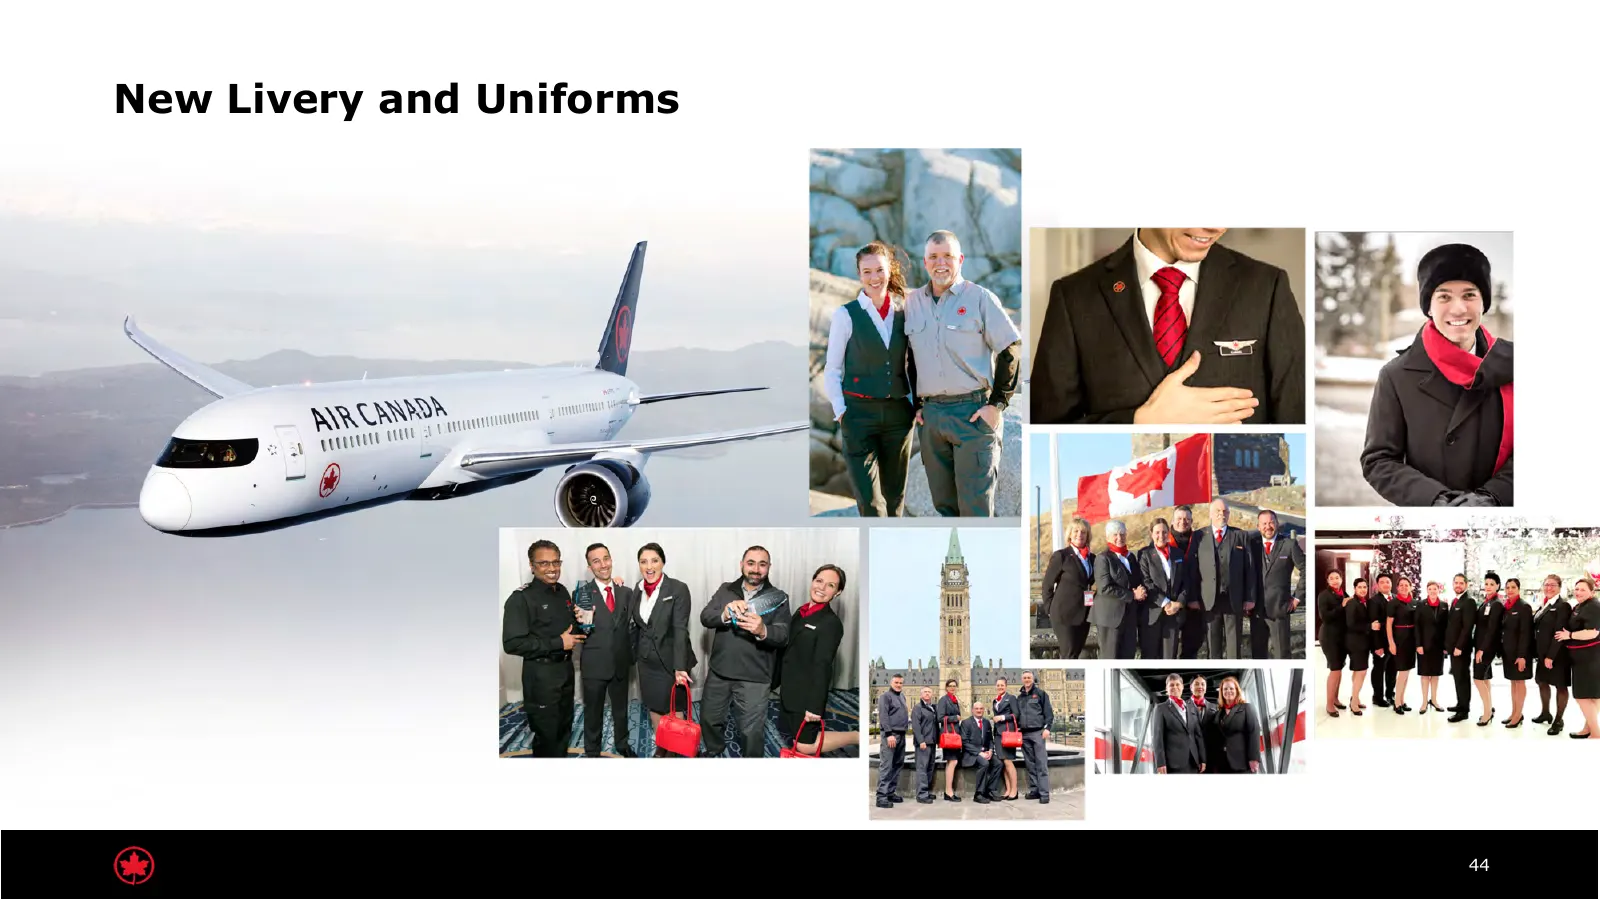
Slide 44: New Livery and Uniforms
New Livery and Uniforms 44
Slide 45: 45
45
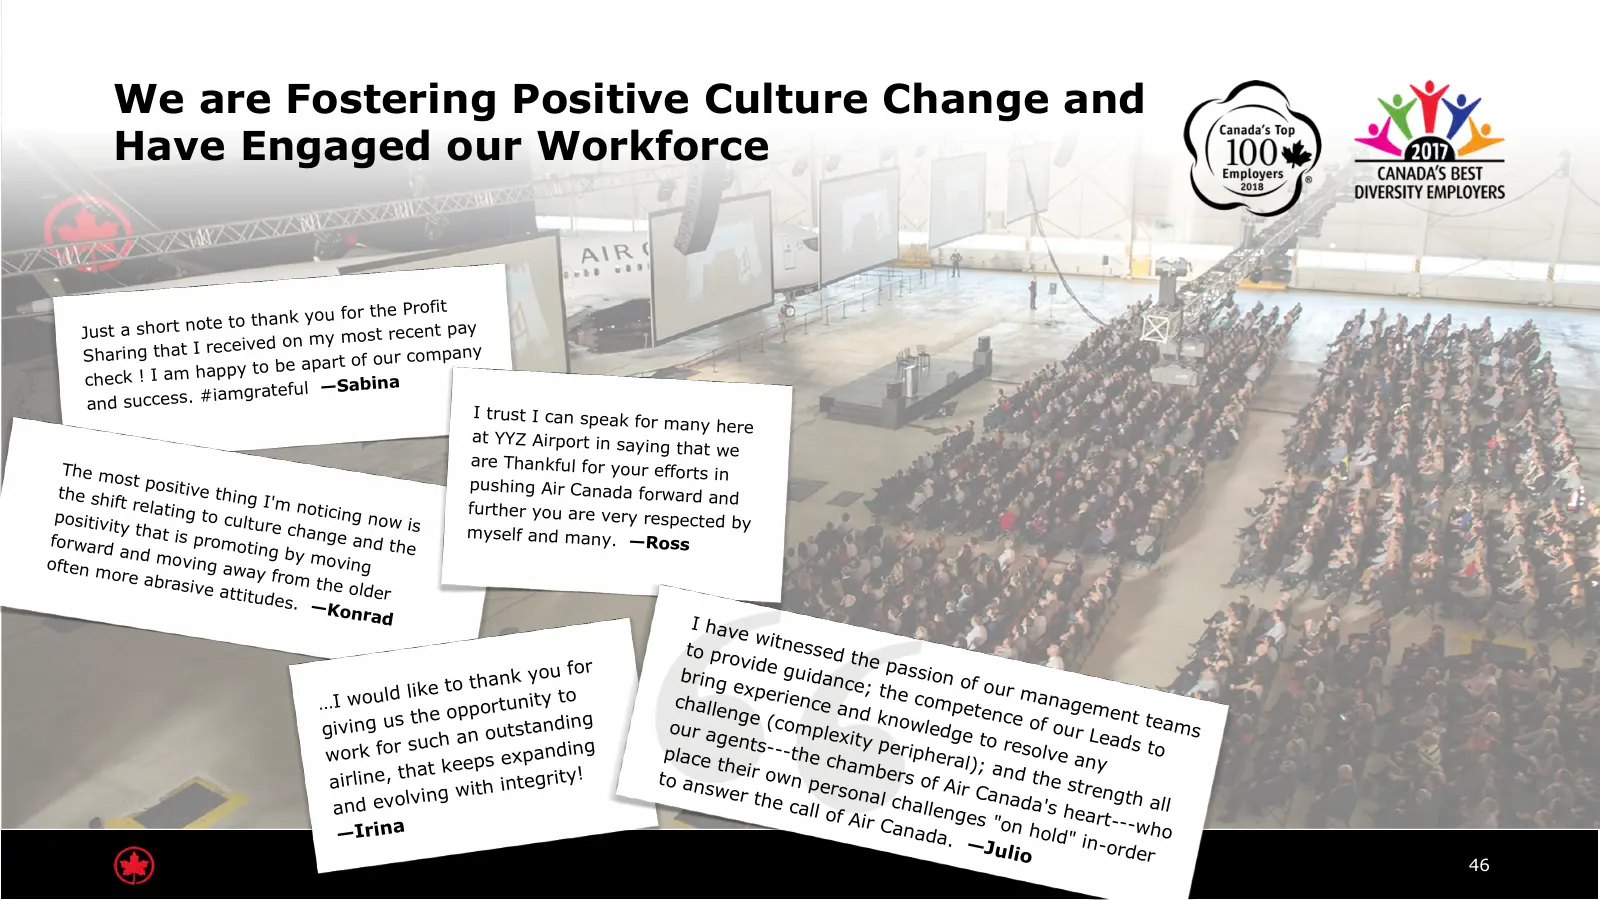
Slide 46: Fostering Positive Culture Change and Engaged Workforce
We are Fostering Positive Culture Change and Have Engaged our Workforce e Profit t no te to th ank you for th Just a shor ost recent pay th at I re ce ived on my m Shari ng mpany ha pp y to be apart of our co check ! I am —Sabina #iamgrateful and success. I trust I can speak for many here at YYZ Air
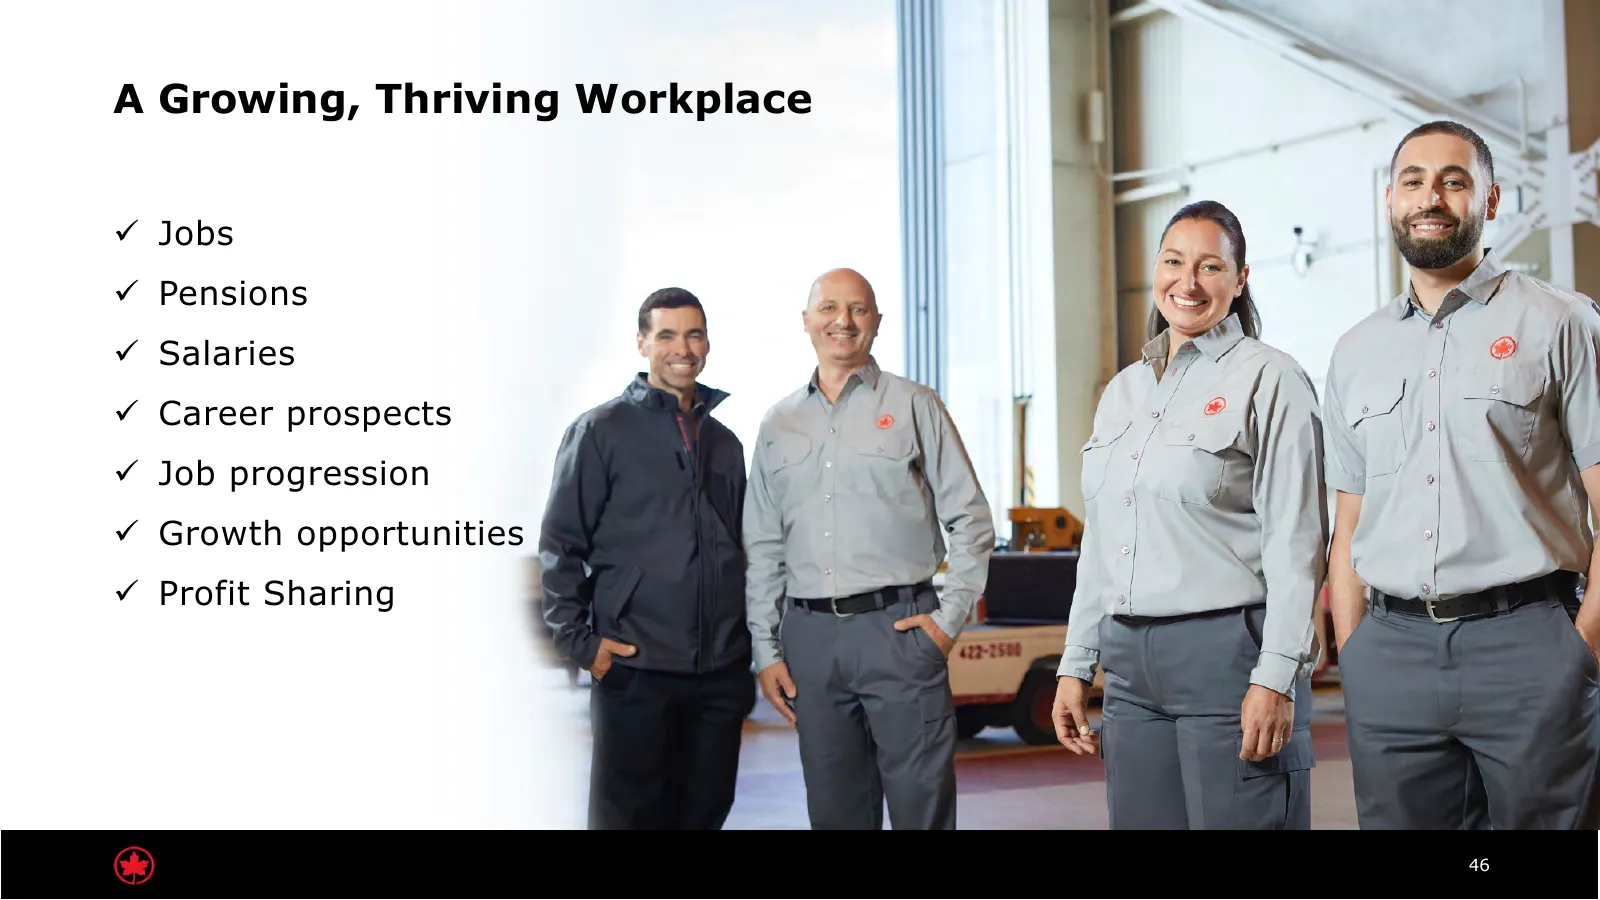
Slide 47: A Growing, Thriving Workplace
A Growing, Thriving Workplace ü Jobs ü Pensions ü Salaries ü Career prospects ü Job progression ü Growth opportunities ü Profit Sharing 46
Slide 48: Customer Engagement
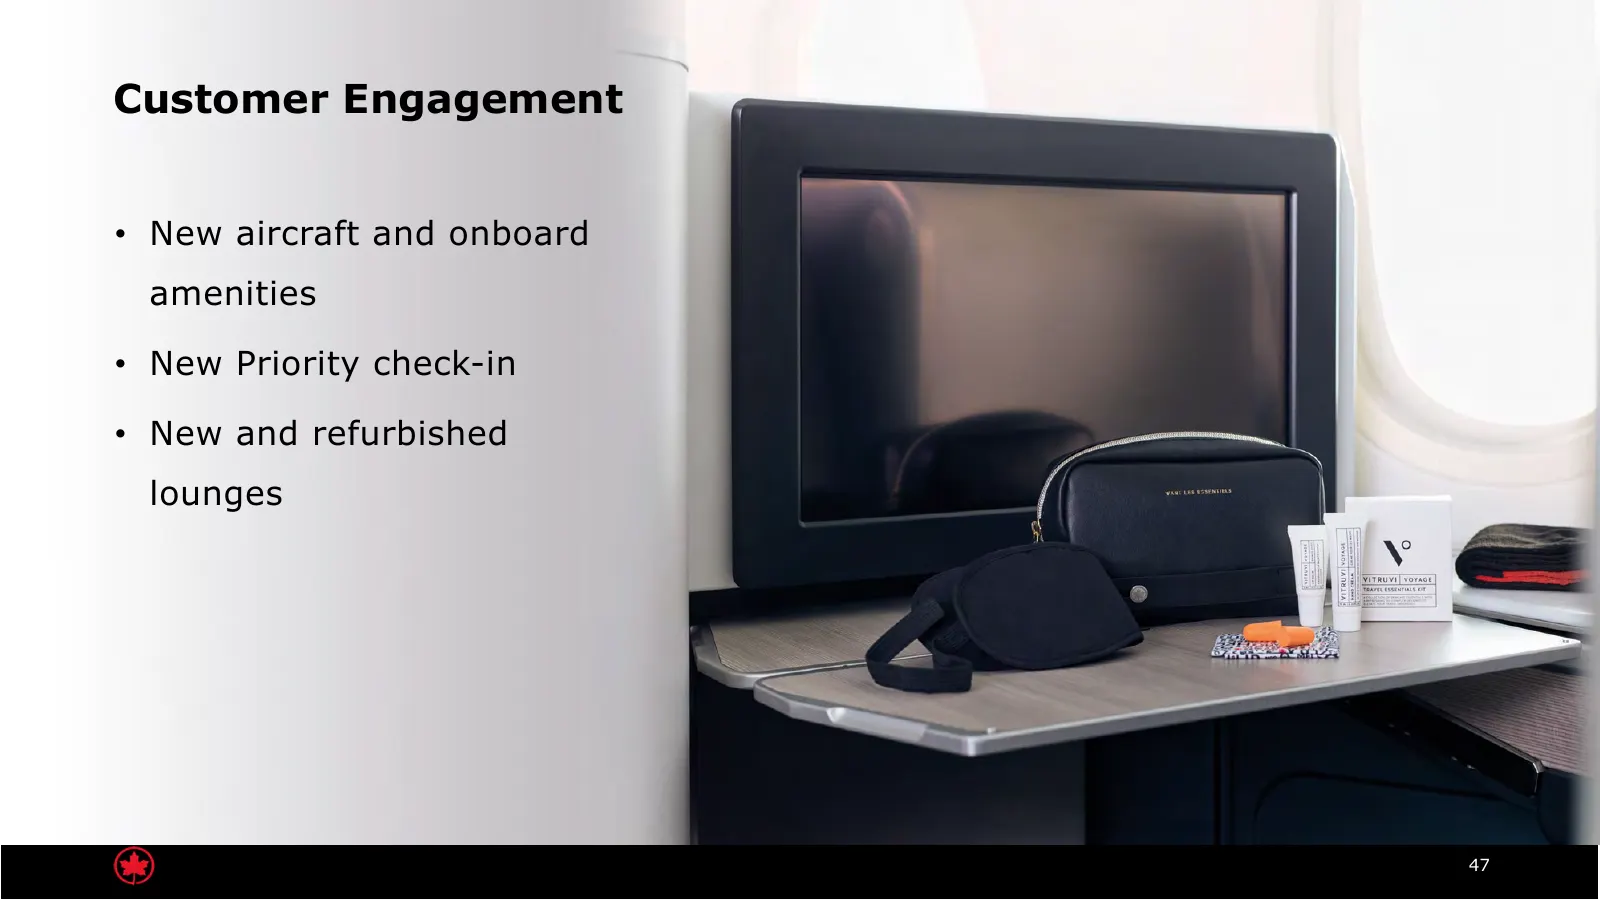
Customer Engagement • New aircraft and onboard amenities • New Priority check-in • New and refurbished lounges 47
Slide 49: New Products and Services
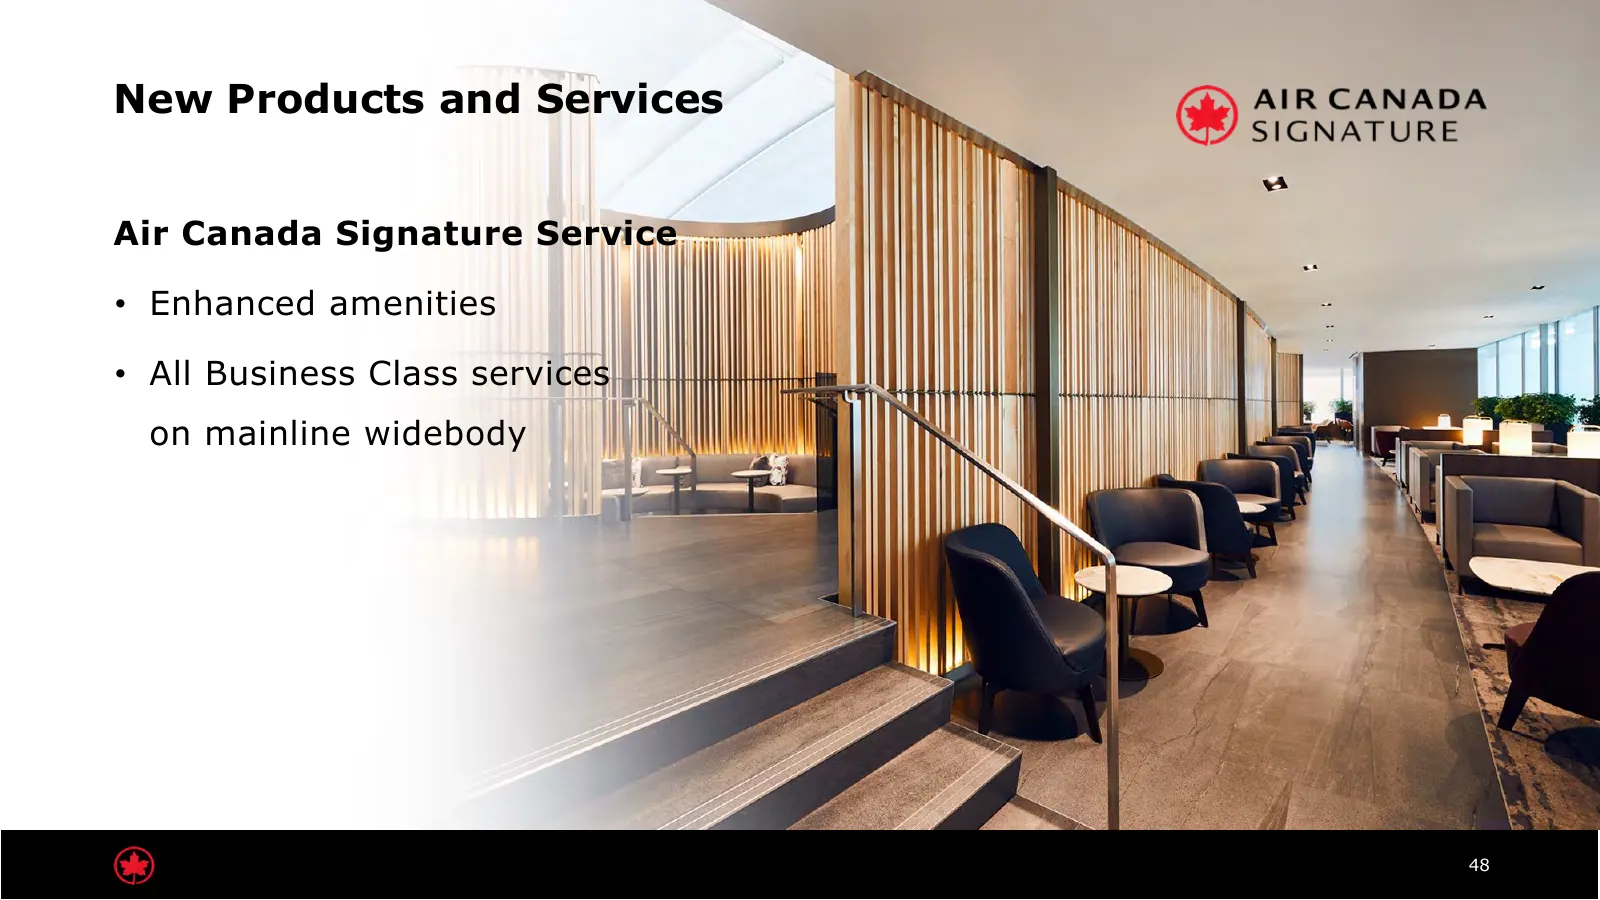
New Products and Services Air Canada Signature Service • Enhanced amenities • All Business Class services on mainline widebody 48
Slide 50: Data the New Oil
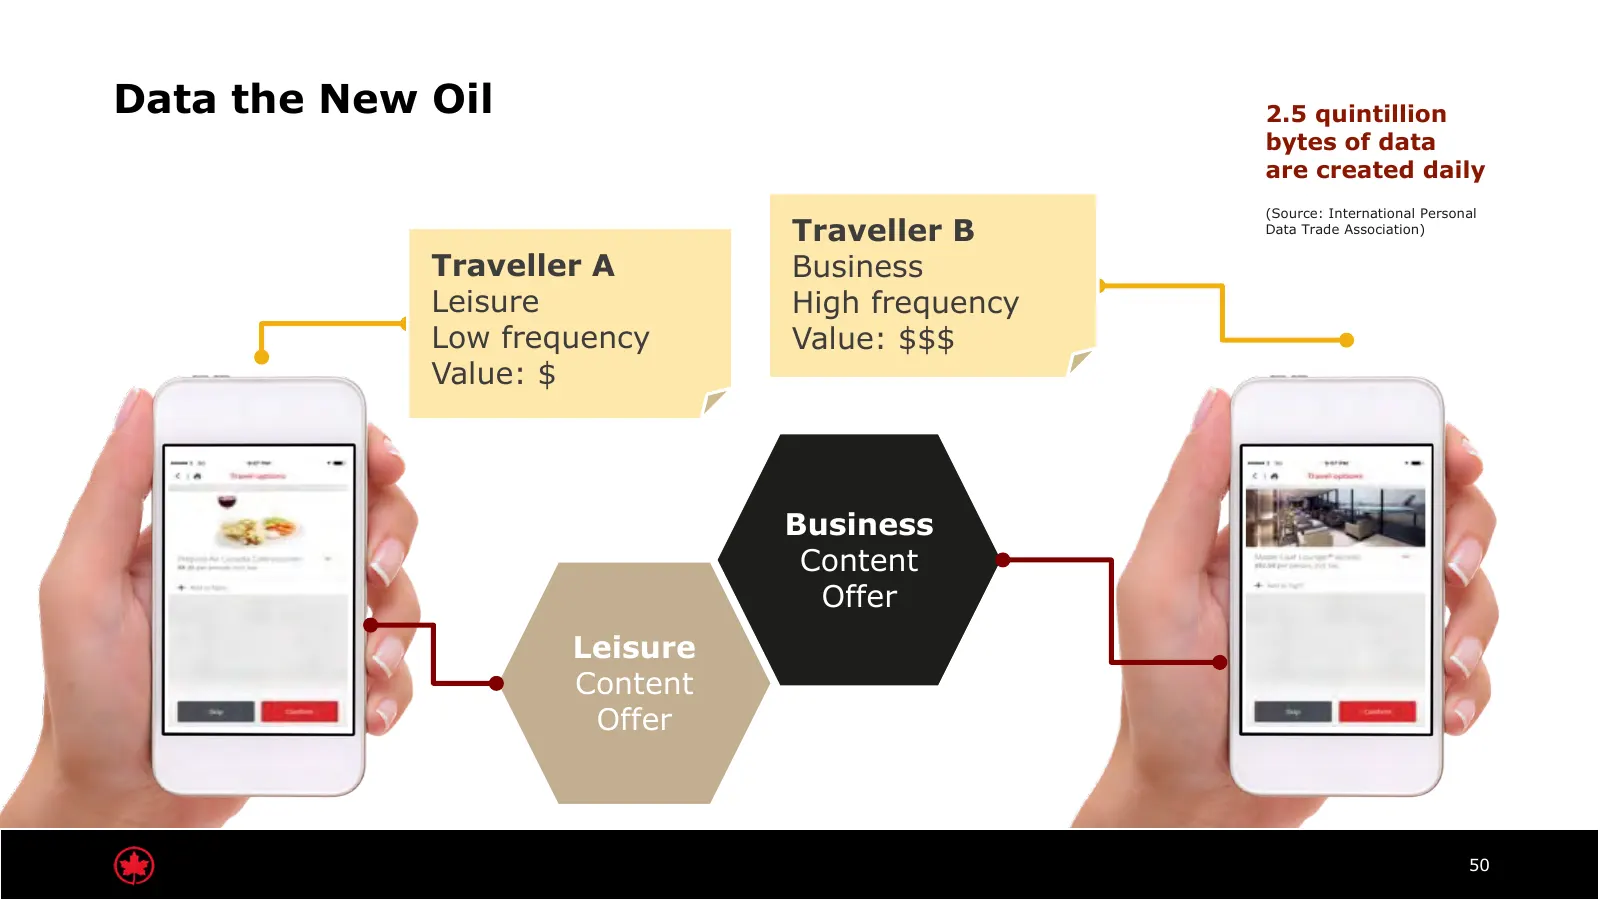
Data the New Oil 2.5 quintillion bytes of data are created daily (Source: International Personal Traveller B Data Trade Association) Traveller A Business Leisure High frequency Low frequency Value: $$$ Value: $ Business Content Offer Leisure Content Offer 50
Slide 51: Montréal – Prime Beneficiary of Air Canada's Growth
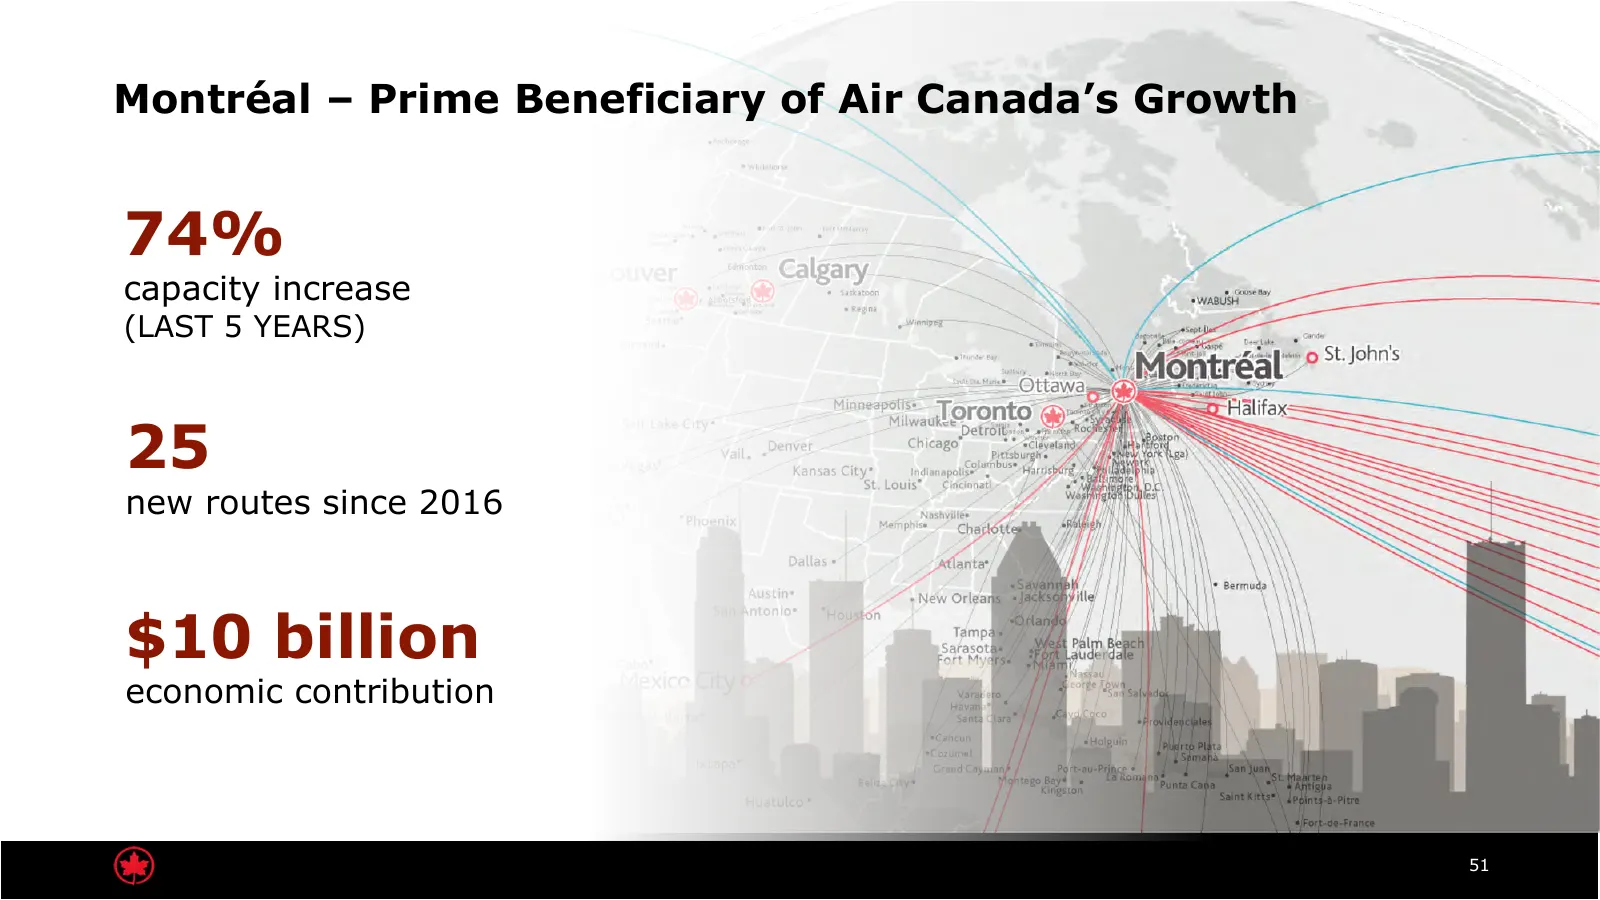
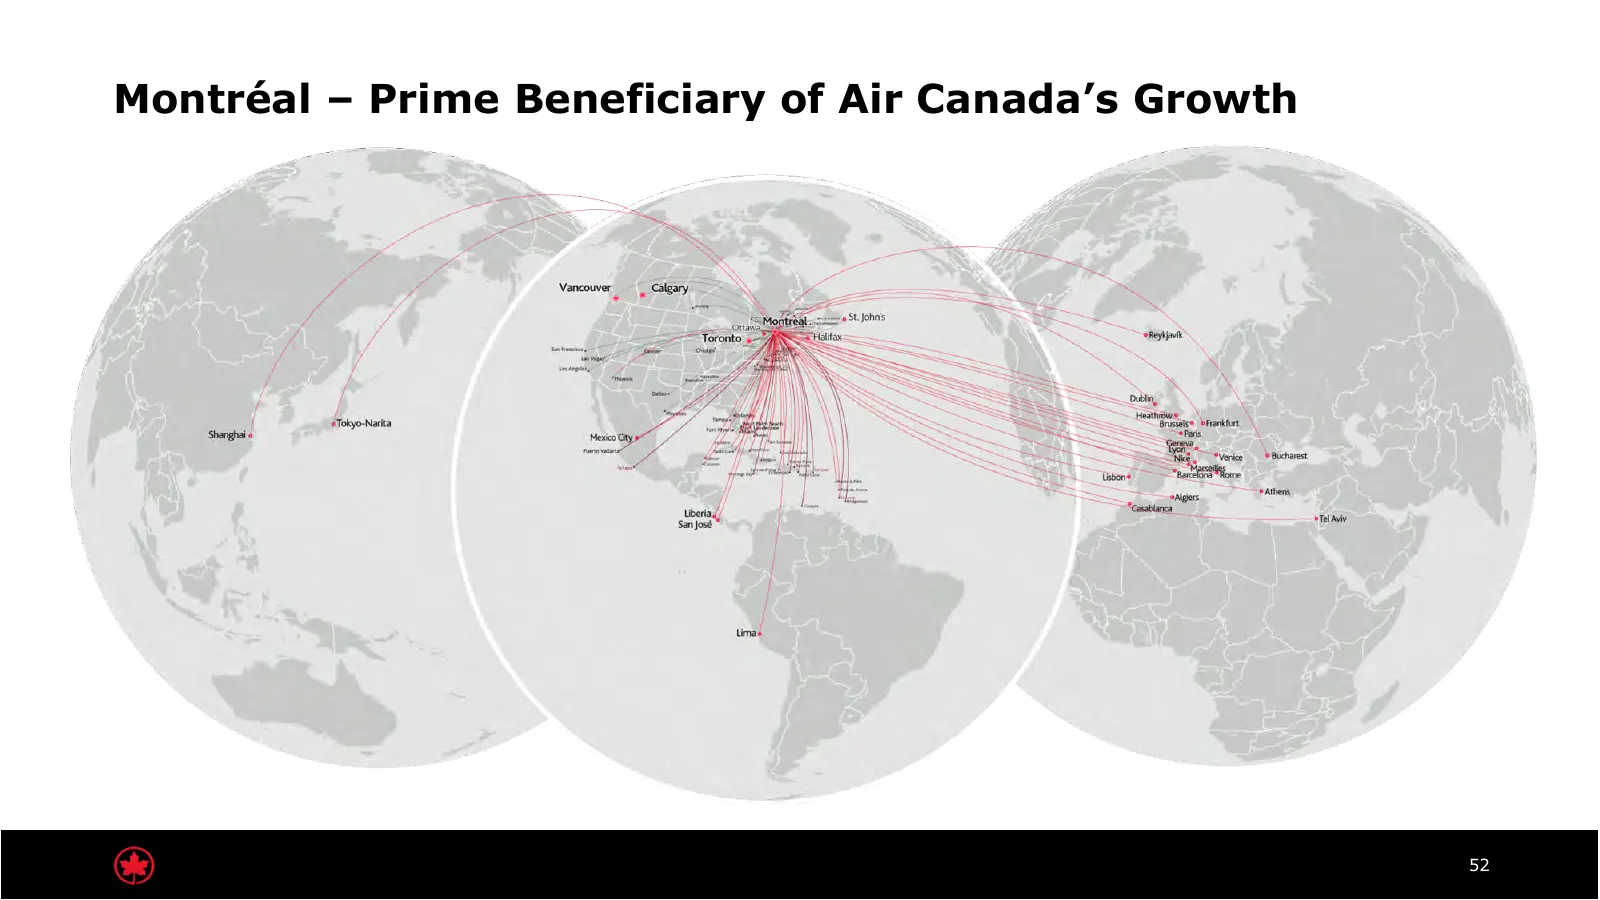
Montréal – Prime Beneficiary of Air Canada’s Growth 74% capacity increase (LAST 5 YEARS) 25 new routes since 2016 $10 billion economic contribution 51
Slide 52: Montréal – Prime Beneficiary of Air Canada's Growth
Montréal – Prime Beneficiary of Air Canada’s Growth 52
Slide 53: Montréal – Prime Beneficiary of Air Canada's Growth
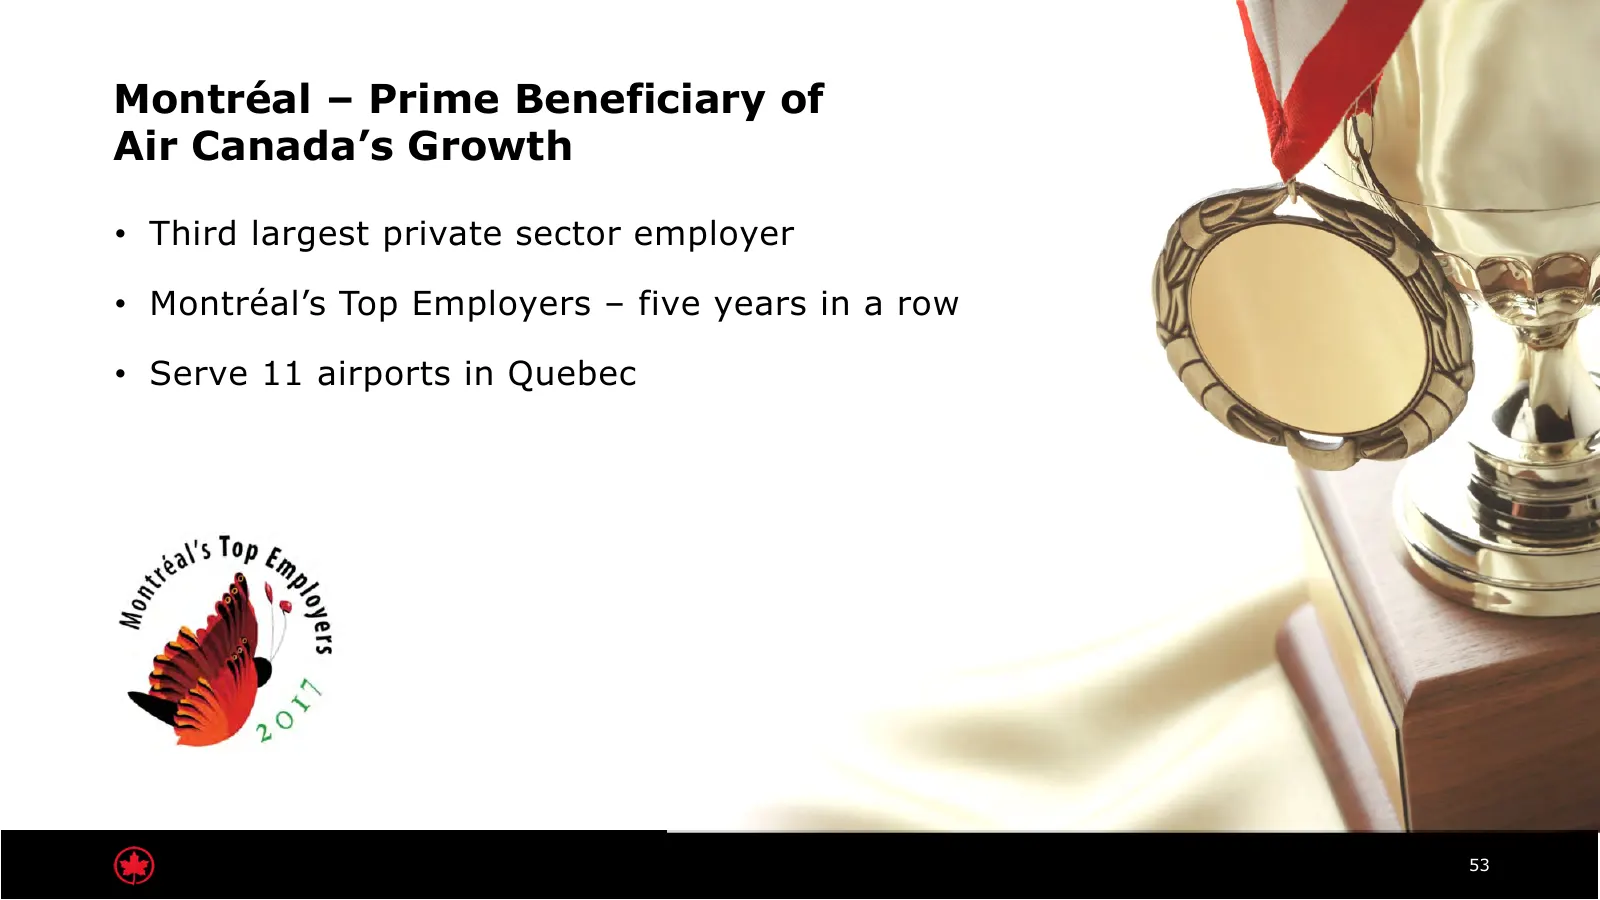
Montréal – Prime Beneficiary of Air Canada’s Growth • Third largest private sector employer • Montréal’s Top Employers – five years in a row • Serve 11 airports in Quebec 53
Slide 54: Air Canada – A Global Champion
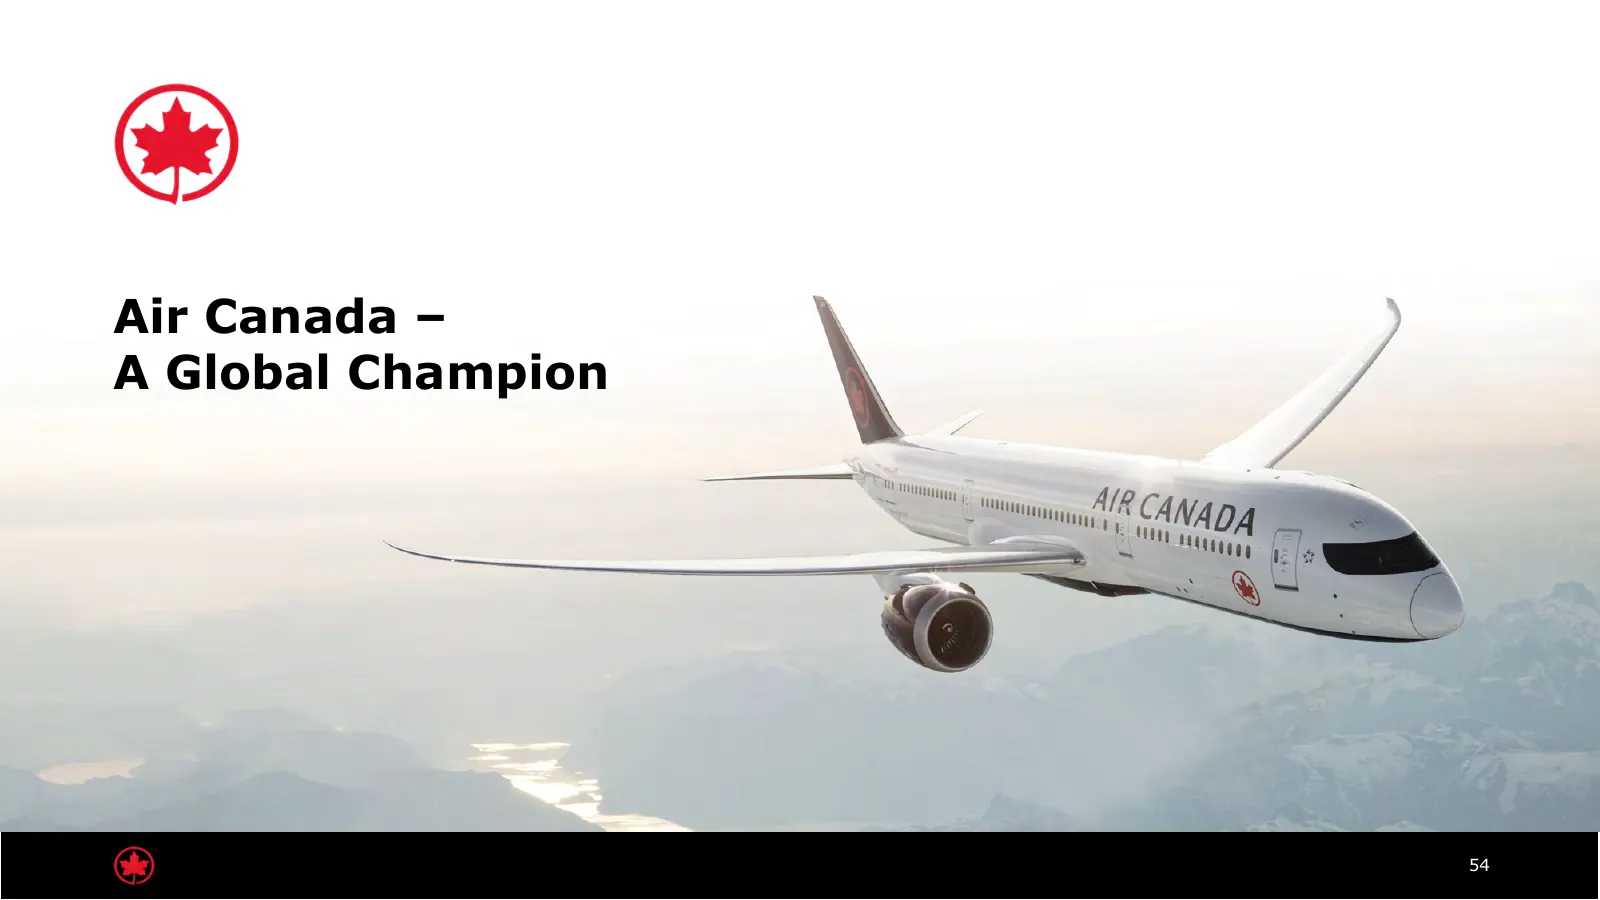
Air Canada – A Global Champion 54

Slide 55: Thank you
Thank you aircanada.com
Source: Internet Archive copy of aircanada.com
More decks from Air Canada
 Q3 2026 Earnings Presentation24 slides · Oct 29, 2026
 Q2 2026 Earnings Presentation24 slides · Aug 12, 2026
 Q1 2026 Earnings Presentation23 slides · Apr 30, 2026
 Q4 2025 Earnings Presentation23 slides · Feb 13, 2026
 Q3 2025 Earnings Presentation23 slides · Nov 5, 2025
 Q2 2025 Earnings Presentation23 slides · Jul 29, 2025