Urstadt Biddle Properties — Investor Presentation (June 2022)
22 slides from Urstadt Biddle Properties's investor presentation, Jun 8, 2022
Slide 1: Investor Presentation June 2022
Investor Presentation June 2022
Slide 2: Forward-looking Statements and Non-GAAP Financial Measures
Forward-looking Statements and Non-GAAP Financial Measures Some of the statements in this presentation constitute forward-looking statements within the meaning of Section 27A of the Securities Act and Section 21E of the Exchange Act. Such statements can generally be identified by such words as “anti

Slide 3: Today's Presenters
Today’s Presenters John T. Hayes Senior V.P. and Chief Financial Officer Willing L. Biddle President and Chief Executive Officer
Slide 4: Company Overview
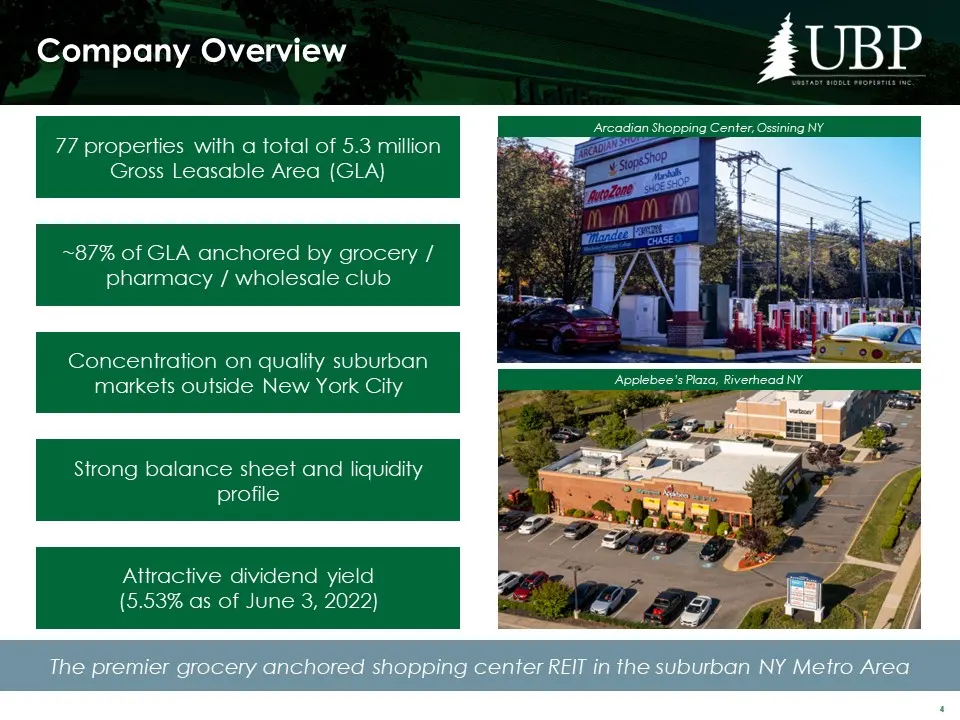
Company Overview ~87% of GLA anchored by grocery / pharmacy / wholesale club Strong balance sheet and liquidity profile Attractive dividend yield (5.53% as of June 3, 2022) 77 properties with a total of 5.3 million Gross Leasable Area (GLA) Concentration on quality suburban markets outside New York
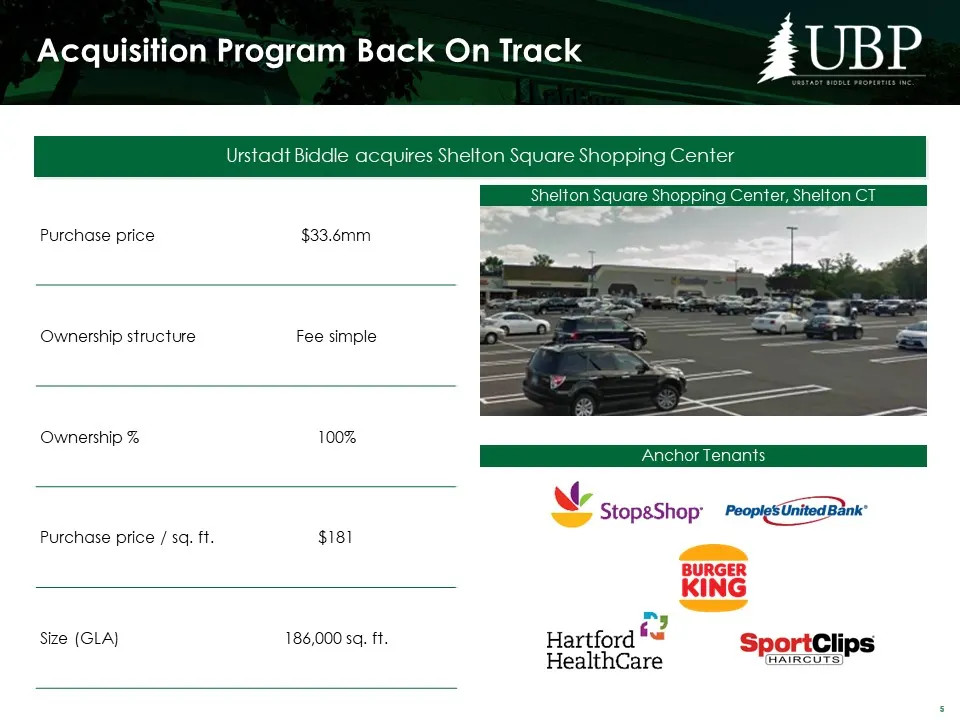
Slide 5: Urstadt Biddle acquires Shelton Square Shopping Center
Purchase price $33.6mm Ownership structure Fee simple Ownership % 100% Purchase price / sq. ft. $181 Size (GLA) 186,000 sq. ft. Acquisition Program Back On Track (10%) (2%) (8%) Shelton Square Shopping Center, Shelton CT Anchor Tenants Urstadt Biddle acquires Shelton Square Shopping Center
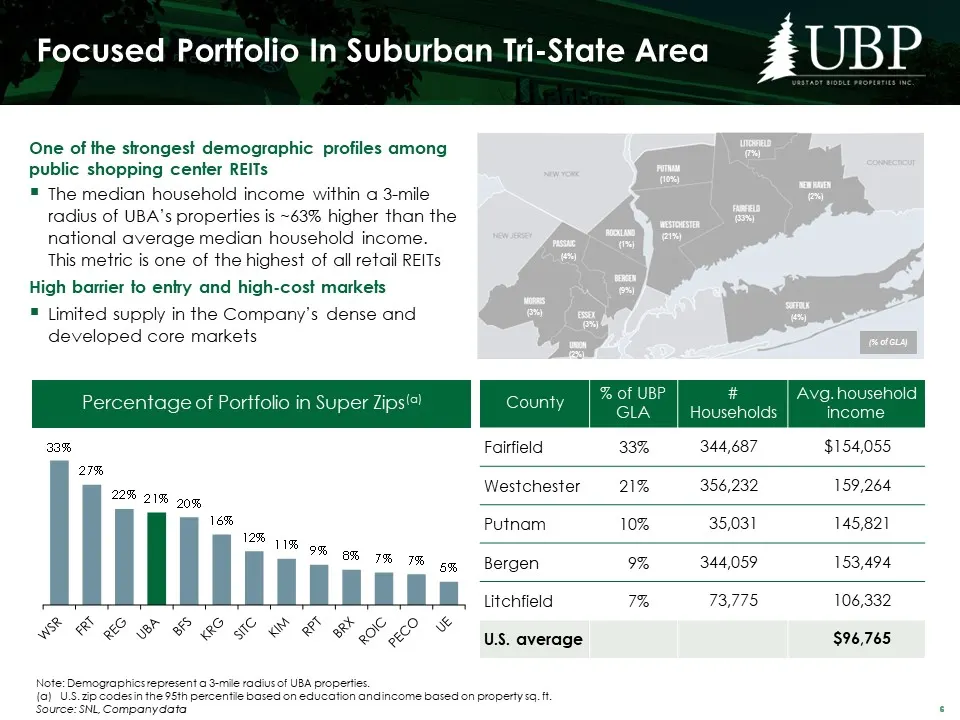
Slide 6: One of the strongest demographic profiles among public shopping center REITs
One of the strongest demographic profiles among public shopping center REITs The median household income within a 3-mile radius of UBA’s properties is ~63% higher than the national average median household income. This metric is one of the highest of all retail REITs High barrier to entry and high-c
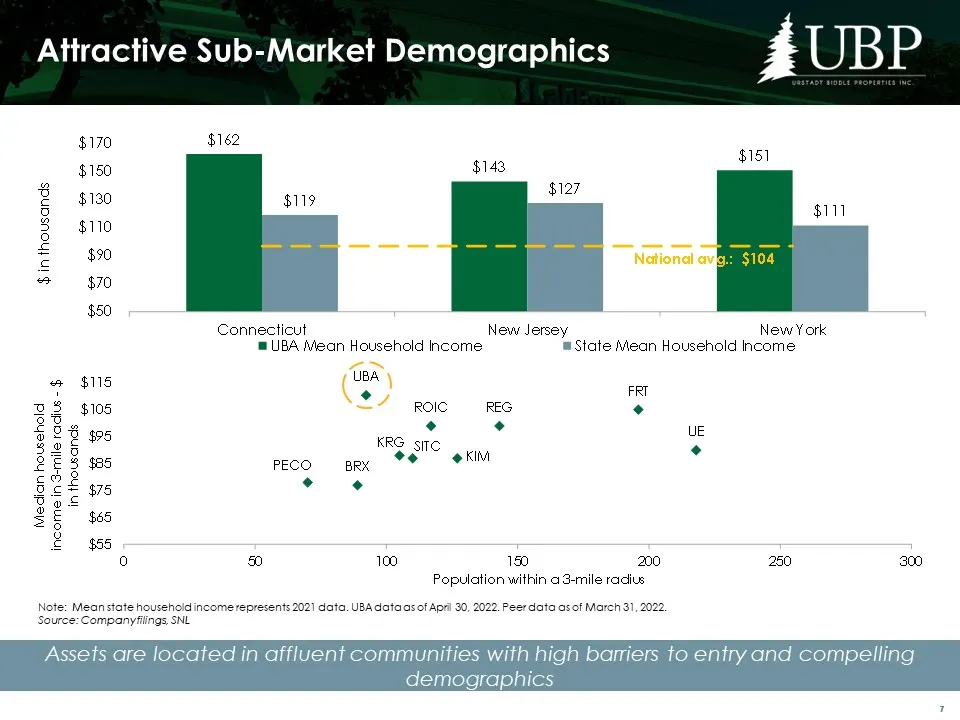
Slide 7: Attractive Sub-Market Demographics
Attractive Sub-Market Demographics Assets are located in affluent communities with high barriers to entry and compelling demographics Note: Mean state household income represents 2021 data. UBA data as of April 30, 2022. Peer data as of March 31, 2022. Source: Company filings, SNL
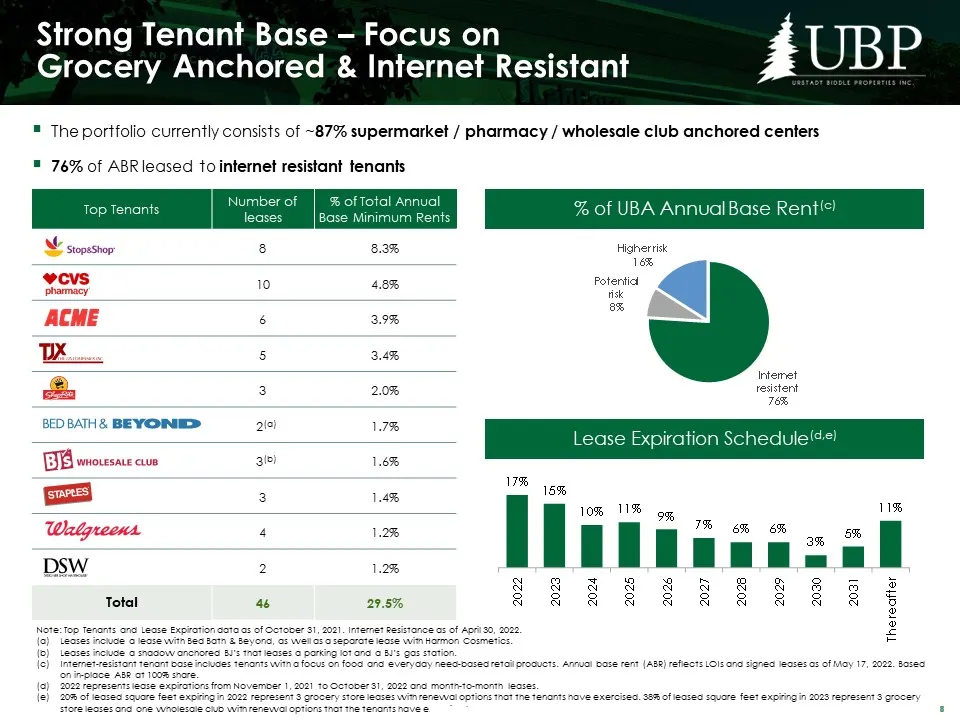
Slide 8: Strong Tenant Base – Focus on Grocery Anchored & Internet Resistant
Strong Tenant Base – Focus on Grocery Anchored & Internet Resistant The portfolio currently consists of ~87% supermarket / pharmacy / wholesale club anchored centers 76% of ABR leased to internet resistant tenants Top Tenants Number of leases % of Total Annual Base Minimum Rents 8 8.3% 10 4.8% 6 3.9
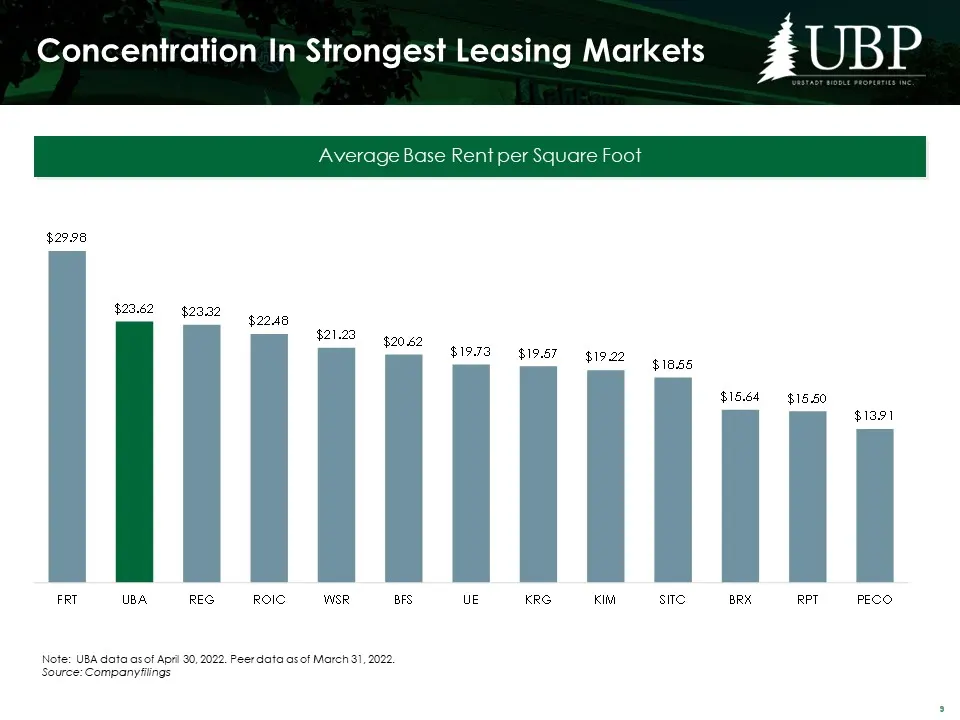
Slide 9: Concentration In Strongest Leasing Markets
Concentration In Strongest Leasing Markets Note: UBA data as of April 30, 2022. Peer data as of March 31, 2022. Source: Company filings Average Base Rent per Square Foot
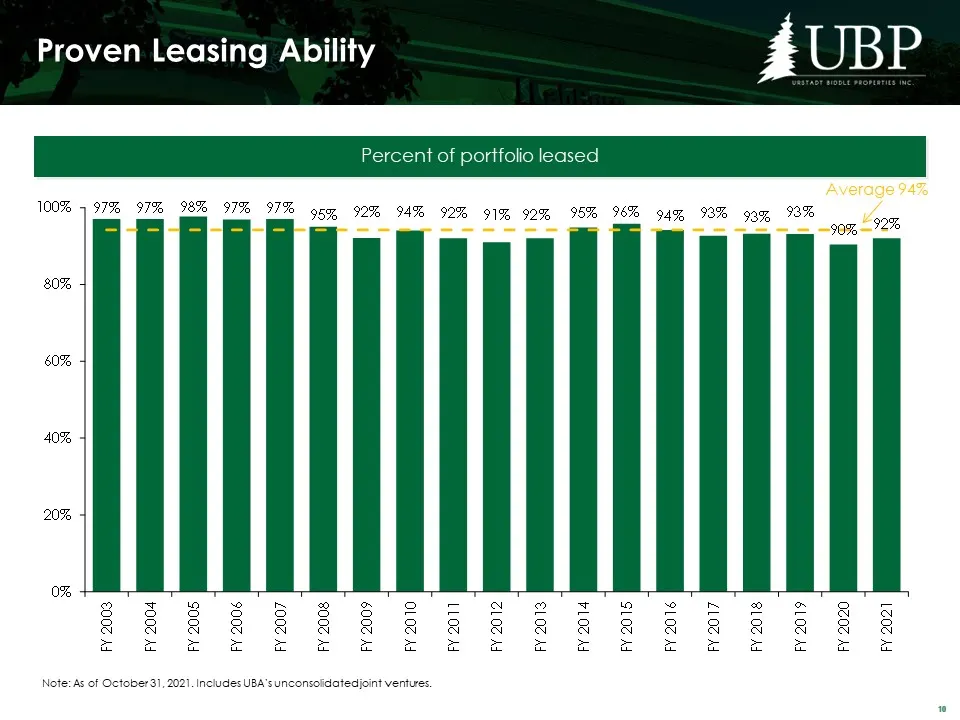
Slide 10: Proven Leasing Ability
Percent of portfolio leased Proven Leasing Ability Average 94% Note: As of October 31, 2021. Includes UBA’s unconsolidated joint ventures.
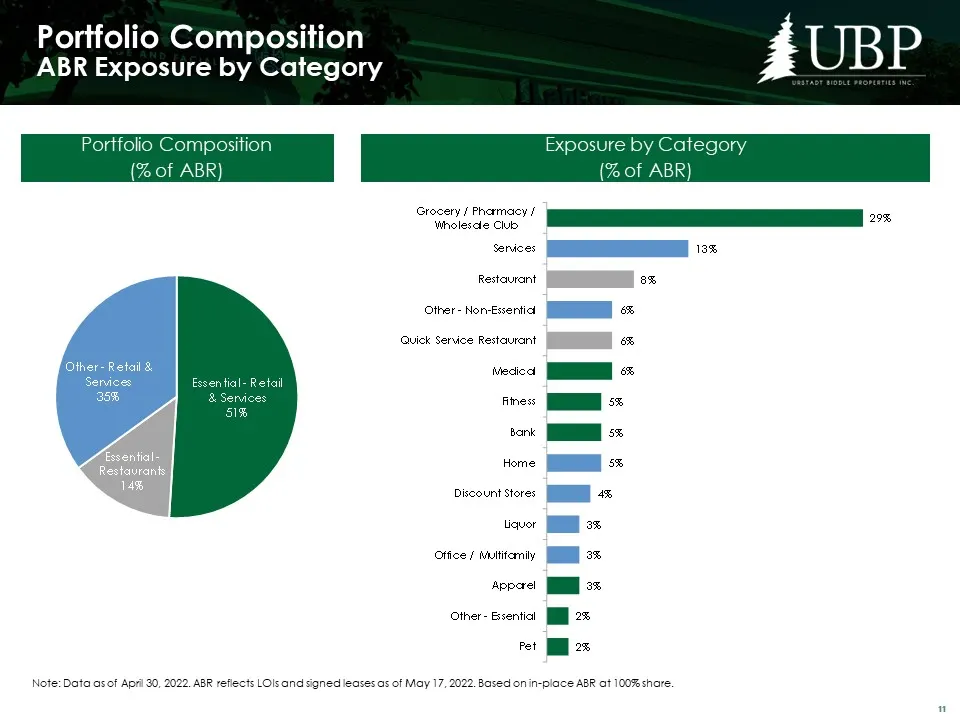
Slide 11: Portfolio Composition and ABR Exposure by Category
Portfolio CompositionABR Exposure by Category Portfolio Composition (% of ABR) Exposure by Category (% of ABR) Note: Data as of April 30, 2022. ABR reflects LOIs and signed leases as of May 17, 2022. Based on in-place ABR at 100% share.
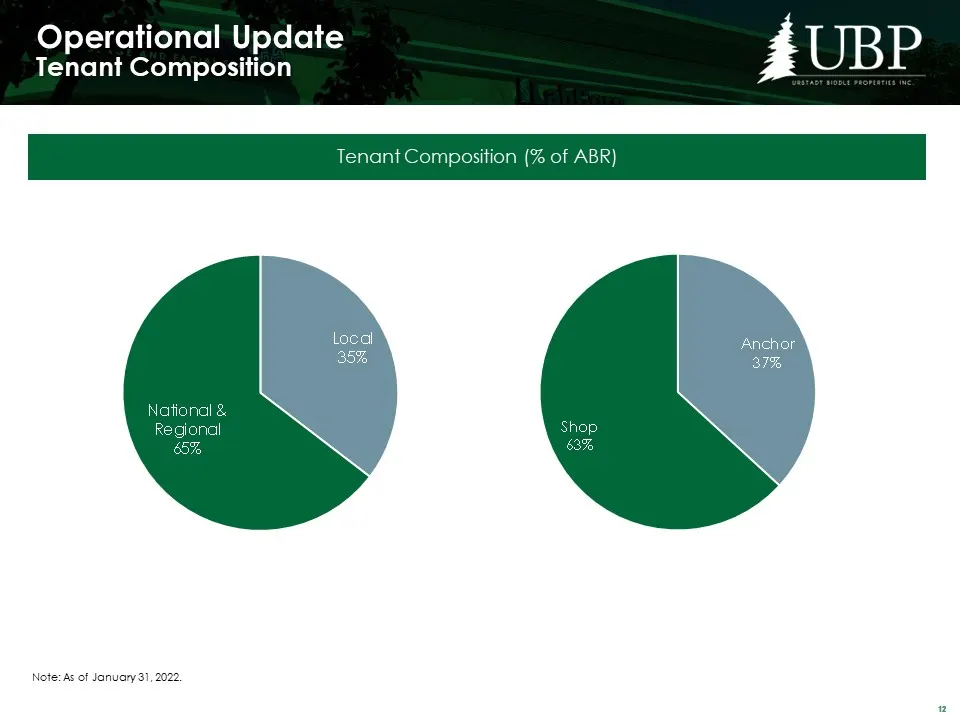
Slide 12: Operational Update: Tenant Composition
Operational UpdateTenant Composition Note: As of January 31, 2022. Tenant Composition (% of ABR)
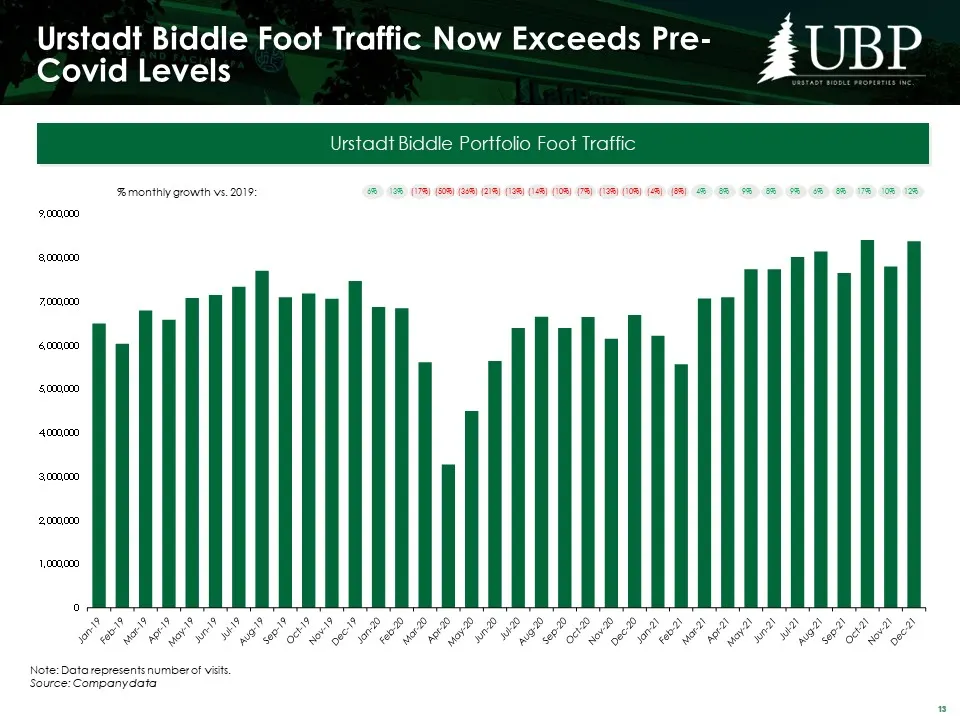
Slide 13: Urstadt Biddle Foot Traffic Now Exceeds Pre-Covid Levels
Urstadt Biddle Foot Traffic Now Exceeds Pre-Covid Levels Note: Data represents number of visits. Source: Company data Urstadt Biddle Portfolio Foot Traffic % monthly growth vs. 2019: 6% 13% (17%) (50%) (36%) (21%) (13%) (14%) (10%) (7%) (13%) (10%) (4%) (8%) 4% 8% 9% 8% 9% 6% 8% 17% 10% 12%
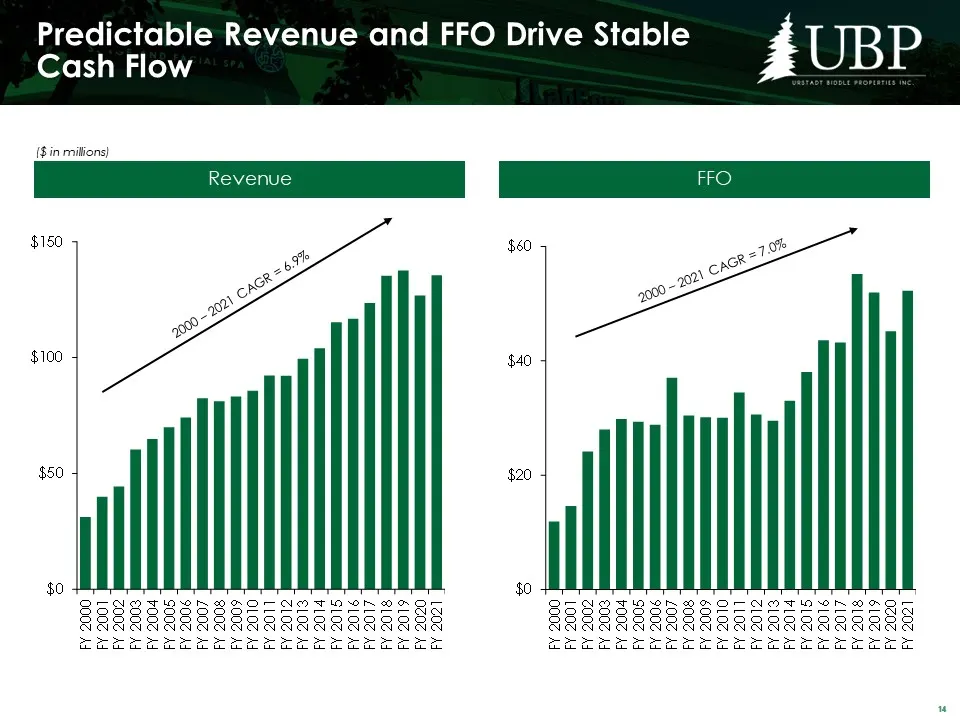
Slide 14: Predictable Revenue and FFO Drive Stable Cash Flow
Predictable Revenue and FFO Drive Stable Cash Flow ($ in millions) 2000 – 2021 CAGR = 7.0% 2000 – 2021 CAGR = 6.9% Revenue FFO
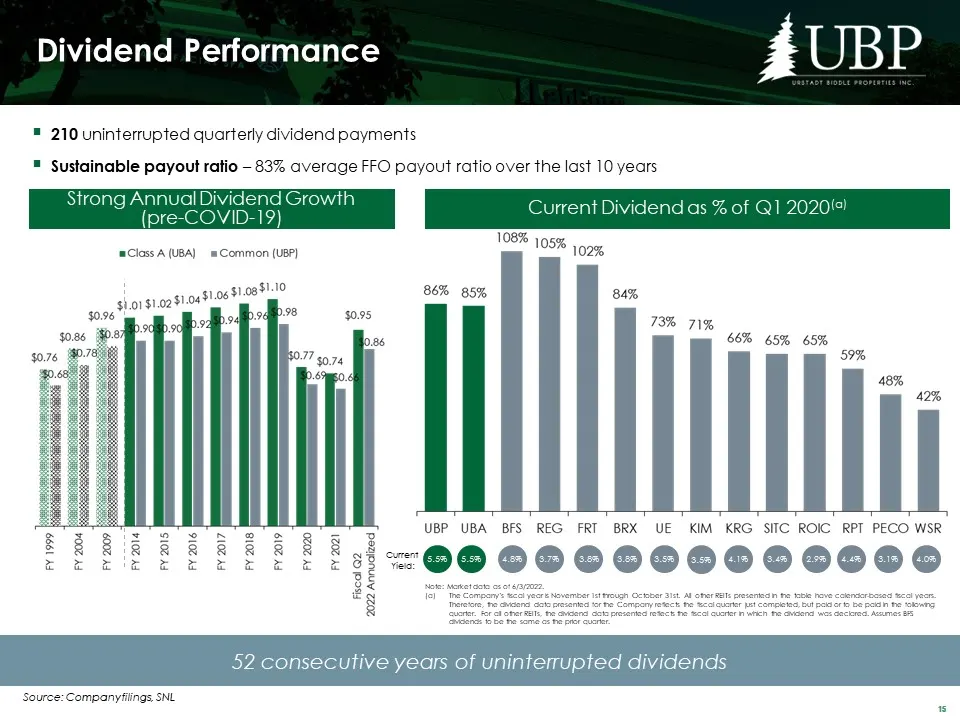
Slide 15: Dividend Performance
Dividend Performance 210 uninterrupted quarterly dividend payments Sustainable payout ratio – 83% average FFO payout ratio over the last 10 years 52 consecutive years of uninterrupted dividends Current Dividend as % of Q1 2020(a) Strong Annual Dividend Growth (pre-COVID-19) Note: Market data as of 6
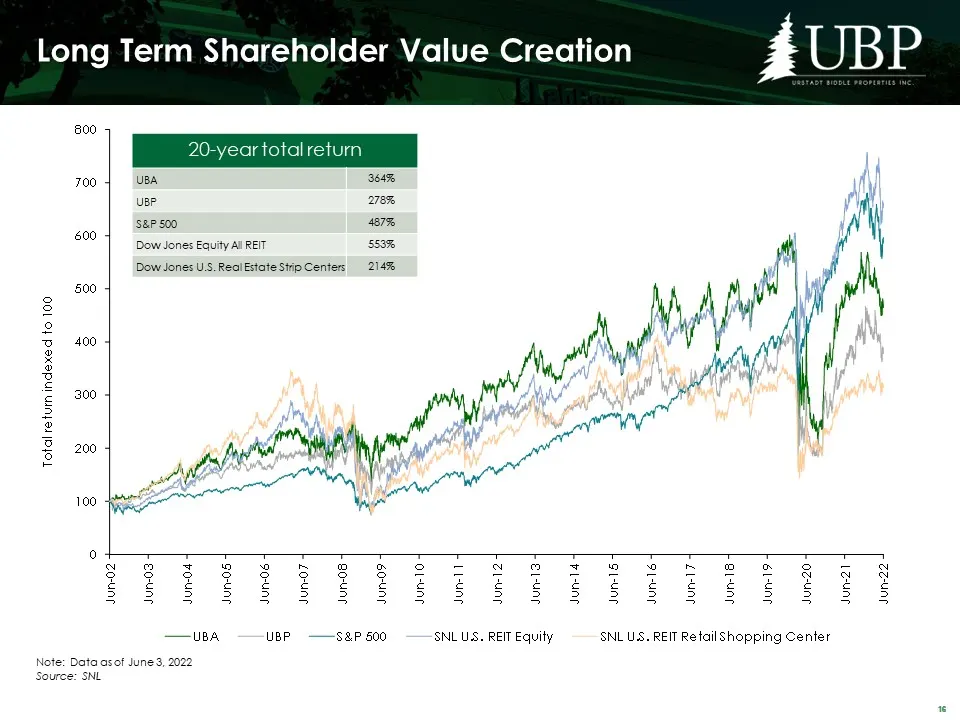
Slide 16: Long Term Shareholder Value Creation
Long Term Shareholder Value Creation Note: Data as of June 3, 2022 Source: SNL 20-year total return UBA 364% UBP 278% S&P 500 487% Dow Jones Equity All REIT 553% Dow Jones U.S. Real Estate Strip Centers 214%
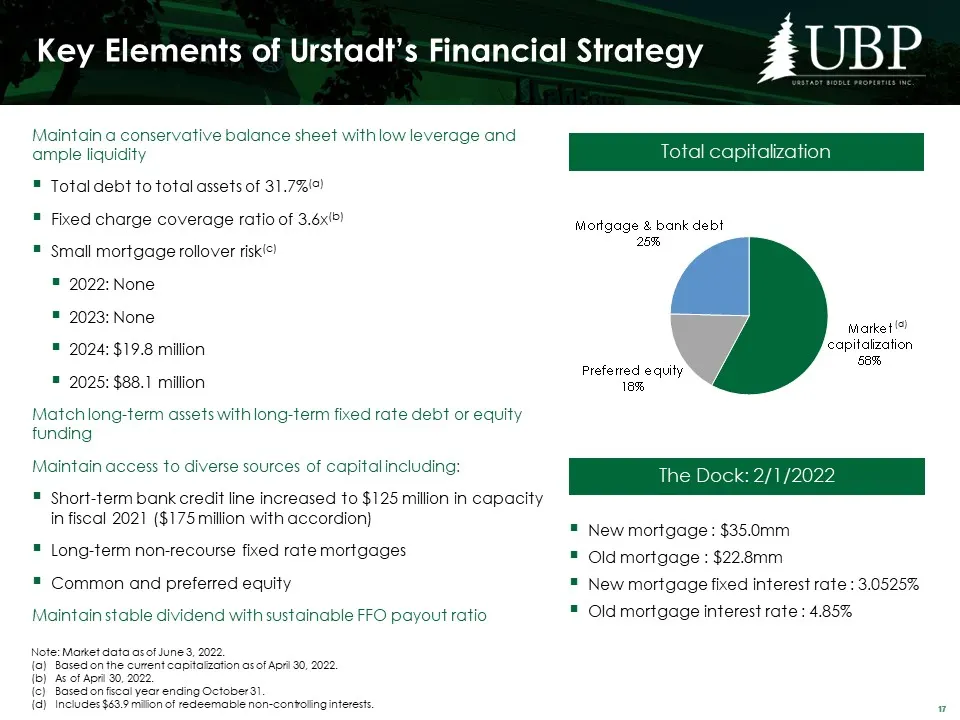
Slide 17: Key Elements of Urstadt's Financial Strategy
Key Elements of Urstadt’s Financial Strategy Maintain a conservative balance sheet with low leverage and ample liquidity Total debt to total assets of 31.7%(a) Fixed charge coverage ratio of 3.6x(b) Small mortgage rollover risk(c) 2022: None 2023: None 2024: $19.8 million 2025: $88.1 million Match l
Slide 18: Capital Initiatives
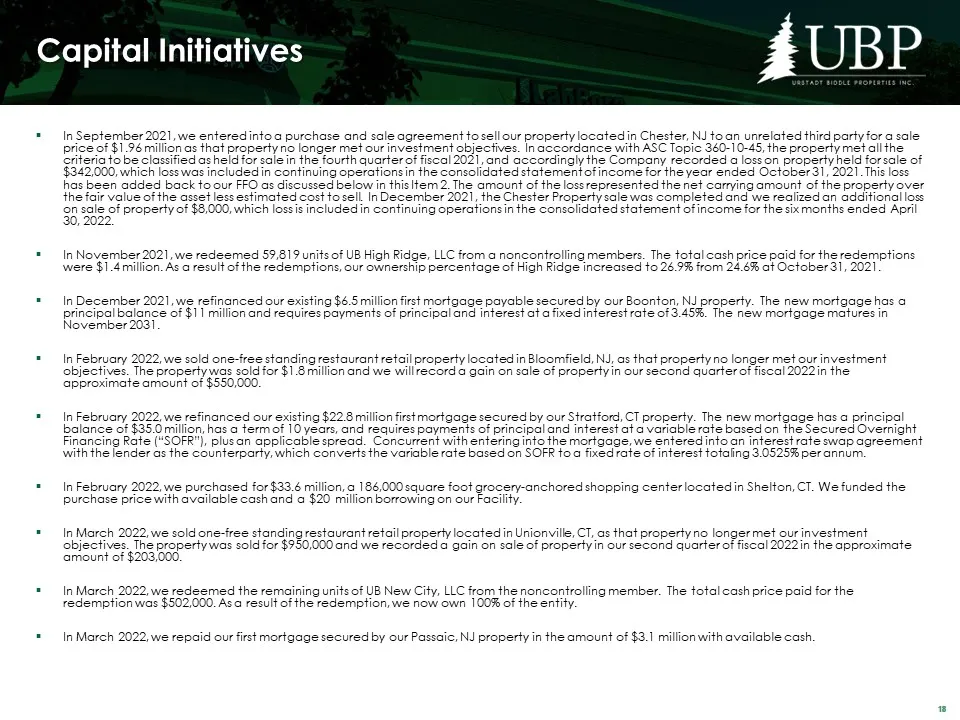
Capital Initiatives In September 2021, we entered into a purchase and sale agreement to sell our property located in Chester, NJ to an unrelated third party for a sale price of $1.96 million as that property no longer met our investment objectives. In accordance with ASC Topic 360-10-45, the propert
Slide 19: Shopping Center Retail Capitalization
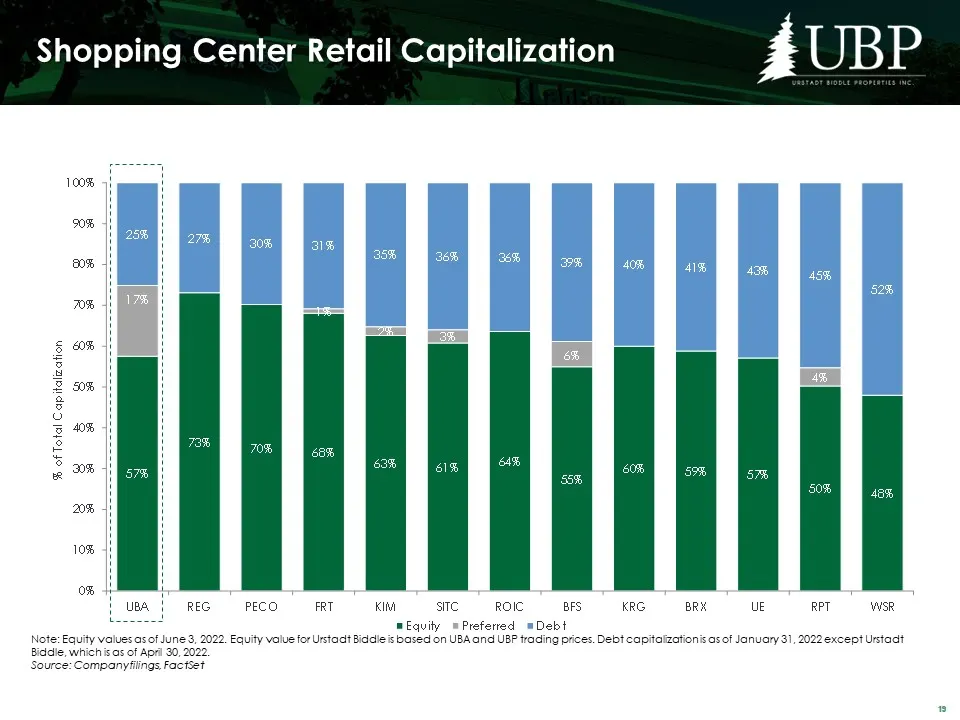
Shopping Center Retail Capitalization Note: Equity values as of June 3, 2022. Equity value for Urstadt Biddle is based on UBA and UBP trading prices. Debt capitalization is as of January 31, 2022 except Urstadt Biddle, which is as of April 30, 2022. Source: Company filings, FactSet
Slide 20: Operating results: Funds from operations, Same property NOI
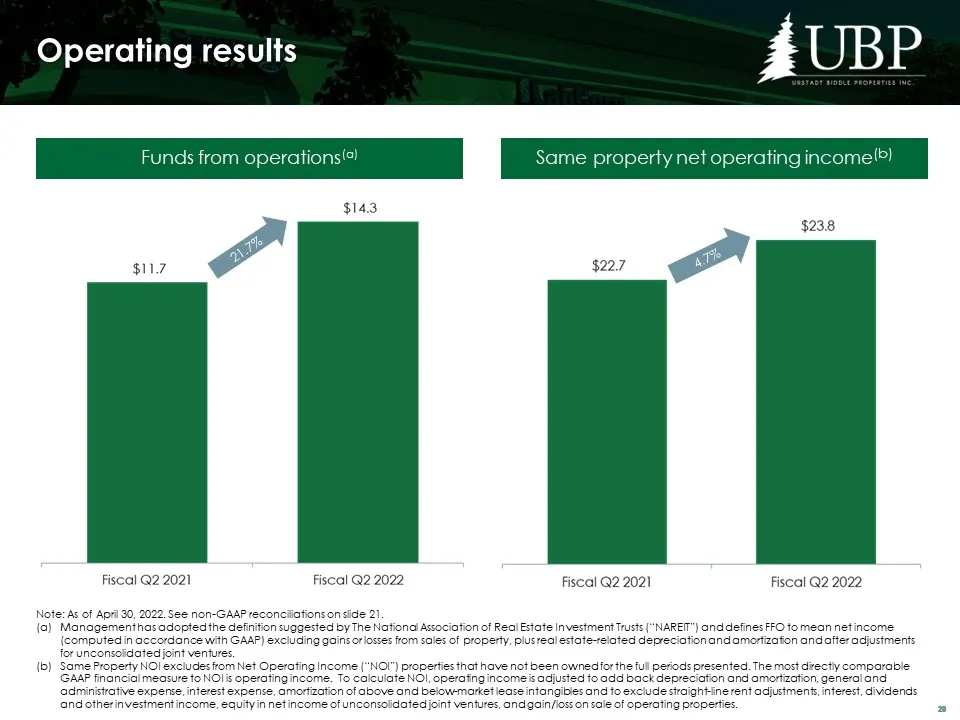
Operating results Funds from operations(a) Same property net operating income(b) Note: As of April 30, 2022. See non-GAAP reconciliations on slide 21. Management has adopted the definition suggested by The National Association of Real Estate Investment Trusts (“NAREIT”) and defines FFO to mean net i
Slide 21: Reconciliation of Net Income to Funds From Operations
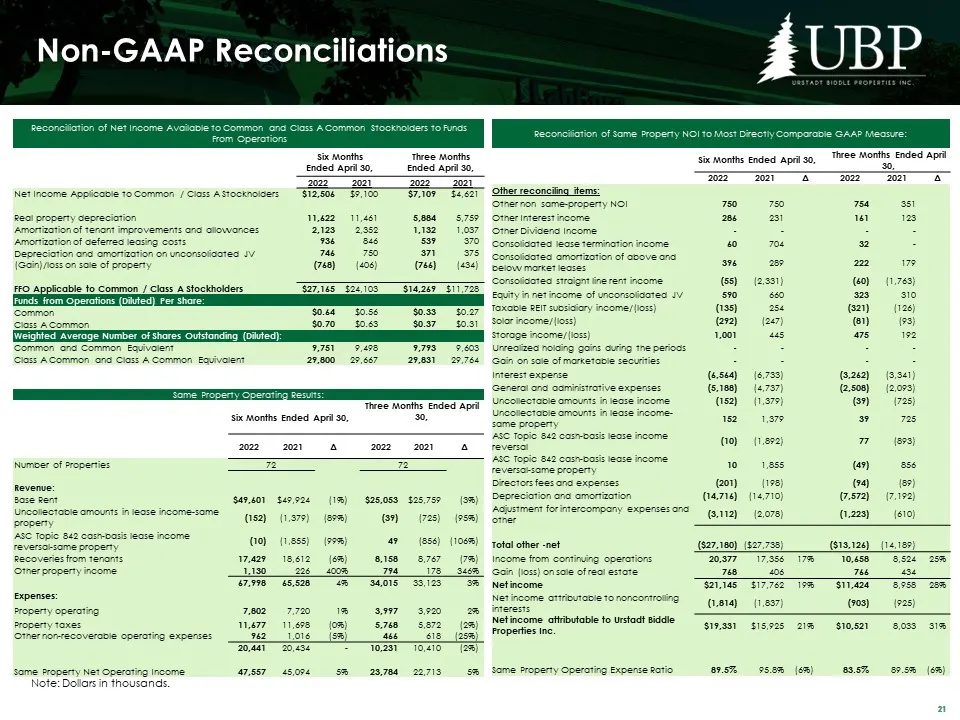
Reconciliation of Net Income Available to Common and Class A Common Stockholders to Funds From Operations Six Months Ended April 30, Three Months Ended April 30, 2022 2021 2022 2021 Net Income Applicable to Common / Class A Stockholders $12,506 $9,100 $7,109 $4,621 Real property depreciation 11,622
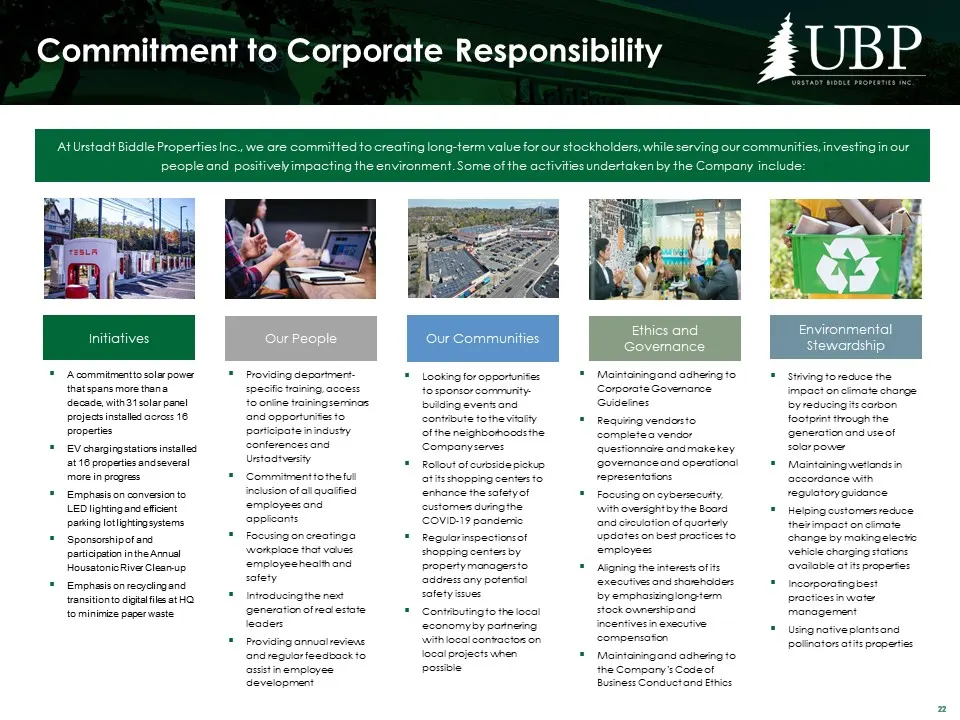
Slide 22: Commitment to Corporate Responsibility
Commitment to Corporate Responsibility At Urstadt Biddle Properties Inc. we are committed to creating long-term value for our stockholders, w people and positiveyimpacting the environment.Some of the activiti Acommitmentiosolapows thatspansmore thane decade, with? solarpanel projects installed acros
Source: SEC EDGAR · 8-K filed Jun 8, 2022
More decks from Urstadt Biddle Properties Inc
 Merger or Acquisition (May 2023)15 slides · May 18, 2023
 Investor Presentation (March 2022)21 slides · Mar 11, 2022
 Investor Presentation (January 2022)21 slides · Jan 13, 2022
 Investor Presentation (September 2021)20 slides · Sep 8, 2021
 Investor Presentation (June 2021)19 slides · Jun 7, 2021
 Investor Presentation (March 2021)19 slides · Mar 11, 2021