MedAssets — J. P. Morgan Healthcare Conference 2015
29 slides from MedAssets's conference presentation, Jan 13, 2015
Slide 1: Performance Improvement for Healthcare Providers
Exhibit 99.1 Performance Improvement for Healthcare Providers J. P. Morgan Healthcare Conference January 13, 2015 Confidential. Property of MedAssets. MedAssets® is a registered trademark of MedAssets, Inc. © 2013 MedAssets, Inc. All rights reserved.
Slide 2: Safe Harbor/Non-GAAP Disclosures
Safe Harbor/Non-GAAP Disclosures Safe Harbor Statement This presentation contains forward-looking statements within the meaning of the Securities Act of 1933 and the Securities Exchange Act of 1934, as amended by the Private Securities Litigation Reform Act of 1995, and include the intent, belief or
Slide 3: MedAssets Business Overview
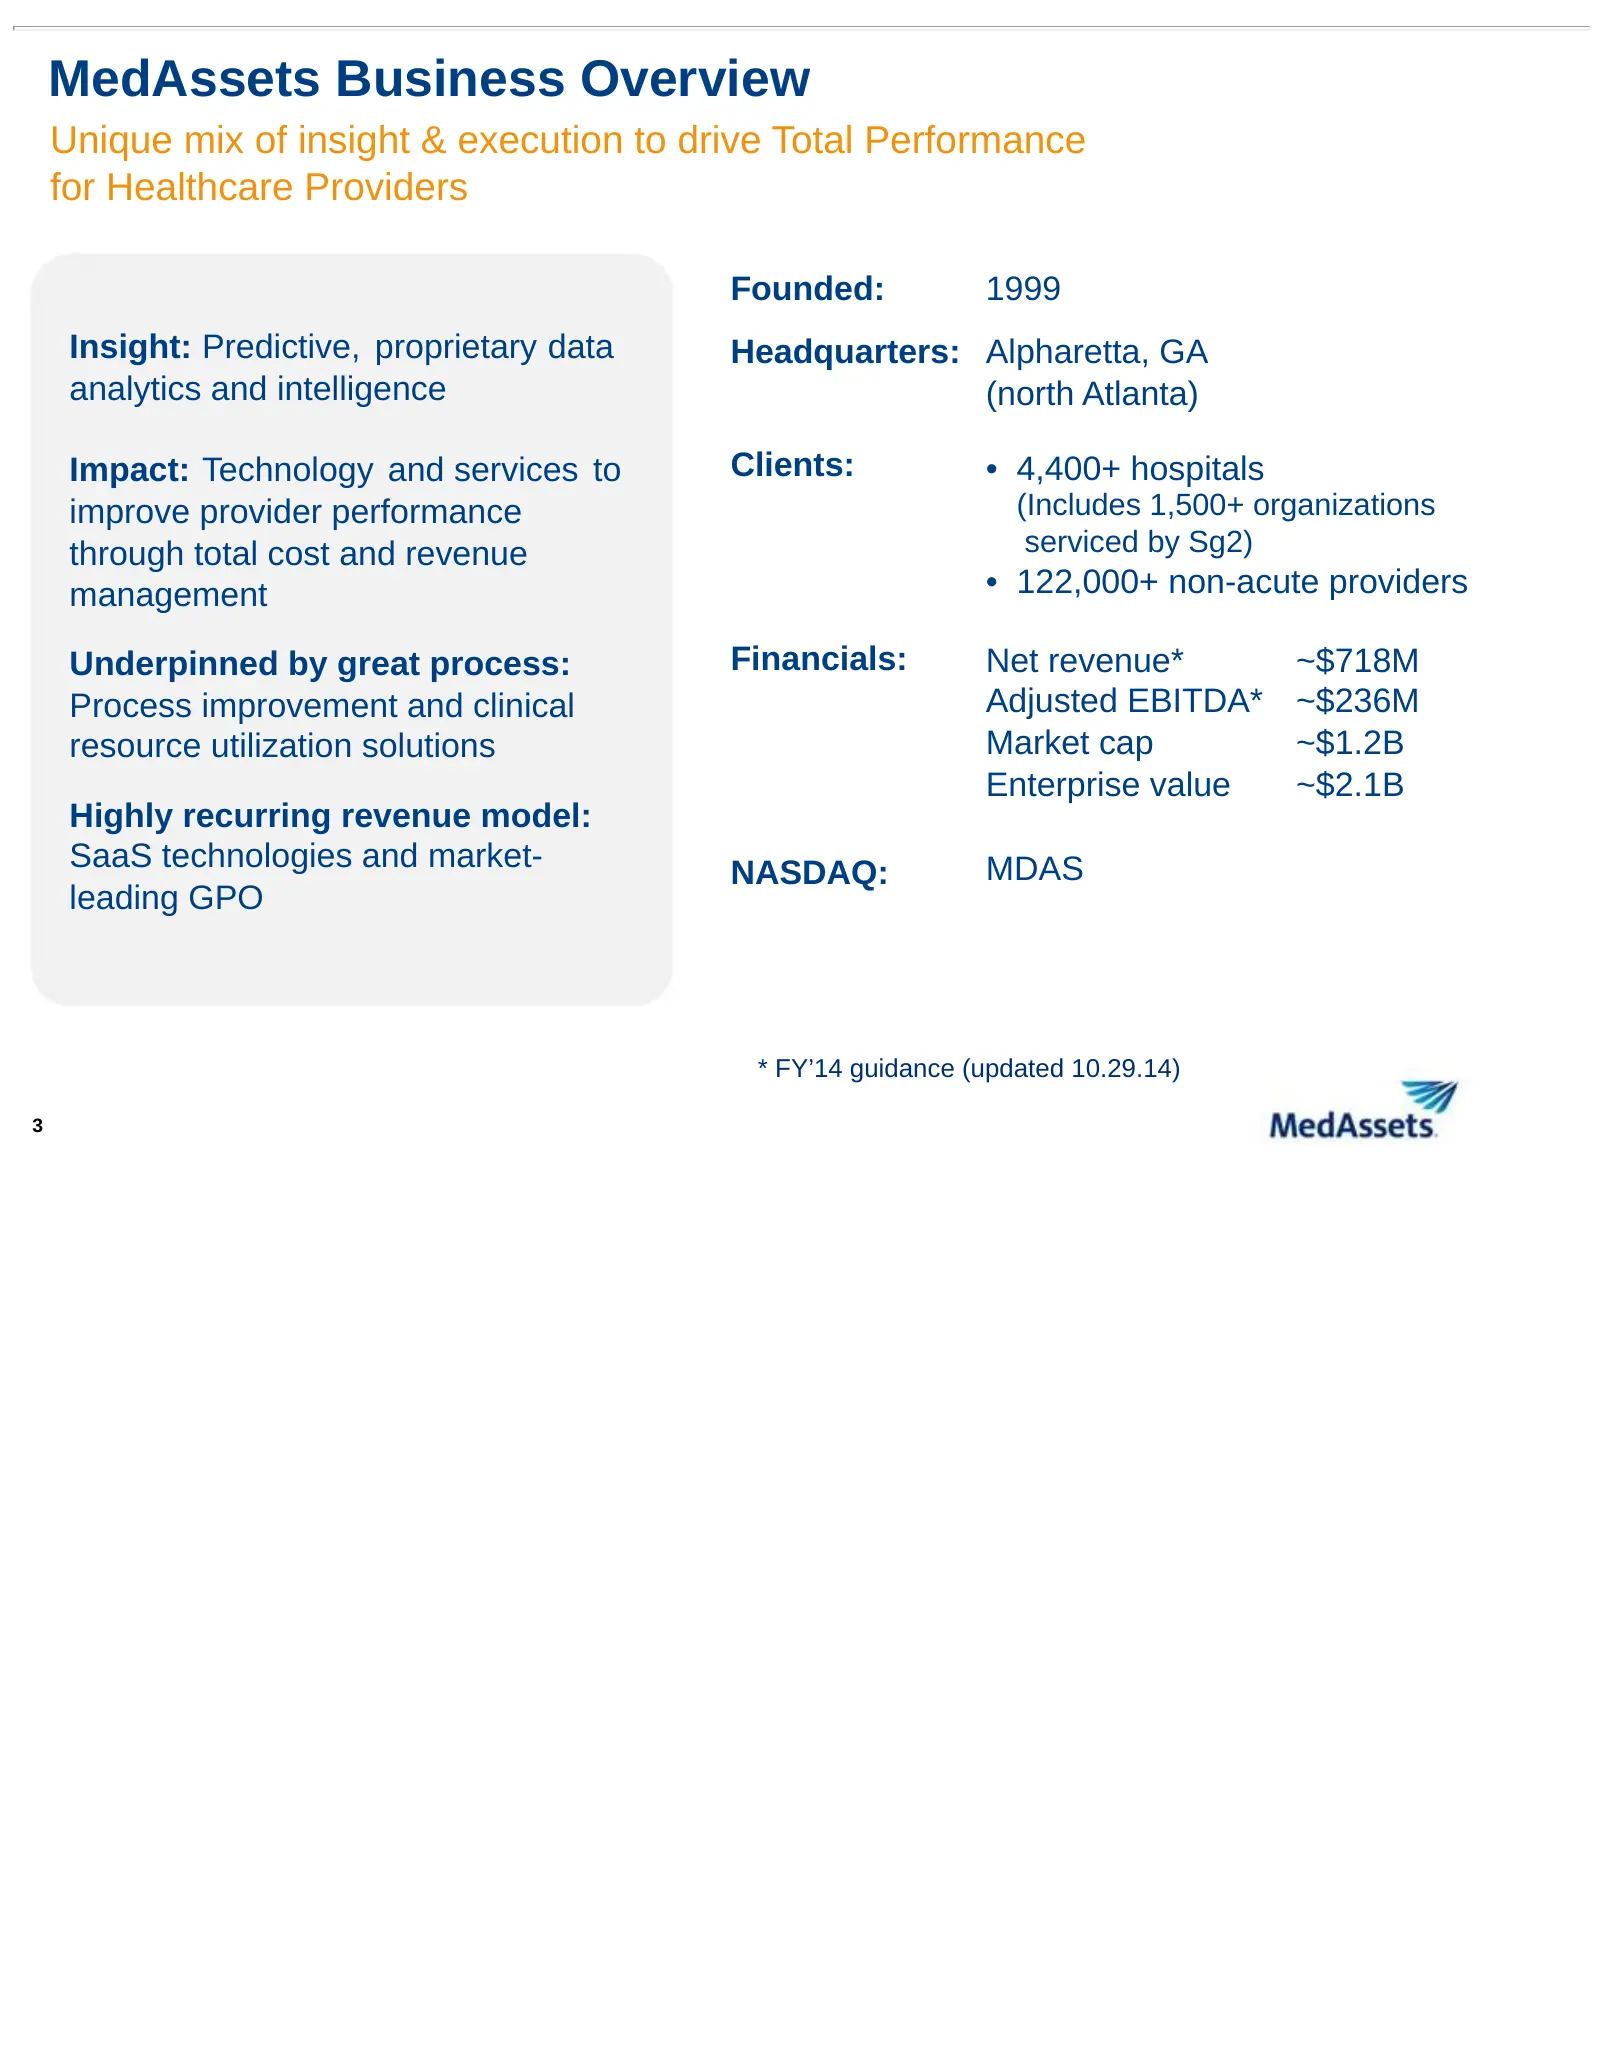
MedAssets Business Overview Unique mix of insight & execution to drive Total Performance for Healthcare Providers Founded: 1999 Insight: Predictive, proprietary data Headquarters: Alpharetta, GA analytics and intelligence (north Atlanta) Impact: Technology and services to Clients: • 4,400+ hospitals
Slide 4: Evolving Market Dynamics Offer Opportunities
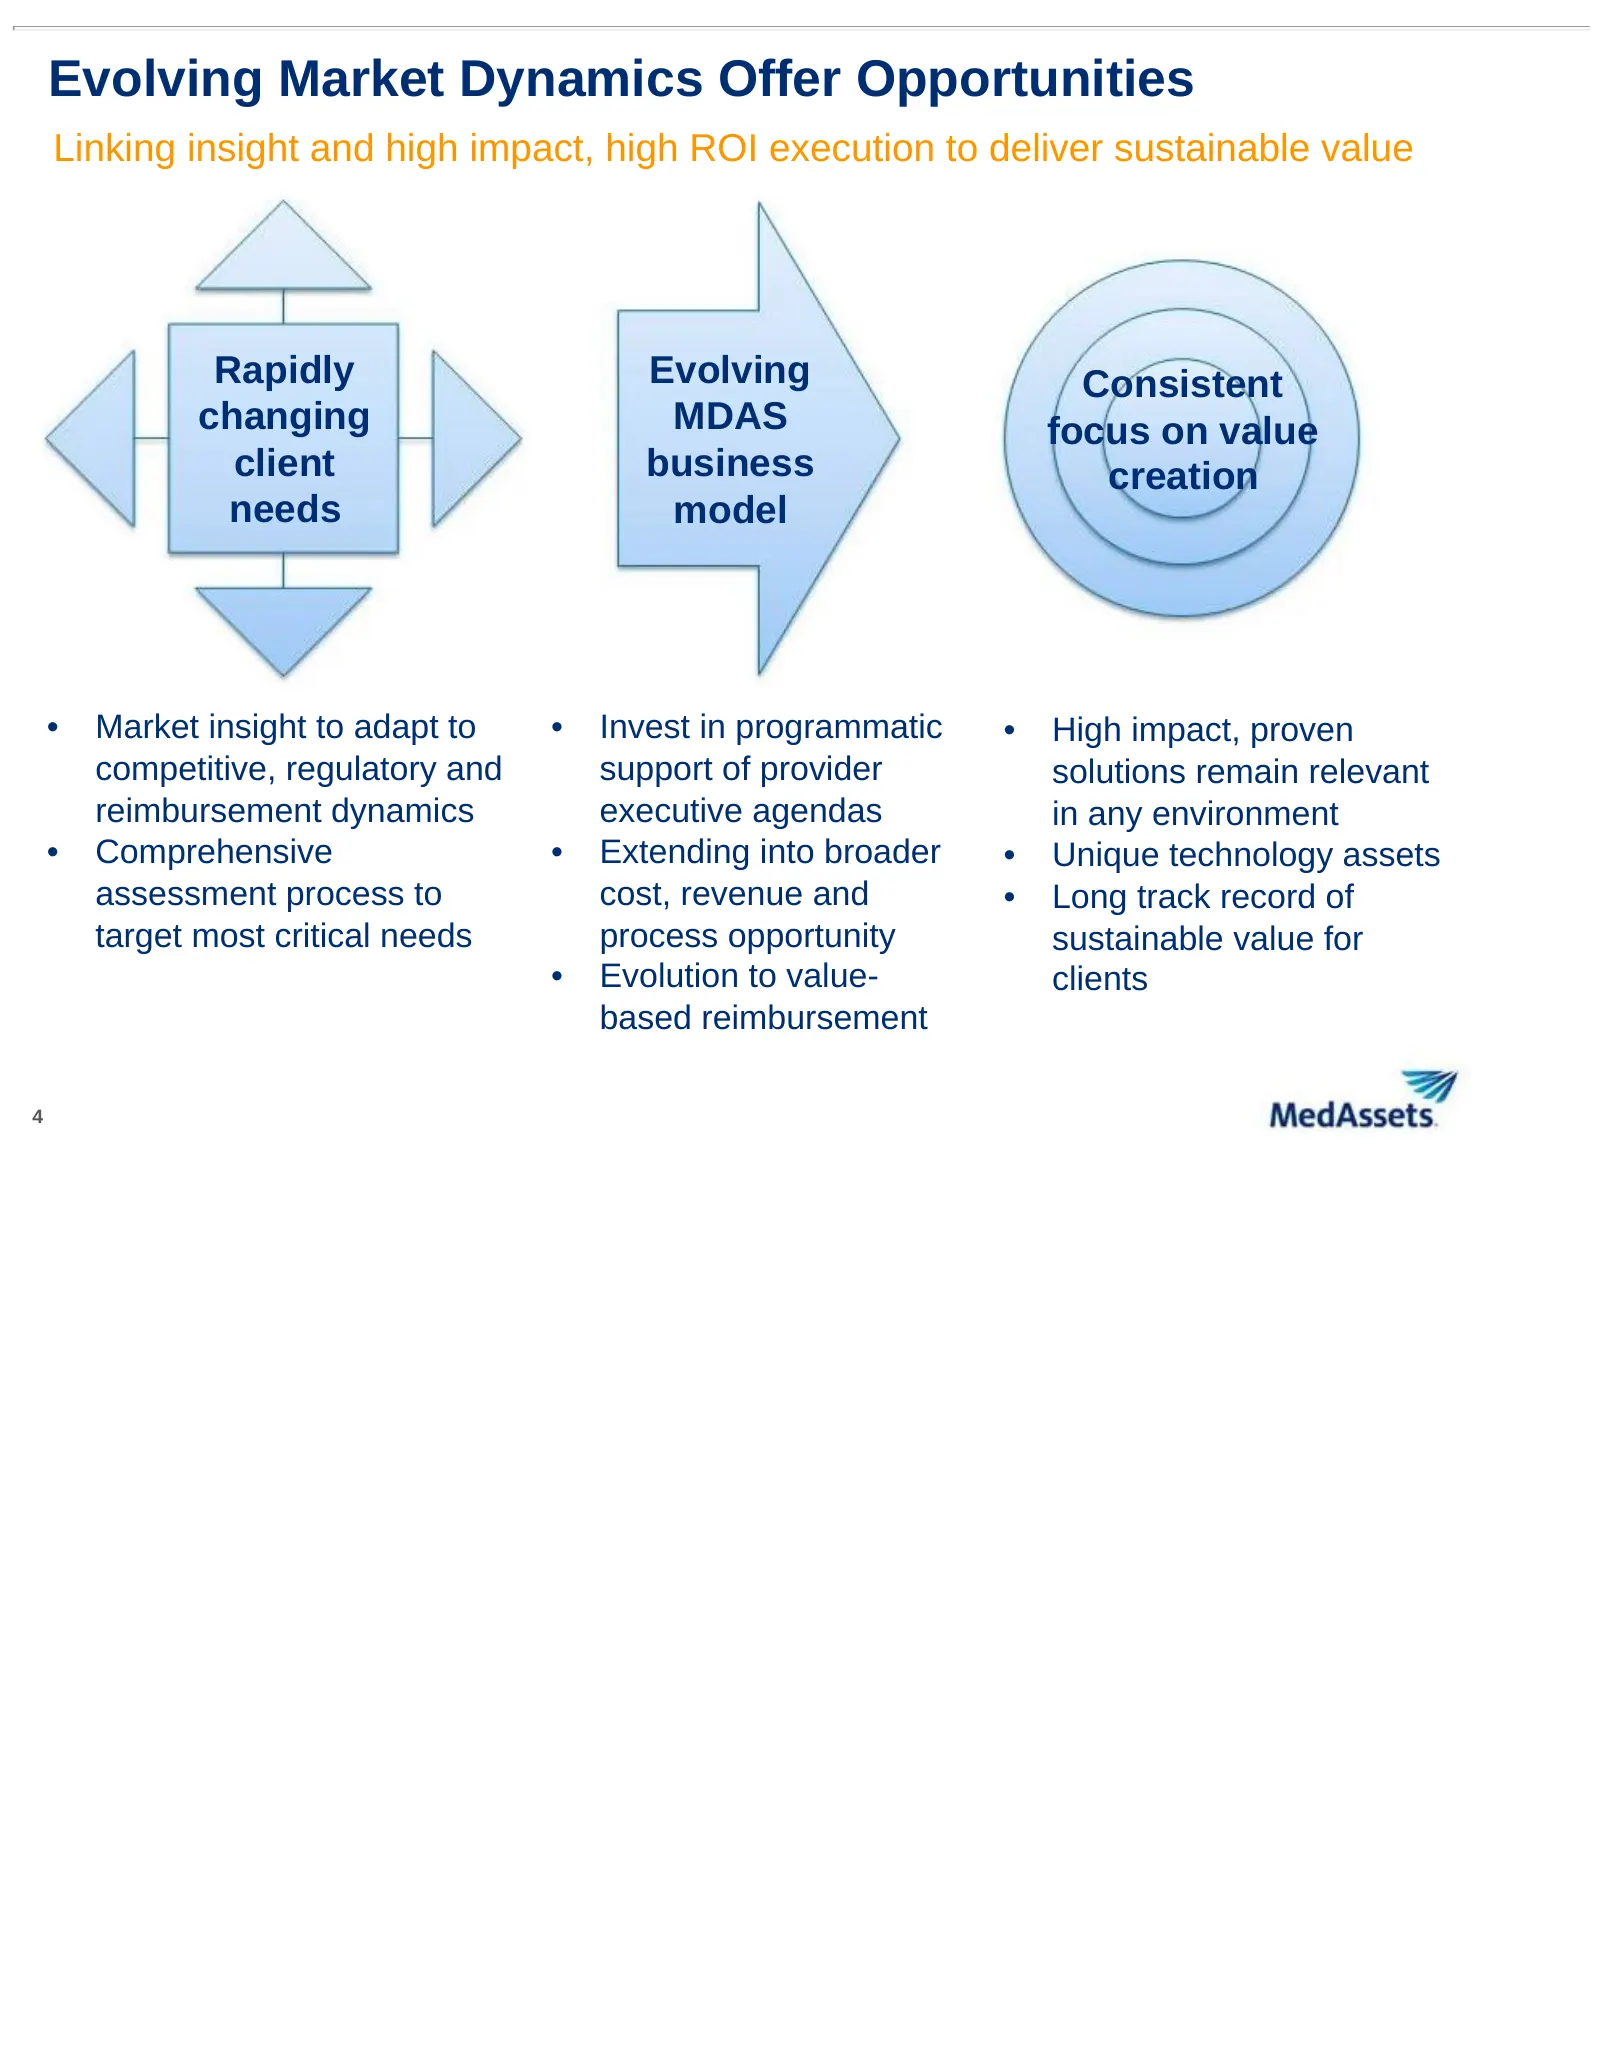
Evolving Market Dynamics Offer Opportunities Linking insight and high impact, high ROI execution to deliver sustainable value Rapidly Evolving Consistent changing MDAS focus on value client business creation needs model • Market insight to adapt to • Invest in programmatic • High impact, proven comp
Slide 5: Performance Partner Delivering High ROI Results
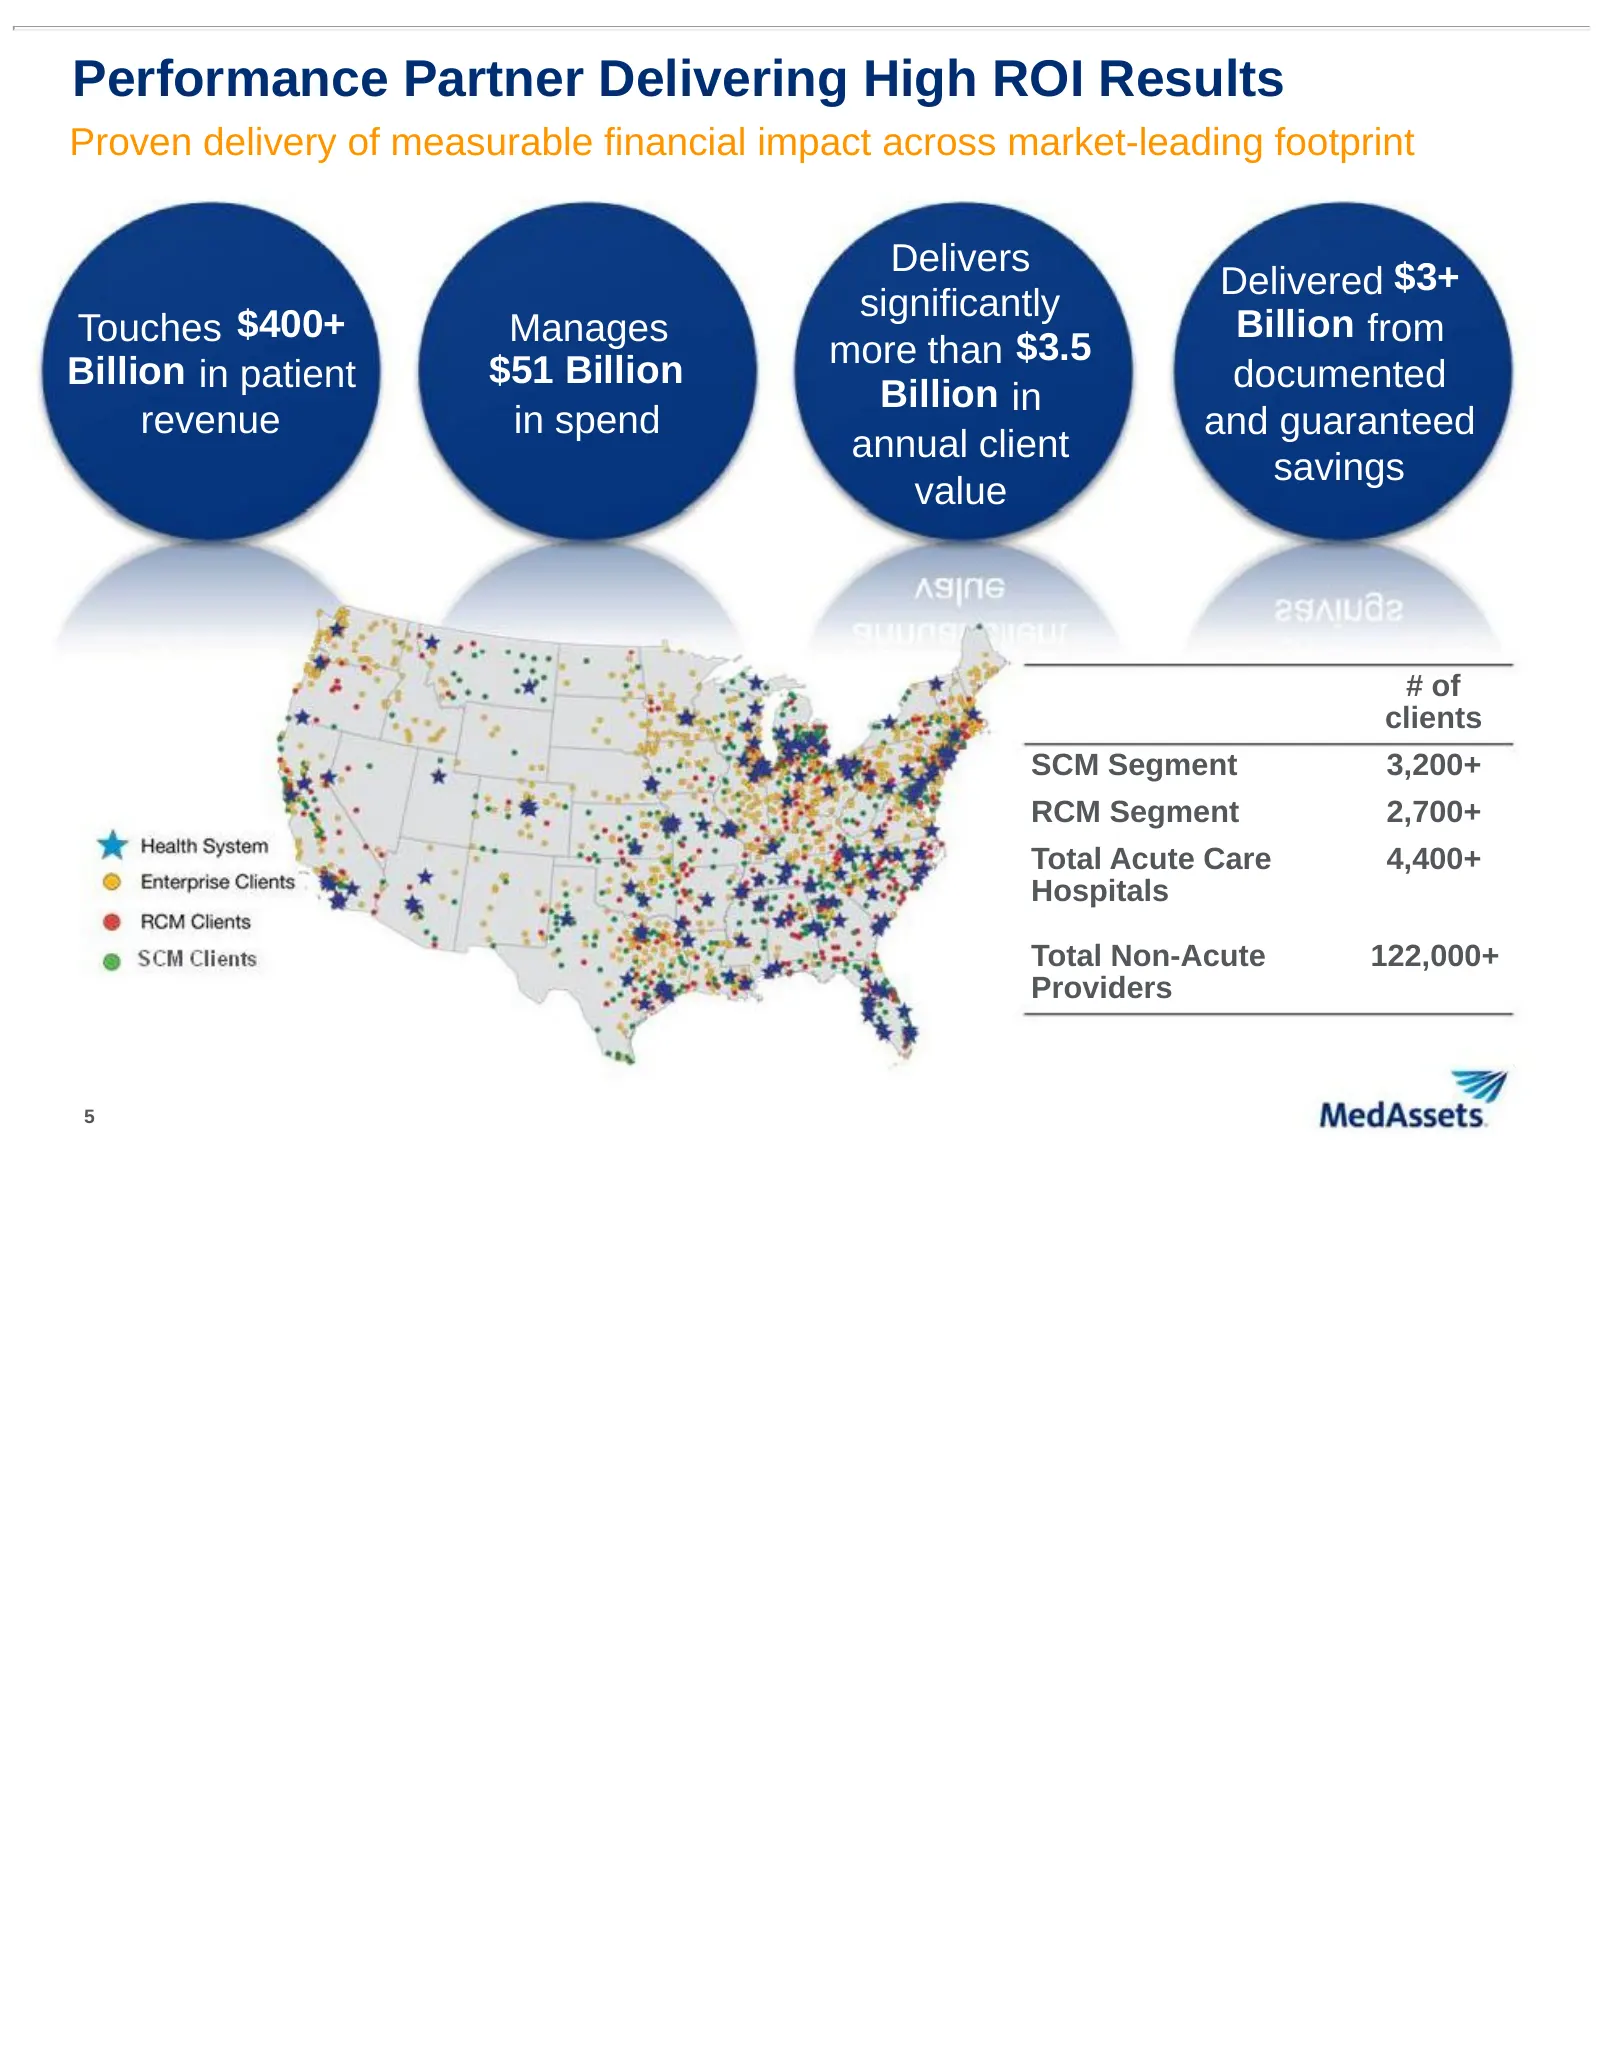
Performance Partner Delivering High ROI Results Proven delivery of measurable financial impact across market-leading footprint Delivers Delivered $3+ significantly Touches $400+ Manages Billion from $51 Billion more than $3.5 Billion in patient documented Billion in revenue in spend and guaranteed a
Slide 6: Broad Capabilities to Deliver Total Performance
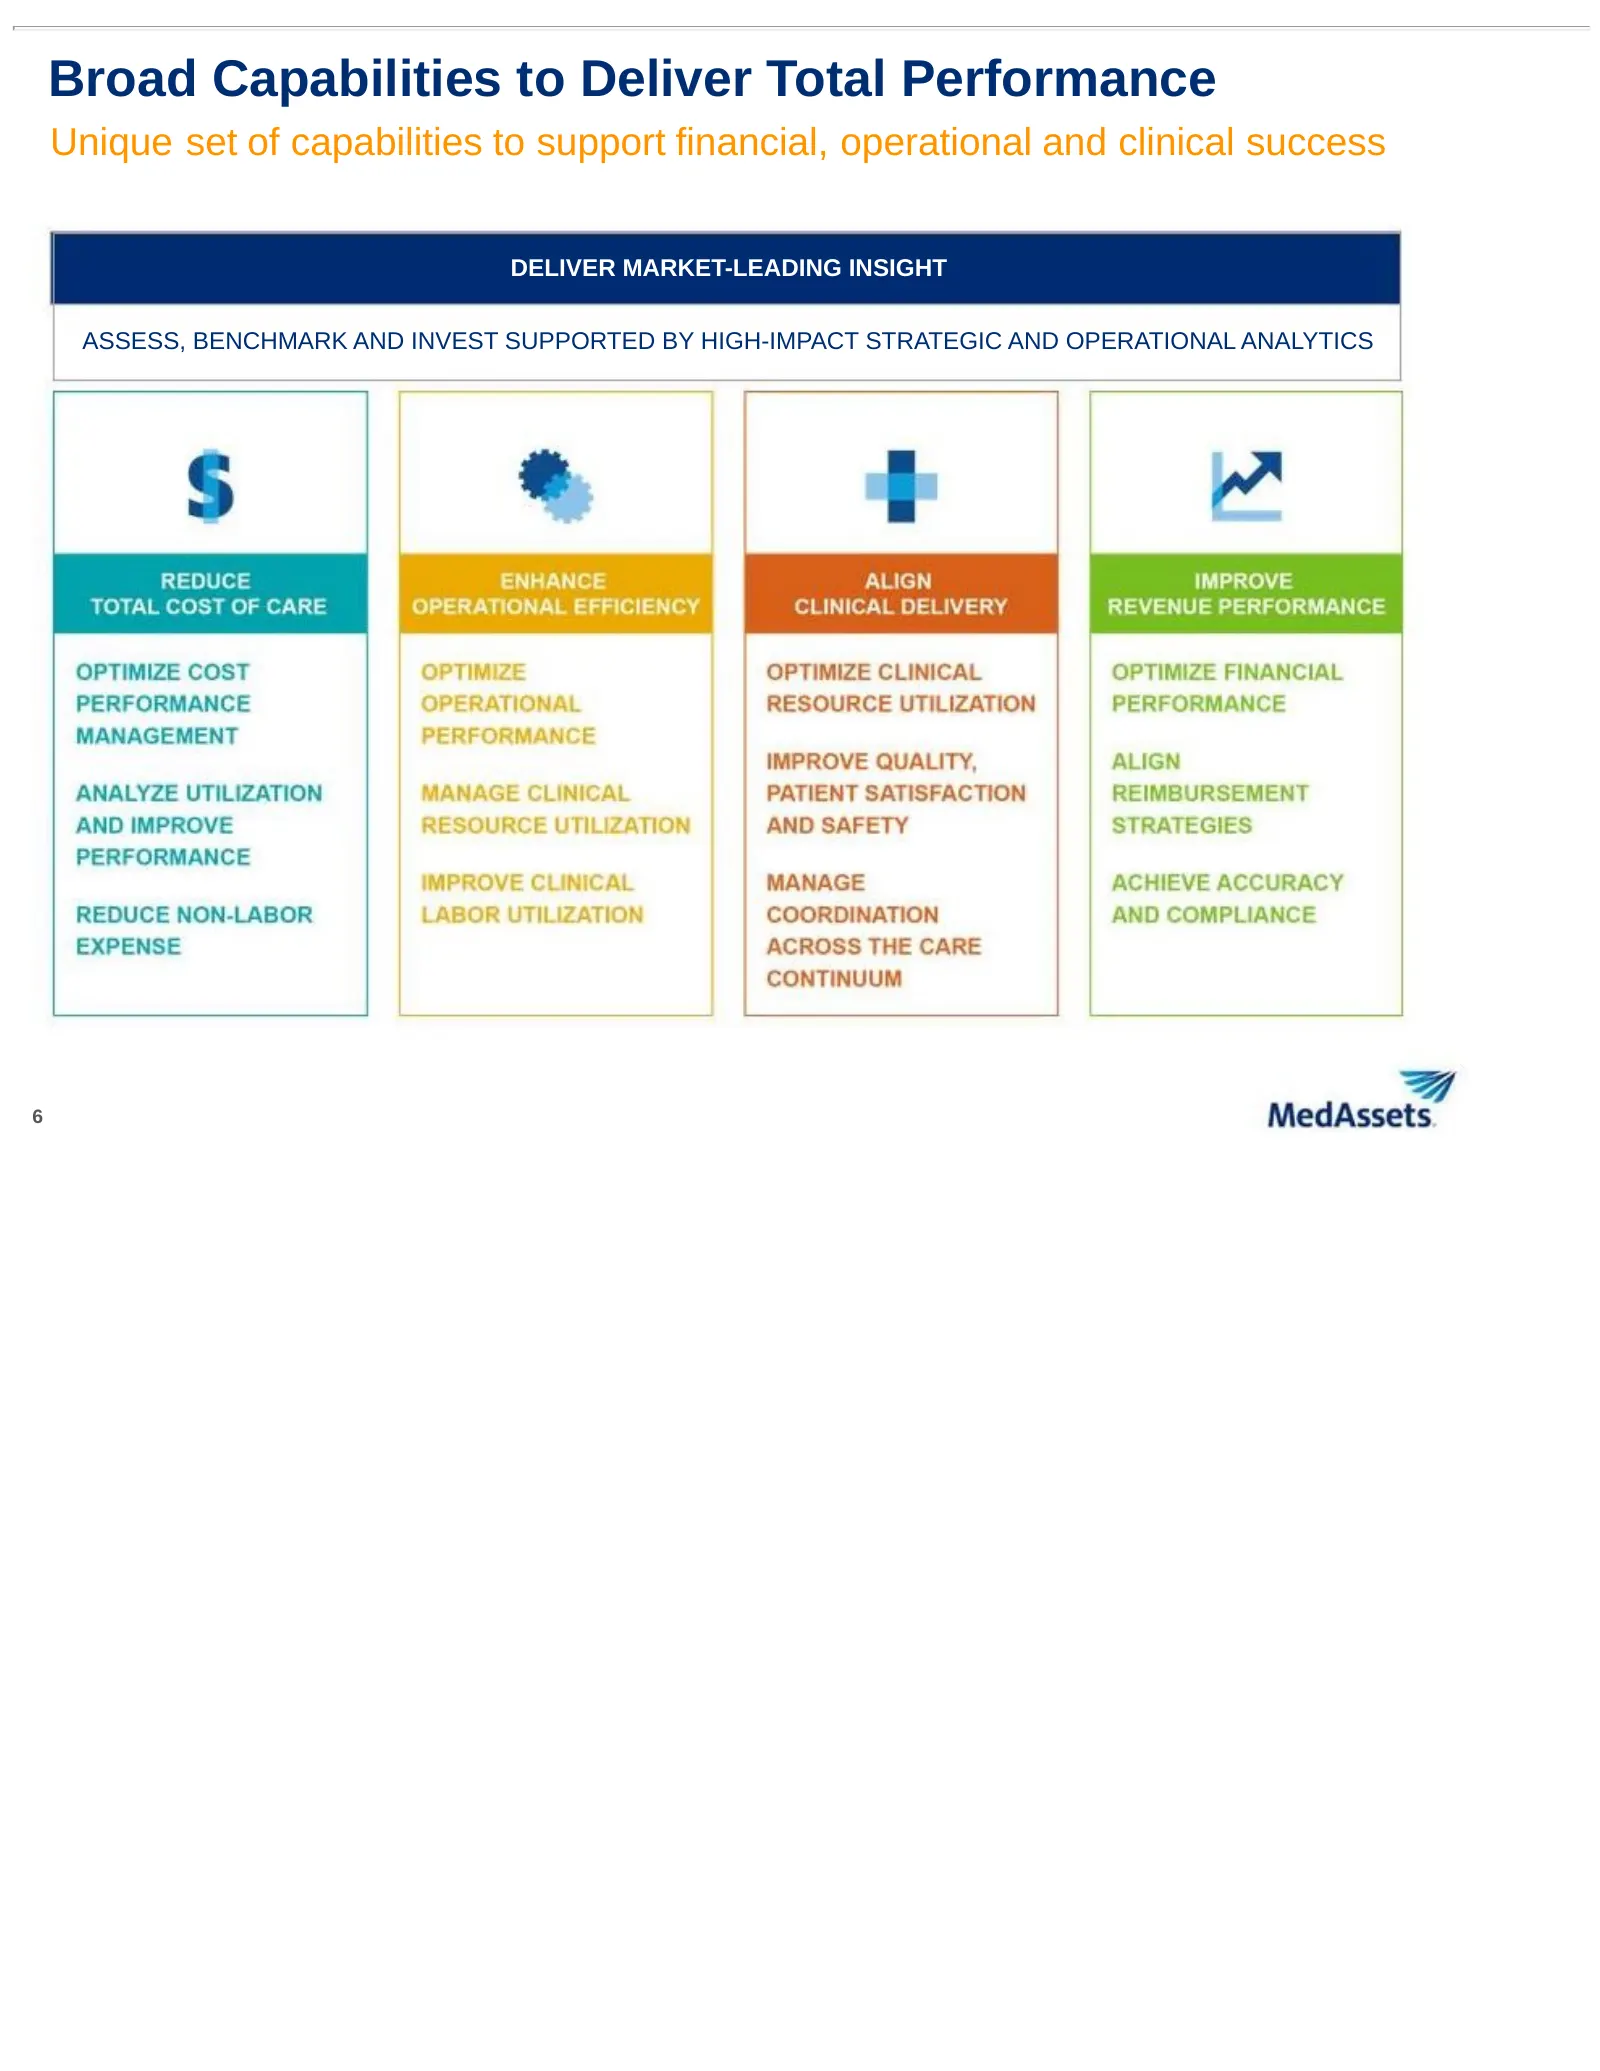
Broad Capabilities to Deliver Total Performance Unique set of capabilities to support financial, operational and clinical success DELIVER MARKET-LEADING INSIGHT ASSESS, BENCHMARK AND INVEST SUPPORTED BY HIGH-IMPACT STRATEGIC AND OPERATIONAL ANALYTICS 6
Slide 7: Two Primary Business Segments
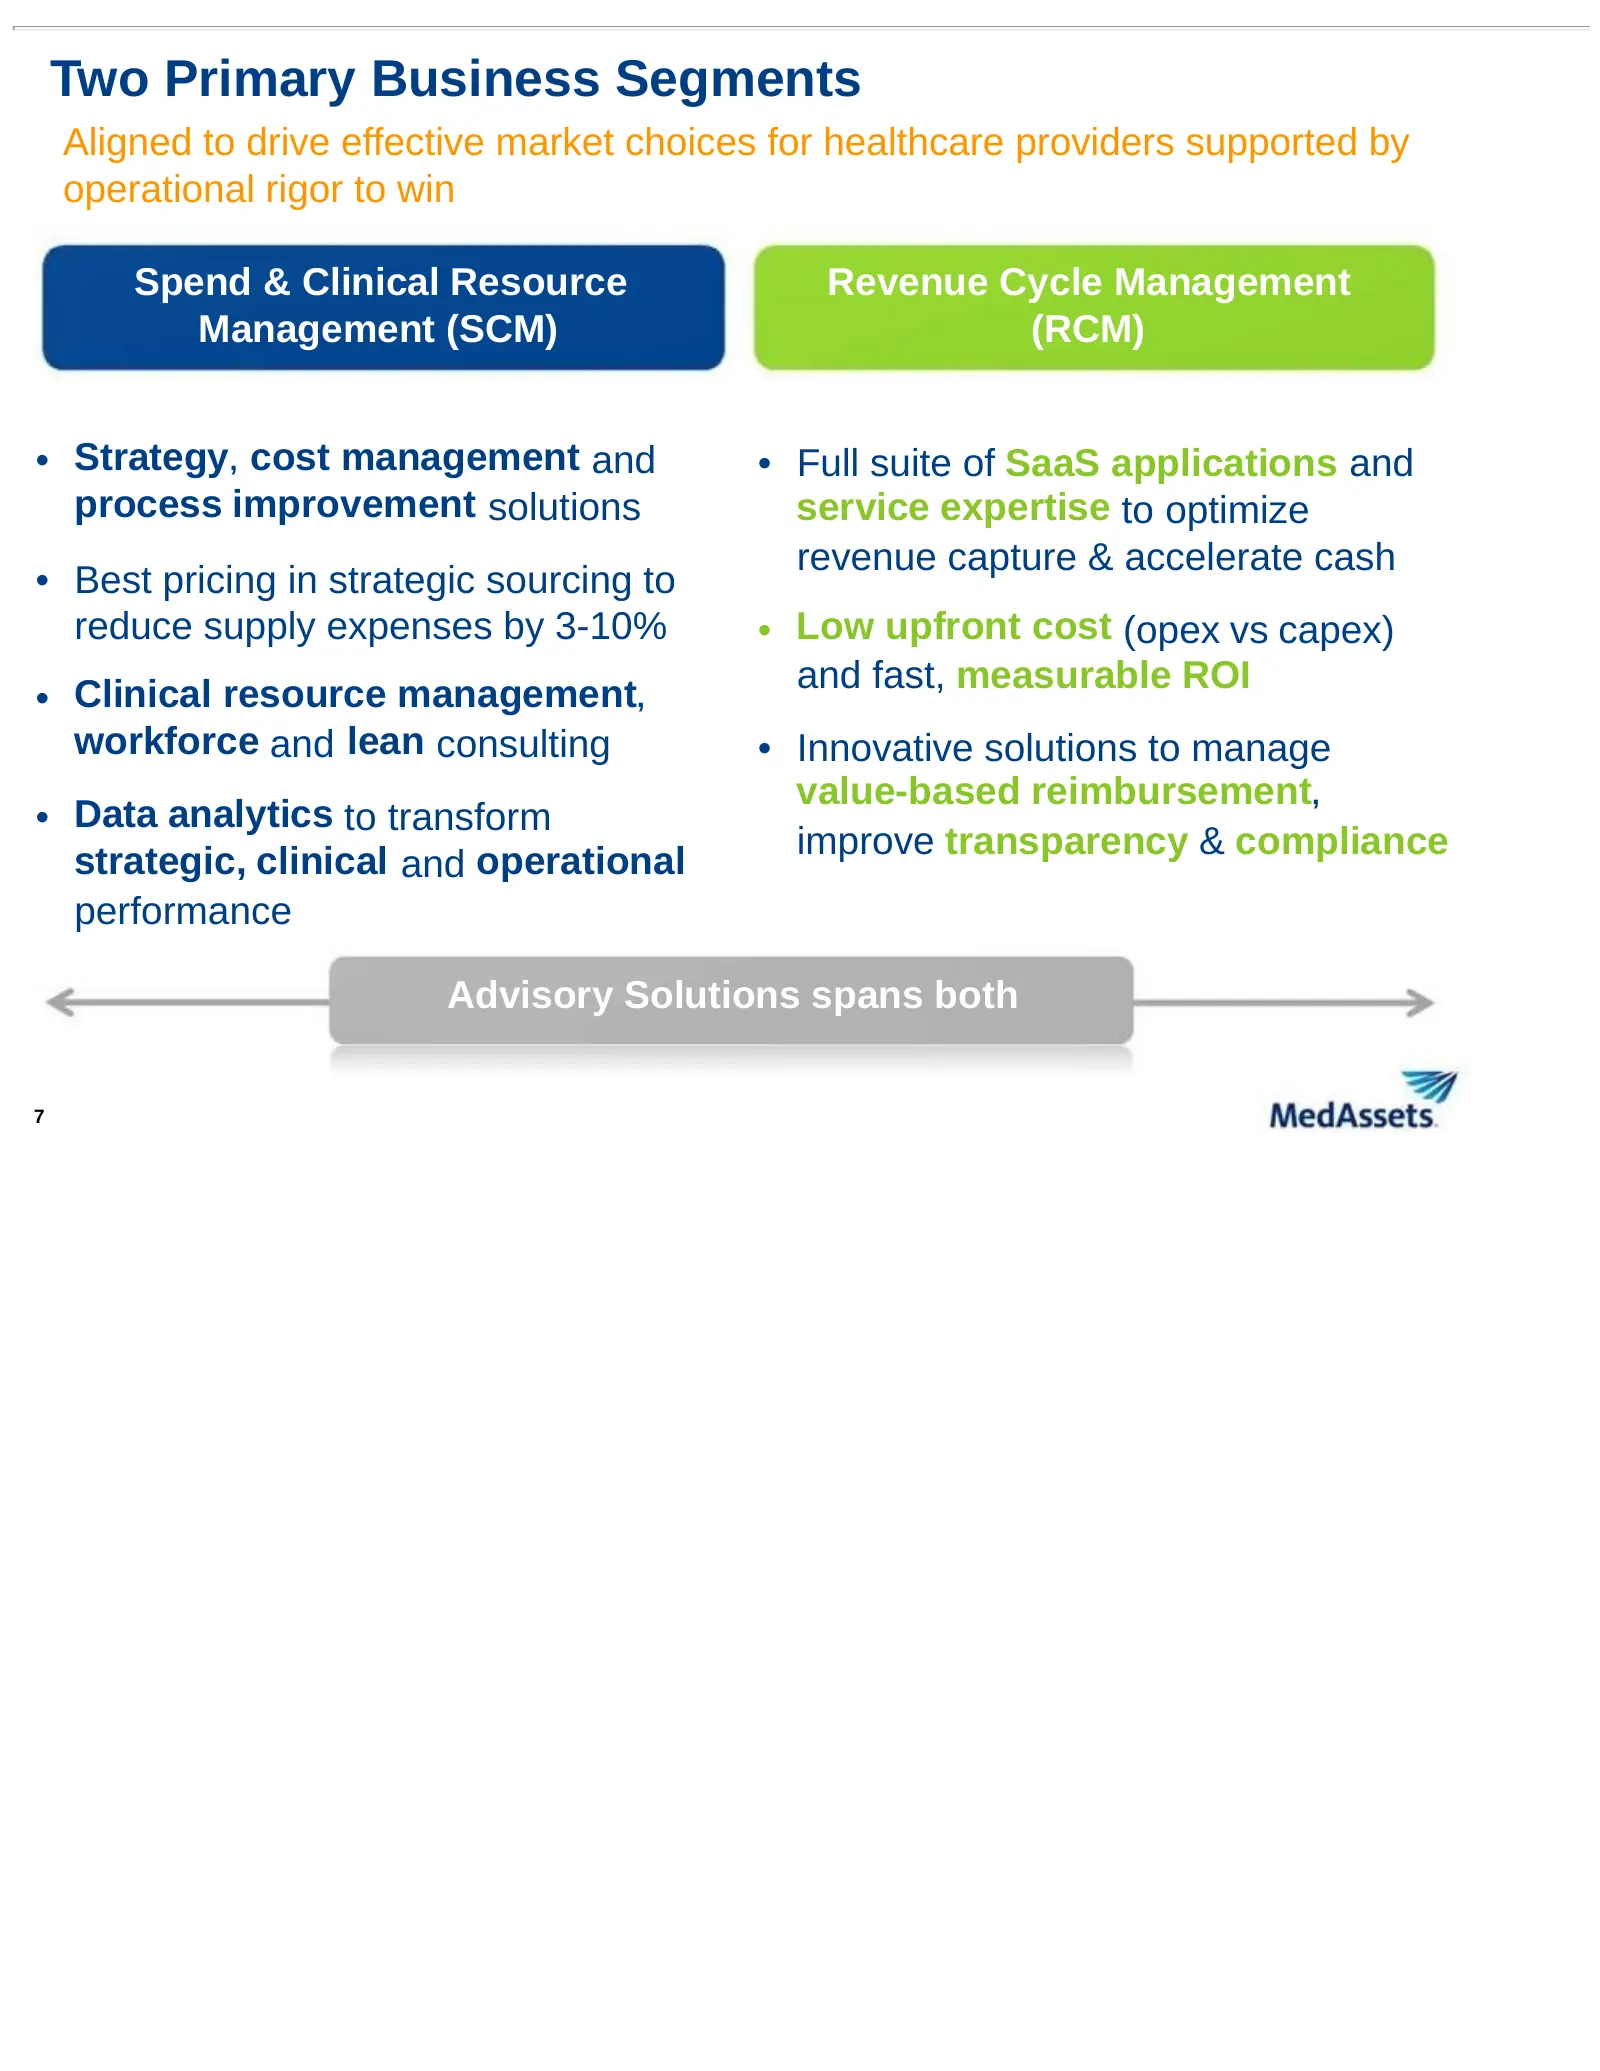
Two Primary Business Segments Aligned to drive effective market choices for healthcare providers supported by operational rigor to win Spend & Clinical Resource Revenue Cycle Management Management (SCM) (RCM) • Strategy, cost management and • Full suite of SaaS applications and process improvement s
Slide 8: Delivering Total Performance Management
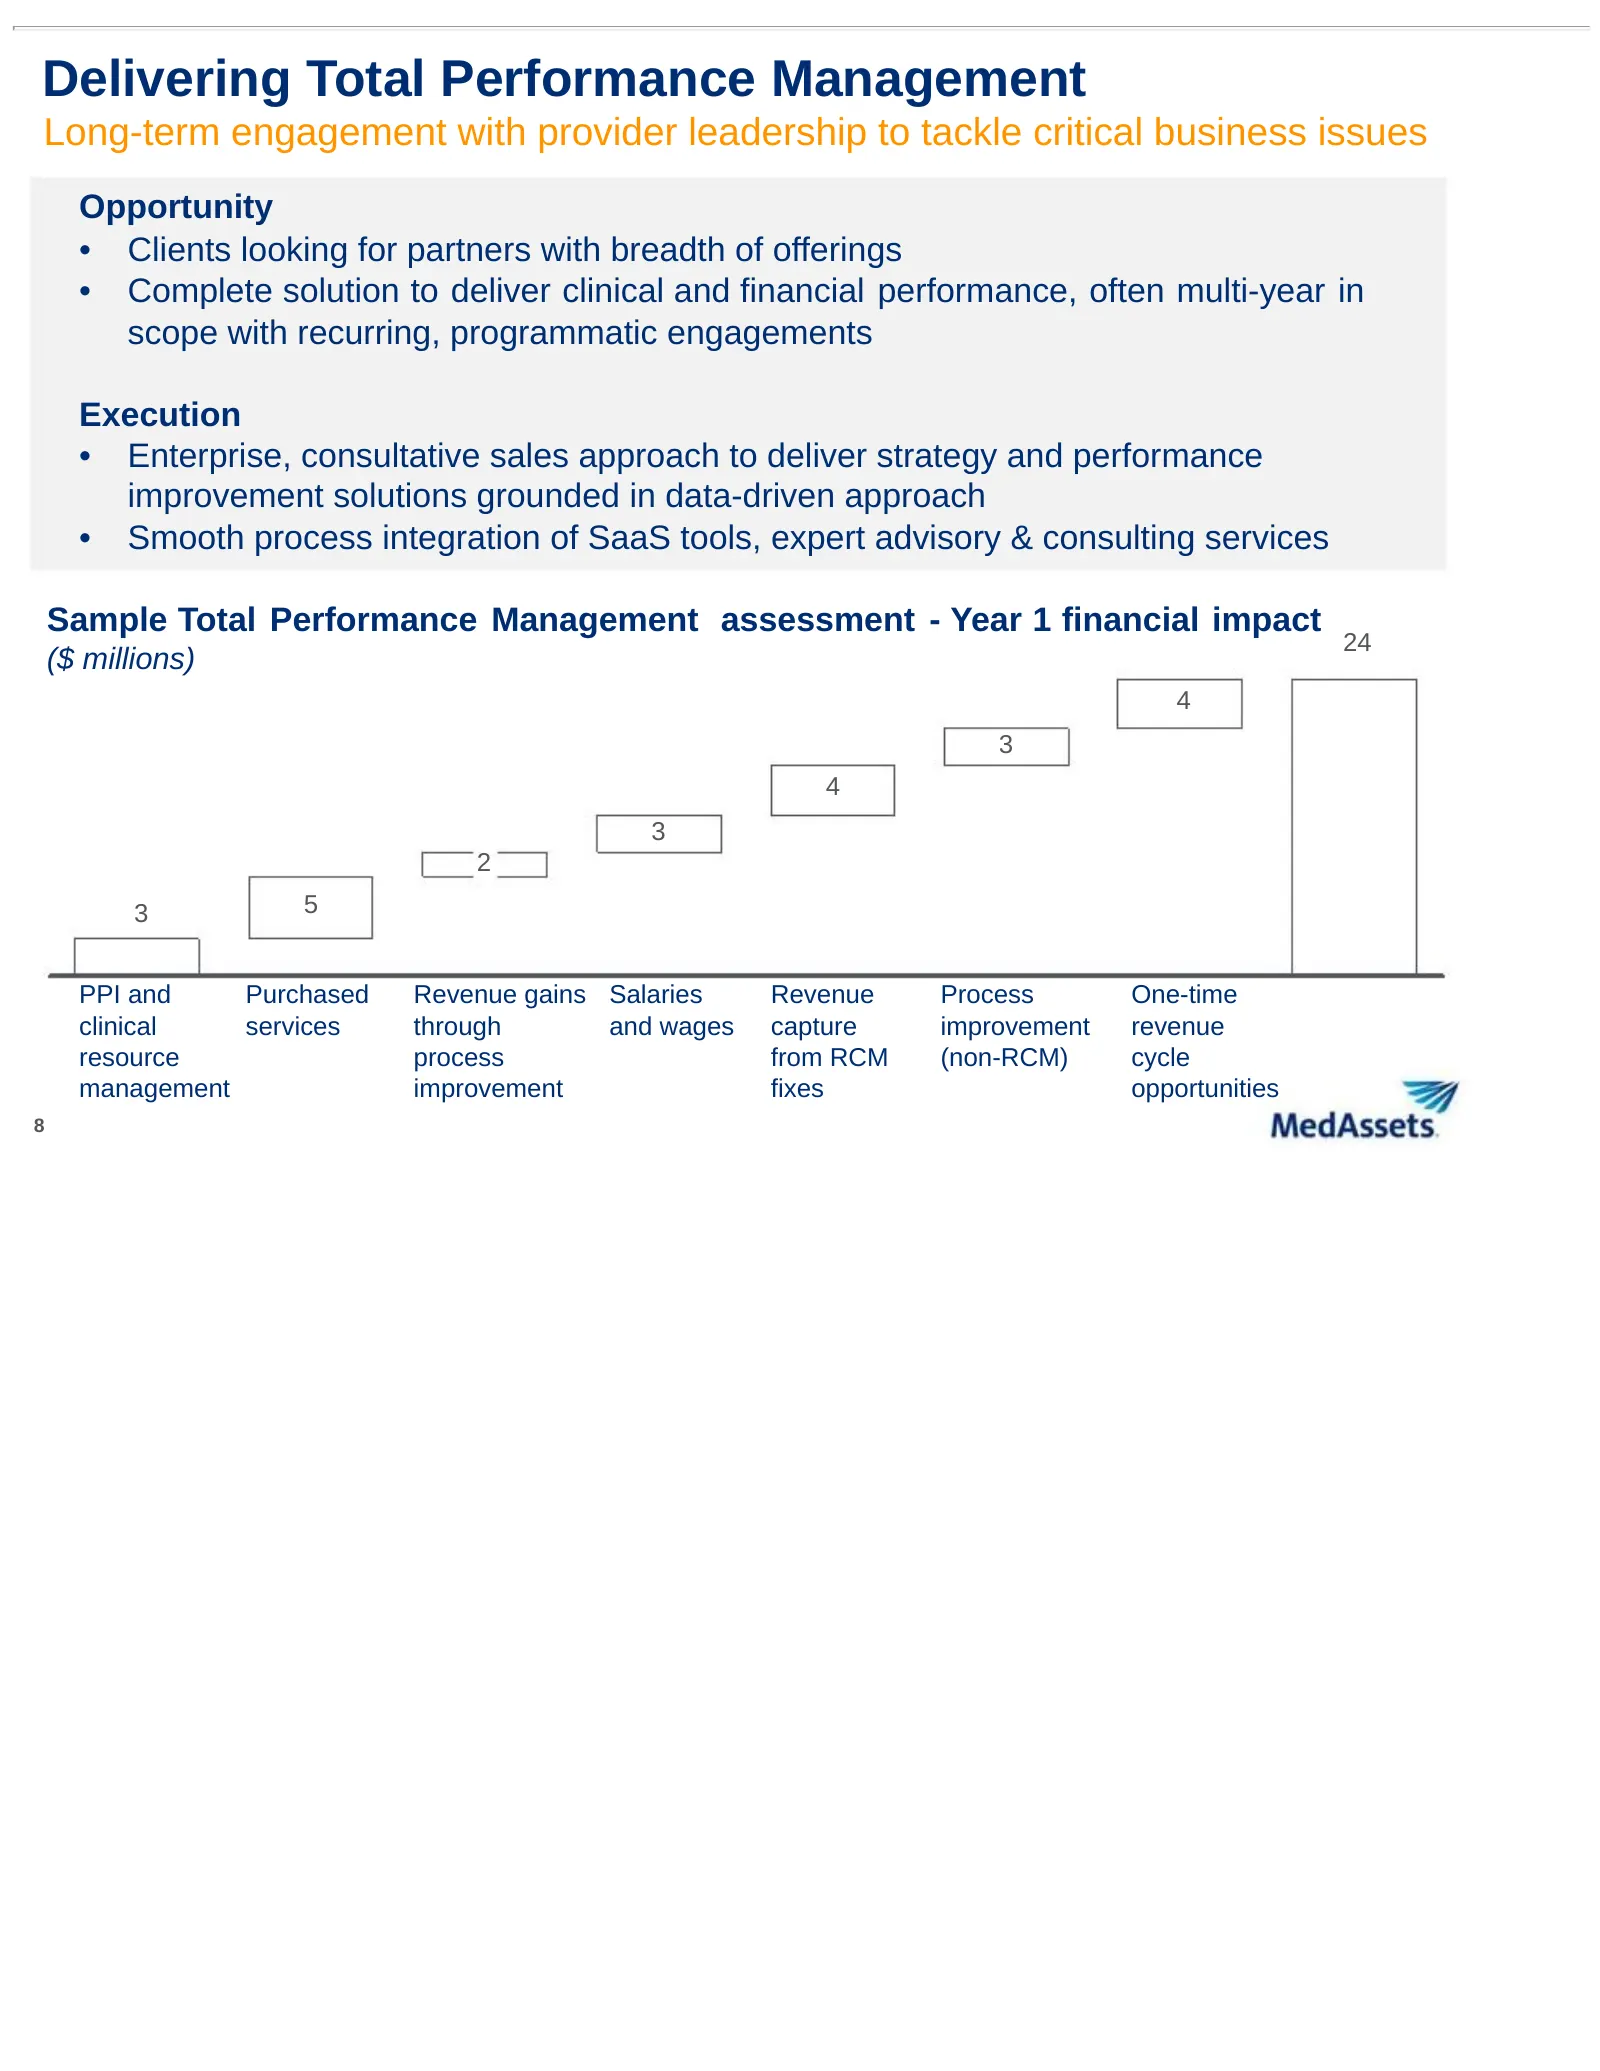
Delivering Total Performance Management Long-term engagement with provider leadership to tackle critical business issues Opportunity • Clients looking for partners with breadth of offerings • Complete solution to deliver clinical and financial performance, often multi-year in scope with recurring, p
Slide 9: 2014 Operational Update
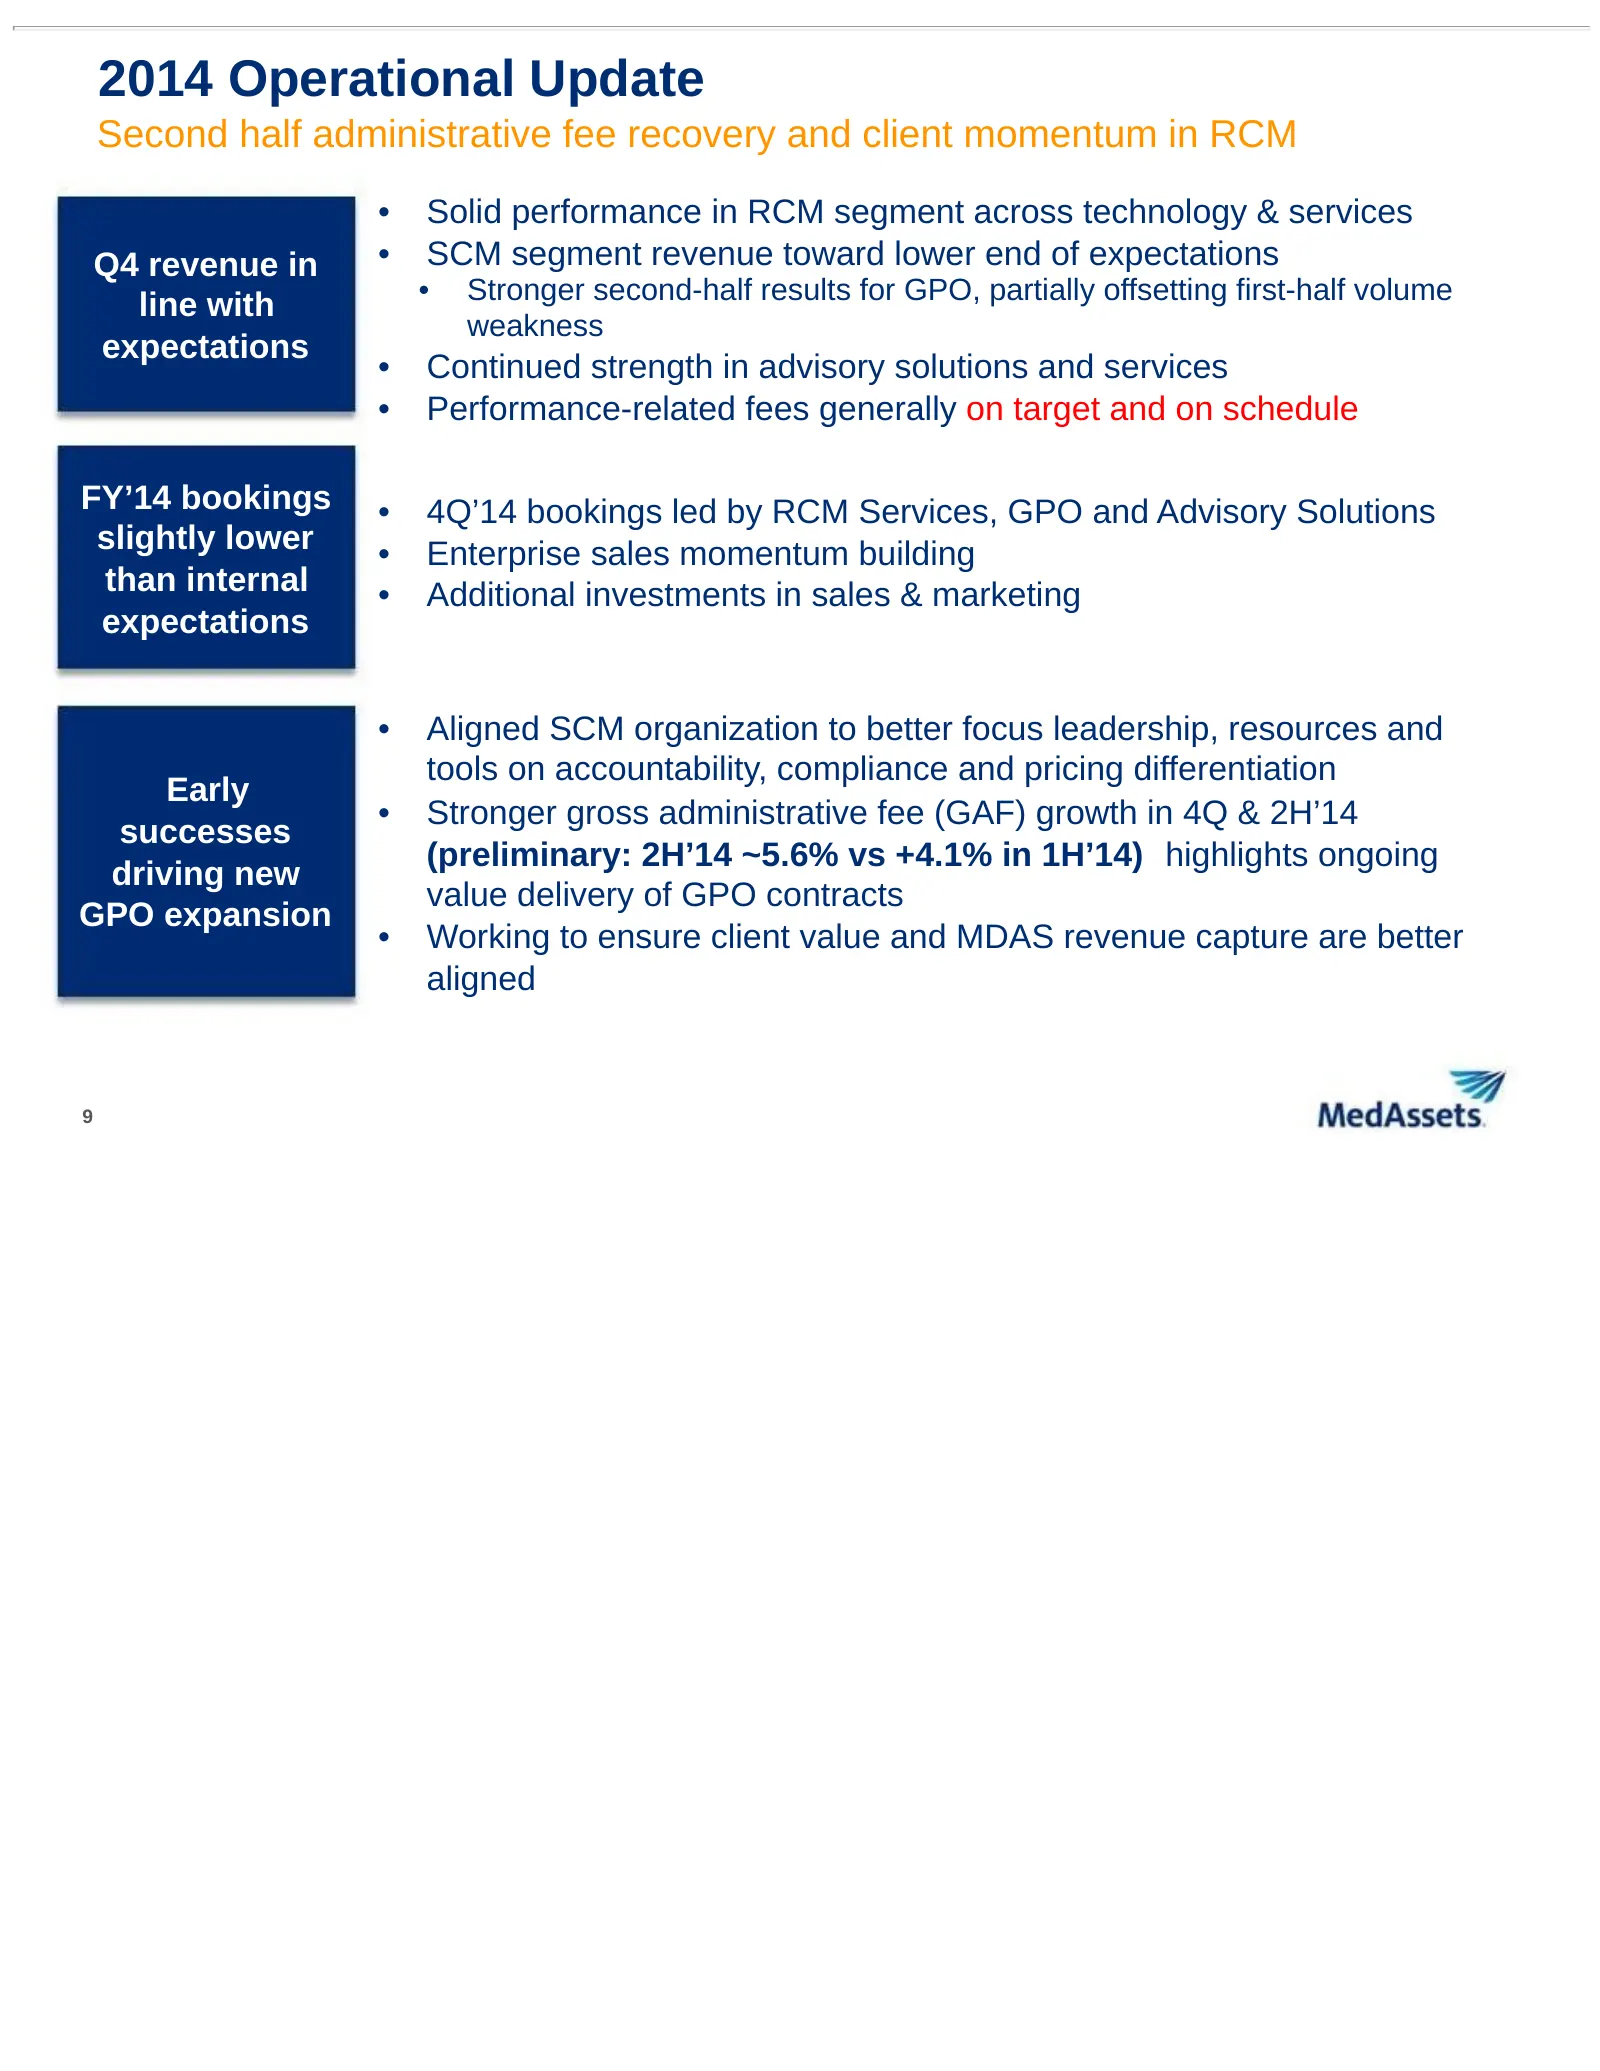
2014 Operational Update Second half administrative fee recovery and client momentum in RCM • Solid performance in RCM segment across technology & services Q4 revenue in • SCM segment revenue toward lower end of expectations • Stronger second-half results for GPO, partially offsetting first-half volu
Slide 10: Focused on Consistent, Long-Term Growth
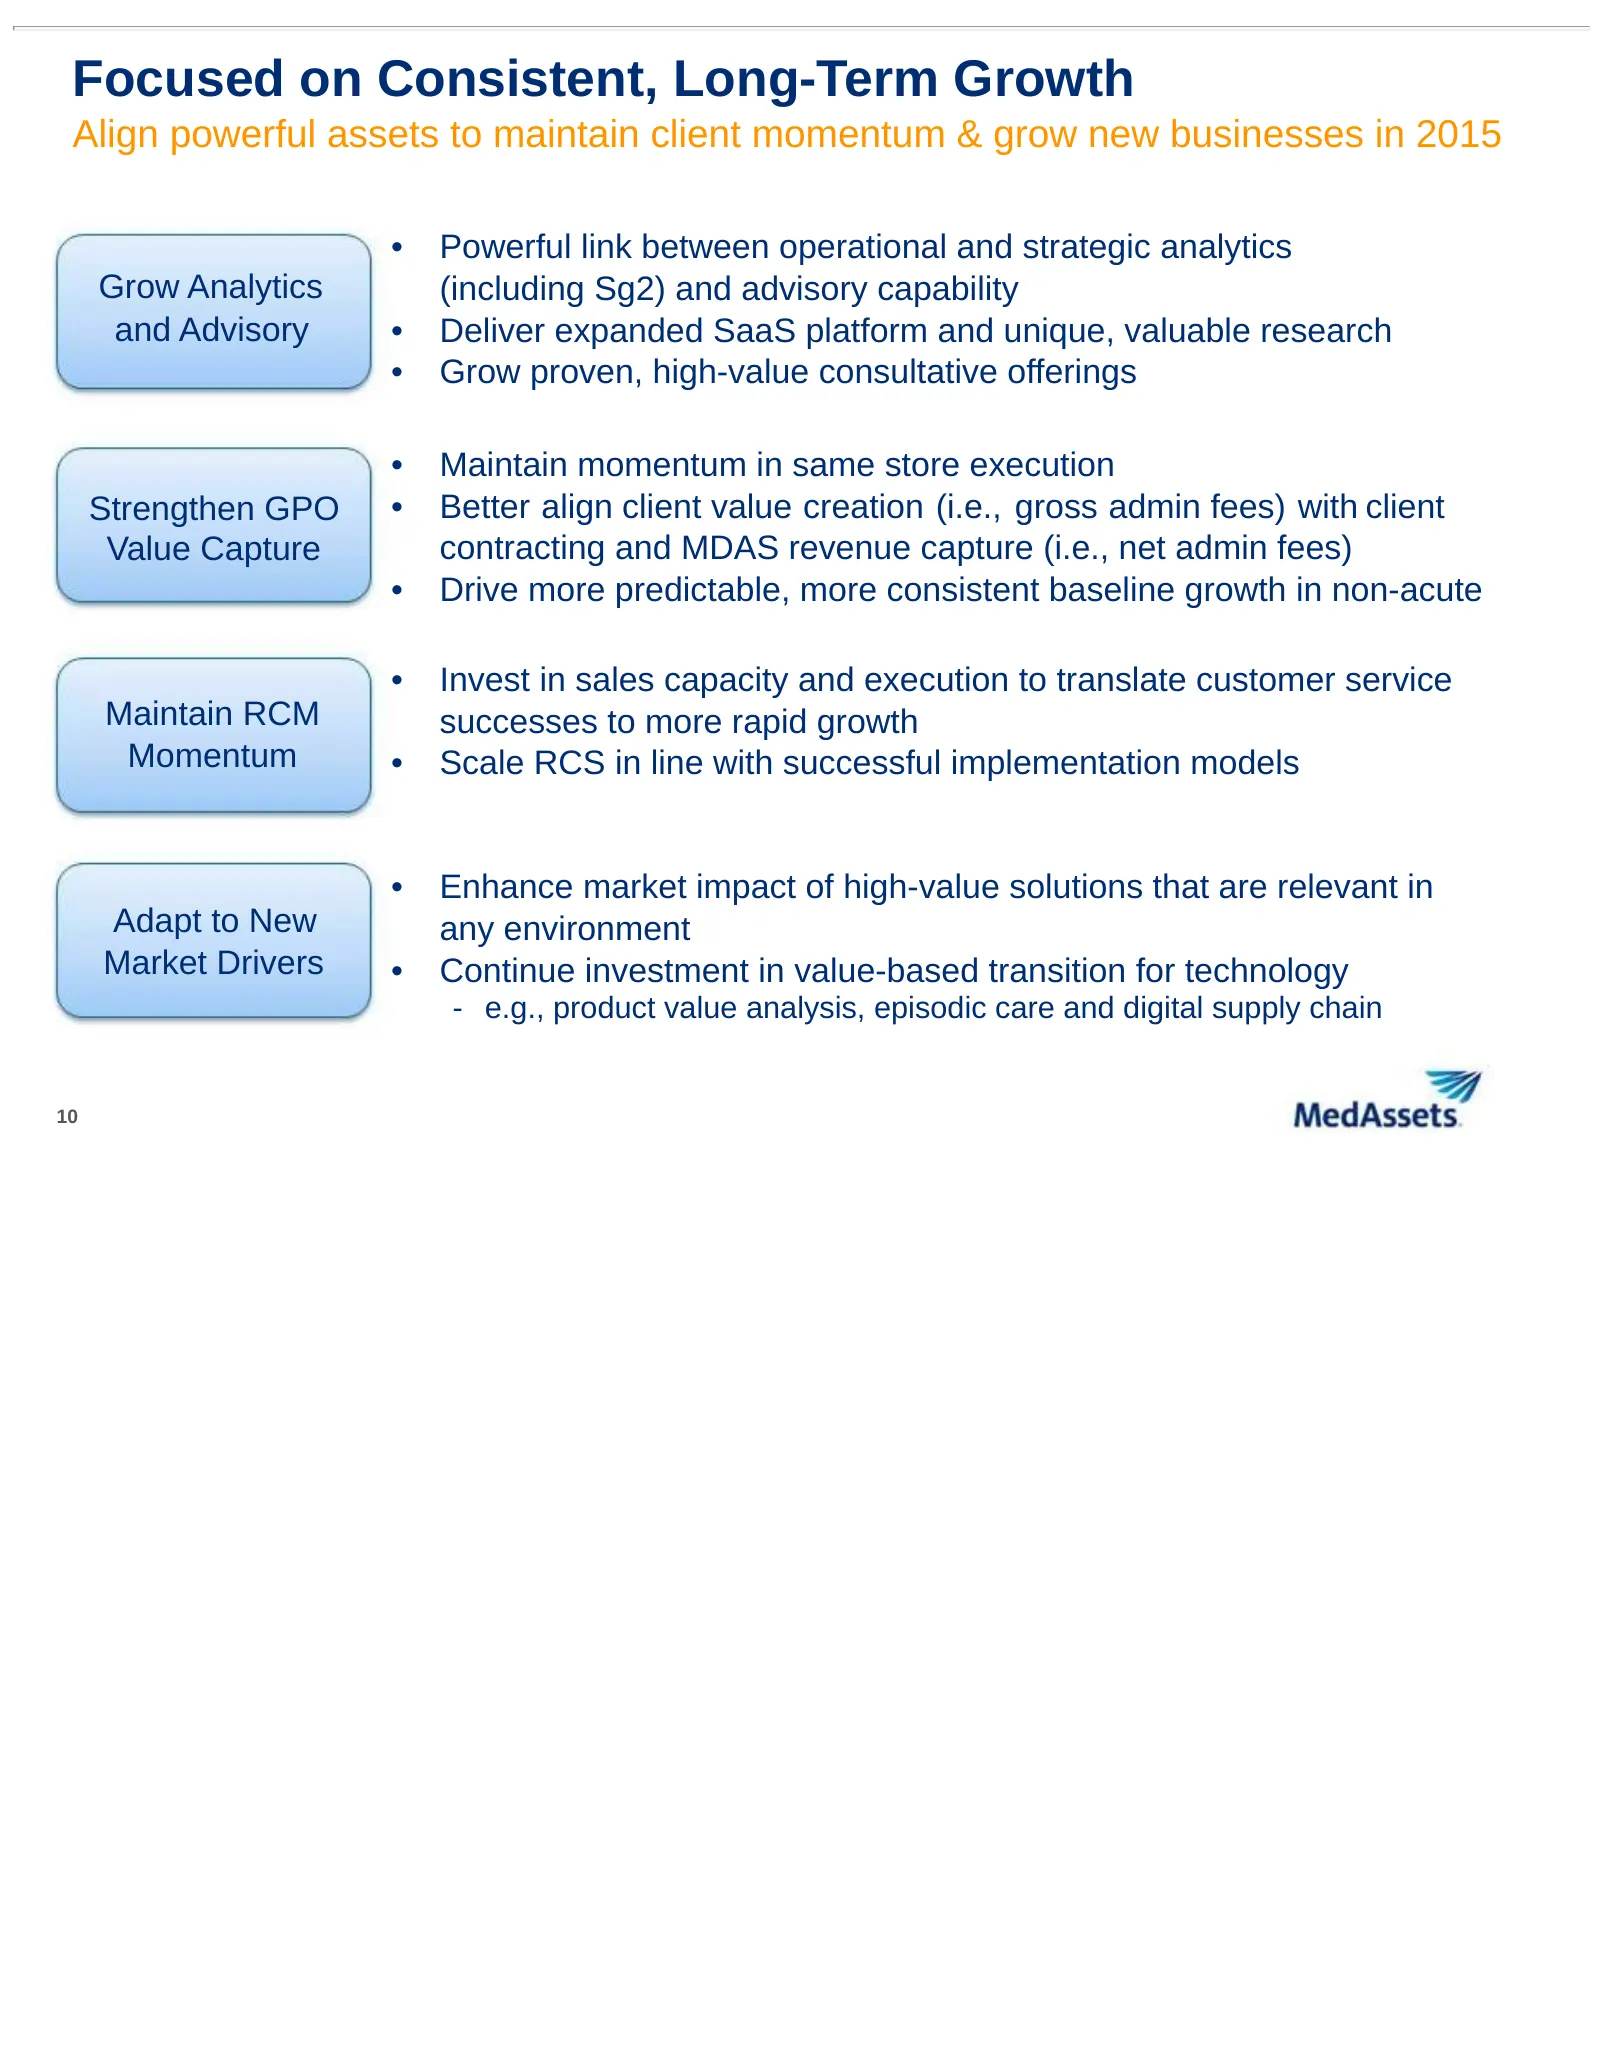
Focused on Consistent, Long-Term Growth Align powerful assets to maintain client momentum & grow new businesses in 2015 • Powerful link between operational and strategic analytics Grow Analytics (including Sg2) and advisory capability and Advisory • Deliver expanded SaaS platform and unique, valuabl
Slide 11: Sg2: Predictive Market Analytics, Expert-led Intelligence
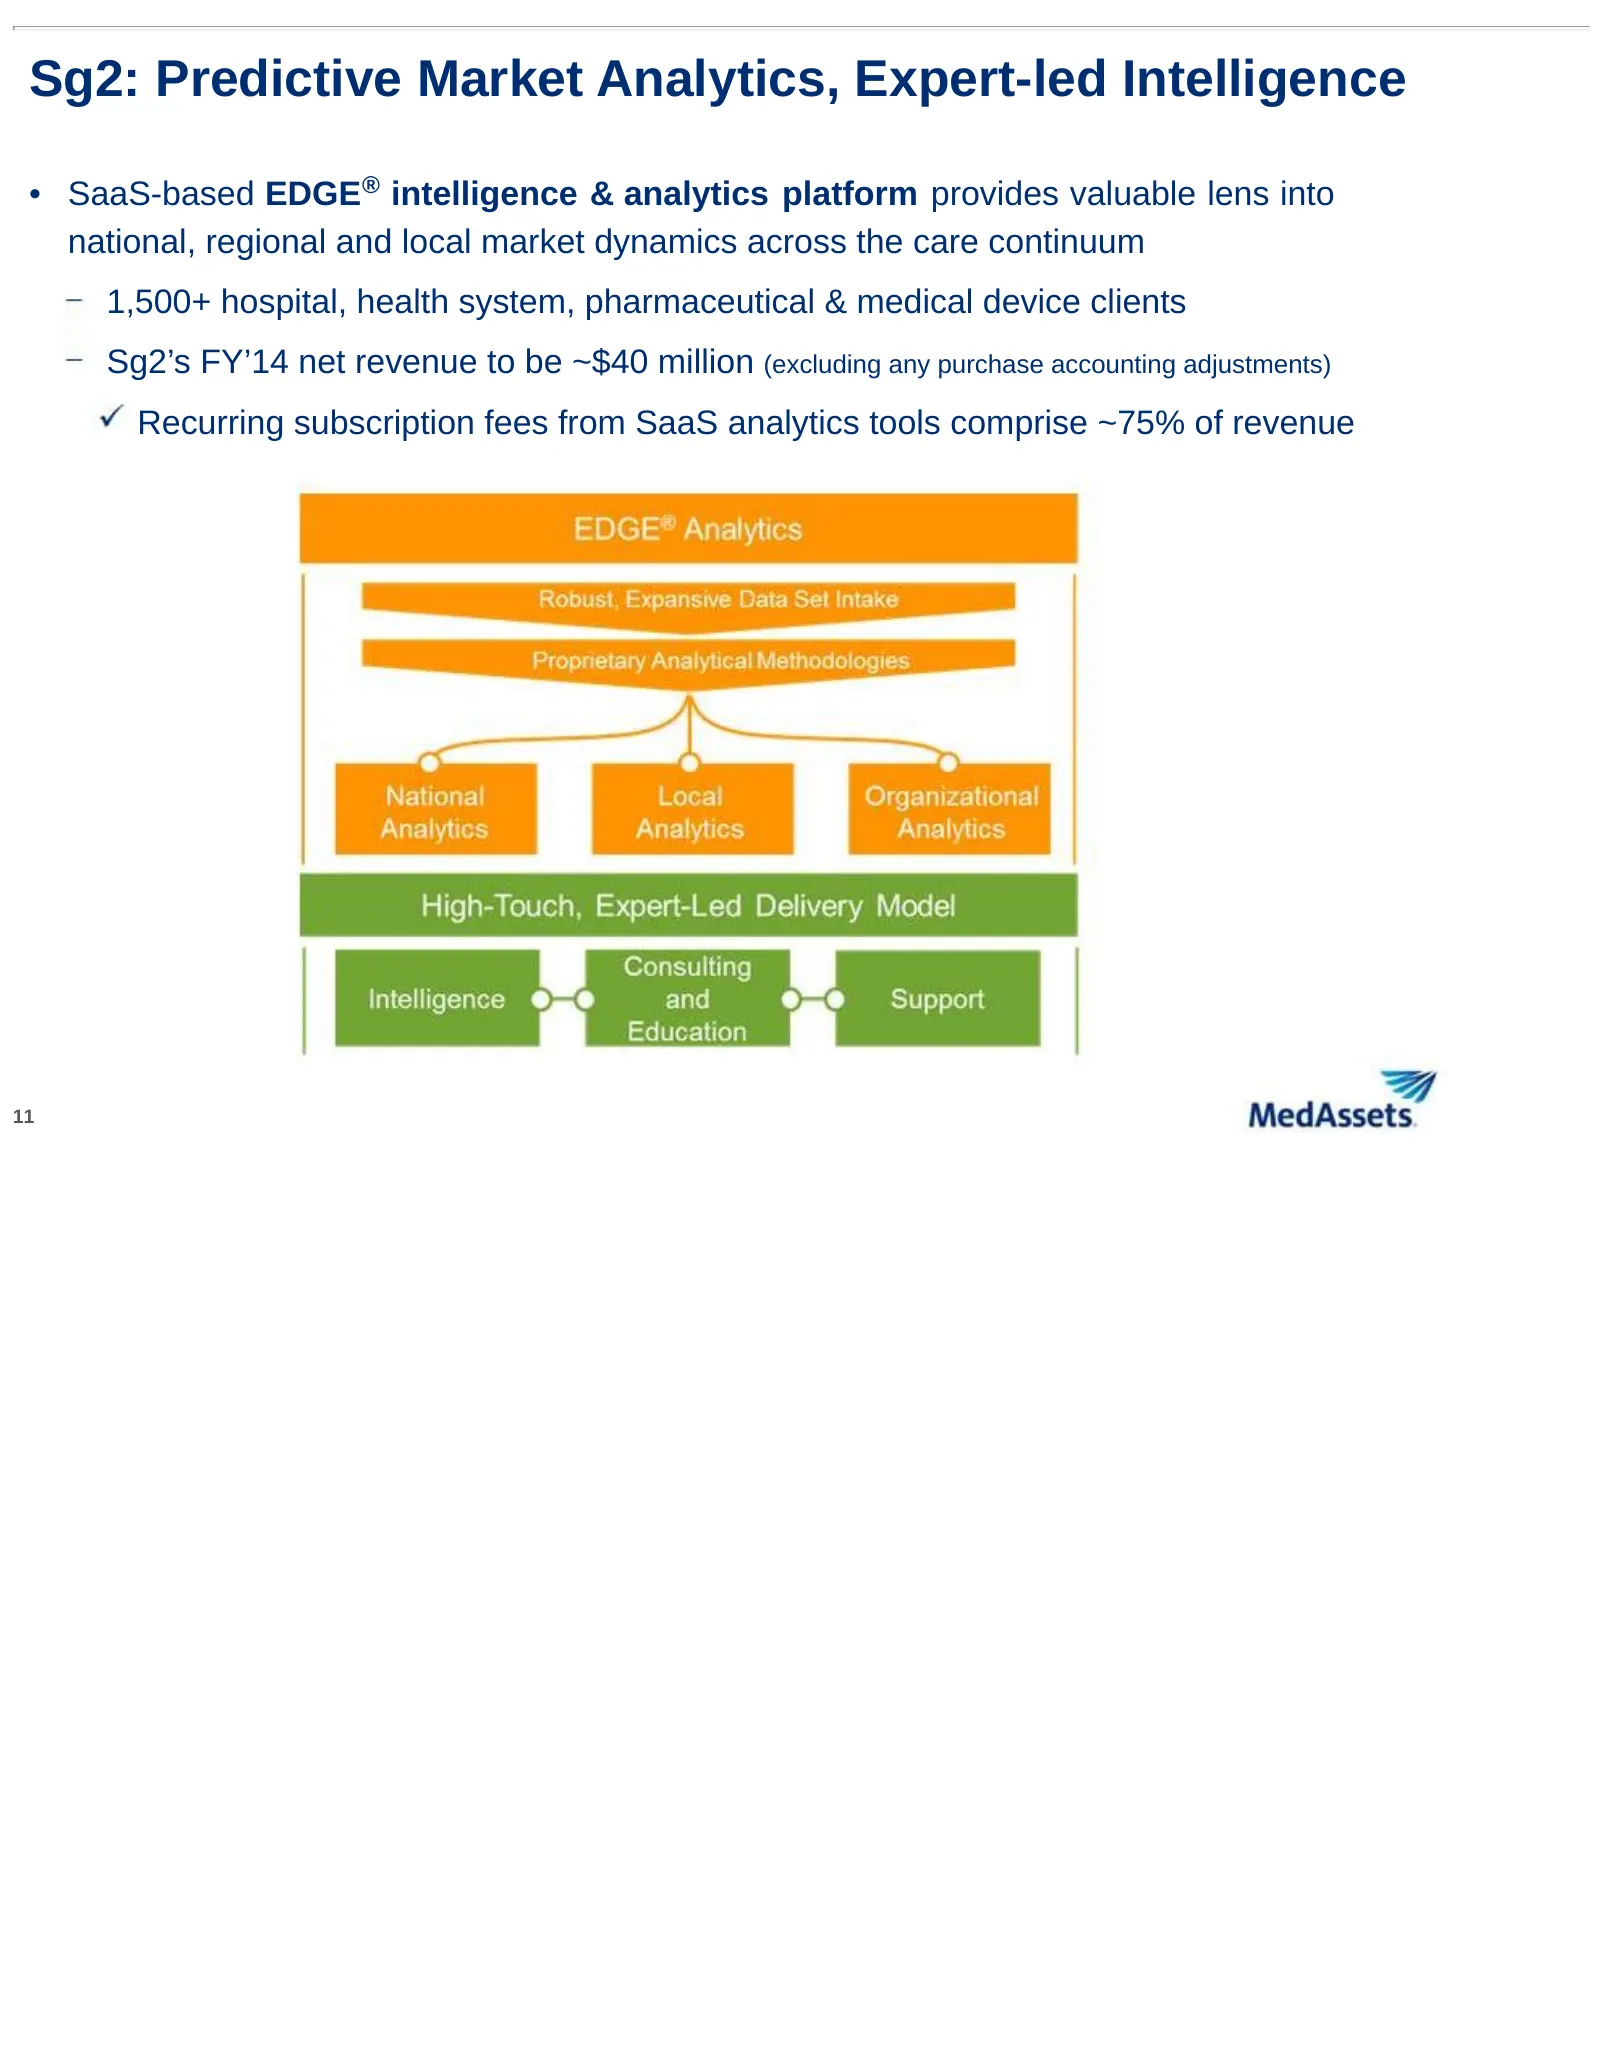
Sg2: Predictive Market Analytics, Expert-led Intelligence • SaaS-based EDGE® intelligence & analytics platform provides valuable lens into national, regional and local market dynamics across the care continuum 1,500+ hospital, health system, pharmaceutical & medical device clients Sg2’s FY’14 net re
Slide 12: Sg2 System of CARE - Assess, Build, Grow, Manage
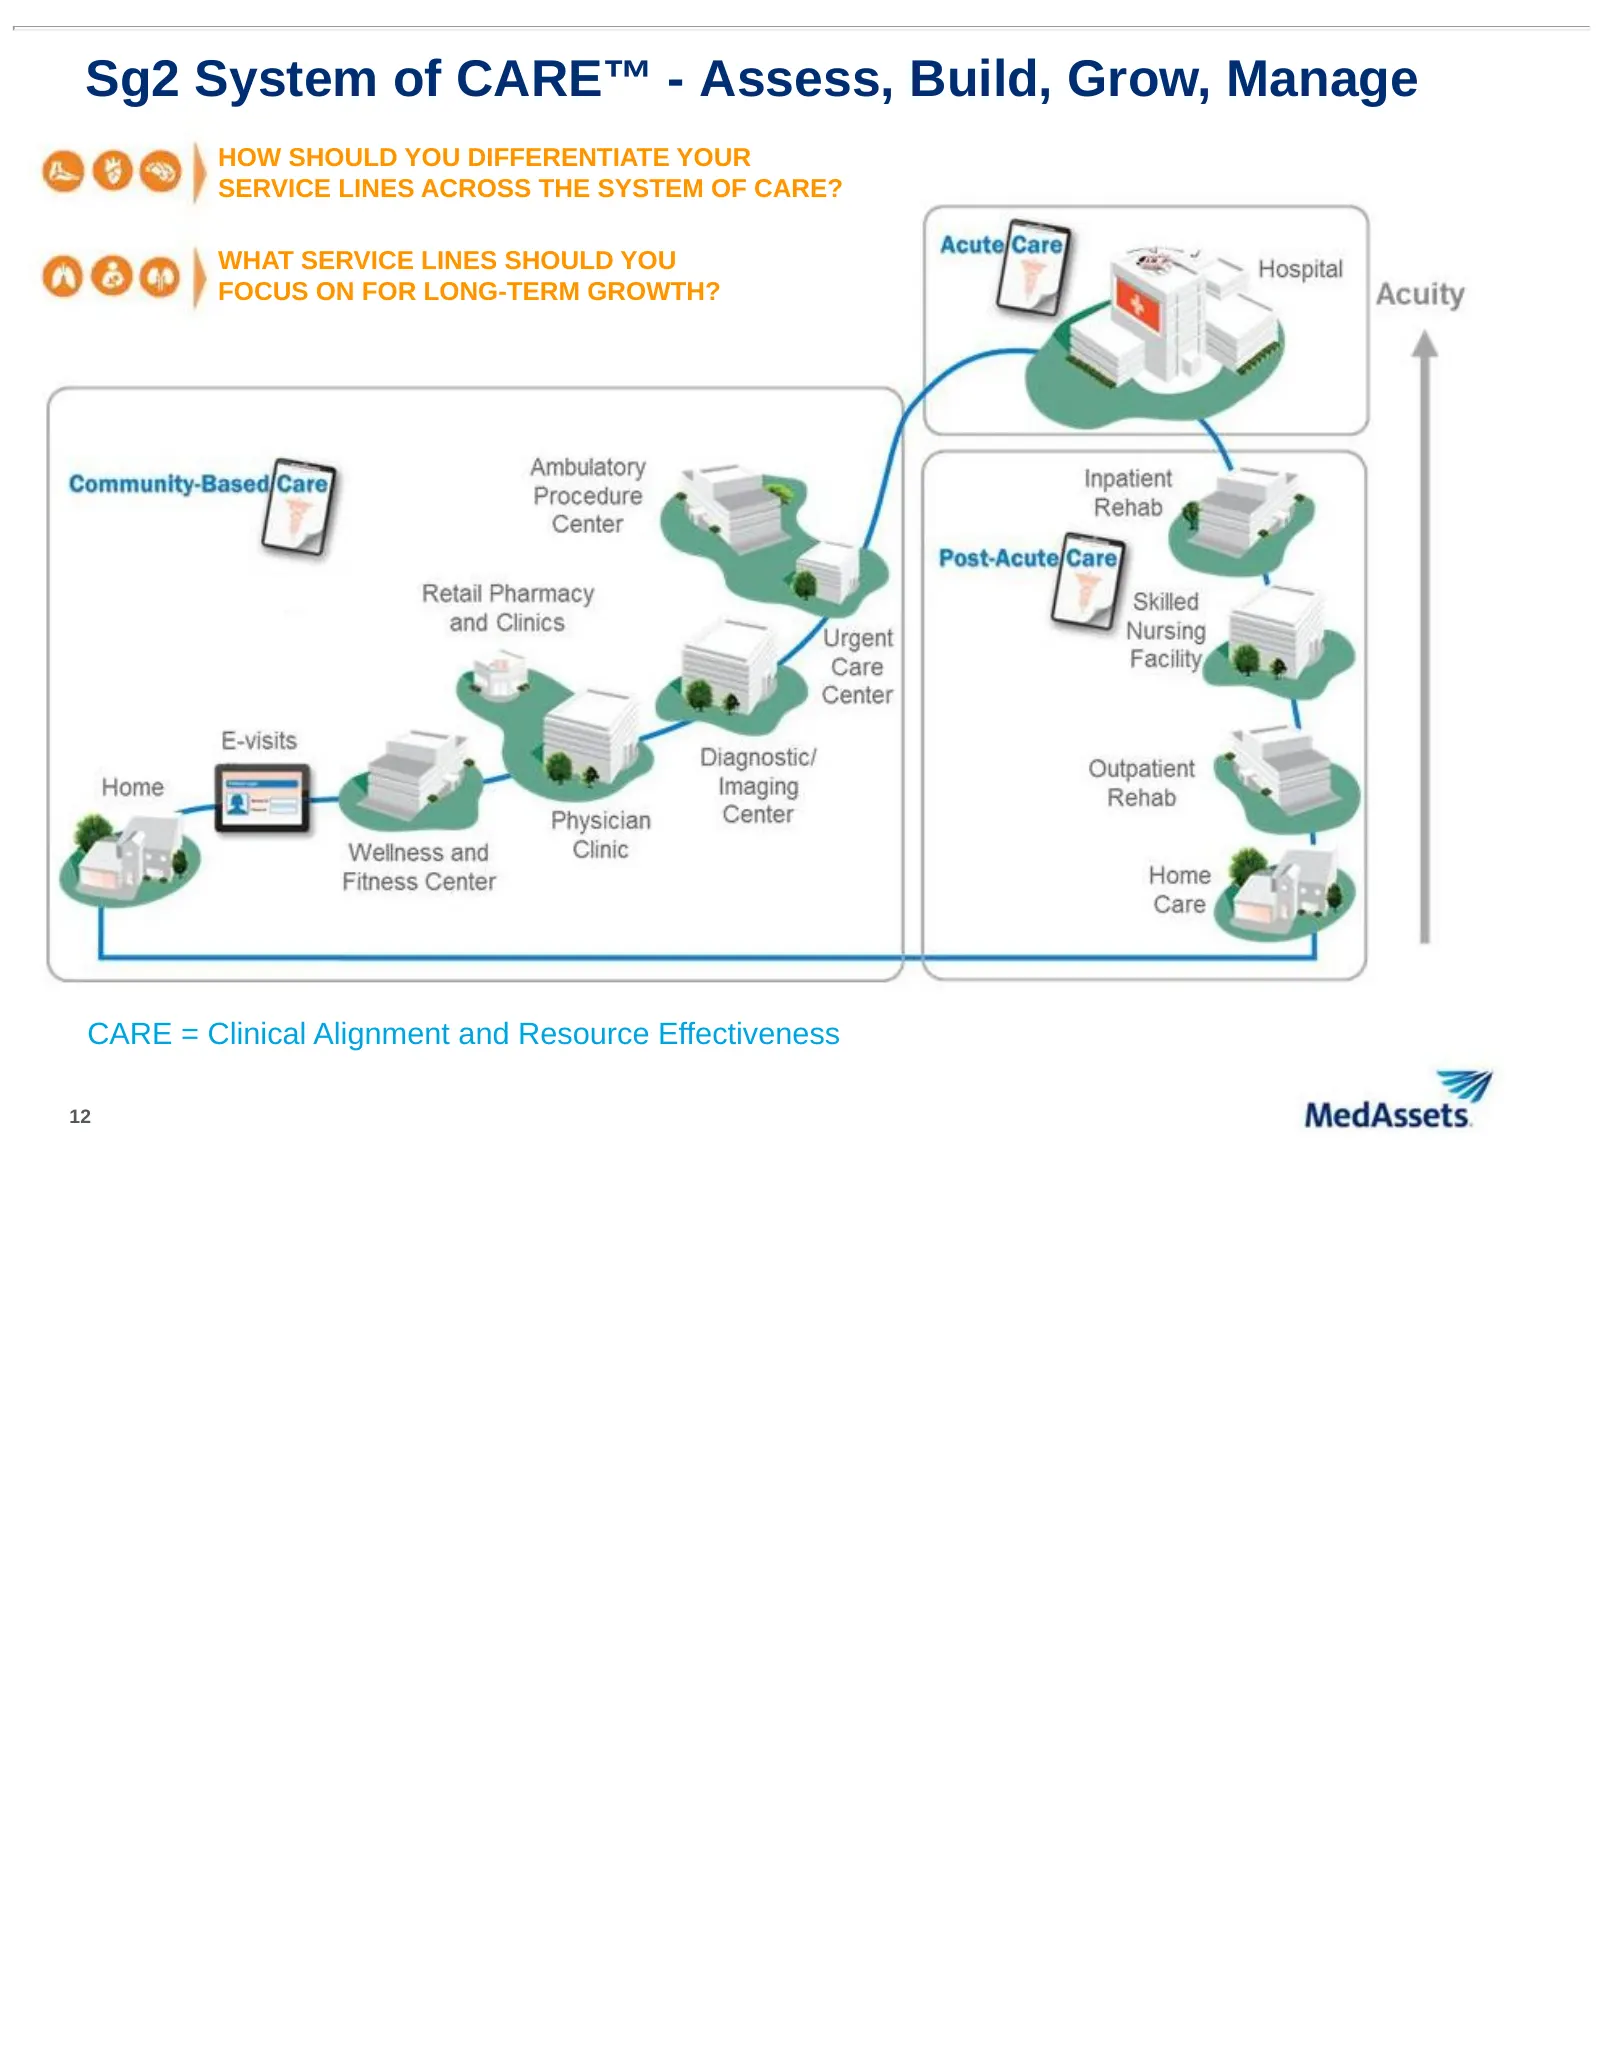
Sg2 System of CARE™ - Assess, Build, Grow, Manage HOW SHOULD YOU DIFFERENTIATE YOUR SERVICE LINES ACROSS THE SYSTEM OF CARE? WHAT SERVICE LINES SHOULD YOU FOCUS ON FOR LONG-TERM GROWTH? CARE = Clinical Alignment and Resource Effectiveness 12
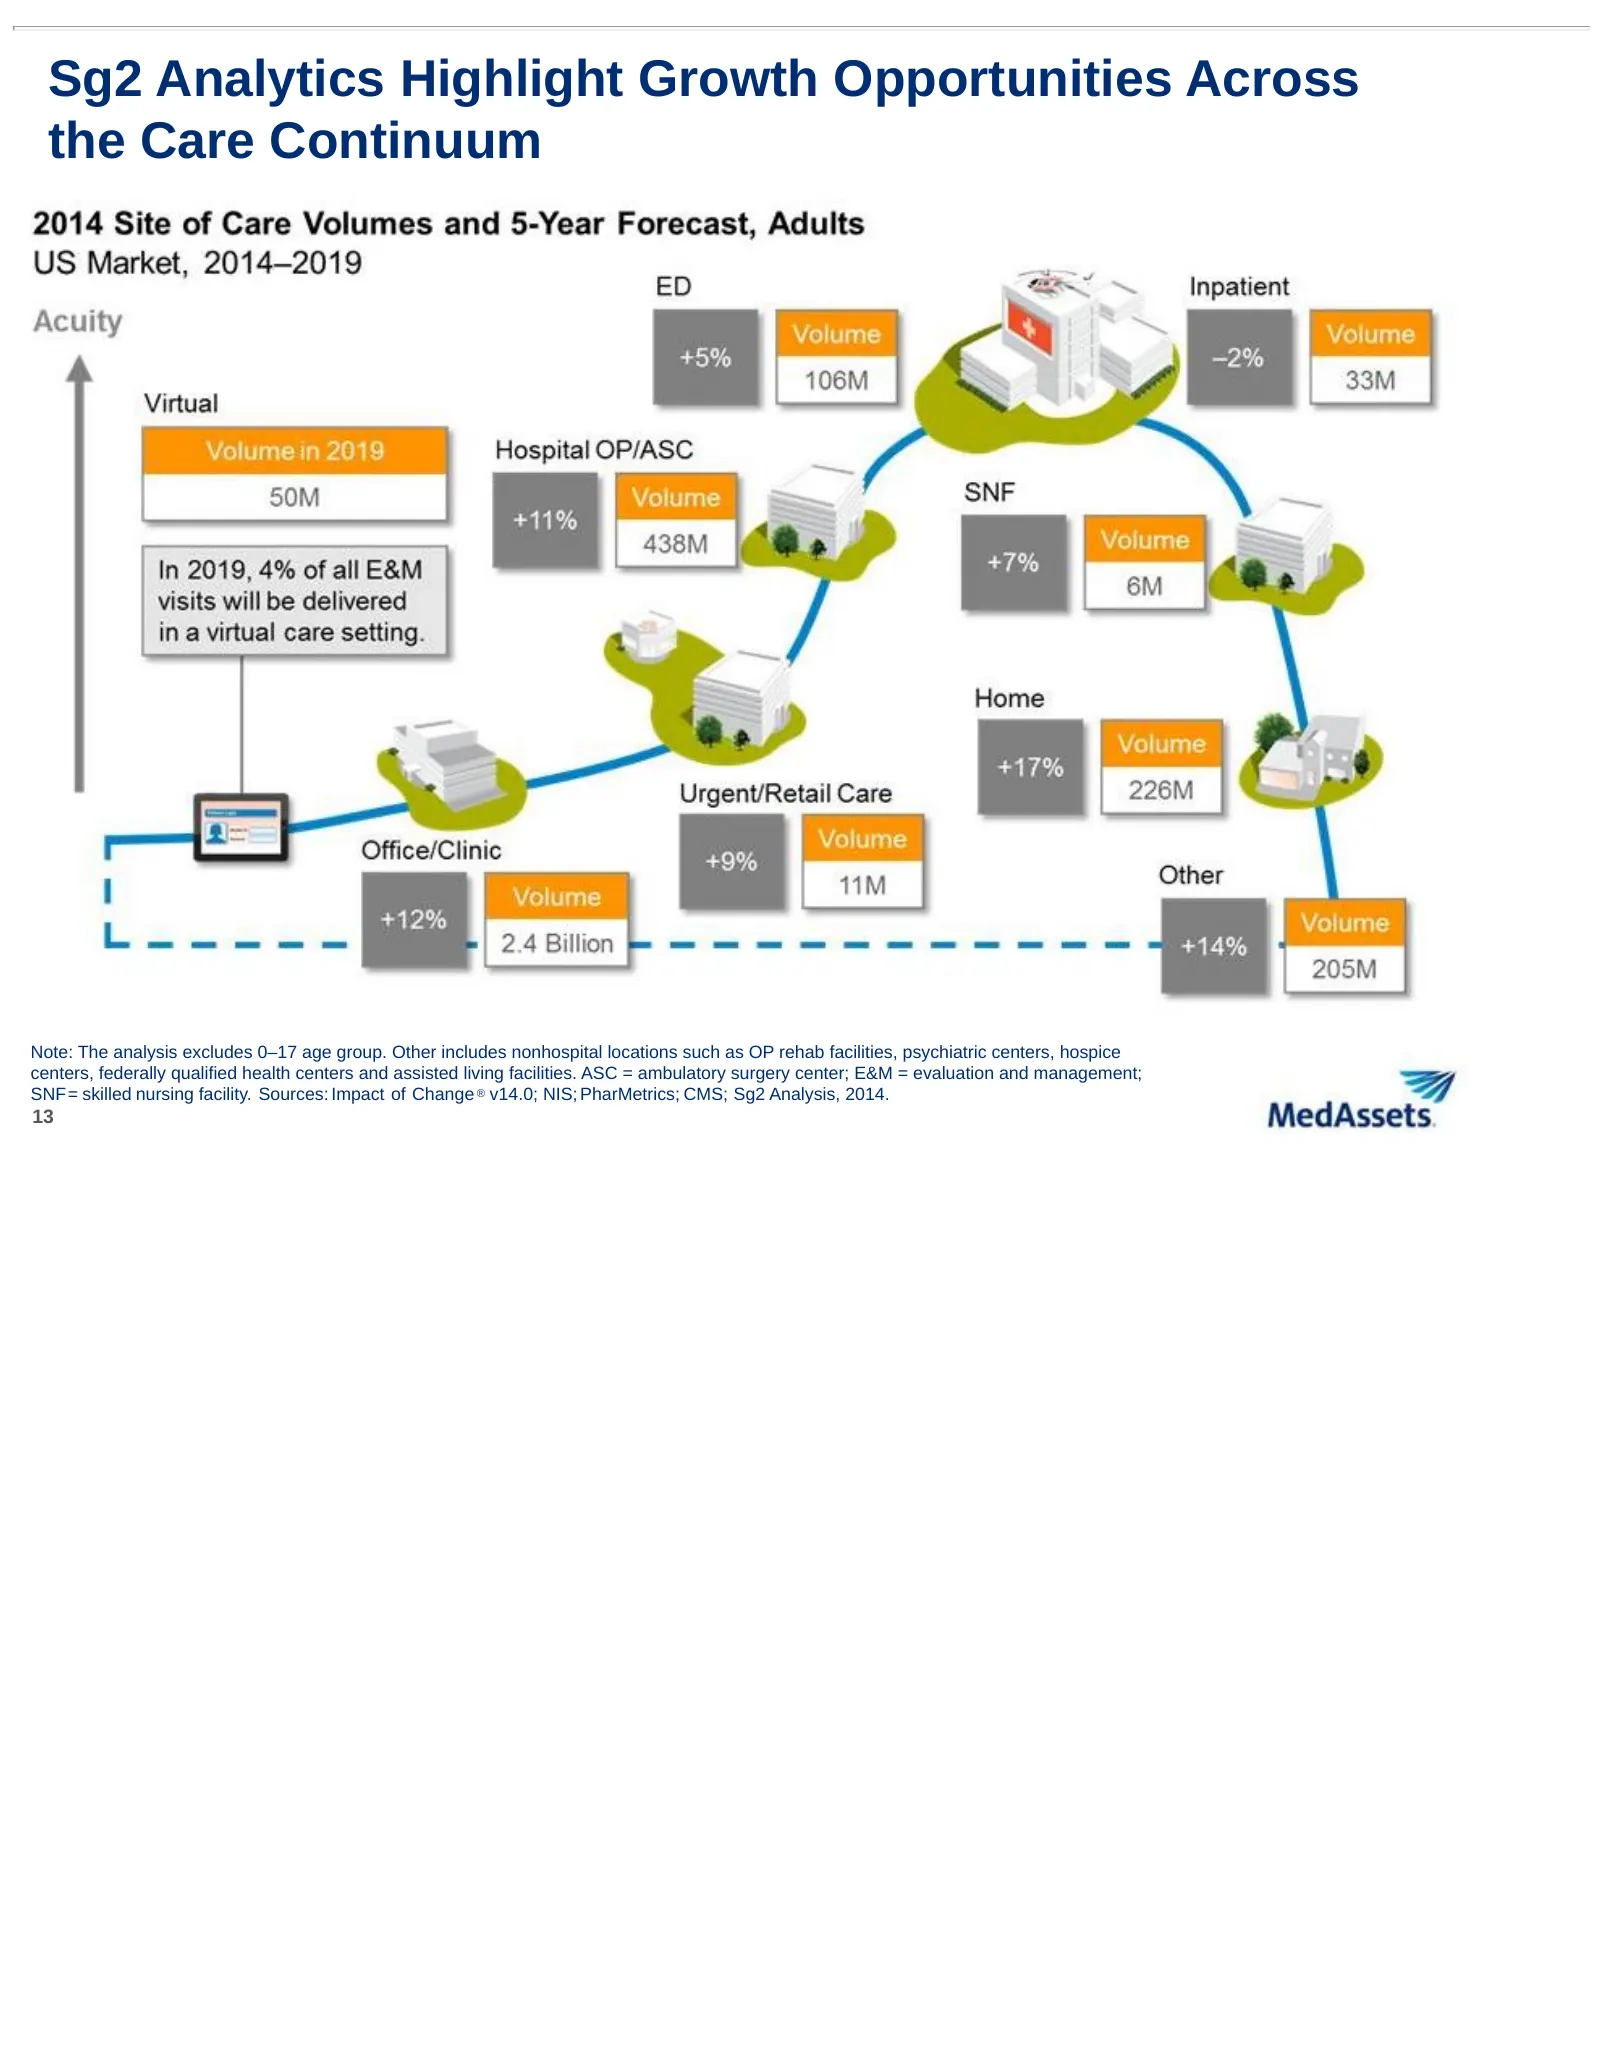
Slide 13: Sg2 Analytics Highlight Growth Opportunities Across the Care Continuum
Sg2 Analytics Highlight Growth Opportunities Across the Care Continuum Note: The analysis excludes 0–17 age group. Other includes nonhospital locations such as OP rehab facilities, psychiatric centers, hospice centers, federally qualified health centers and assisted living facilities. ASC = ambulato
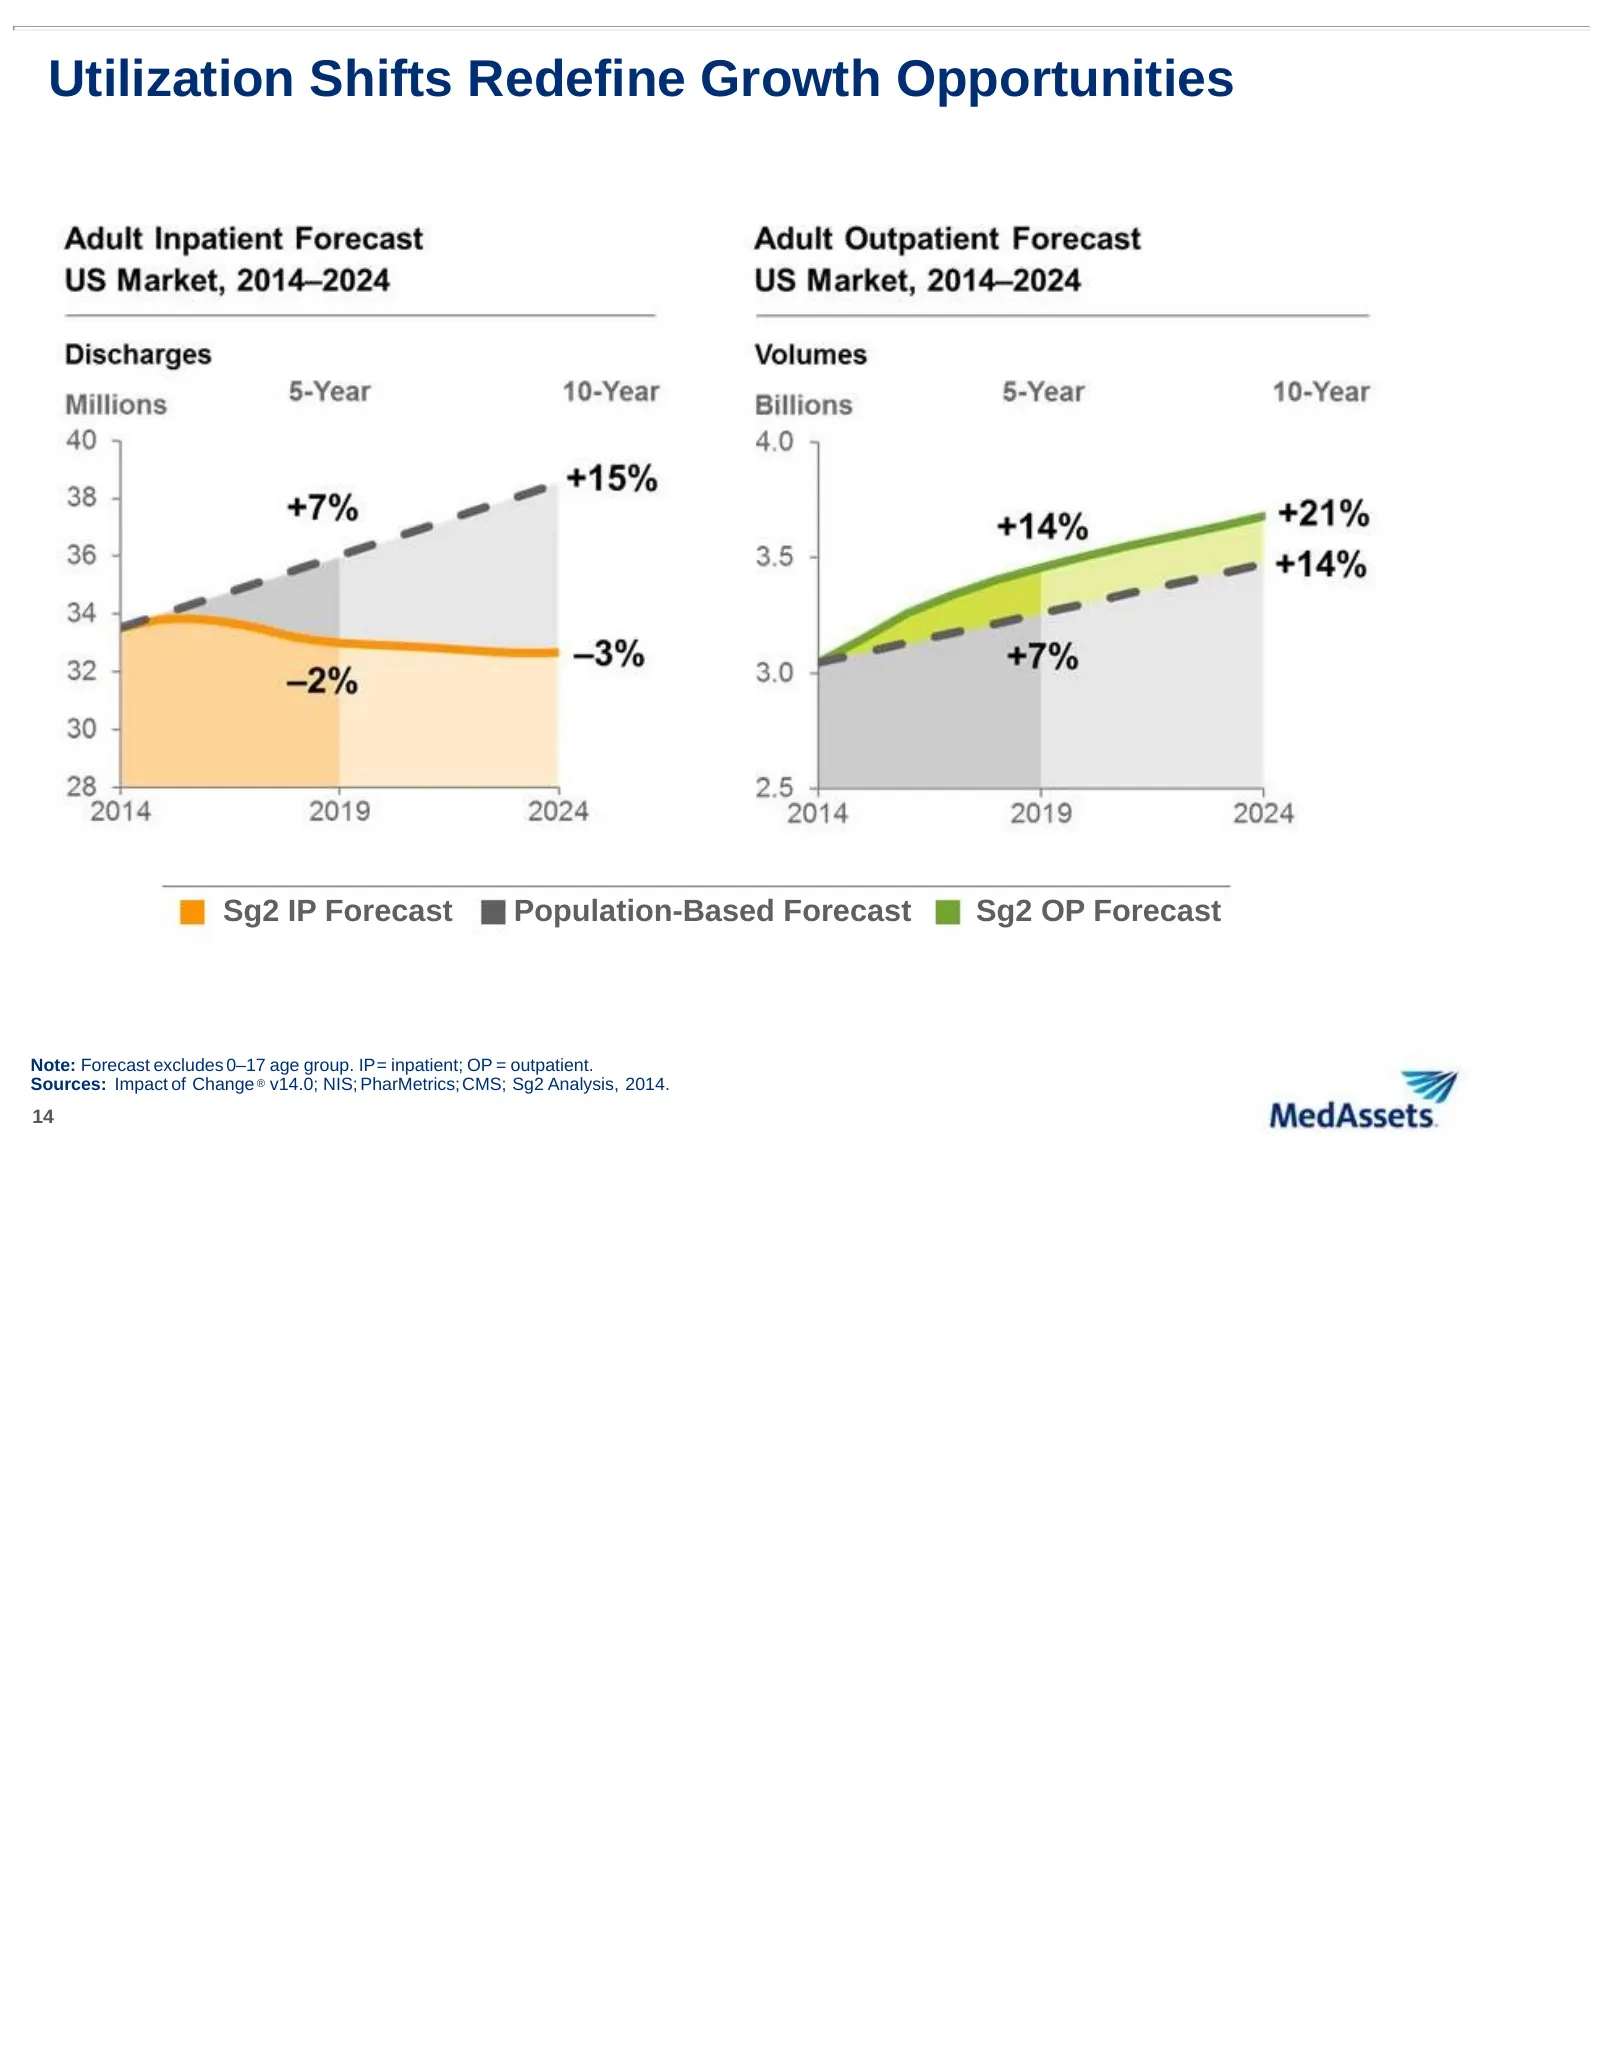
Slide 14: Utilization Shifts Redefine Growth Opportunities
Utilization Shifts Redefine Growth Opportunities Sg2 IP Forecast Population-Based Forecast Sg2 OP Forecast Note: Forecast excludes 0–17 age group. IP= inpatient; OP = outpatient. Sources: Impact of Change ® v14.0; NIS; PharMetrics; CMS; Sg2 Analysis, 2014. 14
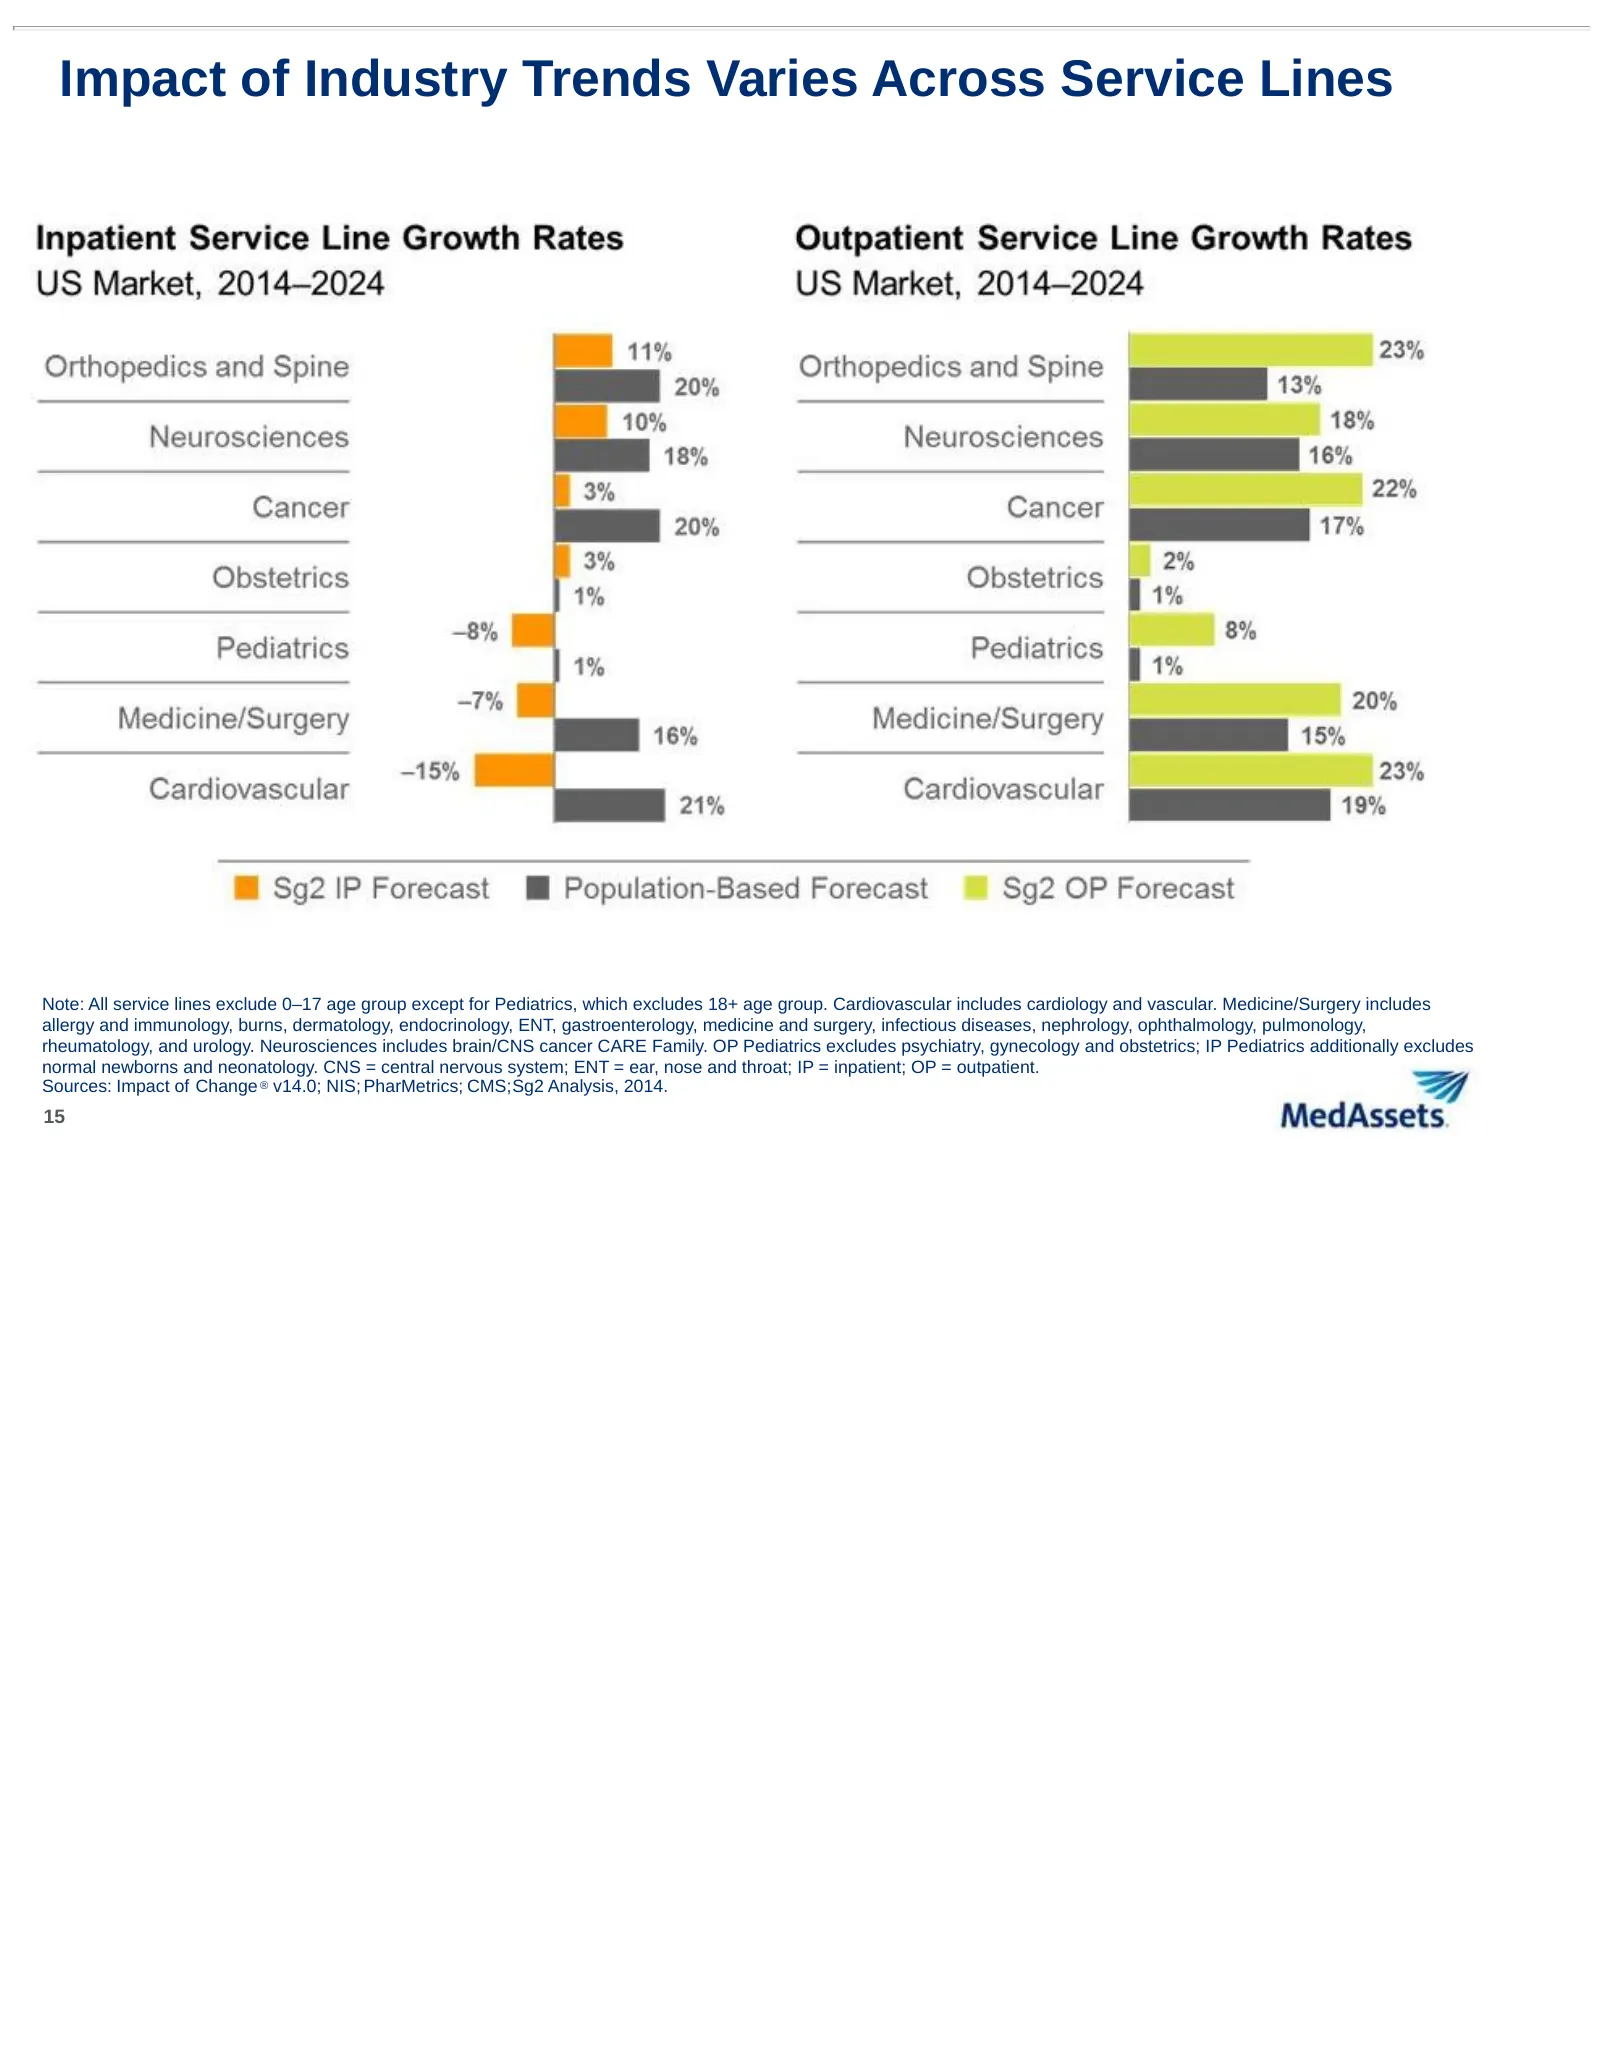
Slide 15: Impact of Industry Trends Varies Across Service Lines
Impact of Industry Trends Varies Across Service Lines Note: All service lines exclude 0–17 age group except for Pediatrics, which excludes 18+ age group. Cardiovascular includes cardiology and vascular. Medicine/Surgery includes allergy and immunology, burns, dermatology, endocrinology, ENT, gastroe
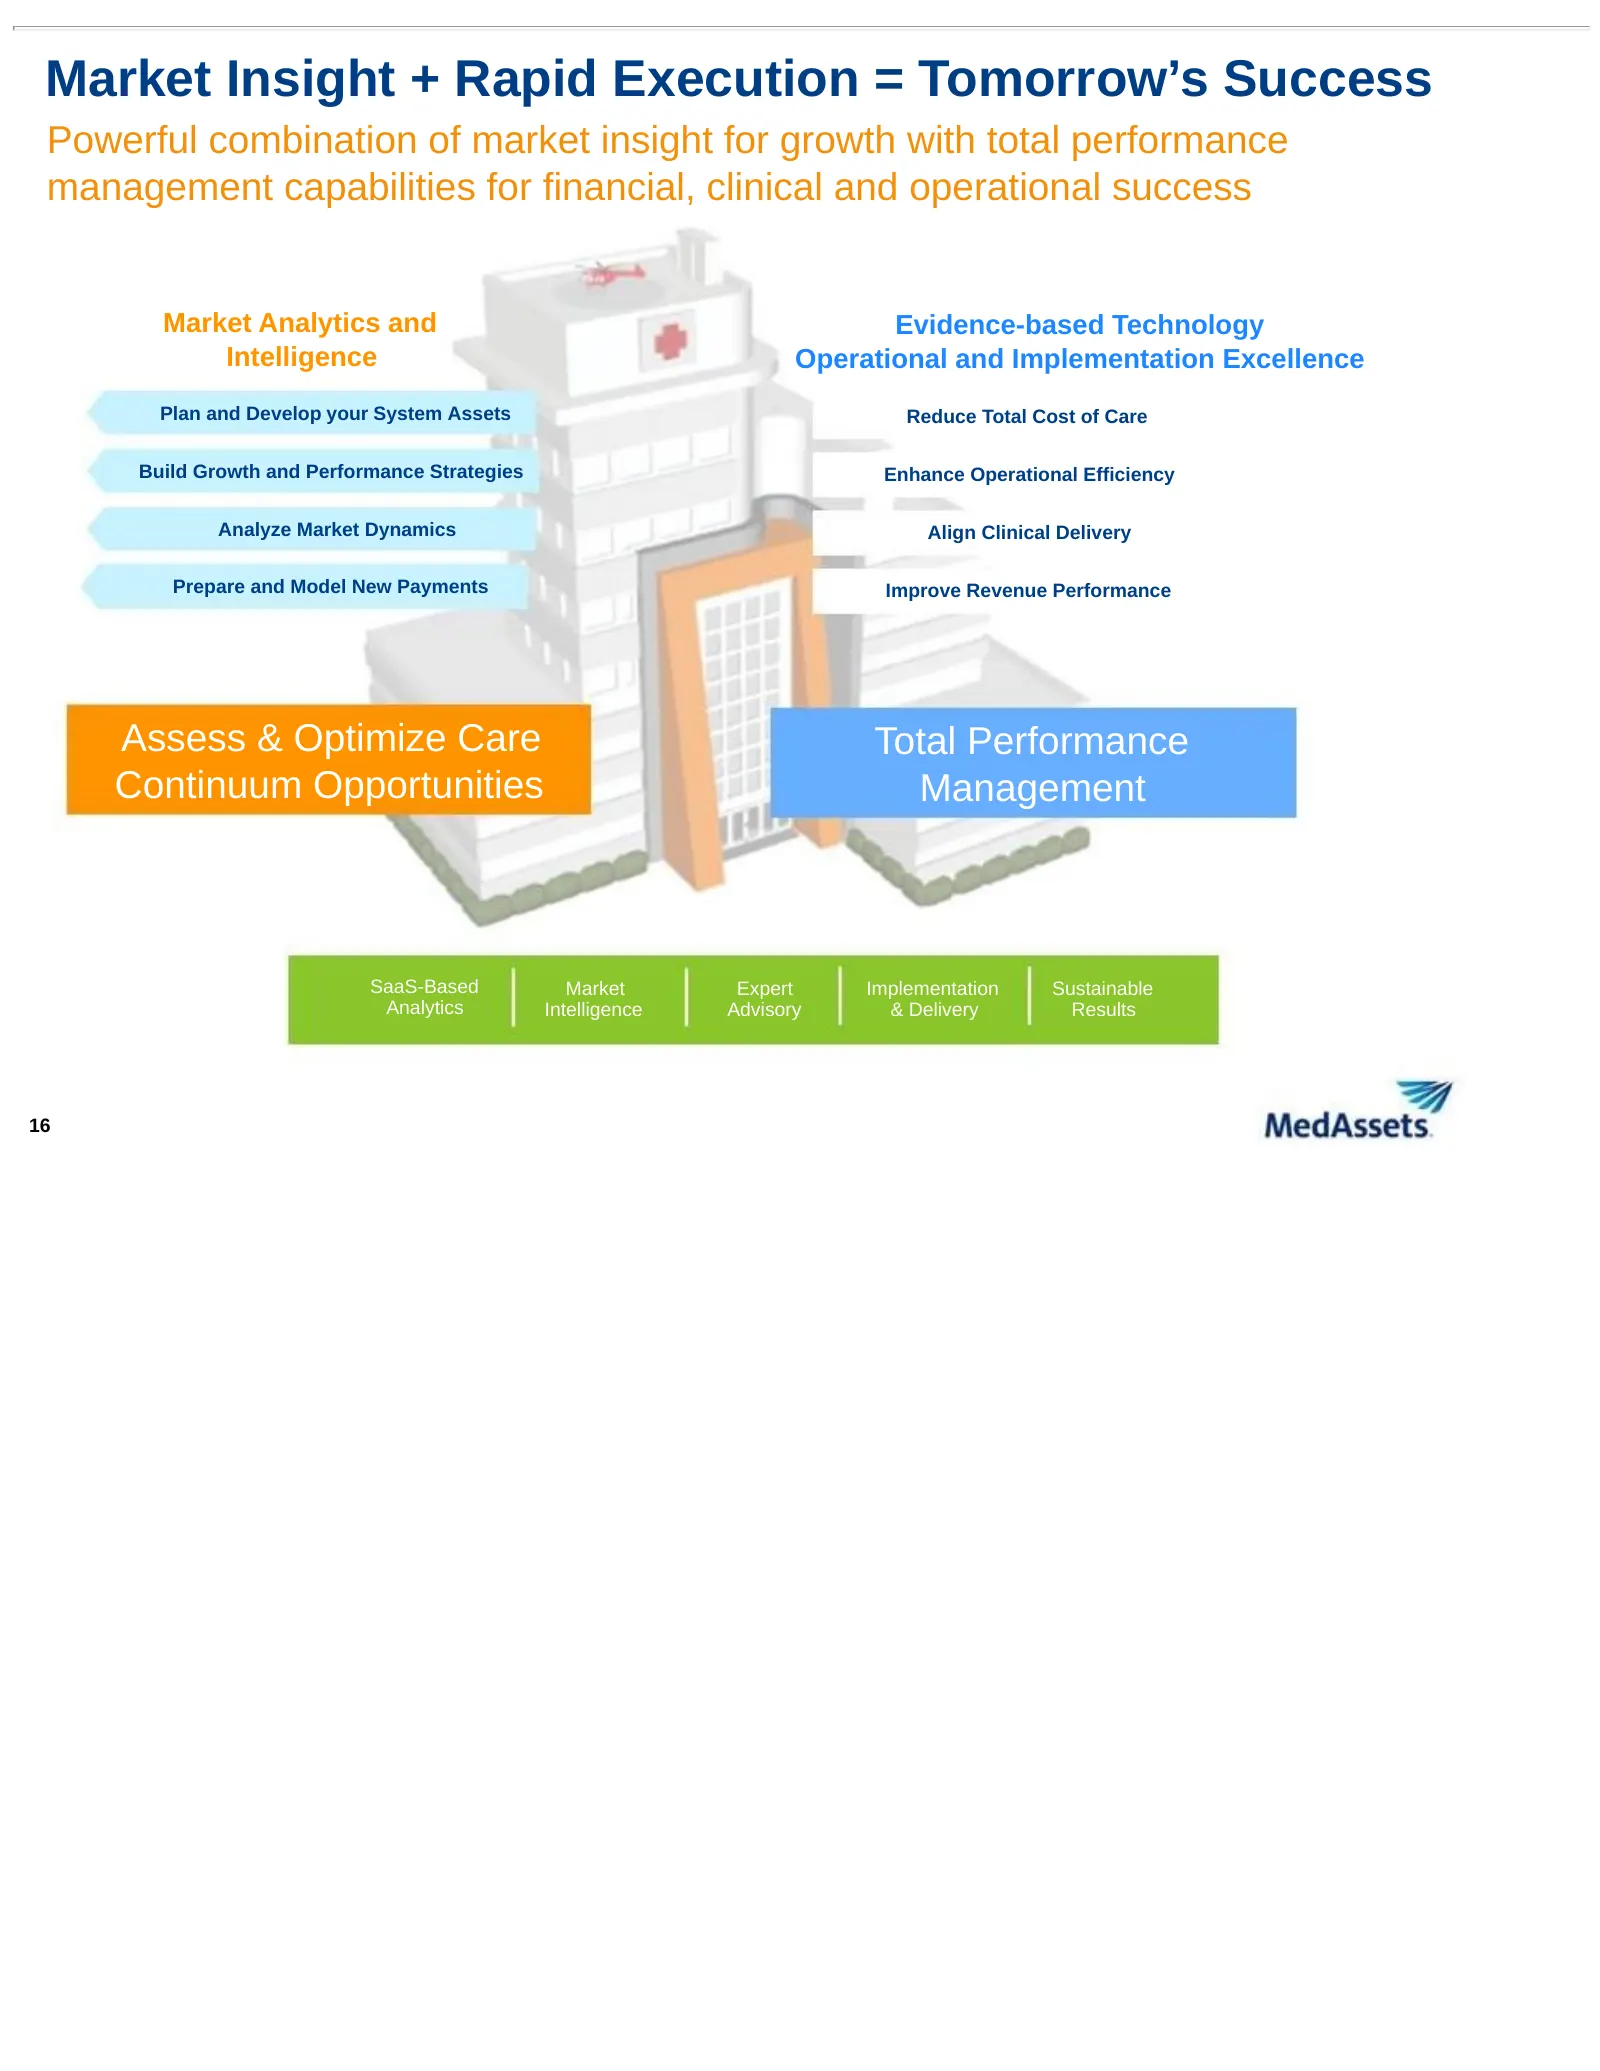
Slide 16: Market Insight + Rapid Execution = Tomorrow's Success
Market Insight + Rapid Execution = Tomorrow’s Success Powerful combination of market insight for growth with total performance management capabilities for financial, clinical and operational success Market Analytics and Evidence-based Technology Intelligence Operational and Implementation Excellence
Slide 17: Financial Review & Update
Fy MedAssets. Financial Review & Update
Slide 18: Financial Snapshot (updated 10.29.14)
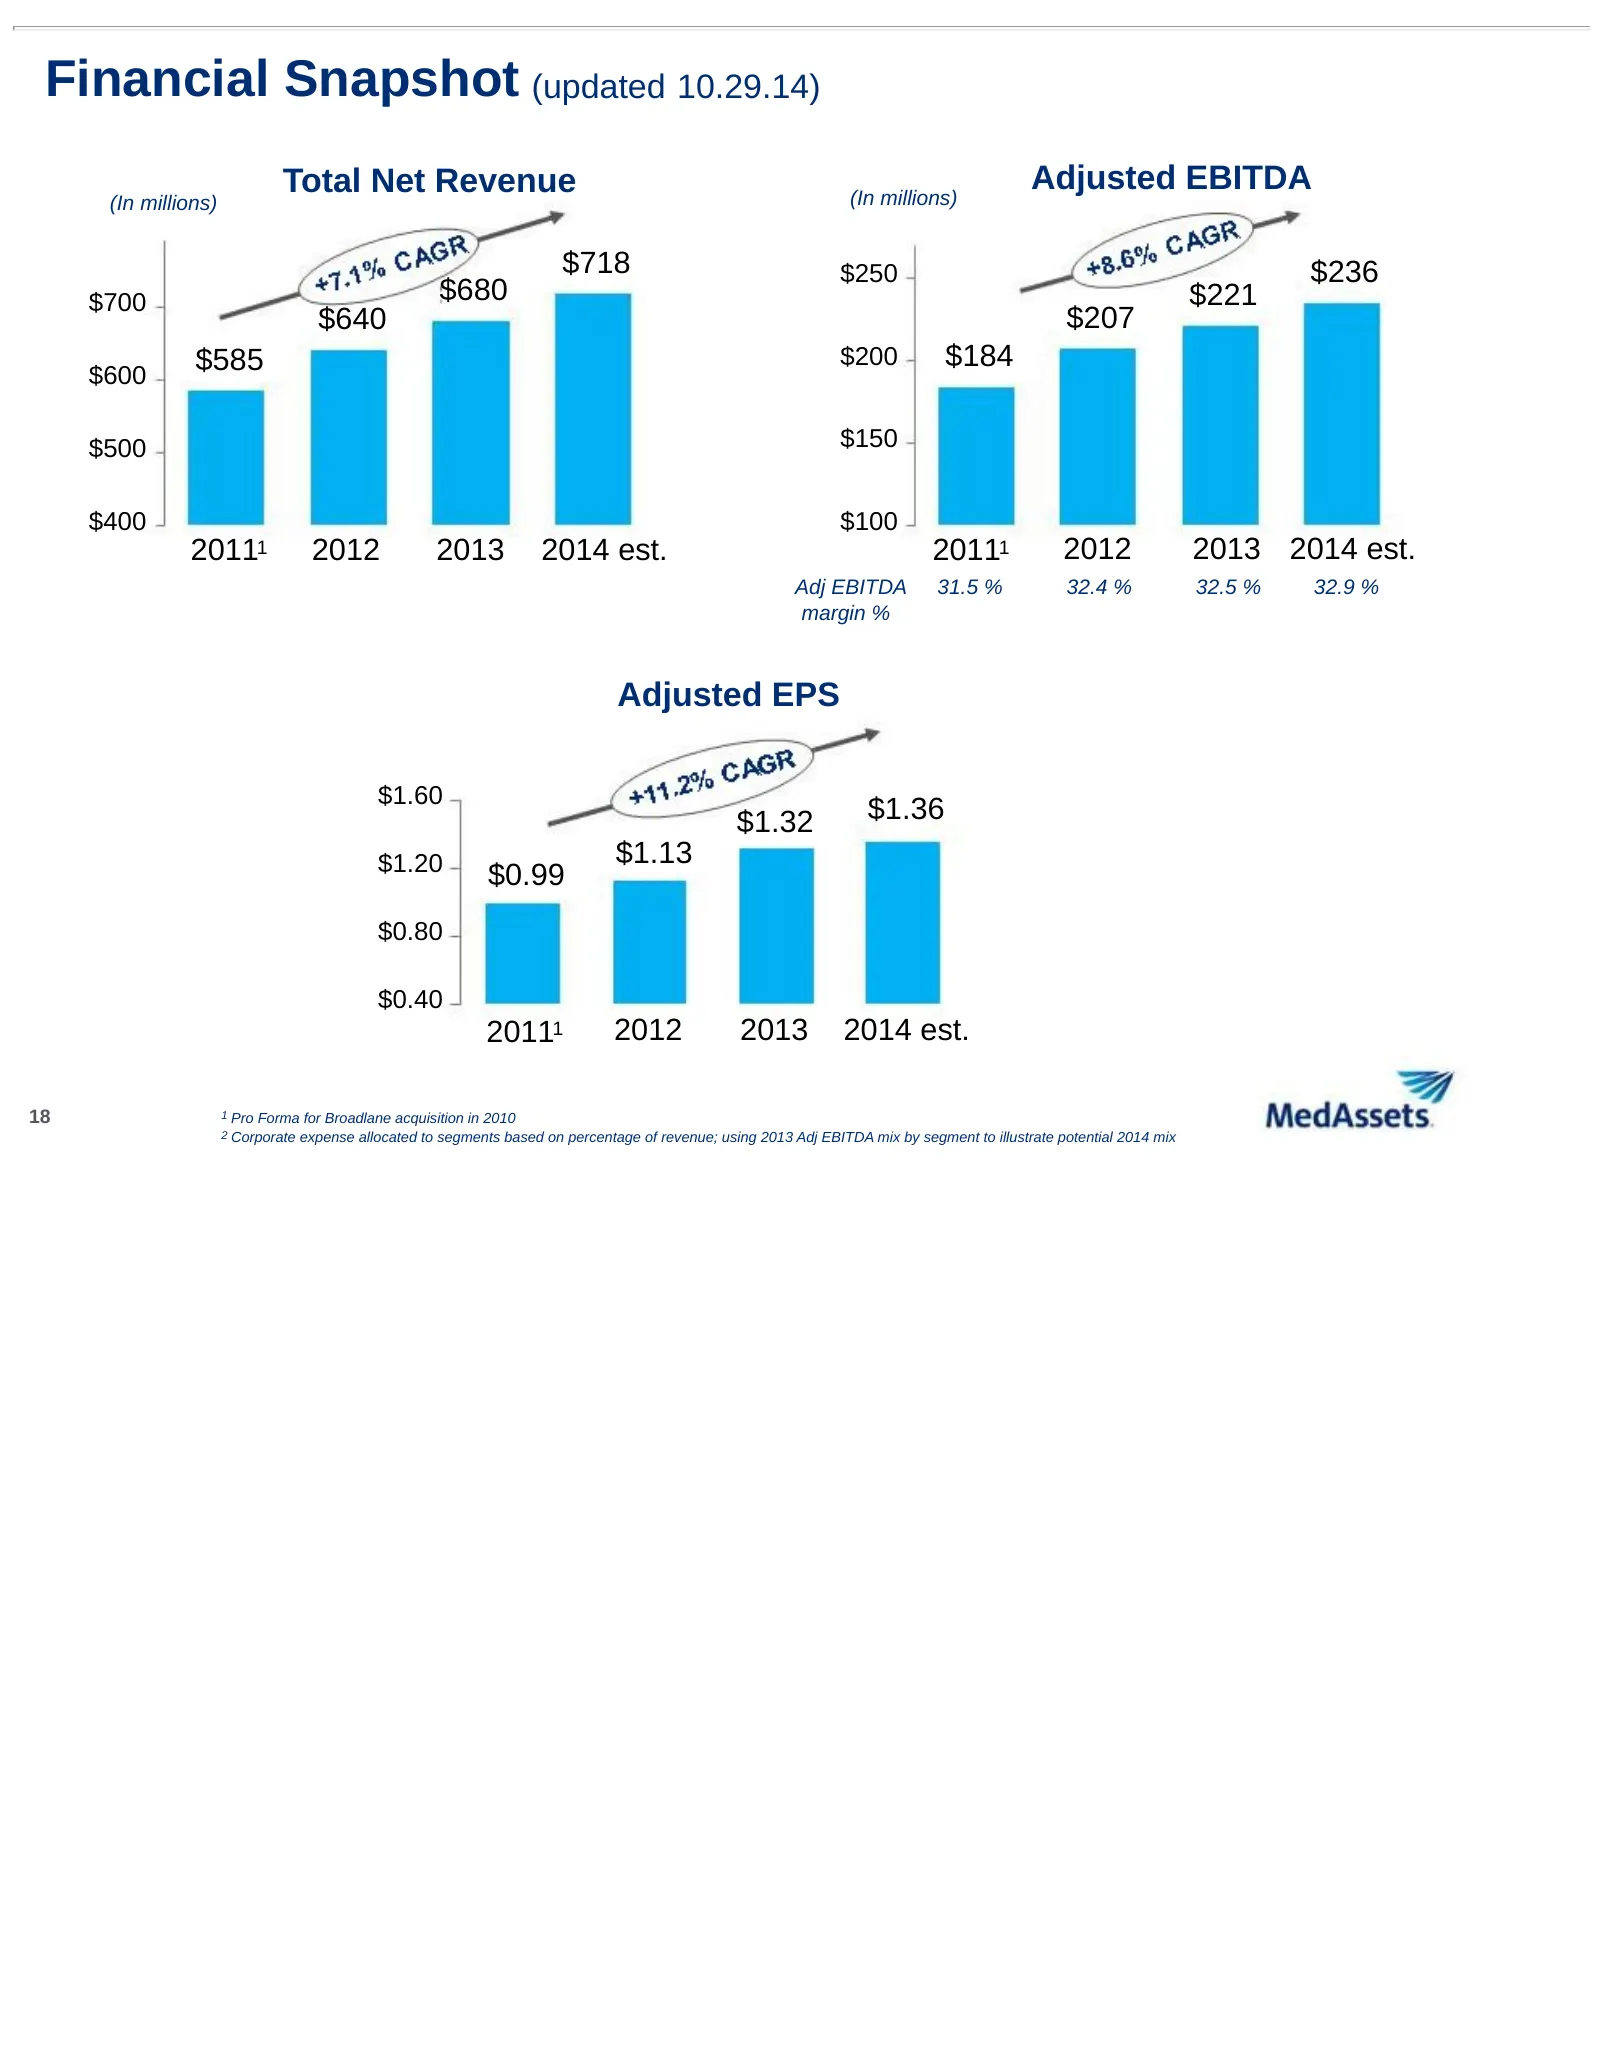
Financial Snapshot (updated 10.29.14) Total Net Revenue (In millions) Adjusted EBITDA (In millions) $718 $250 $236 $700 $680 $221 $640 $207 $585 $200 $184 $600 $500 $150 $400 $100 20111 2012 2013 2014 est. 20111 2012 2013 2014 est. Adj EBITDA 31.5 % 32.4 % 32.5 % 32.9 % margin % Adjusted EPS $1.60 $
Slide 19: Capital Structure (as of 9.30.14)
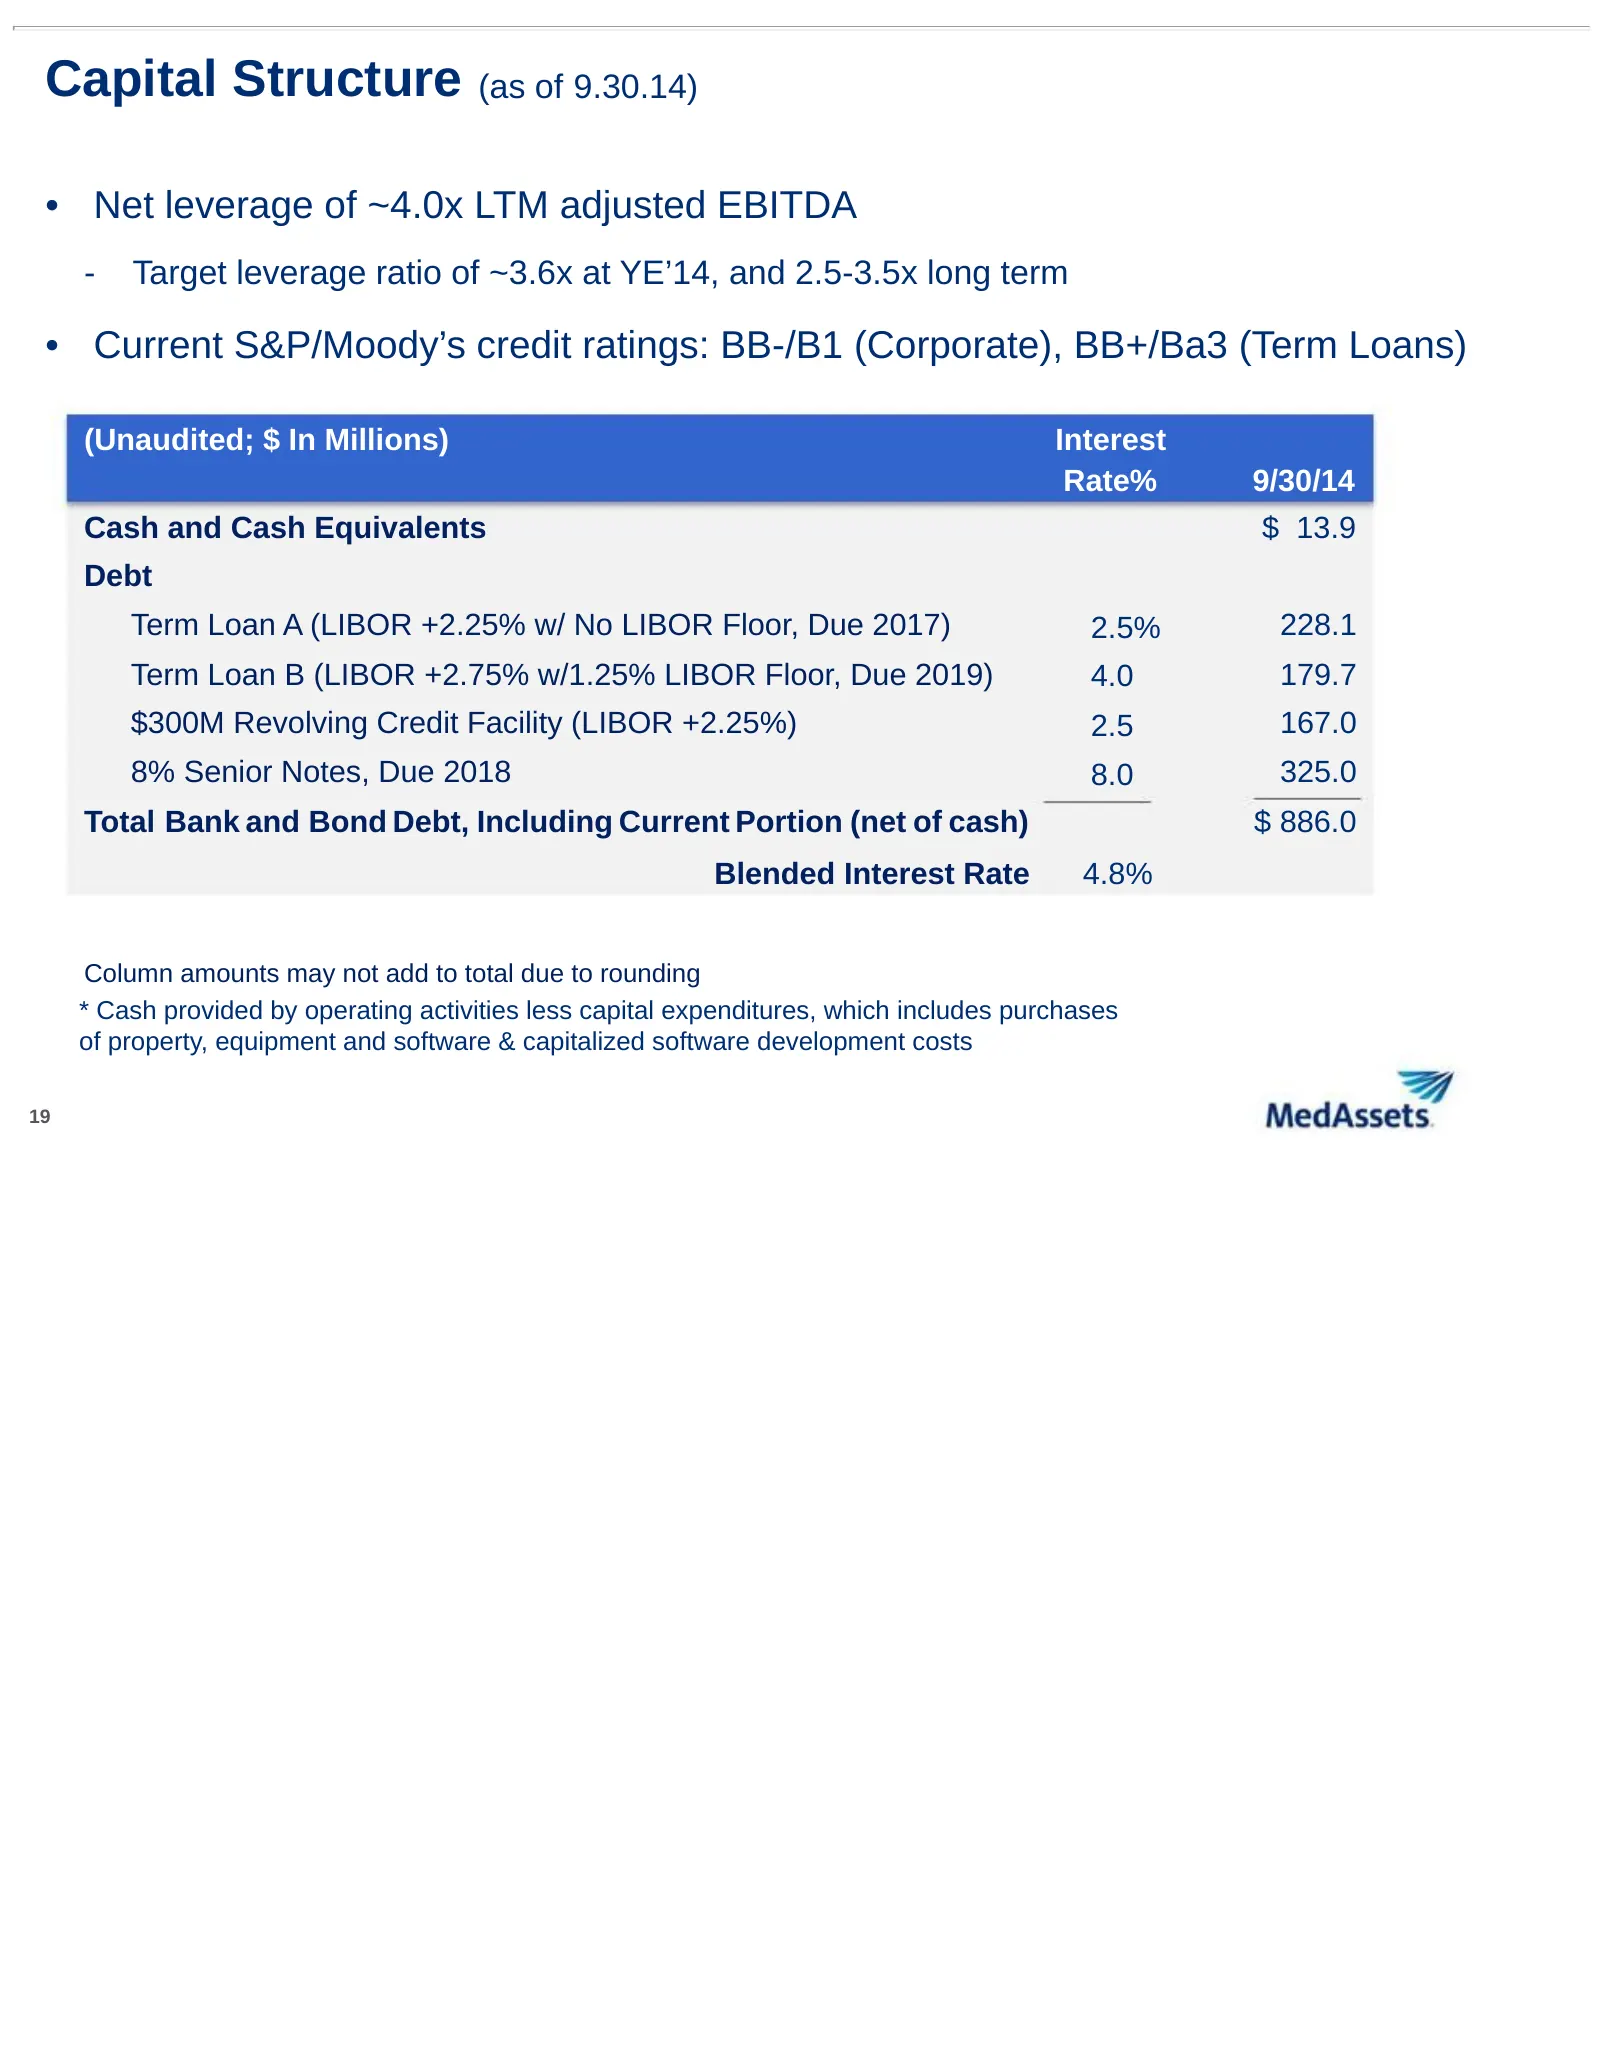
Capital Structure (as of 9.30.14) • Net leverage of ~4.0x LTM adjusted EBITDA - Target leverage ratio of ~3.6x at YE’14, and 2.5-3.5x long term • Current S&P/Moody’s credit ratings: BB-/B1 (Corporate), BB+/Ba3 (Term Loans) (Unaudited; $ In Millions) Interest Rate% 9/30/14 Cash and Cash Equivalents $
Slide 20: FY'14 Financial Guidance (updated 10.29.14)
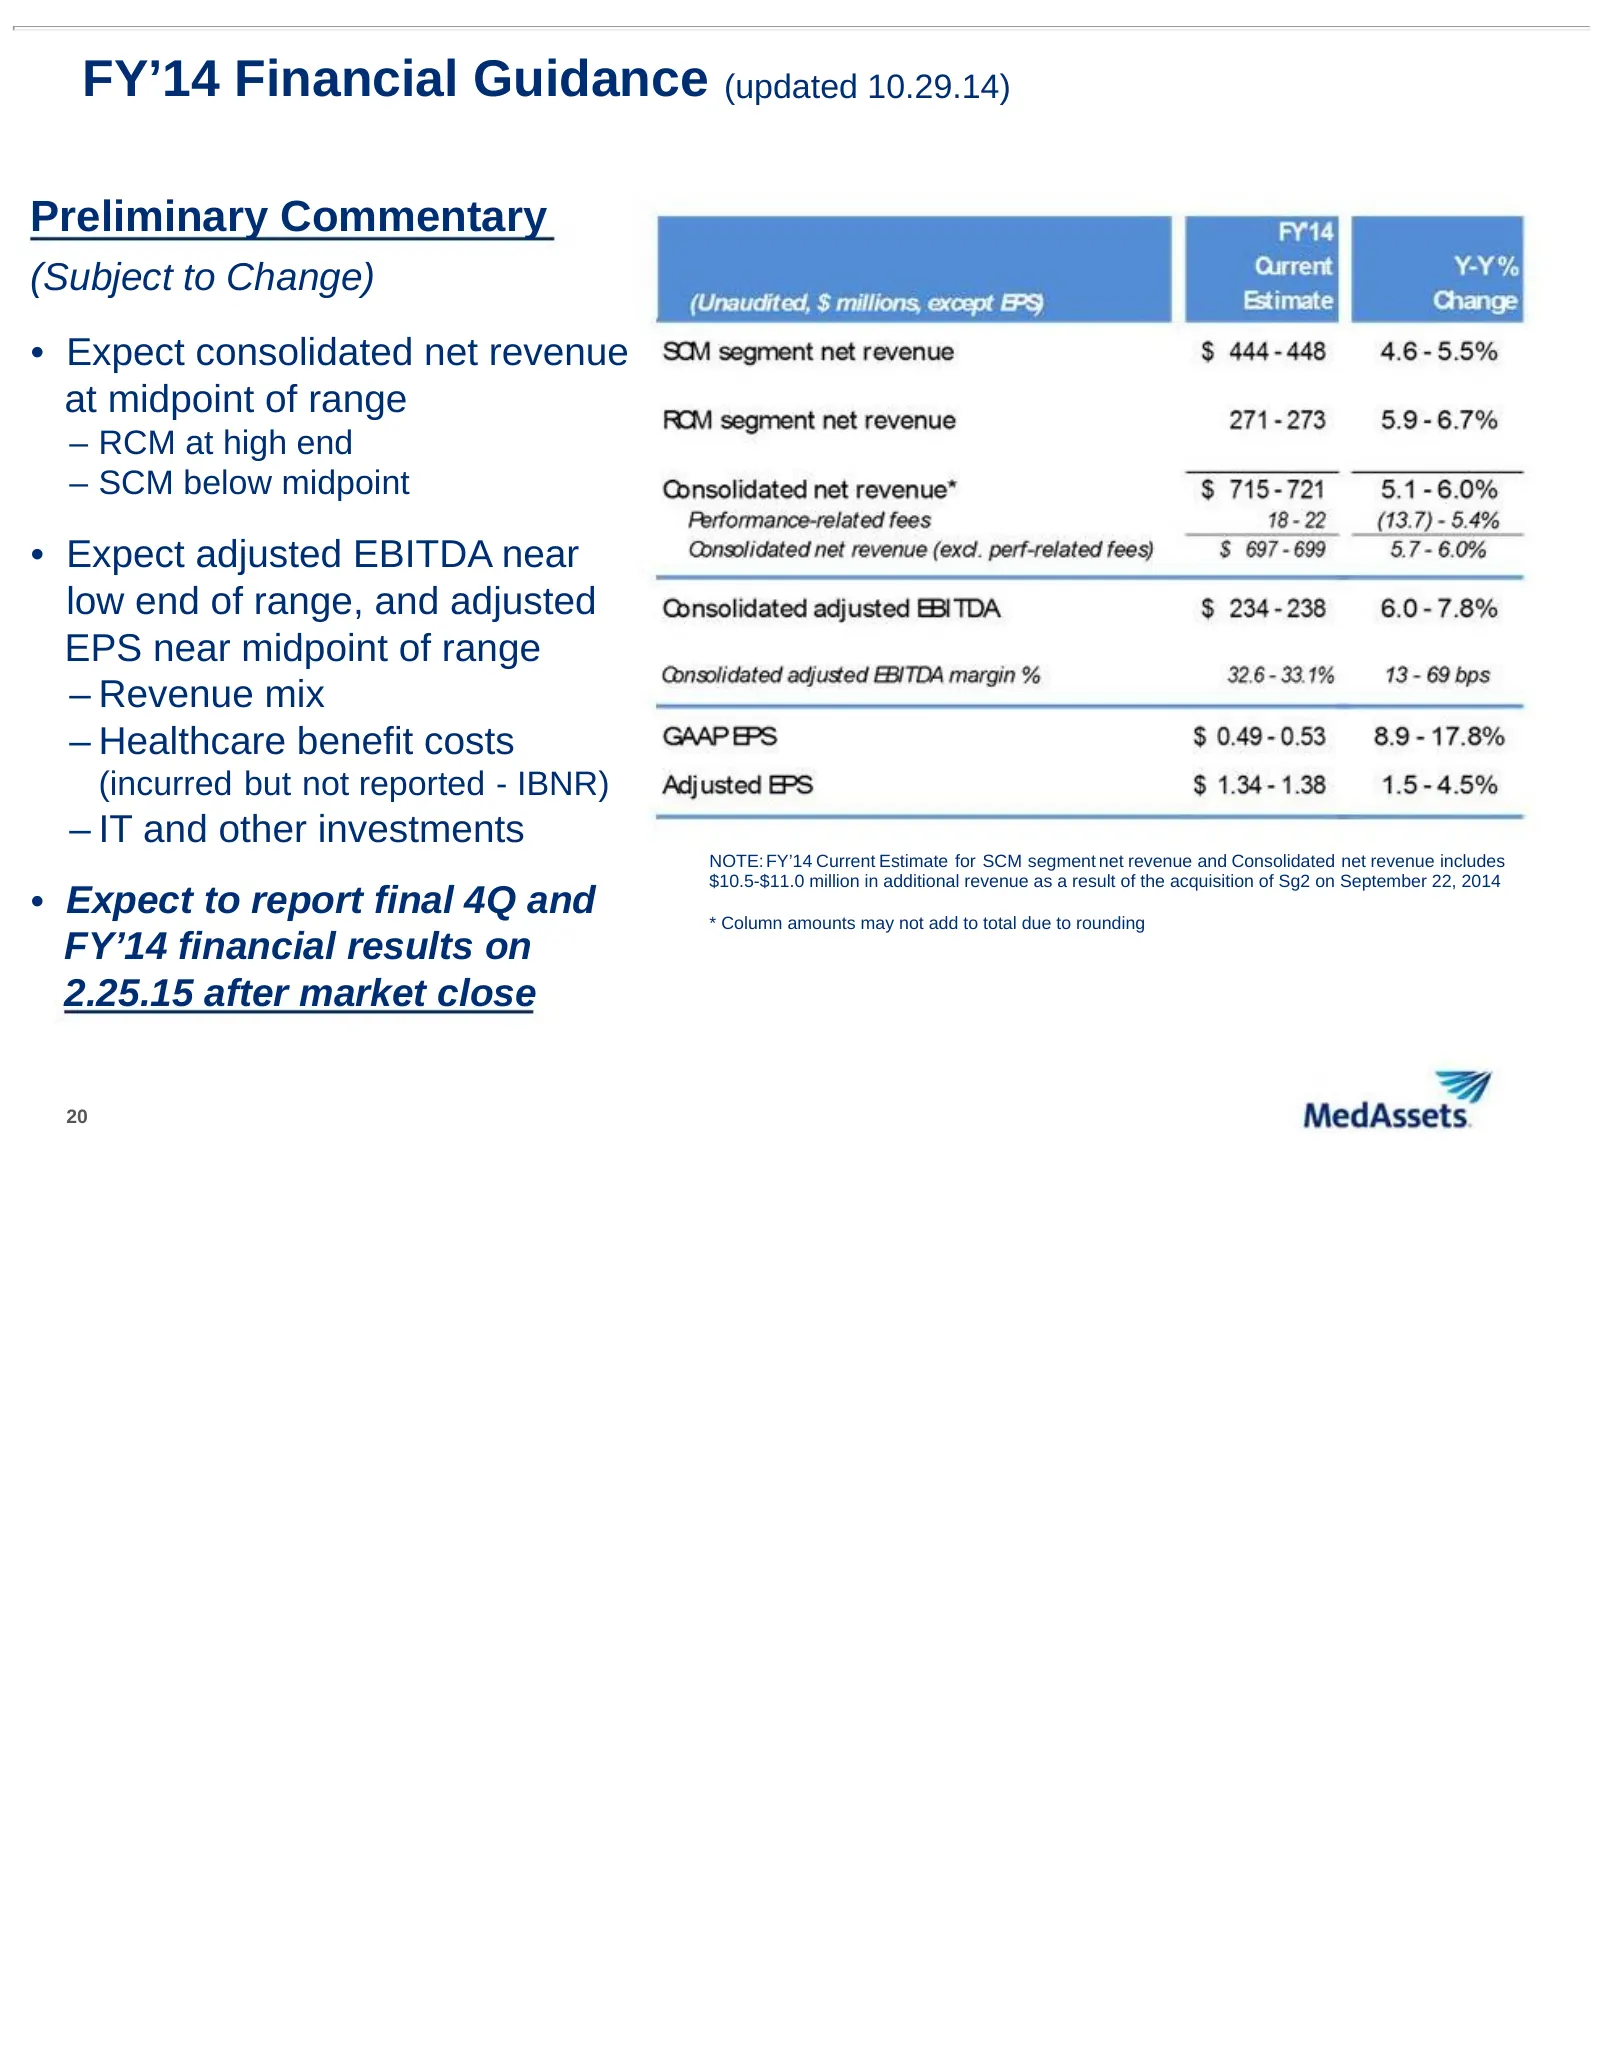
FY’14 Financial Guidance (updated 10.29.14) Preliminary Commentary (Subject to Change) • Expect consolidated net revenue at midpoint of range – RCM at high end – SCM below midpoint • Expect adjusted EBITDA near low end of range, and adjusted EPS near midpoint of range – Revenue mix – Healthcare bene
Slide 21: Recap of FY'15 Considerations and Preliminary Views
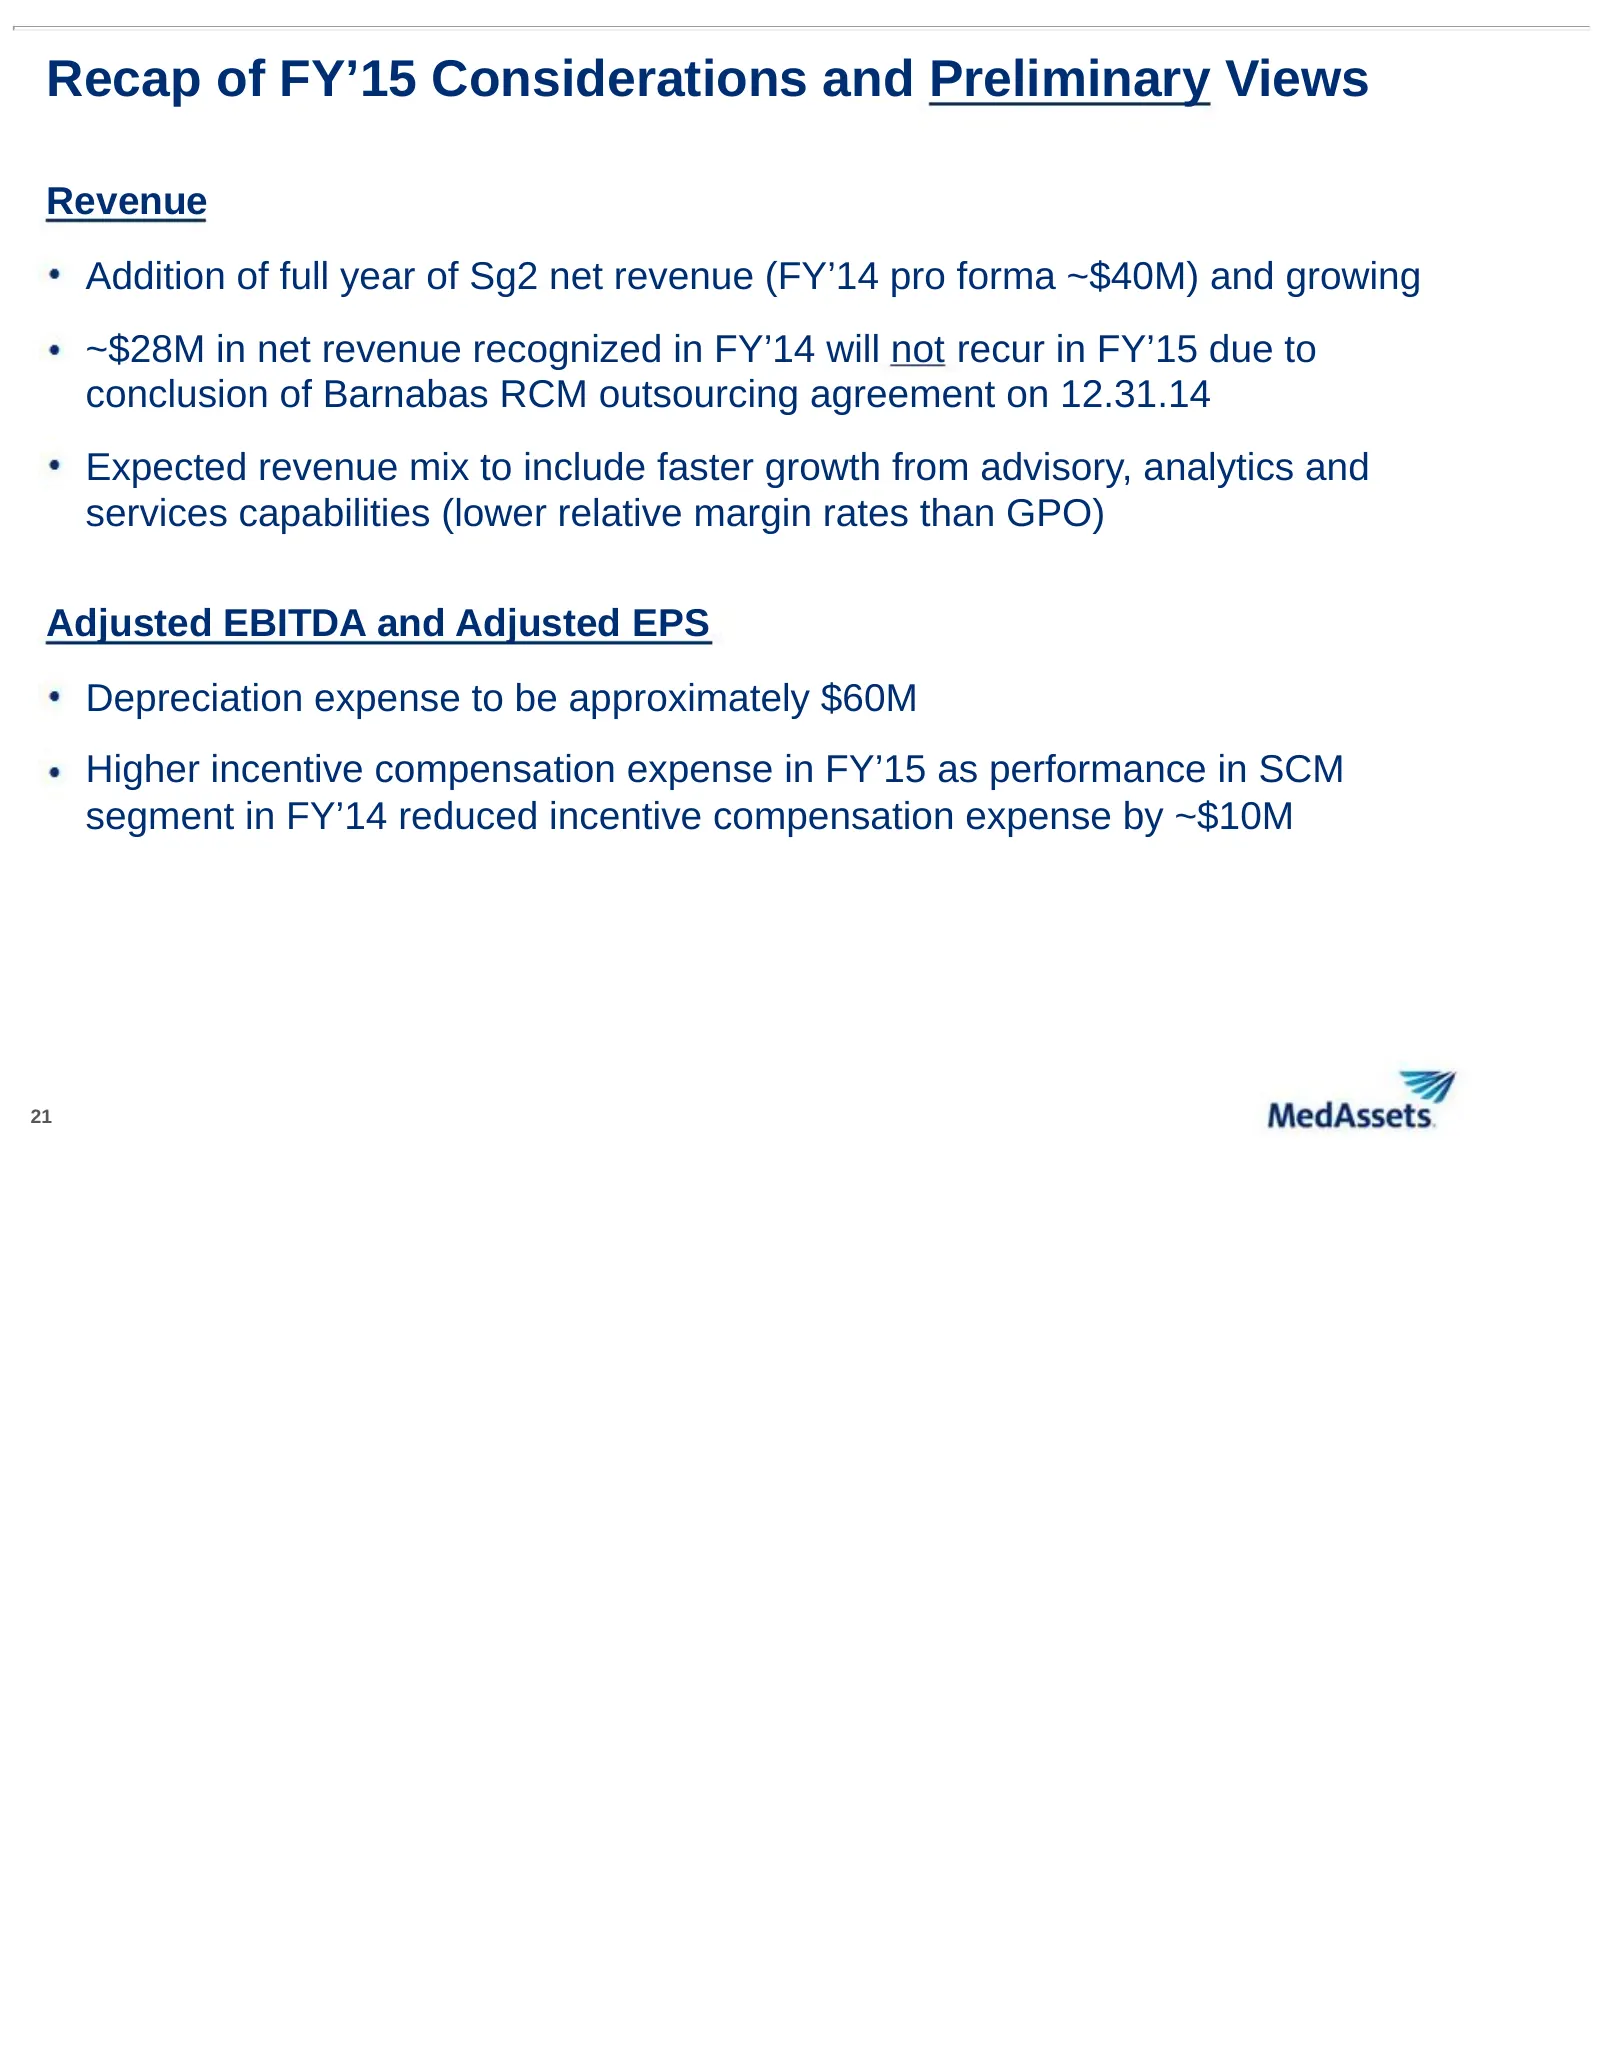
Recap of FY’15 Considerations and Preliminary Views Revenue Addition of full year of Sg2 net revenue (FY’14 pro forma ~$40M) and growing ~$28M in net revenue recognized in FY’14 will not recur in FY’15 due to conclusion of Barnabas RCM outsourcing agreement on 12.31.14 Expected revenue mix to includ
Slide 22: Transparent, High ROI Performance Improvement
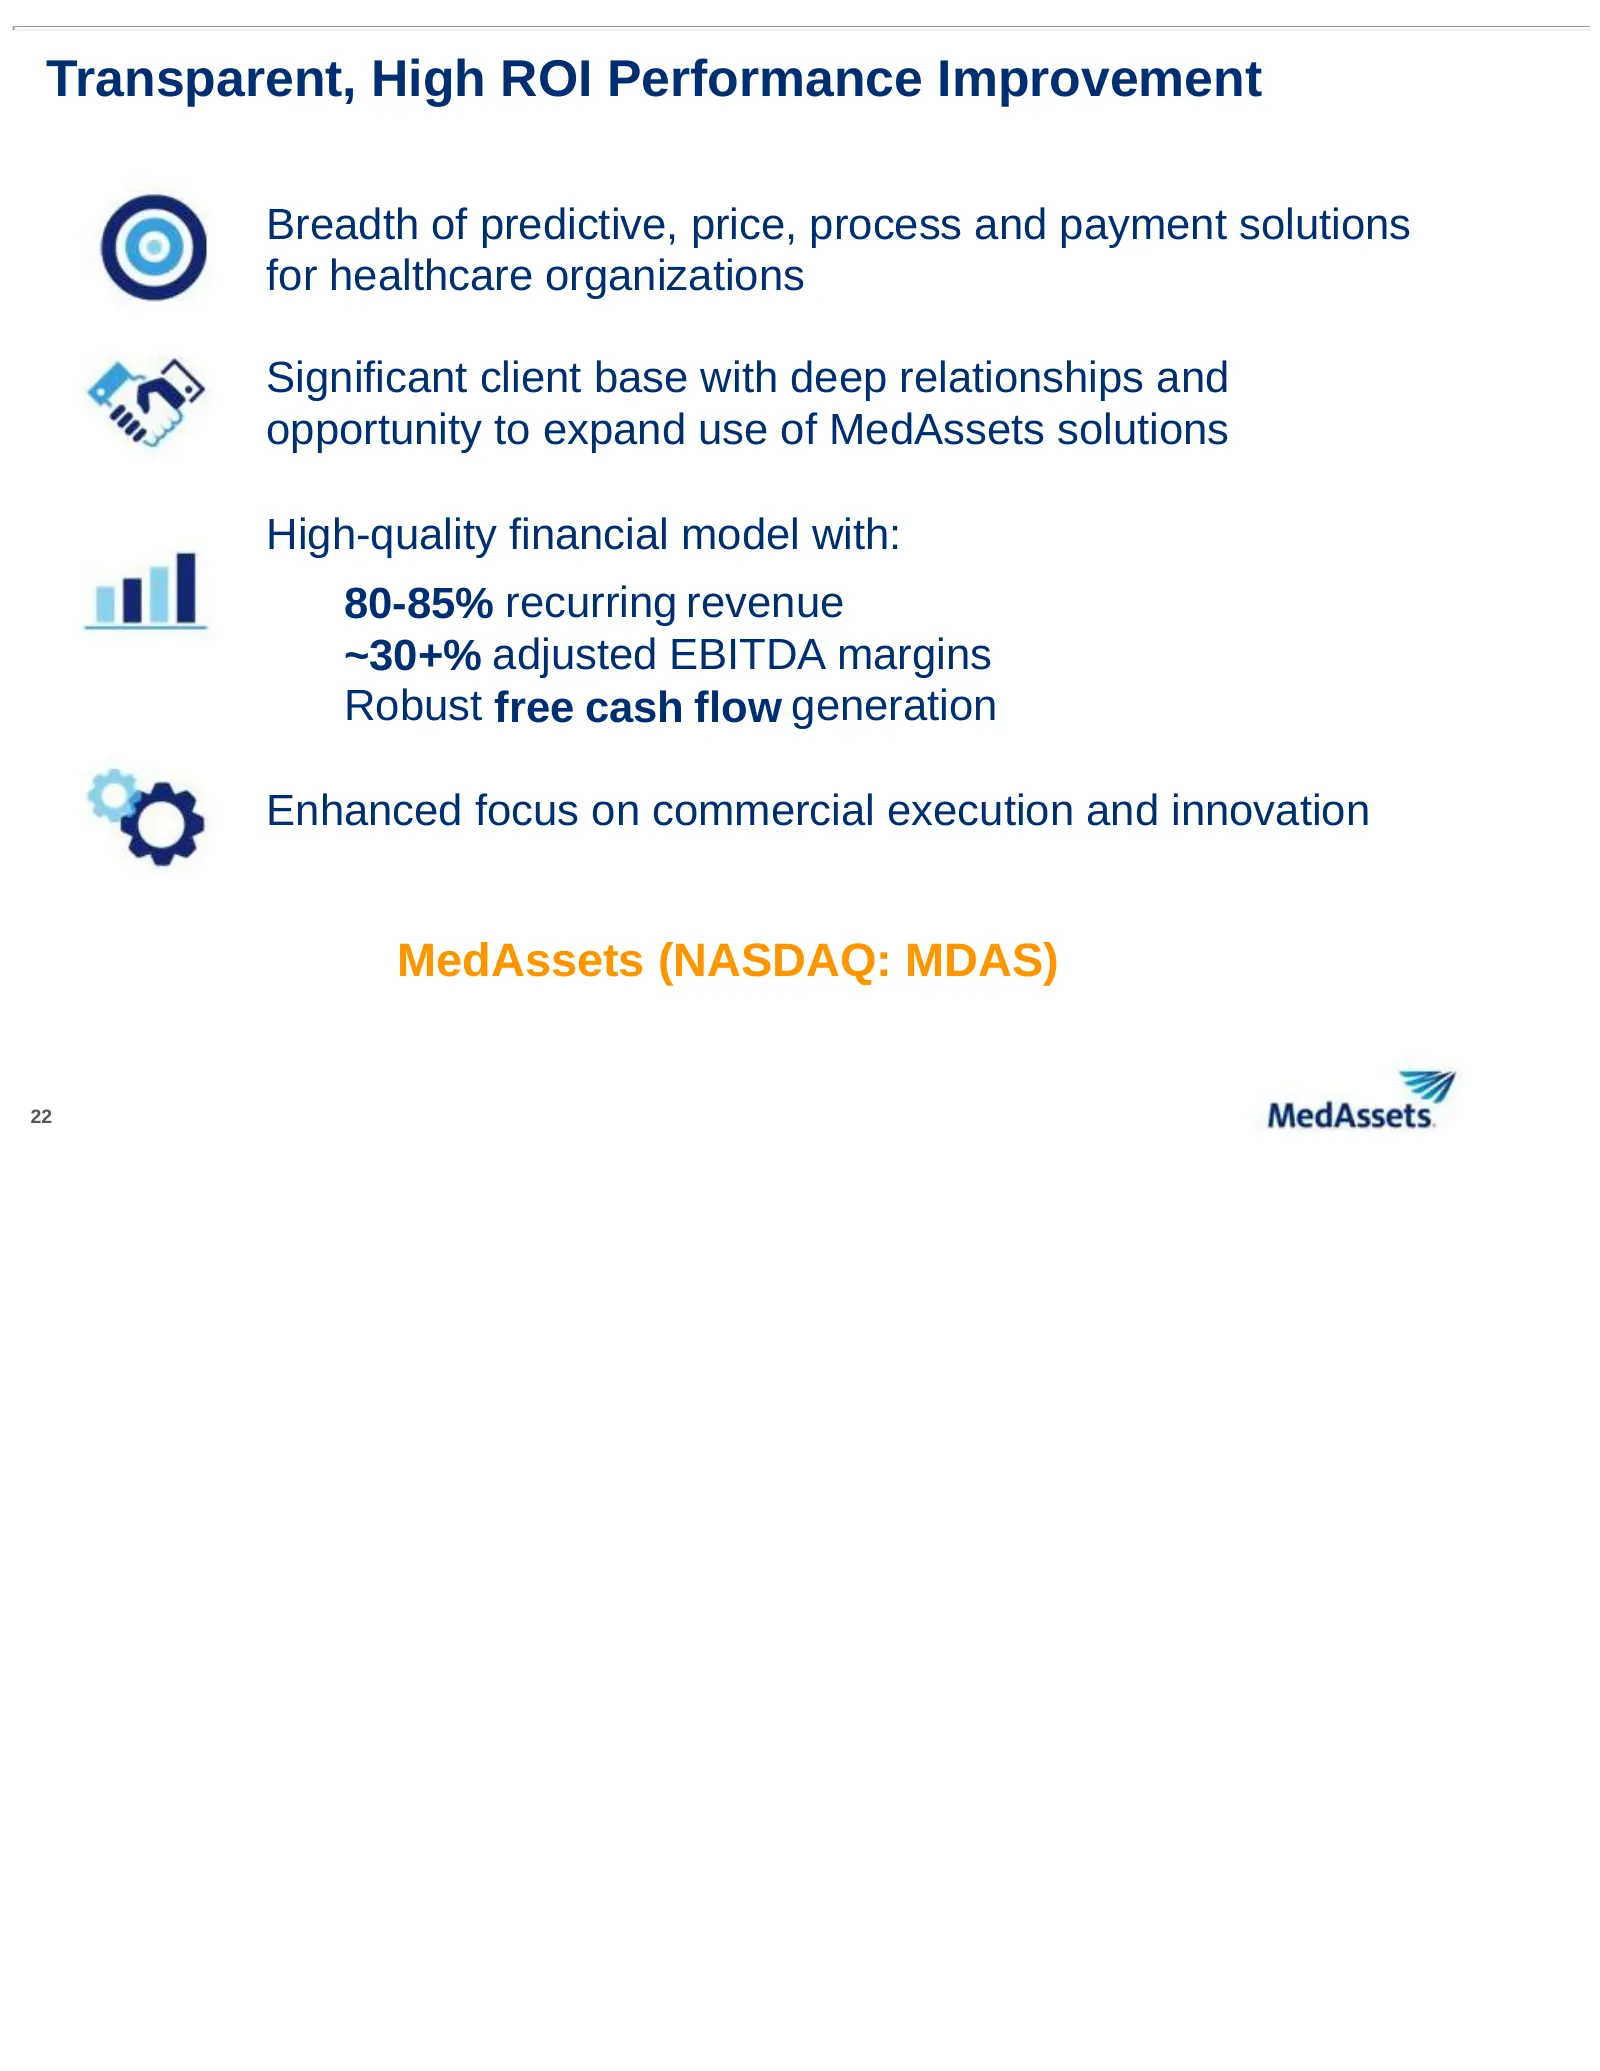
Transparent, High ROI Performance Improvement Breadth of predictive, price, process and payment solutions for healthcare organizations Significant client base with deep relationships and opportunity to expand use of MedAssets solutions High-quality financial model with: 80-85% recurring revenue ~30+
Slide 23: Reconciliation of GAAP Net Income to Non-GAAP EBITDA
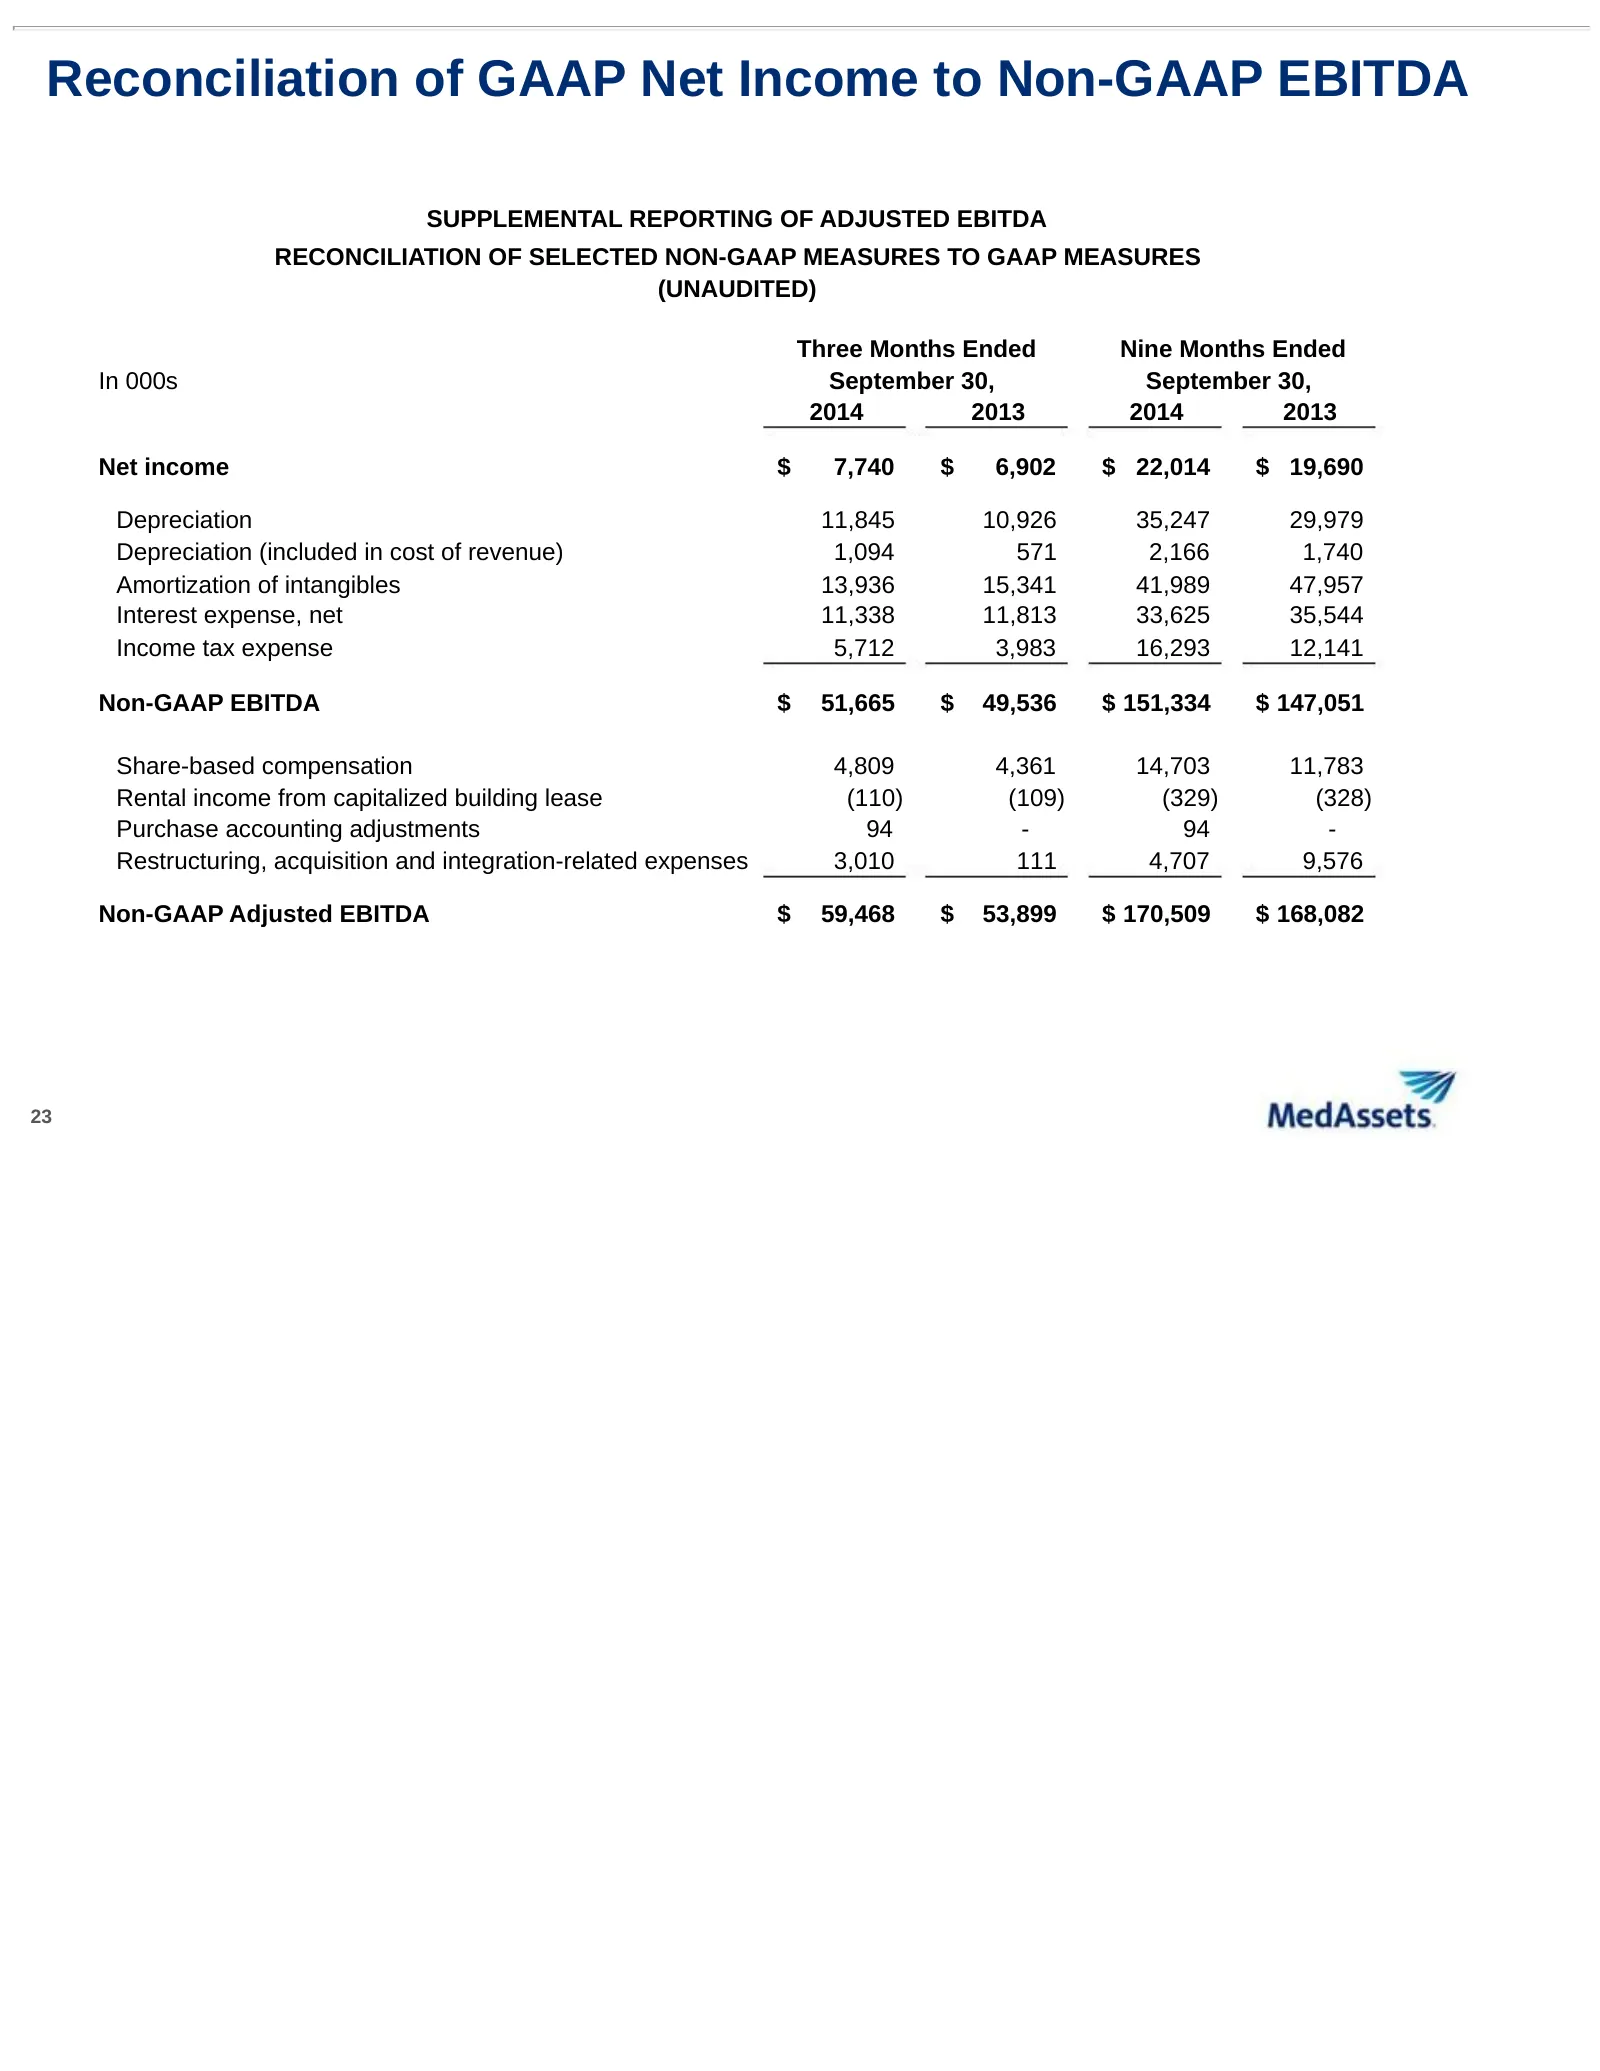
Reconciliation of GAAP Net Income to Non-GAAP EBITDA SUPPLEMENTAL REPORTING OF ADJUSTED EBITDA RECONCILIATION OF SELECTED NON-GAAP MEASURES TO GAAP MEASURES (UNAUDITED) Three Months Ended Nine Months Ended In 000s September 30, September 30, 2014 2013 2014 2013 Net income $ 7,740 $ 6,902 $ 22,014 $
Slide 24: Reconciliation of GAAP to Non-GAAP EPS
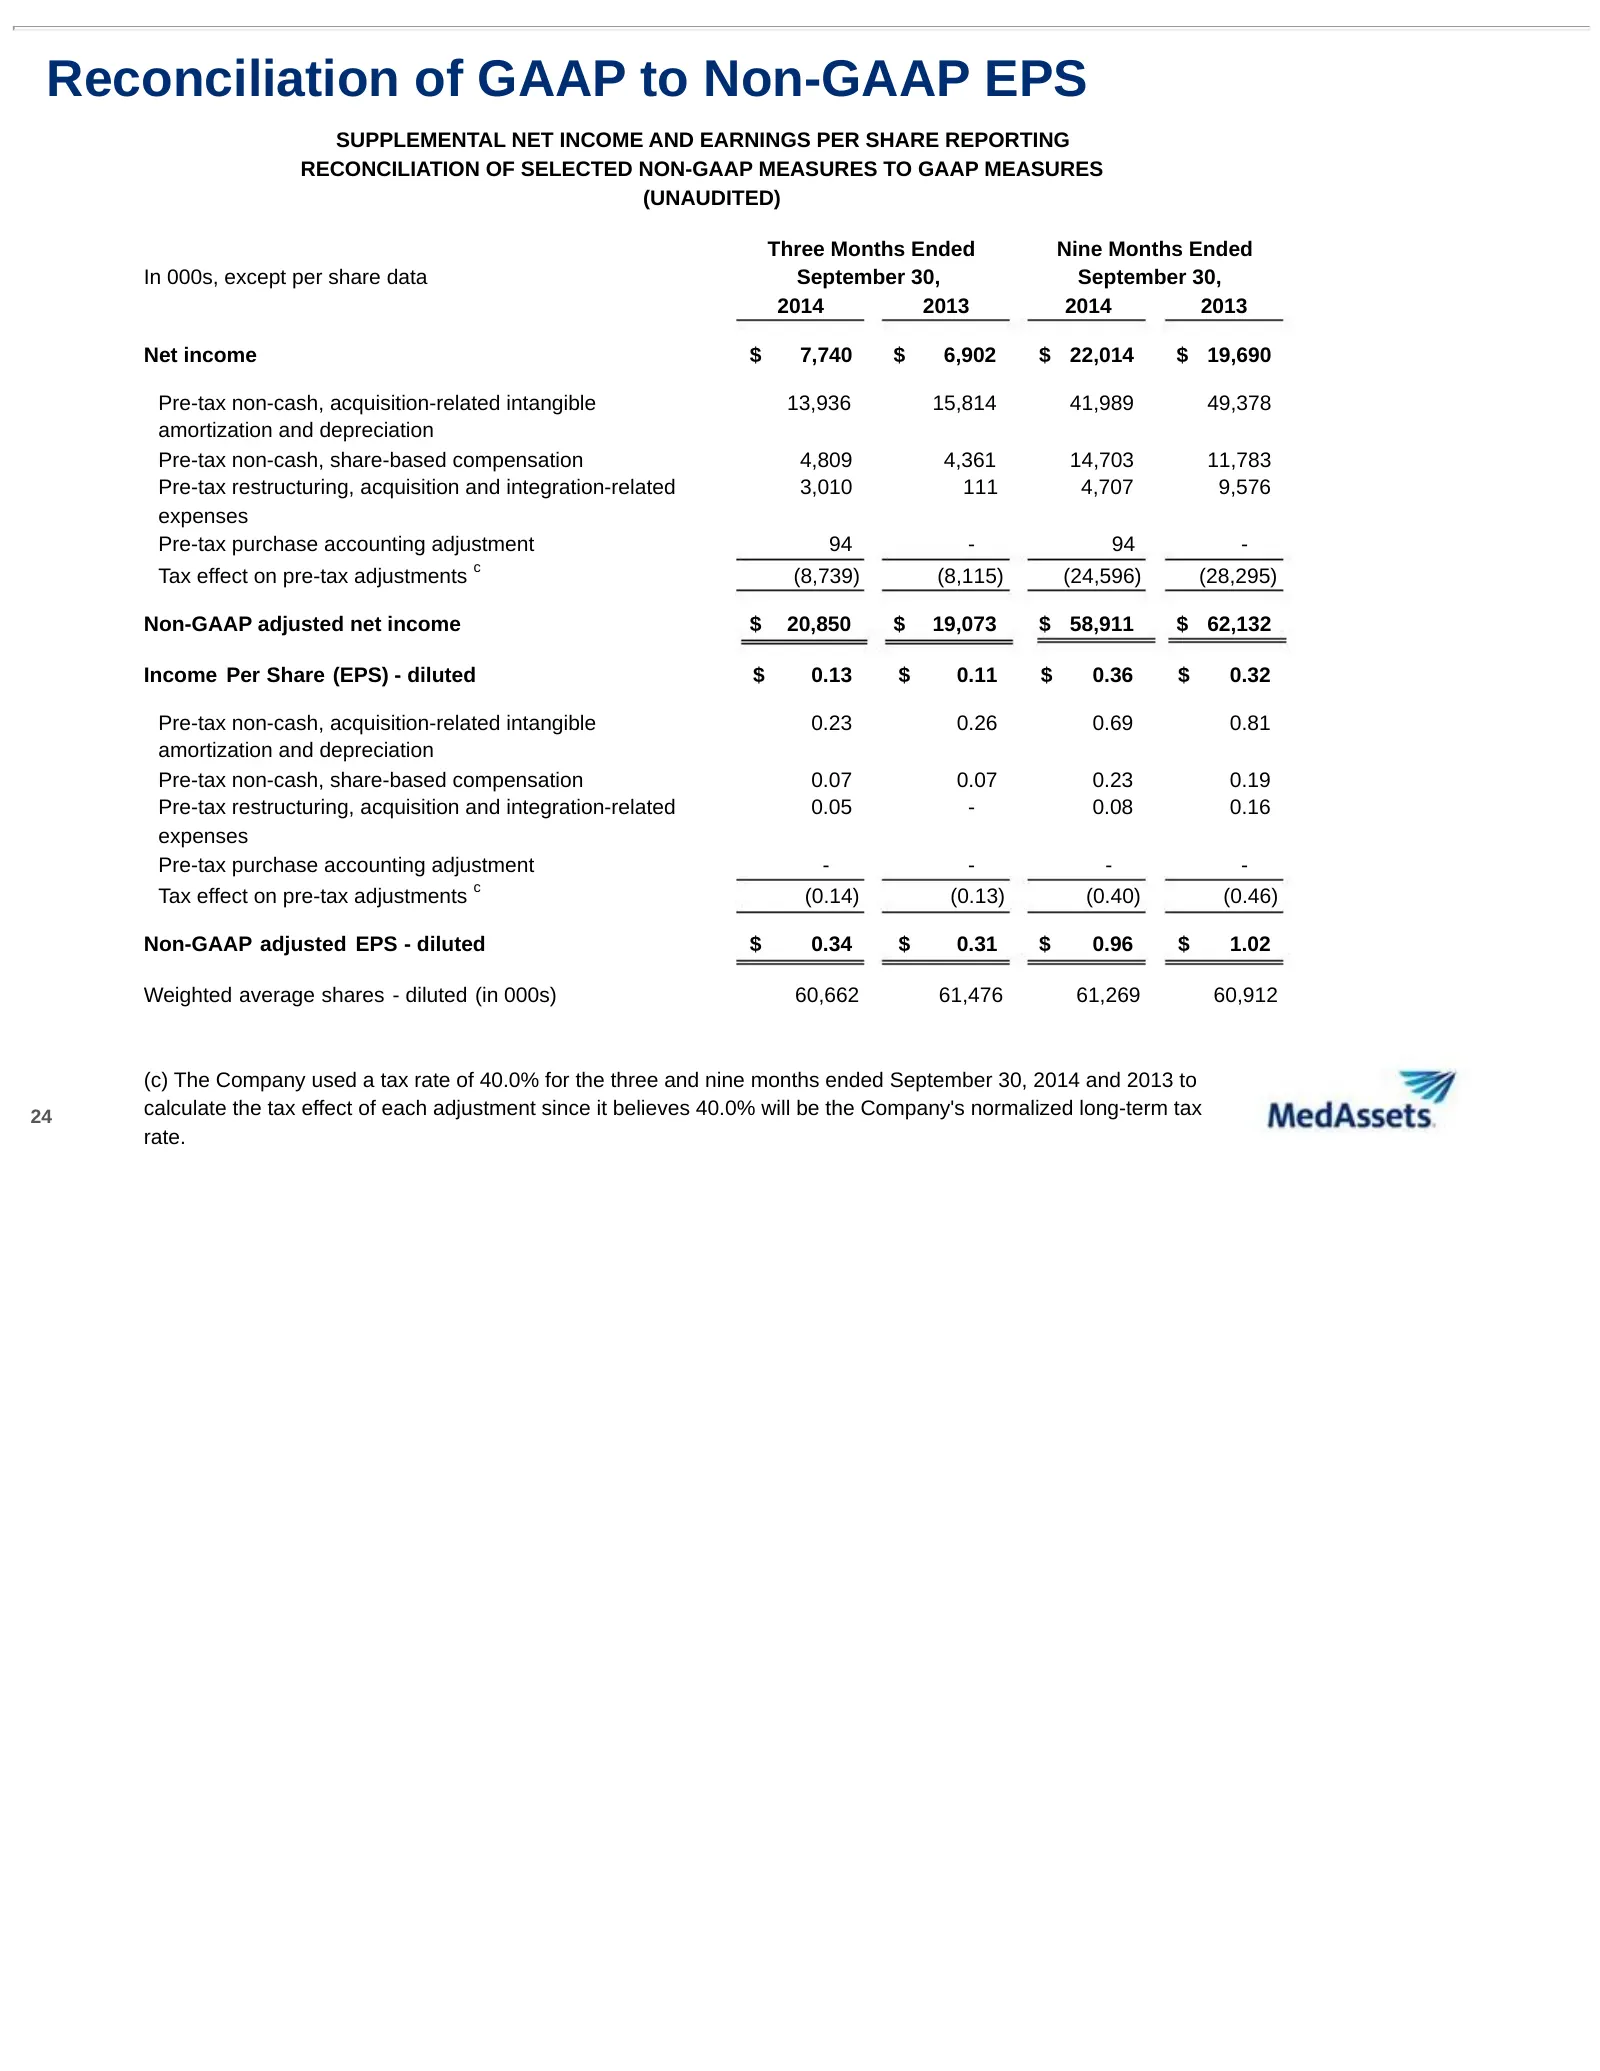
Reconciliation of GAAP to Non-GAAP EPS SUPPLEMENTAL NET INCOME AND EARNINGS PER SHARE REPORTING RECONCILIATION OF SELECTED NON-GAAP MEASURES TO GAAP MEASURES (UNAUDITED) Three Months Ended Nine Months Ended In 000s, except per share data September 30, September 30, 2014 2013 2014 2013 Net income $ 7
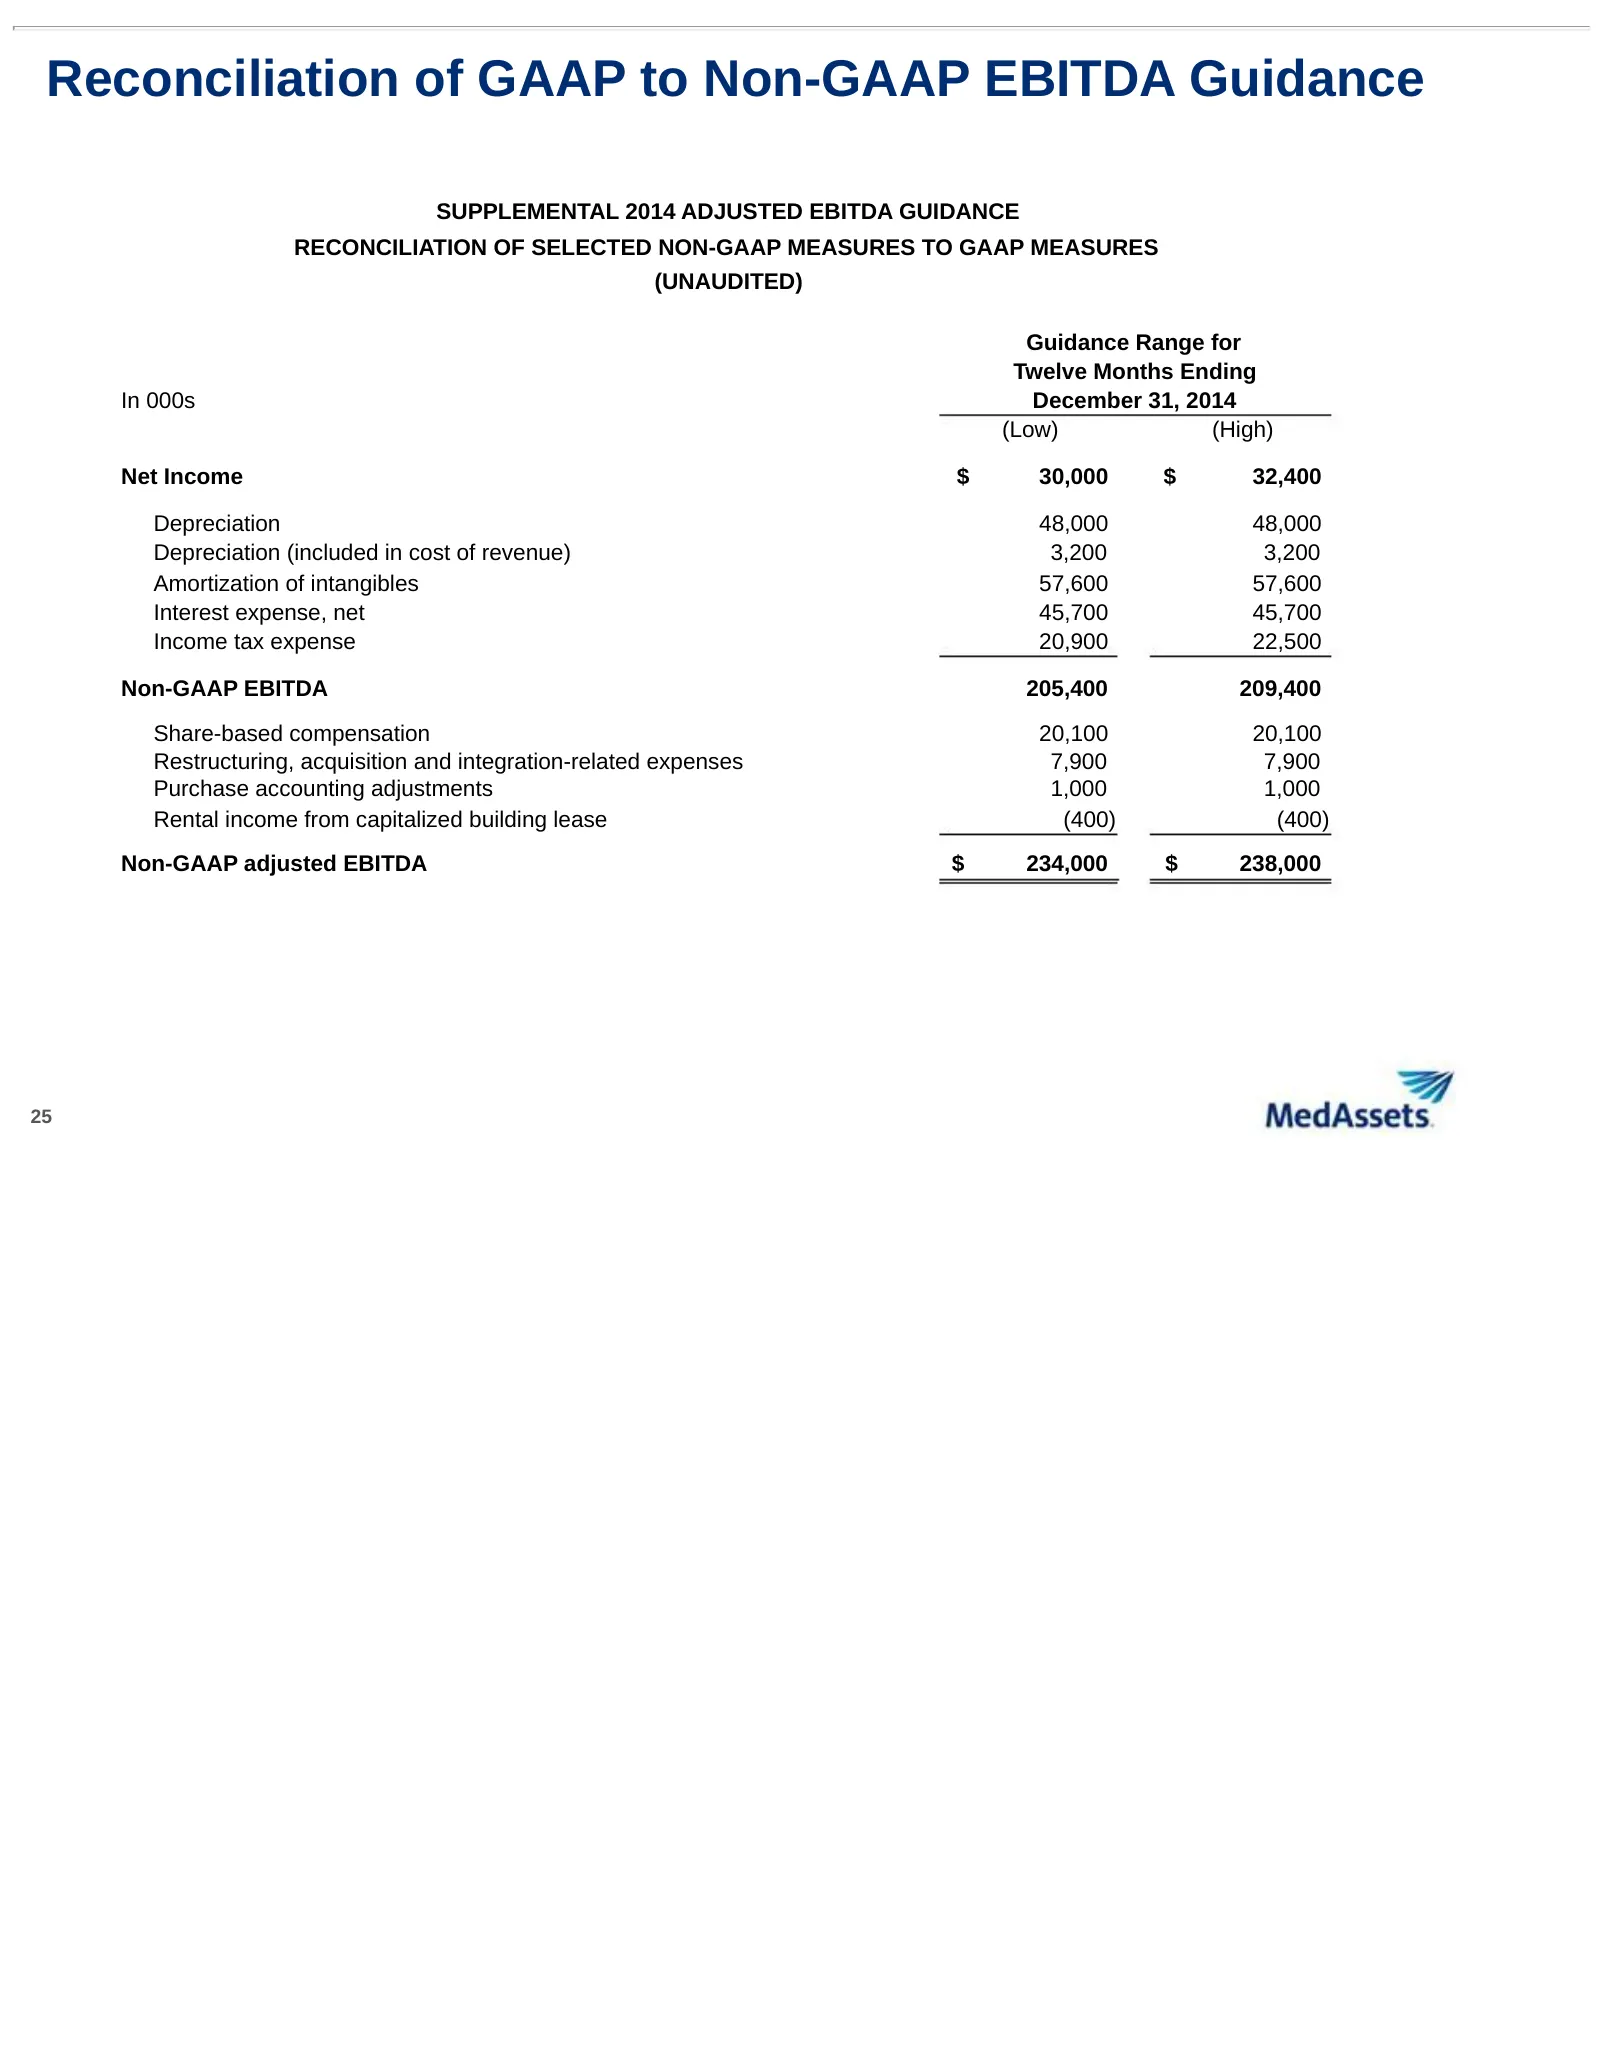
Slide 25: Reconciliation of GAAP to Non-GAAP EBITDA Guidance
Reconciliation of GAAP to Non-GAAP EBITDA Guidance SUPPLEMENTAL 2014 ADJUSTED EBITDA GUIDANCE RECONCILIATION OF SELECTED NON-GAAP MEASURES TO GAAP MEASURES (UNAUDITED) Guidance Range for Twelve Months Ending In 000s December 31, 2014 (Low) (High) Net Income $ 30,000 $ 32,400 Depreciation 48,000 48,0
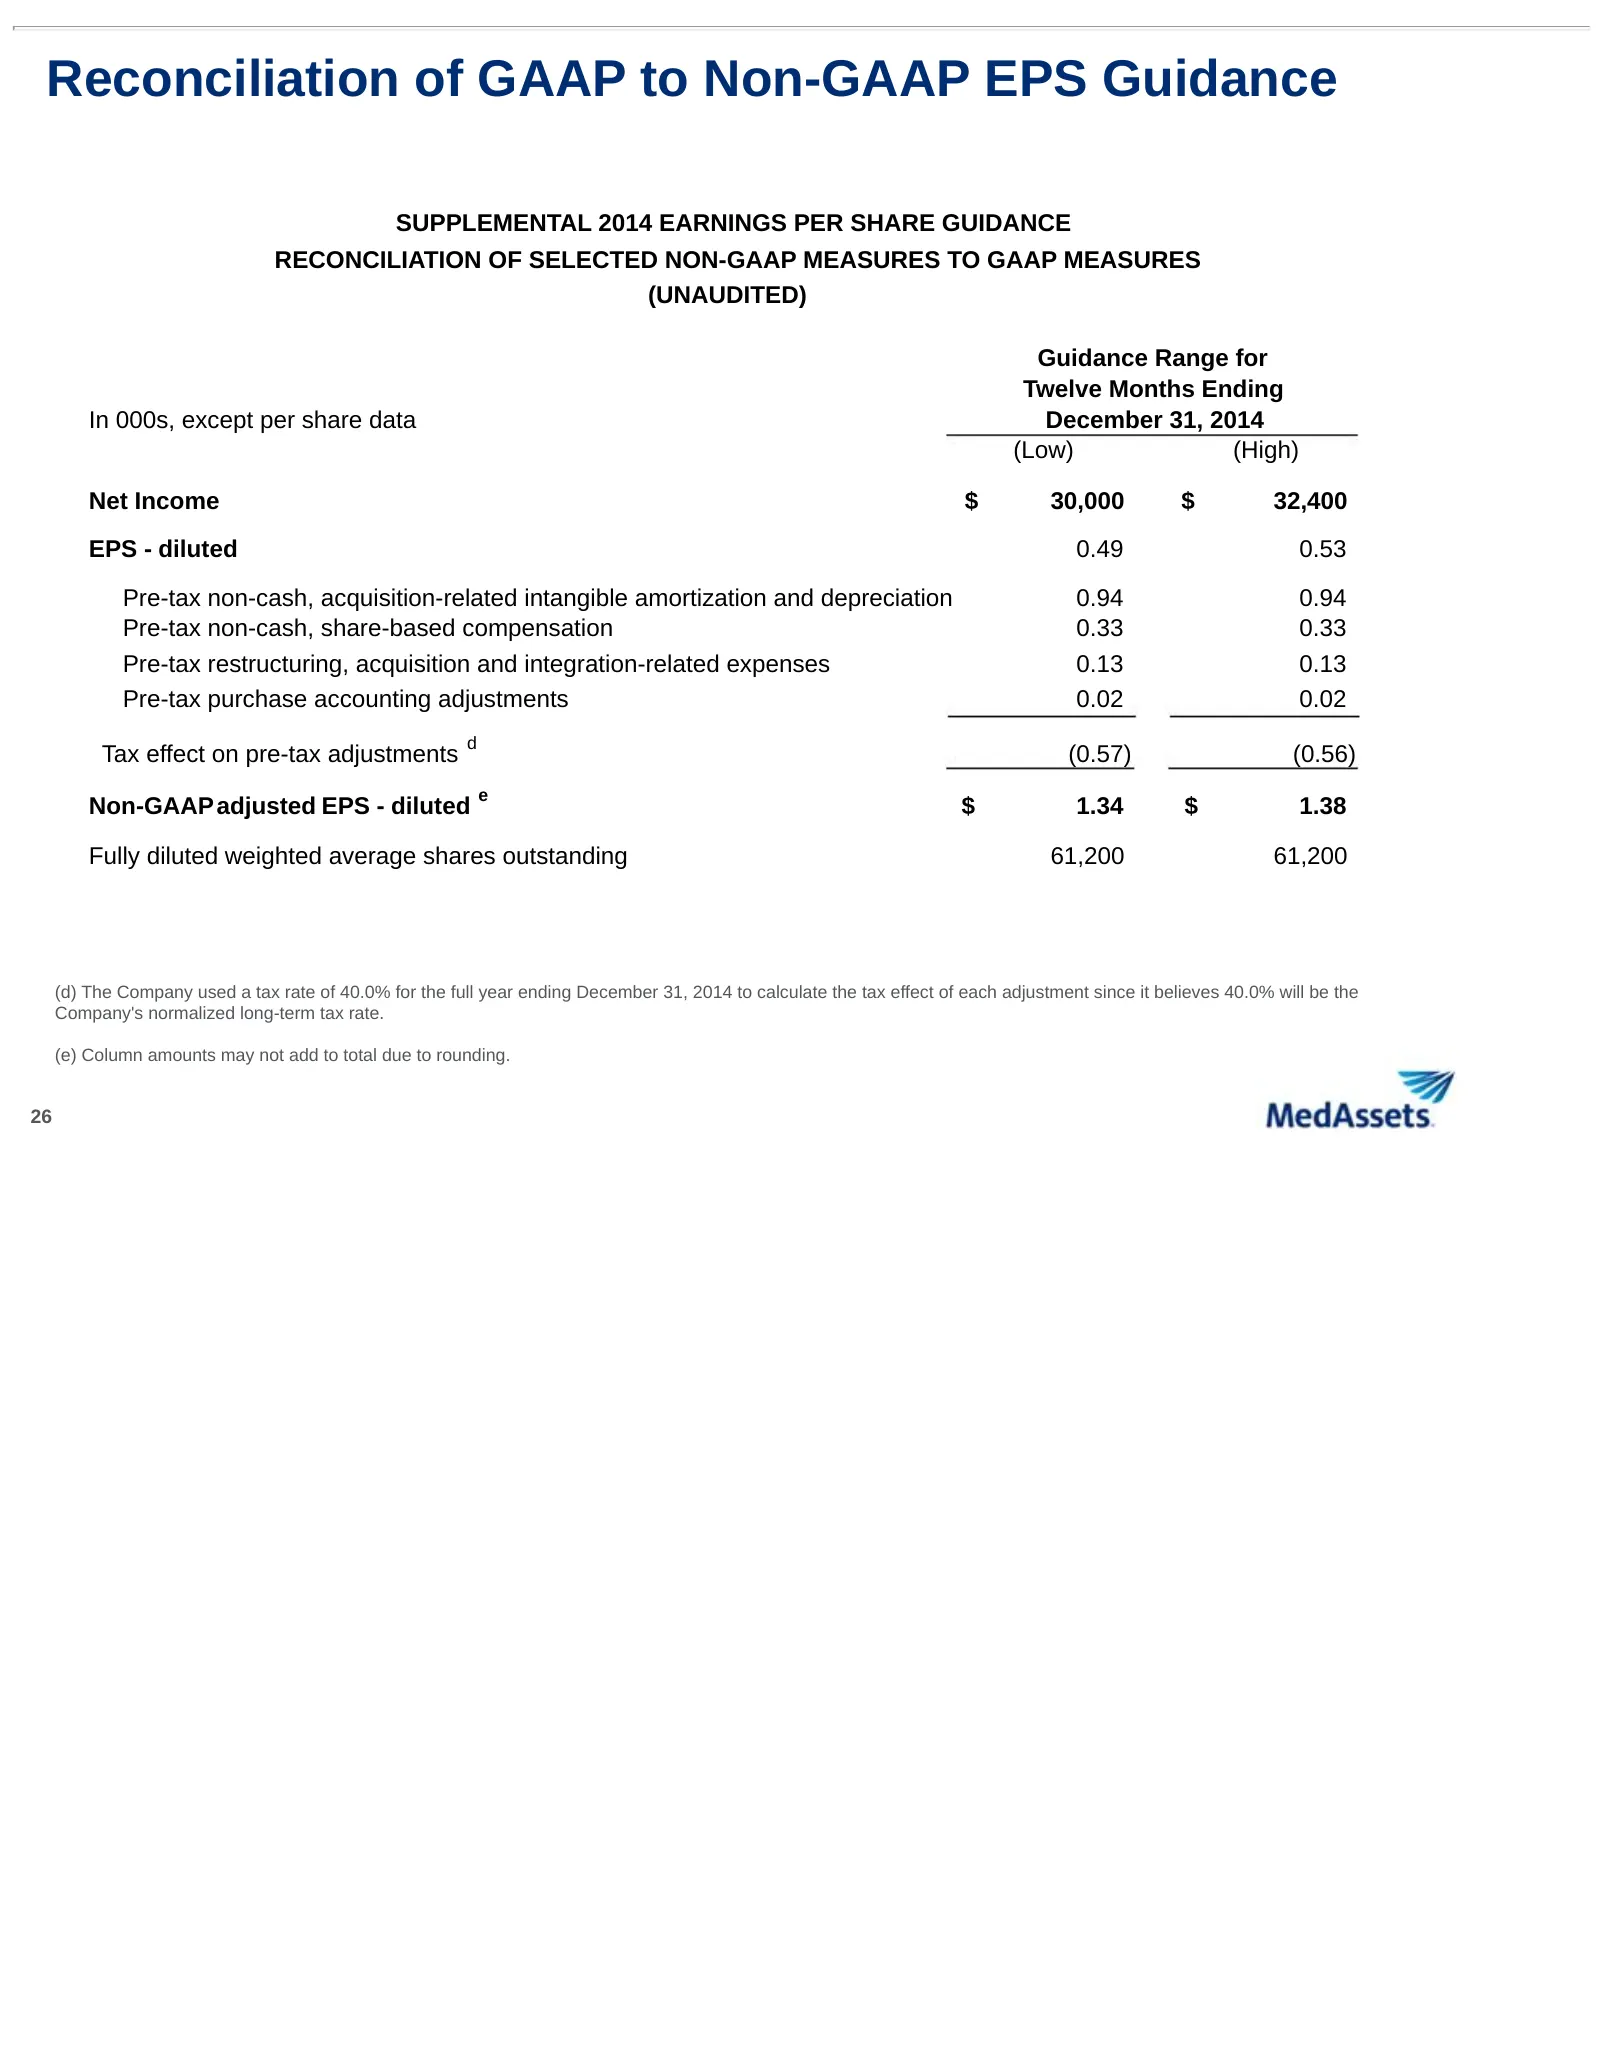
Slide 26: Reconciliation of GAAP to Non-GAAP EPS Guidance
Reconciliation of GAAP to Non-GAAP EPS Guidance SUPPLEMENTAL 2014 EARNINGS PER SHARE GUIDANCE RECONCILIATION OF SELECTED NON-GAAP MEASURES TO GAAP MEASURES (UNAUDITED) Guidance Range for Twelve Months Ending In 000s, except per share data December 31, 2014 (Low) (High) Net Income $ 30,000 $ 32,400 E
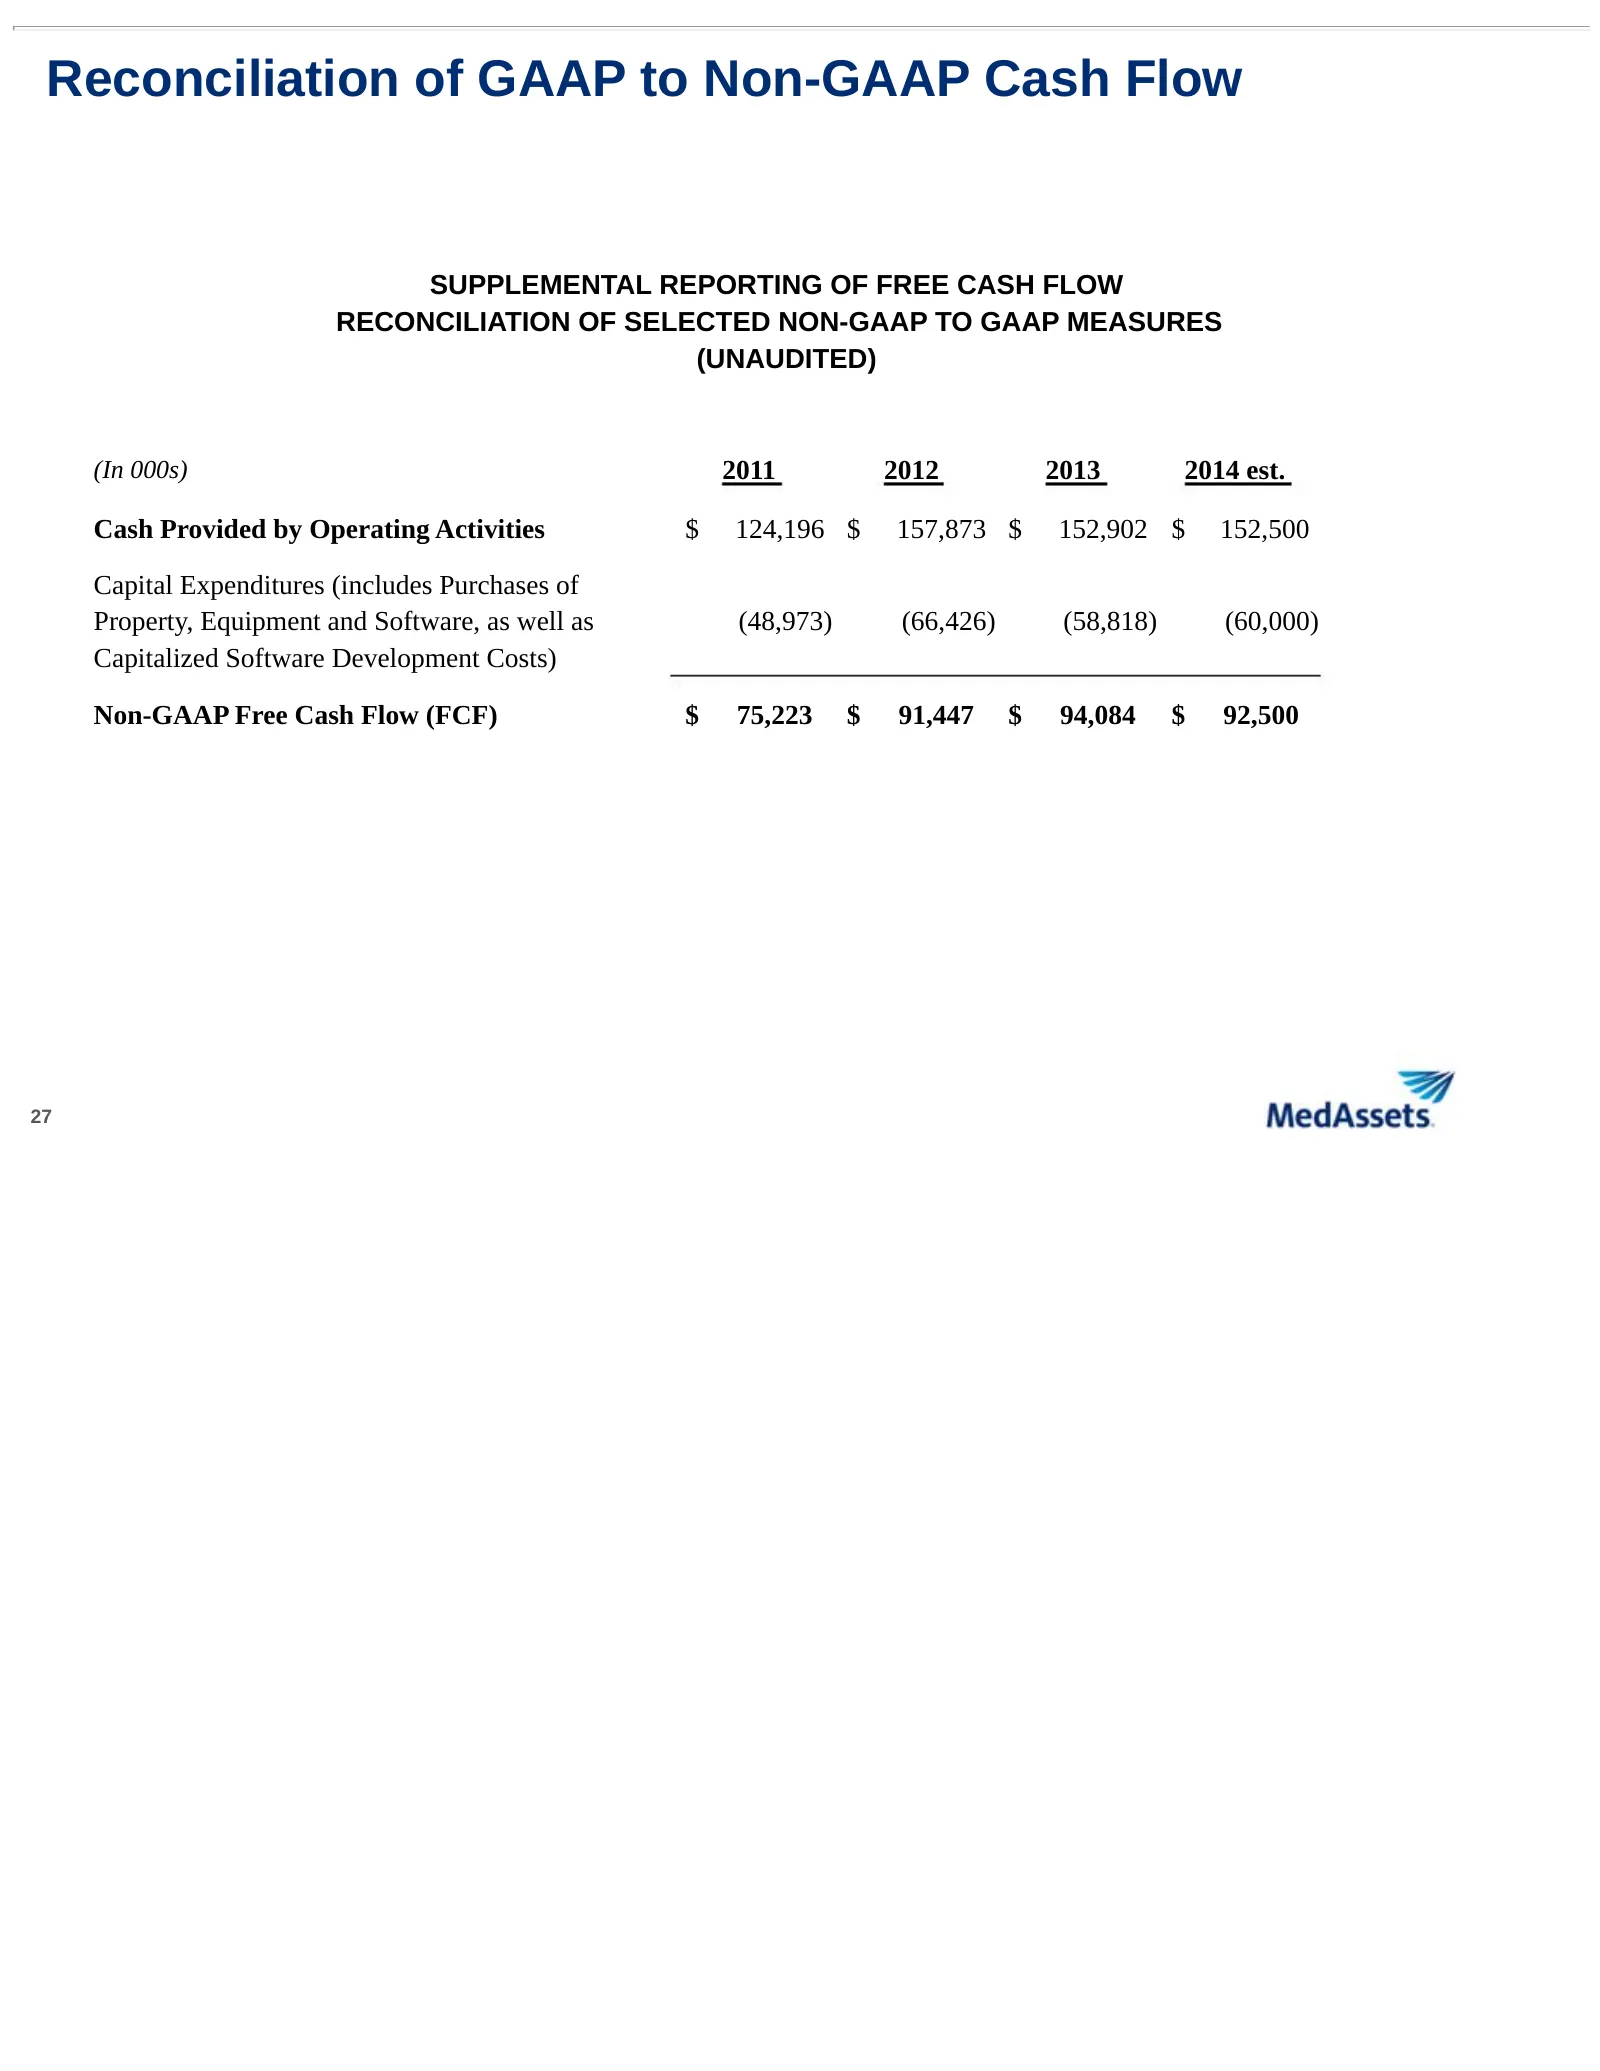
Slide 27: Reconciliation of GAAP to Non-GAAP Cash Flow
Reconciliation of GAAP to Non-GAAP Cash Flow SUPPLEMENTAL REPORTING OF FREE CASH FLOW RECONCILIATION OF SELECTED NON-GAAP TO GAAP MEASURES (UNAUDITED) (In 000s) 2011 2012 2013 2014 est. Cash Provided by Operating Activities $ 124,196 $ 157,873 $ 152,902 $ 152,500 Capital Expenditures (includes Purch
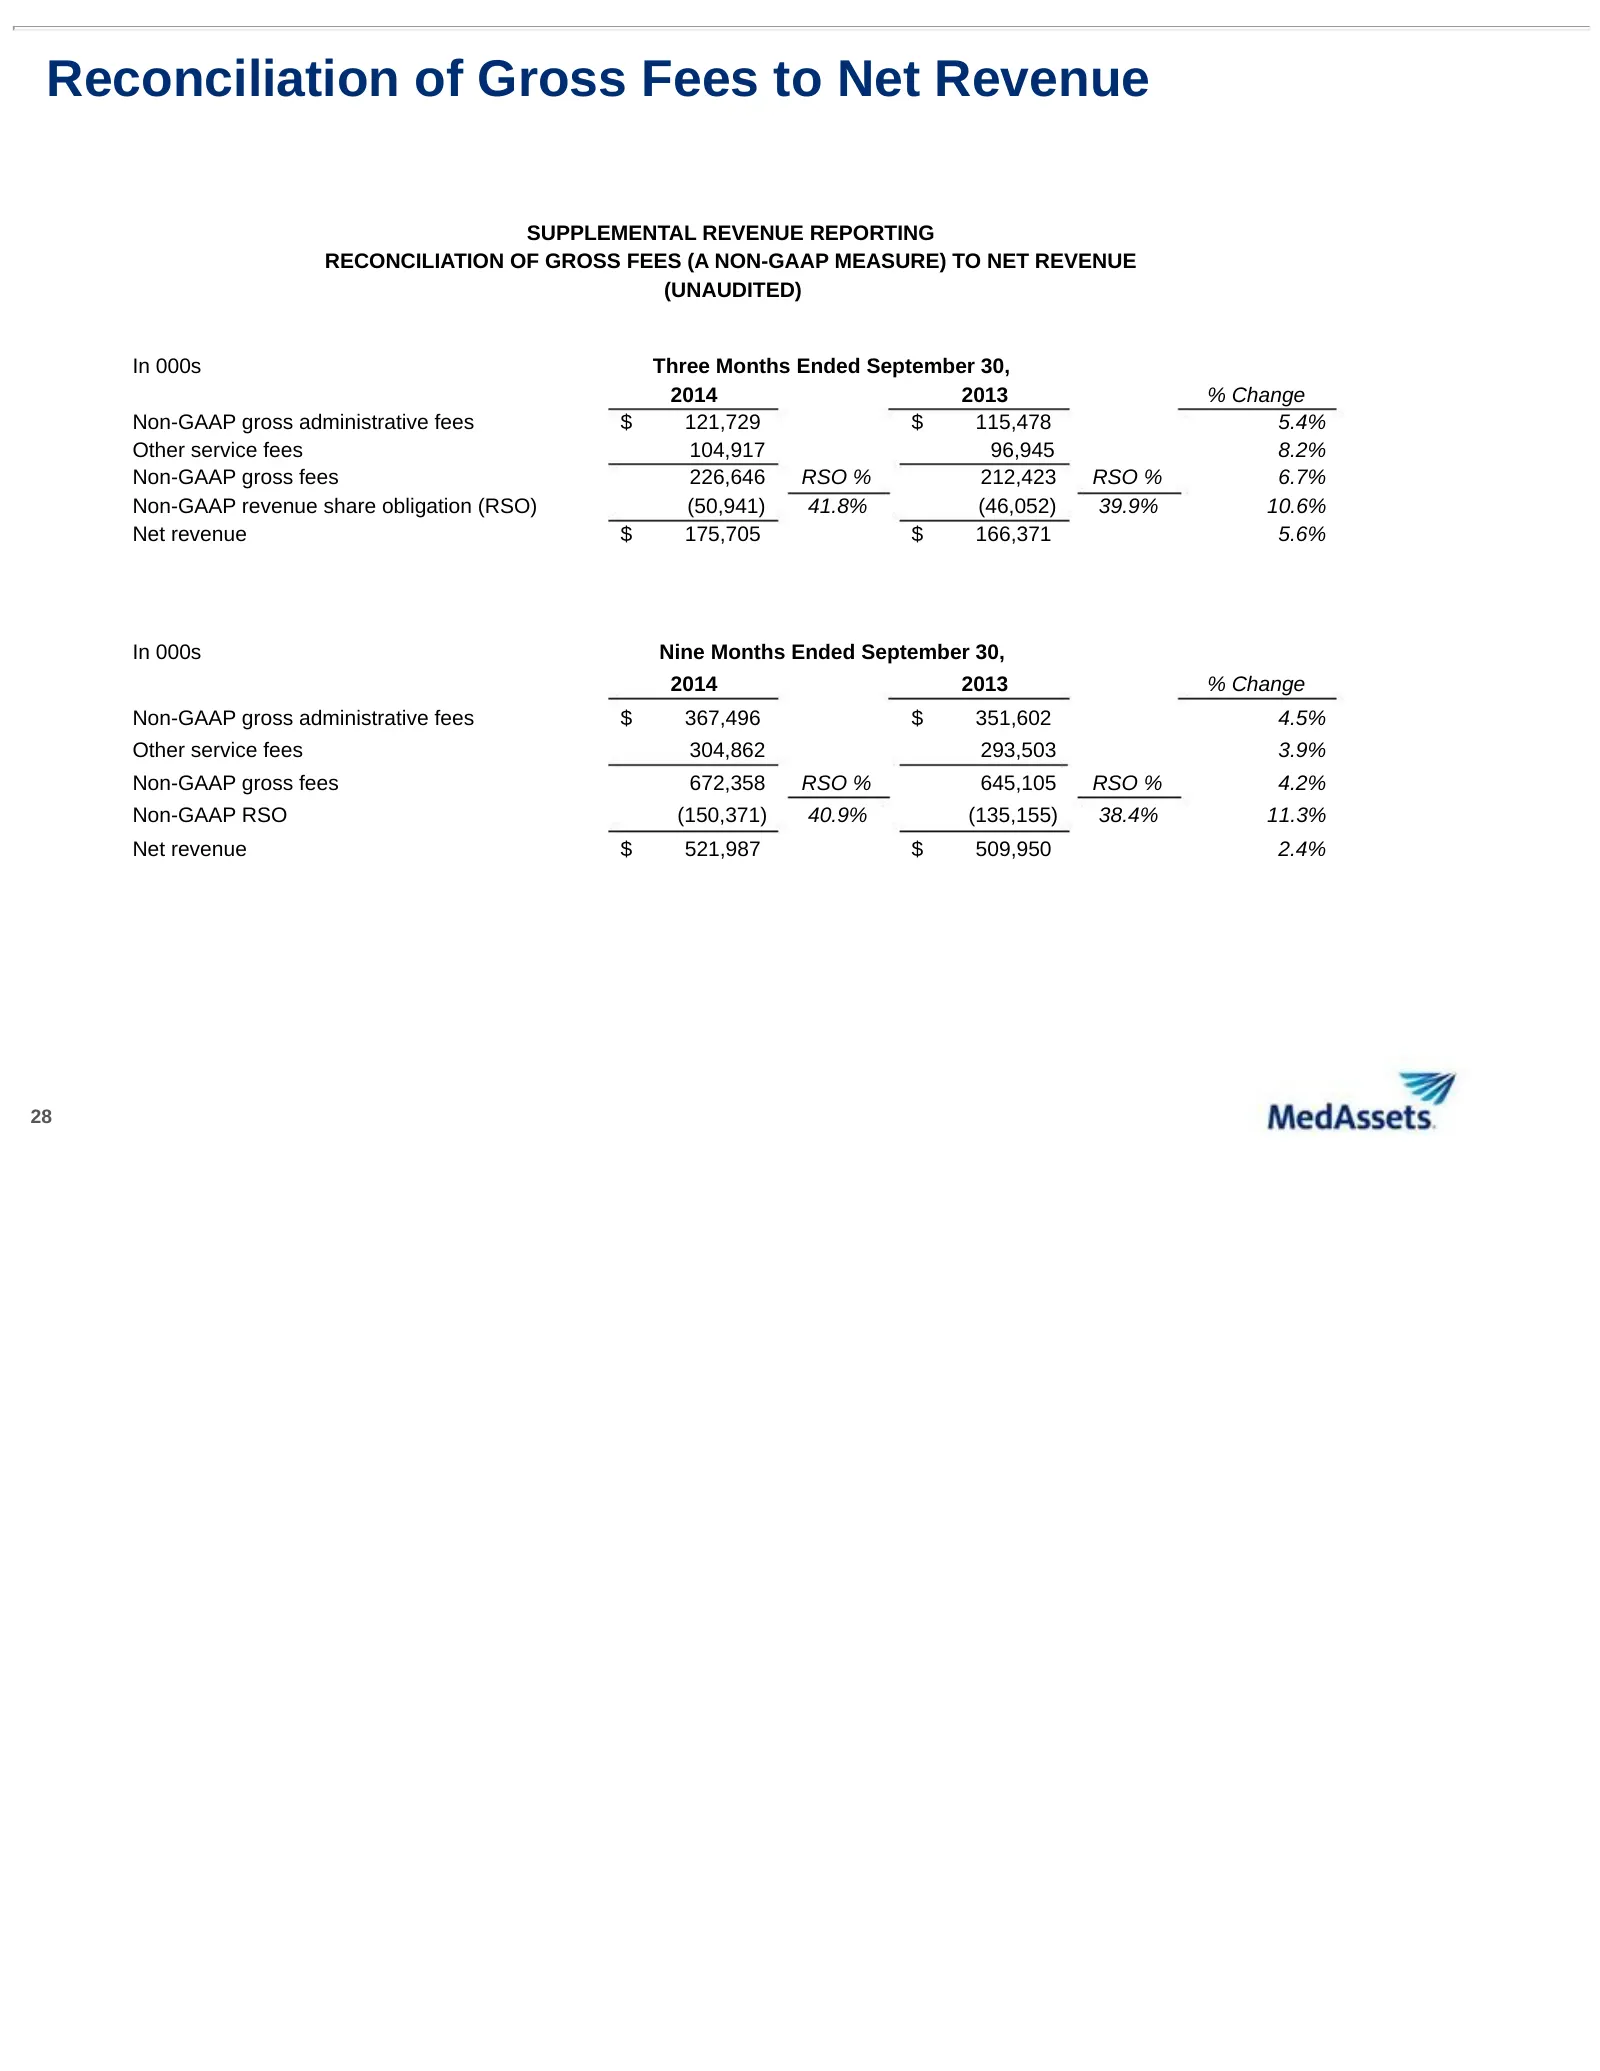
Slide 28: Reconciliation of Gross Fees to Net Revenue
Reconciliation of Gross Fees to Net Revenue SUPPLEMENTAL REVENUE REPORTING RECONCILIATION OF GROSS FEES (A NON-GAAP MEASURE) TO NET REVENUE (UNAUDITED) In 000s Three Months Ended September 30, 2014 2013 % Change Non-GAAP gross administrative fees $ 121,729 $ 115,478 5.4% Other service fees 104,917 9
Slide 29: Use of Non-GAAP Financial Measures
Use of Non-GAAP Financial Measures In order to provide investors with greater insight, promote transparency and allow for a more comprehensive understanding of the information used by management and the board of directors in their financial and operational decision-making, the Company supplements it
Source: SEC EDGAR · 8-K filed Jan 13, 2015